lean construction: lean practices maturity model proposal · lean construction: lean practices...
TRANSCRIPT
Lean Construction:
Lean Practices Maturity Model Proposal
Diogo Miguel Lopes Sousa da Costa Figueira
Extended Abstract
Integrated Masters in Civil Engineering
Orientador: Prof. Doutor António Morais Aguiar da Costa
Júri
Presidente: Prof. Doutor Augusto Martins Gomes
Orientador: Prof. Doutor António Morais Aguiar da Costa
Vogal: Prof. Doutor Amílcar José Martins Arantes
October 2016

ii

1
1. Introduction
Given the problems facing the Architecture, Engineering and Construction industry, this presents
a chance to study the issues that currently are present in construction, and to understand what possible
opportunities for improvement exist. Lean Construction might be able to offer solutions to these
problems, since its main goal is to do more with less, improve effectiveness, and reduce waste in
production overall.
In this work we hope to accomplish two main goals. Firstly we want to study the current state of
the issues that plague the construction industry in Portugal, and then, update those issues to the current
days, while also taking into account the previous studies. This will be achieved by making a comparison
between earlier studies.
To update the previous studies, we studied the data gathering and analysis methods used by the
older studies. Based on the methods we found, we decided it would be best to arrange a meeting
between industry professionals, and discuss on the spot, which issues are the direst. Previous studies
had used inquiries and interviews, but an open discussion provides better results, since we are able to
have all the professionals in the same spot.
This approach allows us to focus the group on the main goal, which is to find issues that can be
solved by the application of Lean practices. One major problem with the historical data, is that the issues
mentioned there can’t be solved, for instance, bad weather, bad soil conditions, delays from government
officials.
Secondly, we created a proposal for a Maturity Model, one that evaluates the current practices of
a construction organization. The practices that are taken into account vary from operational processes
that share similarities to ones suggested by Lean Construction, to soft skills. For example, if the
organization is committed to implement new practices, or if there is training of the people involved in the
application on new practices, among other parameters that can be taken into consideration.
Based on the results of the evaluation, the model will prioritize a set number of practices to
mitigate the weak points of the organization. It will take into account which areas the organization is
doing it’s worst, and will push practices that improve on such areas.
All this work was developed with the help of the Lean Work Group. This group was an initiative
by the PTPC (Portuguese Construction Technological Platform), to study and spread the knowledge of
Lean practices in the construction industry. The results achieved were shared with the Lean Work
Group, which then presented some of the results in a Seminar held at the National Laboratory for Civil
Engineering (LNEC).
2
2. Problems and opportunities in the Portuguese AEC industry
To study the problems in the construction industry, we started by looking at what other studies
had already done. We chose studies that tackled and displayed the problems present in the industry in
their respective year. We focused our attention searching for recent studies, so that we get a view of the
current situation as well as the evolution of the problems since the crisis began. With this being said we
compiled a list of studies that suited our needs and proceeded to evaluate them.
The studies used in our analysis of the Portuguese industry problems are (Couto, 2006; Branco,
2007; Cabrita, 2008; André, 2010; Martins, 2011; Cruz, 2012; Silva, 2014).
These studies focus on the current problems of the construction industry, and all of them follow a
similar structure of analysis to one another, which makes comparing them quite a manageable task. The
backbone of the methodology of analysis of these studies is the PhD thesis by Couto, (2006). Most
studies base their analysis on this study, since it’s the most comprehensive of the lot.
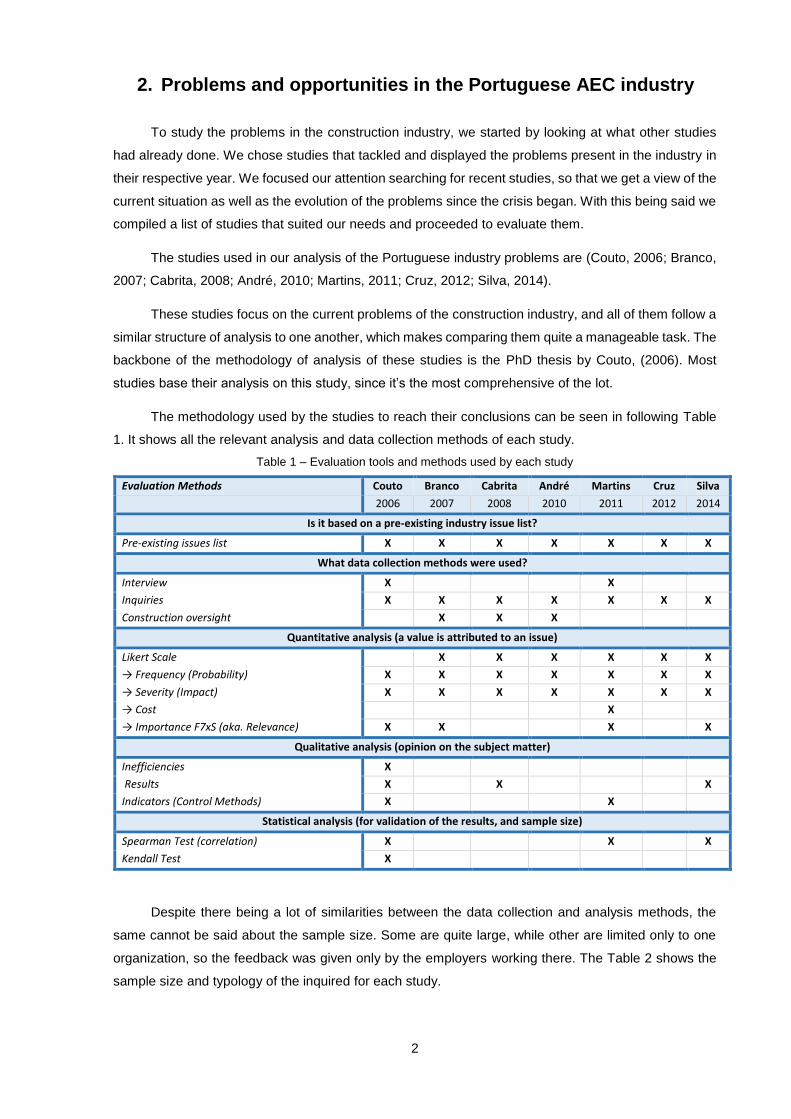
The methodology used by the studies to reach their conclusions can be seen in following Table
1. It shows all the relevant analysis and data collection methods of each study.
Table 1 – Evaluation tools and methods used by each study
Evaluation Methods Couto Branco Cabrita André Martins Cruz Silva
2006 2007 2008 2010 2011 2012 2014
Is it based on a pre-existing industry issue list?
Pre-existing issues list X X X X X X X
What data collection methods were used?
Interview X X
Inquiries X X X X X X X
Construction oversight X X X
Quantitative analysis (a value is attributed to an issue)
Likert Scale X X X X X X
→ Frequency (Probability) X X X X X X X
→ Severity (Impact) X X X X X X X
→ Cost X
→ Importance F7xS (aka. Relevance) X X X X
Qualitative analysis (opinion on the subject matter)
Inefficiencies X
Results X X X
Indicators (Control Methods) X X
Statistical analysis (for validation of the results, and sample size)
Spearman Test (correlation) X X X
Kendall Test X
Despite there being a lot of similarities between the data collection and analysis methods, the
same cannot be said about the sample size. Some are quite large, while other are limited only to one
organization, so the feedback was given only by the employers working there. The Table 2 shows the
sample size and typology of the inquired for each study.
3
Table 2 – Sample Size and typology of the inquired for each study
Studies
Inquired
Private Developer
Public Developer
Designers Contractor Employees Total
Couto, 2006 17 62 26 59 164
Interviewed → 5 18 8 8 39
Branco, 2007 20 20
Cabrita, 2008 13 13
André, 2010 17 17
Martins, 2011 8 10 13 31
Cruz, 2012 8 11 13 32
Silva, 2014 343 343
The main goal of this chapter was to collect data from older studies, and to compare them to the
data that was collected during a group workshop that took place in November 2015, in the LNEC
installations (National Laboratory for Civil Engineering).
Several entities were asked to give their feedback on the problems facing their work. These
entities present comprised mostly of contractors, but there were also designers, developers and the
oversight branch of construction. On this workshop a discussion was opened to collect a new list of
inefficiencies.
Table 3 shows the compilation of the results obtained from the workshop, as well as comparing
them to the older studies found. The red T, in the results column, shows which problems the group
mentioned as being the most serious currently in construction.
Note that equipment is mentioned for the first time. This is because the organizations that came
to this conclusion are organizations that use Lean Construction practices, for them the traditional way
equipment is used is very low efficiency, with no attention given to repair times, or scheduled repairs.
Also no attention is given to preemptive repair, to avoid major breakdowns in the future, something that
Lean focuses on heavily. These organizations would help shape a more Lean view of the issues
discussed in the group.
With the compilation of Inefficiencies done, we then identified the opportunities presented by Lean
Construction. We compiled a list of Lean practices that was first presented to the group for analysis.
Some of the Lean practices initially presented were not suitable for application in the construction
industry. Also it was discussed if the applicability of the selected practices could have an impact in the
problems that have been presented. Only practices that were applicable to construction, and that could
affect the problems found were selected.
The results of both the gathering of inefficiencies of the national construction industry, and the
final Lean practices list that the group deemed usable in the industry are presented in Table 3 and Table
4, respectively.

4
Table 3 – Compilation of inefficiencies results
Inefficiencies
Co
uto
20
06
Bra
nc
o
20
07
Ca
bri
ta
20
08
An
dré
20
10
Ma
rtin
s
20
11
Cru
z
20
12
Sil
va
20
14
Gro
up
res
ult
s
20
15
Developers
Frequent change requests X X X X X X
Delays on decisions by the developers X X X X X X T
Unrealistic date setting X X X X X T
Communication failures X X X T
Interferences and suspension of work X X X
Bad proposal selection criteria X X X T
Delays on the workplace availability X X
Designers
Lacking information before design X X X X X T
Errors and divergences on designs X X X T
Delays on design production X X
Lack of communication in design phase X X T
Project/design complexity X X
Delays on oversight and revision of work X X
Work overload X T
Oversight
Delays on review and approval of work X X X
Delays on oversight and trials X X
Lack of experience X T
Workforce
Lack of qualified workforce X X X X T
Low productivity X X X X
Lack of workers X X
Equipment
Equipment breakdown Mentioned
Lack of equipment Mentioned
Low productivity and efficiency Mentioned
Materials
Delay on material delivery X X X
Delays on material production X X
Late search of needed materials X
Other issues
Municipal and exterior paperwork delays X X X X X X X
Climacteric conditions X X X X X
Lack of finance X X X
Bad soil and terrain conditions X X X
Table 4 – Selection of practices and techniques
Lean practices and techniques
Big Room Integrated Project Delivery
5S Virtual Design & Construction (BIM)
Last Planner System Standard Works
Kaizen Events Spaghetti Chart
A3 Report Gemba Walk
Visual Control SMED
Value Stream Mapping Logistic train
Briefing Room Root Cause Analysis
Kanbans Value Engineering
Poke Yoke KPI
Heijunka TPM
5
3. Maturity Model Proposal
The goal of this chapter is to create a tool that allows organizations to self-evaluate their current
practices against a set list of Lean practices that were established with the help of the Lean Work Group.
The model can also be used as a basis for further improvement and development of maturity evaluation.
The main objective of a Maturity Model is to evaluate an organization, the purpose of this
evaluation is to measure how well the practices inside an organization are implemented and applied.
There are several factors that come into account when you evaluate an organizations practices
(Nesensohn, et al., 2014). We will base our proposal on existing models. Maturity Models started being
applied in the software industry, with one of the most well-known models having been developed by the
Carnegie Melon University, this model is known as CMMI. We present in Table 5 a number of Maturity
Models that were used for the elaboration of our own model.
Table 5 – Maturity Models
Maturity Models
Capability Maturity Model Integrated (CMMI)
Organizational Project Management Maturity Model (OPM3)
Berkley Project Management Process Maturity Model
Portfolio, Program and Project Management Maturity Model (P3M3)
Standardized Process Improvement for Construction Enterprises (SPICE)
One model that will be heavily taken into consideration is the SPICE model. This model is an
adaption of the CMMI to the construction industry, being developed by the Center for Information
Technology in Construction, University of Saltford, in the UK.
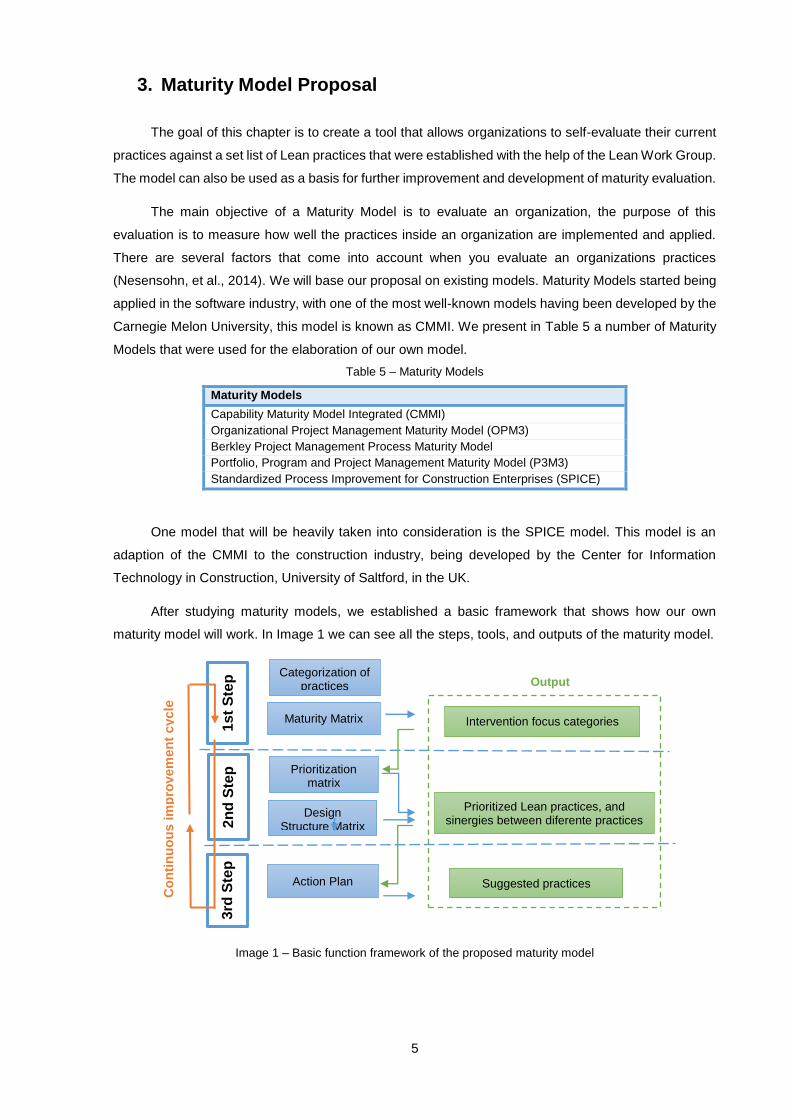
After studying maturity models, we established a basic framework that shows how our own
maturity model will work. In Image 1 we can see all the steps, tools, and outputs of the maturity model.
Image 1 – Basic function framework of the proposed maturity model
Categorization of practices
Maturity Matrix
1st
Ste
p
2n
d S
tep
Prioritization matrix
Design Structure Matrix
3rd
Ste
p
Action Plan
Intervention focus categories
Prioritized Lean practices, and sinergies between diferente practices
Suggested practices
Output
Co
nti
nu
ou
s im
pro
vem
en
t cycle
6
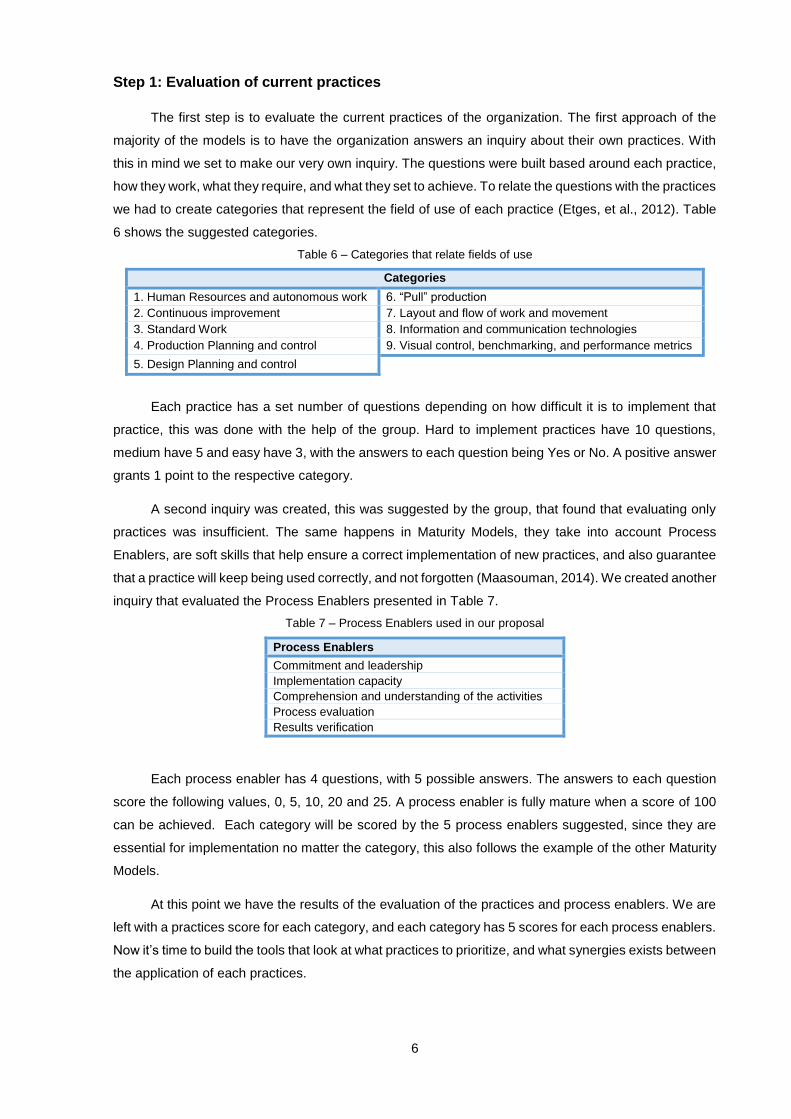
Step 1: Evaluation of current practices
The first step is to evaluate the current practices of the organization. The first approach of the
majority of the models is to have the organization answers an inquiry about their own practices. With
this in mind we set to make our very own inquiry. The questions were built based around each practice,
how they work, what they require, and what they set to achieve. To relate the questions with the practices
we had to create categories that represent the field of use of each practice (Etges, et al., 2012). Table
6 shows the suggested categories.
Table 6 – Categories that relate fields of use
Categories
1. Human Resources and autonomous work 6. “Pull” production
2. Continuous improvement 7. Layout and flow of work and movement
3. Standard Work 8. Information and communication technologies
4. Production Planning and control 9. Visual control, benchmarking, and performance metrics
5. Design Planning and control
Each practice has a set number of questions depending on how difficult it is to implement that
practice, this was done with the help of the group. Hard to implement practices have 10 questions,
medium have 5 and easy have 3, with the answers to each question being Yes or No. A positive answer
grants 1 point to the respective category.
A second inquiry was created, this was suggested by the group, that found that evaluating only
practices was insufficient. The same happens in Maturity Models, they take into account Process
Enablers, are soft skills that help ensure a correct implementation of new practices, and also guarantee
that a practice will keep being used correctly, and not forgotten (Maasouman, 2014). We created another
inquiry that evaluated the Process Enablers presented in Table 7.
Table 7 – Process Enablers used in our proposal
Process Enablers
Commitment and leadership
Implementation capacity
Comprehension and understanding of the activities
Process evaluation
Results verification
Each process enabler has 4 questions, with 5 possible answers. The answers to each question
score the following values, 0, 5, 10, 20 and 25. A process enabler is fully mature when a score of 100
can be achieved. Each category will be scored by the 5 process enablers suggested, since they are
essential for implementation no matter the category, this also follows the example of the other Maturity
Models.
At this point we have the results of the evaluation of the practices and process enablers. We are
left with a practices score for each category, and each category has 5 scores for each process enablers.
Now it’s time to build the tools that look at what practices to prioritize, and what synergies exists between
the application of each practices.
7
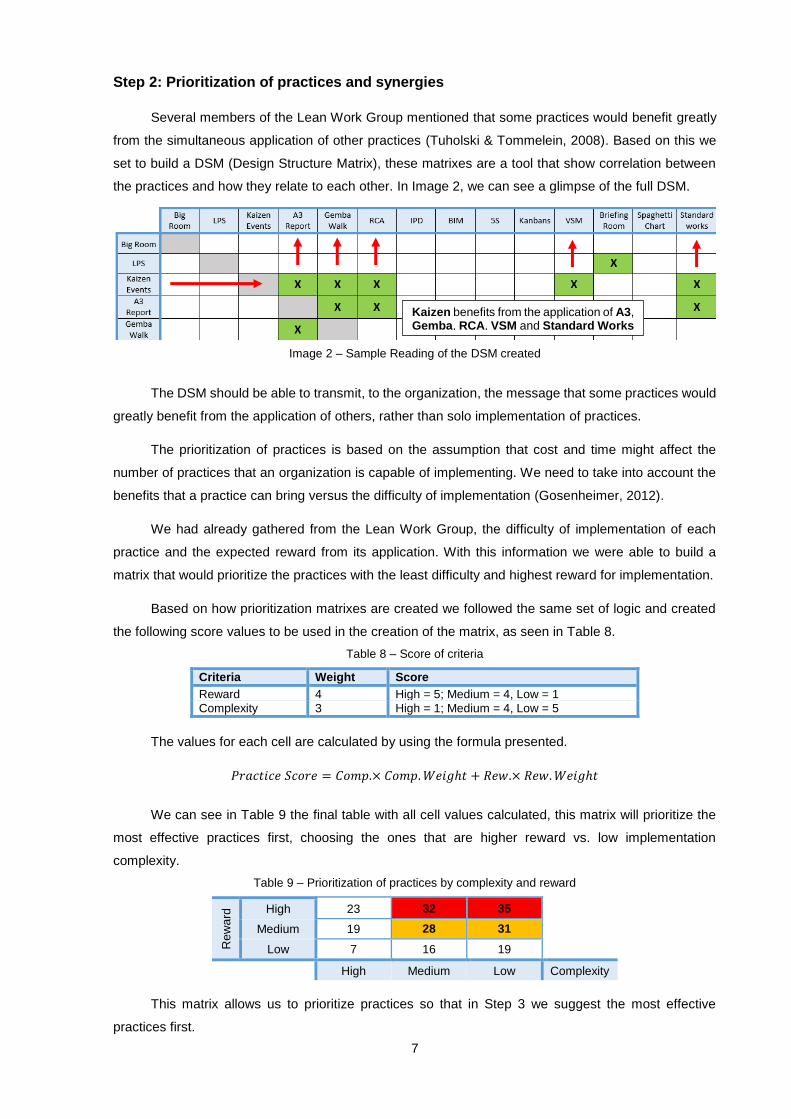
Step 2: Prioritization of practices and synergies
Several members of the Lean Work Group mentioned that some practices would benefit greatly
from the simultaneous application of other practices (Tuholski & Tommelein, 2008). Based on this we
set to build a DSM (Design Structure Matrix), these matrixes are a tool that show correlation between
the practices and how they relate to each other. In Image 2, we can see a glimpse of the full DSM.
The DSM should be able to transmit, to the organization, the message that some practices would
greatly benefit from the application of others, rather than solo implementation of practices.
The prioritization of practices is based on the assumption that cost and time might affect the
number of practices that an organization is capable of implementing. We need to take into account the
benefits that a practice can bring versus the difficulty of implementation (Gosenheimer, 2012).
We had already gathered from the Lean Work Group, the difficulty of implementation of each
practice and the expected reward from its application. With this information we were able to build a
matrix that would prioritize the practices with the least difficulty and highest reward for implementation.
Based on how prioritization matrixes are created we followed the same set of logic and created
the following score values to be used in the creation of the matrix, as seen in Table 8.
Table 8 – Score of criteria
Criteria Weight Score
Reward 4 High = 5; Medium = 4, Low = 1
Complexity 3 High = 1; Medium = 4, Low = 5
The values for each cell are calculated by using the formula presented.
𝑃𝑟𝑎𝑐𝑡𝑖𝑐𝑒 𝑆𝑐𝑜𝑟𝑒 = 𝐶𝑜𝑚𝑝.× 𝐶𝑜𝑚𝑝. 𝑊𝑒𝑖𝑔ℎ𝑡 + 𝑅𝑒𝑤.× 𝑅𝑒𝑤. 𝑊𝑒𝑖𝑔ℎ𝑡
We can see in Table 9 the final table with all cell values calculated, this matrix will prioritize the
most effective practices first, choosing the ones that are higher reward vs. low implementation
complexity.
Table 9 – Prioritization of practices by complexity and reward
Rew
ard
High 23 32 35
Medium 19 28 31
Low 7 16 19
High Medium Low Complexity
This matrix allows us to prioritize practices so that in Step 3 we suggest the most effective
practices first.
Image 2 – Sample Reading of the DSM created
Kaizen benefits from the application of A3, Gemba, RCA, VSM and Standard Works

8
Step 3: Action Plan and suggestion of practices
The action plan is the culmination of all the tools and inquiries that were elaborated in the previous
steps. Here you should be able to see an organizations weak points, as well as a suggestion of practices
for the categories that were lacking maturity.
The first results presented in the action plan, show in which categories the organization has
practices that are relatively far from the ideals of Lean Construction. At the same time it shows the
scores of the process enablers for each category. A sample of possible results is shown in Image 3.
Image 3 – Maturity results for each category and process enabler
Based on these values the action plan will show the suggested list of practices for a given number
of weak categories. The practices are shown in descending order, with the most important practices
showing up first. You can also see that the model adjusts its suggestion depending on how many
categories you want to improve by implementing Lean practices. A sample is provided in Image 4.
Image 4 – Sample of Maturity Model suggestion
9
4. Conclusions
The work started by older studies, of collecting and compiling the inefficiencies of the Portuguese
Construction industry, has been updated in this work. This time we had the opportunity to include entities
that provided us with a Lean perspective on the whole inefficiencies debacle, bringing new insight to the
study of inefficiencies.
Given all of the inefficiencies provided and collected, there is a clear necessity in the current
Portuguese Construction industry for improvement of production and overall operating and planning
processes. The inefficiencies related to equipment were mentioned for the first time in any of the studies
covered, this was due to the fact that the people mentioning this problem were Lean practitioners, for
them equipment, if managed in the traditional way, is not effective at all and contributes a great deal to
overall waste generated.
With the help of the Lean Work Group, we were able to gather a series of practices that through
consensus, were deemed applicable to the Portuguese Construction Industry. These practices would
later on be used to create our maturity model.
The elaboration of the maturity model, enabled us to start developing a tool that might be used
by organizations to get an idea of what their current standing in Lean Construction is. This is one of
many stepping stones that an organization must go through. The current model developed, through an
inquiry, tries to figure out if there are practices being applied in an organization that are similar to those
described by the Lean Construction practitioners, it also tries to evaluate, to a certain extent, the maturity
of the culture behind the organization. It is this backbone that allows an organization to successfully
implement new practices and to assure that they can continue to be used and also improved as they
are used, time and time again
Based on the evaluation the maturity model with present the weak points of an organization. It
will point out which categories of practices are the weakest, and will also show what aspects of the
culture are missing or fragile. It then gives suggestions on which practices can be implemented where.
In the future, the inefficiencies can keep being updated to see if there are any changes in the
industry, may they be positive or negative. The list of practices can be added upon, as there is always
room for more Lean practices that are applicable to the Construction Industry. The Maturity Model that
has been presented can be built upon, it can be used as a basis for a more developed and
comprehensive model to be developed. The maturity model can be adapted to incorporate several levels
of maturity, changing its questions and practices with each one, this is what models like CMMI do and
is the next logical step for a maturity model to take. It could also take more factors into consideration,
like financial results, performance indicators.
10
Bibliografia
André, N. M., 2010. Tese de Mestrado em Engenharia Civil "Modelo de estimação do impacto dos
atrasos nos custos de um projecto", s.l.: Instituto Superior Técnico.
Branco, D. M., 2007. Tese de Mestrado em Engenharia Civil "Causas e efeitos dos atrasos na
construção", s.l.: Instituto Superior Técnico.
Cabrita, A. F. N., 2008. Tese de Mestrado em Engenharia Civil "Atrasos na Construção: Causas, efeitos
e medidas de mitigação", s.l.: Instituto Superior Técnico.
Couto, J. P., 2006. Tese de Douturamento em Engenharia Civil "Incumprimentos dos prazos na
Construção", s.l.: Universidade do Minho.
Cruz, A. F., 2012. Tese de Mestrado em Engenharia Civil "Estudo dos atrasos em edificações
correntes", s.l.: Instituto Superior de Engenharia de Coimbra.
Etges, B., Saurin, T. & Bulhões, I., 2012. Identifying Lean Construction Categories of practices in IGLC
Proceedings, s.l.: IGLC.
Gosenheimer, C., 2012. "Project Prioritization: A structured approach to working on what matters most".
Office of Quality Improvement University of Wisconsin-Madison.
Maasouman, M. A., 2014. Tese de Mestrado em Ciências Aplicadas em Engenharia da Indústria
"Development of Lean Maturity Model for Operational Level Planning", Montreal, Quebec, Canada:
Concordia University.
Martins, J. R. M., 2011. Tese de Mestrado em Engenharia Civil "Lean Construction na Construção e
Engenharia Portuguesas - Oportunidades e desafios para os Donos de Obra", s.l.: Universidade Nova
de Lisboa.
Nesensohn, C., Bryde, D. J., Fearon, D. J. & Ochieng, E. G., 2014. Combining Lean Construction with
Maturity Models.
Silva, A. B. B. d., 2014. Tese de Mestrado em Engenharia Civil "Dificuldades, ineficiências e
oportunidades no sector da construção em Portugal", s.l.: Instituto Superior Técnico.
Tuholski, S. J. & Tommelein, I. D., 2008. Design Structure Matrix (DSM) Implementation on a Seismic
Retrofit. IGLC.