leadership in turbulent times - milken...
TRANSCRIPT

Leadership in Turbulent TimesLeadership in Turbulent TimesLeadership in Turbulent TimesLeadership in Turbulent Times
Milken Institute Summit - LondonHeron Tower
Milken Institute Summit - LondonHeron TowerHeron Tower
October 18, 2011Heron Tower
October 18, 2011
Michael MilkenChairman, The Milken Institute
Michael MilkenChairman, The Milken Institute,,
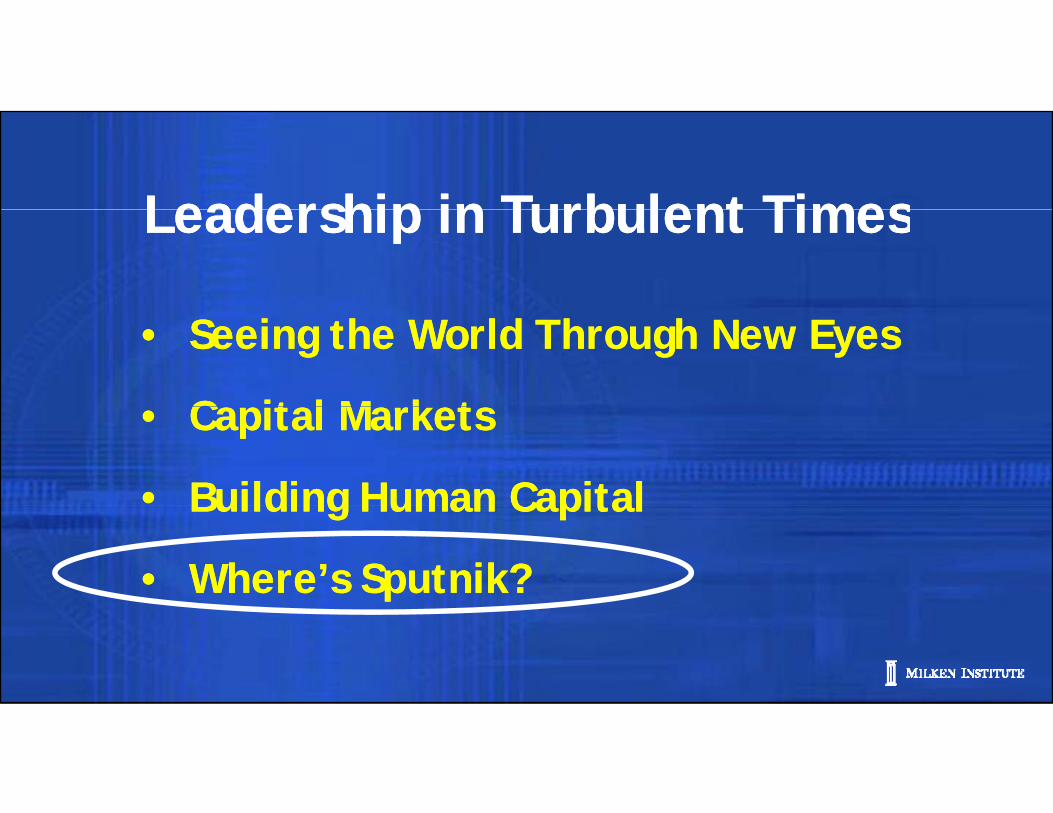
Leadership in Turbulent TimesLeadership in Turbulent TimesLeadership in Turbulent TimesLeadership in Turbulent Times
• Seeing the World Through New Eyes
C it l M k t
• Seeing the World Through New Eyes
C it l M k t• Capital Markets
• Building Human Capital
• Capital Markets
• Building Human Capital• Building Human Capital
• Where’s Sputnik?
• Building Human Capital
• Where’s Sputnik?

“It was the best of times, “It was the best of times, it was the worst of times, it was the age of wisdom, it was the age of foolishness
it was the worst of times, it was the age of wisdom, it was the age of foolishness it was the age of foolishness, it was the epoch of belief, it was the epoch of incredulity,
it was the age of foolishness, it was the epoch of belief, it was the epoch of incredulity, it was the season of Light, it was the season of Darkness, it was the spring of hope
it was the season of Light, it was the season of Darkness, it was the spring of hope it was the spring of hope, it was the winter of despair, we had everything before us,
it was the spring of hope, it was the winter of despair, we had everything before us, we had nothing before us …”we had nothing before us …”
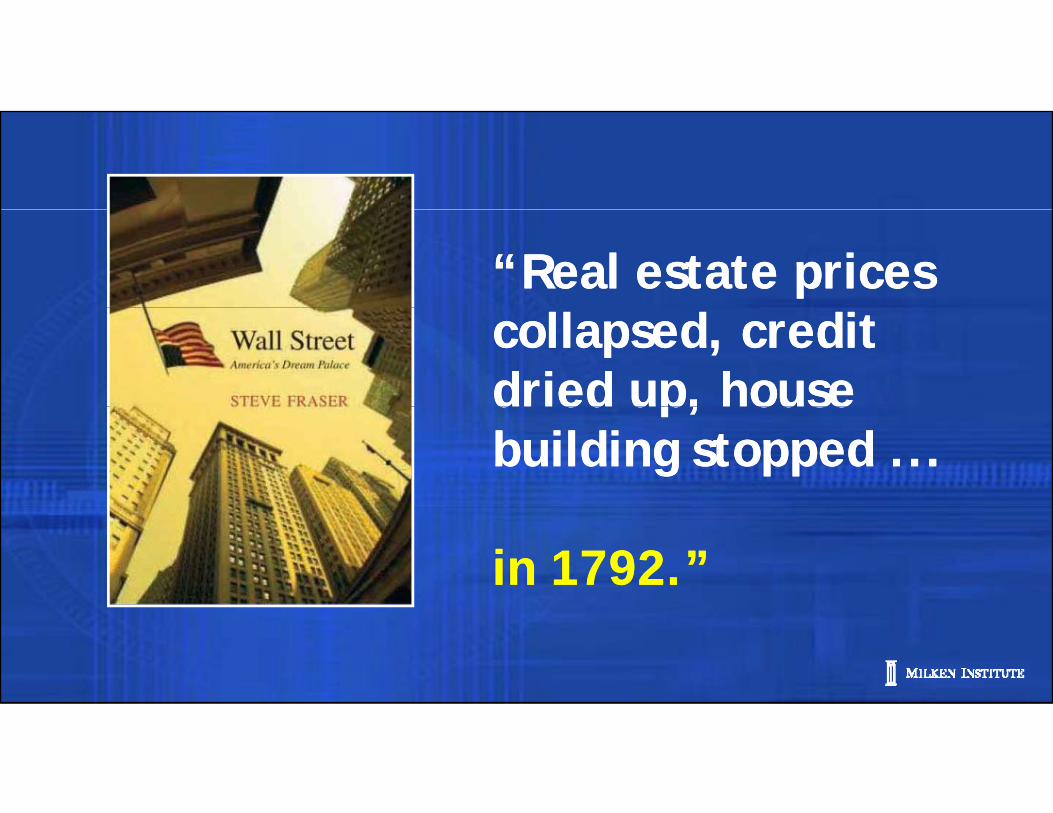
“Real estate prices“Real estate pricescollapsed, creditdried up, housecollapsed, creditdried up, housed ed up, ousebuilding stopped ...d ed up, ousebuilding stopped ...
in 1792.”in 1792.”
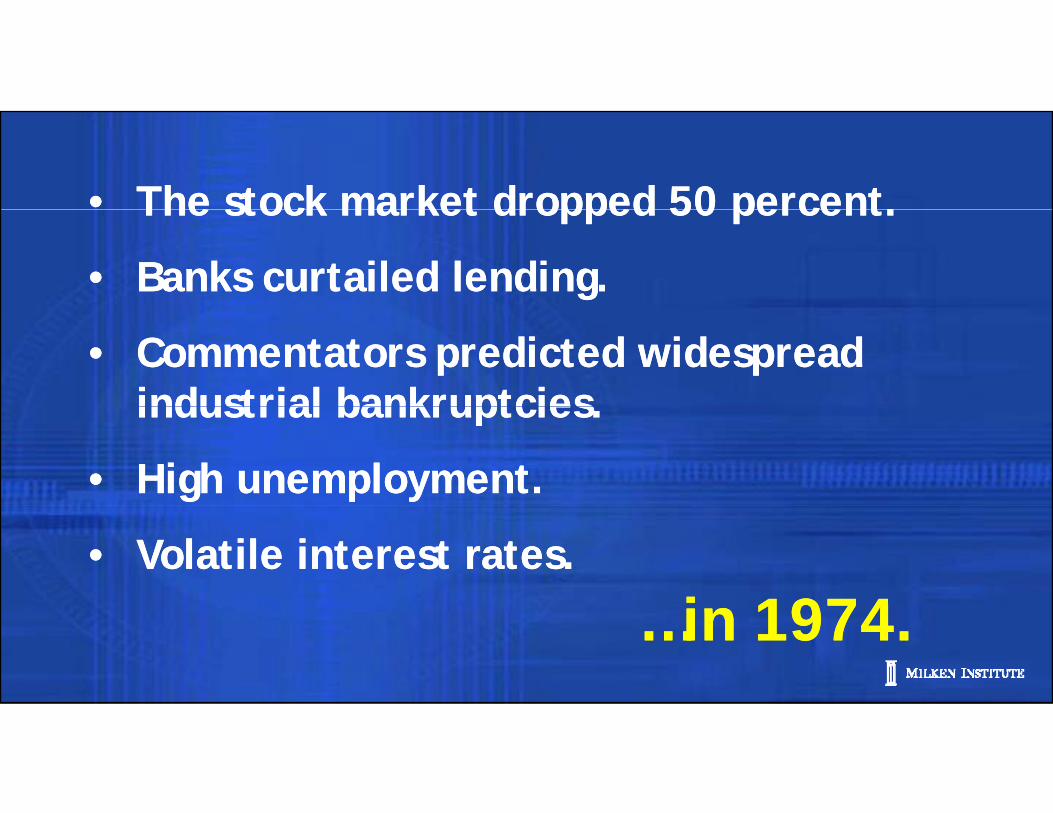
• The stock market dropped 50 percent.• The stock market dropped 50 percent.• The stock market dropped 50 percent.
• Banks curtailed lending.
• The stock market dropped 50 percent.
• Banks curtailed lending.
• Commentators predicted widespread industrial bankruptcies
• Commentators predicted widespread industrial bankruptciesindustrial bankruptcies.
• High unemployment.
industrial bankruptcies.
• High unemployment.
• Volatile interest rates.• Volatile interest rates.
i 1974i 1974…in 1974.…in 1974.
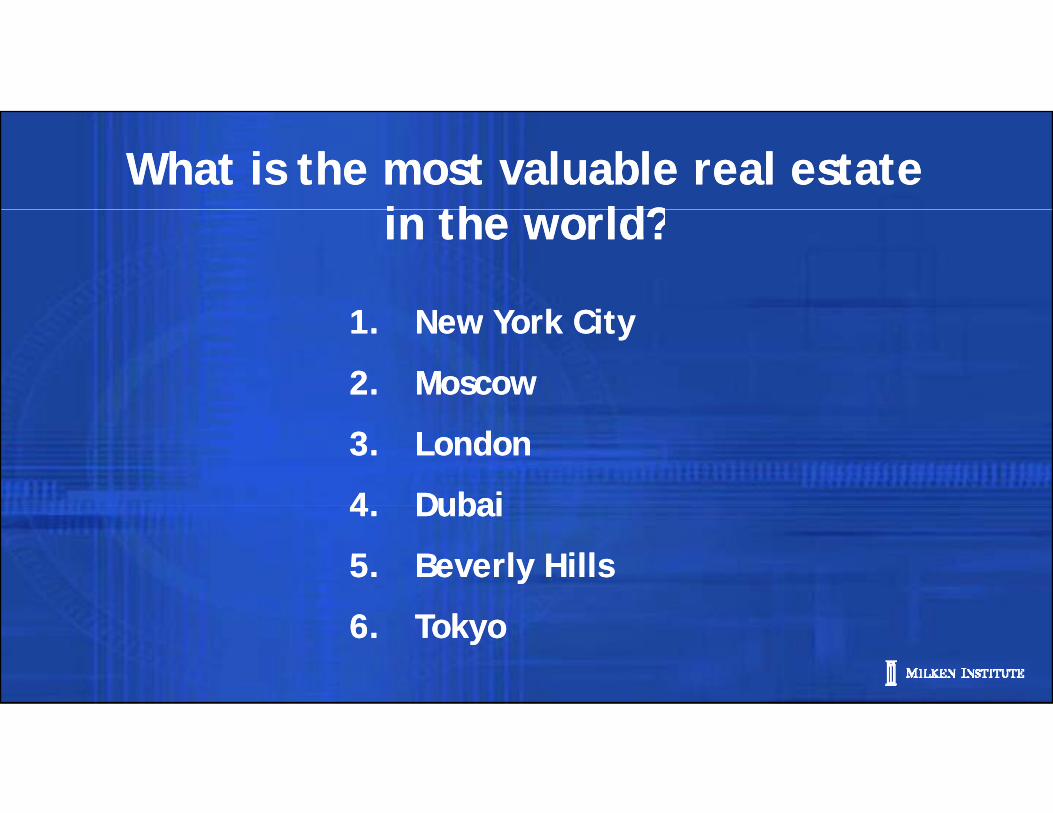
What is the most valuable real estate i th ld?
What is the most valuable real estate i th ld?in the world?in the world?
kk1. New York City
2. Moscow
1. New York City
2. Moscow
3. London
4 Dubai
3. London
4 Dubai4. Dubai
5. Beverly Hills
4. Dubai
5. Beverly Hills
6. Tokyo6. Tokyo
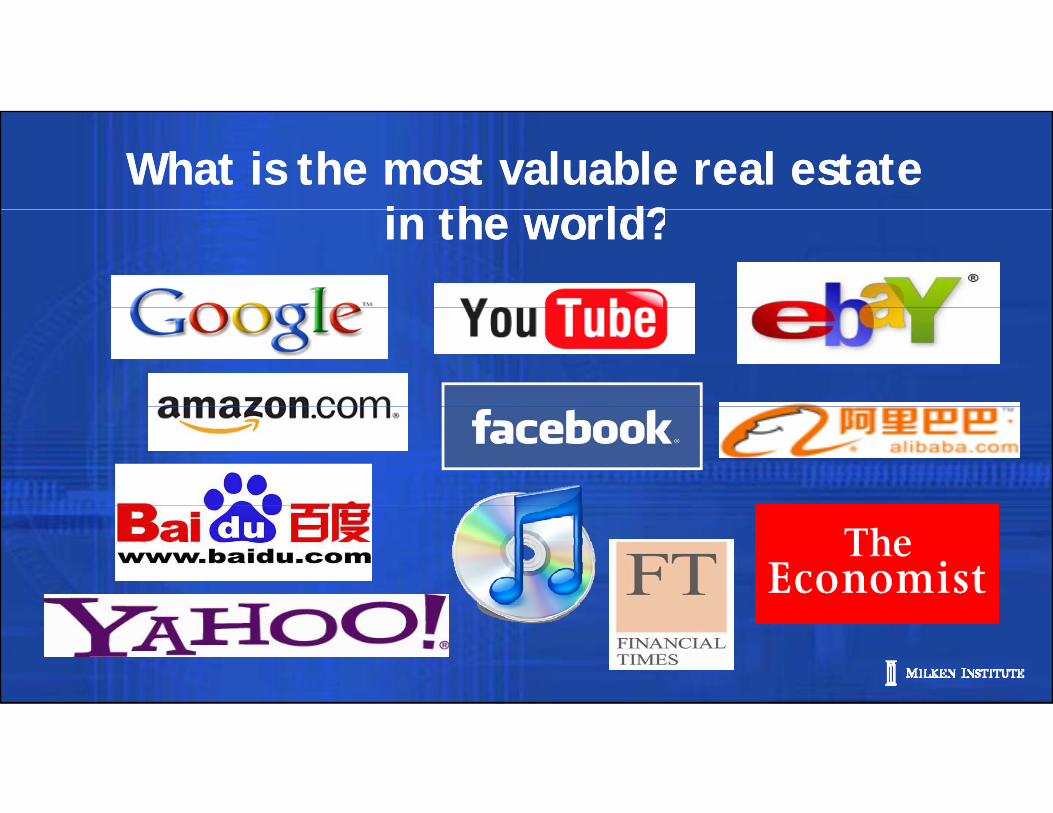
What is the most valuable real estate i th ld?
What is the most valuable real estate i th ld?in the world?in the world?
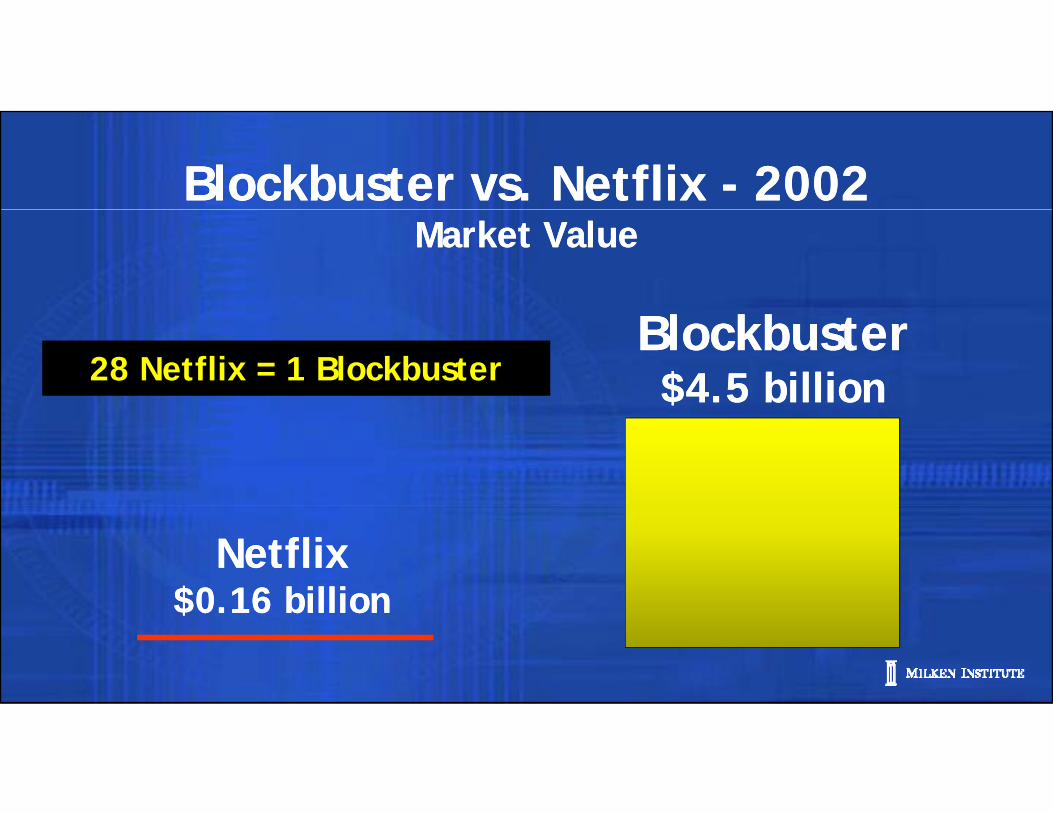
Blockbuster vs. Netflix - 2002Blockbuster vs. Netflix - 2002Market ValueMarket Value
BlockbusterBlockbuster$4.5 billion$4.5 billion28 Netflix = 1 Blockbuster $$
Netflix$0 16 billion
Netflix$0 16 billion$0.16 billion$0.16 billion

Blockbuster vs. Netflix - 2011Blockbuster vs. Netflix - 2011Market ValueMarket Value
Netflix$6 1 billionNetflix
$6 1 billion$6.1 billion$6.1 billion
BlockbusterBlockbuster$0$0$0$0
Source: WSJ.com 10/16/11
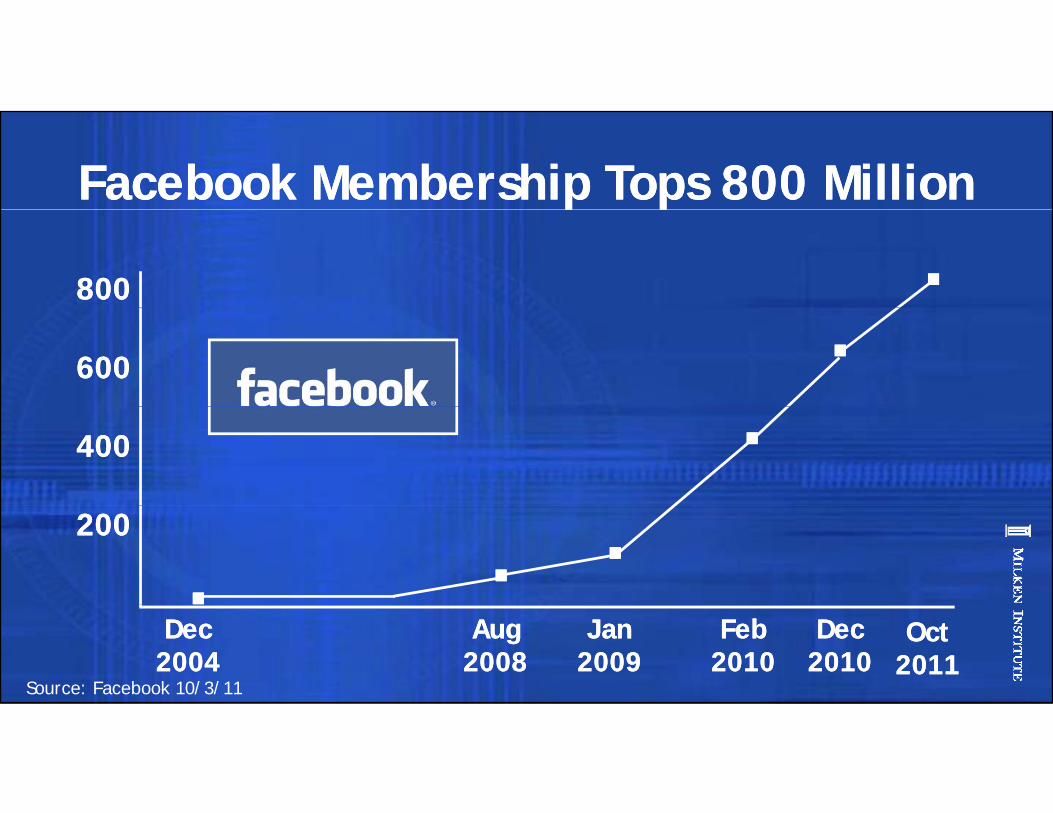
Facebook Membership Tops 800 MillionFacebook Membership Tops 800 Millionp pp p
800800 ..600 600
..400 400 ..200 200
.. ....Dec
2004Dec
2004
..Dec
2010Dec
2010Feb
2010Feb
2010Aug
2008Aug
2008Jan
2009Jan
2009Source: Facebook 10/3/11
Oct2011Oct
2011
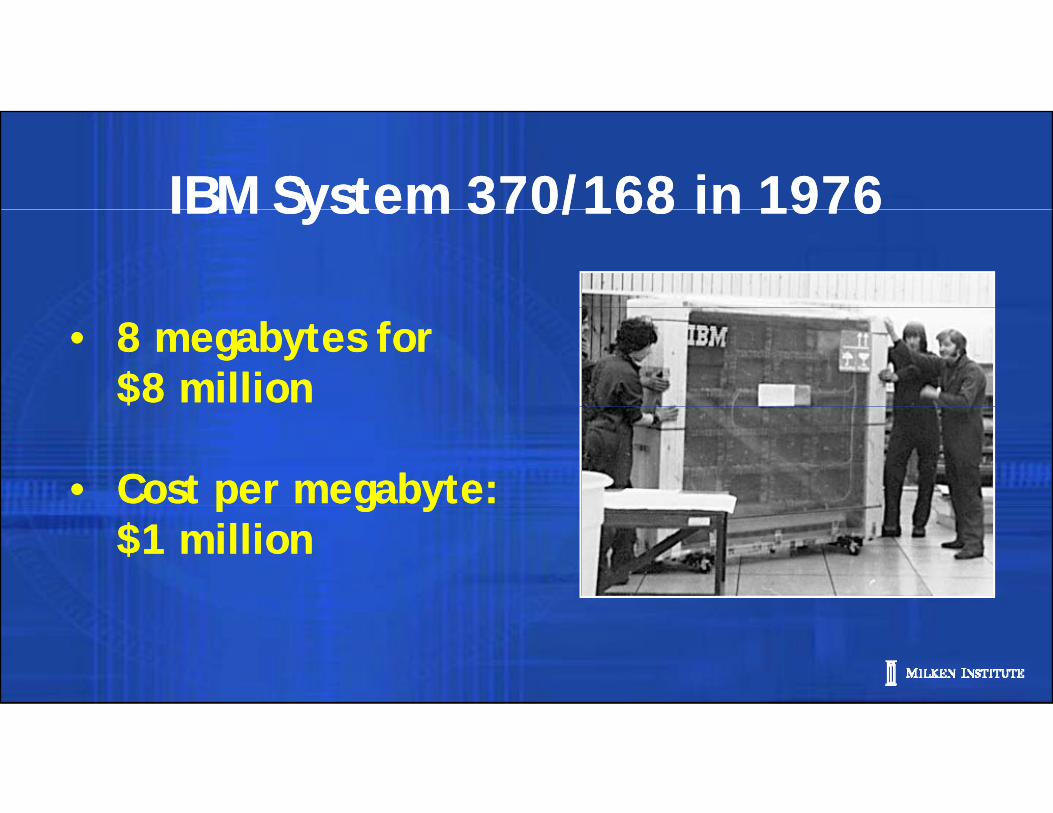
IBM System 370/168 in 1976IBM System 370/168 in 1976IBM System 370/168 in 1976IBM System 370/168 in 1976
• 8 megabytes for$8 million
• 8 megabytes for$8 million$
• Cost per megabyte:
$
• Cost per megabyte:p g y$1 million
p g y$1 million
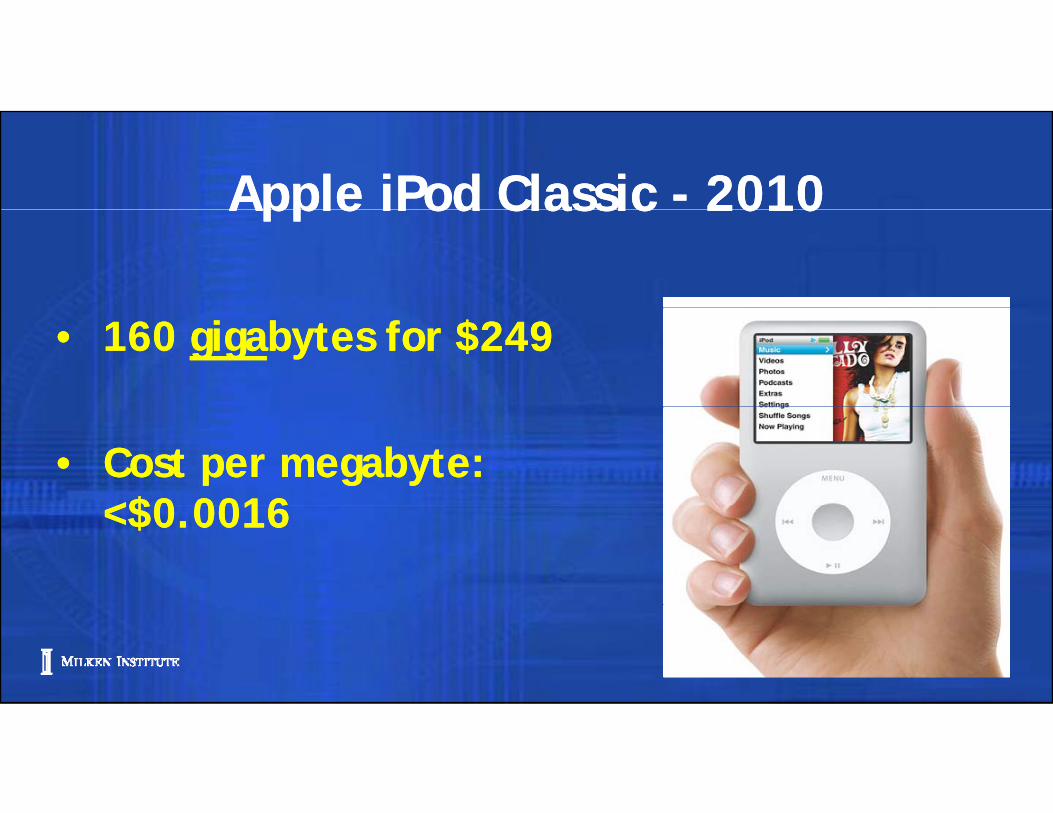
Apple iPod Classic - 2010Apple iPod Classic - 2010Apple iPod Classic 2010Apple iPod Classic 2010
• 160 gigabytes for $249• 160 gigabytes for $249
• Cost per megabyte: <$0 0016
• Cost per megabyte: <$0 0016<$0.0016<$0.0016

Today there are more than 500 Today there are more than 500 Today, there are more than 500
million cell phones in China
Today, there are more than 500
million cell phones in China million cell phones in China …million cell phones in China …
Source: China’s Ministry of Information Industry
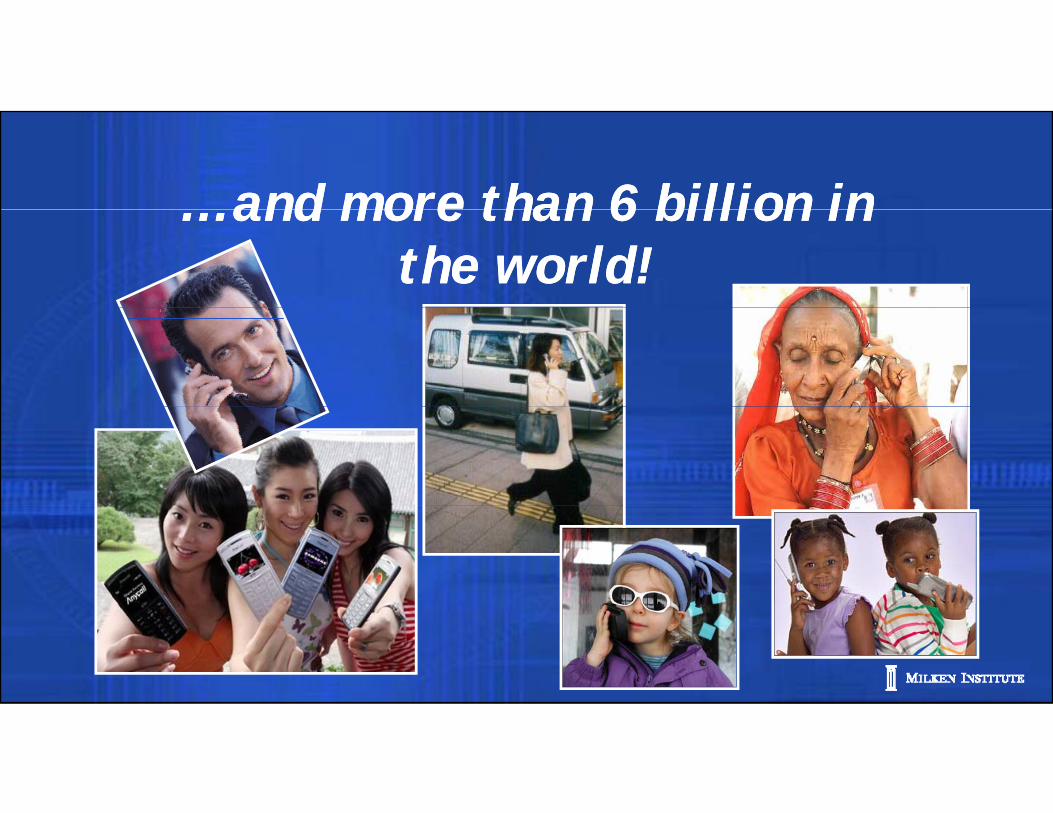
and more than 6 billion in and more than 6 billion in… and more than 6 billion inthe world!
… and more than 6 billion inthe world!

Down on the FarmDown on the FarmDown on the FarmDown on the Farm
Source: McGraw Hill advertisement

Cost of a 1-Minute Phone Call from the Cost of a 1-Minute Phone Call from the U.S. to IndiaU.S. to India
1975$101975$10
20112011$.01$.01
Telecommunications cost to business Telecommunications cost to business Telecommunications cost to business approaches zero.
Telecommunications cost to business approaches zero.
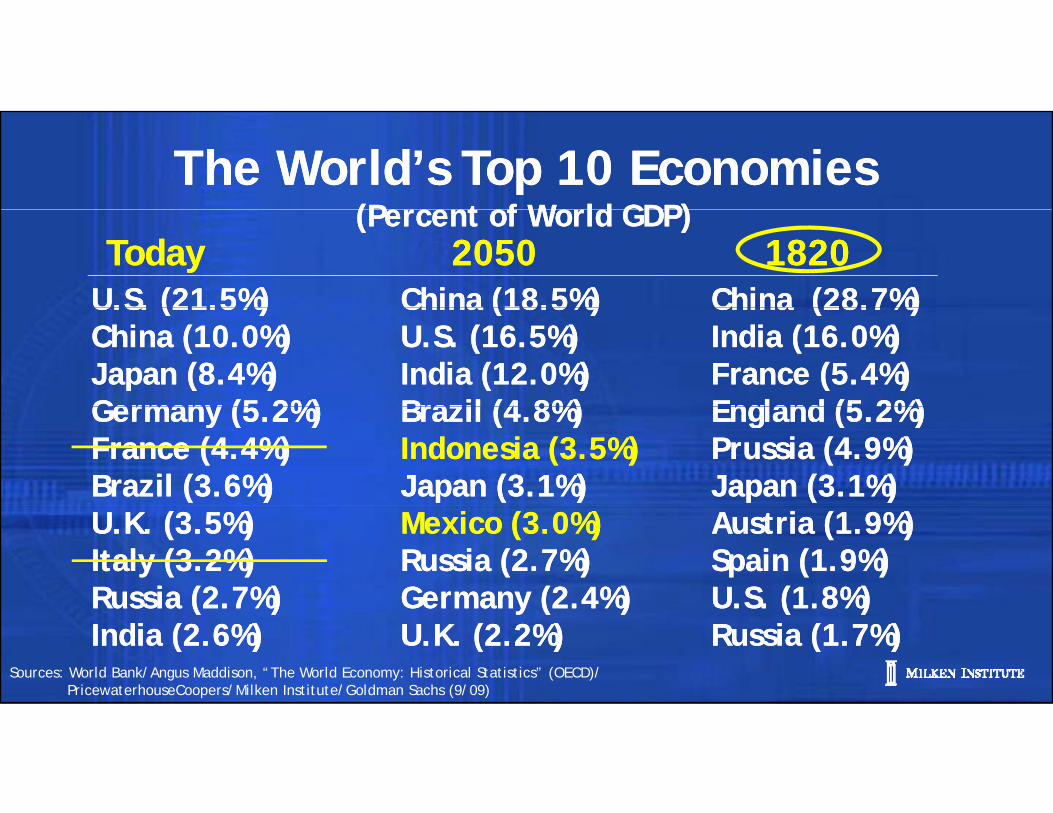
The World’s Top 10 Economies(P t f W ld GDP)
The World’s Top 10 Economies(P t f W ld GDP)
U.S. (21.5%)U.S. (21.5%)TodayToday
(Percent of World GDP)(Percent of World GDP)20502050 18201820
China (28.7%) China (28.7%) China (18.5%) China (18.5%) U.S. (21.5%)China (10.0%) Japan (8.4%) Germany (5 2%)
U.S. (21.5%)China (10.0%) Japan (8.4%) Germany (5 2%)
China (28.7%) India (16.0%)France (5.4%) England (5 2%)
China (28.7%) India (16.0%)France (5.4%) England (5 2%)
China (18.5%) U.S. (16.5%) India (12.0%) Brazil (4 8%)
China (18.5%) U.S. (16.5%) India (12.0%) Brazil (4 8%)Germany (5.2%)
France (4.4%) Brazil (3.6%)
Germany (5.2%)France (4.4%) Brazil (3.6%)
England (5.2%) Prussia (4.9%) Japan (3.1%)
England (5.2%) Prussia (4.9%) Japan (3.1%)
Brazil (4.8%)Indonesia (3.5%)Japan (3.1%)
Brazil (4.8%)Indonesia (3.5%)Japan (3.1%)
U.K. (3.5%) Italy (3.2%)Russia (2.7%)
U.K. (3.5%) Italy (3.2%)Russia (2.7%)
Austria (1.9%)Spain (1.9%) U.S. (1.8%)
Austria (1.9%)Spain (1.9%) U.S. (1.8%)
Mexico (3.0%)Russia (2.7%) Germany (2.4%)
Mexico (3.0%)Russia (2.7%) Germany (2.4%)Russia (2.7%)
India (2.6%)Russia (2.7%)India (2.6%)
Sources: World Bank/Angus Maddison, “The World Economy: Historical Statistics” (OECD)/PricewaterhouseCoopers/Milken Institute/Goldman Sachs (9/09)
U.S. (1.8%) Russia (1.7%)U.S. (1.8%) Russia (1.7%)
Germany (2.4%)U.K. (2.2%)Germany (2.4%)U.K. (2.2%)
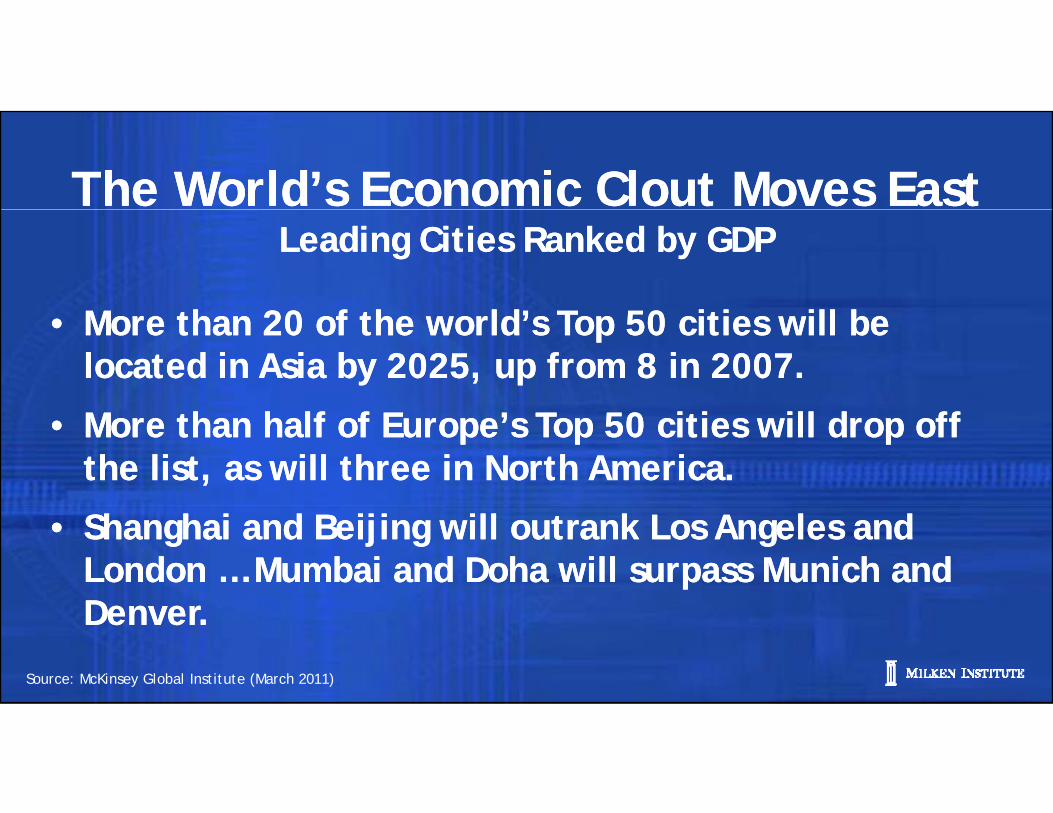
The World’s Economic Clout Moves EastThe World’s Economic Clout Moves EastLeading Cities Ranked by GDPLeading Cities Ranked by GDP
• More than 20 of the world’s Top 50 cities will be located in Asia by 2025, up from 8 in 2007.
• More than 20 of the world’s Top 50 cities will be located in Asia by 2025, up from 8 in 2007.
• More than half of Europe’s Top 50 cities will drop off the list, as will three in North America.
• More than half of Europe’s Top 50 cities will drop off the list, as will three in North America.
• Shanghai and Beijing will outrank Los Angeles and London … Mumbai and Doha will surpass Munich and D
• Shanghai and Beijing will outrank Los Angeles and London … Mumbai and Doha will surpass Munich and DDenver.Denver.
Source: McKinsey Global Institute (March 2011)
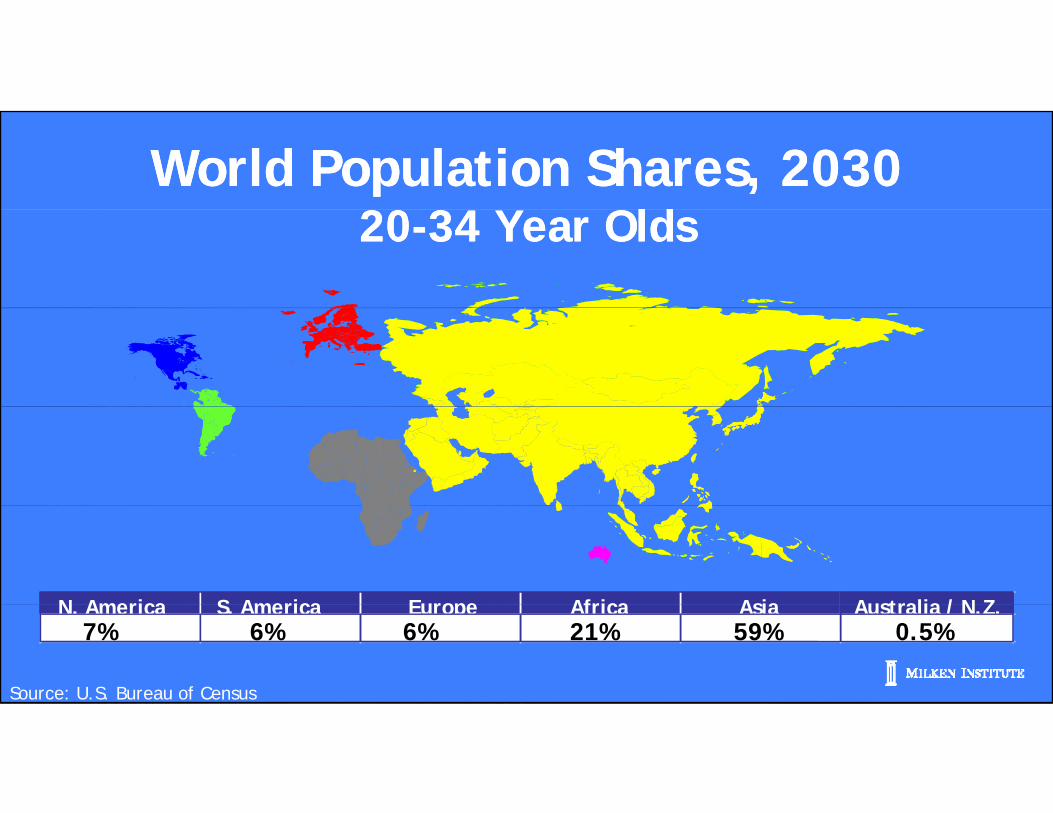
World Population Shares, 203020 34 Y Old
World Population Shares, 203020 34 Y Old20-34 Year Olds20-34 Year Olds
N America S America Europe Africa Asia Australia / N ZN. America S. America Europe Africa Asia Australia / N.Z.7% 6% 6% 21% 59% 0.5%
Source: U.S. Bureau of Census
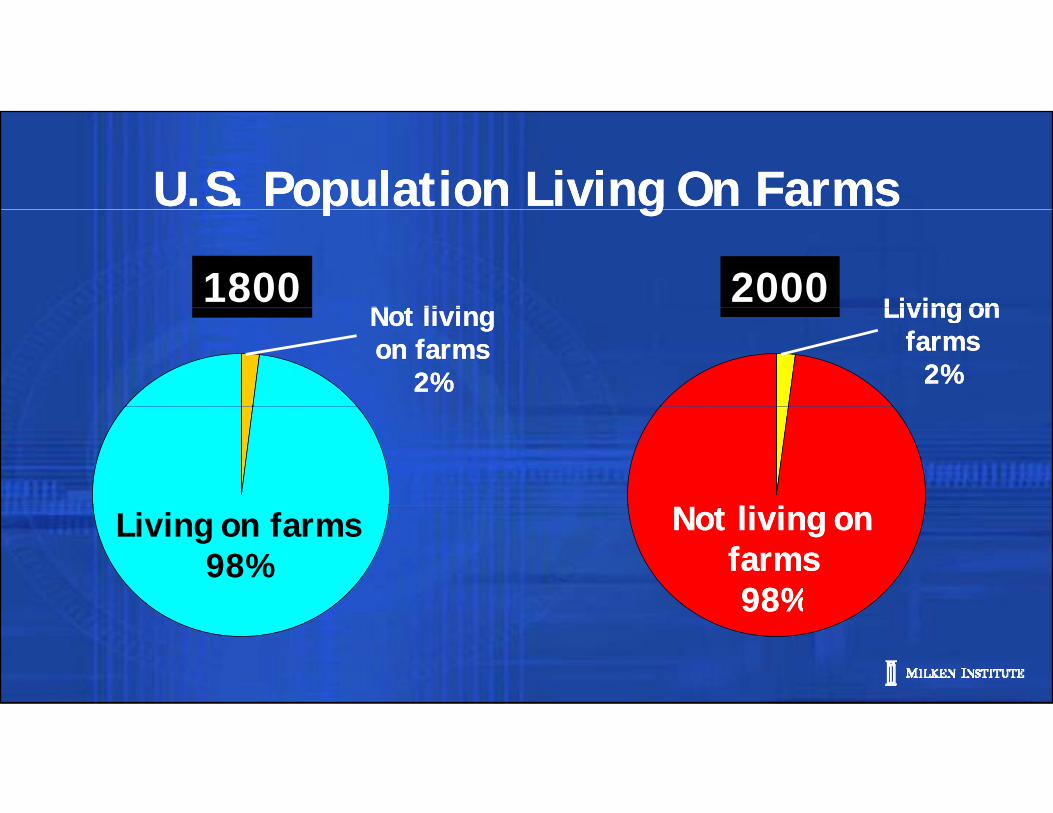
U.S. Population Living On FarmsU.S. Population Living On Farmsp gp g
1800 20002000N t li iN t li i Living on Living on Not livingon farms
2%
Not livingon farms
2%
Living on farms
2%
Living on farms
2%
li i li i Living on farms98%
Not living on farms98%
Not living on farms98%98%98%
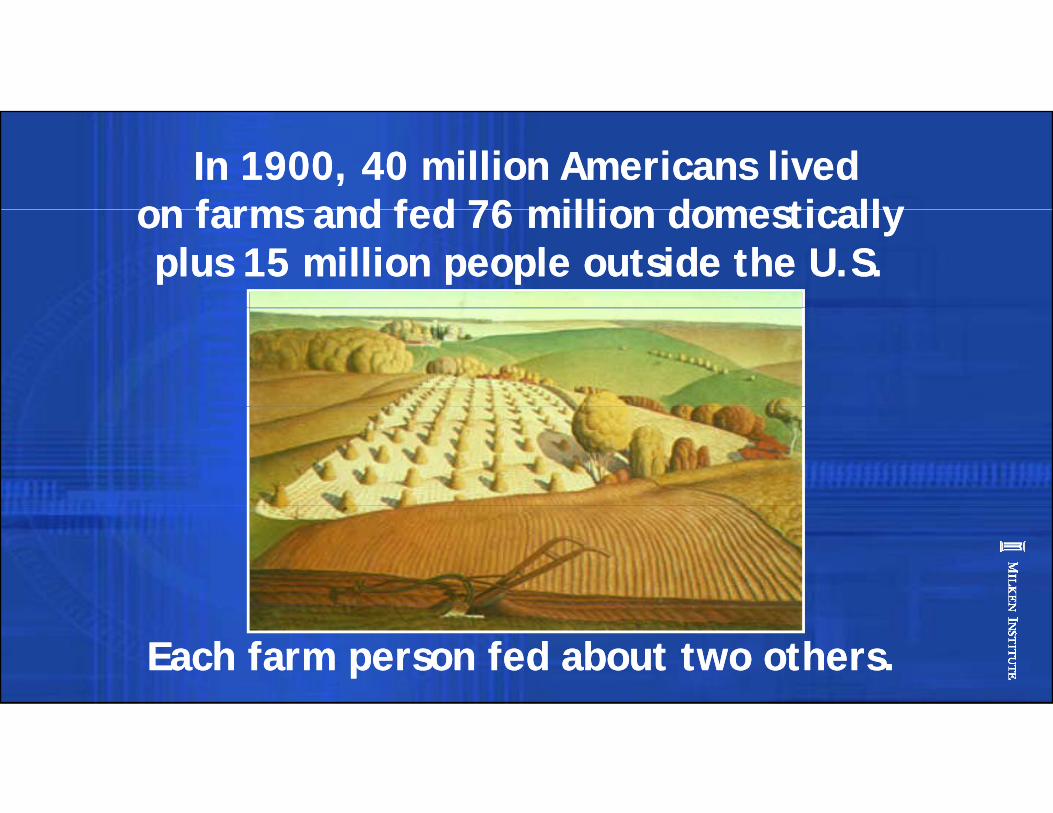
In 1900, 40 million Americans livedon farms and fed 76 million domestically
In 1900, 40 million Americans livedon farms and fed 76 million domestically on farms and fed 76 million domestically plus 15 million people outside the U.S.
on farms and fed 76 million domestically plus 15 million people outside the U.S.
Each farm person fed about two others.Each farm person fed about two others.

In 2000, 1.5 million Americans lived on farms and fed 290 million domestically plus 220
In 2000, 1.5 million Americans lived on farms and fed 290 million domestically plus 220 and fed 290 million domestically plus 220
million others.and fed 290 million domestically plus 220
million others.
Each farm person fed about 340 others!Each farm person fed about 340 others!
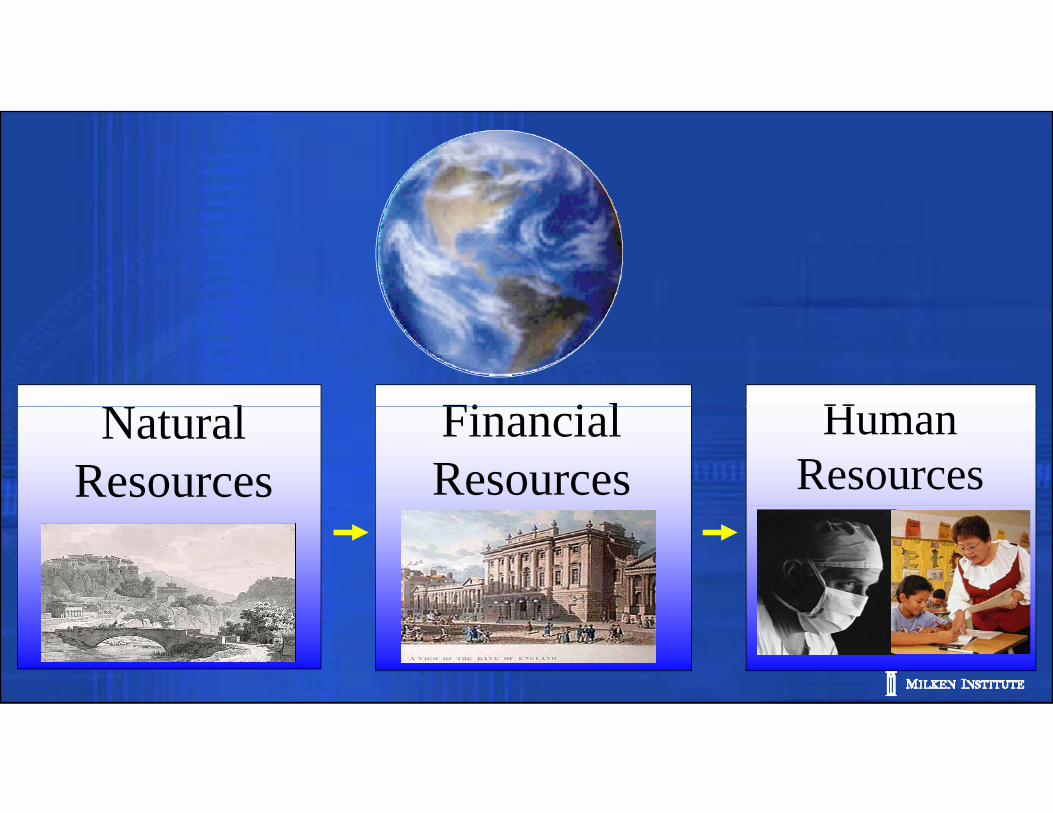
Fi i l HN l FinancialResources
HumanResources
Natural Resources

Cost of Raw Materials & EnergyCost of Raw Materials & Energygygy
1920’sb l
1920’sb l
Today’s h
Today’s hAutomobileAutomobile MicrochipMicrochip
60%60% 2%2%60%60% <2%<2%
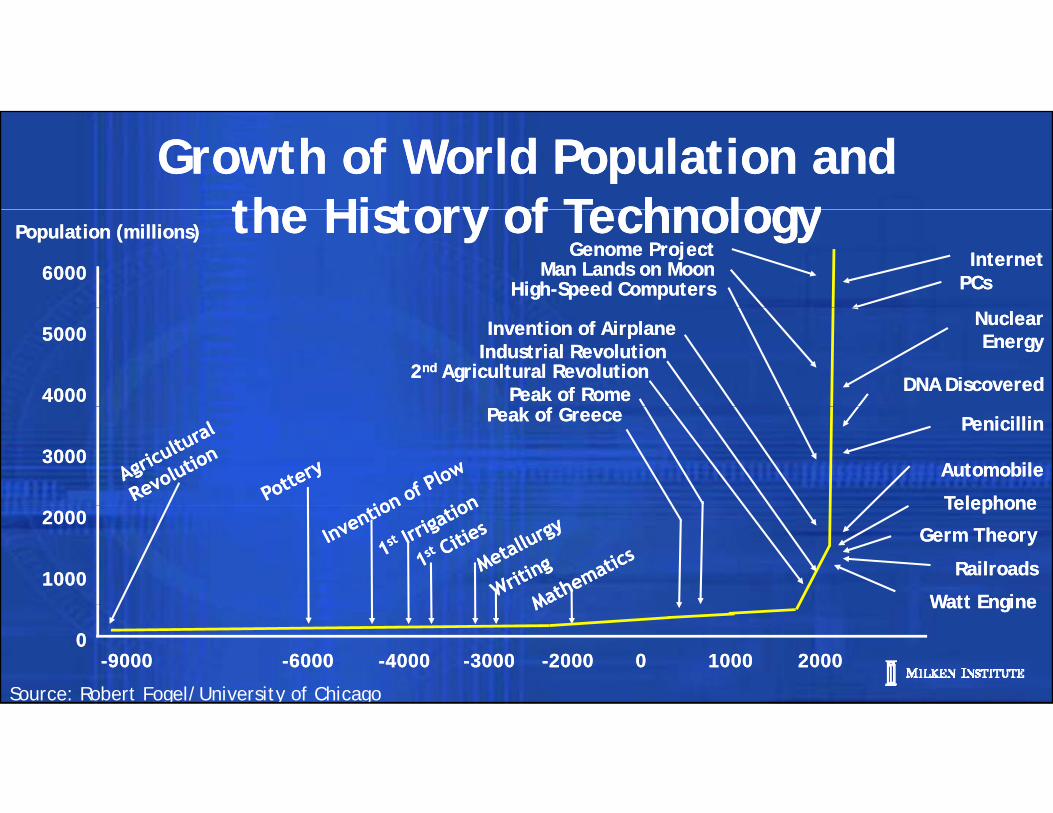
Growth of World Population andthe History of Technology
Growth of World Population andthe History of Technologythe History of Technologythe History of Technology
60006000High-Speed ComputersHigh-Speed Computers
Man Lands on MoonMan Lands on MoonGenome ProjectGenome Project
PCsPCs
Population (millions)Population (millions)InternetInternet
50005000
40004000kk
Peak of RomePeak of Rome
Invention of AirplaneInvention of Airplane
2nd Agricultural Revolution2nd Agricultural RevolutionIndustrial RevolutionIndustrial Revolution
NuclearEnergy
NuclearEnergy
DNA DiscoveredDNA Discovered
30003000
Peak of GreecePeak of Greece PenicillinPenicillin
AutomobileAutomobile
TelephoneTelephone20002000
10001000Watt EngineWatt Engine
RailroadsRailroads
Germ TheoryGerm Theory
TelephoneTelephone
Source: Robert Fogel/University of Chicago
-9000-9000 -6000-6000 -3000-3000 -2000-2000 00 10001000 20002000-4000-400000
Watt EngineWatt Engine
Leadership in Turbulent TimesLeadership in Turbulent TimesLeadership in Turbulent TimesLeadership in Turbulent Times
• Seeing the World Through New Eyes
C it l M k t
• Seeing the World Through New Eyes
C it l M k t• Capital Markets
• Building Human Capital
• Capital Markets
• Building Human Capital• Building Human Capital
• Where’s Sputnik?
• Building Human Capital
• Where’s Sputnik?

B k lBerkeley19641964

Los Angeles Under SiegeLos Angeles Under Siege
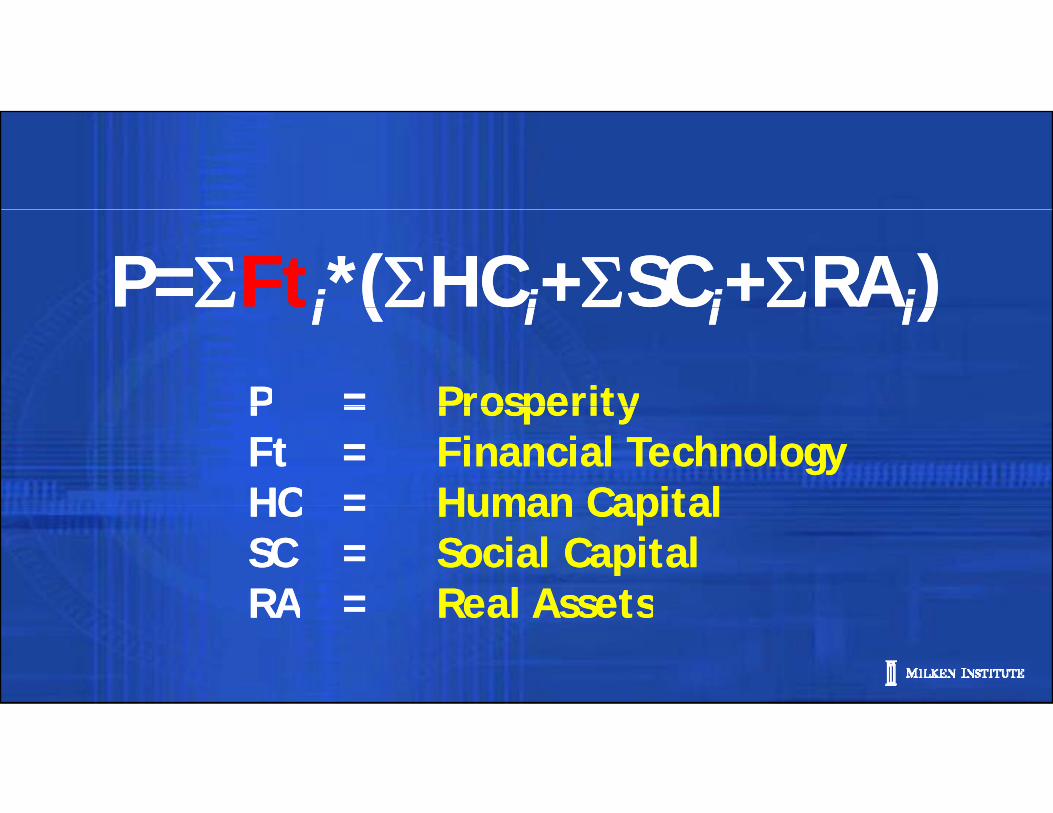
P=ΣFti*(ΣHCi+ΣSCi+ΣRAi)P=ΣFti*(ΣHCi+ΣSCi+ΣRAi)P = ProsperityP = Prosperity
i ( i i i)i ( i i i)P = ProsperityFt = Financial TechnologyHC = Human Capital
P = ProsperityFt = Financial TechnologyHC = Human CapitalHC = Human CapitalSC = Social CapitalRA = Real Assets
HC = Human CapitalSC = Social CapitalRA = Real AssetsRA = Real AssetsRA = Real Assets
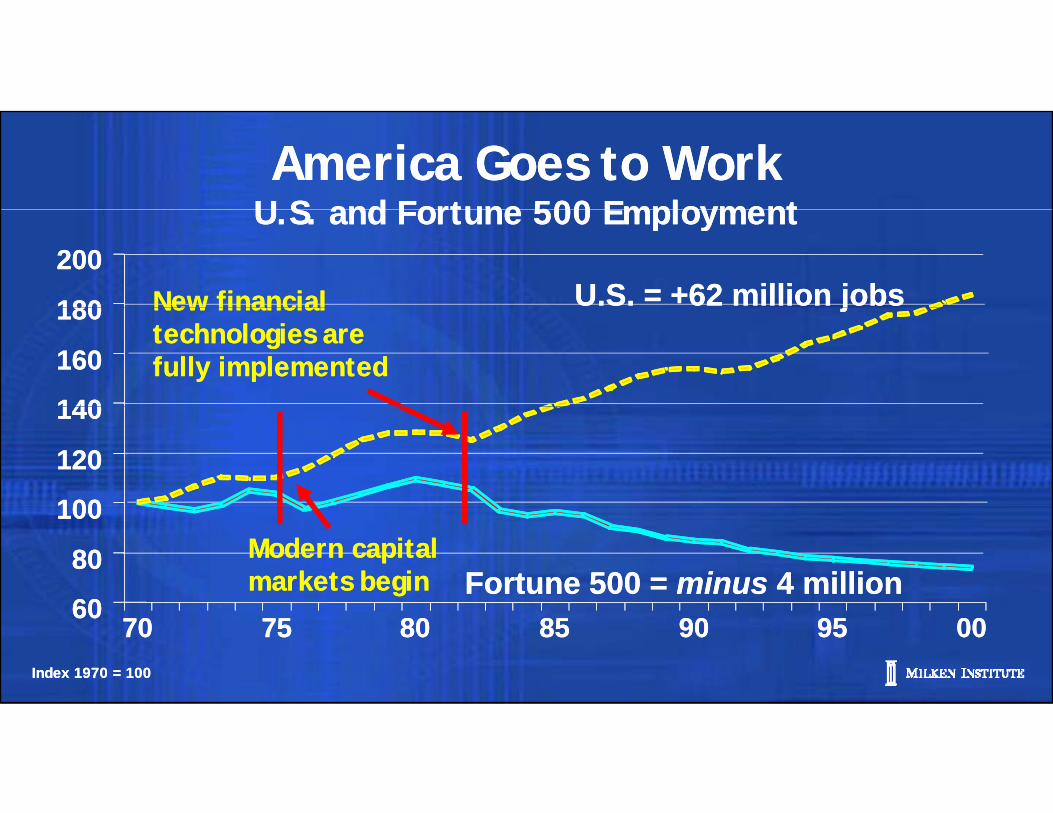
America Goes to WorkU S and Fortune 500 EmploymentAmerica Goes to Work
U S and Fortune 500 EmploymentU.S. and Fortune 500 EmploymentU.S. and Fortune 500 Employment200200
180180 U.S. = +62 million jobsU.S. = +62 million jobsNew financialNew financial180180
160160
140140
jjNew financialtechnologies arefully implemented
New financialtechnologies arefully implemented
140140
120120
100100100100
8080
6060Fortune 500 = minus 4 millionFortune 500 = minus 4 million
Modern capitalmarkets beginModern capitalmarkets begin
00009595909085858080757570706060
Index 1970 = 100Index 1970 = 100
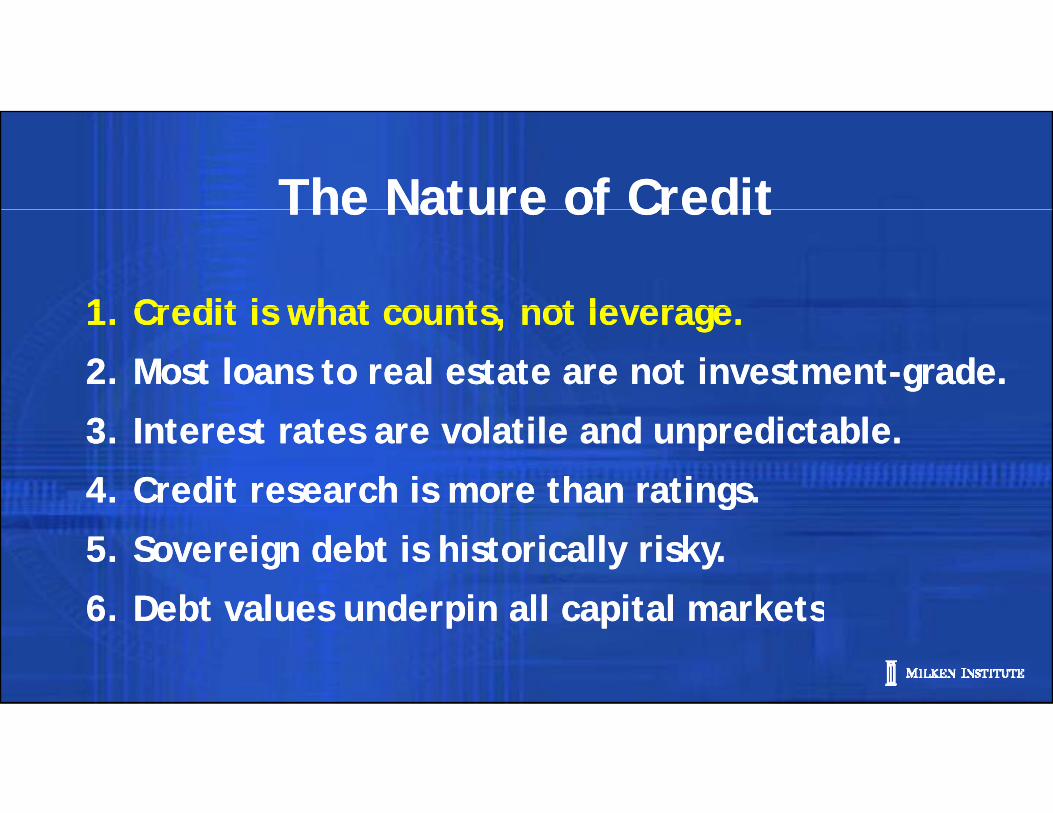
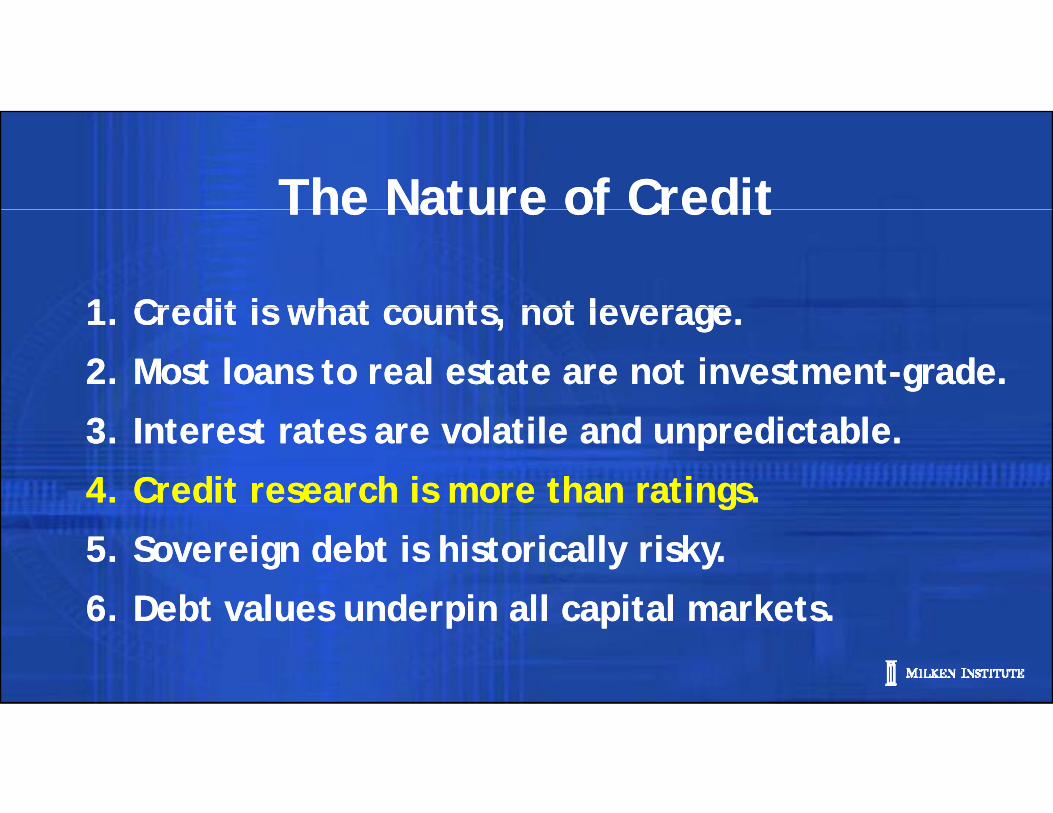
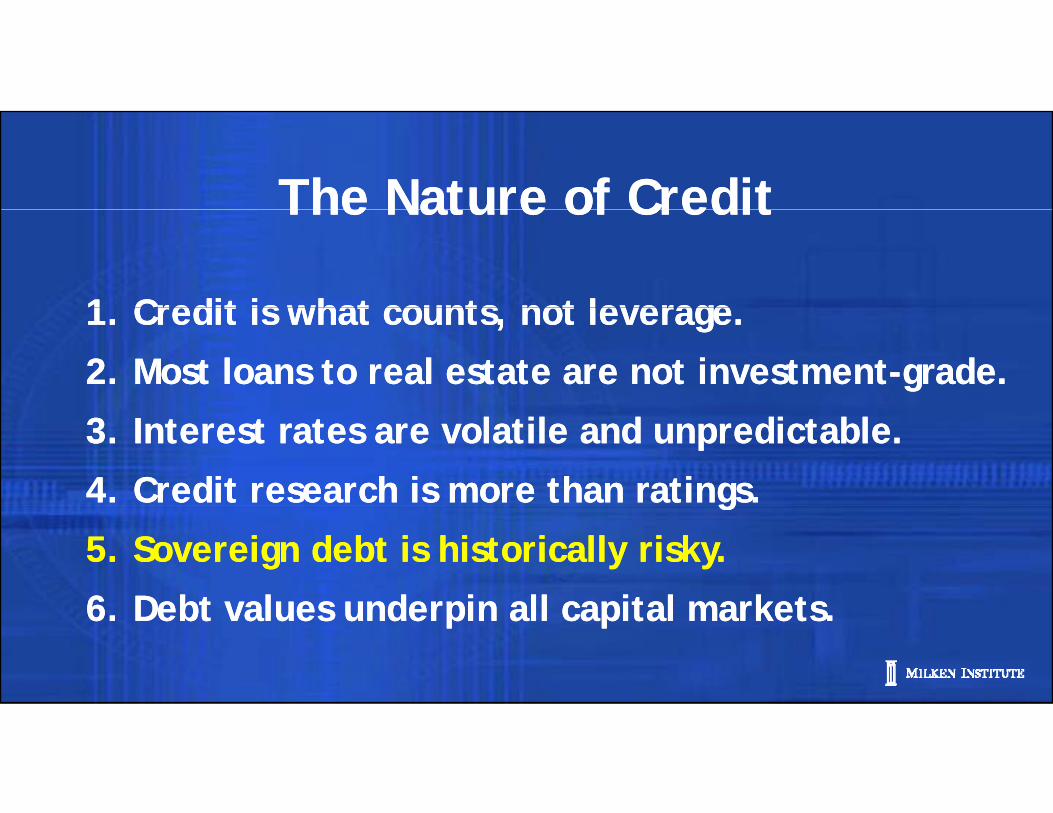
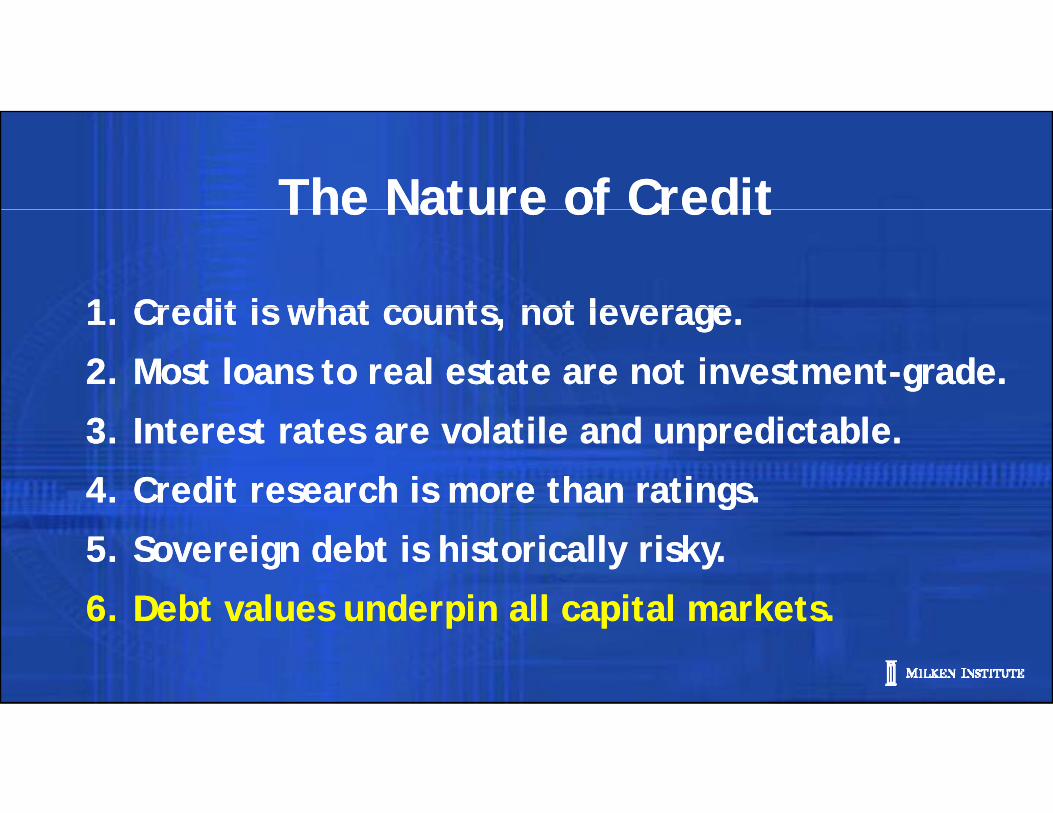
The Nature of CreditThe Nature of CreditThe Nature of CreditThe Nature of Credit
1 Credit is what counts not leverage1 Credit is what counts not leverage1. Credit is what counts, not leverage.
2. Most loans to real estate are not investment-grade.
1. Credit is what counts, not leverage.
2. Most loans to real estate are not investment-grade.
3. Interest rates are volatile and unpredictable.
4. Credit research is more than ratings.
3. Interest rates are volatile and unpredictable.
4. Credit research is more than ratings.g
5. Sovereign debt is historically risky.
6 Debt values underpin all capital markets
g
5. Sovereign debt is historically risky.
6 Debt values underpin all capital markets6. Debt values underpin all capital markets6. Debt values underpin all capital markets
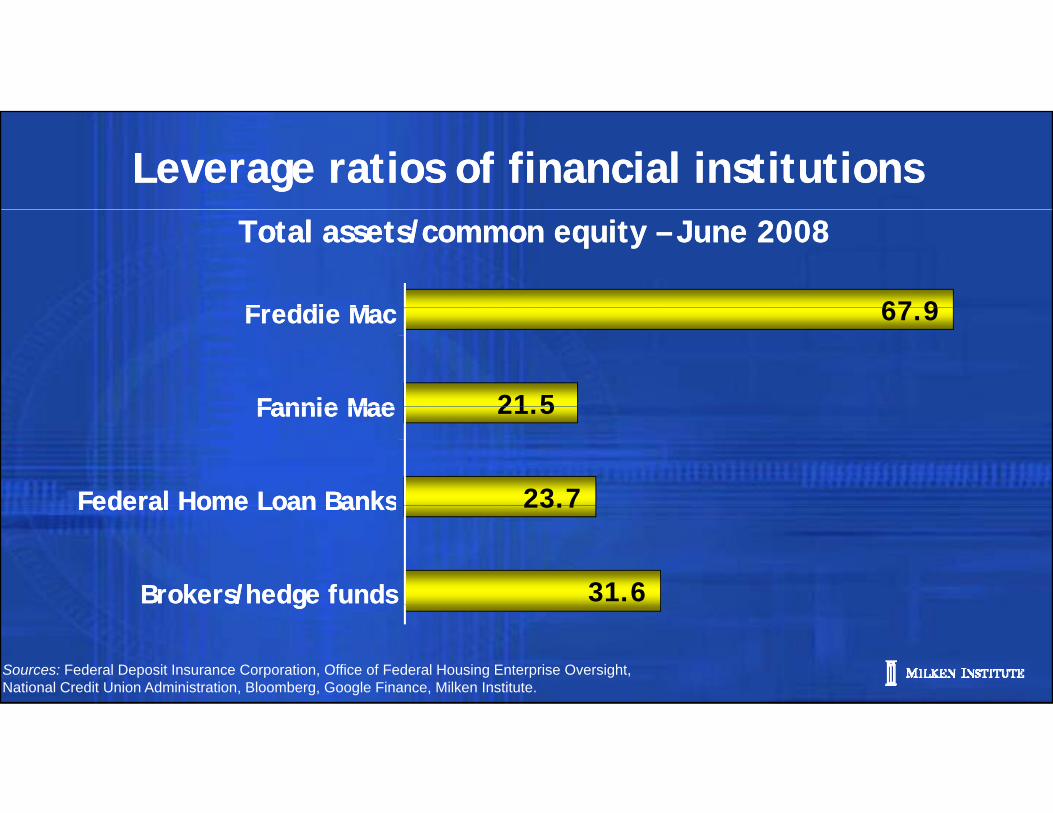
Leverage ratios of financial institutionsLeverage ratios of financial institutionsTotal assets/common equity – June 2008Total assets/common equity – June 2008
67 9F ddi MF ddi M
21 5
67.9
Fannie MaeFannie Mae
Freddie MacFreddie Mac
23.7
21.5
Federal Home Loan BanksFederal Home Loan Banks
Fannie MaeFannie Mae
31.6
23.7
Brokers/hedge fundsBrokers/hedge funds
Federal Home Loan BanksFederal Home Loan Banks
Sources: Federal Deposit Insurance Corporation, Office of Federal Housing Enterprise Oversight, National Credit Union Administration, Bloomberg, Google Finance, Milken Institute.
gg

The Nature of CreditThe Nature of CreditThe Nature of CreditThe Nature of Credit
1 Credit is what counts not leverage1 Credit is what counts not leverage1. Credit is what counts, not leverage.
2. Most loans to real estate are not investment-grade.
1. Credit is what counts, not leverage.
2. Most loans to real estate are not investment-grade.
3. Interest rates are volatile and unpredictable.
4. Credit research is more than ratings.
3. Interest rates are volatile and unpredictable.
4. Credit research is more than ratings.g
5. Sovereign debt is historically risky.
6 Debt values underpin all capital markets
g
5. Sovereign debt is historically risky.
6 Debt values underpin all capital markets6. Debt values underpin all capital markets.6. Debt values underpin all capital markets.
Fallacy:Fallacy:“Any loan to real estate is a good loan … ”“Any loan to real estate is a good loan … ”
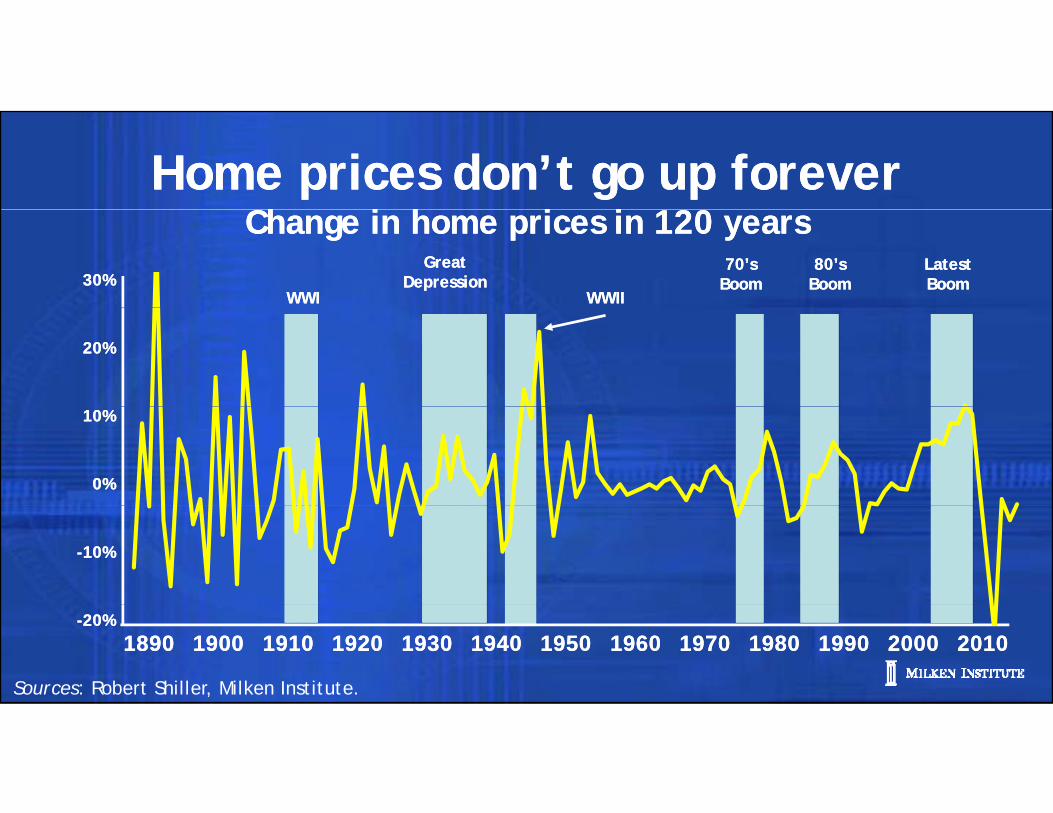
Home prices don’t go up foreverCh i h i i 120
Home prices don’t go up foreverCh i h i i 120
WWIWWI WWIIWWII
GreatDepression
GreatDepression
70’sBoom70’s
Boom80’s
Boom80’s
BoomLatestBoomLatestBoom30%30%
Change in home prices in 120 yearsChange in home prices in 120 years
The image cannot be displayed. Your computer may not have enough memory to open the image, or the image may have been corrupted. Restart your computer, and then open the file again. If the red x still appears, you may have to delete the image and then insert it again.
The image cannot be displayed. Your computer may not have enough memory to open the image, or the image may have been corrupted. Restart your computer, and then open the file again. If the red x still appears, you may have to delete the image and then insert it again.
The image cannot be displayed. Your computer may not have enough memory to open the image, or the image may have been corrupted. Restart your computer, and then open the file again. If the red x still appears, you may have to delete the image and then insert it again.
The image cannot be displayed. Your computer may not have enough memory to open the image, or the image may have been corrupted. Restart your computer, and then open the file again. If the red x still appears, you may have to delete the image and then insert it again.
The image cannot be displayed. Your computer may not have enough memory to open the image, or the image may have been corrupted. Restart your computer, and then open the file again. If the red x still appears, you may have to delete the image and then insert it again.
The image cannot be displayed. Your computer may not have enough memory to open the image, or the image may have been corrupted. Restart your computer, and then open the file again. If the red x still appears, you may have to delete the image and then insert it again.
20%20%
10%10%
0%0%
-10%-10%
19901990
Sources: Robert Shiller, Milken Institute.
18901890 19001900 19101910 19201920 19301930 19401940 19501950 19601960 19701970 19801980 20002000 20102010-20%-20%

When Lenders Make Non-Recourse LoansWhen Lenders Make Non-Recourse LoansHeads they lose -- Tails they loseHeads they lose -- Tails they lose
• If prices rise the borrower keeps • If prices rise the borrower keeps • If prices rise, the borrower keeps the gain
• If prices fall, the borrower can
• If prices rise, the borrower keeps the gain
• If prices fall, the borrower can p ,walk, sticking the lender witha long-term depreciating assetIf i i h l f
p ,walk, sticking the lender witha long-term depreciating assetIf i i h l f• If interest rates rise, the value ofthe loan depreciates as the “real” average life of the asset is extended
• If interest rates rise, the value ofthe loan depreciates as the “real” average life of the asset is extended
• If interest rates fall, the borrower prepays• If interest rates fall, the borrower prepays
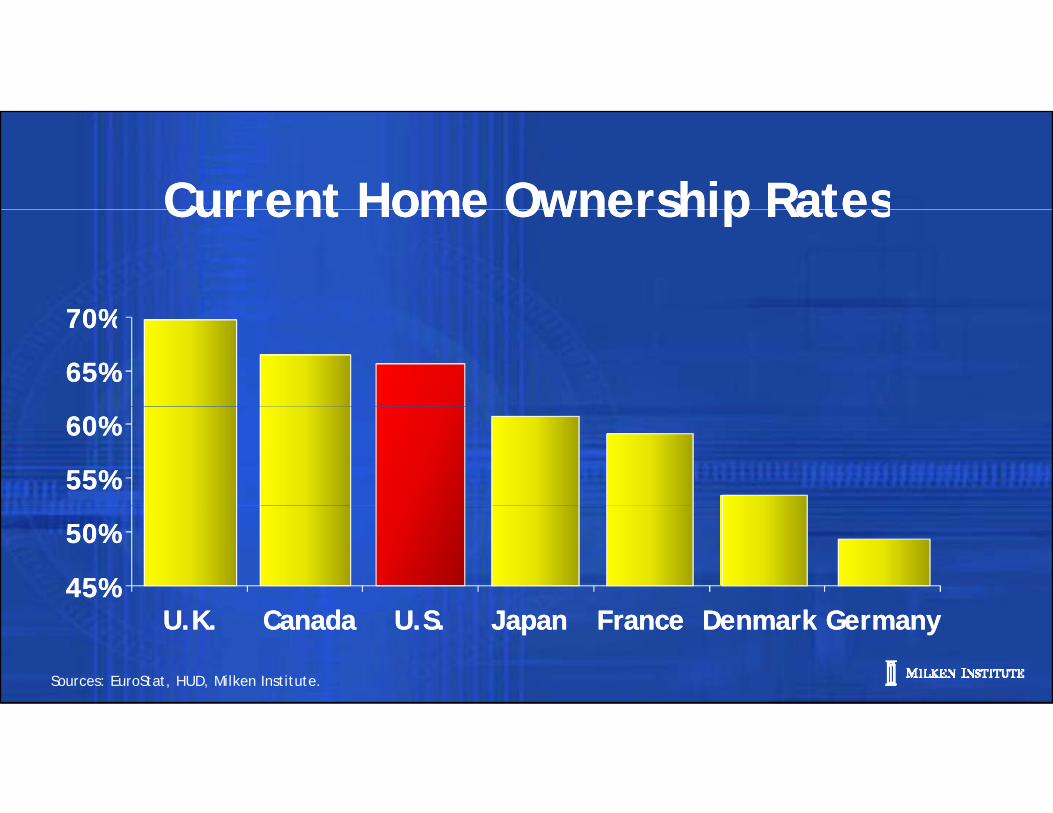
Current Home Ownership RatesCurrent Home Ownership RatesCurrent Home Ownership RatesCurrent Home Ownership Rates
0%0%
65%65%
70%70%
55%55%
60%60%
45%45%
50%50%
Sources: EuroStat, HUD, Milken Institute.
U.K.U.K. CanadaCanada U.S.U.S. JapanJapan FranceFrance DenmarkDenmark GermanyGermany
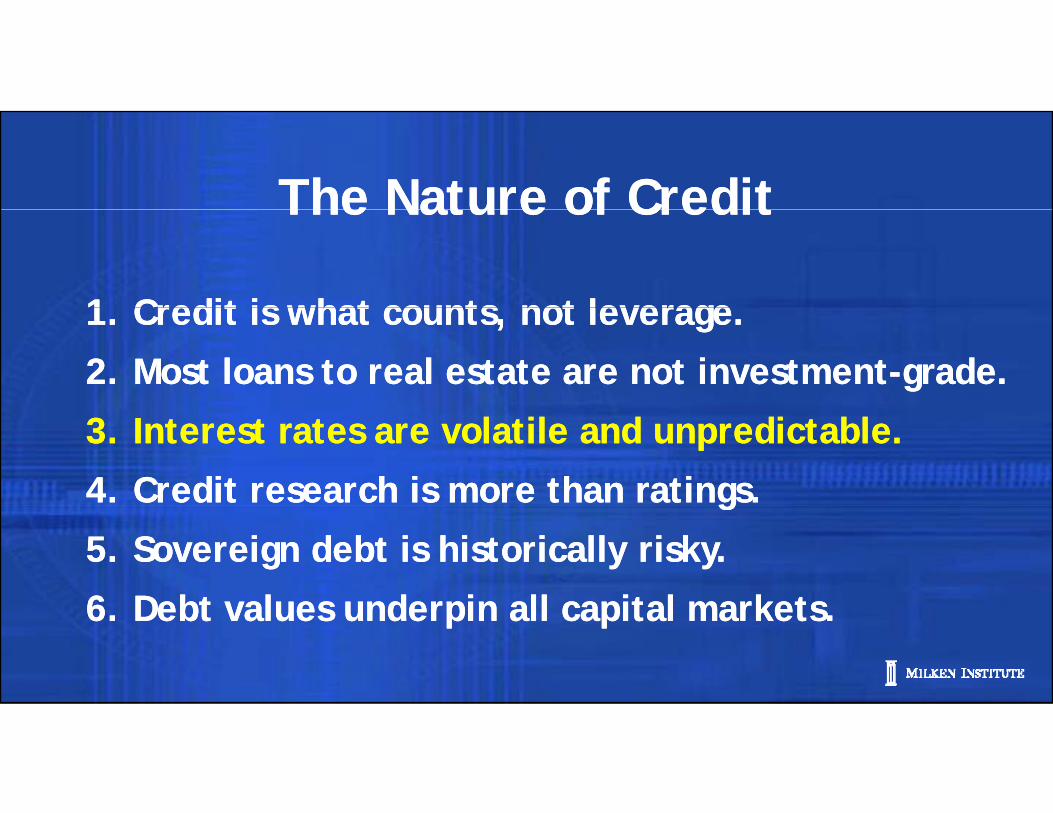
The Nature of CreditThe Nature of CreditThe Nature of CreditThe Nature of Credit
1 Credit is what counts not leverage1 Credit is what counts not leverage1. Credit is what counts, not leverage.
2. Most loans to real estate are not investment-grade.
1. Credit is what counts, not leverage.
2. Most loans to real estate are not investment-grade.
3. Interest rates are volatile and unpredictable.
4. Credit research is more than ratings.
3. Interest rates are volatile and unpredictable.
4. Credit research is more than ratings.g
5. Sovereign debt is historically risky.
6 Debt values underpin all capital markets
g
5. Sovereign debt is historically risky.
6 Debt values underpin all capital markets6. Debt values underpin all capital markets.6. Debt values underpin all capital markets.
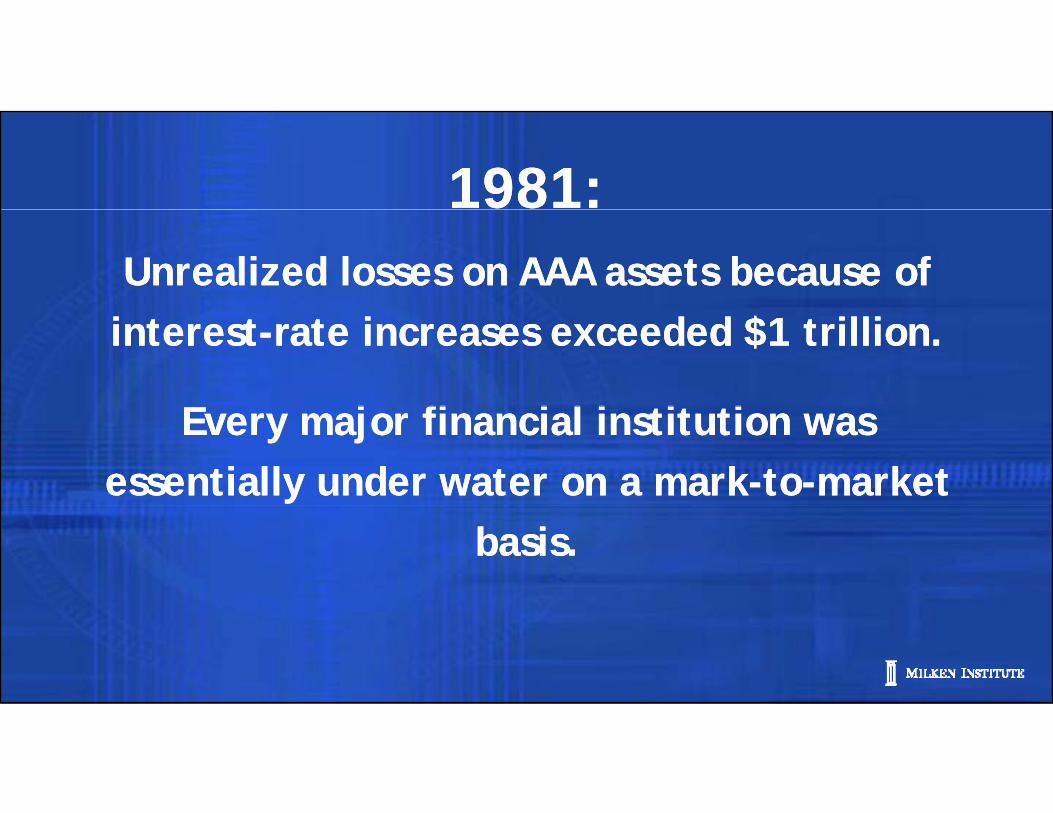
1981:1981:Unrealized losses on AAA assets because of Unrealized losses on AAA assets because of
interest-rate increases exceeded $1 trillion.
E j fi i l i i i
interest-rate increases exceeded $1 trillion.
E j fi i l i i i Every major financial institution was essentially under water on a mark-to-market
Every major financial institution was essentially under water on a mark-to-market
basis.basis.
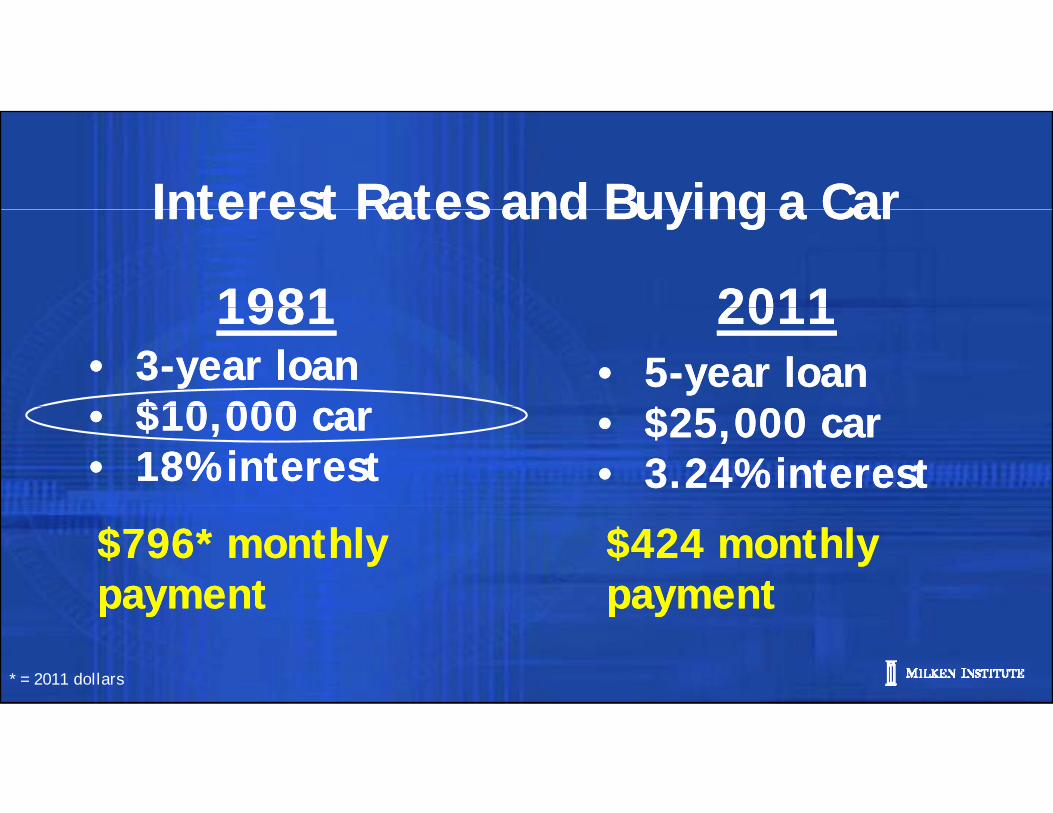
Interest Rates and Buying a CarInterest Rates and Buying a Car
19811981 20112011
Interest Rates and Buying a CarInterest Rates and Buying a Car
19811981 20112011• 3-year loan
$10 000 • 3-year loan
$10 000 • 5-year loan
$2 000 • 5-year loan
$2 000 • $10,000 car• 18% interest• $10,000 car• 18% interest
• $25,000 car• 3.24% interest• $25,000 car• 3.24% interest
$796* monthly payment$796* monthly payment
$424 monthly payment$424 monthly paymentpaymentpayment paymentpayment
* = 2011 dollars
The Nature of CreditThe Nature of CreditThe Nature of CreditThe Nature of Credit
1 Credit is what counts not leverage1 Credit is what counts not leverage1. Credit is what counts, not leverage.
2. Most loans to real estate are not investment-grade.
1. Credit is what counts, not leverage.
2. Most loans to real estate are not investment-grade.
3. Interest rates are volatile and unpredictable.
4. Credit research is more than ratings.
3. Interest rates are volatile and unpredictable.
4. Credit research is more than ratings.g
5. Sovereign debt is historically risky.
6 Debt values underpin all capital markets
g
5. Sovereign debt is historically risky.
6 Debt values underpin all capital markets6. Debt values underpin all capital markets.6. Debt values underpin all capital markets.
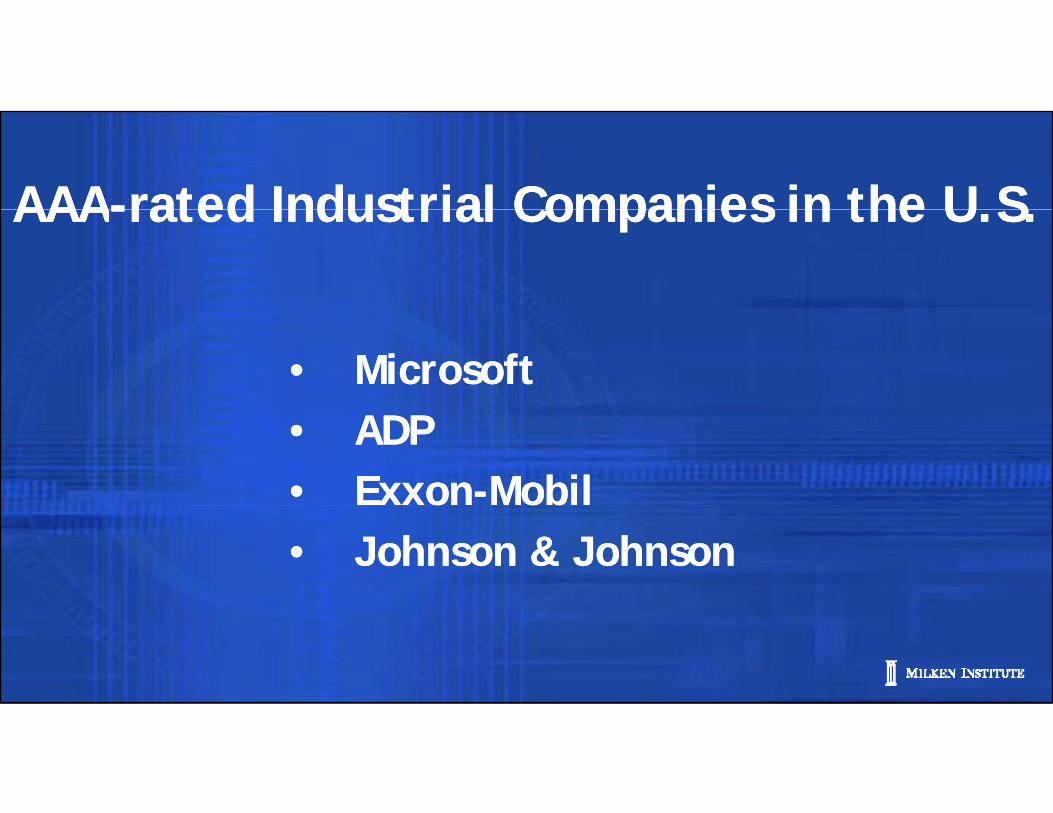
AAA-rated Industrial Companies in the U SAAA-rated Industrial Companies in the U SAAA-rated Industrial Companies in the U.S.AAA-rated Industrial Companies in the U.S.
• Microsoft• Microsoft• ADP• Exxon-Mobil• ADP• Exxon-Mobil• Johnson & Johnson• Johnson & Johnson
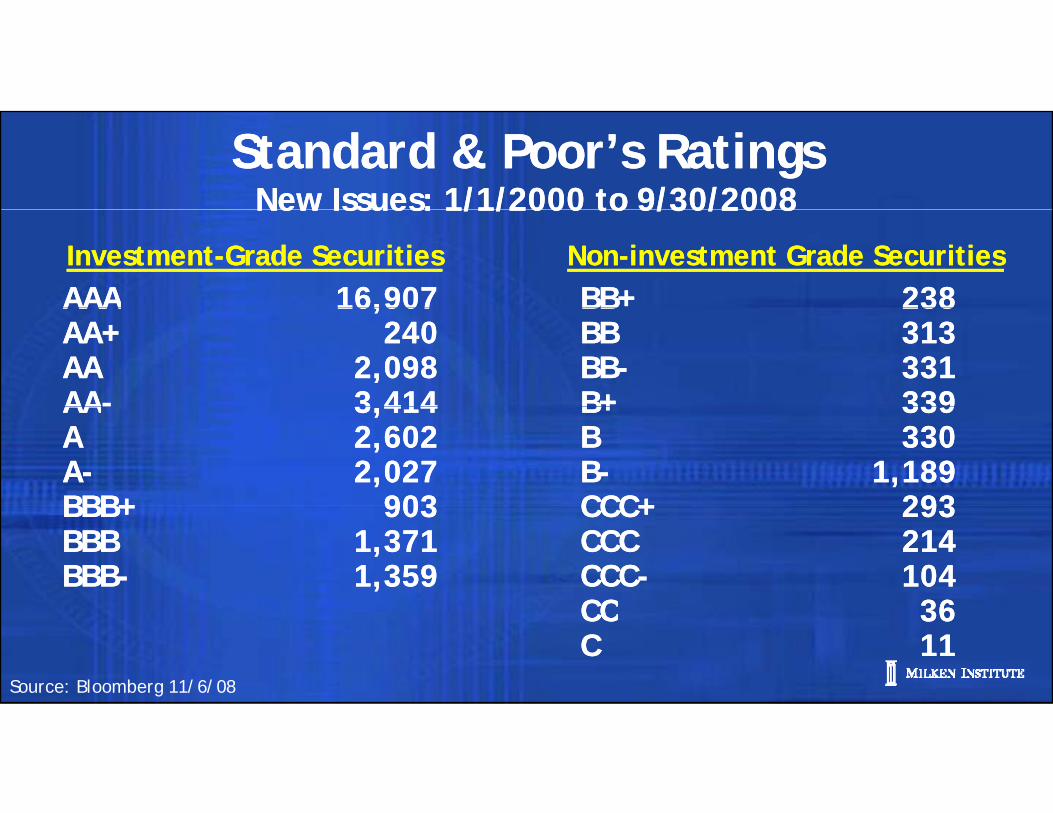
Standard & Poor’s RatingsNew Issues: 1/1/2000 to 9/30/2008
Standard & Poor’s RatingsNew Issues: 1/1/2000 to 9/30/2008
AAA 16,907AAA 16,907 BB+ 238BB+ 238Investment-Grade SecuritiesInvestment-Grade Securities Non-investment Grade SecuritiesNon-investment Grade Securities
New Issues: 1/1/2000 to 9/30/2008New Issues: 1/1/2000 to 9/30/2008
AAA 16,907AA+ 240AA 2,098AA- 3 414
AAA 16,907AA+ 240AA 2,098AA- 3 414
BB 238BB 313BB- 331B+ 339
BB 238BB 313BB- 331B+ 339AA 3,414
A 2,602A- 2,027BBB+ 903
AA 3,414A 2,602A- 2,027BBB+ 903
B+ 339B 330B- 1,189CCC+ 293
B+ 339B 330B- 1,189CCC+ 293BBB+ 903
BBB 1,371BBB- 1,359
BBB+ 903BBB 1,371BBB- 1,359
CCC+ 293CCC 214CCC- 104CC 36
CCC+ 293CCC 214CCC- 104CC 36CC 36C 11CC 36C 11
Source: Bloomberg 11/6/08
The Nature of CreditThe Nature of CreditThe Nature of CreditThe Nature of Credit
1 Credit is what counts not leverage1 Credit is what counts not leverage1. Credit is what counts, not leverage.
2. Most loans to real estate are not investment-grade.
1. Credit is what counts, not leverage.
2. Most loans to real estate are not investment-grade.
3. Interest rates are volatile and unpredictable.
4. Credit research is more than ratings.
3. Interest rates are volatile and unpredictable.
4. Credit research is more than ratings.g
5. Sovereign debt is historically risky.
6 Debt values underpin all capital markets
g
5. Sovereign debt is historically risky.
6 Debt values underpin all capital markets6. Debt values underpin all capital markets.6. Debt values underpin all capital markets.

Sovereign Debt Has Long Been SuspectSovereign Debt Has Long Been Suspect
“Wh ti l d bt h b “Wh ti l d bt h b
Sovereign Debt Has Long Been SuspectSovereign Debt Has Long Been Suspect
“When national debts have once been accumulated to a certain degree, there is “When national debts have once been accumulated to a certain degree, there is scarce, I believe, a single instance of their having been fairly and completely paid.”scarce, I believe, a single instance of their having been fairly and completely paid.”g y p y p
Adam Smith
g y p y p
Adam Smith

Alexander Hamilton,Alexander Hamilton,
first U.S. Secretaryfirst U.S. Secretary
of the Treasuryof the Treasury
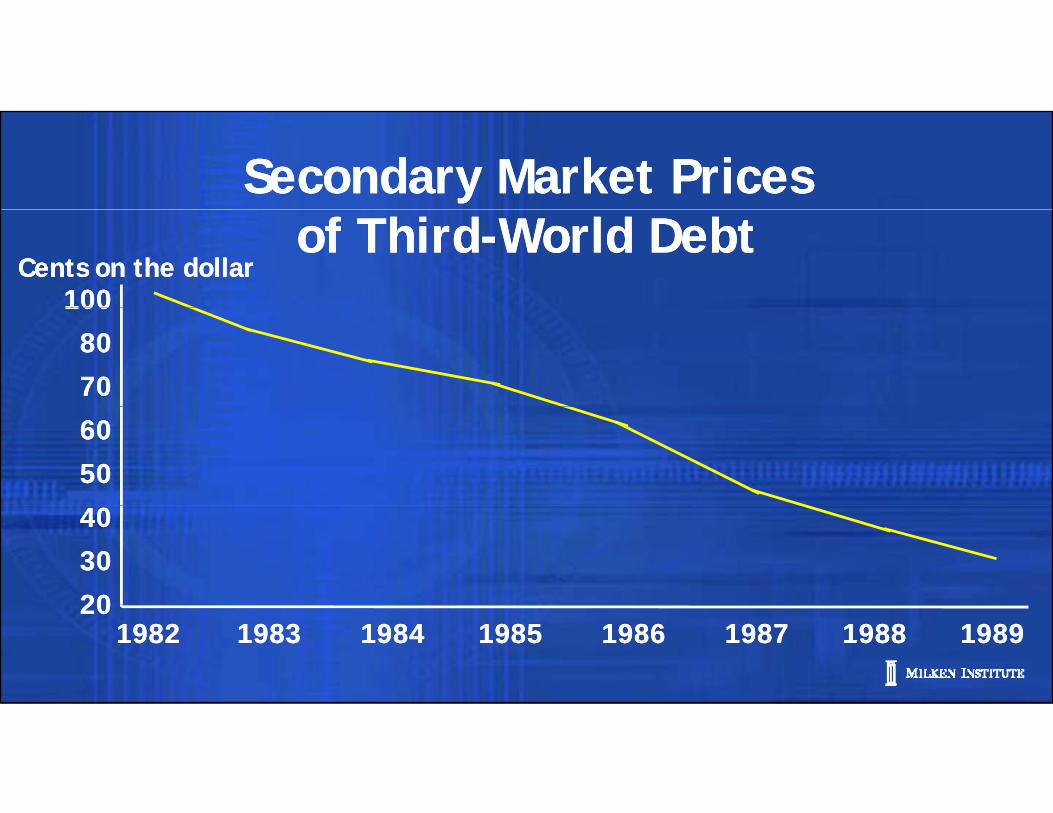
Secondary Market Prices Secondary Market Prices of Third-World Debtof Third-World Debt
100100Cents on the dollarCents on the dollar
7070
8080
100100
5050
6060
2020
3030
4040
202019821982 19831983 19841984 19851985 19861986 19871987 19881988 19891989
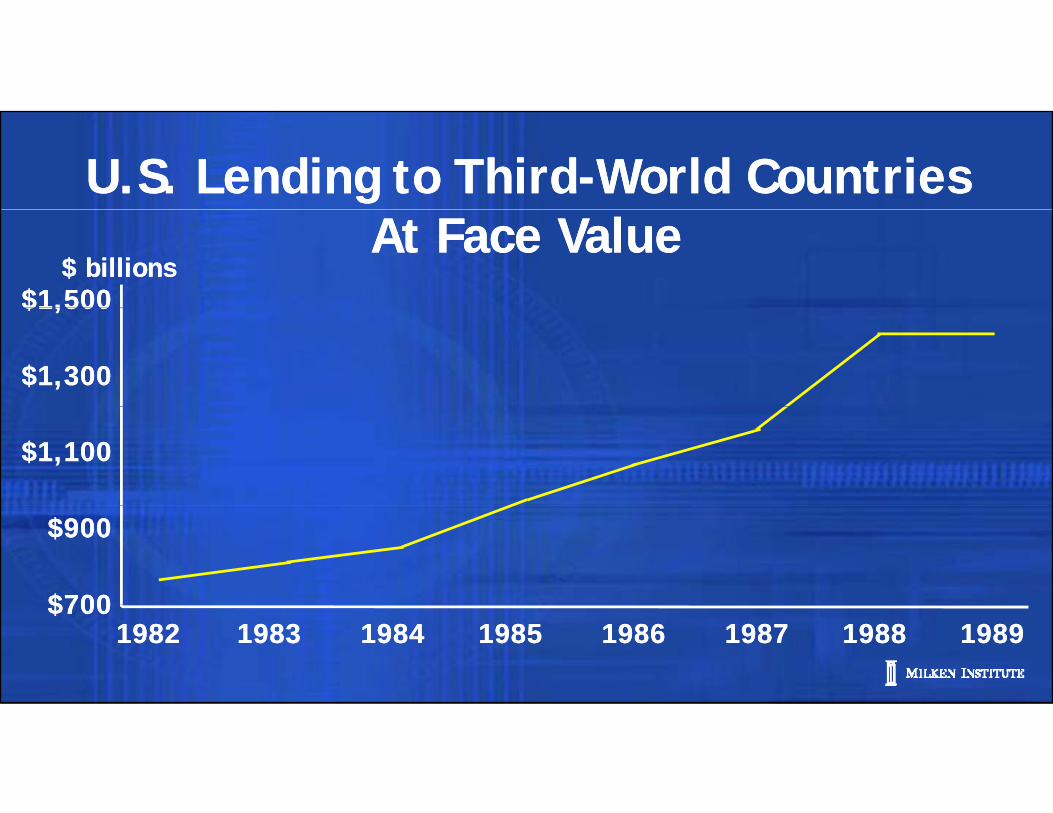
U.S. Lending to Third-World CountriesU.S. Lending to Third-World CountriesAt Face ValueAt Face Value
$1,500$1,500$ billions$ billions
$1,300$1,300
$1,500$1,500
$1,100$1,100
$700$700
$900$900
$700$70019821982 19831983 19841984 19851985 19861986 19871987 19881988 19891989
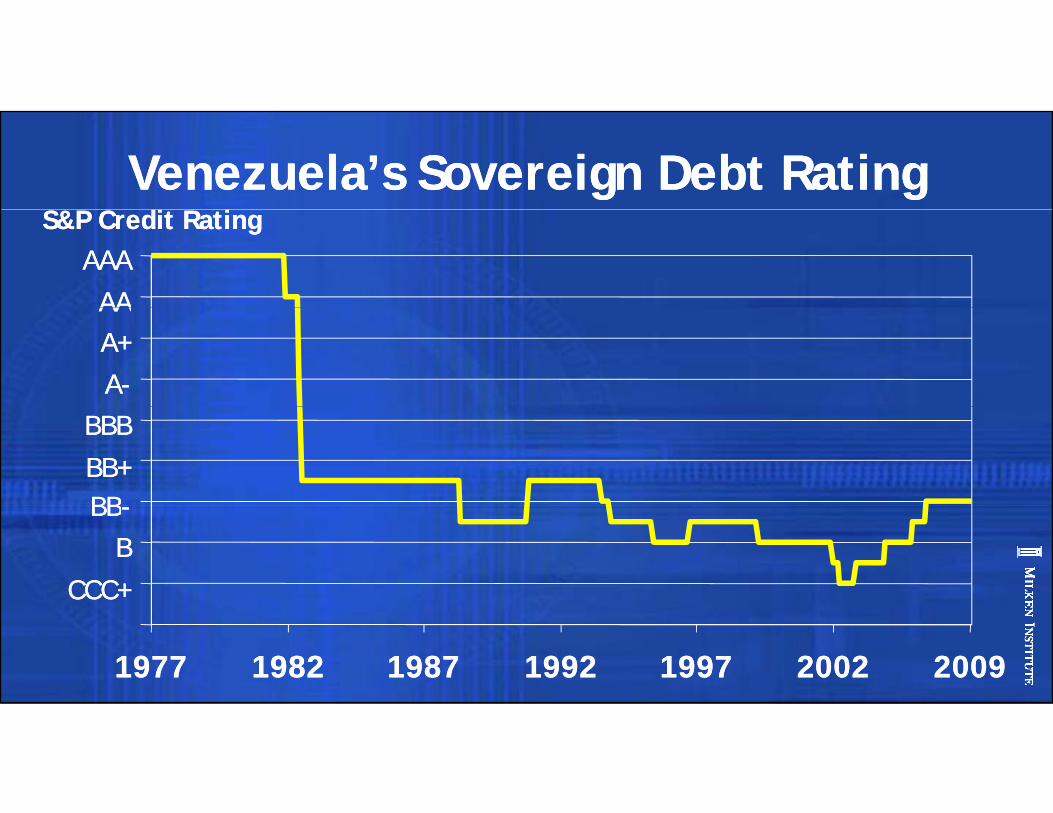
Venezuela’s Sovereign Debt RatingVenezuela’s Sovereign Debt Ratingdd
AAAAAA
AAAA
S&P Credit RatingS&P Credit Rating
AAAA
A-A-
A+A+
BB+BB+BBBB
BBBBBB
BB-BB-BB
CCC+CCC+
19771977 19821982 19871987 19921992 19971997 20022002 20092009
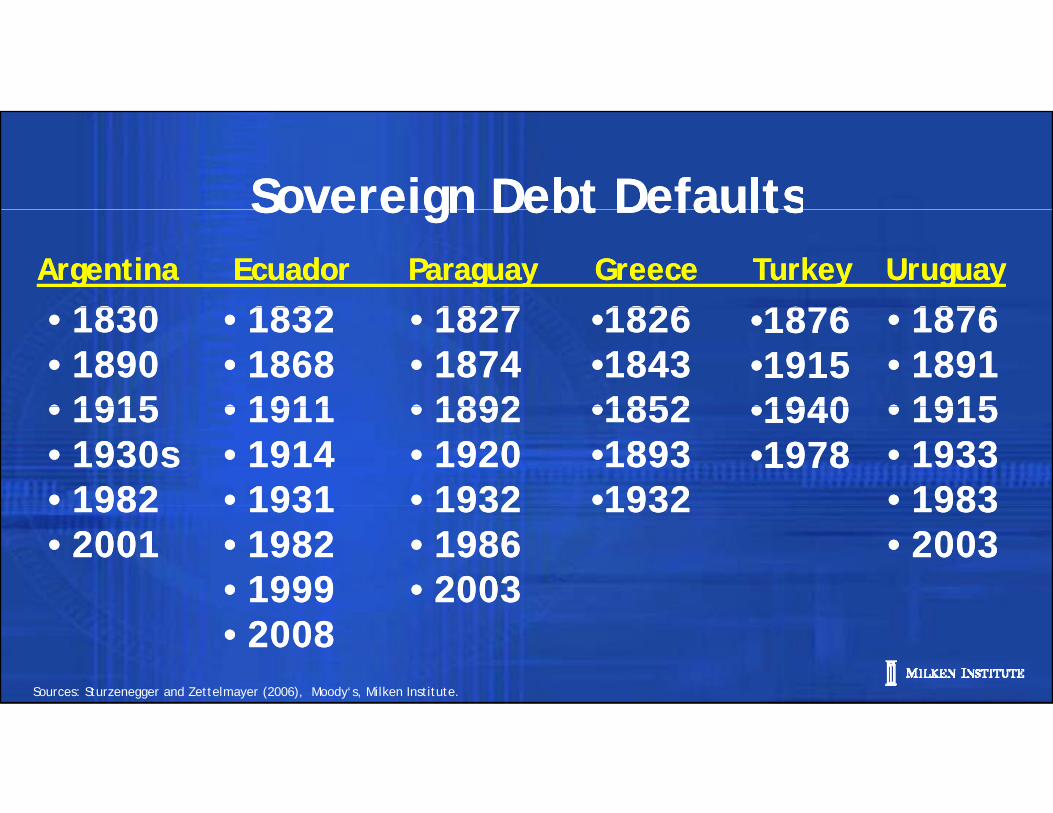
Sovereign Debt DefaultsSovereign Debt DefaultsSovereign Debt DefaultsSovereign Debt DefaultsArgentinaArgentina EcuadorEcuador ParaguayParaguay GreeceGreece TurkeyTurkey UruguayUruguay
18301830 18321832 18271827 18761876 1876187618261826•• 18301830•• 18901890•• 19151915
•• 18321832•• 18681868•• 19111911
•• 18271827•• 18741874•• 18921892
••18761876••19151915••19401940
•• 18761876•• 18911891•• 19151915
••18261826••18431843••18521852•• 19151915
•• 1930s1930s•• 19821982
•• 19111911•• 19141914•• 19311931
•• 18921892•• 19201920•• 19321932
••19401940••19781978
•• 19151915•• 19331933•• 19831983
••18521852••18931893••1932193219821982
•• 2001200119311931
•• 19821982•• 19991999
19321932•• 19861986•• 20032003
19831983•• 20032003
19321932
Sources: Sturzenegger and Zettelmayer (2006), Moody‘s, Milken Institute.
•• 20082008
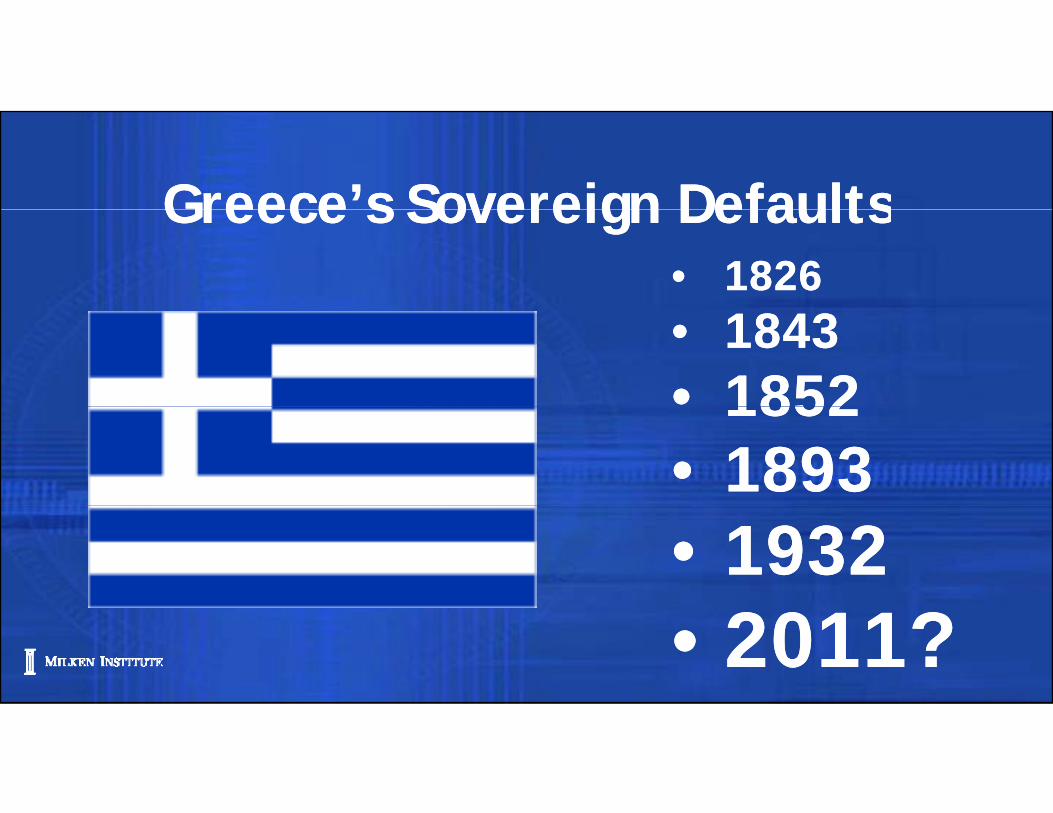
Greece’s Sovereign DefaultsGreece’s Sovereign DefaultsGreece s Sovereign DefaultsGreece s Sovereign Defaults• 1826• 1826• 1843• 1852• 1843• 18521852• 1893
1852• 1893• 1932• 1932• 2011?• 2011?
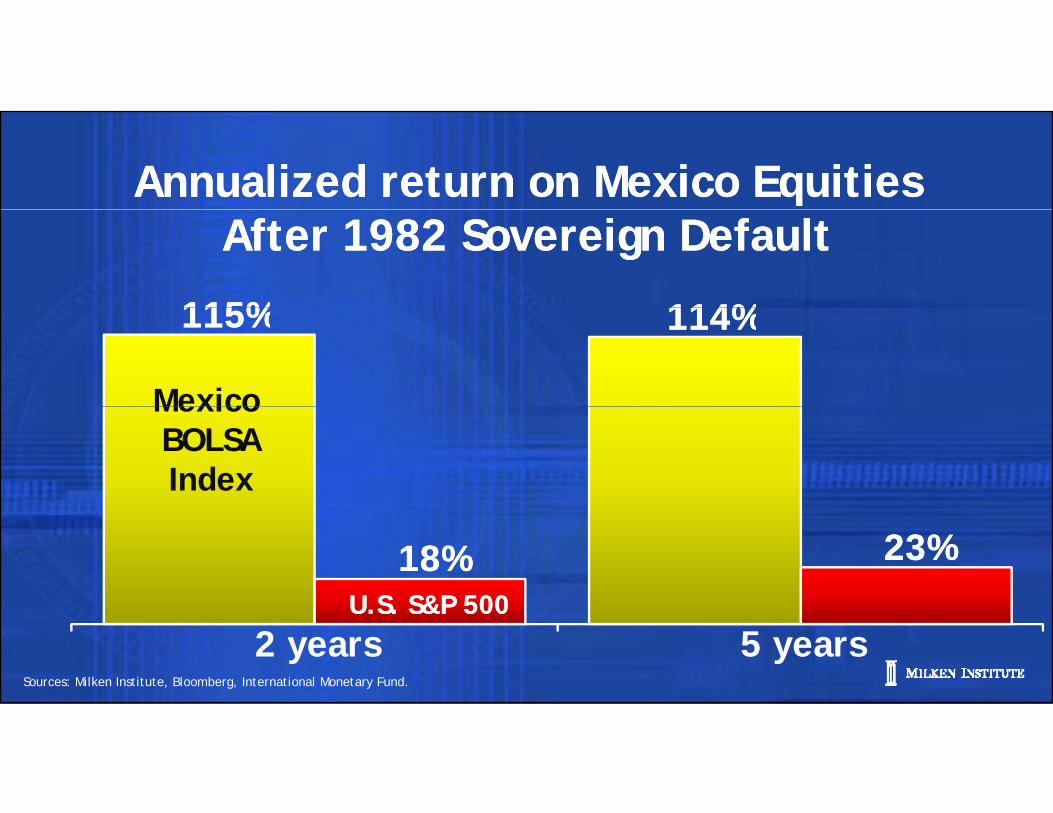
Annualized return on Mexico EquitiesAnnualized return on Mexico EquitiesAfter 1982 Sovereign Default After 1982 Sovereign Default
115%115% 114%114%
Mexico
115%115% 114%114%
Mexico BOLSAIndex
U S S&P 500U S S&P 500
18%18% 23%23%
Sources: Milken Institute, Bloomberg, International Monetary Fund.
U.S. S&P 500U.S. S&P 500
2 years 5 years
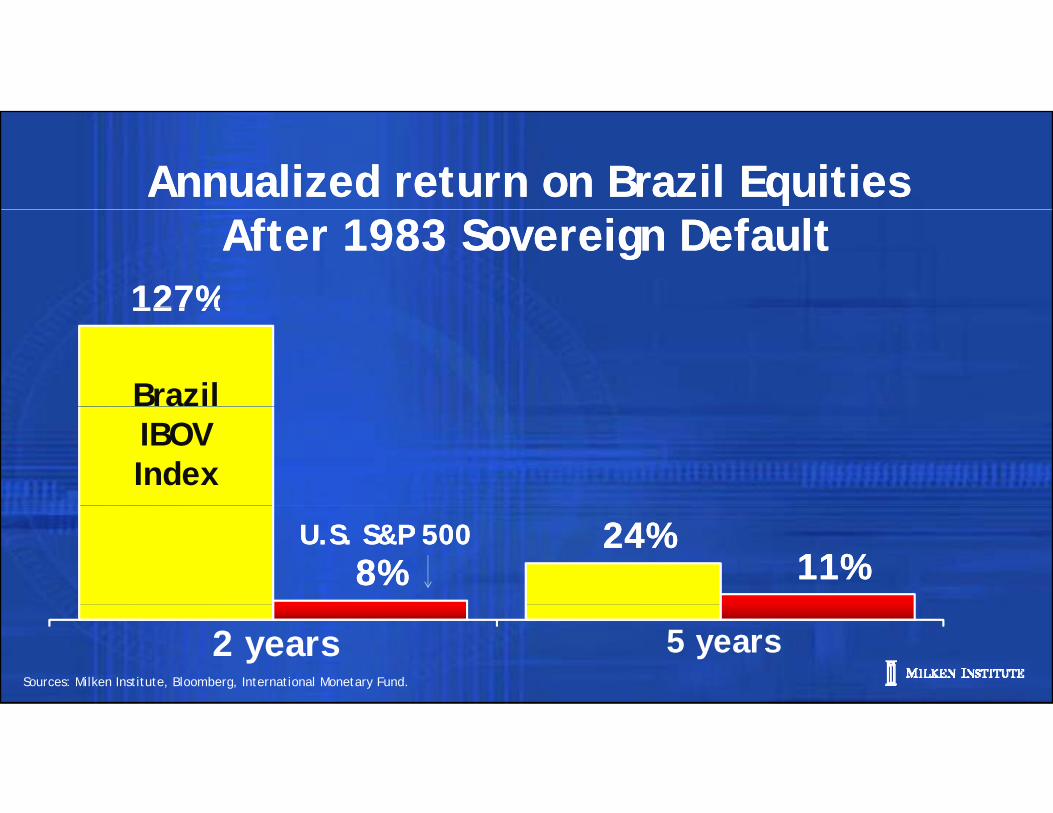
Annualized return on Brazil EquitiesAnnualized return on Brazil EquitiesAfter 1983 Sovereign Default After 1983 Sovereign Default
127%127%
Brazil
127%127%
IBOVIndex
U.S. S&P 500U.S. S&P 500 24%24%8%8% 11%11%
Sources: Milken Institute, Bloomberg, International Monetary Fund.
2 years 5 years
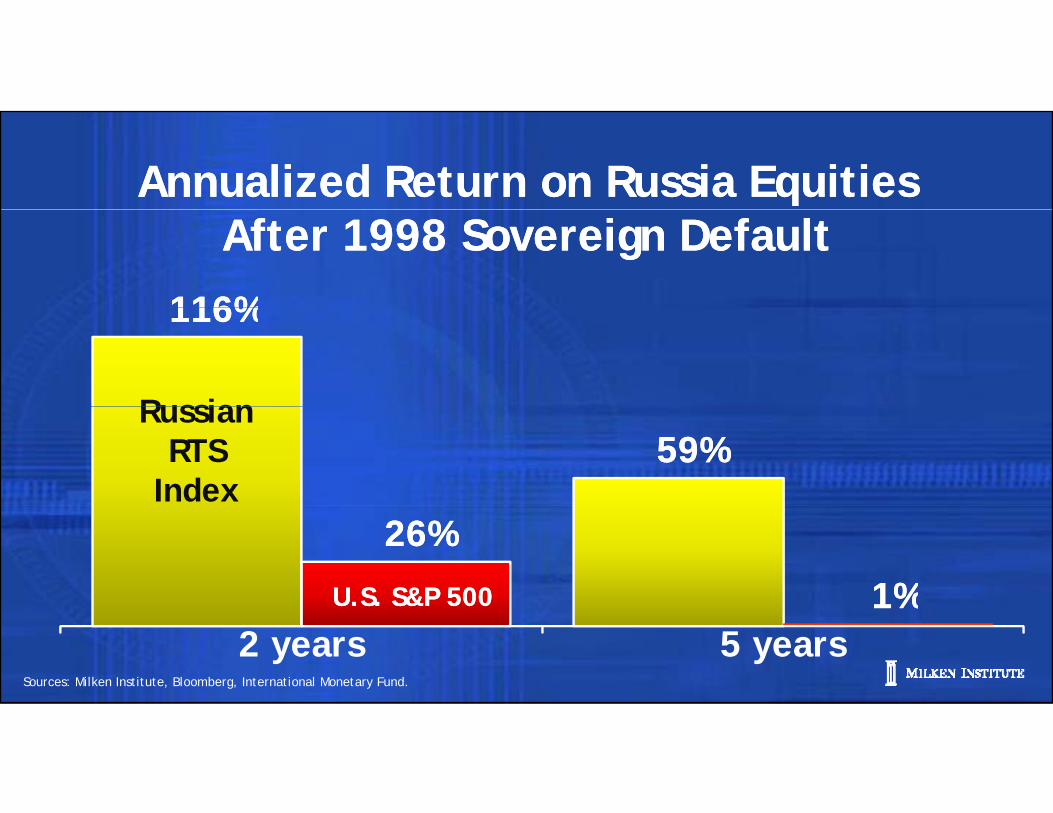
Annualized Return on Russia EquitiesAnnualized Return on Russia EquitiesAfter 1998 Sovereign Default After 1998 Sovereign Default
116%116%
Russian
116%116%
RussianRTS
Index59%59%
U.S. S&P 500U.S. S&P 500
26%26%
1%1%
Sources: Milken Institute, Bloomberg, International Monetary Fund.
U.S. S&P 500U.S. S&P 500 1%1%2 years 5 years

Russia:1998-2000 and Italy: 2010-11
26000900
1,000 Italy FTSE MIB index
20000
22000
24000
700800900
16000
18000
20000
400500600
12000
14000
16000
100200300 Russia RTS index
100000100
October 4, 2011
January 1997—August 1998 August1998—December 2000
The Nature of CreditThe Nature of CreditThe Nature of CreditThe Nature of Credit
1 Credit is what counts not leverage1 Credit is what counts not leverage1. Credit is what counts, not leverage.
2. Most loans to real estate are not investment-grade.
1. Credit is what counts, not leverage.
2. Most loans to real estate are not investment-grade.
3. Interest rates are volatile and unpredictable.
4. Credit research is more than ratings.
3. Interest rates are volatile and unpredictable.
4. Credit research is more than ratings.g
5. Sovereign debt is historically risky.
6 Debt values underpin all capital markets
g
5. Sovereign debt is historically risky.
6 Debt values underpin all capital markets6. Debt values underpin all capital markets.6. Debt values underpin all capital markets.
19741974
Th t i t t Th t i t t
19741974
The most important yearin financial history
The most important yearin financial historyin financial historysince World War IIin financial historysince World War IIsince World War II.since World War II.
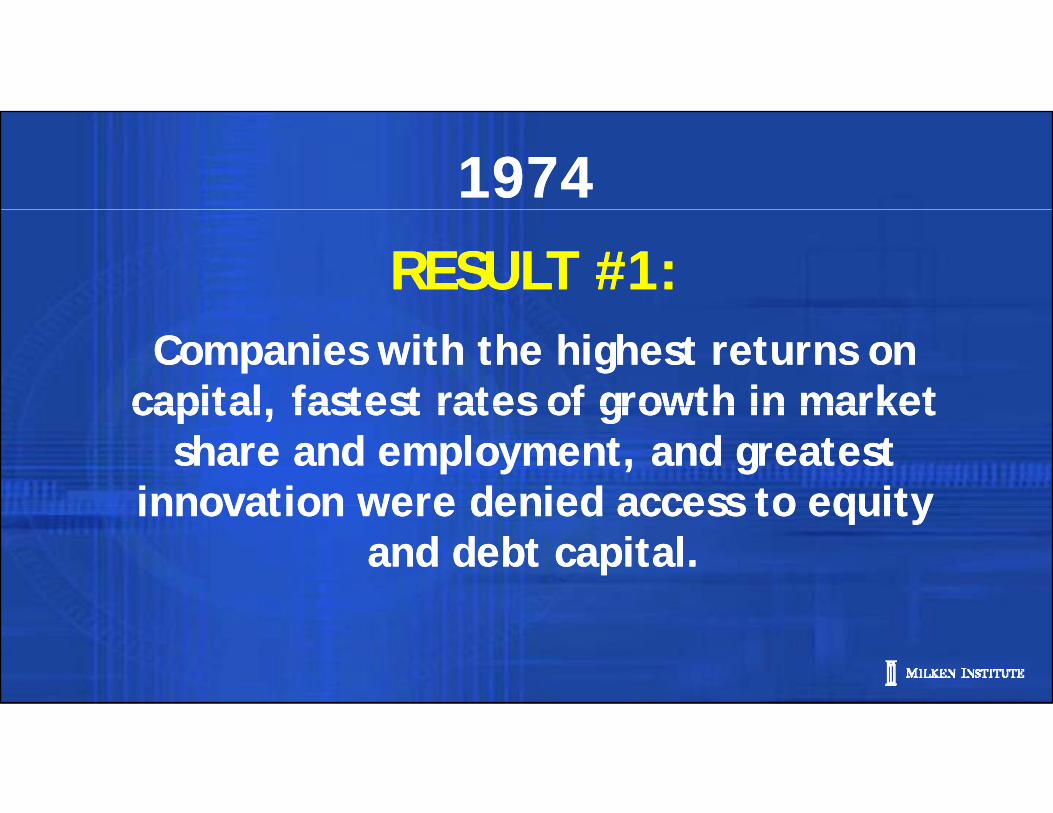
19741974
RESULT #1:RESULT #1:Companies with the highest returns on
capital fastest rates of growth in market Companies with the highest returns on
capital fastest rates of growth in market capital, fastest rates of growth in market share and employment, and greatest
innovation were denied access to equity
capital, fastest rates of growth in market share and employment, and greatest
innovation were denied access to equity innovation were denied access to equity and debt capital.
innovation were denied access to equity and debt capital.
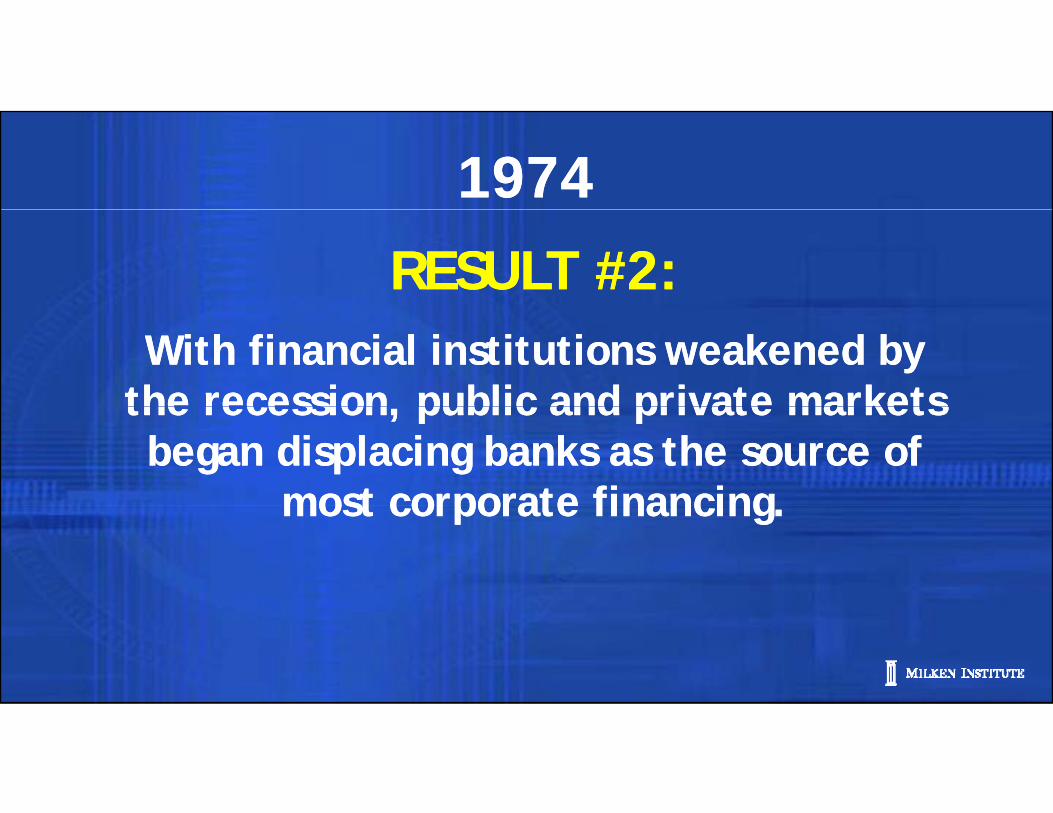
19741974
RESULT #2:RESULT #2:With financial institutions weakened by
the recession public and private markets With financial institutions weakened by
the recession public and private markets the recession, public and private markets began displacing banks as the source of
most corporate financing
the recession, public and private markets began displacing banks as the source of
most corporate financingmost corporate financing.most corporate financing.
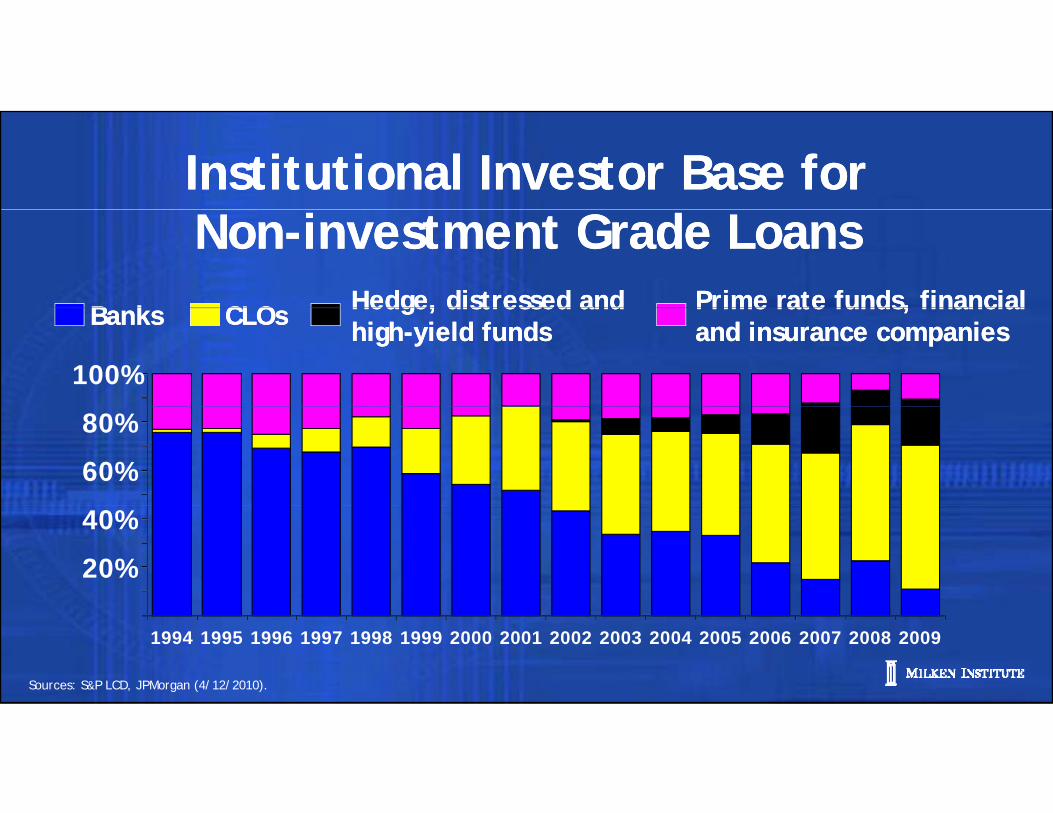
Institutional Investor Base forInstitutional Investor Base forNon-investment Grade LoansNon-investment Grade Loans
B kB k CLOCLO Hedge, distressed andHedge, distressed and Prime rate funds, financial Prime rate funds, financial
100%
BanksBanks CLOsCLOs Hedge, distressed andhigh-yield fundsHedge, distressed andhigh-yield funds
Prime rate funds, financial and insurance companiesPrime rate funds, financial and insurance companies
60%
80%
20%
40%
Sources: S&P LCD, JPMorgan (4/12/2010).
1994 1995 1996 1997 1998 1999 2000 2001 2002 2003 2004 2005 2006 2007 2008 2009
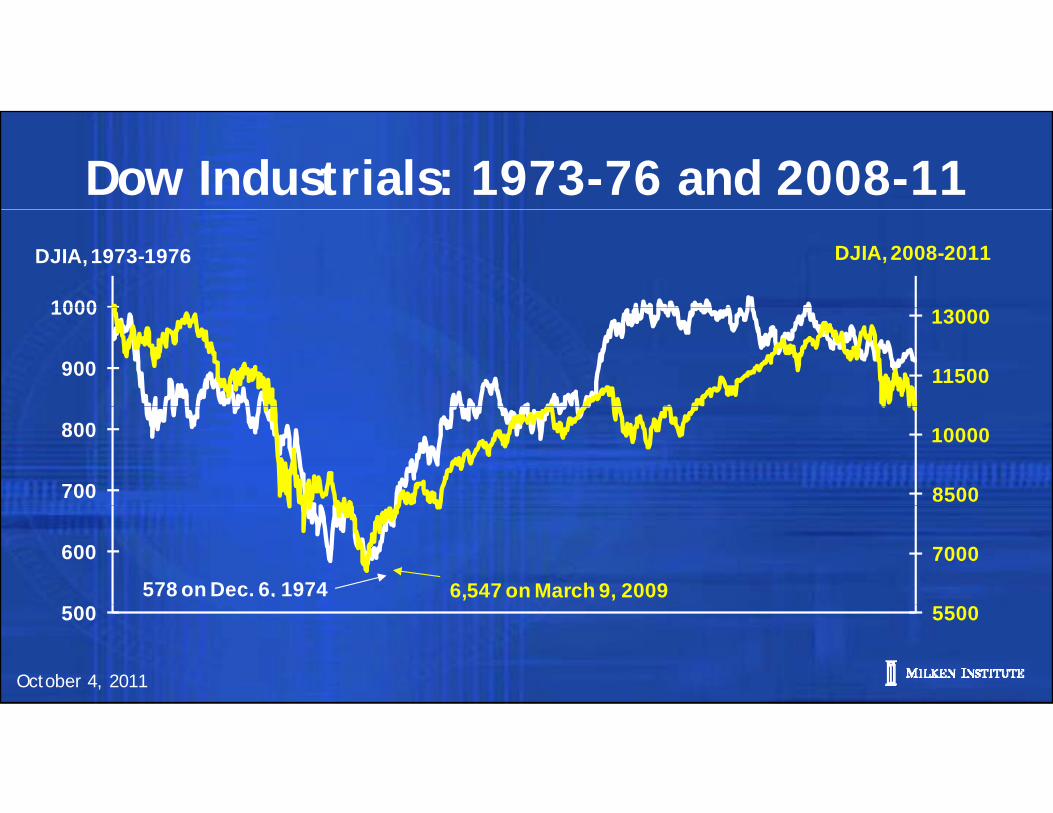
Dow Industrials: 1973-76 and 2008-11
1000
DJIA, 1973-1976 DJIA, 2008-2011
11500
13000
900
1000
8500
10000
700
800
7000600
578 on Dec. 6, 1974 6,547 on March 9, 2009
October 4, 2011
5500500
Leadership in Turbulent TimesLeadership in Turbulent TimesLeadership in Turbulent TimesLeadership in Turbulent Times
• Seeing the World Through New Eyes
C it l M k t
• Seeing the World Through New Eyes
C it l M k t• Capital Markets
• Building Human Capital
• Capital Markets
• Building Human Capital• Building Human Capital
• Where’s Sputnik?
• Building Human Capital
• Where’s Sputnik?
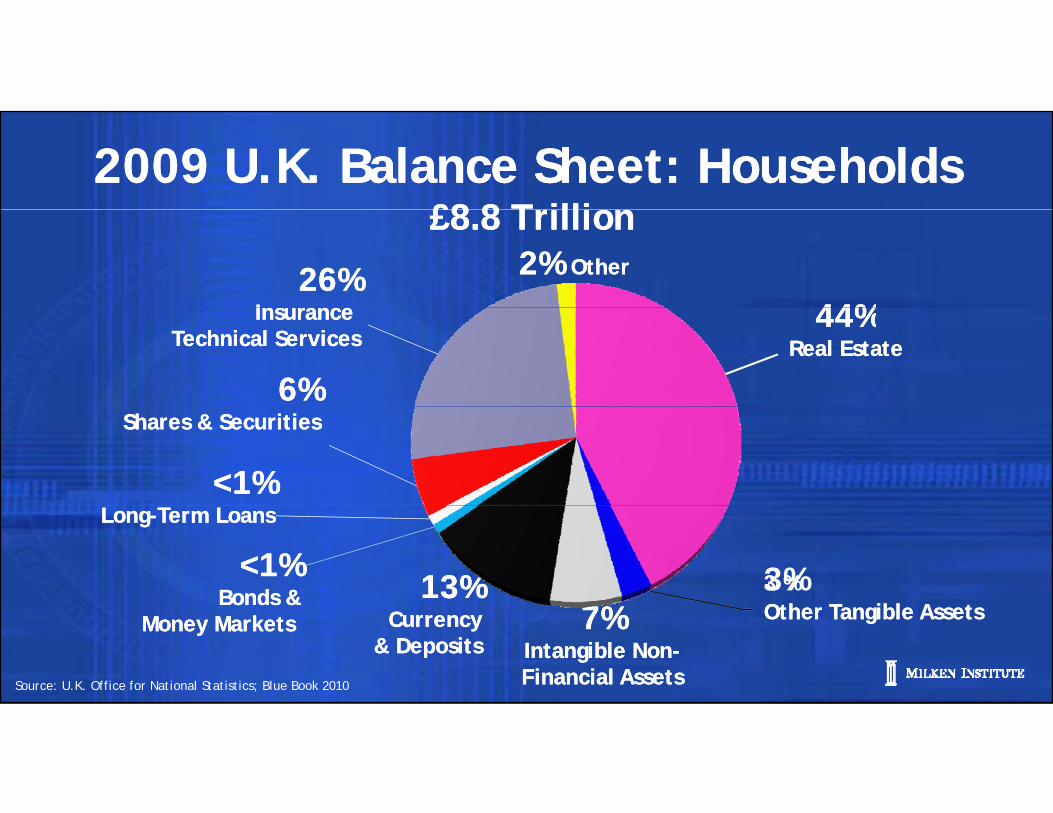
2009 U.K. Balance Sheet: Households£8 8 T illi
2009 U.K. Balance Sheet: Households£8 8 T illi£8.8 Trillion£8.8 Trillion
44%44%26%
Ins rance 26%
Ins rance
2% Other2% Other
44%Real Estate
44%Real Estate
6%6%
Insurance Technical Services
Insurance Technical Services
<1%<1%
Shares & SecuritiesShares & Securities
3 %O h T ibl A 3%O h T ibl A
13% 13% <1%
Bonds &<1%
Bonds &
Long-Term Loans Long-Term Loans
Source: U.K. Office for National Statistics; Blue Book 2010
Other Tangible Assets Other Tangible Assets Currency & Deposits
Currency & Deposits
Bonds &Money Markets
Bonds &Money Markets 7%
Intangible Non-Financial Assets
7%Intangible Non-Financial Assets

“What is the world’s “What is the world’s largest asset class?” largest asset class?”

Human capital is the Human capital is the Human capital is the largest asset class.
Human capital is the largest asset class.
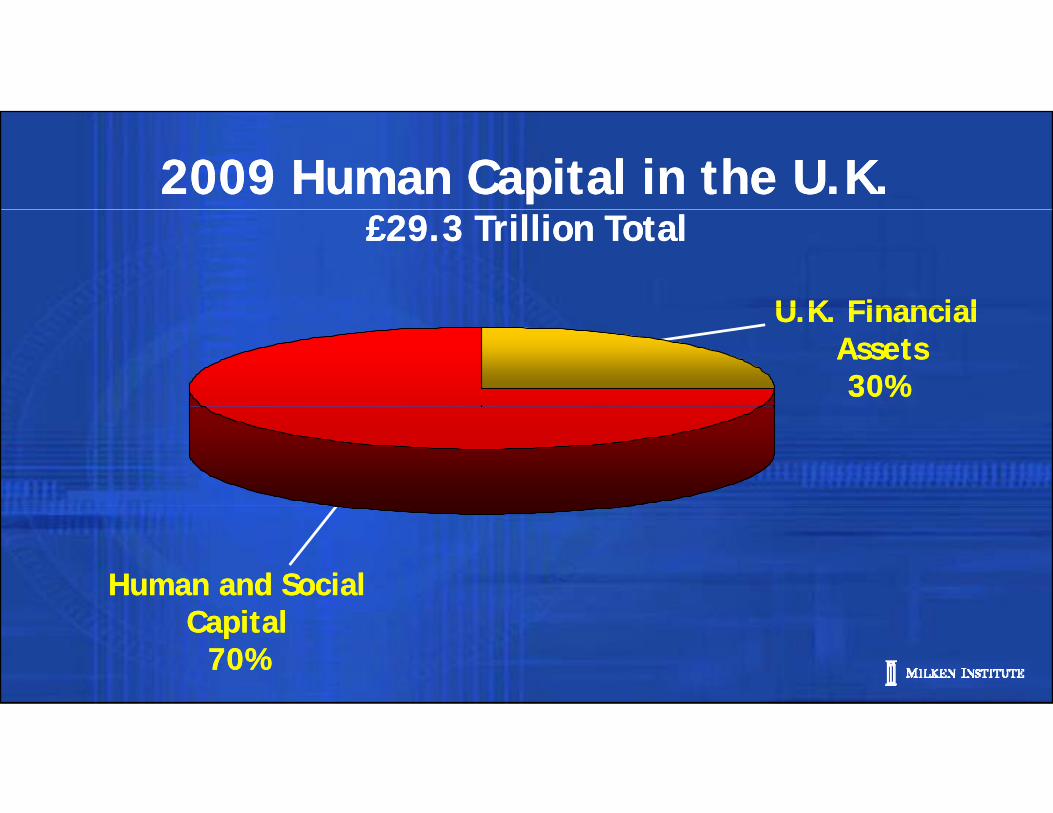
2009 Human Capital in the U.K.2009 Human Capital in the U.K.
U K Financial U K Financial
£29.3 Trillion Total£29.3 Trillion Total
U.K. Financial Assets30%
U.K. Financial Assets30%
Human and SocialHuman and SocialCapital
70% Capital
70%
The 21st Century will see The 21st Century will see The 21 Century will see a worldwide competition The 21 Century will see a worldwide competition a worldwide competition
for human capitala worldwide competition
for human capitalfor human capital.for human capital.

1880s Eastern Europe1880s Eastern Europe
Warsaw
Samuel GoldwynMGM, ParamountSamuel GoldwynMGM, Paramount
Louis B. MayerMGM
Louis B. MayerMGM
Warsaw
Carl Laemmlel d
Carl Laemmlel d
Jack WarnerJack WarnerUniversal StudiosUniversal Studios Warner Bros. StudiosWarner Bros. Studios
Adolph ZukorParamount Pictures
Adolph ZukorParamount Pictures
William FoxFox Films
William FoxFox Films
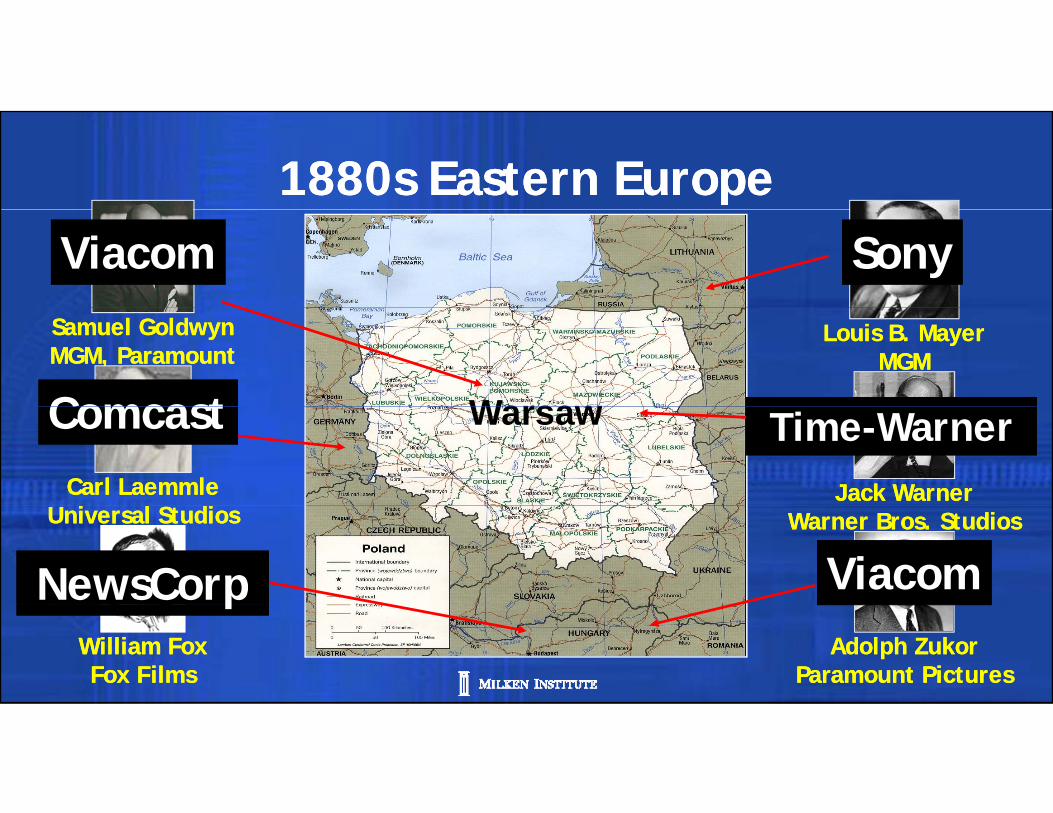
1880s Eastern Europe1880s Eastern EuropeViacomViacom SonySony
Samuel GoldwynMGM, ParamountSamuel GoldwynMGM, Paramount
Louis B. MayerMGM
Louis B. MayerMGM
WarsawComcastComcastCarl Laemmle
l dCarl Laemmle
l dJack WarnerJack Warner
WarsawComcastComcast Time-WarnerTime-Warner
Universal StudiosUniversal Studios Warner Bros. StudiosWarner Bros. Studios
ViacomViacomNewsCorpNewsCorpAdolph Zukor
Paramount PicturesAdolph Zukor
Paramount PicturesWilliam FoxFox Films
William FoxFox Films
pp
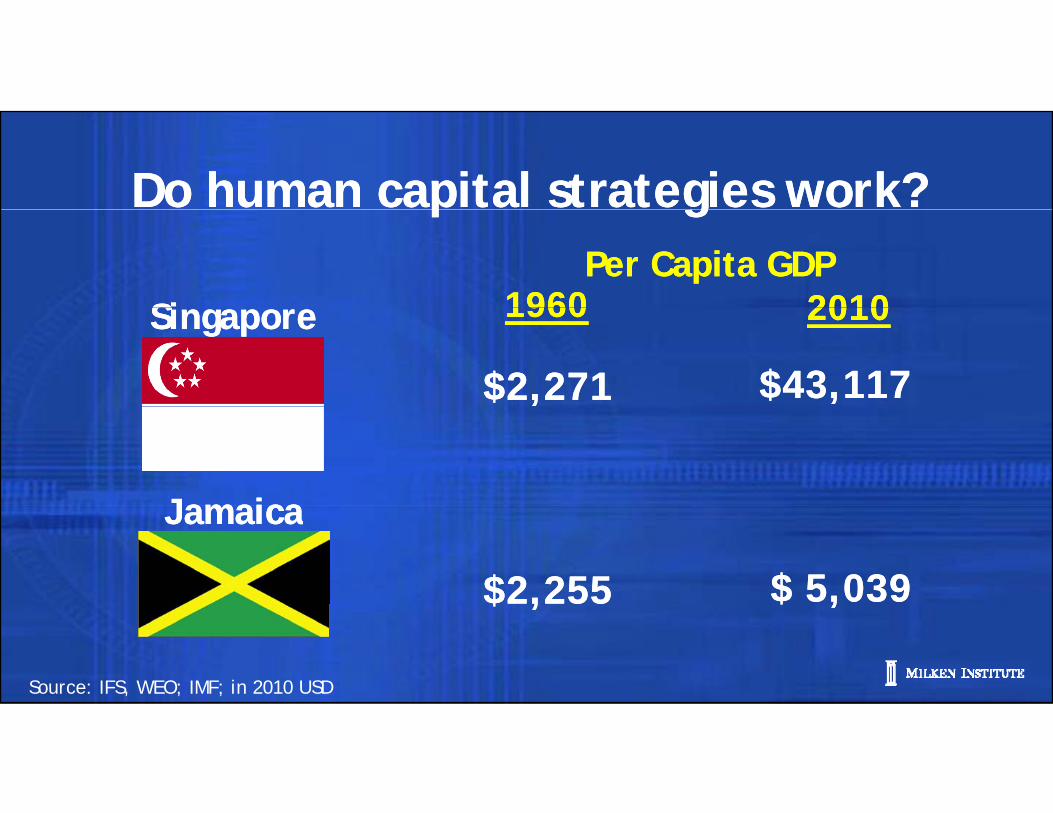
Do human capital strategies work?Do human capital strategies work?Per Capita GDPPer Capita GDP
19601960 20102010
p gp g
SiSi 19601960
$43,117$43,117
20102010
$2,271$2,271
SingaporeSingapore
,,
JamaicaJamaica
$ 5,039$ 5,039$2,255$2,255
JamaicaJamaica
Source: IFS, WEO; IMF; in 2010 USD
$ ,$ ,$ ,$ ,
Leadership in Turbulent TimesLeadership in Turbulent TimesLeadership in Turbulent TimesLeadership in Turbulent Times
• Seeing the World Through New Eyes
C it l M k t
• Seeing the World Through New Eyes
C it l M k t• Capital Markets
• Building Human Capital
• Capital Markets
• Building Human Capital• Building Human Capital
• Where’s Sputnik?
• Building Human Capital
• Where’s Sputnik?
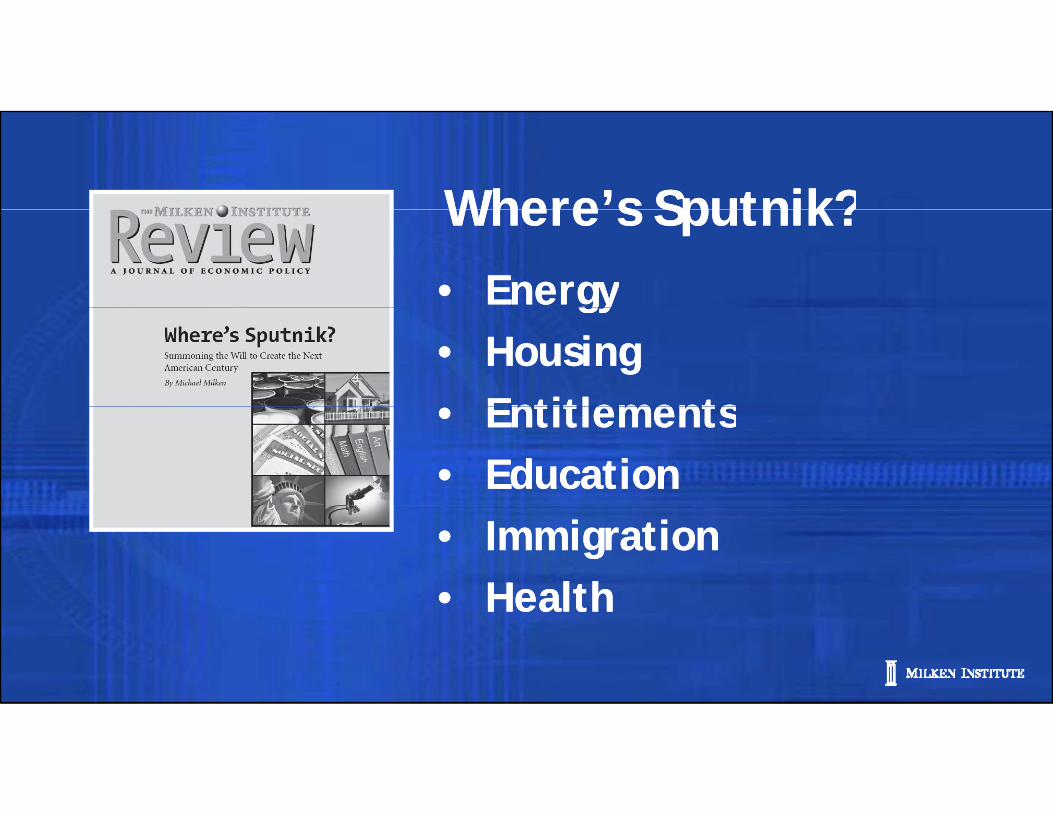
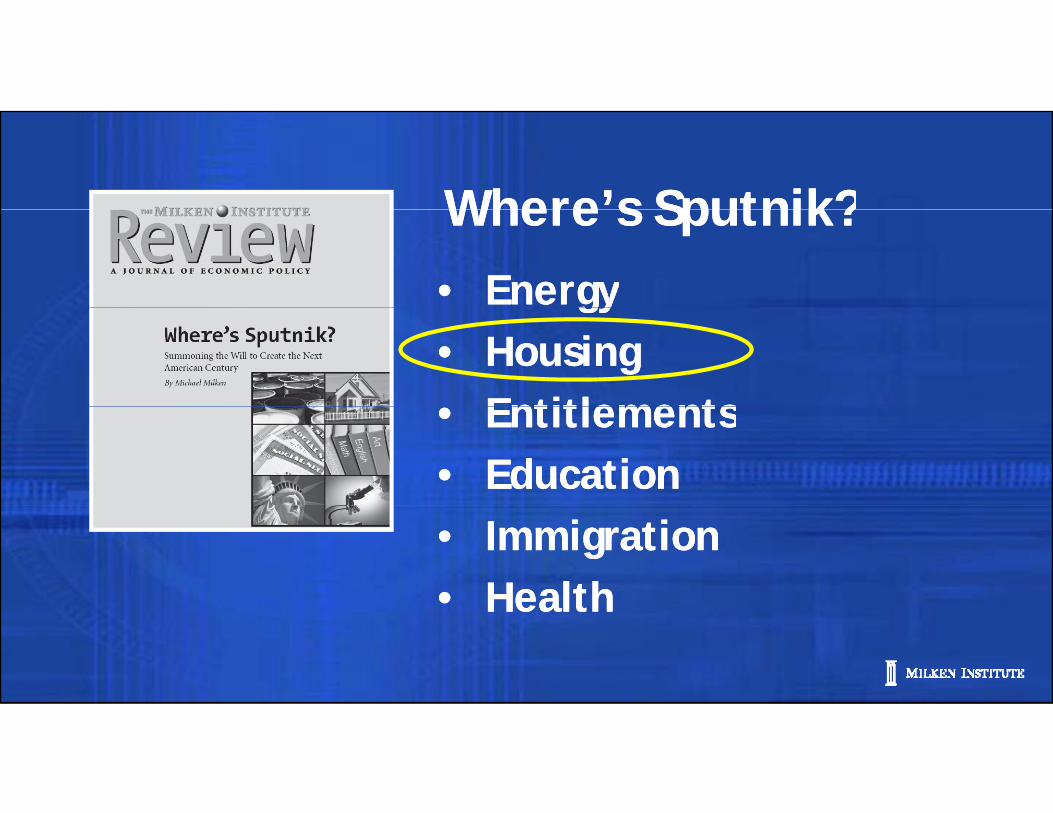
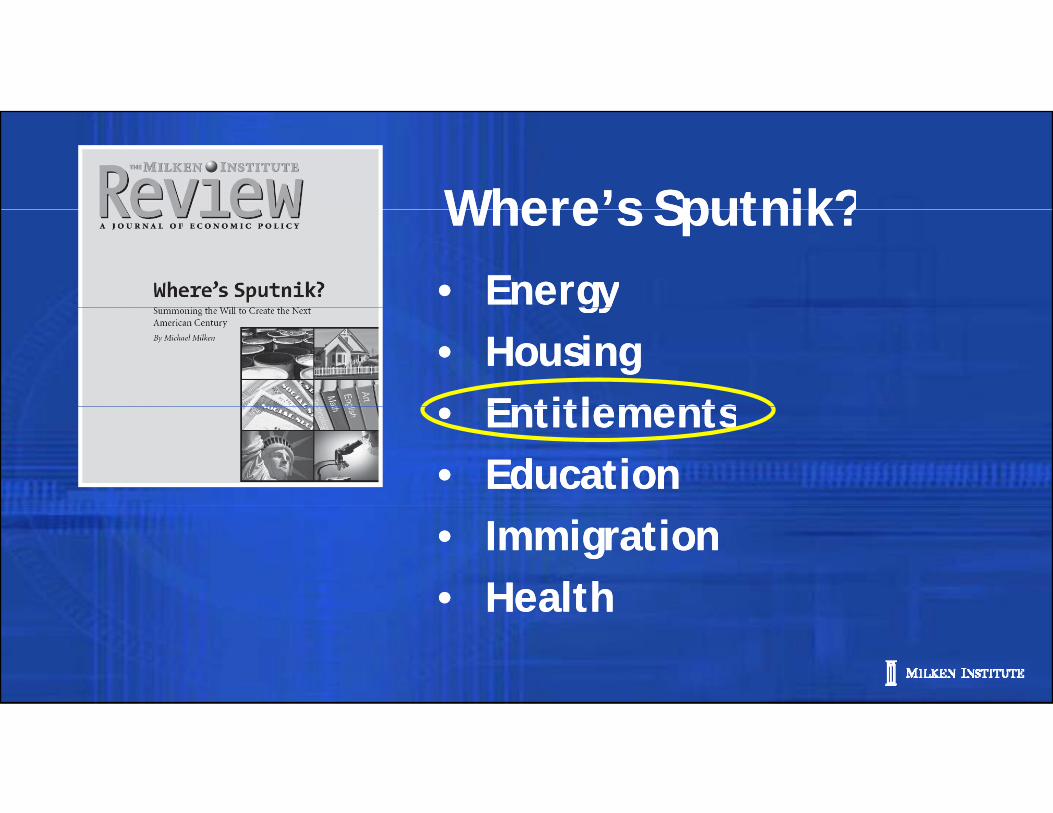
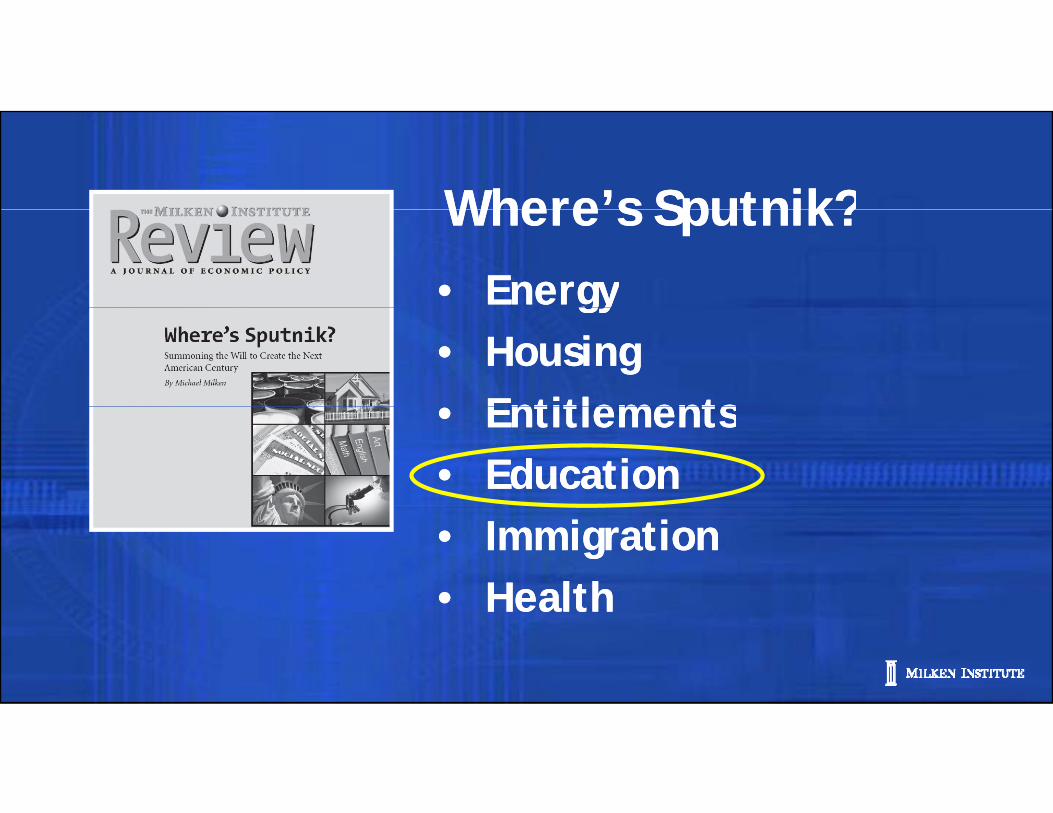
Where’s Sputnik?Where’s Sputnik?•• EnergyEnergy
Where s Sputnik?Where s Sputnik?gygy
•• HousingHousingEntitlementsEntitlements•• EntitlementsEntitlements
•• EducationEducation•• ImmigrationImmigration•• HealthHealthHealthHealth
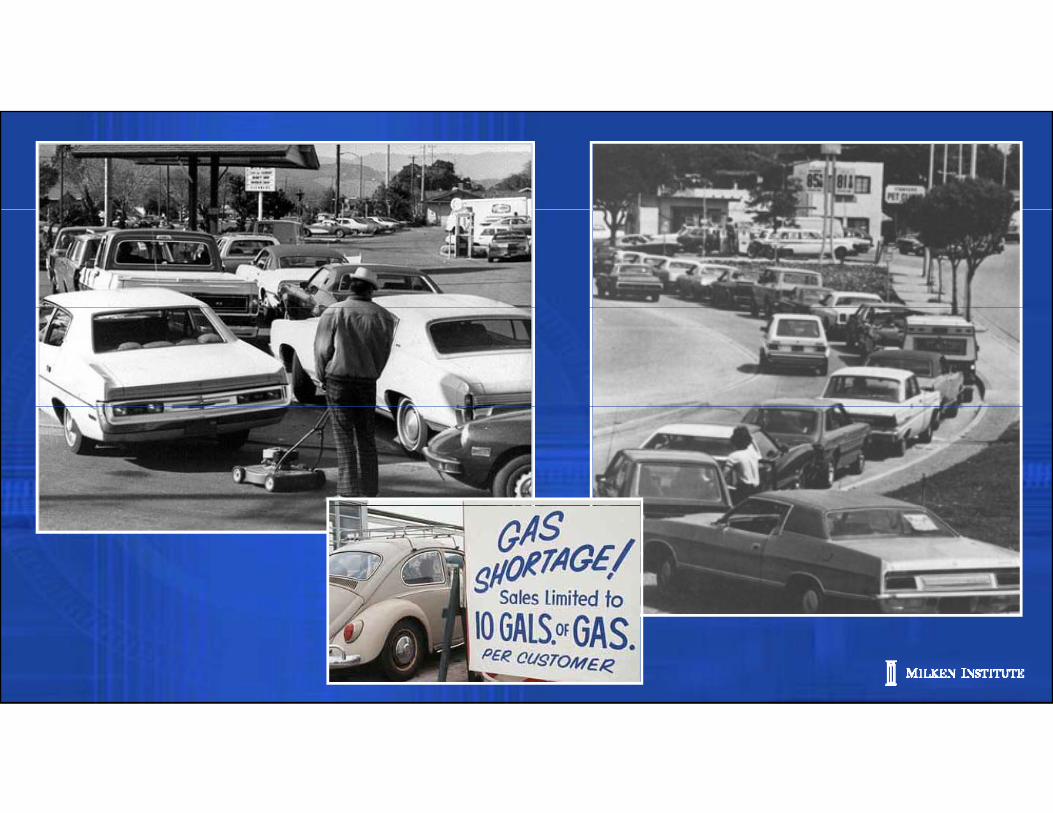
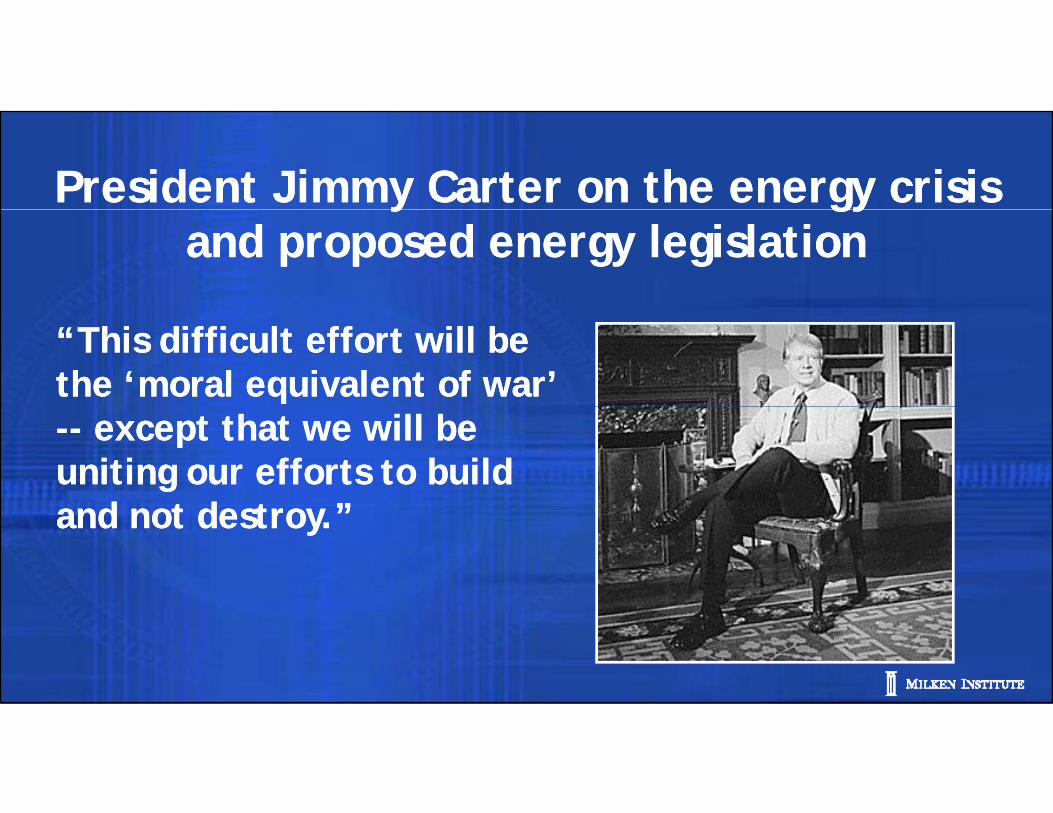
President Jimmy Carter on the energy crisisPresident Jimmy Carter on the energy crisisy gyy gyand proposed energy legislationand proposed energy legislation
“This difficult effort will be “This difficult effort will be the ‘moral equivalent of war’ the ‘moral equivalent of war’ ---- except that we will be except that we will be uniting our efforts to build uniting our efforts to build
d t d t ”d t d t ”and not destroy.”and not destroy.”
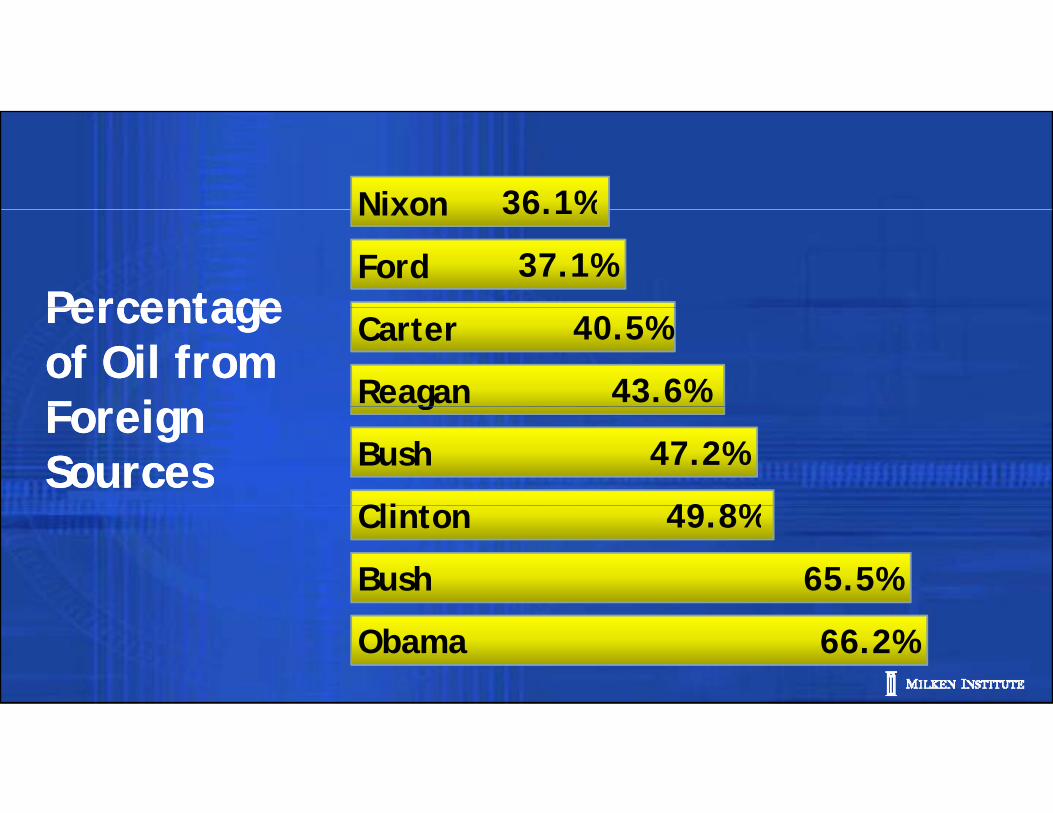
36.1%Nixon 36.1%
37.1%Ford
Nixon
Percentage Percentage 40.5%
43.6%Reagan
CarterPercentage Percentage of Oil from of Oil from F i F i
47.2%
49 8%Cli t
Bush
gForeign Foreign SourcesSources
65.5%Bush
49.8%Clinton
66.2%Obama
Where’s Sputnik?Where’s Sputnik?•• EnergyEnergy
Where s Sputnik?Where s Sputnik?gygy
•• HousingHousingEntitlementsEntitlements•• EntitlementsEntitlements
•• EducationEducation•• ImmigrationImmigration•• HealthHealthHealthHealth
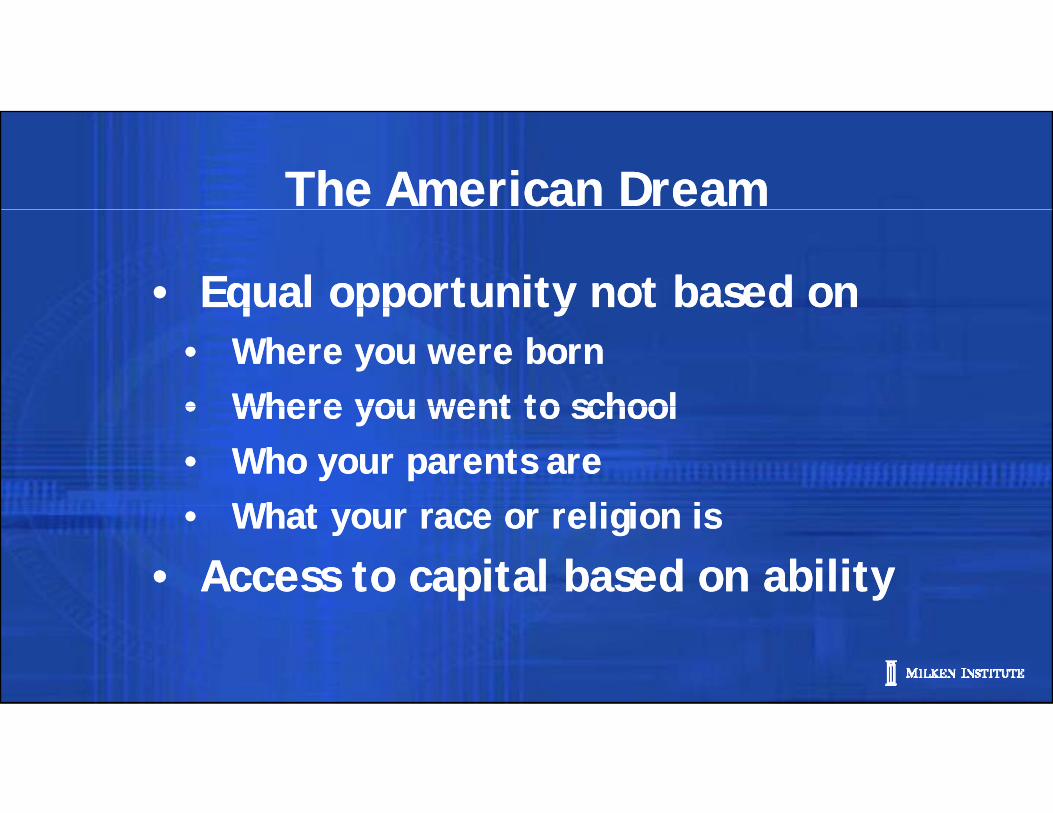
The American DreamThe American Dream
• Equal opportunity not based on • Equal opportunity not based on q pp y• Where you were born• Where you went to school
q pp y• Where you were born• Where you went to school• Where you went to school• Who your parents are
Wh t li i i
• Where you went to school• Who your parents are
Wh t li i i• What your race or religion is
• Access to capital based on ability• What your race or religion is
• Access to capital based on ability

The American DreamThe American Dream
• Father born in Syria• Father born in Syria• Father born in Syria
• Adopted
• Father born in Syria
• Adopted
• Dropped out of college• Dropped out of college
Steve JobsSteve Jobs
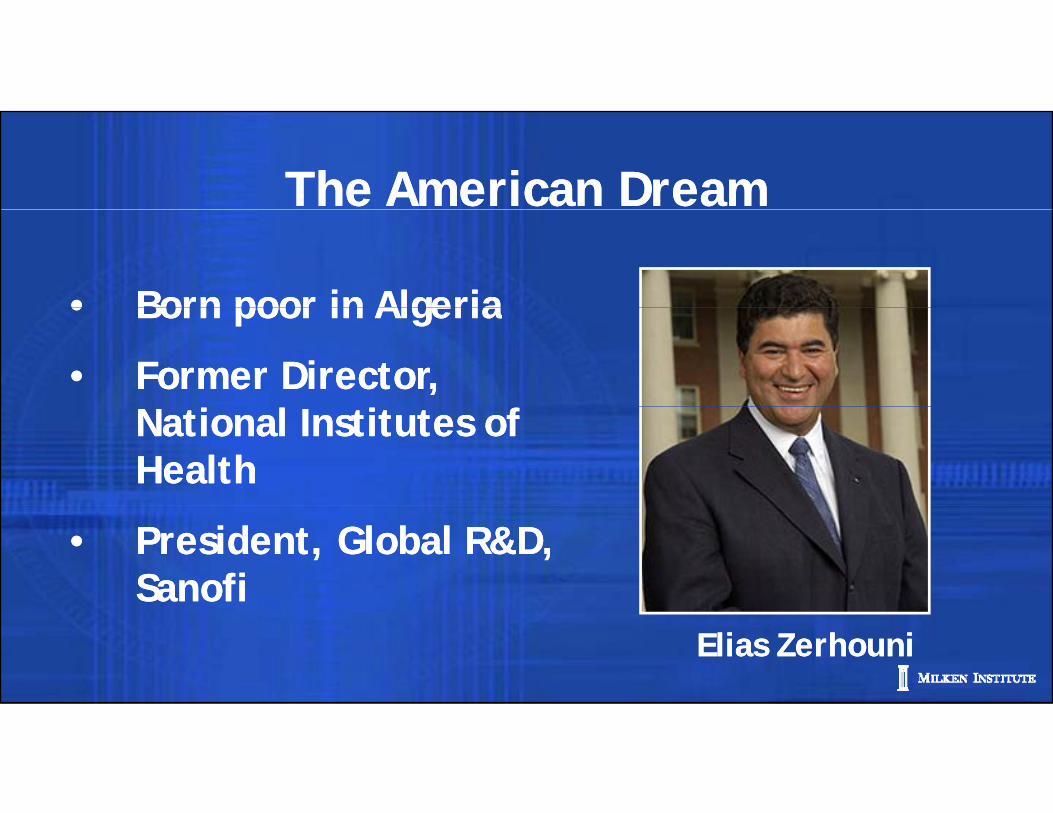
The American DreamThe American Dream
• Born poor in Algeria• Born poor in Algeria• Born poor in Algeria
• Former Director, l
• Born poor in Algeria
• Former Director, lNational Institutes of
HealthNational Institutes of Health
• President, Global R&D, Sanofi
• President, Global R&D, Sanofi
Elias Elias ZerhouniZerhouni
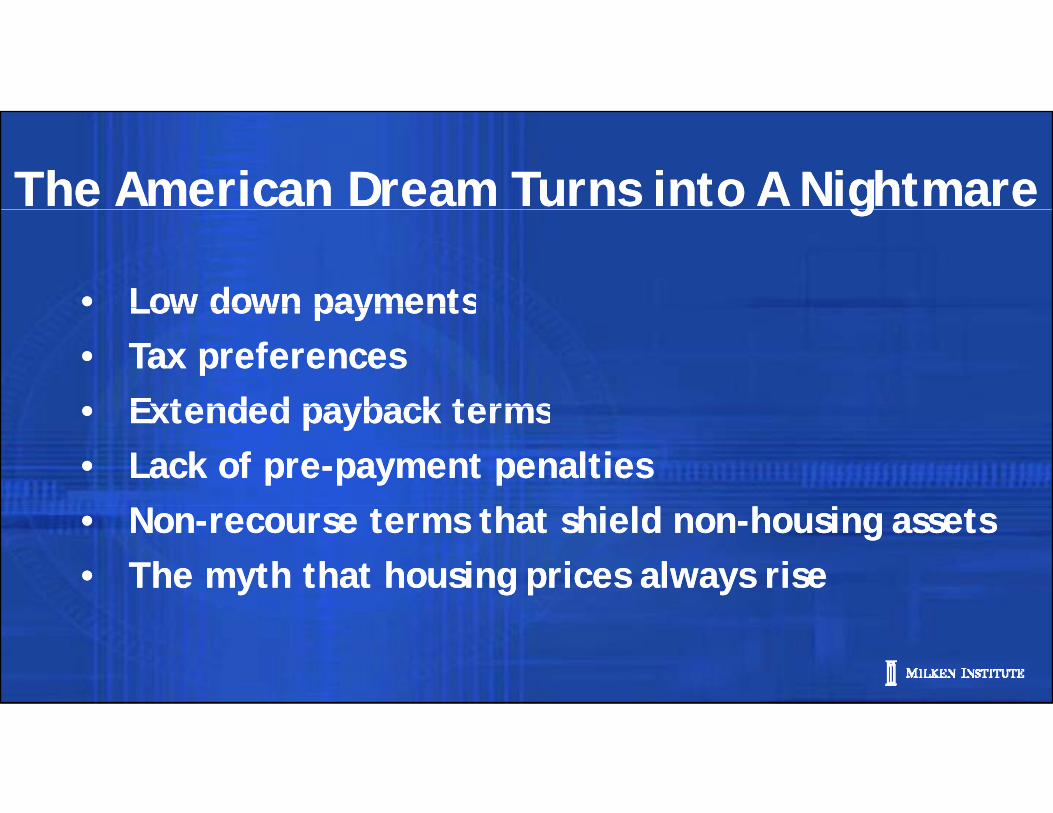
The American Dream Turns into A NightmareThe American Dream Turns into A Nightmare
• Low down payments• Low down payments
gg
• Low down payments• Tax preferences
Extended payback terms
• Low down payments• Tax preferences
Extended payback terms• Extended payback terms• Lack of pre-payment penalties
h h ld h
• Extended payback terms• Lack of pre-payment penalties
h h ld h• Non-recourse terms that shield non-housing assets• The myth that housing prices always rise• Non-recourse terms that shield non-housing assets• The myth that housing prices always rise
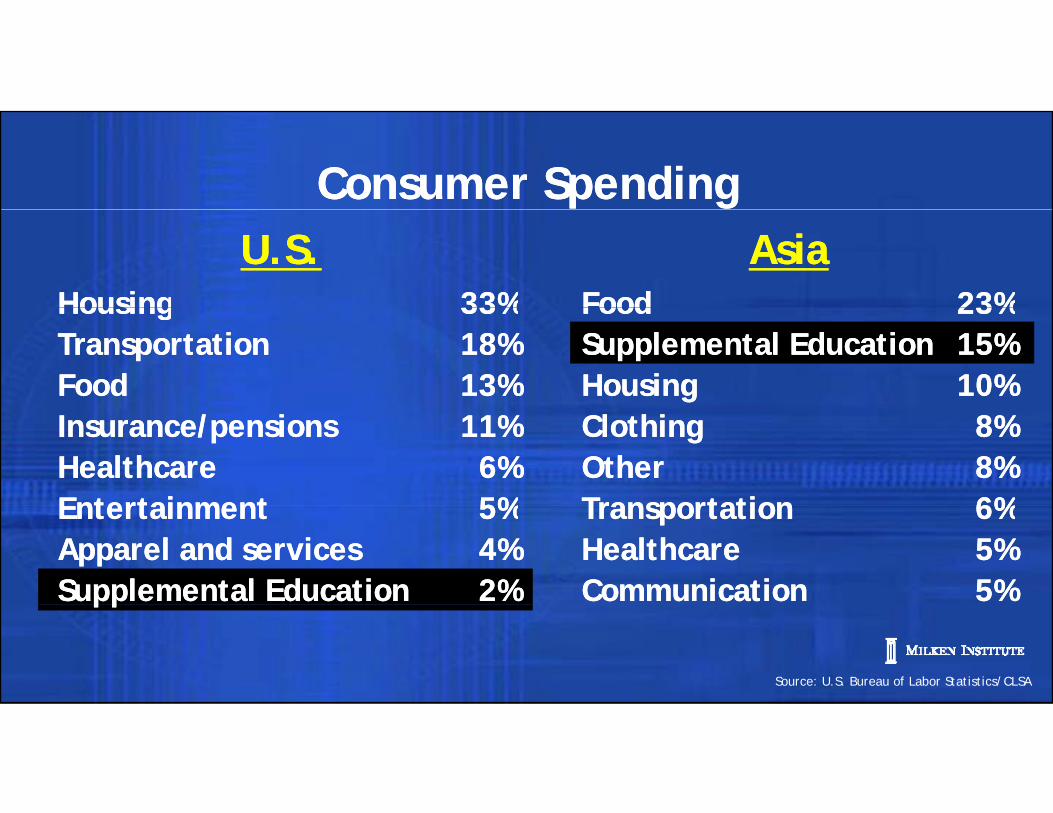
Consumer SpendingConsumer Spending
Housing 33%Housing 33%
U.S.U.S. AsiaAsiaFood 23%Food 23%Housing 33%
Transportation 18%Food 13%
Housing 33%Transportation 18%Food 13%
Food 23%Supplemental Education 15%Housing 10%
Food 23%Supplemental Education 15%Housing 10%
Insurance/pensions 11%Healthcare 6%Entertainment 5%
Insurance/pensions 11%Healthcare 6%Entertainment 5%
Clothing 8%Other 8%Transportation 6%
Clothing 8%Other 8%Transportation 6%Entertainment 5%
Apparel and services 4%Supplemental Education 2%
Entertainment 5%Apparel and services 4%Supplemental Education 2%
Transportation 6%Healthcare 5%Communication 5%
Transportation 6%Healthcare 5%Communication 5%pppp
Source: U.S. Bureau of Labor Statistics/CLSA
Where’s Sputnik?Where’s Sputnik?•• EnergyEnergy
Where s Sputnik?Where s Sputnik?gygy
•• HousingHousingEntitlementsEntitlements•• EntitlementsEntitlements
•• EducationEducation•• ImmigrationImmigration•• HealthHealthHealthHealth
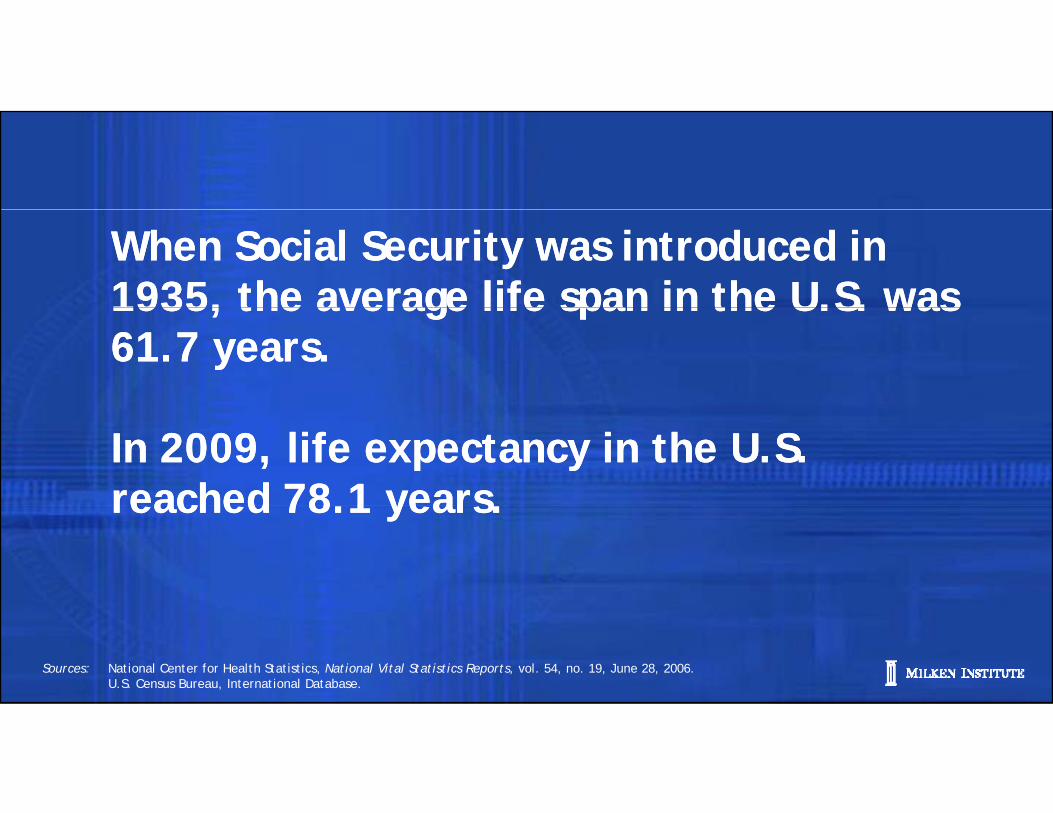
When Social Security was introduced in When Social Security was introduced in 1935, the average life span in the U.S. was 1935, the average life span in the U.S. was 1935, the average life span in the U.S. was 1935, the average life span in the U.S. was 61.7 years.61.7 years.
In 2009, life expectancy in the U.S. In 2009, life expectancy in the U.S. reached 78 1 years reached 78 1 years reached 78.1 years. reached 78.1 years.
Sources: National Center for Health Statistics, National Vital Statistics Reports, vol. 54, no. 19, June 28, 2006.U.S. Census Bureau, International Database.
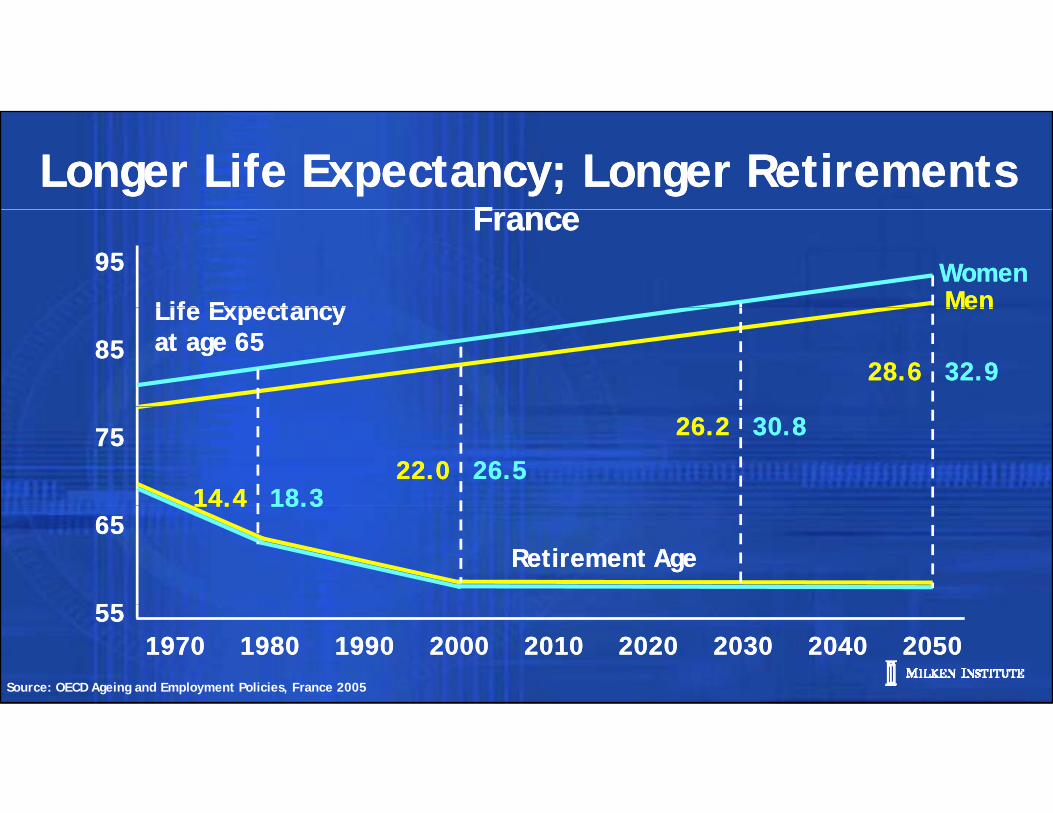
Longer Life Expectancy; Longer RetirementsF
Longer Life Expectancy; Longer RetirementsF
9595
FranceFrance
Life Expectancy Life Expectancy WomenWomenMenMen
8585Life Expectancy at age 65Life Expectancy at age 65
MenMen
28.628.6 32.932.9
7575
14.414.4 18.318.322.022.0 26.526.5
26.226.2 30.830.8
6565
5555
Retirement AgeRetirement Age
14.414.4 18.318.3
19701970 19801980 19901990 20002000 20102010 20202020 20302030 20402040 205020505555
Source: OECD Ageing and Employment Policies, France 2005
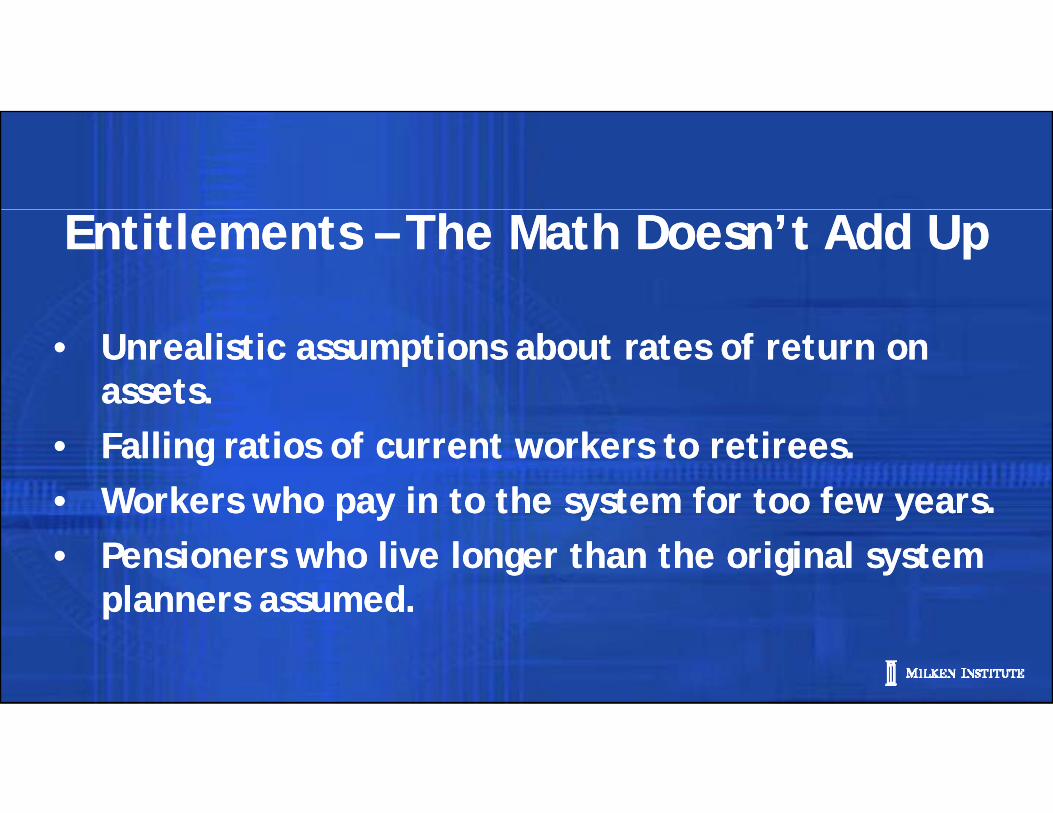
Entitlements Entitlements –– The Math Doesn’t Add UpThe Math Doesn’t Add Up
• Unrealistic assumptions about rates of return on assets.
• Unrealistic assumptions about rates of return on assets.
• Falling ratios of current workers to retirees.• Workers who pay in to the system for too few years• Falling ratios of current workers to retirees.• Workers who pay in to the system for too few years• Workers who pay in to the system for too few years.• Pensioners who live longer than the original system
planners assumed
• Workers who pay in to the system for too few years.• Pensioners who live longer than the original system
planners assumedplanners assumed.planners assumed.
Where’s Sputnik?Where’s Sputnik?•• EnergyEnergy
Where s Sputnik?Where s Sputnik?gygy
•• HousingHousingEntitlementsEntitlements•• EntitlementsEntitlements
•• EducationEducation•• ImmigrationImmigration•• HealthHealthHealthHealth
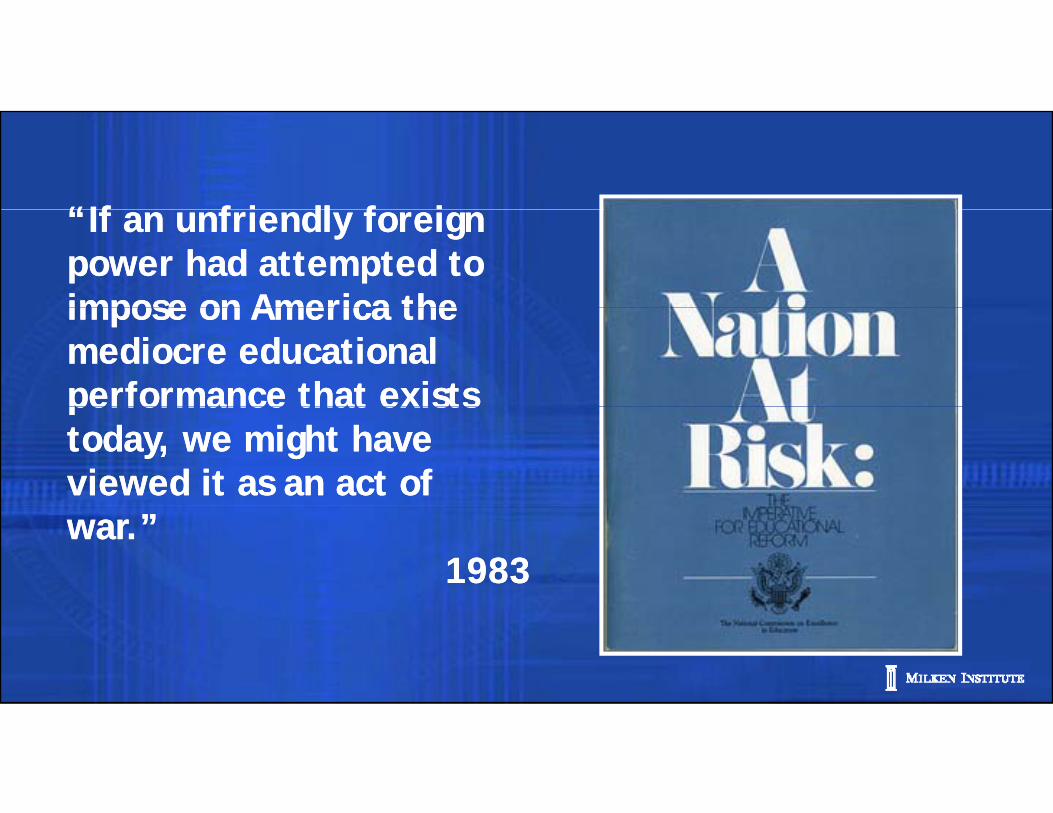
“If f i dl f i “If f i dl f i “If an unfriendly foreign power had attempted to impose on America the
“If an unfriendly foreign power had attempted to impose on America the impose on America the mediocre educational performance that exists
impose on America the mediocre educational performance that exists performance that exists today, we might have viewed it as an act of
performance that exists today, we might have viewed it as an act of war.”
1983war.”
1983
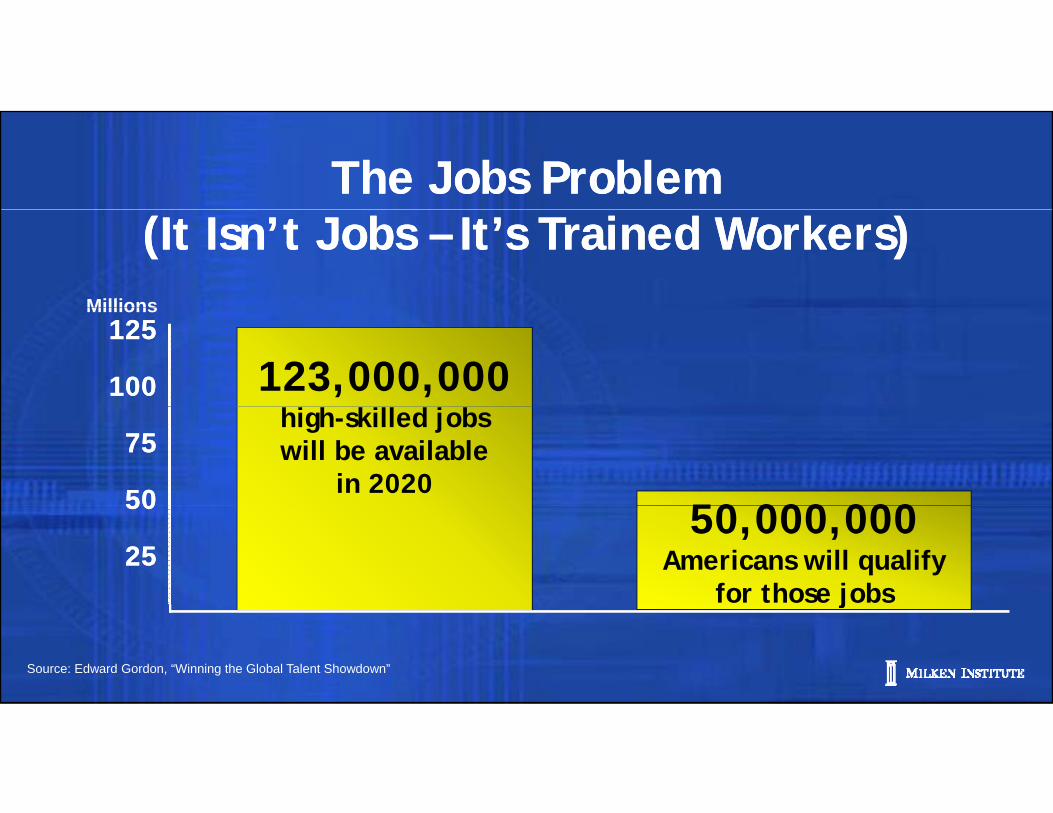
The Jobs ProblemThe Jobs Problem(It Isn’t Jobs – It’s Trained Workers)(It Isn’t Jobs – It’s Trained Workers)
Millions125125
100100
Millions
123,000,000 h h k ll d b
7575
5050
high-skilled jobs will be available
in 202050 000 000 5050
252550,000,000
Americans will qualify for those jobs
Source: Edward Gordon, “Winning the Global Talent Showdown”
j
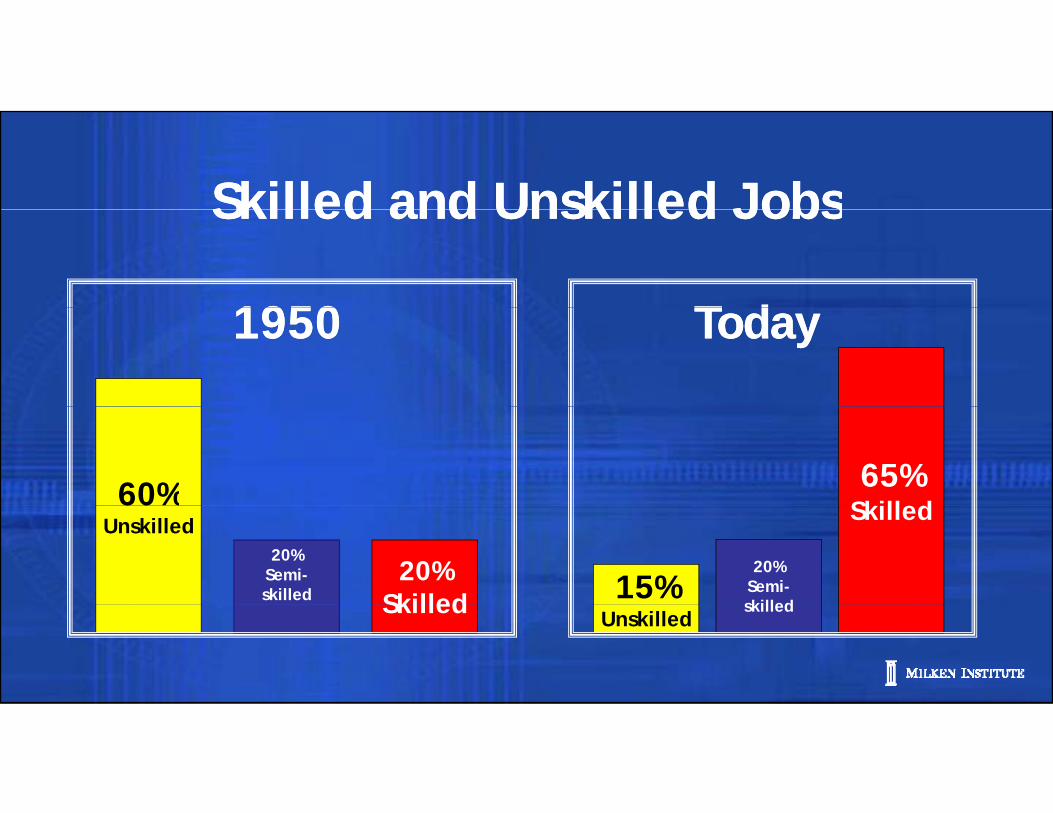
Skilled and Unskilled JobsSkilled and Unskilled Jobs
19501950 T dT d
Skilled and Unskilled JobsSkilled and Unskilled Jobs
19501950 TodayToday
60% 65%Skill d
20%Skilled
20%Semi-skilled
60%Unskilled
20%Semi-skilled
Skilled
15%Skilled skilledUnskilled

Occupy Movement:Occupy Movement:Occupy Movement:Ignore at Your Own Peril
Occupy Movement:Ignore at Your Own Peril
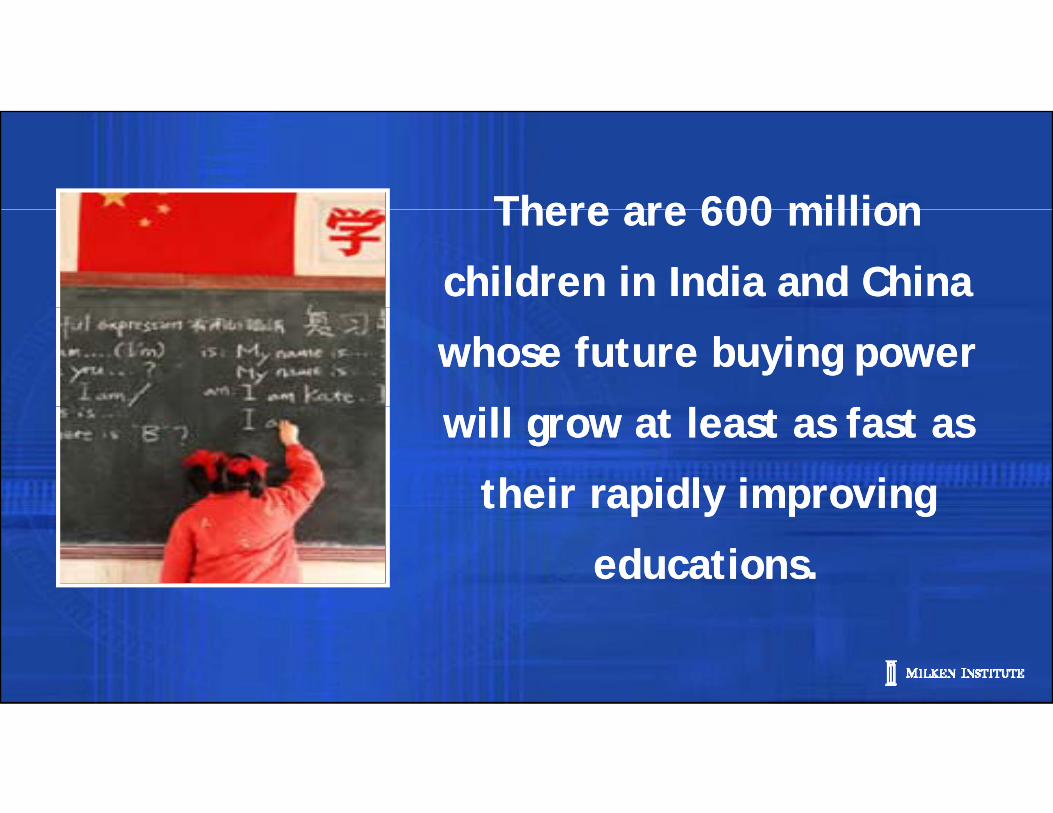
There are 600 million There are 600 million There are 600 million
children in India and China
There are 600 million
children in India and China
whose future buying power
ill l f
whose future buying power
ill l f will grow at least as fast as
their rapidly improving
will grow at least as fast as
their rapidly improving their rapidly improving
educations.
their rapidly improving
educations.
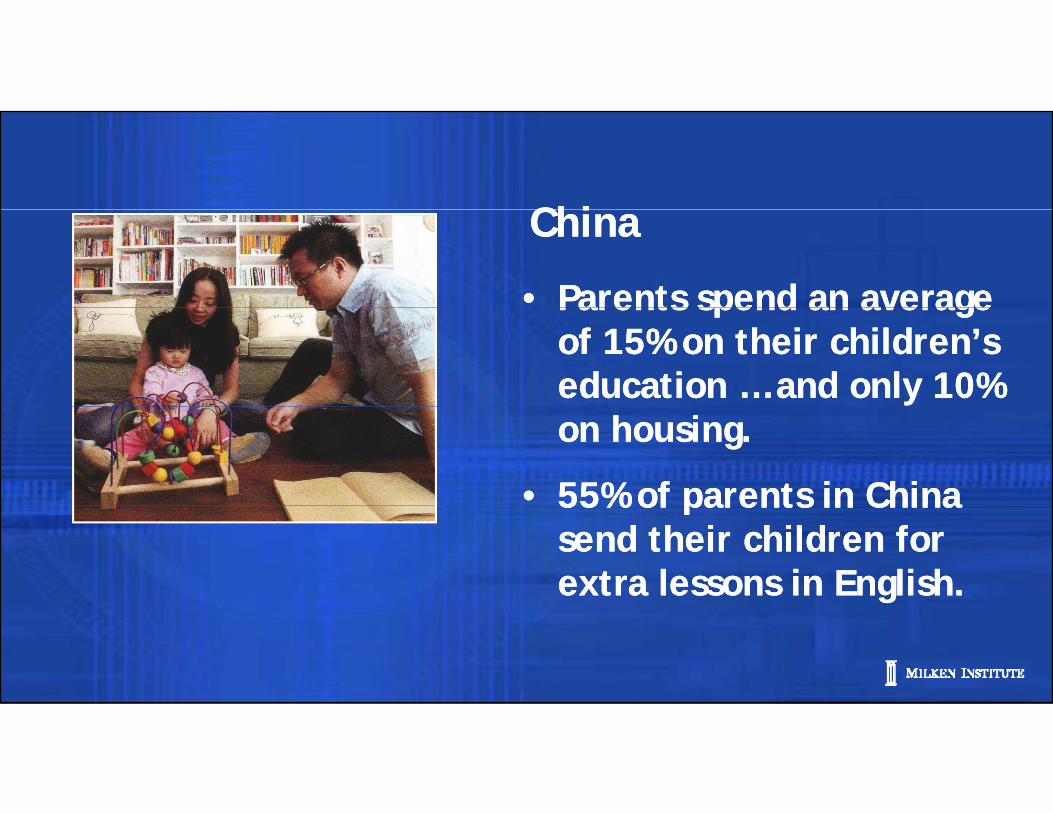
ChiChi
• Parents spend an average • Parents spend an average
ChinaChina
Parents spend an average of 15% on their children’s education … and only 10%
Parents spend an average of 15% on their children’s education … and only 10% on housing.
• 55% of parents in China
on housing.
• 55% of parents in China 55% of parents in China send their children for extra lessons in English.
55% of parents in China send their children for extra lessons in English.

I di I di India… India… • Extracurricular activities
i t d f d i • Extracurricular activities
i t d f d i consisted of academic coaching in 95% of the households
consisted of academic coaching in 95% of the householdshouseholds.
• 43% of parents want their children to get a Master’s
households.
• 43% of parents want their children to get a Master’s children to get a Master s degree; 29% want them to get a PhD.
children to get a Master s degree; 29% want them to get a PhD.get a PhD.get a PhD.

We must not be afraid of We must not be afraid of f fcompetition.
f fcompetition.
We must be ready to We must be ready to We must be ready to compete.
We must be ready to compete.
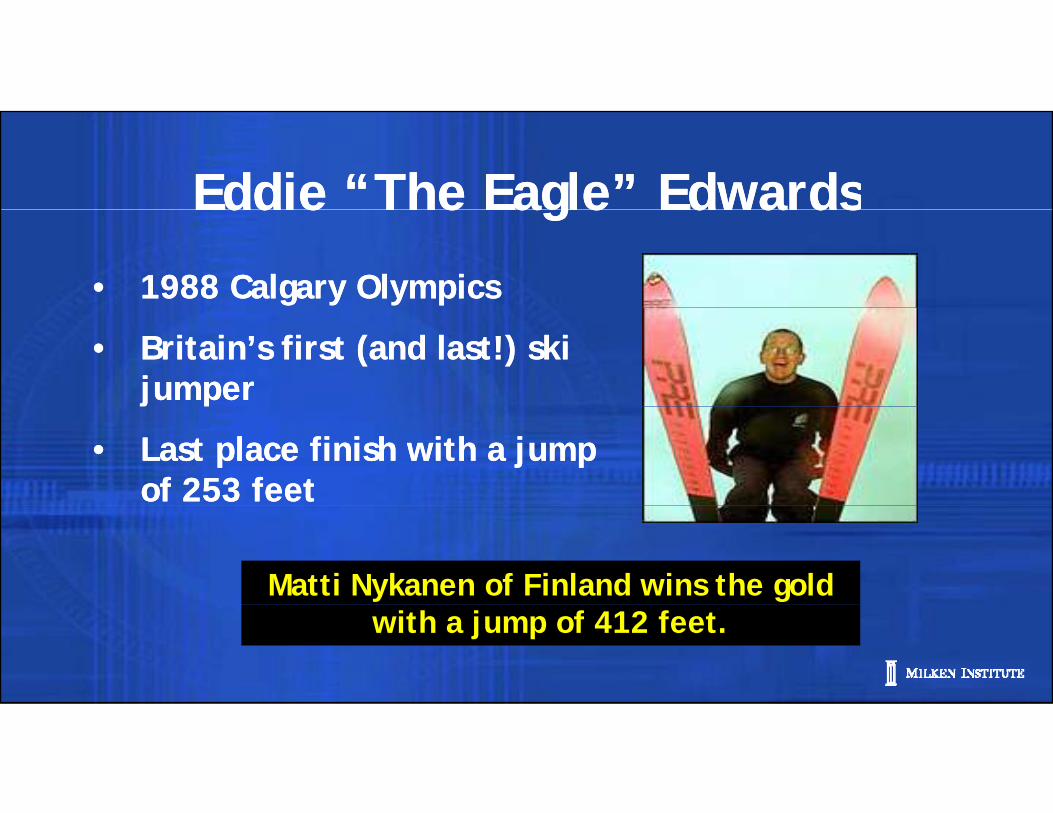
Eddie “The Eagle” EdwardsEddie “The Eagle” EdwardsEddie The Eagle EdwardsEddie The Eagle Edwards
• 1988 Calgary Olympics• 1988 Calgary Olympics
• Britain’s first (and last!) ski jumper
• Britain’s first (and last!) ski jumper
• Last place finish with a jump of 253 feet
• Last place finish with a jump of 253 feet
Matti Nykanen of Finland wins the gold with a jump of 412 feet.
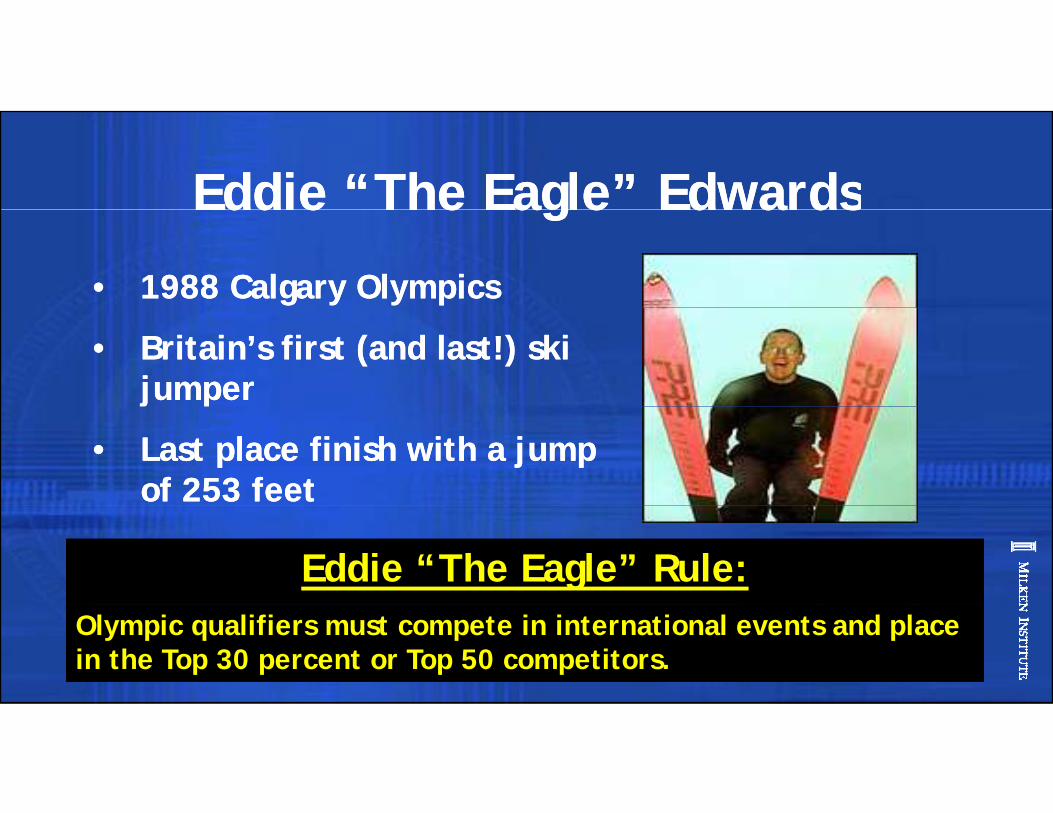
Eddie “The Eagle” EdwardsEddie “The Eagle” EdwardsEddie The Eagle EdwardsEddie The Eagle Edwards
• 1988 Calgary Olympics• 1988 Calgary Olympics
• Britain’s first (and last!) ski jumper
• Britain’s first (and last!) ski jumper
• Last place finish with a jump of 253 feet
• Last place finish with a jump of 253 feet
Eddie “The Eagle” Rule:Eddie “The Eagle” Rule:Olympic qualifiers must compete in international events and place in the Top 30 percent or Top 50 competitors.Olympic qualifiers must compete in international events and place in the Top 30 percent or Top 50 competitors.

Where’s Sputnik?Where’s Sputnik?•• EnergyEnergy
Where s Sputnik?Where s Sputnik?gygy
•• HousingHousingEntitlementsEntitlements•• EntitlementsEntitlements
•• EducationEducation•• ImmigrationImmigration•• HealthHealthHealthHealth
Highly skilled, entrepreneurial Highly skilled, entrepreneurial
and educated immigrants are
l ’
and educated immigrants are
l ’crucial to any nation’s prosperity. crucial to any nation’s prosperity.
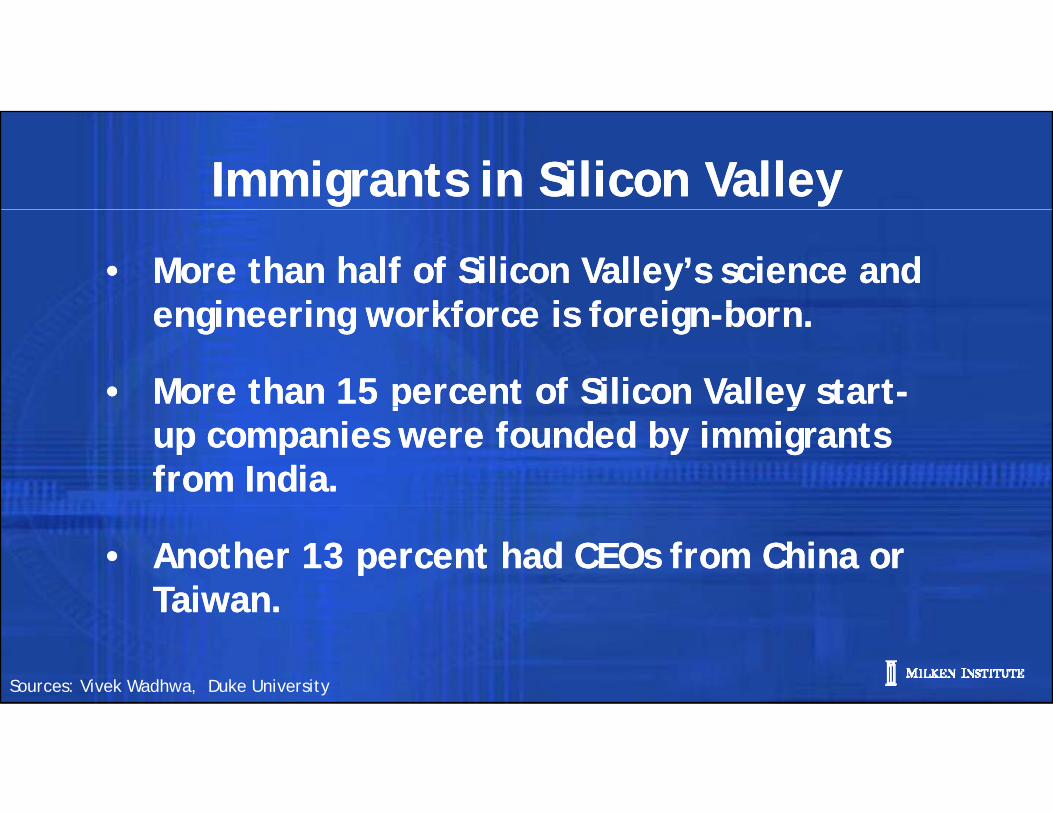
Immigrants in Silicon Valley Immigrants in Silicon Valley
• More than half of Silicon Valley’s science and engineering workforce is foreign born
• More than half of Silicon Valley’s science and engineering workforce is foreign bornengineering workforce is foreign-born.
• More than 15 percent of Silicon Valley start-
engineering workforce is foreign-born.
• More than 15 percent of Silicon Valley start-p yup companies were founded by immigrants from India.
p yup companies were founded by immigrants from India.
• Another 13 percent had CEOs from China or Taiwan
• Another 13 percent had CEOs from China or Taiwan
Sources: Vivek Wadhwa, Duke University
Taiwan. Taiwan.
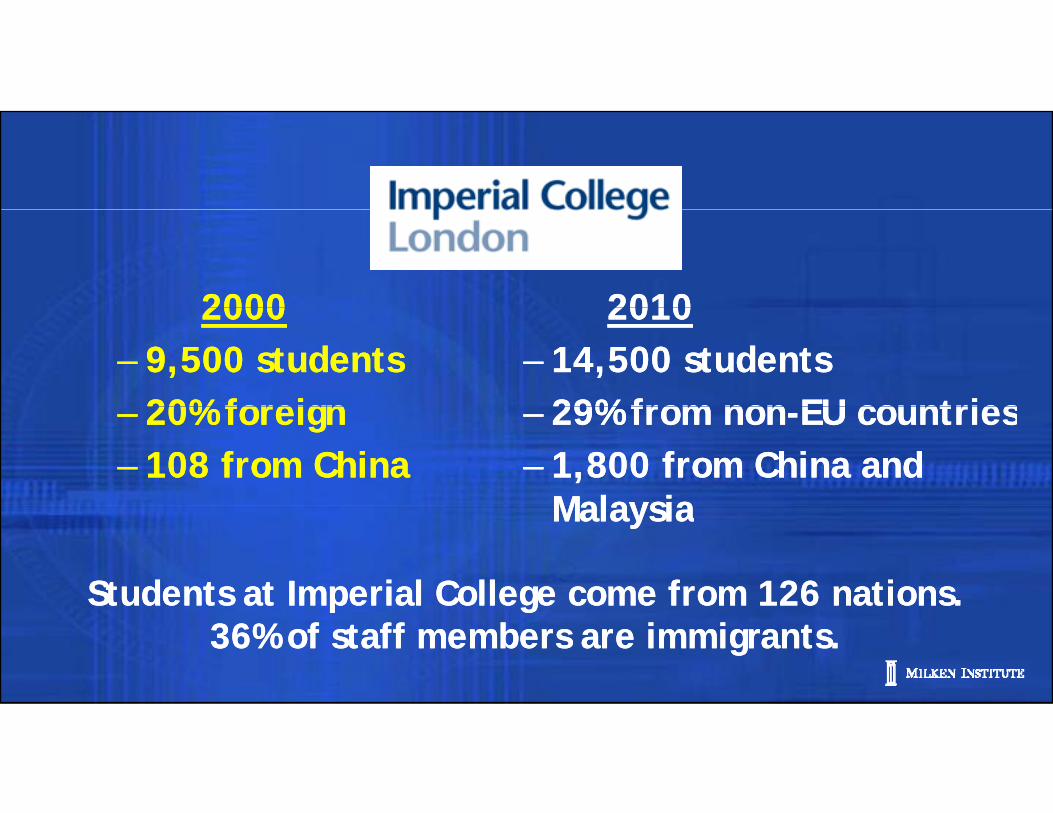
20002000 201020102000– 9,500 students
20% foreign
2000– 9,500 students
20% foreign
2010– 14,500 students
29% from non EU countries
2010– 14,500 students
29% from non EU countries– 20% foreign– 108 from China– 20% foreign– 108 from China
– 29% from non-EU countries– 1,800 from China and
Malaysia
– 29% from non-EU countries– 1,800 from China and
MalaysiaMalaysiaMalaysia
Students at Imperial College come from 126 nations.Students at Imperial College come from 126 nations.Students at Imperial College come from 126 nations.36% of staff members are immigrants.
Students at Imperial College come from 126 nations.36% of staff members are immigrants.
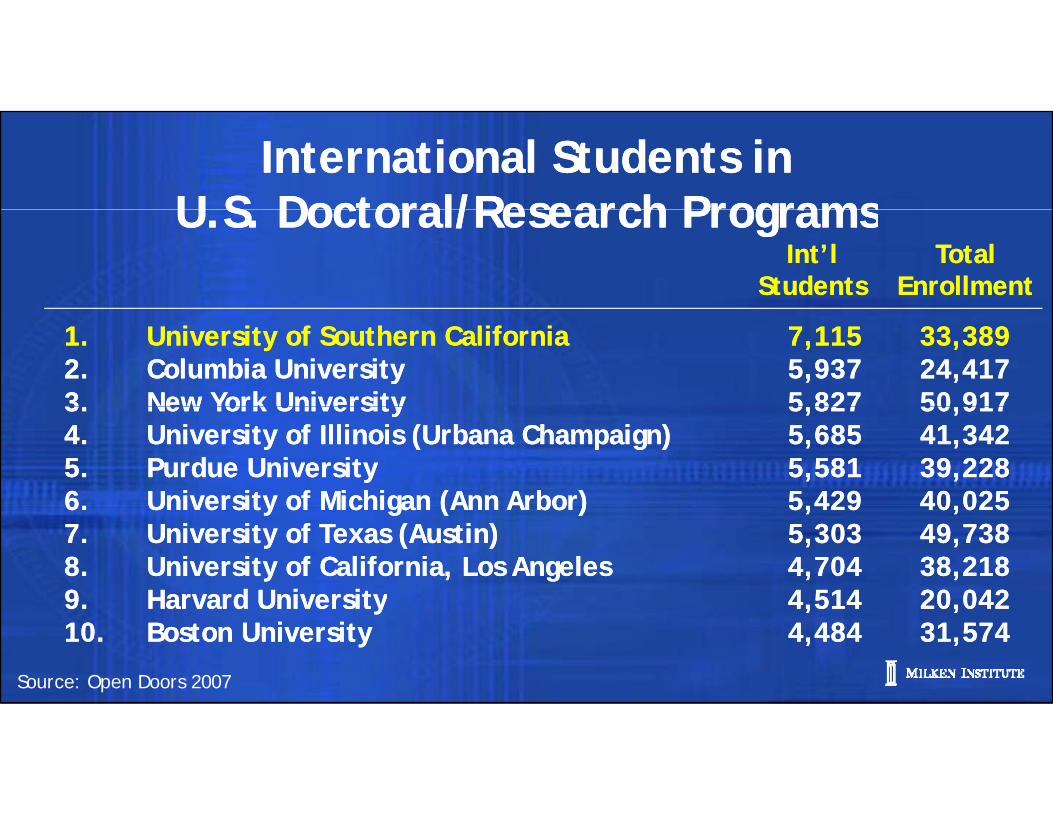
International Students inU S Doctoral/Research Programs
International Students inU S Doctoral/Research ProgramsU.S. Doctoral/Research ProgramsU.S. Doctoral/Research Programs
Int’l Students
Int’l Students
TotalEnrollment
TotalEnrollment
1. University of Southern California 7,115 33,3892. Columbia University 5,937 24,4173 New York University 5 827 50 917
1. University of Southern California 7,115 33,3892. Columbia University 5,937 24,4173 New York University 5 827 50 9173. New York University 5,827 50,9174. University of Illinois (Urbana Champaign) 5,685 41,3425. Purdue University 5,581 39,2286 University of Michigan (Ann Arbor) 5 429 40 025
3. New York University 5,827 50,9174. University of Illinois (Urbana Champaign) 5,685 41,3425. Purdue University 5,581 39,2286 University of Michigan (Ann Arbor) 5 429 40 0256. University of Michigan (Ann Arbor) 5,429 40,0257. University of Texas (Austin) 5,303 49,7388. University of California, Los Angeles 4,704 38,2189 Harvard University 4 514 20 042
6. University of Michigan (Ann Arbor) 5,429 40,0257. University of Texas (Austin) 5,303 49,7388. University of California, Los Angeles 4,704 38,2189 Harvard University 4 514 20 0429. Harvard University 4,514 20,04210. Boston University 4,484 31,5749. Harvard University 4,514 20,04210. Boston University 4,484 31,574
Source: Open Doors 2007

Where’s Sputnik?Where’s Sputnik?•• EnergyEnergy
Where s Sputnik?Where s Sputnik?gygy
•• HousingHousingEntitlementsEntitlements•• EntitlementsEntitlements
•• EducationEducation•• ImmigrationImmigration•• HealthHealthHealthHealth
Three SolutionsThree SolutionsThree Solutionsto Healthcare Challenges
Three Solutionsto Healthcare Challenges
• Prevention• Prevention
• Cost reduction• Cost reduction
• Research leading to cures• Research leading to curesResearch leading to curesResearch leading to cures

Lifestyle Makes a DifferenceLifestyle Makes a Differenceyy
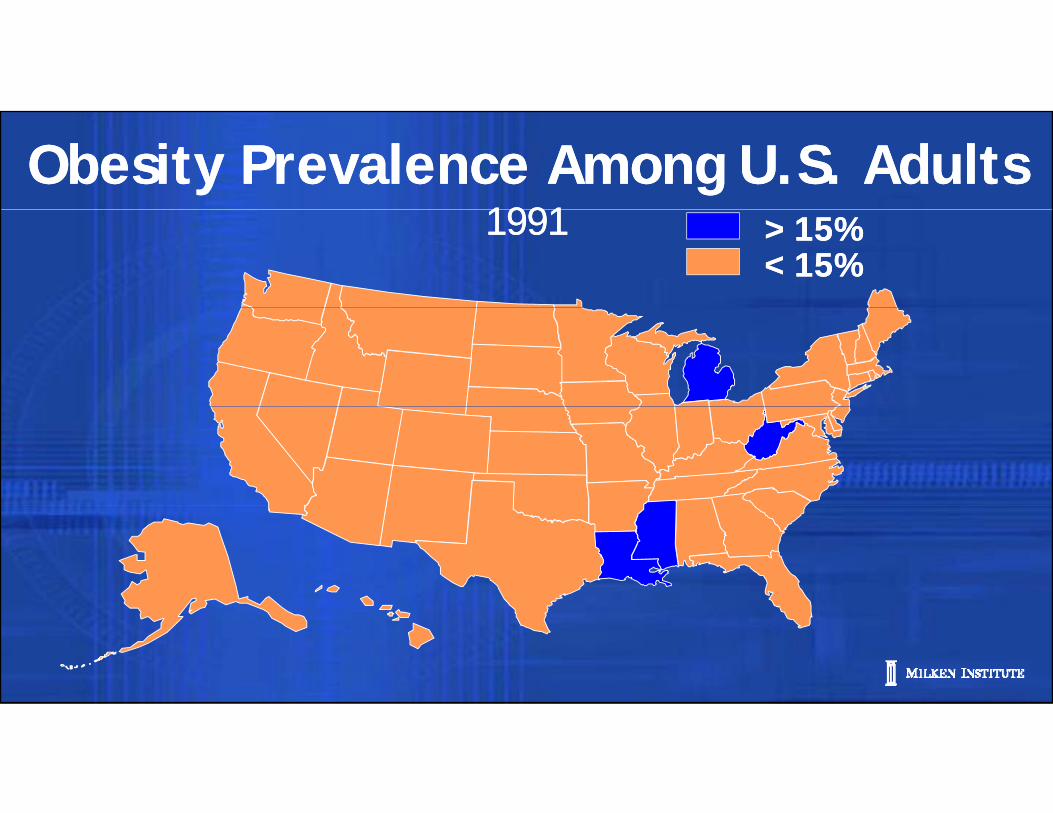
Obesity Prevalence Among U.S. Adults 1991
Obesity Prevalence Among U.S. Adults 199119911991 > 15%> 15%
< 15%< 15%
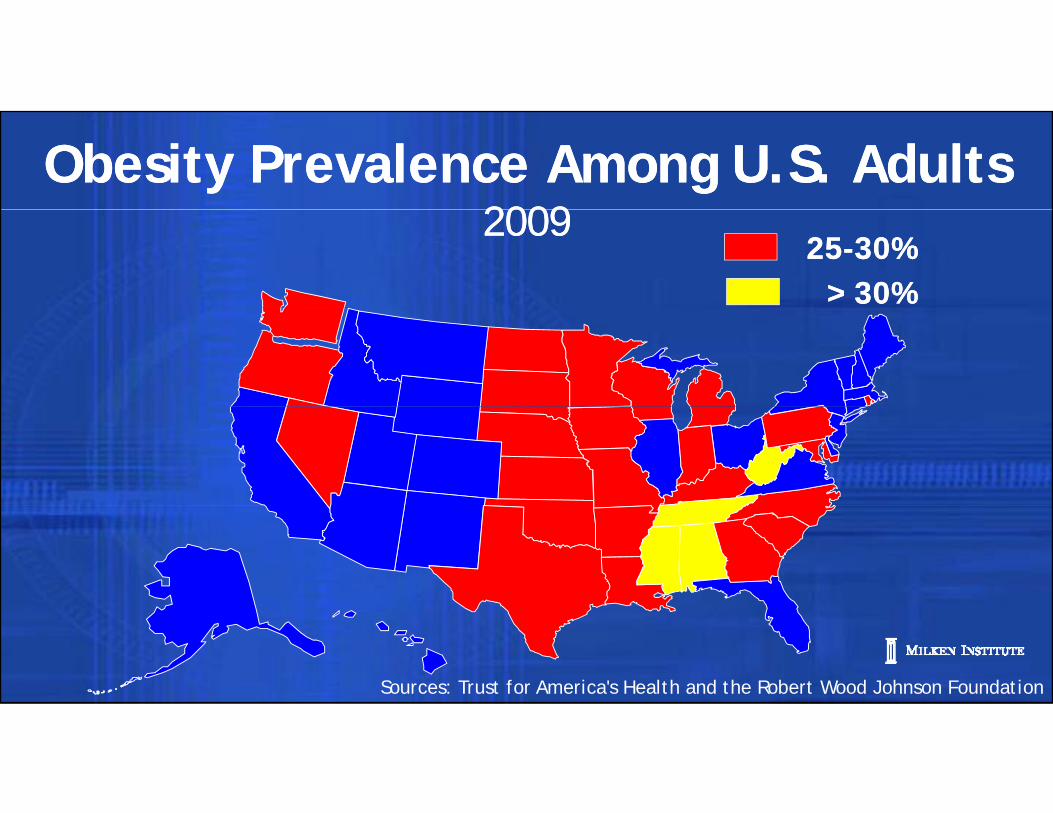
Obesity Prevalence Among U.S. Adults 2009
Obesity Prevalence Among U.S. Adults 200920092009
25-30%25-30%> 30%> 30%
Sources: Trust for America's Health and the Robert Wood Johnson Foundation
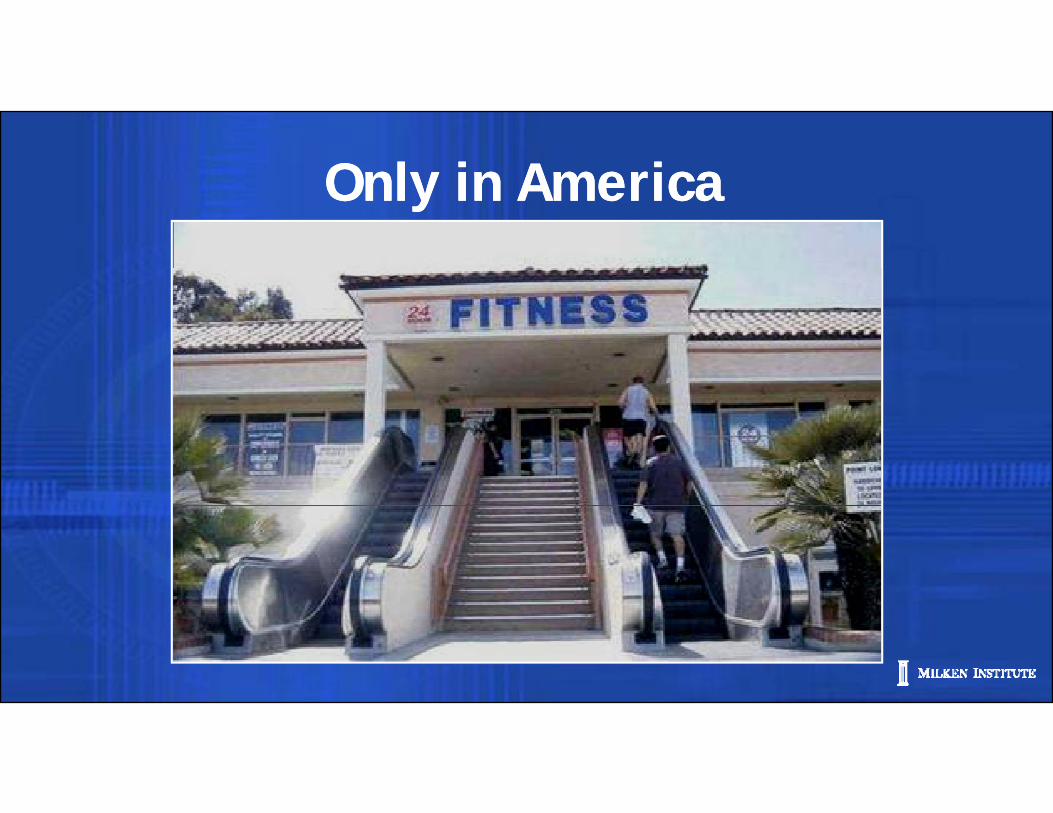
Only in AmericaOnly in Americayy
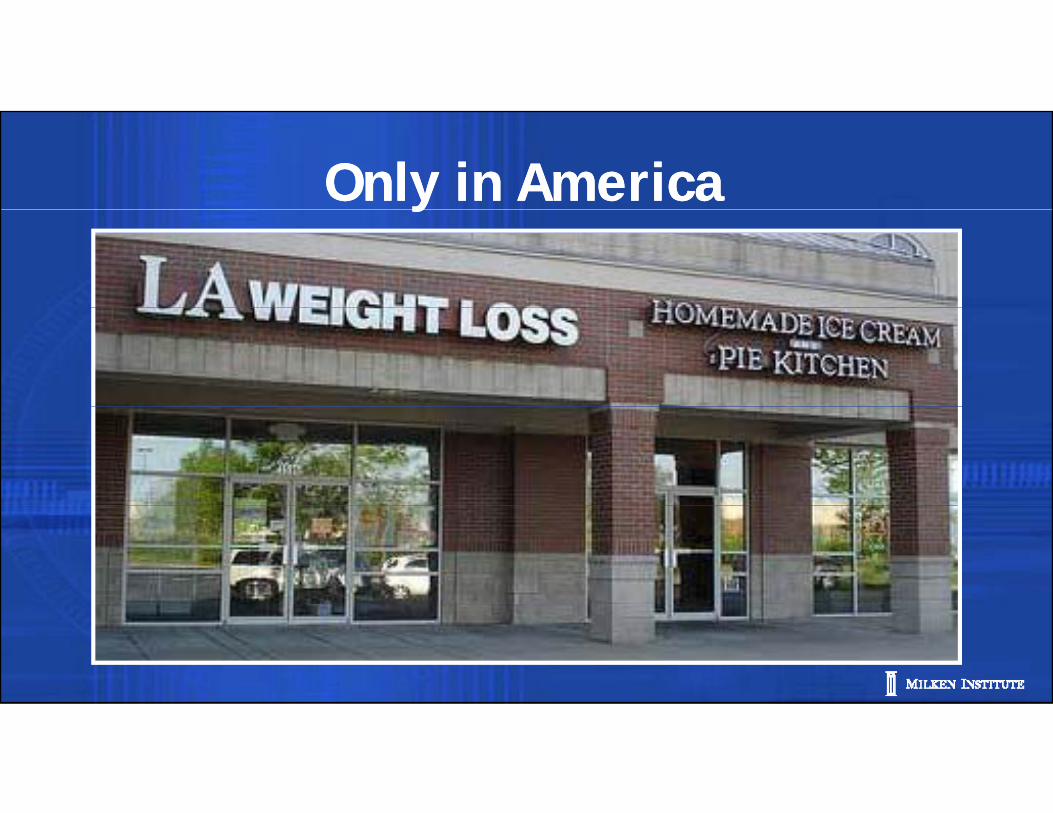
Only in AmericaOnly in Americayy
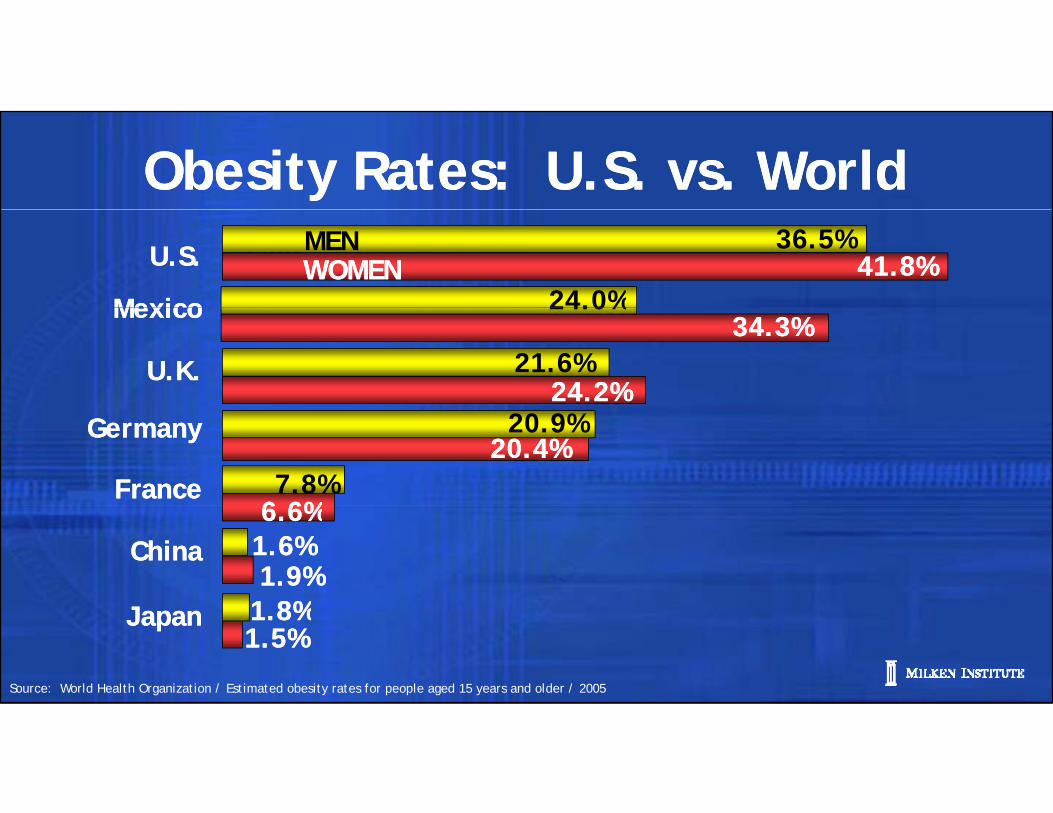
Obesity Rates: U.S. vs. WorldObesity Rates: U.S. vs. World20022005 41.8%41.8%
36.5%U.S.U.S. MENWOMENWOMEN
24.0%MexicoMexico
24.2%24.2%21.6%U.K.U.K.
34.3%34.3%24.0%MexicoMexico
6 6%6 6%
20.4%20.4%7.8%
20.9%
FranceFrance
GermanyGermany
1.9%1.9%
6.6%6.6%
1 8%1 8%
1.6%1.6%ChinaChina
Source: World Health Organization / Estimated obesity rates for people aged 15 years and older / 2005
1.5%1.5%1.8%1.8%JapanJapan


W ld W I W ld W I World War I poster urges World War I poster urges “sacrifice” – eatfruits and veggies“sacrifice” – eatfruits and veggiesfruits and veggiesso the troops can have the good
fruits and veggiesso the troops can have the good have the good sugar and fats!have the good sugar and fats!
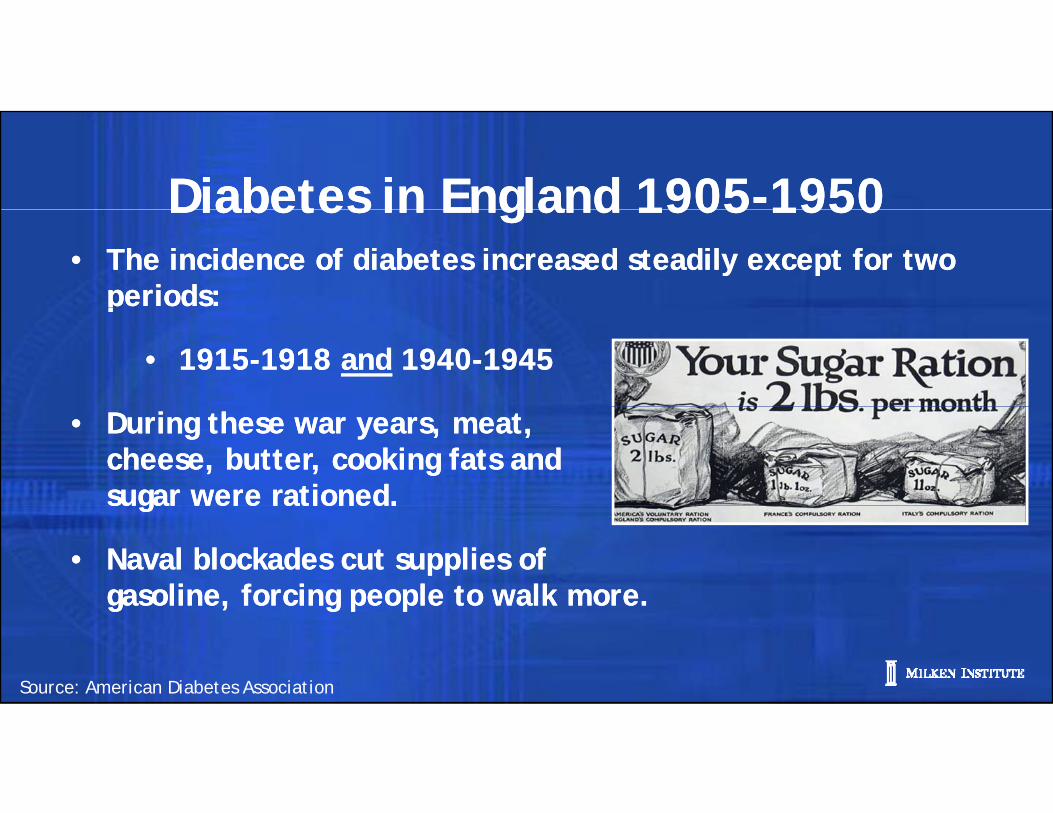
Diabetes in England 1905-1950Diabetes in England 1905-1950Diabetes in England 1905 1950Diabetes in England 1905 1950• The incidence of diabetes increased steadily except for two
periods:• The incidence of diabetes increased steadily except for two
periods:p
• 1915-1918 and 1940-1945
p
• 1915-1918 and 1940-1945
• During these war years, meat, cheese, butter, cooking fats andsugar were rationed.
• During these war years, meat, cheese, butter, cooking fats andsugar were rationed.sugar were rationed.
• Naval blockades cut supplies ofgasoline, forcing people to walk more.
sugar were rationed.
• Naval blockades cut supplies ofgasoline, forcing people to walk more.gasoline, forcing people to walk more.gasoline, forcing people to walk more.
Source: American Diabetes Association

Chronic Disease StudyChronic Disease Study
Failure to address chronic diseases Failure to address chronic diseases adequately costs the
U S th adequately costs the
U S th U.S. economy more than $1 trillion annually.
U.S. economy more than $1 trillion annually.
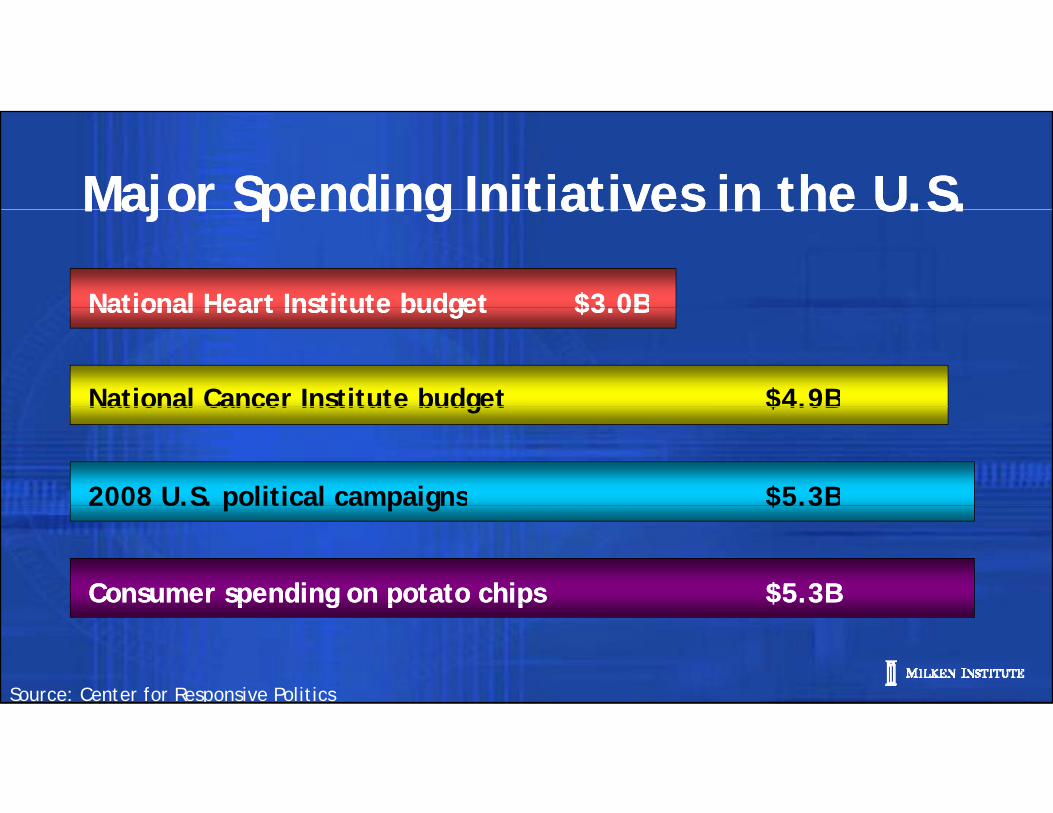
Major Spending Initiatives in the U.S.Major Spending Initiatives in the U.S.Major Spending Initiatives in the U.S.Major Spending Initiatives in the U.S.
National Heart Institute budget $3 0BNational Heart Institute budget $3 0B
National Cancer Institute budget $4.9B
National Heart Institute budget $3.0BNational Heart Institute budget $3.0B
2008 U.S. political campaigns $5.3B
National Cancer Institute budget $4.9B
2008 U.S. political campaigns $5.3B
Consumer spending on potato chips $5.3BConsumer spending on potato chips $5.3B
Source: Center for Responsive Politics
p g p p $p g p p $
Half of all economic growth in the l i b d
Half of all economic growth in the l i b d last two centuries can be traced to medical research advances.
last two centuries can be traced to medical research advances.to medical research advances.to medical research advances.
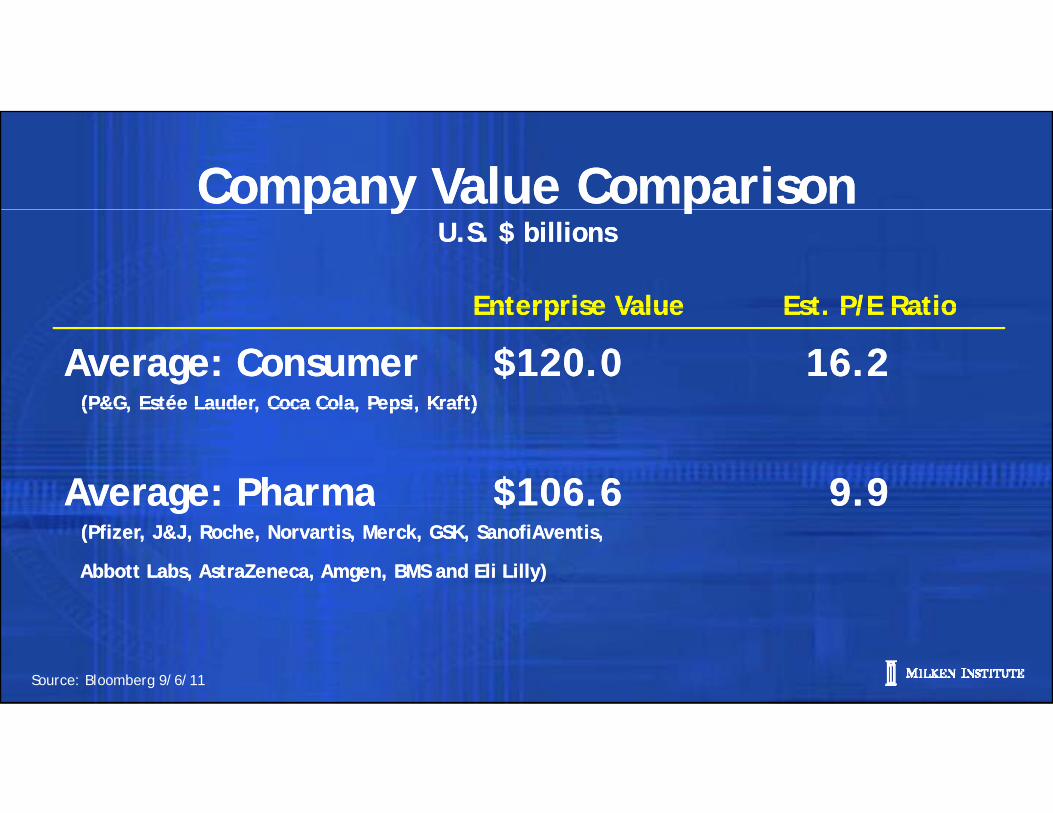
Company Value ComparisonCompany Value Comparisonp y pU.S. $ billions
p y pU.S. $ billions
Enterprise ValueEnterprise Value Est P/E RatioEst P/E Ratio
Average: Consumer $120.0 16.2(P&G, Estée Lauder, Coca Cola, Pepsi, Kraft)
Average: Consumer $120.0 16.2(P&G, Estée Lauder, Coca Cola, Pepsi, Kraft)
Enterprise ValueEnterprise Value Est. P/E RatioEst. P/E Ratio
(P&G, Estée Lauder, Coca Cola, Pepsi, Kraft)
Average: Pharma $106.6 9.9
(P&G, Estée Lauder, Coca Cola, Pepsi, Kraft)
Average: Pharma $106.6 9.9ve age: a a $ 06.6 9.9(Pfizer, J&J, Roche, Norvartis, Merck, GSK, SanofiAventis,
Abbott Labs, AstraZeneca, Amgen, BMS and Eli Lilly)
ve age: a a $ 06.6 9.9(Pfizer, J&J, Roche, Norvartis, Merck, GSK, SanofiAventis,
Abbott Labs, AstraZeneca, Amgen, BMS and Eli Lilly)
Source: Bloomberg 9/6/11
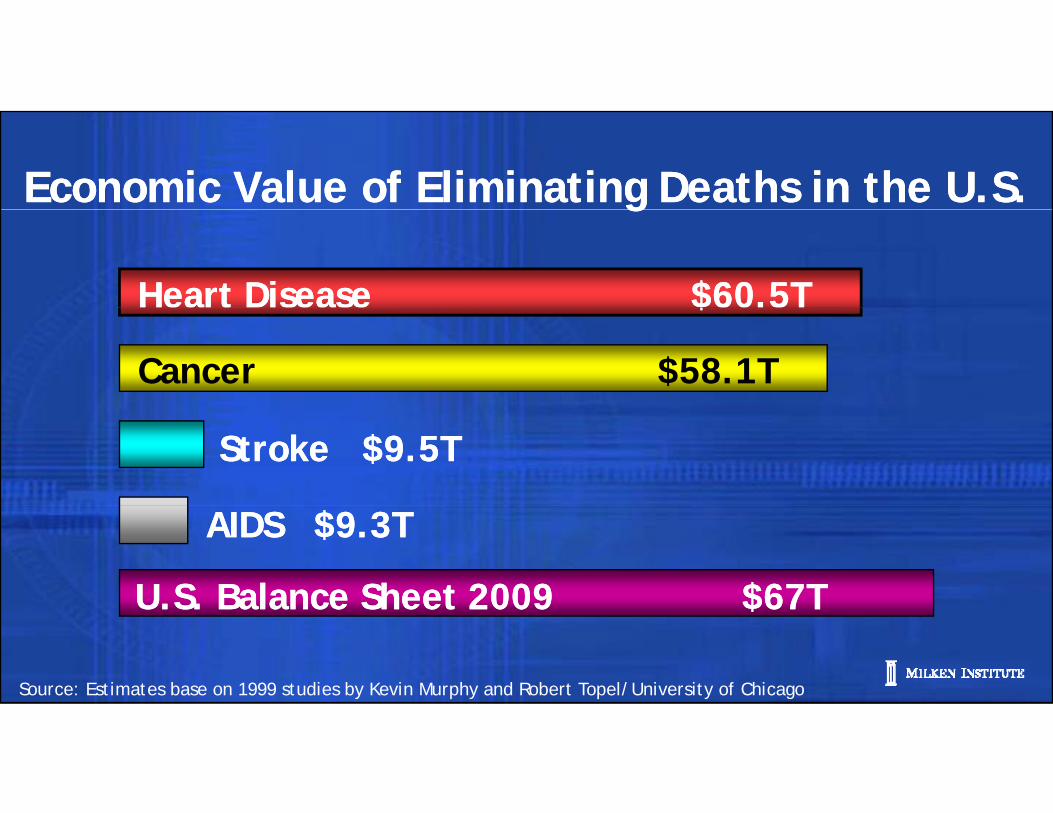
Economic Value of Eliminating Deaths in the U.S.Economic Value of Eliminating Deaths in the U.S.gg
Heart Disease $60.5THeart Disease $60.5T$ .$ .
Cancer $58.1T
Stroke $9.5TStroke $9.5T
AIDS $9.3TAIDS $9.3T
U.S. Balance Sheet 2009 $67TU.S. Balance Sheet 2009 $67T
Source: Estimates base on 1999 studies by Kevin Murphy and Robert Topel/University of Chicago
U.S. Balance Sheet 2009 $67TU.S. Balance Sheet 2009 $67T
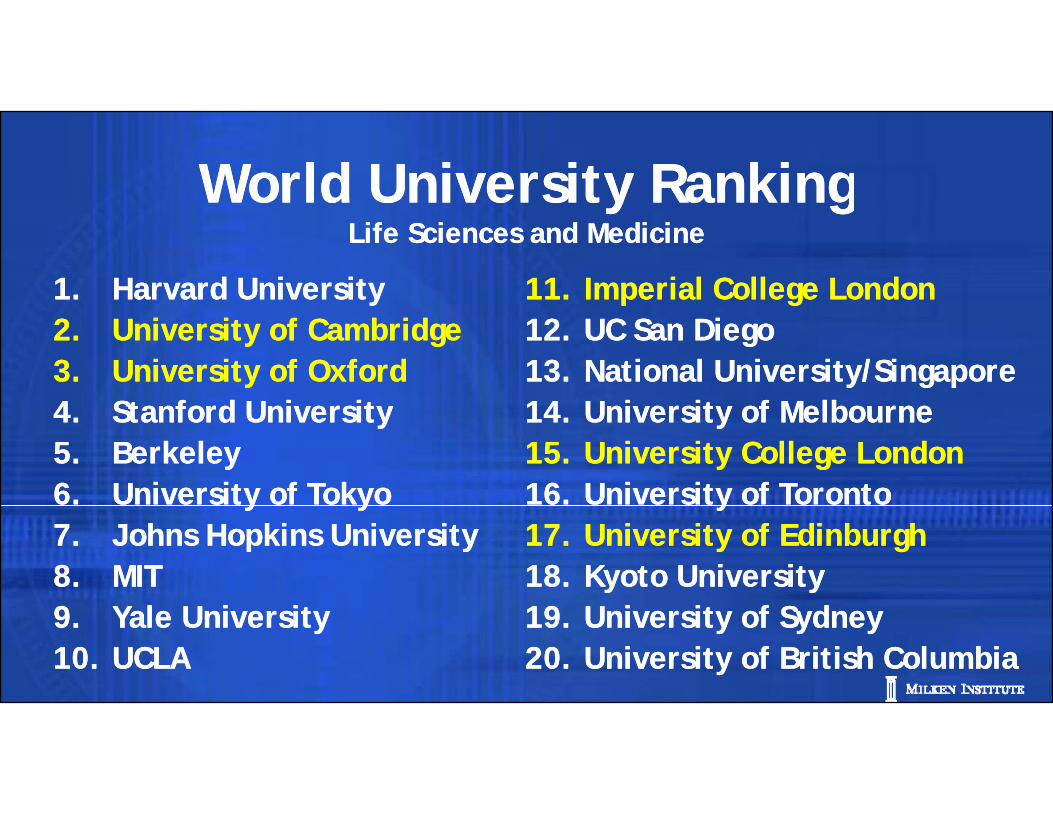
World University RankingWorld University Ranking
1. Harvard University1. Harvard University
y gLife Sciences and Medicine
y gLife Sciences and Medicine
11. Imperial College London11. Imperial College London2. University of Cambridge3. University of Oxford4 Stanford University
2. University of Cambridge3. University of Oxford4 Stanford University
12. UC San Diego13. National University/Singapore14 University of Melbourne
12. UC San Diego13. National University/Singapore14 University of Melbourne4. Stanford University
5. Berkeley6. University of Tokyo
4. Stanford University5. Berkeley6. University of Tokyo
14. University of Melbourne15. University College London16. University of Toronto
14. University of Melbourne15. University College London16. University of Torontoy y
7. Johns Hopkins University8. MIT
y y7. Johns Hopkins University8. MIT
y17. University of Edinburgh18. Kyoto University
y17. University of Edinburgh18. Kyoto University
9. Yale University10. UCLA9. Yale University10. UCLA
19. University of Sydney20. University of British Columbia19. University of Sydney20. University of British Columbia

Do we have the will?Do we have the will?•• EnergyEnergyDo we have the will?Do we have the will?
•• HousingHousing•• EntitlementsEntitlements•• EntitlementsEntitlements•• EducationEducation•• ImmigrationImmigration•• HealthHealth
wheressputnik.comwheressputnik.com
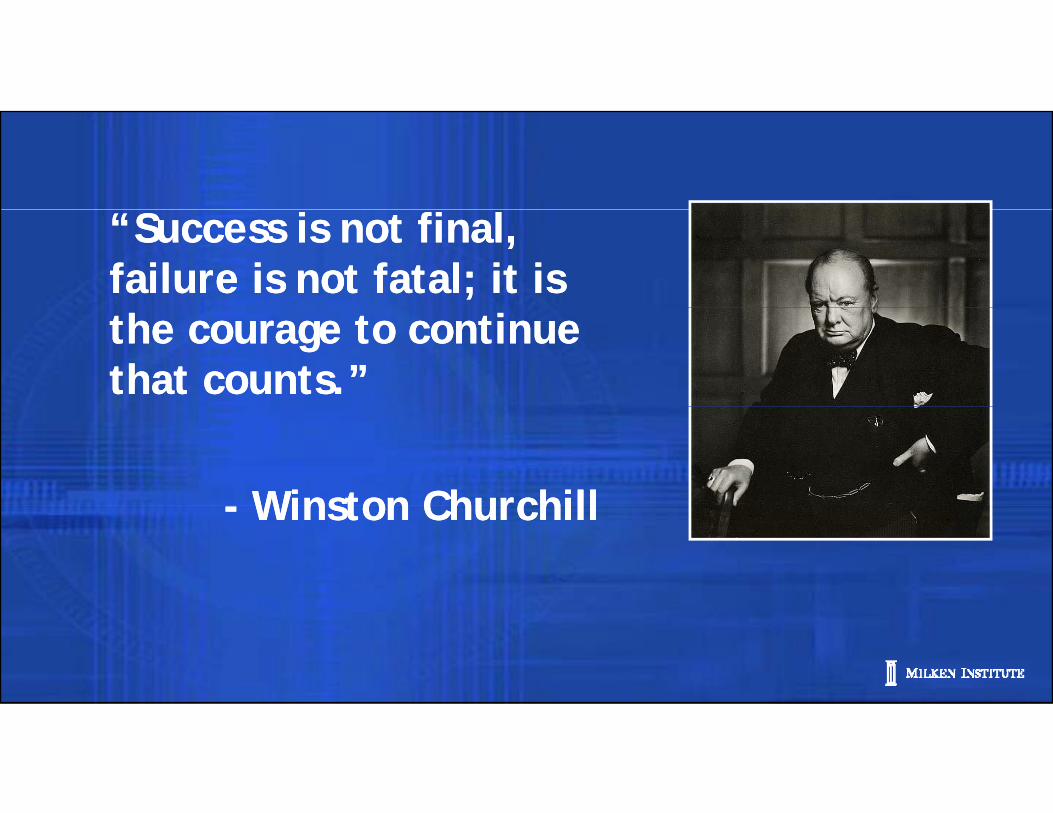
“Success is not final, failure is not fatal; it is “Success is not final, failure is not fatal; it is the courage to continue that counts.”the courage to continue that counts.”
- Winston Churchill- Winston Churchill- Winston Churchill- Winston Churchill
Leadership in Turbulent TimesLeadership in Turbulent TimesLeadership in Turbulent TimesLeadership in Turbulent Times
Milken Institute Summit - LondonHeron Tower
Milken Institute Summit - LondonHeron TowerHeron Tower
October 18, 2011Heron Tower
October 18, 2011
Michael MilkenChairman, The Milken Institute
Michael MilkenChairman, The Milken Institute,,