leadership in life insurance - prudential plc/media/files/p/prudential...icici prudential bajaj...
TRANSCRIPT
Leadership in life insurance
April 2008
2
Agenda
Indian life insurance opportunity
Organisational overview
Performance highlights
3
Agenda
Indian life insurance opportunity
Organisational overview
Performance highlights
4
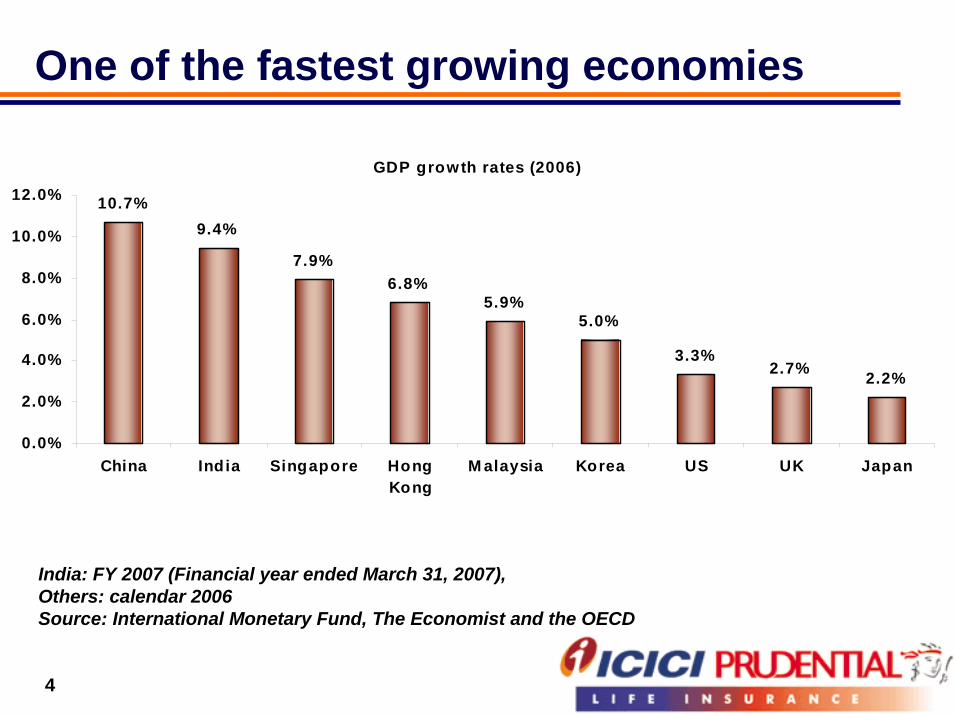
One of the fastest growing economies
GDP growth rates (2006)
10.7%9.4%
7.9%6.8%
5.9%5.0%
3.3%2.7% 2.2%
0.0%
2.0%
4.0%
6.0%
8.0%
10.0%
12.0%
China India Singapore HongKong
M alaysia Korea US UK Japan
India: FY 2007 (Financial year ended March 31, 2007), Others: calendar 2006Source: International Monetary Fund, The Economist and the OECD
5
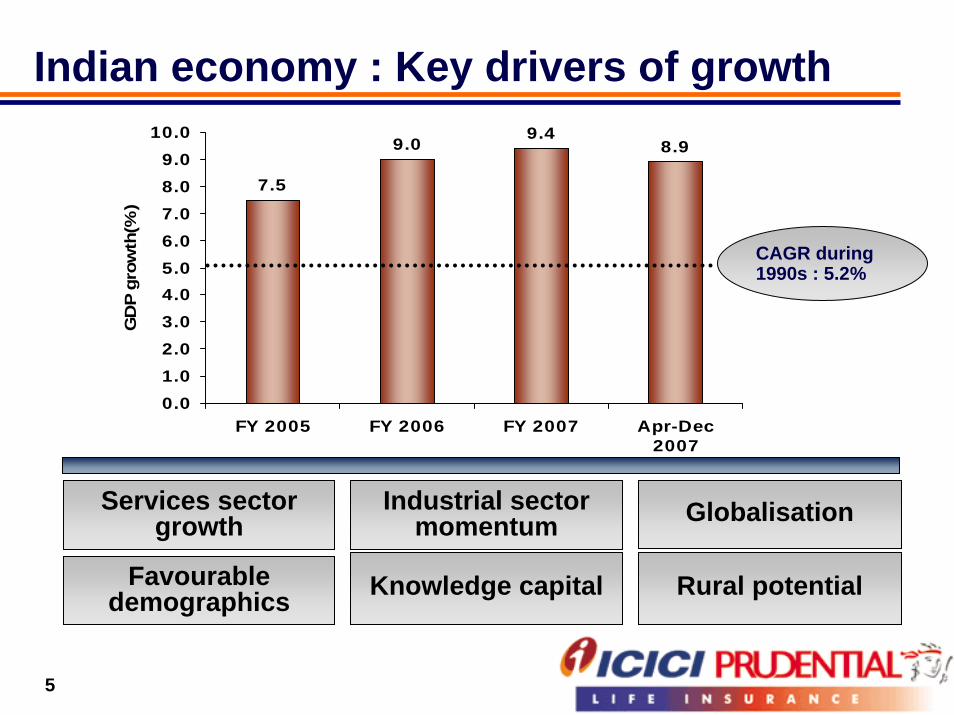
7.5
9.0 9.48.9
0.01.02.03.04.05.06.07.08.09.0
10.0
FY 2005 FY 2006 FY 2007 Apr-Dec2007
GD
P gr
owth
(%)
CAGR during 1990s : 5.2%
Indian economy : Key drivers of growth
Services sector growth
Industrial sector momentum Globalisation
Favourabledemographics Knowledge capital Rural potential
6
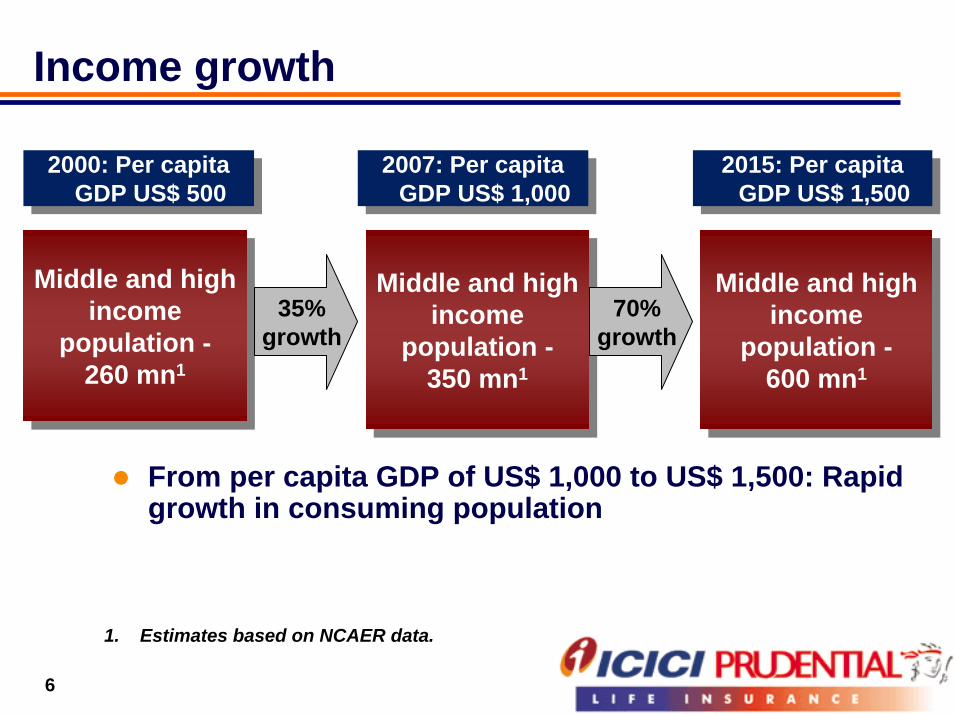
Income growth
2000: Per capita GDP US$ 500
2000: Per capita GDP US$ 500
2007: Per capita GDP US$ 1,000
2007: Per capita GDP US$ 1,000
2015: Per capita GDP US$ 1,500
2015: Per capita GDP US$ 1,500
Middle and high income
population -260 mn1
Middle and high income
population -260 mn1
Middle and high income
population -350 mn1
Middle and high income
population -350 mn1
Middle and high income
population -600 mn1
35% growth
70% growth
Middle and high income
population -600 mn1
From per capita GDP of US$ 1,000 to US$ 1,500: Rapid growth in consuming population
1. Estimates based on NCAER data.
7
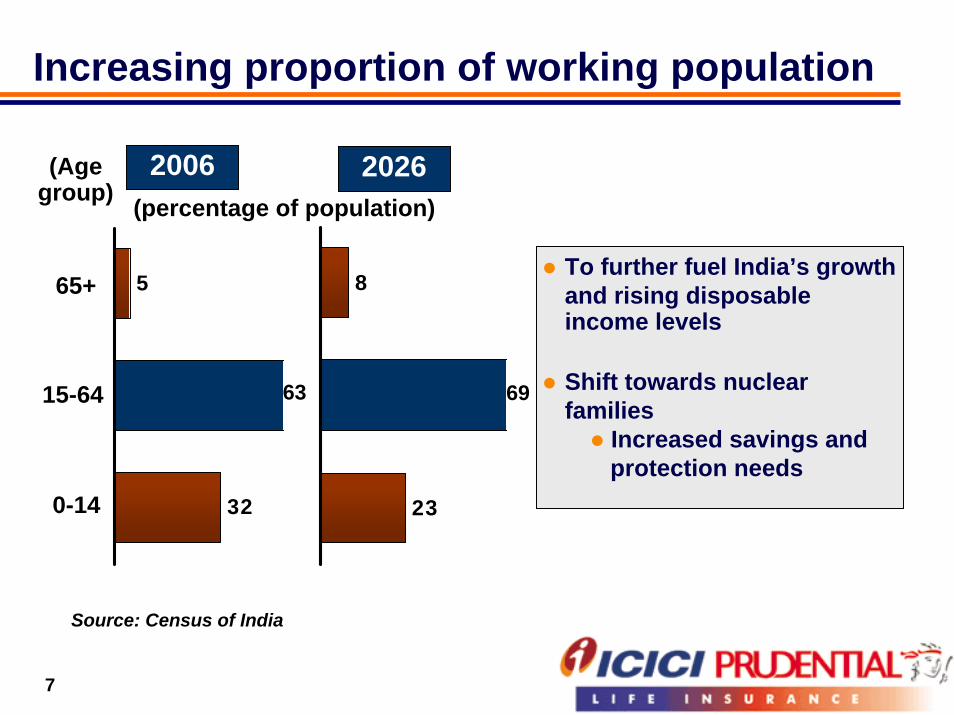
Increasing proportion of working population
2006 2026(Age group)
To further fuel India’s growth and rising disposable income levels
Shift towards nuclear families
Increased savings and protection needs
(percentage of population)
5
32
8
23
6963
65+
15-64
0-14
Source: Census of India
8
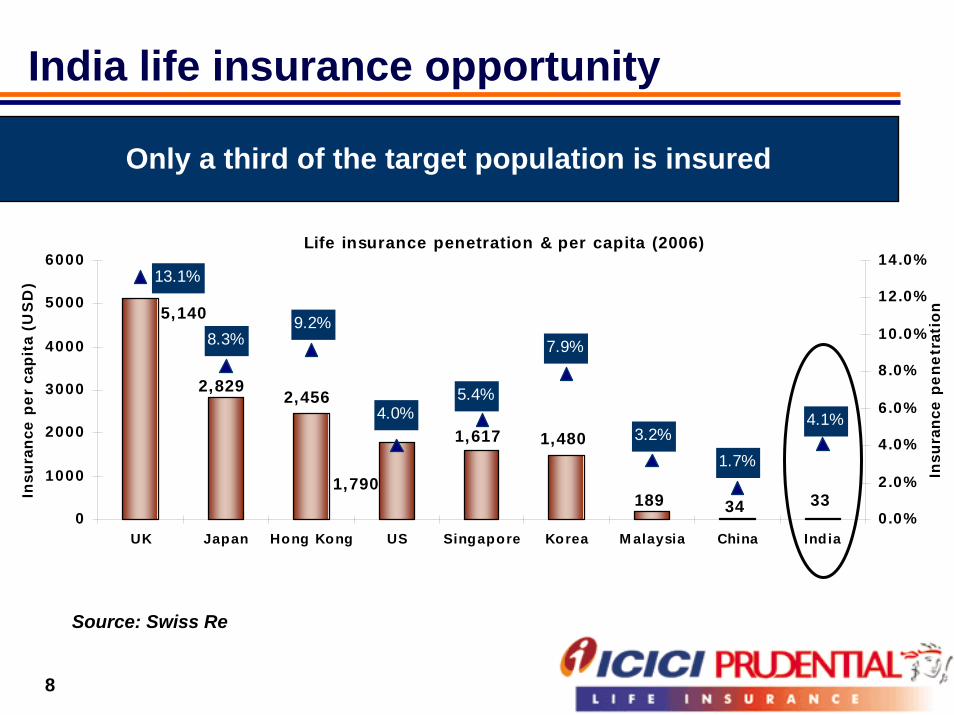
India life insurance opportunity
Only a third of the target population is insured
Life insurance penetration & per capita (2006)
33
1,617
34189
1,480
1,790
2,4562,829
5,140
13.1%
4.1%
8.3%
4.0%
9.2%7.9%
3.2%1.7%
5.4%
0
1000
2000
3000
4000
5000
6000
UK Japan Hong Kong US Singapore Korea M alaysia China India
Insu
ranc
e pe
r ca
pita
(U
SD
)
0 .0%
2.0%
4.0%
6.0%
8.0%
10.0%
12.0%
14.0%
Insu
ranc
e pe
netr
atio
n
Source: Swiss Re
9
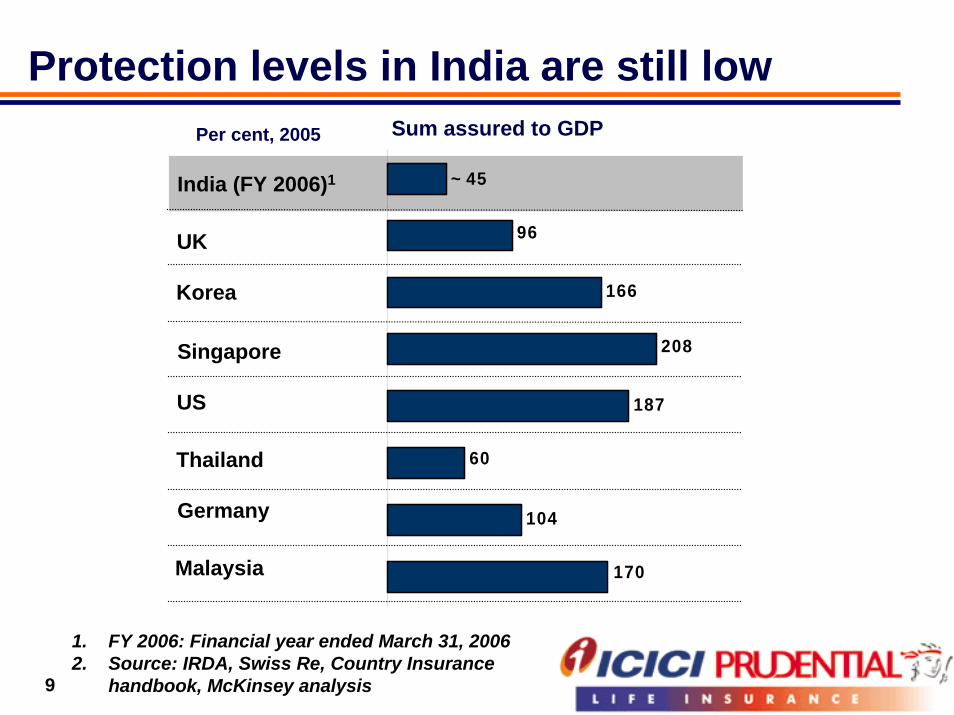
Protection levels in India are still low Sum assured to GDPPer cent, 2005
~ 45
166
96
208
187
60
104
170
India (FY 2006)1
UK
Korea
Singapore
US
Thailand
Germany
Malaysia
1. FY 2006: Financial year ended March 31, 20062. Source: IRDA, Swiss Re, Country Insurance
handbook, McKinsey analysis
10
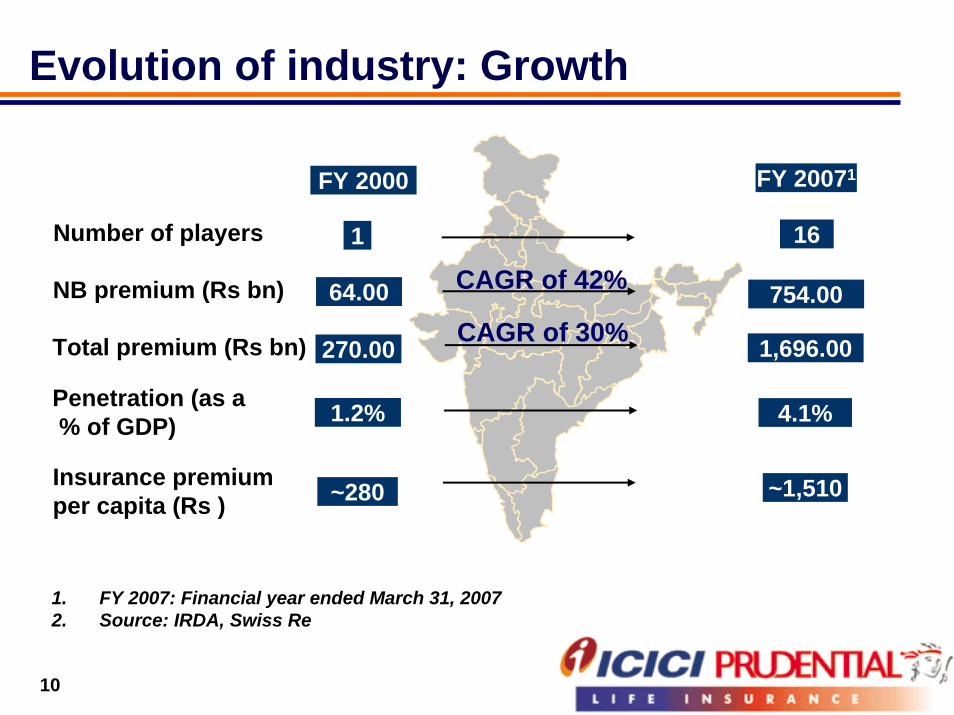
Evolution of industry: Growth
1. FY 2007: Financial year ended March 31, 20072. Source: IRDA, Swiss Re
Penetration (as a% of GDP)
Insurance premiumper capita (Rs )
Number of players
1.2%
~280
1
FY 2000
NB premium (Rs bn) 64.00
270.00
CAGR of 42%
CAGR of 30%
4.1%
16
FY 20071
754.00
~1,510
1,696.00Total premium (Rs bn)
11
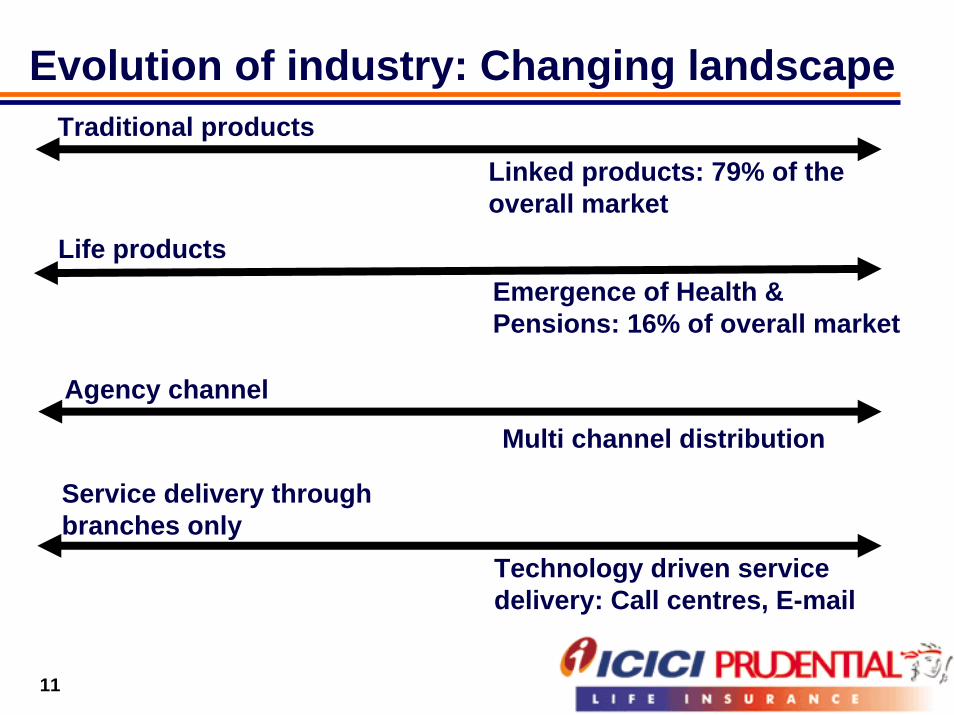
Evolution of industry: Changing landscapeTraditional products
Linked products: 79% of the overall market
Life productsEmergence of Health & Pensions: 16% of overall market
Agency channel
Multi channel distribution
Service delivery through branches only
Technology driven service delivery: Call centres, E-mail
12
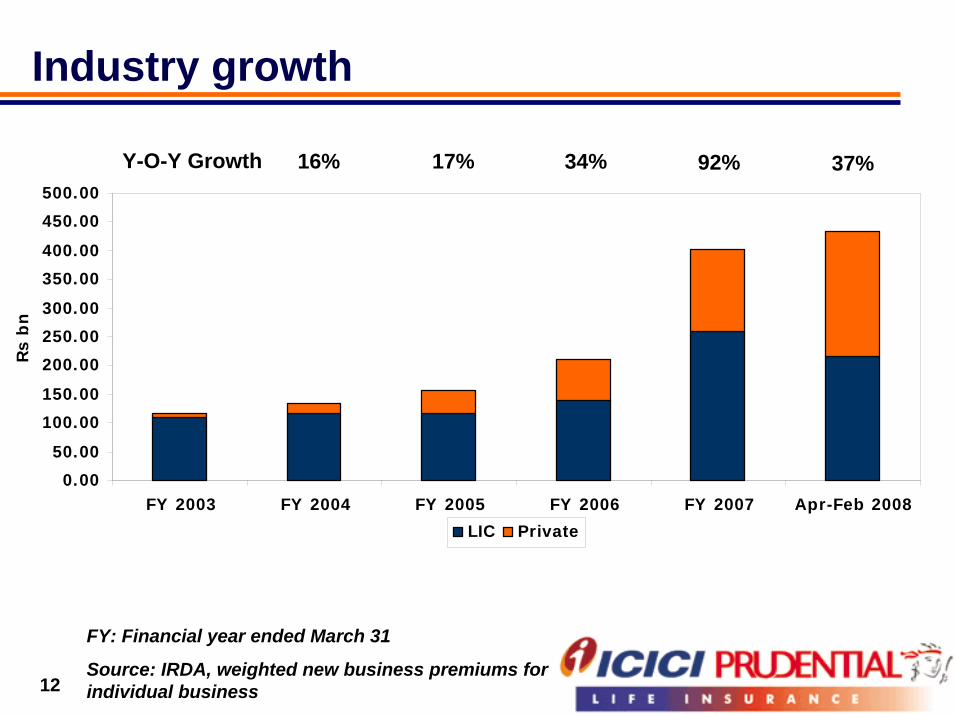
Industry growth
Y-O-Y Growth 16% 17% 34% 92% 37%
0.0050.00
100.00150.00
200.00250.00300.00
350.00400.00
450.00500.00
FY 2003 FY 2004 FY 2005 FY 2006 FY 2007 Apr-Feb 2008
Rs b
n
LIC Private
FY: Financial year ended March 31
Source: IRDA, weighted new business premiums for individual business
13
Agenda
Indian life insurance opportunity
Organisational overview
Performance highlights
14
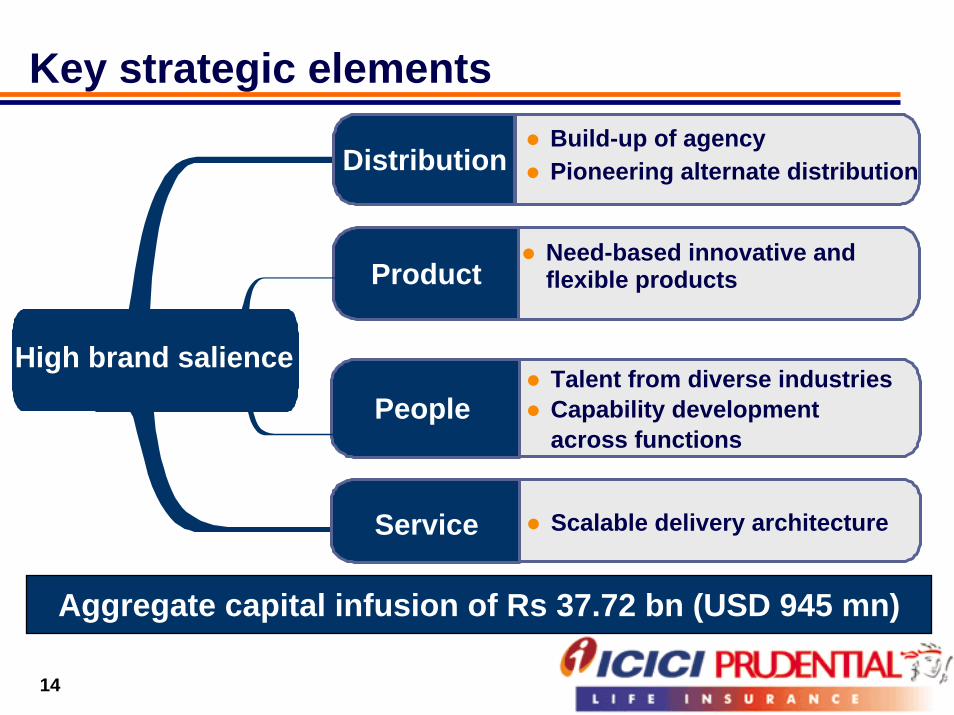
Key strategic elements
ProductNeed-based innovative and flexible products
Scalable delivery architecture
DistributionBuild-up of agencyPioneering alternate distribution
High brand salience
Service
PeopleTalent from diverse industriesCapability development across functions
Aggregate capital infusion of Rs 37.72 bn (USD 945 mn)

15
Sustained private market leadership
FY 2007
Apr-Feb 2008
FY 2003
FY 2004
FY 2005
FY 2006
1
2
3
4
5
FY: Financial year ended March 31
Based on weighted new business premiums for individual business
16
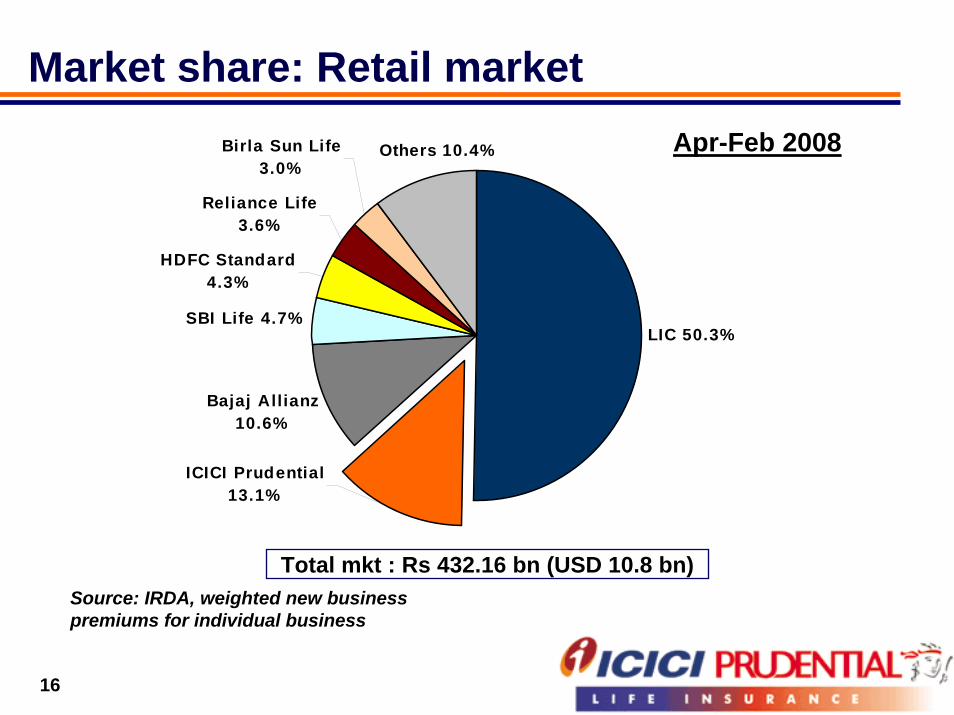
Market share: Retail market
LIC 50.3%
Bajaj Allianz 10.6%
SBI Life 4.7%
HDFC Standard 4.3%
Reliance Life 3.6%
Birla Sun Life 3.0%
ICICI Prudential 13.1%
Others 10.4% Apr-Feb 2008
Total mkt : Rs 432.16 bn (USD 10.8 bn)Source: IRDA, weighted new business premiums for individual business
17
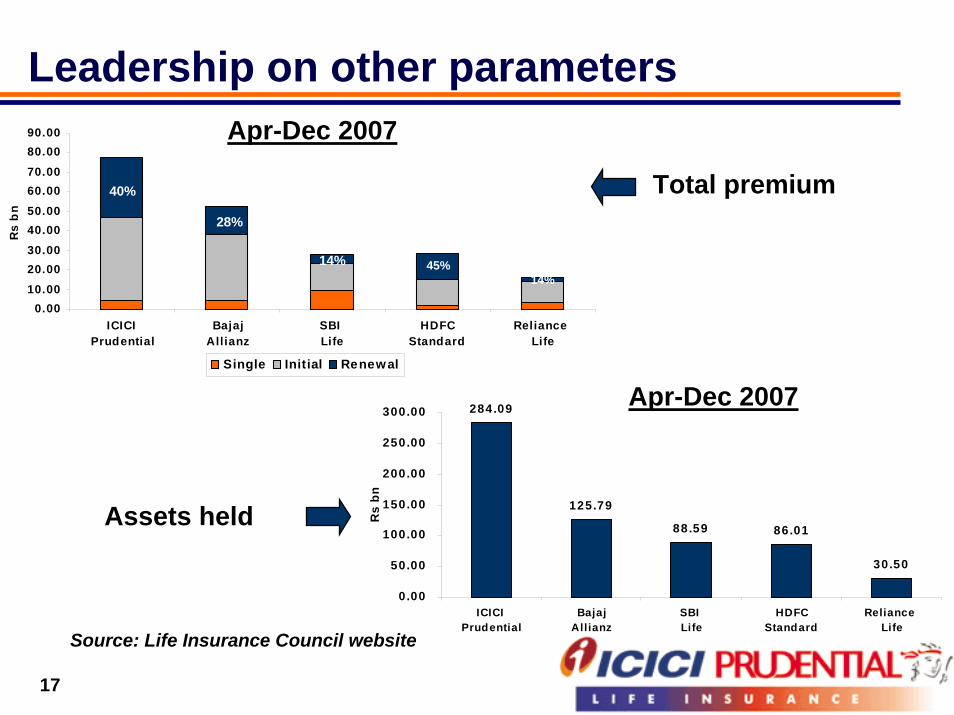
Leadership on other parameters
0.0010.0020.0030.0040.0050.0060.0070.0080.0090.00
ICICI Prudential
BajajAllianz
SBI Life
HDFCStandard
Reliance Life
Rs
bn
Single Initial Renewal
Source: Life Insurance Council website
Assets held
40%
28%
14% 45%
Total premium
Apr-Dec 2007
Apr-Dec 2007284.09
125.79
88.59 86.01
30.50
0.00
50.00
100.00
150.00
200.00
250.00
300.00
ICICI Prudential
BajajAllianz
SBI Life
HDFCStandard
Reliance Life
Rs
bn
14%
18
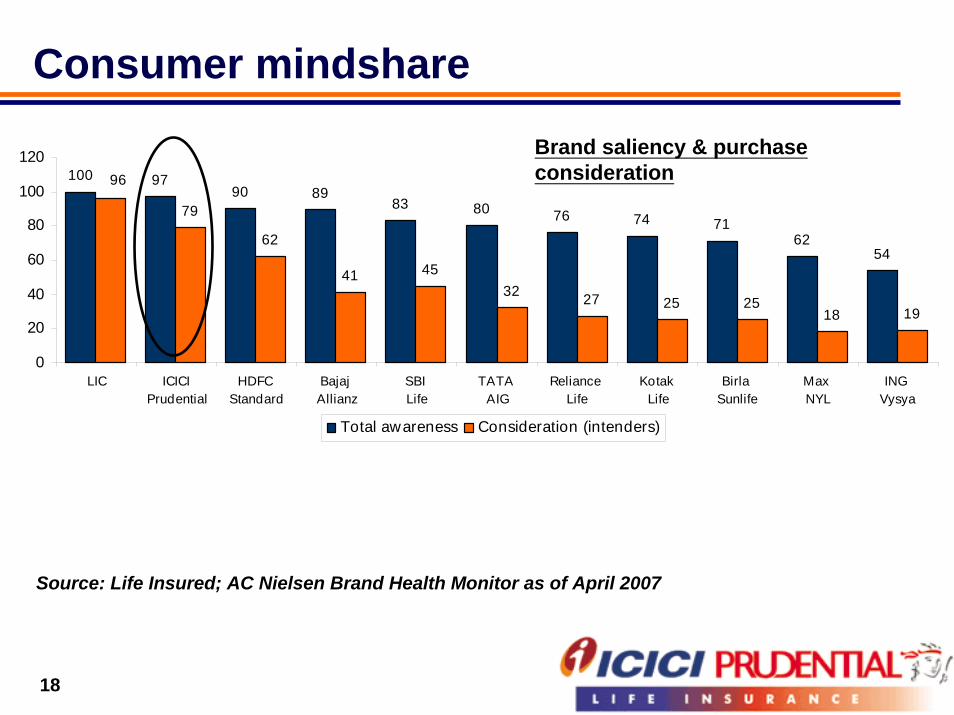
Consumer mindshare
100 9790 89
83 80 76 74 7162
54
79
62
41 4532 27 25 25
18 19
96
0
20
40
60
80
100
120
LIC ICICI Prudential
HDFC Standard
Bajaj Allianz
SBI Life
TATA AIG
Reliance Life
Kotak Life
Birla Sunlife
Max NYL
ING Vysya
Total awareness Consideration (intenders)
Brand saliency & purchase consideration
Source: Life Insured; AC Nielsen Brand Health Monitor as of April 2007
19
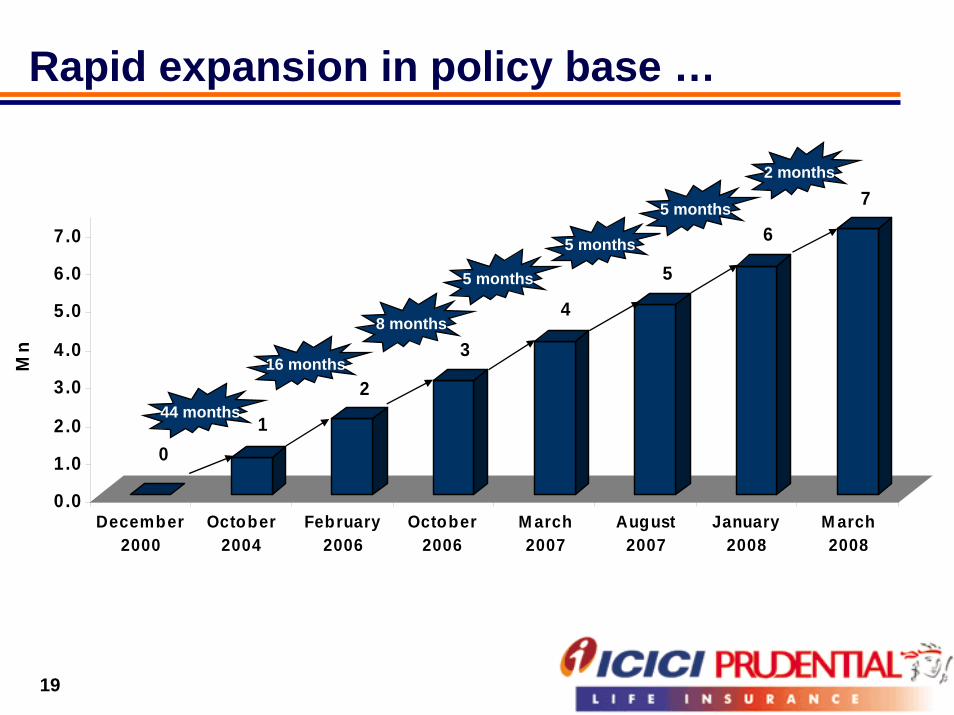
Rapid expansion in policy base …
01
2
3
4
5
6
7
0.0
1.0
2.0
3.0
4.0
5.0
6.0
7.0
Mn
December2000
October2004
February2006
October2006
M arch2007
August2007
January2008
M arch2008
16 months
8 months
44 months
5 months
5 months
5 months
2 months

20
… backed by market innovationContinued development of the market with new products and
services
Leading the evolution of unit linked productsIntroduction of LifeStage RP: Automatic asset allocation and increased protection
Focus on emerging segmentsHealth: Introduction of 9 health products, including innovative health product for diabeticsPensions: Emphasis on retirement planning backed by a comprehensive product suite
Health Link
Pensions Link
Health Link
21
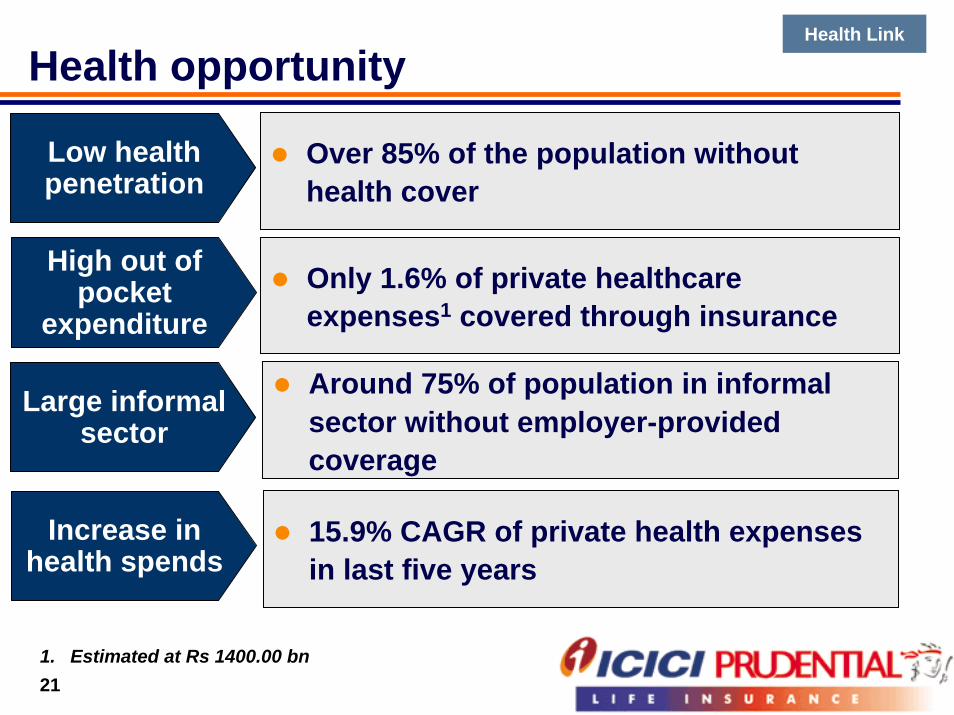
Health opportunity
Over 85% of the population without health cover
Low health penetration
Only 1.6% of private healthcare expenses1 covered through insurance
High out of pocket
expenditure
Around 75% of population in informal sector without employer-provided coverage
Large informal sector
15.9% CAGR of private health expenses in last five years
Increase in health spends
1. Estimated at Rs 1400.00 bn
22
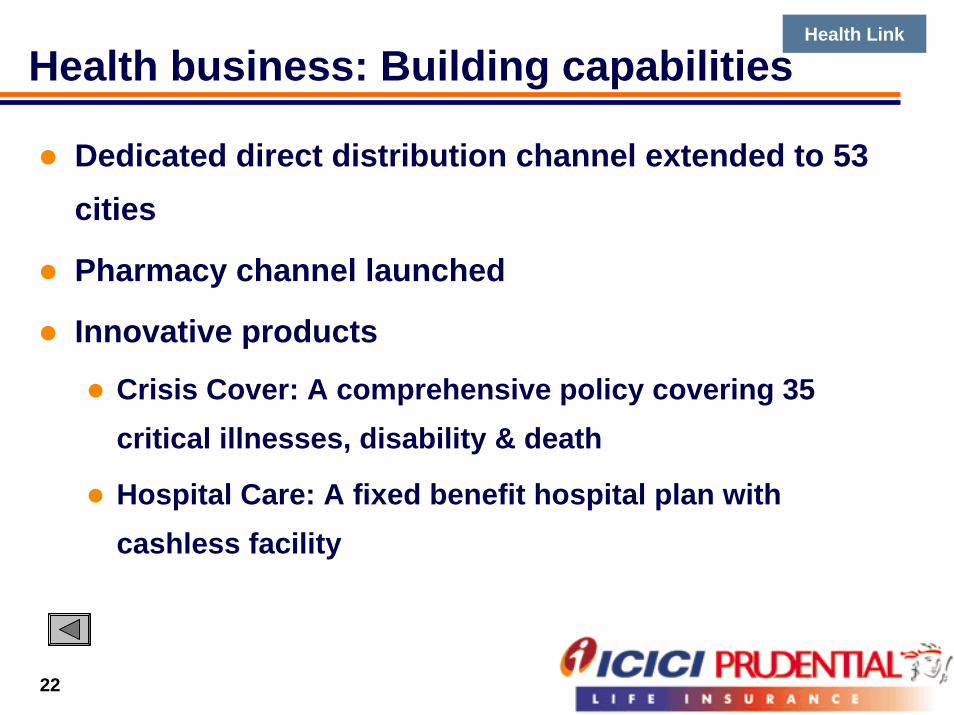
Health business: Building capabilitiesHealth Link
Dedicated direct distribution channel extended to 53 cities
Pharmacy channel launched
Innovative products
Crisis Cover: A comprehensive policy covering 35 critical illnesses, disability & death
Hospital Care: A fixed benefit hospital plan with cashless facility
23
… backed by market innovationContinued development of the market with new products and
services
Leading the evolution of unit linked productsIntroduction of LifeStage RP: Automatic asset allocation and increased protection
Focus on emerging segmentsHealth: Introduction of 9 health products, including innovative health product for diabeticsPensions: Emphasis on retirement planning backed by a comprehensive product suite
Health Link
Pensions Link
Pensions Link
24
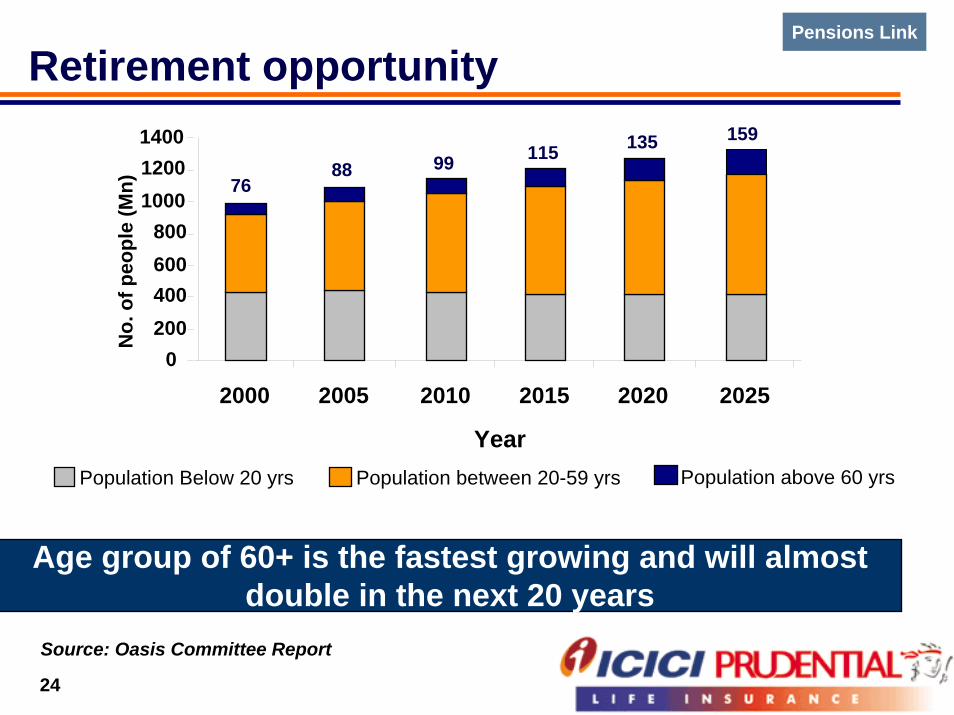
Retirement opportunity
0200400600800
100012001400
2000 2005 2010 2015 2020 2025
Year
No.
of p
eopl
e (M
n)
Population Below 20 yrs Population between 20-59 yrs Population above 60 yrs
7688 99 115 135 159
Age group of 60+ is the fastest growing and will almost double in the next 20 years
Source: Oasis Committee Report
Pensions Link
25
Comprehensive product offeringProducts for the accumulation phase
Advanced ULIP products with automatic asset allocationDifferent premium paying optionsRange of funds offered
Products for the payout phaseRange of annuity options
Life annuity, joint life annuity, annuity with return of purchase priceAnnuity guaranteed for 5, 10, 15 years
Launch of Annuity Card First of its kind debit card in Asia for annuitants
Philosophy: Different customers, different needs
Pensions Link
26
Retirement solutions campaignRetirement solutions: Key focus area of the company in brand communication
Commenced with ‘Retire from work, not life’ campaign
Retirement planning weaved into the recent corporate campaign ‘Jeetey Raho’
New campaign: ‘Plan your NUMBER with us’To enhance action orientation of consumers in planning for retirement
27
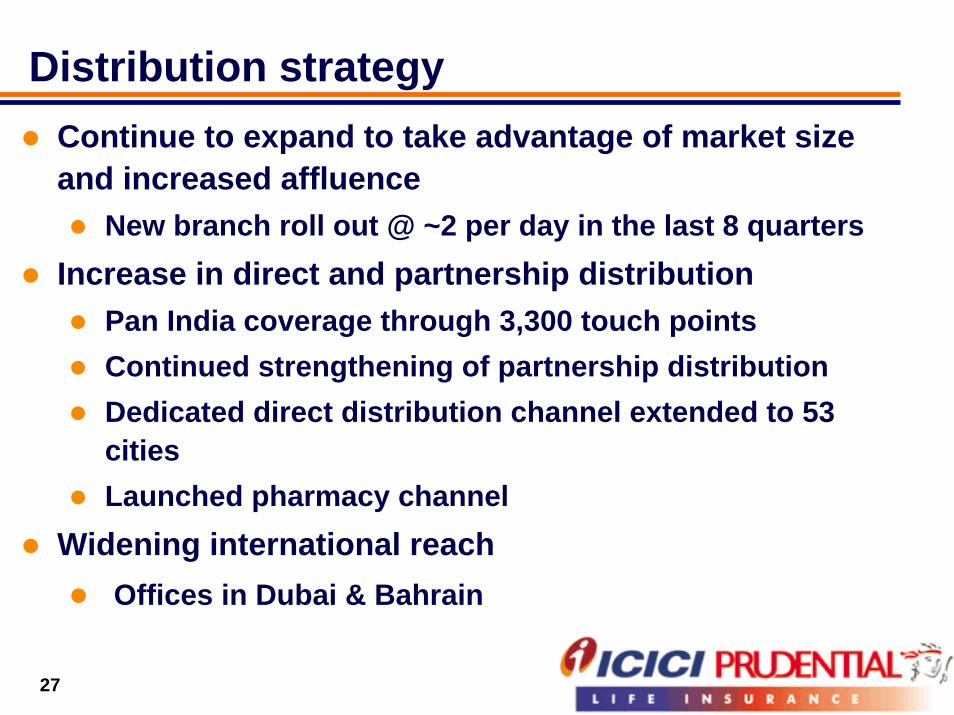
Distribution strategyContinue to expand to take advantage of market size and increased affluence
New branch roll out @ ~2 per day in the last 8 quartersIncrease in direct and partnership distribution
Pan India coverage through 3,300 touch pointsContinued strengthening of partnership distribution Dedicated direct distribution channel extended to 53 citiesLaunched pharmacy channel
Widening international reachOffices in Dubai & Bahrain
28
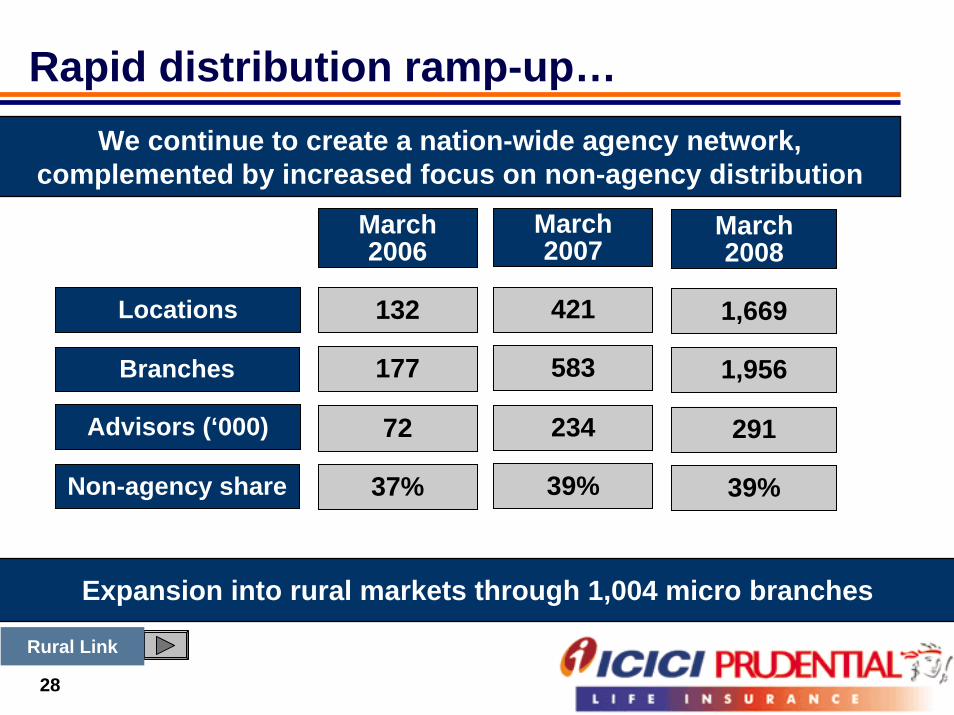
Rapid distribution ramp-up…We continue to create a nation-wide agency network,
complemented by increased focus on non-agency distribution
March 2007
March 2006
March 2008
421Locations 132 1,669
583177Branches 1,956
Advisors (‘000) 23472 291
39%37%Non-agency share 39%
Expansion into rural markets through 1,004 micro branches
Rural Link
Rural Link
29
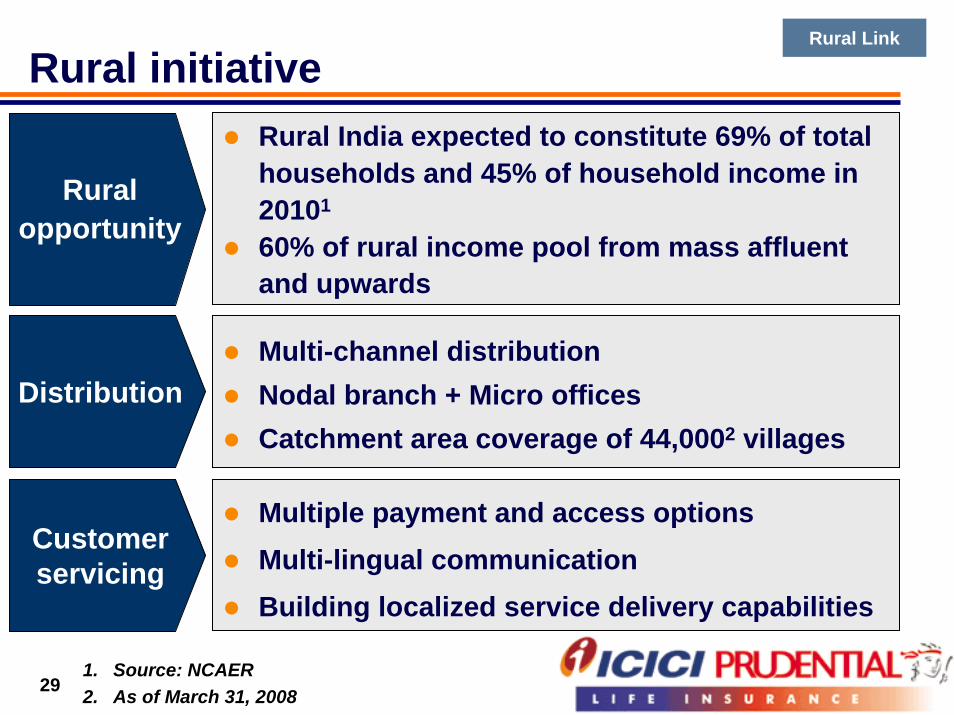
Rural initiativeRural India expected to constitute 69% of total households and 45% of household income in 20101
60% of rural income pool from mass affluent and upwards
Ruralopportunity
Multi-channel distributionNodal branch + Micro officesCatchment area coverage of 44,0002 villages
Distribution
Multiple payment and access options Multi-lingual communicationBuilding localized service delivery capabilities
Customer servicing
1. Source: NCAER2. As of March 31, 2008
30
Rural Link
31
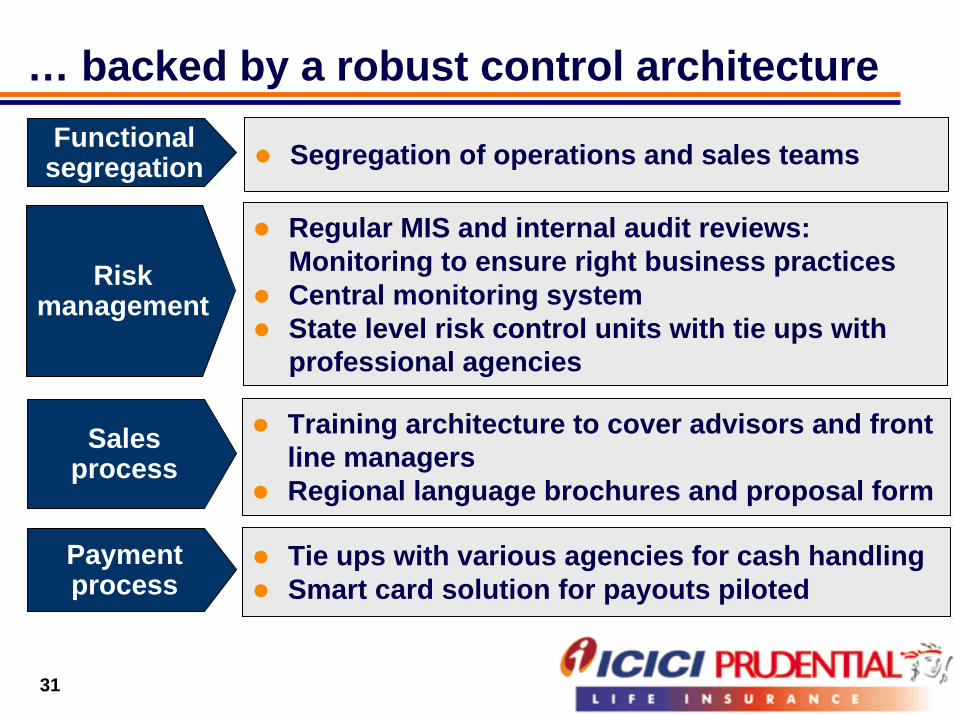
… backed by a robust control architecture
Segregation of operations and sales teamsFunctional segregation
Regular MIS and internal audit reviews: Monitoring to ensure right business practicesCentral monitoring systemState level risk control units with tie ups with professional agencies
Risk management
Training architecture to cover advisors and front line managersRegional language brochures and proposal form
Sales process
Tie ups with various agencies for cash handlingSmart card solution for payouts piloted
Payment process
32
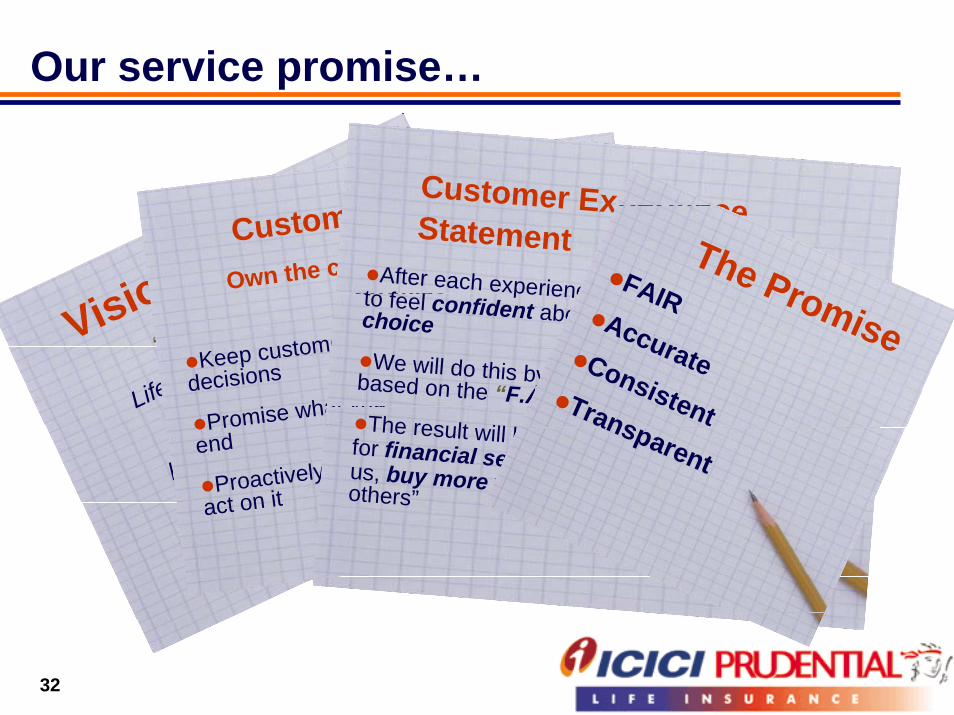
Our service promise…
Vision Statement
“To be the dominant
Life, Health & Pensions player
built on trust
by world class people & service”
Customer First Value
Own the customer; deliver the
promise
Keep customer interest at the center of all
decisions
Promise what you can, deliver it to the
end
Proactively seek voice of customer and
act on it
Customer Experience StatementAfter each experience, we want our customers to feel confident about having made the right choice
We will do this by ensuring all our dealings are based on the “F.A.C.T.” principle.The result will be that we are their first choicefor financial security so that they will stay with us, buy more from us & recommend us to others”
The PromiseFAIR AccurateConsistentTransparent
33
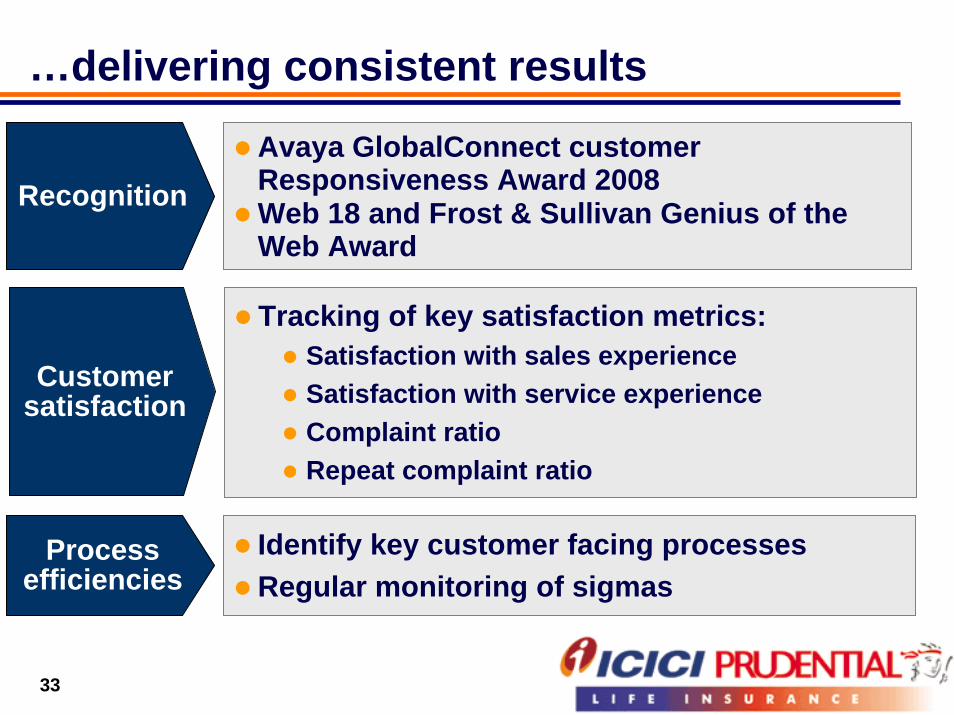
…delivering consistent results
RecognitionAvaya GlobalConnect customer Responsiveness Award 2008Web 18 and Frost & Sullivan Genius of the Web Award
Customer satisfaction
Tracking of key satisfaction metrics:Satisfaction with sales experienceSatisfaction with service experienceComplaint ratioRepeat complaint ratio
Process efficiencies
Identify key customer facing processesRegular monitoring of sigmas
34
Agenda
Indian life insurance opportunity
Organisational overview
Performance highlights
35
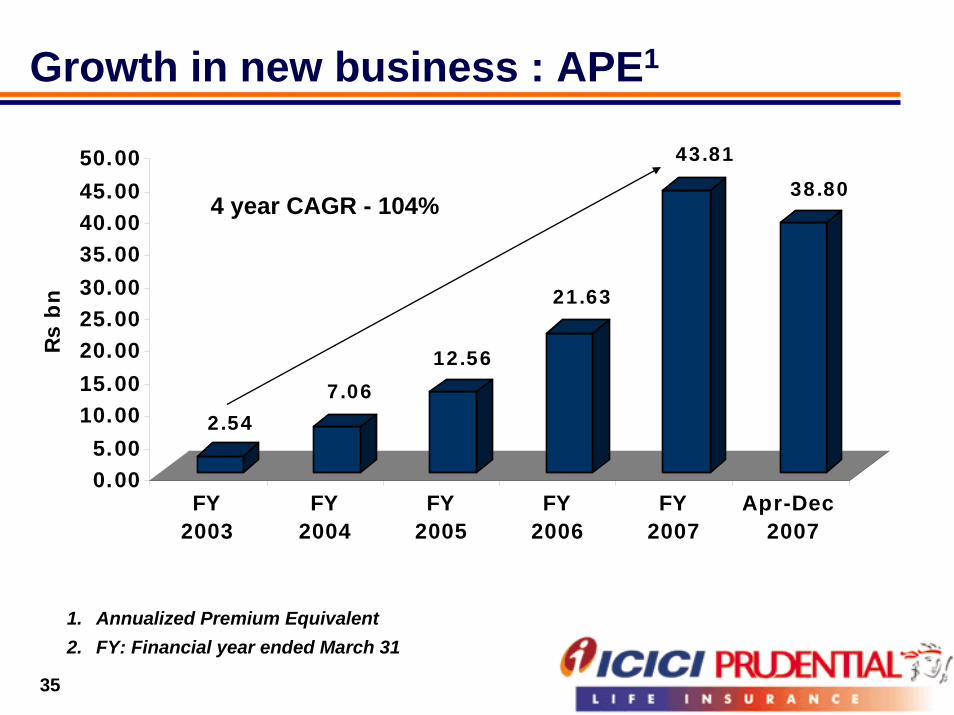
Growth in new business : APE1
2.547.06
12.56
21.63
43.81
38.80
0.005.00
10.0015.0020.0025.0030.0035.0040.0045.0050.00
Rs b
n
FY2003
FY2004
FY2005
FY2006
FY2007
Apr-Dec 2007
4 year CAGR - 104%
1. Annualized Premium Equivalent2. FY: Financial year ended March 31
36
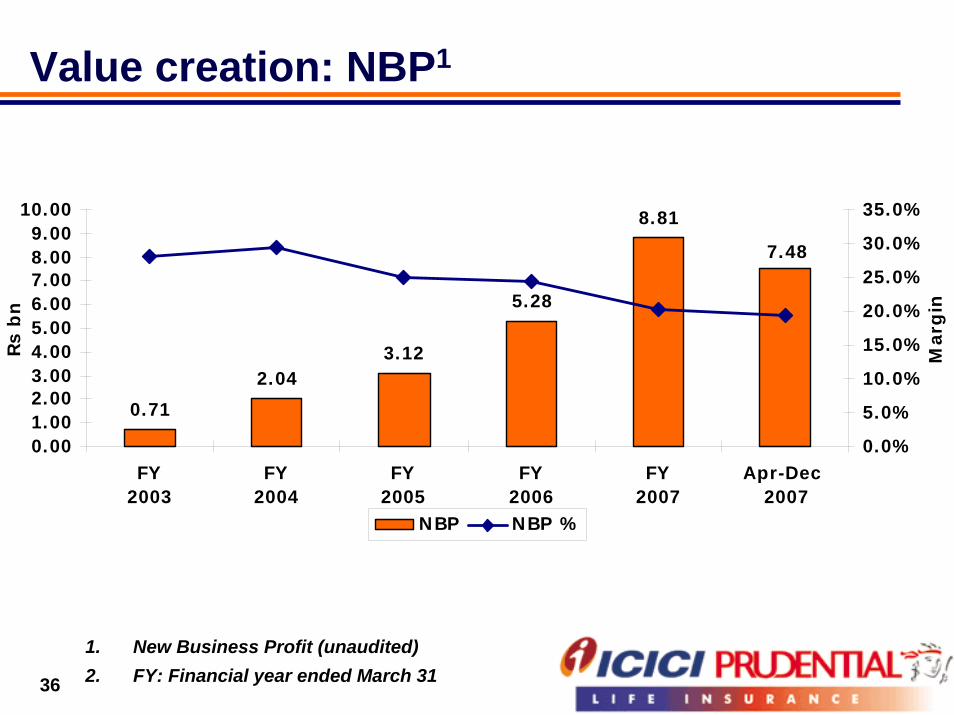
Value creation: NBP1
0.712.04
3.12
5.28
8.81
7.48
0.001.002.003.004.005.006.007.008.009.00
10.00
FY2003
FY2004
FY2005
FY2006
FY2007
Apr-Dec 2007
Rs b
n
0.0%
5.0%
10.0%
15.0%
20.0%
25.0%
30.0%
35.0%
Mar
gin
NBP NBP %
1. New Business Profit (unaudited)2. FY: Financial year ended March 31
37
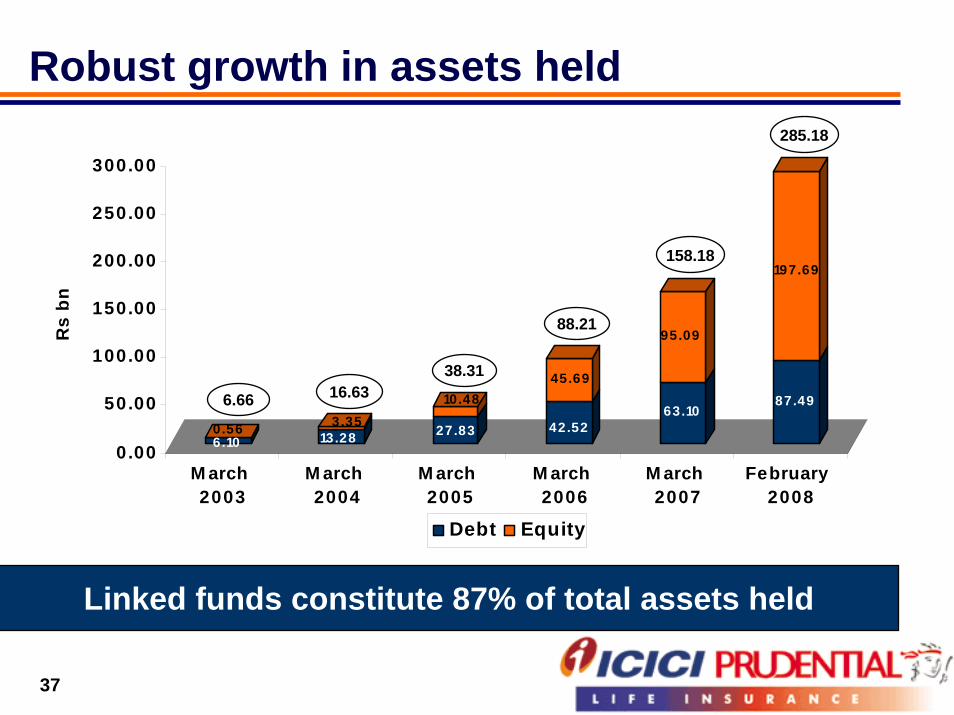
Robust growth in assets held
6.100.56 13.28
3.35 27.83
10.48
42.52
45.69
63.10
95.09
87.49
197.69
0.00
50.00
100.00
150.00
200.00
250.00
300.00
Rs
bn
M arch 2003
M arch 2004
M arch 2005
M arch 2006
M arch 2007
February 2008
Debt Equity
Linked funds constitute 87% of total assets held
6.66 16.6338.31
88.21
158.18
285.18
38
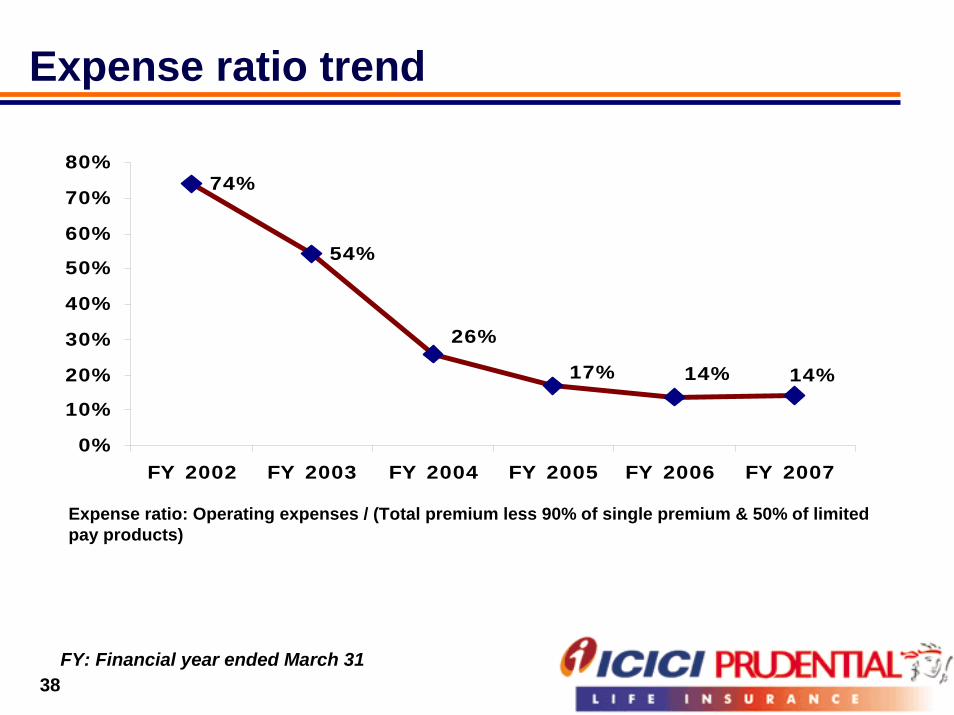
Expense ratio trend
Expense ratio: Operating expenses / (Total premium less 90% of single premium & 50% of limited pay products)
74%
54%
14%14%
26%
17%
0%
10%
20%
30%
40%
50%
60%
70%
80%
FY 2002 FY 2003 FY 2004 FY 2005 FY 2006 FY 2007
FY: Financial year ended March 31

39
Summary of key achievements
Sustained private market leadership: 7 years in a row
More than 7 million policies sold
Over Rs 280.00 bn (USD 7.0 bn) of assets held
Awarded most respected private life insurer
Fitch rating of ‘AAA (Ind)’
NBP of Rs 7.48 bn (USD 189.9 mn) in Apr-Dec 2007
Total premiums of Rs 77.58 bn (USD 2.0 bn) in Apr-Dec 2007
40
Safe harbourExcept for the historical information contained herein, statements in this release which contain words or phrases such as 'will', 'would', ‘indicating’, ‘expected to’ etc., and similar expressions or variations of such expressions may constitute 'forward-looking statements'. These forward-looking statements involve a number of risks, uncertainties and other factors that could cause actual results to differ materially from those suggested by the forward-looking statements. These risks and uncertainties include, but are not limited to our ability to successfully implement our strategy, our growth and expansion in business, the impact of any acquisitions, technological implementation and changes, the actual growth in demand for insurance products and services, investment income, cash flow projections, our exposure to market risks, policies and actions of regulatory authorities; impact of competition; experience with regard to mortality and morbidity trends, lapse rates and policy renewal rates; the impact of changes in capital , solvency or accounting standards , tax and other legislations and regulations in the jurisdictions as well as other risks detailed in the reports filed by ICICI Bank Limited, our holding company, with the United States Securities and Exchange Commission. ICICI Bank and we undertake no obligation to update forward-looking statements to reflect events or circumstances after the date thereof.