leadership in education : a field test of hersey and
TRANSCRIPT

University of Massachusetts Amherst University of Massachusetts Amherst
ScholarWorks@UMass Amherst ScholarWorks@UMass Amherst
Doctoral Dissertations 1896 - February 2014
1-1-1978
Leadership in education : a field test of Hersey and Blanchard's Leadership in education : a field test of Hersey and Blanchard's
situational leadership theory. situational leadership theory.
John D. W. Beck University of Massachusetts Amherst
Follow this and additional works at: https://scholarworks.umass.edu/dissertations_1
Recommended Citation Recommended Citation Beck, John D. W., "Leadership in education : a field test of Hersey and Blanchard's situational leadership theory." (1978). Doctoral Dissertations 1896 - February 2014. 3367. https://scholarworks.umass.edu/dissertations_1/3367
This Open Access Dissertation is brought to you for free and open access by ScholarWorks@UMass Amherst. It has been accepted for inclusion in Doctoral Dissertations 1896 - February 2014 by an authorized administrator of ScholarWorks@UMass Amherst. For more information, please contact [email protected].

LEADERSHIP IN EDUCATION: A FIELD TEST OF
MERSEY AND BLANCHARD'S SITUATIONAL
LEADERSHIP THEORY
A Dissertation Presented
By
JOHN DAVID WEIL BECK
Submitted to the Graduate School of theUniversity of Massachusetts in partial fulfillment
of the requirements for the degree of
DOCTOR OF EDUCATION
May 1978
Education
(c) John David Weil Beck
All Rights Reserved
1978
LEADERSHIP IN EDUCATION: A FIELD TEST OF
HERSEY AND BLANCHARD'S SITUATIONAL
LEADERSHIP THEORY
iii
A Dissertation Presented
By
JOHN DAVID WEIL BECK
Approved as to style and content by
h‘ nJ.[.
Kenneth H. Blanchard, Chairperson
l)ouglas R. Forsyth, Member
^771/ /t i'
c
Fi/ederic E . Finch, Member
7Mario FantLhi, DeanSchool of Education
iv
ACKNOWLEDGEMENTSThe researcher wishes to express his gratitude to
the following people whose support and guidance were
critical to the completion of this study; Frederic E.
Finch, Douglas R. Forsyth, Ronald K. Hambleton, Kenneth
H. Blanchard, D. Anthony Butterfield, Janice Gifford,
Roger James, Jackie Bearce, and Bernie McDonald. A
special appreciation is also extended to all the princi-
pals and teachers who participated in the research.
V
ABSTRACT
Leadership in Education; A Field Test ofHersey and Blanchard's Situational
Leadership Theory
May 1978
John David Weil Beck, B.A., Dartmouth College
M.Ed., University of MassachusettsEd.D., University of Massachusetts
Directed by: Professor Kenneth H. Blanchard
Purpose
The purpose of this study was to test the basic
premise of Situational Leadership Theory (SLT),that
leader effectiveness results from the adaptation of
leadership style to follower task-relevant maturity. The
general hypothesis was:
Principal effectiveness is positivelycorrelated with the congruency betweenprincipal leadership style and teachertask-relevant maturity.
Fourteen specific null hypotheses were stated, seven for
task-relevant maturity from principals' perspective and
seven for task-relevant maturity from teachers' perspec-
tive. It was hypothesized that, at each level of maturity,
no significant difference in effectiveness would result
from principals' use of the four leadership styles. The
rejection level for the null hypotheses was established
at .05.
vi
Methodology
To test the null hypotheses, a field test was de-
signed with twenty-one elementary school principals and
eighty- five of their teachers. Each teacher used the Job
Responsibilities Form to choose five responsibilities
about which the data were collected. The Maturity Scale
was used to obtain measures of teachers' task-relevant
maturity from principals' perspective and from teachers'
perspective. The Leadership Style and Effectiveness Form
was used to measure principals' leadership style, teachers'
performance and satisfaction, and principals' effective-
ness from teachers' perspective. The Leadership Style and
Performance Form was used to measure teachers' performance
from principals' perspective (this form also measured
principals' leadership style from principals'perspective,
but those data were not used in this study)
.
Results
Due to insufficient data, six of the fourteen hy-
potheses were not tested. Of the eight that were tested,
six were accepted in the null form and two were rejected.
The accepted hypotheses and one of the rejected hypotheses
contradicted SLT. The other rejected hypothesis partially
validated SLT. In summary, there was only one instance
when matches between leadership style and task-relevant
maturity correlated with leader effectiveness.
vii
Conclusions
There were strong indications that the Maturity
Scale did not discriminate levels of task-relevant ma-
turity accurately. There were also questions about the
instruments which measured leadership style and effec-
tiveness, the data collection procedure, and the popu-
lation. Based on these methodological considerations,
it was not possible to make a definitive statement about
the validity of SLT.
Nevertheless, some conclusions were possible. One
was that Styles 2, 3, and 4 were all effective with some
teachers in some situations. Another was that there was
a tendency, though not significant, for S2 to be per-
ceived as the most effective style regardless of maturity
level. A third was that the high relationship styles (S2
and S3) were perceived to be significantly more effective
than the low relationship styles (SI and S4) regardless
of task-relevant maturity.
These conclusions reaffirmed the need to conduct
further research with theories of situational leadership,
to address the methodological issues regarding measure-
ment of maturity, leadership style, and effectivness ,and
to use the results of research to develop improved theories.
In addition to these conclusions, two recommenda-
tions for modifying SLT were suggested. One was to change

viii
the term task-relevant maturity to performance quotient.
The other was to expand the dimension relationship be-
havior to two dimensions, supportive behavior and parti-
cipative behavior.
ix
TABLE OF CONTENTS
Page
ACKNOWLEDGEMENT. . IV
ABSTRACTV
LIST OF TABLES ******* ^ 1
LIST OF FIGURES* * * ^ V
CHAPTER
I INTRODUCTION 1
Statement of the Problem 1Definition of Terms 5Purpose of the Study 6
Methodology 8Delimitations 8Significance 10Organization of the Remainderof the Dissertation 10
II REVIEW OF LITERATURE 12
Historical Review 12
Trait Theories 12Leadership Style Theories 13Situational Theories 20
Leadership in Schools 32
General Studies 32
Relationship-oriented vs.Task-oriented Principals 34
Ohio State Studies 35
Studies with Contingency Theory 38
Path-goal Studies 40
Studies with SLT 41
Summary. 41
X
CHAPTER
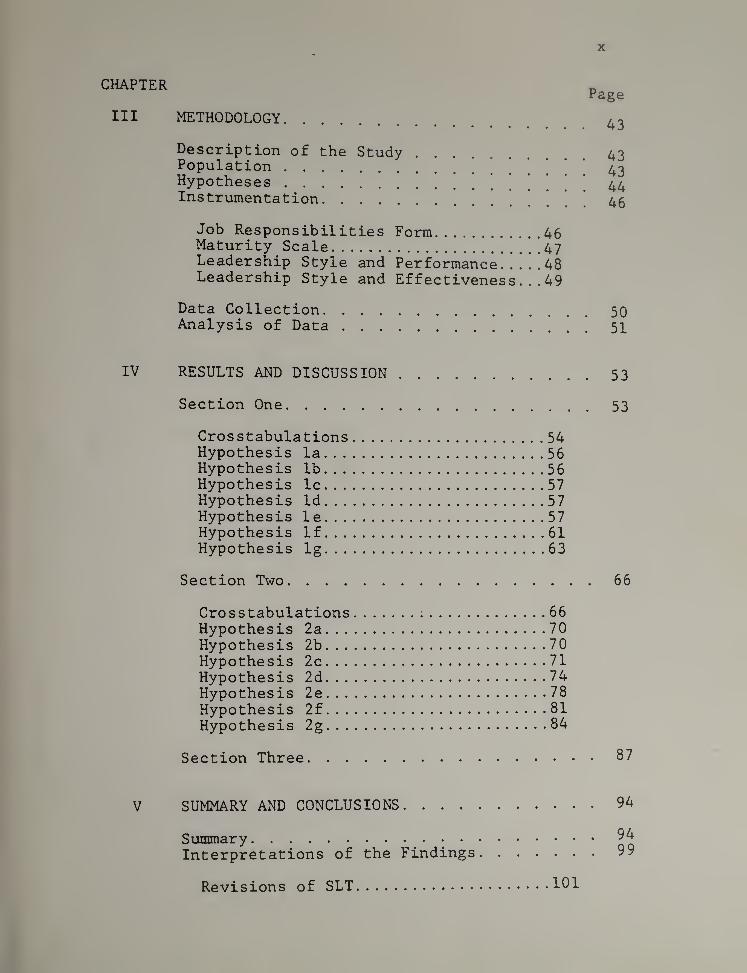
III METHODOLOGY.
Page
43
Description of the Study .
PopulationHypothesesInstrumentation
43434446
Job Responsibilities Form 46Maturity Scale ’47Leadership Style and Performance 48Leadership Style and Ef fectiveness . . . 49
Data Collection 50Analysis of Data 51
IV RESULTS AND DISCUSSION 53
Section One 53
Crosstabulations 54Hypothesis la 56Hypothesis lb 56Hypothesis Ic 57Hypothesis Id 57Hypothesis le 57Hypothesis If 61Hypothesis Ig 63
Section Two 66
Crosstabulations 66Hypothesis 2a 70Hypothesis 2b 70Hypothesis 2c 71Hypothesis 2d 74Hypothesis 2e 78
Hypothesis 2f 81Hypothesis 2g 84
Section Three 87
V SUMMARY AND CONCLUSIONS 94
Summary:
• '
Interpretations of the Findings.
Revisions of SLT 101
9499
xi
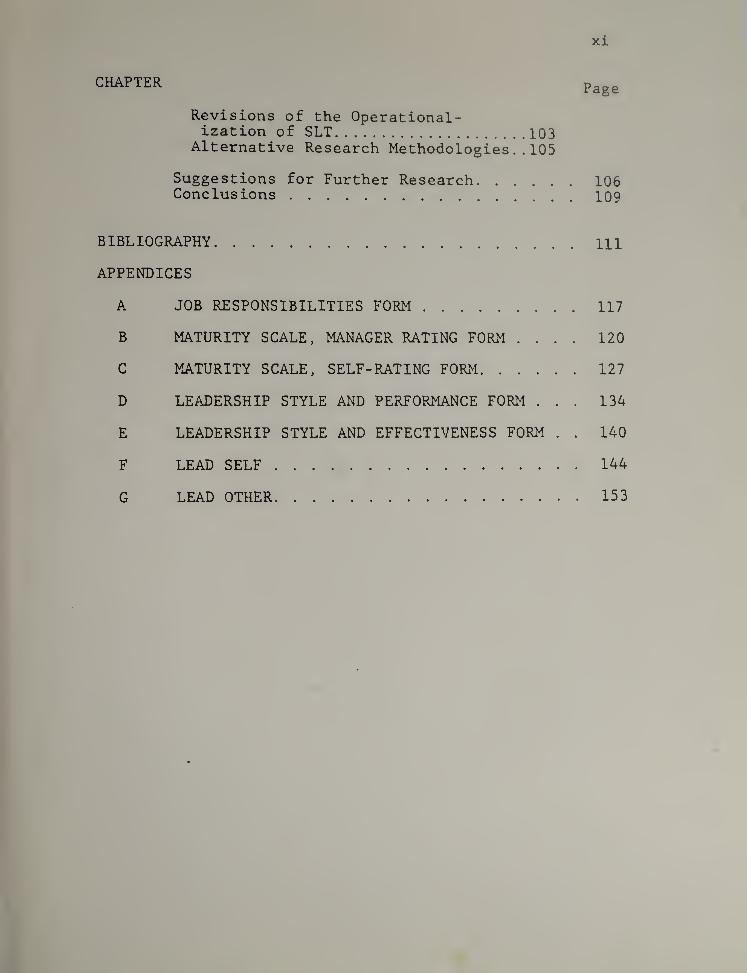
CHAPTER pggg
Revisions of the Operational-ization of SLT 103
Alternative Research Methodologies .. 105
Suggestions for Further Research 106Conclusions 109
BIBLIOGRAPHY HI
APPENDICES
A JOB RESPONSIBILITIES FORM 117
B MATURITY SCALE, MANAGER RATING FORM .... 120
C MATURITY SCALE, SELF-RATING FORM 127
D LEADERSHIP STYLE AND PERFORMANCE FORM ... 134
E LEADERSHIP STYLE AND EFFECTIVENESS FORM . . 140
F LEAD SELF 144
G LEAD OTHER 153
1
2
3
4
5
6
7
8
9
10
11
12
13
xii
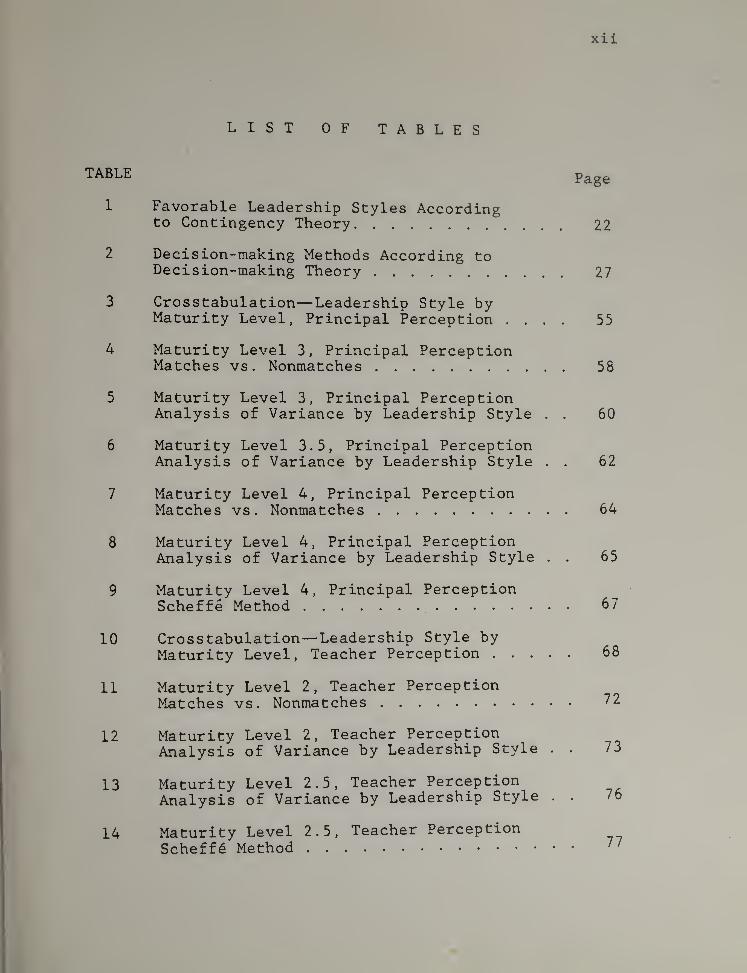
LIST OF TABLES
Page
Favorable Leadership Styles Accordingto Contingency Theory 22
Decision-making Methods According toDecision-making Theory 27
Crosstabulation—Leadership Style byMaturity Level, Principal Perception .... 55
Maturity Level 3, Principal PerceptionMatches vs. Nonmatches 58
Maturity Level 3, Principal PerceptionAnalysis of Variance by Leadership Style . . 60
Maturity Level 3.5, Principal PerceptionAnalysis of Variance by Leadership Style . . 62
Maturity Level 4, Principal PerceptionMatches vs. Nonmatches 64
Maturity Level 4, Principal PerceptionAnalysis of Variance by Leadership Style . . 65
Maturity Level 4, Principal PerceptionScheffe Method 67
Cross tabulation—Leadership Style byMaturity Level, Teacher Perception 68
Maturity Level 2 ,Teacher Perception
Matches vs. Nonmatches 72
Maturity Level 2, Teacher PerceptionAnalysis of Variance by Leadership Style . . 73
Maturity Level 2.5, Teacher PerceptionAnalysis of Variance by Leadership Style . . 76
Maturity Level 2.5, Teacher PerceptionScheffd Method ''
xiii
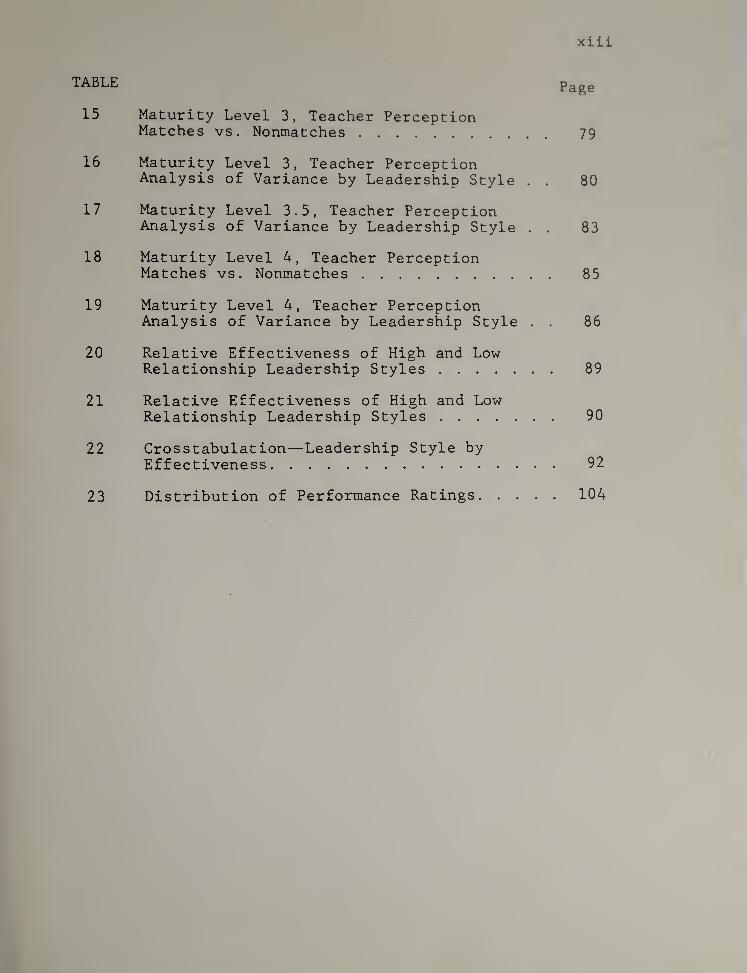
TABLE Page
15 Maturity Level 3, Teacher PerceptionMatches vs. Nonmatches 79
16 Maturity Level 3, Teacher PerceptionAnalysis of Variance by Leadership Style . . 80
17 Maturity Level 3.5, Teacher PerceptionAnalysis of Variance by Leadership Style . . 83
18 Maturity Level 4, Teacher PerceptionMatches vs. Nonmatches 85
19 Maturity Level 4, Teacher PerceptionAnalysis of Variance by Leadership Style . . 86
20 Relative Effectiveness of High and LowRelationship Leadership Styles 89
21 Relative Effectiveness of High and LowRelationship Leadership Styles 90
22 Crosstabulation—Leadership Style byEffectiveness 92
23 Distribution of Performance Ratings 104
xiv
LIST OF FIGURES
Figure Page
1 Predicted relationships among thevariables of SLT 7
2 Leadership styles according to theOhio State Model 18
3 Leadership styles according to theManagerial Grid 19
4 Leadership styles according to SLT 29
5 Diagnosing effective leader behavior 30
CHAPTER I
INTRODUCTION
This research was conducted to validate Situational
Leadersnip Theory (SLT) which was developed by Paul Hersey
and Kenneth H. Blanchard (1969, 1977). Specifically, the
study tested SLT's contention that leader effectiveness
is a function of a leader's adapting his/her leadership
style to the task-relevant maturity of his/her follower(s)
The research was done with educators; it examined rela-
tionships between principals and teachers in elementary
schools
.
Statement of the Problem
There have been three phases of research in the
field of leadership, the first focused on trait theories.
The second focused on leadership styles. The third is
still focusing on situational theories.
Research with trait theories attempted to identify
personality traits which distinguish leaders from non-
leaders. Twenty years of such research yielded one trait
— intelligence—which is common among leaders (Gibb, 1954
Stogdill, 1948). However, since many intelligent people
are not leaders, research with trait theories produced
no results of lasting value.
1
2
Leadership style theories attempted to classify
leader behavior in terms of various continua. Research
with these theories attempted to determine which style
was the most effective. The best known and most widely
researched of these theories is the Ohio State Model
developed by the Bureau of Business Research at Ohio
State University (Stogdill and Coons, 1957). The model
scales two dimensions, init-iat-ing structure and con-
sideration, from low to high and uses the resulting
continua to form a matrix. The matrix defines four
leadership styles: one which is high on initiating
structure, one which is high on consideration, one which
is high on both dimensions, and one which is low on both
dimensions. Research with the Ohio State Model has not
been able to find a single style which is most effective
(Porter, Lawler, and Hackman, 1975).
Situational theories accept the premise that no
one style is the best. Each situational theory defines
a range of styles and then attempts to determine which
style is most effective in varying situations. One of
these theories is SLT.
SLT is an outgrowth of the Ohio State Model. It
uses the terms task behavior and relationship behavior
instead of initiating structure and consideration, but
the dimensions describe behaviors similar to those of
the Ohio State Model. SLT uses the notations Style 1
3
(SI), Style 2 (S2), Style 3 (S3), and Style 4 (S4) to
to tho fouir leadsrship stylos . SI is high on task
behavior. S2 is high on task behavior and high on rela-
tionship behavior. S3 is high on relationship behavior.
Ans S4 is low on both dimensions.
Influenced by the work of William Reddin (1967,
1970), SLT goes beyond the Ohio State Model by adding
effectiveness as a third dimension of the model. This
dimension is used to demonstrate that any leadership style
can be used effectively or ineffectively depending upon
the situation in which a leader uses it.
SLT then adds a situational variable which Hersey
and Blanchard contend can be used to diagnose appropriate
leader behavior. This variable is task-relevant maturity
which is defined in terms of followers' foh maturity and
psychological maturity or, in simpler terms, ability and
willingness
.
SLT defines four levels of task-relevant
maturity. Maturity level one (ML) is low on willingness
and low on ability. Maturity level two (M2) is low on
willingness but high on ability. Maturity level three
(M3) is high on willingness but low on ability. And
maturity level four (M4) is high on both willingness and
ability.
A
In essence, SLT says that an effective leader
should have a range of leadership styles and should adapt
his/her behavior to the task-relevant maturity of his/her
subordinates. In other words, effectiveness results from
matching leadership style with task-relevant maturity.
Specifically, SLT claims that effective leader behavior
results from the use of SI with Ml, S2 with M2, S3 with
M3, and S4 with M4.
One study has been done which examines the relation-
ship between leader behavior and maturity. Smith (1974)
used the Personality Orientation Inventory (POI) dimen-
sions of time Gompetenay and inner* direatedness to
measure teachers’ maturity. She used the Leader Behavior
Description Questionnaire (LBDQ) to measure leader behavior
And she used measures of student achievement, student
attitudes, and teacher satisfaction to measure effective-
ness. Her results indicated that high task principals are
more effective with low maturity teachers and high relation
ship principals are more effective with average maturity
teachers. However, these relationships only held up with
the time competency dimension. With inner directedness
,
there were not such distinctions. Thus, her results were
not conclusive. In addition, her methodology did not
provide an adequate test of SLT since the theory is based
on task-relevant maturity and her measures of maturity
5
were general measures. The same criticism applies to her
measures of leader behavior since the LBDQ does not col-
lect data in relation to specific tasks.
Given this history, the problem addressed in this
study was to test the basic premise of SLT: that leader
effectiveness is a function of matching leadership style
^fth followers' task-relevant maturity. Methodologically,
this was done by measuring task-relevant maturity, leader-
ship style, and leader effectiveness in relation to
specific tasks.
Definition of Terms
Task-relevant Maturity : According to SLT, task-
relevant maturity is defined in terms of job maturity and
pscyhological maturity. These dimensions refer to a
worker's ability and willingness to do a given task.
Four levels of maturity are defined as follows:
Ml is low on both ability and willingness,
M2 is low on ability but high on willingness,
M3 is high on ability but low on willingness,
M4 is high on both ability and willingness.
SLT emphasizes that "these measures of maturity should be
considered* only in relation to a specific task to be per-
formed" (Hersey and Blanchard, 1977, p. 161).
Leadership Style : This term referes to ... the con-
sistent behavior patterns they (managers) use when they
6
are working with and through other people as perceived
by those people. These patterns emerge in people as they
begin to respond in the same fashion under similar con-
ditions; they develop habits of action that become some-
what predictable to those who work with them" (Mersey
and Blanchard, 1977). SLT defines leadership style in
terms of task behavior and relationship behavior. Four
styles of leadership are defined as follows:
51 is high on task behavior, low on relation-ship behavior,
52 is high on both task and relationship behavior,
53 is low on task behavior, high on relationshipbehavior
54 is low on both task and relationship behavior.
Leader Effectiveness : In this study leader effec-
tiveness is defined in terms of followers' performance and
satisfaction, and in terms of leaders' ability to create
conditions conducive to high performance and satisfaction..
Effectiveness refers to a leader ' s ability to create a
work environment in which followers are motivated to do
their best work (Mersey and Blanchard, 1977, pp. 114-116).
Purpose of the Study
SLT has been accepted by a wide range of people in
various work environments. This acceptance verifies the
theory's strong face validity. Nevertheless, there needs
to be empirical evidence to support the theory. The
7
purpose of this study was to investigate the adequacy of
SLT in one environment where it has been widely used
the elementary school. Specifically, the relationship
between principals and teachers in elementary schools was
examined as one example of leader- subordinate relation-
ships .
To test the adequacy of SLT, the following hypo-
thesis was investigated:
Principal effectiveness is positivelycorrelated with the congruency betweenprincipal leadership style and teachertask-relevant maturity.
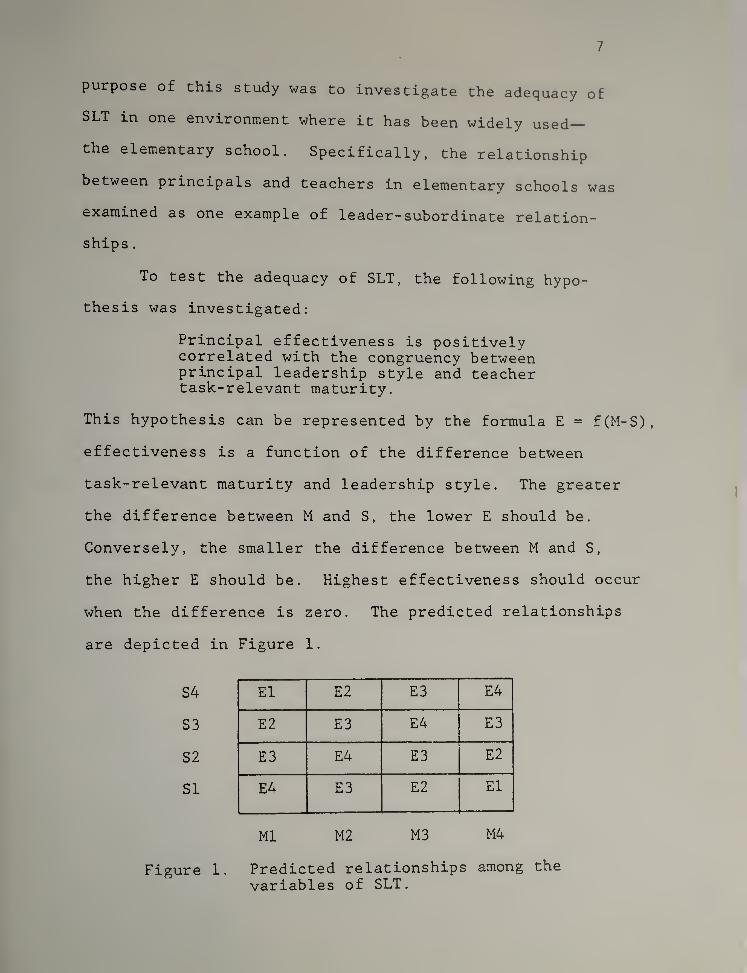
This hypothesis can be represented by the formula E = f(M-S),
effectiveness is a function of the difference between
task-relevant maturity and leadership style. The greater
the difference between M and S, the lower E should be.
Conversely, the smaller the difference between M and S,
the higher E should be. Highest effectiveness should occur
when the difference is zero. The predicted relationships
are depicted in Figure 1.
S4 El E2 E3 E4
S3 E2 E3 E4 E3
S2 E3 E4 E3 E2
SI E4 E3 E2 El
Ml M2 M3 M4
Figure 1. Predicted relationships among the
variables of SLT.
8
As the grid indicates, highest effectiveness should re-
sult from matches between task-relevant maturity and
leadership style. In addition, effectiveness should de-
crease steadily as leadership style becomes increasingly
distant from task-relevant maturity.
Methodology
To investigate the above hypothesis and the depicted
relationships among variables, a field test was conducted.
Task-relevant maturity was measured from teachers' and
principals' perspectives. Leadership style was measured
from teachers' perspective. Leader effectiveness was
measured on the basis of teacher performance, teacher
satisfaction, and principal ability to create conditions
where performance and satisfaction are high. All mea-
sures were in relation to specific job responsibilities
which teachers selected.
Delimitations
The research design employed in this study is de-
scribed by Kerlinger (1973) as a field study. He writes,
"Field studies are strong in realism, significance,
strength of variables, theory orientation, and heuristic
quality" (p. 406). He also writes, "Despite these
strengths, the field study is a scientific weak cousin
of laboratory and field experiments. Its most serious
9
weakness, of course, is its ex post facto character.
Thus, statements of relations are weaker than they are
in experimental research” (p. 408). He points out that
variables are more complex and more difficult to measure
precisely (p. 408). And he concludes that with ex post
facto research, hypotheses are a must, results must be
treated with caution, and results usually show correla-
tions, not causal relationships (p. 392).
Another delimitation was related to the population.
Kerlinger indicates that participants in field studies
usually cannot be randomly selected since they are al-
ready part of significant groups (p . 379). This was
clearly a problem with this study. The research was
delimited to apply only to elementary school principals
and teachers in New England. A further delimitation was
that all subjects were selected solely on the basis of
willingness to participate, thus they may represent a
special group among educators. Therefore, results can
only be generalized to New England elementary school
principals and teachers who are willing to volunteer for
after- school workshops.
Another delimitation related to the instruments.
The Maturity Scales, the Leadership Style and Performance
form and the Leadership Style and Effectiveness form have
not been tested for reliability. In addition, their
10
validity has only been established on the basis of pilot-
ing. In addition, the definition of effectiveness and
the scales for measuring effectiveness may or may not
yield the same results as other definitions or other
scales
.
Significance
This study is significant to the field of leader-
ship since it generated new information about the situa-
tional variable task-relevant maturity and its use for
diagnosing effective leader behavior.
The study is also significant to school practitioners
since it indicated which leadership styles tend to be
most effective with elementary school teachers.
The study is also significant methodologically
since it established a means of conducting research in
relation to specific situations. It also produced new
information about conducting such research.
Organization of the Remainder
of the Dissertation
This dissertation contains five chapters. Chapter
I is the Introduction. It has already presented the
problem, definitions of terms, the purpose, the method-
ology, the delimitations, and the significance of the
study. Chapter II is the Review of Literature. It pre-
sents a selective review of the literature in two sections.
11
a history of leadership theories and a review of leader-
ship studies in schools. Chapter III is the Methodology.
It presents a description of the study, the population,
the specific hypotheses, the instrumentation, the proce-
dures for data collection, and the procedures for data
analysis. Chapter IV is the Results and Discussion.
It presents the results and a discussion of the results.
Chapter V is the Summary and Conclusions. It presents a
summary of the results, interpretations of the findings,
suggestions for further research, and conclusions.
CHAPTER II
REVIEW OF LITERATURE
This chapter is presented in two sections. The
fi^st is an historical review of leadership theories.
The second considers research with leadership theories
in schools.
Historical Review
Leadership theories can be grouped into three
categories: trait theories, leadership style theories,
and situational theories. Each category is discussed in
this section.
Trait Theories
Reviews of research with trait theories are found
in Stogdill (1948) and Gibb (1954). Filley, House, and
Kerr (1976, p. 213) provide a good description of this
phase of leadership studies:
Many studies were designed to determinethe leader's intellectual, social,emotional, physical, and personal make-up in order to discover if there existedany universal traits in effectiveleaders that would distinguish themfrom less effective leaders.
Finch, Jones, and Litterer (1976, p. 92) summarize trait
research
:
This line of research died out in the1940 's when reviews of the literature
12
13
to uncover any consistent traitswhich characterize leaders. The char-acteristic which is most consistentlyfound to be associated is intelligence.In general, leaders tend to be moreintelligent than followers.
They continue, concluding:
In essence, the research indicates thatthere is no clear, consistent patternof traits associated with leadership.The failure of this approach turnedresearchers in other directions.
Some renewed interest in trait theory was generated by
Ghiselli (1963) . Even though he found several traits
positively related to hierarchical levels, his findings
> were not strong enough to inspire other researchers to
renew interest in traits. Most texts refer to trait
theories as a phenomenon of the past and discuss them
primarily as background to subsequent research.
Leadership Style Theories
The second phase of leadership studies focused on
.leadership styles. These theories have their history in
^ two schools of managerial thought, the scientific managemen
movement and the human relations movement. Scientific
management, associated with Frederick Taylor (1911), is
concerned with determining how to organize a work environ-
ment so efficiently that anyone could do a good job. Human
relations, associated with Elton Mayo (1945), is concerned
with improving the interpersonal relationships involved in
work. Hersey and Blanchard (1976, p. 91) write:
14
In essence, the scientific itianagementmovement emphasized a concern for task(output) while the human relations move-ment stressed a concern for relationships(people) . The recognition of these twoconcerns has characterized the writingson leadership ever since the conflictbetween the scientific management andthe human relations schools of thoughtbecame apparent.
Three leadership style theories which are concerned
with task-oriented and people-oriented behaviors were
developed by Likert (1961), Cartwright and Zander (1960),
and Bales (1958). Likert's work is based on managerial
behavior. The other two theories are based on behavior
in small groups. Each of these theories can be visually
conceptualized as a one dimensional continuum anchored
at the poles by different terms. These terms, regardless
of their source, are historically relevant to the current
s tudy
.
Likert and the staff of the University of Michigan
Survey Research Center developed a model which uses the
terms production-orientation and employee-orientation
.
In
the Michigan studies, leaders of best and worst producing
departments were described in terms of this continuum.
The research indicates that "employee-centered supervision
results in superior outcomes, both in terms of material
productivity and employee satisfaction" (Finch et al.,
1976, p. 95).
15
Cartwright and Zander's work with small groups sug-
gests that group objectives are either directed toward
the achievement of specific goals or toward the mainte-
nance of the group itself. Leadership is, therefore,
either goal-oriented or maintenance-oriented.
Along these sam.e lines. Bales identifies two dis-
tinct leadership functions: task roles and maintenance
roles. His research with leaderless groups indicates that
two types of leaders tend to emerge, a task specialist and
a maintenance specialist. The implication is that leader-
ship is concerned with both functions, but individual
leaders behave in the one style or the other.
One problem with these theories is that they are too
simplistic. In addition, leaders are most often described
in terms of the poles and not thought of as being in be-
between. The next three theories are somewhat more complex.
Tannenbaum and Schmidt (1957) define another one-
dimensional model anchored by the terms authoritarian and
democratic
.
However, in addition to labelling the poles,
they identify a range of leader behaviors along the con-
tinuum suggesting that leadership may be described at any
point on the scale.
White and Lippitt (1943) also use the authoritarian-
democratic continuum. In addition, they studied a laissez-
faire style. In their research with Boys Clubs, authori-
tarian leadership resulted in somewhat higher production
16
at the expense of interpersonal relations. When authori-
tarian leaders withdrew, conflicts surfaced. In contrast,
when democratic leaders withdrew, members were able to
solve their problems and productivity continued. Laissez-
leadership resulted in poor production and inter-
personal relations.
Getzels and Cuba (1957) also define three leadership
styles. They use the terms nomethetia and idiographia
to anchor their model. The nomothetic style "places em-
phasis on the requirements of the institution, the role,
and the expectations." The idographic style "places em-
phasis on the requirements of the individual, the person-
ality, and the need-disposition." Getzels and Guba's third
style is called transactional
.
It is intermediate between
the other two and is typified by explicit roles and expec-
tations plus adaptation to individuals.
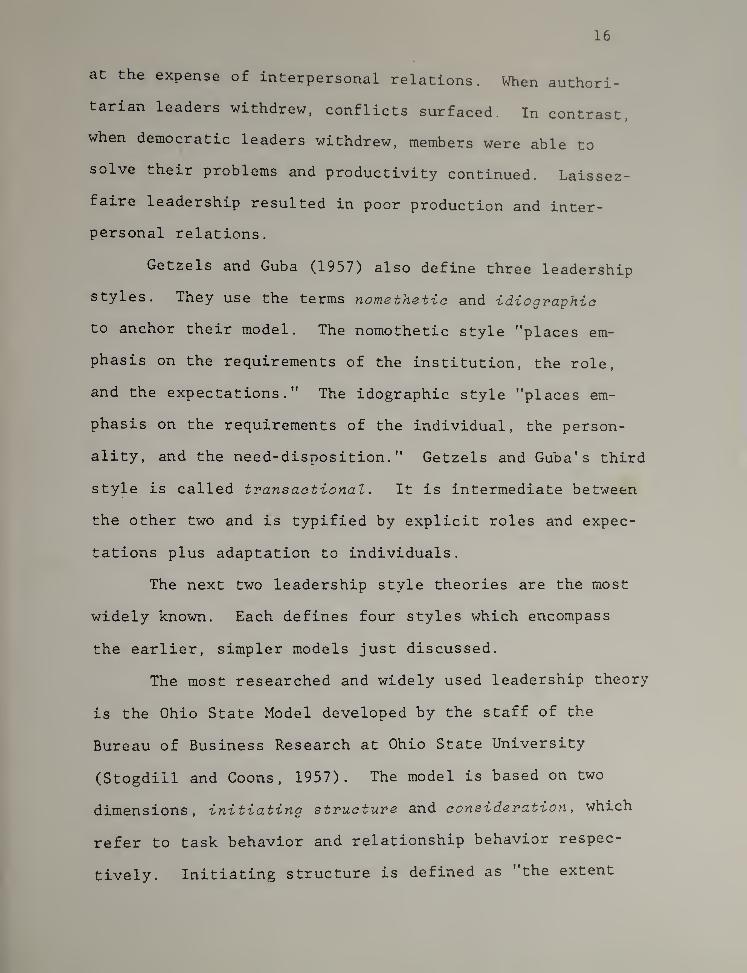
The next two leadership style theories are the most
widely known. Each defines four styles which encompass
the earlier, simpler models just discussed.
The most researched and widely used leadership theory
is the Ohio State Model developed by the staff of the
Bureau of Business Research at Ohio State University
(Stogdiil and Coons, 1957). The model is based on two
dimensions, initiating structure and consideration
,
which
refer to task behavior and relationship behavior respec-
tively. Initiating structure is defined as "the extent
17
to whicli an individaul is lilcaly to dafine and structura
his/har rola and thosa of subordinatas toward goal attain-
ment" (Fleishman and Peters, 1962). It refers to "the
leader's behavior in delineating the relationship between
him/herself and members of the work, group and in endeavor-
ing to establish well-defined patterns of organization,
channels of communication, and methods of procedure"
(Halpin, 1959). Consideration is defined as "the extent
to which an individual is likely to have job relationships
with subordinates characterized by mutual trust, respect
for their ideas, consideration of their feelings, and a
certain warmth between him/herself and them" (Fleishman
and Peters, 1962). It refers to "behavior indicative of
friendship, mutual trust, respect, and warmth in the rela-
tionship between the leader and the members of his staff"
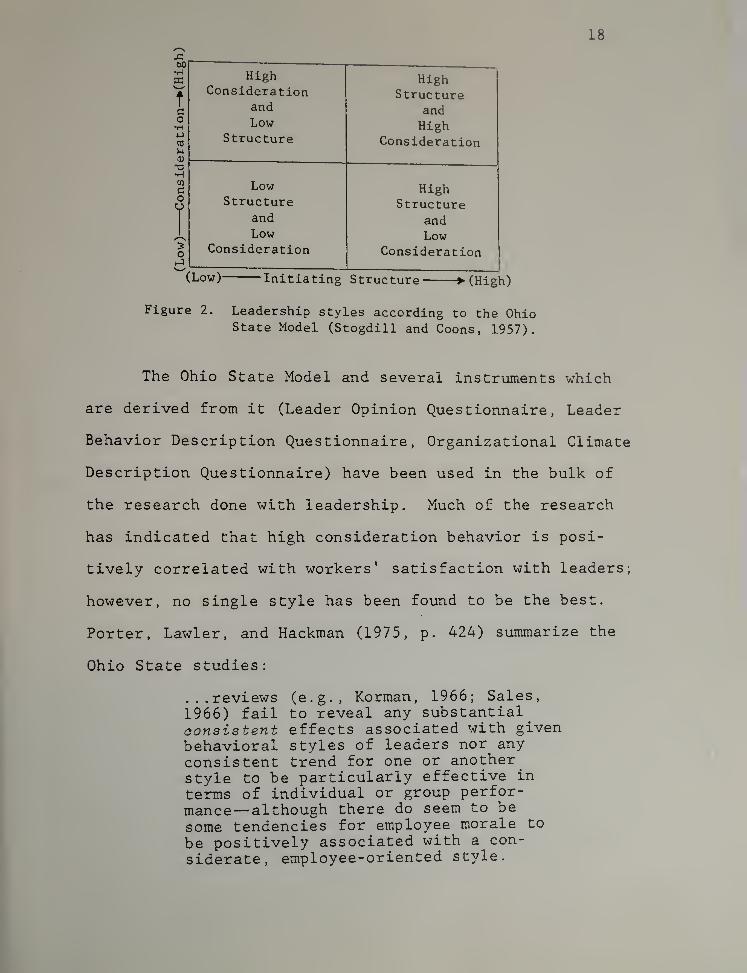
(Halpin, 1959). These two dimensions are scaled from low
to high and plotted on horizontal and vertical axes to
define four leadership styles as depicted by the quadrants
in Figure 2.
18
60
(Low)
Figure 2 .
HighConsideration
andLow
Structure
HighStructure
andHigh
Consideration
LowStructure
and
LowConsideration
HighStructure
andLow
Consideration
-Initiating Structure- ->(High)
Leadership styles according to the OhioState Model (Stogdill and Coons, 1957).
The Ohio State Model and several instruments which
are derived from it (Leader Opinion Questionnaire, Leader
Behavior Description Questionnaire, Organizational Climate
Description Questionnaire) have been used in the bulk of
the research done with leadership. Much of the research
has indicated that high consideration behavior is posi-
tively correlated with workers' satisfaction with leaders;
however, no single style has been found to be the best.
Porter, Lawler, and Hackman (1975, p. 424) summarize the
Ohio State studies:
...reviews (e.g., Korman, 1966; Sales,
1966) fail to reveal any substantialconsistent effects associated with givenbehavioral styles of leaders nor anyconsistent trend for one or anotherstyle to be particularly effective in
terms of individual or group perfor-mance— although there do seem to be
some tendencies for employee morale to
be positively associated with a con-
siderate, employee-oriented style.
19I
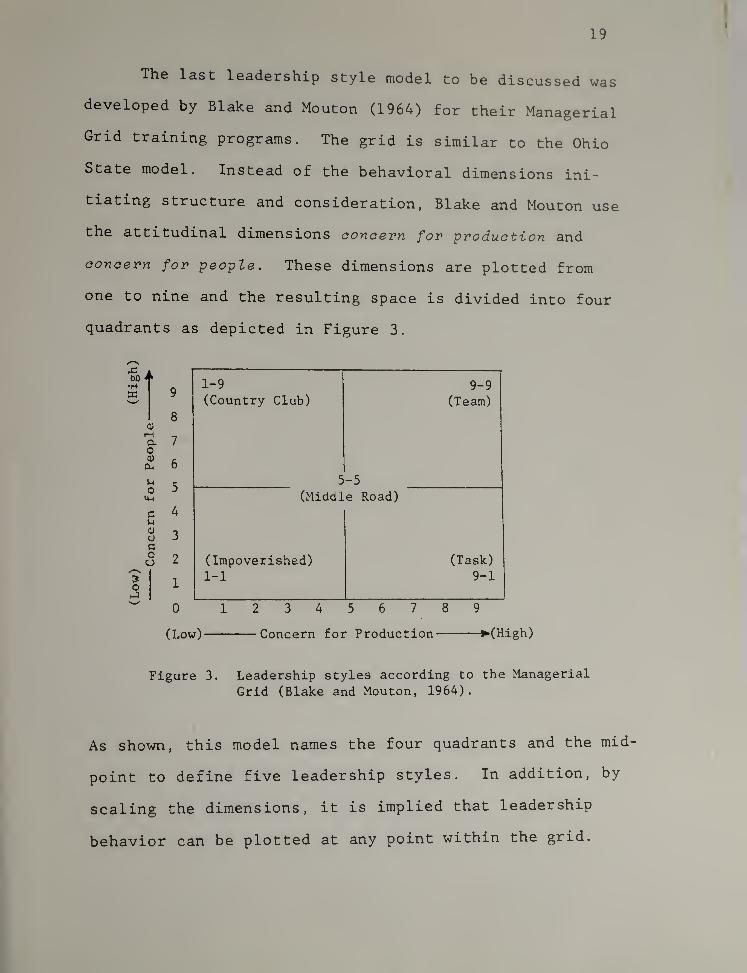
The last leadership style model to be discussed was
developed by Blake and Mouton (1964) for their Managerial
Grid training programs. The grid is similar to the Ohio
State model. Instead of the behavioral dimensions ini-
bl3.ting structure and consideration, Blake and Mouton use
the attitudinal dimensions oonoern for produation and
Qonoern for people. These dimensions are plotted from
one to nine and the resulting space is divided into four
quadrants as depicted in Figure 3.
00 ^
Q1-9 9-9
X (Country Club) (Team)
8(U
o- 7
0)
CL, 6
A 5-5o
<4-4
J(Middle Road)
4
0)
o 3Zoo 2 (Impoverished) (Task)
3o 1
1-1 9-1
0 123456789(Low) Concern for Production (High)
Figure 3. Leadership styles according to the Managerial
Grid (Blake and Mouton, 1964).
As shown, this model names the four quadrants and the mid-
point to define five leadership styles. In addition, by
scaling the dimensions, it is implied that leadership
behavior can be plotted at any point within the grid.
20
Grid training is designed to train managers to be
team or high/high leaders. Blake and Mouton are explicit
that this is the most effective style for leaders to use.
Thus, even though the model defines more styles than pre-
vious theories, it still is concerned with one style as
the best way to lead.
The problem with identifying the best style is that
too many situations deviate from the norm. For example,
despite his general conclusion, Likert (1961) found some
production- or iented leaders who had high producing depart-
ments. And the Ohio State studies verify that no one stylet
is best.
Situational Theories
In response to the limitations of style theories, a
third phase of leadership studies has developed situational
theories. These theories identify variables in the work
environment which indicate where and when the various
leadership styles should be used. Four situational theories
are recognized in current literature and are discussed in
the following pages. They are Fiedler's Contingency Theory
(1967), House's Path-Goal Theory (1971), Vroom' s Decision-
making Theory (1973), and Hersey and Blanchard's Situational
Leadership Theory (1977).
Contingency theory . This theory is based on three
situational variables : leader-member relations (group
21
acceptance), task structure, and leader position power.
It only considers two leadership styles, high LPC and low
LPC, which are determined by a leader's completing the
Least Preferred Coworker (LPC) instrument. The LPC in-
strument measures a single trait, esteem for one's least
preferred coworker. On the basis of this trait, a style
is generalized. The low LPC leader tends to be task-
oriented or directive. The high LPC leader is not task-
oriented or permissive. In either case, the leader may
or may not be relationship-oriented.
Research with Contingency Theory has focused on
defining the tw^o styles and examining the interaction
between the styles and the three situational variables.
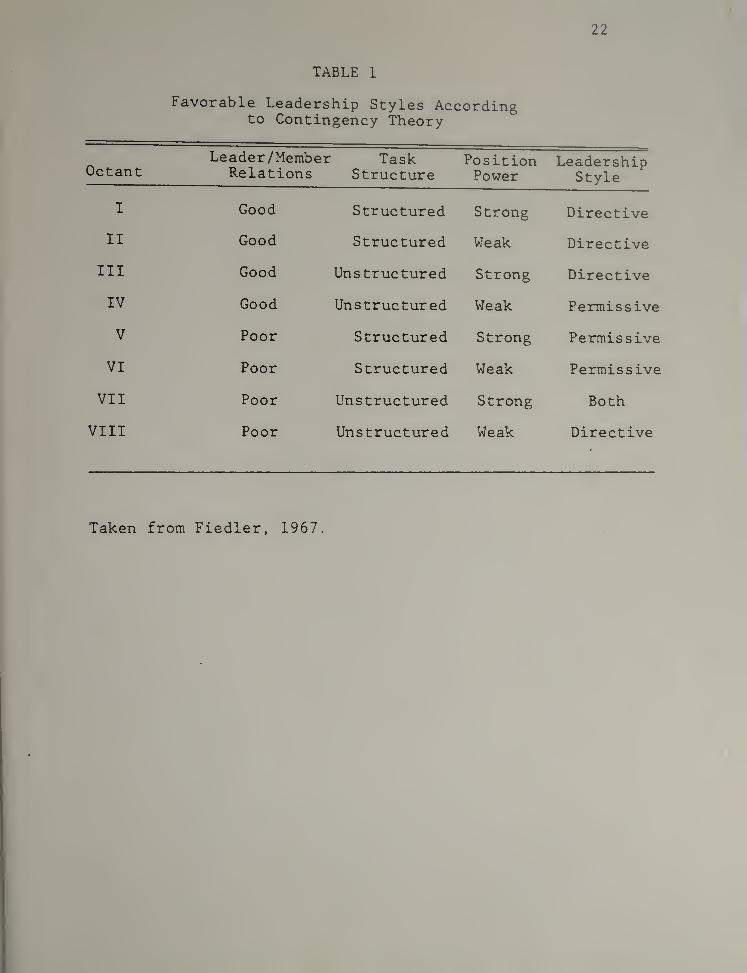
The theory predicts which style is most favorable in each
situation according to the chart shown in Table 1.
In general, the theory predicts that when the sit-
uation is highly favorable or unfavorable to the leader,
low LPC is the better style. ^’Jhen the situation is moder-
ate, high LPC is better. Research reported by Fiedler
(1967) supports these contentions. Filley, House, and
Kerr (1976) report that Graen (1970) and Ashour (1972)
have criticized Fiedler's findings on methodological
grounds. However, they also report a tightly-controlled
study of Chemers and Skrzypek (1972) which supports the
Contingency Theory.
22
TABLE 1
Favorable Leadership Styles Accordingto Contingency Theory
OctantLeader/Member
RelationsTask
StructurePositionPower
LeadershipStyle
I Good Structured Strong Directive
II Good Structured Weak Directive
III Good Unstructured Strong Directive
IV Good Unstructured Weak Permissive
V Poor Structured Strong Permissive
VI Poor Structured Weak Permissive
VII Poor Unstructured Strong Both
VIII Poor Unstructured Weak Directive
Taken from Fiedler, 1967.
23
The value of the theory is that it identifies sit-
uational variables which are worth consideration. It
also adds support to the contention that different styles
of leadership are appropriate under varying conditions.
However, it does not help a manager know how to adjust
his/her behavior according to the situation.
There are three problems with Contingency Theory.
One is that it only considers two leadership styles. A
second is that it is not clear exactly what the LPC
instrument measures or what the high and low scores mean.
The third is stated by Filley, House, and Kerr (1976,
p. 246):
. . . the theory is in actuality anempirical generalization and not anexplanation of relationships betweenleader behavior, situational factors,and group factors.
Path-goal Theory . This situational theory has gen-
erated much research in recent years. It is based on the
assumption "that the major impact of a leader on the per-
formance of subordinates is clarifying the path to desired
rewards and making such rewards contingent on effective
performance" (House and Mitchell, 1974). Path-goal Theory
considers the interaction between four leadership styles
and several situational variables including personal char-
acteristics and environmental factors. Research with the
theory has attempted to determine which styles are most
effective with various types of followers under varying
vork conditions. The intended outcome of such studies is
24
to help a manager know how to establish goals and deter-
mine paths to goal-accomplishment for a range of subor-
dinates .
The four leadership styles defined by Path-goal
Theory are as follows (Filley, House, and Kerr, 1976,
P- 253):
Instrumental leadership features the planning,organizing, controlling, and coordinatingof subordinate activities.
Participative leadership is characterized by thesharing of information, power, and influencebetween supervisors and subordinates. Parti-cipative leaders treat subordinates prettymuch as their equals, and allow them to in-fluence their actions and decisions.
Supportive leadership refers to behavior whichincludes giving consideration to the needsof subordinates, displaying concern for theirwell-being, status, and comfort, and creatinga friendly and pleasant climate.
Achievement-oriented leadership is characterizedby leaders who set challenging goals, expectsubordinates to perform at their highestlevel, continuously seek improvement in per-formance and show a high degree of confidencethat the subordinates will assume responsi-bility, put forth effort, and accomplishchallenging goals.
Path-goal Theory examines two sets of situational
variables. Personal characteristics which are considered
are authoritarianism, locus of control, ability, and achieve-
ment motivation. Environmental factors are size of group,
task complexity, task repetitiveness, task ambiguity, and
the formal authority system.
25
Research with Path-goal Theory has been extensive
(Filley, House, and Kerr, 1976). The findings indicate
several conclusions about each leadership style. Instru-
mental leadership is positively correlated with satis-
faction and productivity when tasks are ambiguous. How-
ever, when tasks are clear, this directive style is only
effective with subordinates who prefer to be directed
(high authoritarian) . Participative leadership is related
to satisfaction and productivity when tasks are non-
repetitive and ego- involving . When tasks are not, only
low authoritarian followers are influenced by participa-
tion. Supportive leadership is needed when work is stress-
ful, frustrating, or dissatisfying. Achievement-oriented
leadership is useful only with non-repetitive ,ambiguous
tasks. In such situations, the higher a leader's achieve-
ment motivation, the more confident followers are that
they will perform well.
The results of Path-goal studies are interesting
but not illuminating. Three of the four styles are use-
ful with ambiguous tasks. With clear tasks, some subor-
dinates like to be directed and some do not. And when
problems are pressing, people need support. This infor-
mation does not give a manager a means of determining
how to adapt his/her behavior to various situations.
The major value of the theory is that it provides a
mechanism for testing many situational variables in
26
relation to the main leadership styles discussed in the
literature. In addition, the results of research confirm
the hypothesis that no one style is the best.
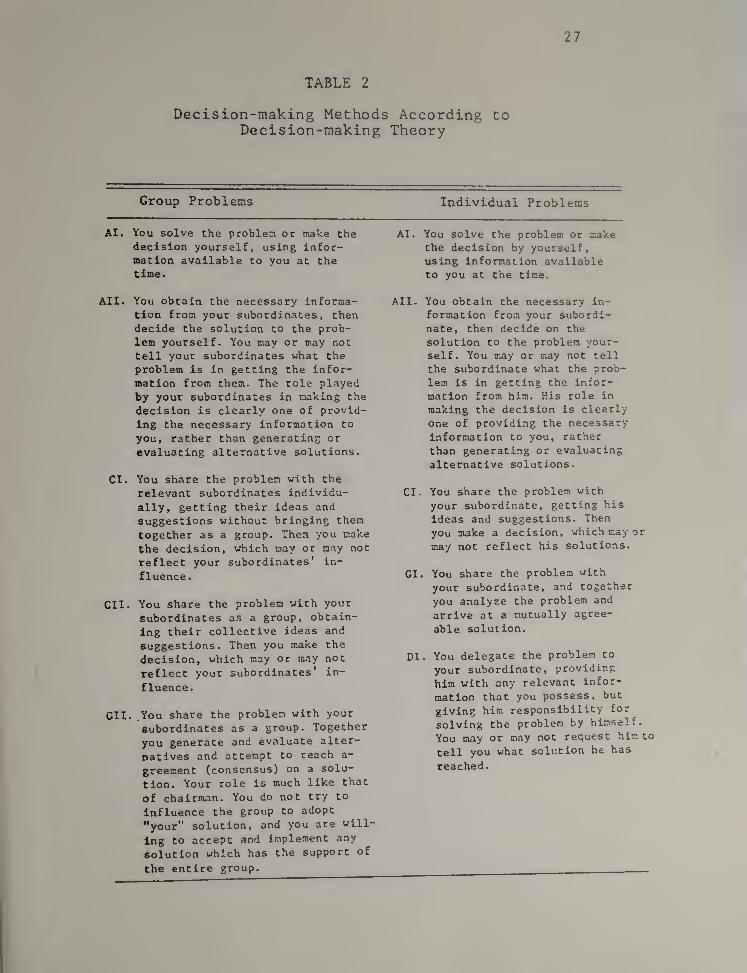
Decision-making Theory . This third situational
model is based on "types of decision methods" rather than
leadership styles. The four types are autoaratio (A),
oonsultative (C),
gpoup (G) and delegated (D) . The spe-
cific decision methods are depicted in Table 2.
Decision-making Theory also defines seven "problem
attributes" which identify situational variables influenc-
ing decision situations. The variables used are the
importance of quality ^the leader's information/expertise ,
the structure of the problem, the need for subordinate
acceptance, acceptance of the leader, subordinates' com-
mitment to organizational goals, and the likelihood of
conflict
.
The theory is normative in the sense that
research has found that these attributes do, in fact,
distinguish problem situations. The theory is prescriptive
in the sense that it is used to determine which method
is the best for any given situation. To accomplish this,
the decision methods and problem attributes are organized
into a "tree" which guides a manager to examine any situa-
tion in terms of each attribute. By following the branches
of the tree, the theoretically best method is determined.
Research with this theory has been limited because
the authors have placed control of all studies in the
27
TABLE 2
Decision-making Methods According toDecision-making Theory
Group Problems Individual Problems
AI. You solve the problen or make thedecision yourself, using infor-mation available to you at thetime.
All. You obtain the necessary informa-tion from your subordinates, thendecide the solution to the prob-lem yourself. You may or may not
tell your subordinates what the
problem is in getting the infor-mation from them. The role playedby your subordinates in making the
decision is clearly one of provid-ing the necessary information to
you, rather than generating or
evaluating alternative solutions.
Cl. You share the problem with the
relevant subordinates individu-
ally, getting their ideas andsuggestions without bringing them
together as a group. Then you make
the decision, which may or may not
reflect your subordinates' in-
fluence.
CII. You share the problem with your
subordinates as a group, obtain-
ing their collective ideas and
suggestions. Then you make the
decision, which may or may not
reflect your subordinates' in-
fluence.
GlI. .You share the problem with your
subordinates as a group. Together
you generate and evaluate alter-
natives and attempt to reach a-
greement (consensus) on a solu-
tion. Your role is much like that
of chairman. You do not try to
Influence the group to adopt
"your" solution, and you are will-
ing to accept and Implement any
solution which has the support of
the entire group.
AI. You solve the problem or makethe decision by yourself,using information availableto you at the time.
All. You obtain the necessary in-
formation from your subordi-nate, then decide on the
solution to the problem your-self. You may or may not tell
the subordinate what the prob-
lem is in getting the infor-
mation from him. His role in
making the decision is clearly
one of providing the necessary
information to you, rather
than generating or evaluating
alternative solutions.
Cl. You share the problem with
your subordinate, getting his
ideas and suggestions. Then
you make a decision, which may or
may not reflect his solutions.
GI. You share the problem with
your subordinate, and together
you analyze the problem and
arrive at a mutually agree-
able solution.
DI. You delegate the problem to
your subordinate, providing
him with any relevant infor-
mation that you possess, but
giving him responsibility for
solving the problem by himself.
You may or may not request him to
tell you what solution he has
reached.
28
hands of the Kepner-Tregoe Company. Vroom's research
indicates that most managers use all of the decision
methods (Vroom, 1976) . This finding indicates that
leaders do not use one style or another. Rather, they
typically use a range of styles. The theory contends that
leaders who use the right style at the right time are
sffsctive than those who do not. It has been deter-
mined that training improves managers' ability to diagnose
situations in a laboratory setting (Vroom, 1976). However,
the accuracy of this theory has not been tested in the
field.
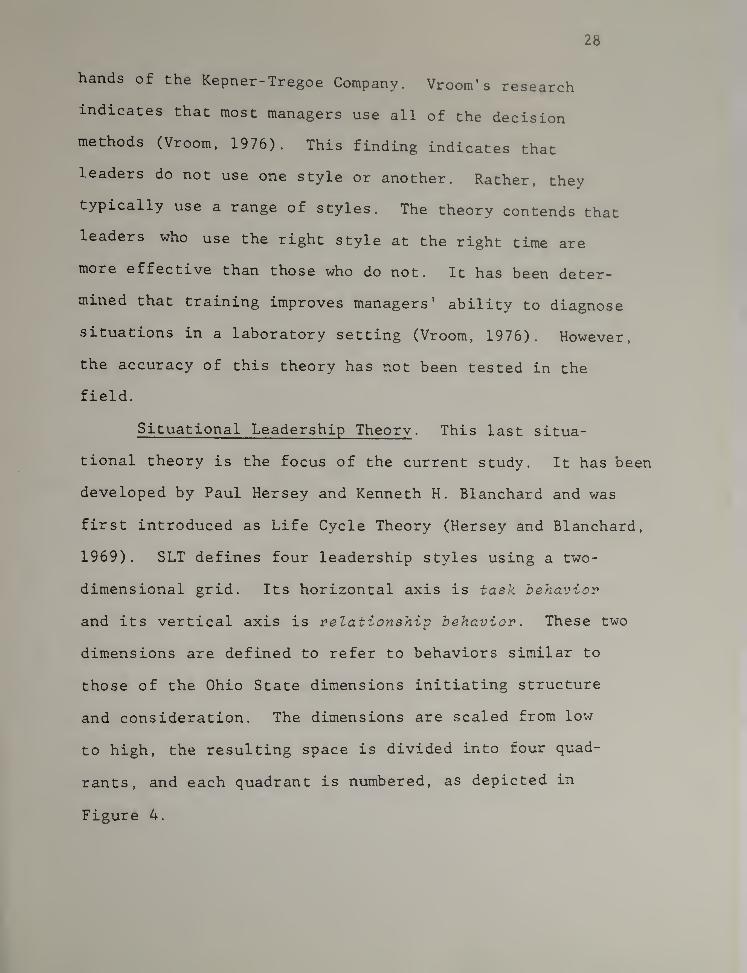
Situational Leadership Theory . This last situa-
tional theory is the focus of the current study. It has been
developed by Paul Hersey and Kenneth H. Blanchard and was
first introduced as Life Cycle Theory (Hersey and Blanchard,
1969) . SLT defines four leadership styles using a two-
dimensional grid. Its horizontal axis is task behavior
and its vertical axis is relationship behavior. These two
dimensions are defined to refer to behaviors similar to
those of the Ohio State dimensions initiating structure
and consideration. The dimensions are scaled from low
to high, the resulting space is divided into four quad-
rants, and each quadrant is numbered, as depicted in
Figure 4.
29
00•HPC
tV.I
o•H>
0)
na•H
HighRelationship
andLow Task
S3
High TaskandHigh
Relationship
S2
wc S4 SI0
•u03
Low Task High Task
0)and and
Pi Low Low
1
Relationship Relationship
&
(Low) Task Behavior (High)
Figure 4. Leadership styles according to SLT(Hersey and Blanchard, 1977)
The development of SLT was aided by the work of
William Reddin (1967, 1970) who added a third dimension,
effectiveness, to the earlier two-dimensional models.
Reddin thus introduced the idea that any of the four
styles could be effective or ineffective depending on
the situation. SLT incorporates this concept by defining
Styles 1-4 as the effective use of the behavior described
by each quadrant of the above grid.
SLT takes Reddin' s work one step further by adding
a situational variable which can be used to determine
appropriate leadership style. The variable is task-
relevant maturity" which is defined in terms of job
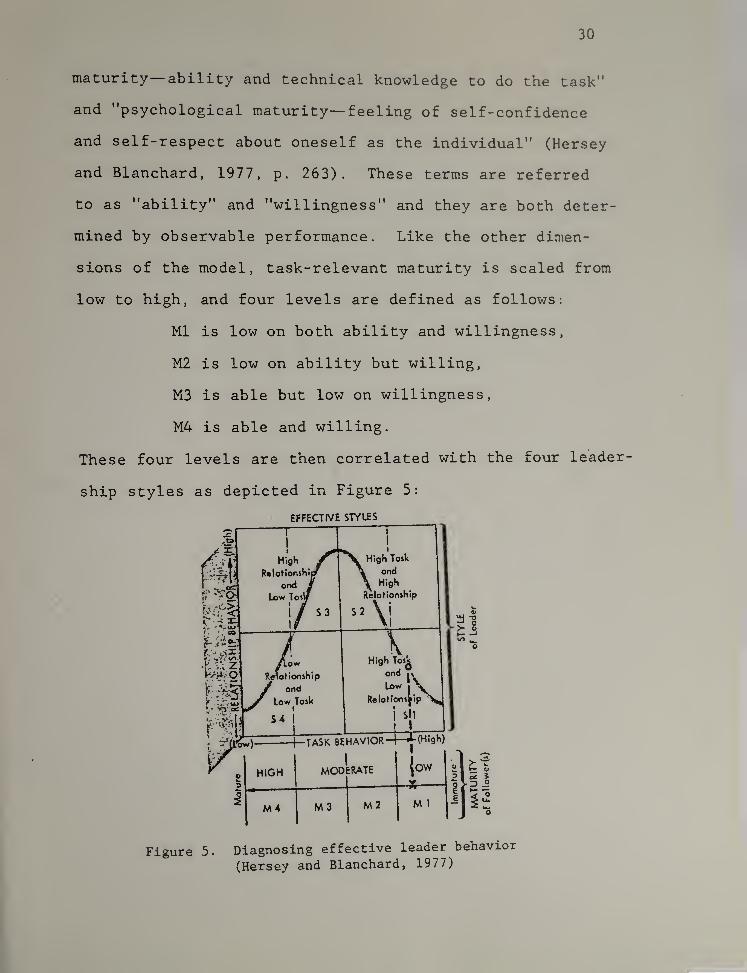
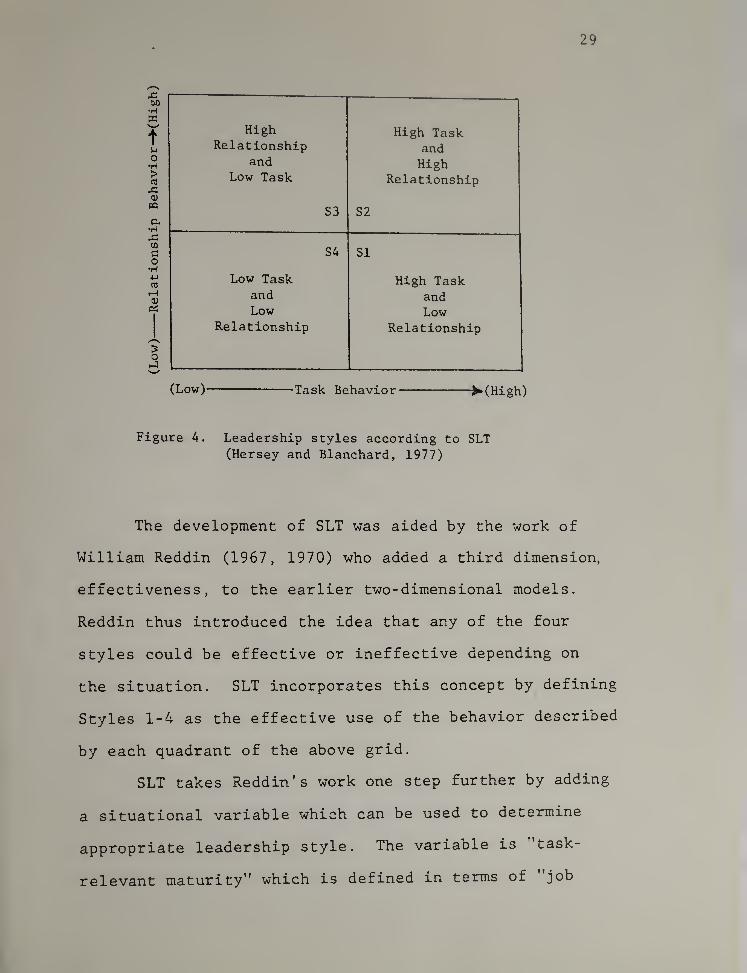
30
maturity— ability and technical knowledge to do the task”
and "psychological maturity— feeling of self-confidence
and self-respect about oneself as the individual” (Hersey
and Blanchard, 1977, p. 263). These terms are referred
to as "ability” and "willingness” and they are both deter-
mined by observable performance. Like the other dimen-
sions of the model, task-relevant maturity is scaled from
low to high, and four levels are defined as follows:
Ml is low on both ability and willingness,
M2 is low on ability but willing,
M3 is able but low on willingness,
M4 is able and willing.
These four levels are then correlated with the four leader-
ship styles as depicted in Figure 5:
EFFECTIVE STYLES
31
In essence, SLT postulates that effective leaders
use a range of leadership styles and adapt their behavior
to the task-relevant maturity of followers. The model is
prescriptive since it indicates how a leader should act
in various situations. In addition, the model is devel-
opmental since the theory claims that as task-relevant
maturity increases, leadership style should progress
accordingly. Thus, in path-goal terms, when a task is
new and therefore ambiguous, a leader should be directive
(Style 1) ; but, as the subordinate becomes familiar with
the task, the leader should be participative (Style 2),
and so on until the follower is working independently.
Research with SLT has been limited. Raynor (1976)
found that training results in increased ability to ac-
curately diagnose hypothetical management situations.
Smith (1974) partially validated the postulate that ef-
fective leader behavior is adapted to follow maturity.
However, her measure of maturity was a global measure,
therefore her test did not examine task-relevant maturity.
These studies do not provide sufficient evidence support-
ing SLT. Therefore, even though the theory has strong
face validity and has been used by leaders in many fields
including education, its validity has not been established
through research. The current study was designed to pro-
vide such validation.
32
Leadership in Schools
This second section reviews several general studies,
several studies which indicated a preference for task-
oriented or relationships oriented leadership, and then
examines research with the Ohio State Model, Contingency
Theory, Path-goal Theory, and SLT.
General Studies
Several pieces of general information have been
generated by leadership studies in schools. Chase (1953),
Moyer (1955), and Gross and Harriott (1965) demonstrate
that the behavior of principals has a strong impact on
the functioning of a school.
Chase (April, 1953) found that there is a positive
relationship between a principal's leadership style and
teacher satisfaction, that satisfaction is a result of
a principal's meeting teacher expectations, and that ef-
fective principals "need to understand the expectations
of teachers." He writes (March, 1953):
When teachers' expectations with regardto the leadership of the principal aremet, there are seventy chances in a hun-dred that they will be enthusiastic aboutteaching in the school, and less than onechance in a hundred of active dissatis-faction.
Moyer (1955) came to a similar conclusion, finding
that teachers are most satisfied when a principal s real
behavior is consistent with a teacher's conception of ideal

33
behavior. He also found that the more a principal "en-
courages teachers to be less dependent upon him and more
interdependent on each other, the higher teacher satis-
faction in the group."
Gross and Harriott (1965) found that principals
who stress improving the quality of staff performance have
teachers who are higher on morale and performance, and
they have students who are higher on learning than princi-
pals who do not stress professional development.
Ignatovich (1974), Brown (1964), and Eidell (1969)
did studies which indicate that perceptions of principals
and teachers vary and that type of school and culture
may affect behavior.
Ignatovich (1974) found that Iowa principals and
teachers have similar perceptions of principals' real be-
havior and ideal behavior. Both groups see principals as
person-oriented and living up to ideal standards. In a
parallel study in Turkey, he found principals and teachers
agreeing that principals are system-oriented. However,
principals saw themselves living up to ideals on all
dimensions while teachers saw principals as living up to
none
.
Brown (1964) found that principals generally tend to
perceive their schools as being more open than teachers do.
Eidell (1969) found that principals in different
types of schools behave differently. In multi-unit and
34
IPI (individually programmed instruction) schools, they
use more participative styles of leadership than princi-
pals in control schools.
To summarize these general studies, a principal's
leadership style has a strong impact on teachers, the
effects of his/her behavior depend on teachers' expecta-
tions and environmental constraints, and different types
of leader behavior have varying impacts on schools.
Relationship-oriented vs.Task-oriented Principals
Several studies have drawn conclusions about task-
oriented principals or relationship-oriented principals.
The conclusions have been mixed as indicated in the follow-
ing six studies.
Getzels and Cuba (1957) found that professionally-
trained people, like teachers, generally prefer idio-
graphic (high relationship) leadership.
Harrell (1972) found that idiographic principals
tend to have more innovation occurring in their schools
than do nomothetic (task-oriented) principals.
Grassie and Carss (1972) discovered that professionally-
oriented teachers are satisfied by considerate, trustful
leadership
.
Chesler, Schmuck, and Lippitt (1963) found that
teaching staffs with the greatest number of innovations
35
have principals who are "tuned to their feelings and
values" (relationship-oriented)
.
Doyle and Ahlbrand (1974) found that relationship-
oriented principals are supportive of teachers' ideas
while task-oriented principals are critical.
On the other side of the argument, Congreve (1957)
found that school staffs prefer a formal, impersonal
approach to administration.
Similarly, Moeller (1964) found that bureaucratic
organizations give teachers a greater sense of power to
affect change in the system. In contrast with democratic
organizations, there is less turnover in bureaucratic
systems, and the longer teachers stay in the system, the
more they feel powerful to change it.
To summarize the results of the last six studies,
high relationship principals tend to support new ideas
and innovations. High task principals tend to manage more
stable schools. And the evidence indicates that, depend-
ing on the goal, teachers prefer both types of leadership.
Ohio State Studies
Much of the research about leadership in education
has been generated by the Ohio State Model. Most studies
have been done with the Leader Behavior Description Ques-
tionnaire (LBDQ) . In general, these studies support the
contention that task behavior and relationship behavior
36
are both important for principals. Several examples
follow.
Hemphill (1955) found that the best administered
college departments have staffs above the mean on both
initiating structure and consideration.
Halpin (1956) studied school superintendents and
found that school boards wanted them to emphasize struc-
ture while staffs thought superintendents should emphasize
consideration. Both groups thought that both dimensions
should be high.
Evenson (1959) repeated Helpin' s study with prin-
cipals and found the same results. Superintendents and
teachers found the most effective principals to be high
on structure and consideration.
Peoples (1964) found that principals need to be
high on both dimensions in order to have a successful
system of upward communication.
Sergiovanni, Metzous, and Burden (1969) predicted
that teachers would prefer a range of leadership styles
depending on their needs orientation. However, their re-
search discovered no such relationships. Instead, teachers
preferred principals to be high on structure and high on
consideration regardless of their needs orientation.
Stotts (1968) ,used the LBDQ XII with administrators
of Adult Basic Education programs in Illinois. He found
that both principals and teachers perceived leaders to be
37
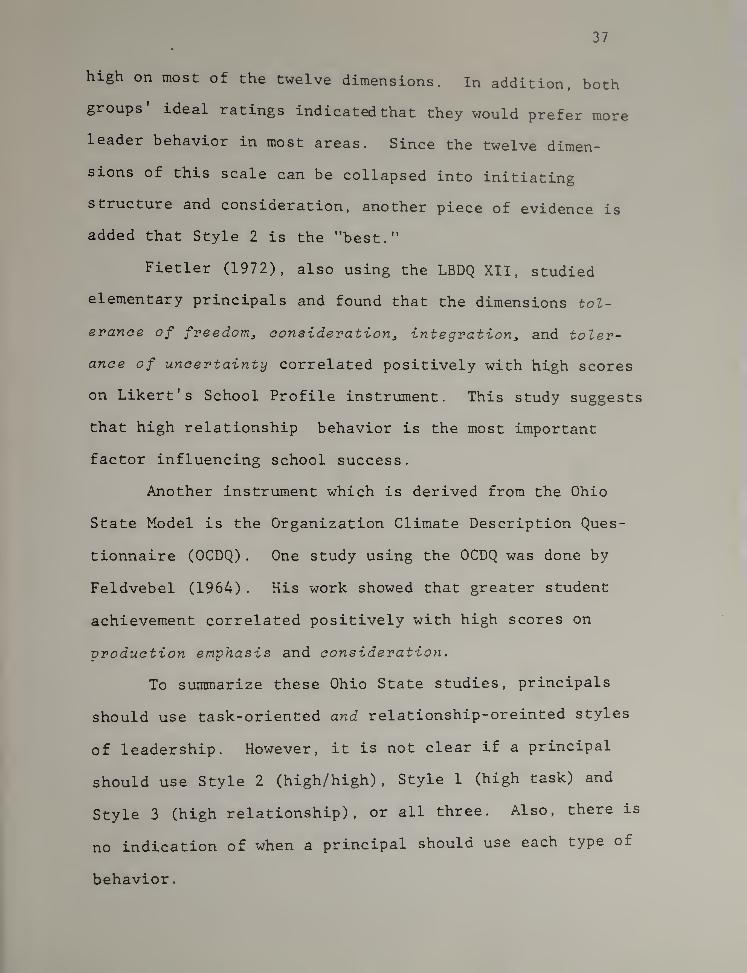
high on most of the twelve dimensions. In addition, both
groups' ideal ratings indicated that they would prefer more
leader behavior in most areas. Since the twelve dimen-
sions of this scale can be collapsed into initiating
structure and consiaeration, another piece of evidence is
added that Style 2 is the "best."
Fietler (1972), also using the LBDQ XII, studied
elementary principals and found that the dimensions tol-
evanoe of freedom^ aonsideratiorij integration j and toler-
ance of uncertainty correlated positively with high scores
on Likert's School Profile instrument. This study suggests
that high relationship behavior is the most important
factor influencing school success.
Another instrument which is derived from the Ohio
State Model is the Organization Climate Description Ques-
tionnaire (OCDQ) . One study using the OCDQ was done by
Feldvebel (1964) . His work showed that greater student
achievement correlated positively with high scores on
production emphasis and consideration.
To summarize these Ohio State studies, principals
should use task-oriented and relationship-oreinted styles
of leadership. However, it is not clear if a principal
should use Style 2 (high/high). Style 1 (high task) and
Style 3 (high relationship), or all three. Also, there is
no indication of when a principal should use each type of
behavior
.
38
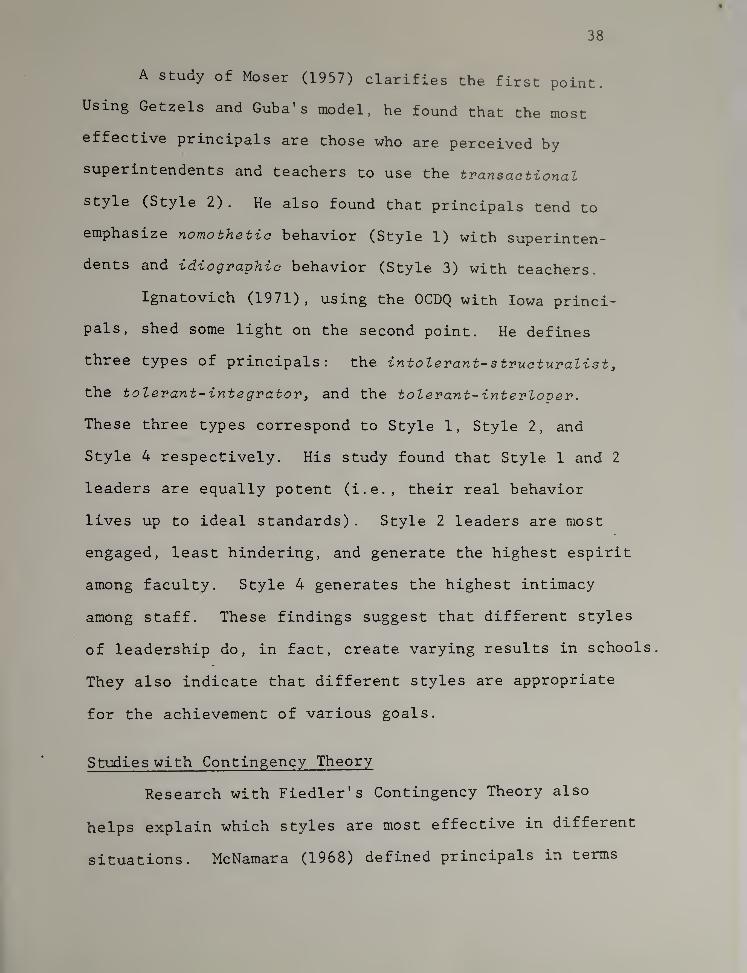
A study of Moser (1957) clarifies the first point.
Using Getzels and Cuba's model, he found that the most
effective principals are those who are perceived by
superintendents and teachers to use the transaational
style (Style 2) . He also found that principals tend to
emphasize nomothetic behavior (Style 1) with superinten-
dents and idiographic behavior (Style 3) with teachers.
Ignatovich (1971), using the OCDQ with Iowa princi-
pals, shed some light on the second point. He defines
three types of principals: the intolerant- structuralist
j
the tolerant-integrator^ and the tolerant-interloper.
These three types correspond to Style 1, Style 2, and
Style 4 respectively. His study found that Style 1 and 2
leaders are equally potent (i.e., their real behavior
lives up to ideal standards) . Style 2 leaders are most
engaged, least hindering, and generate the highest espirit
among faculty. Style 4 generates the highest intimacy
among staff. These findings suggest that different styles
of leadership do, in fact, create varying results in schools.
They also indicate that different styles are appropriate
for the achievement of various goals.
Studies with Contingency Theory
Research with Fiedler's Contingency Theory also
helps explain which styles are most effective in different
McNamara (1968) defined principals in termssituations
.
39
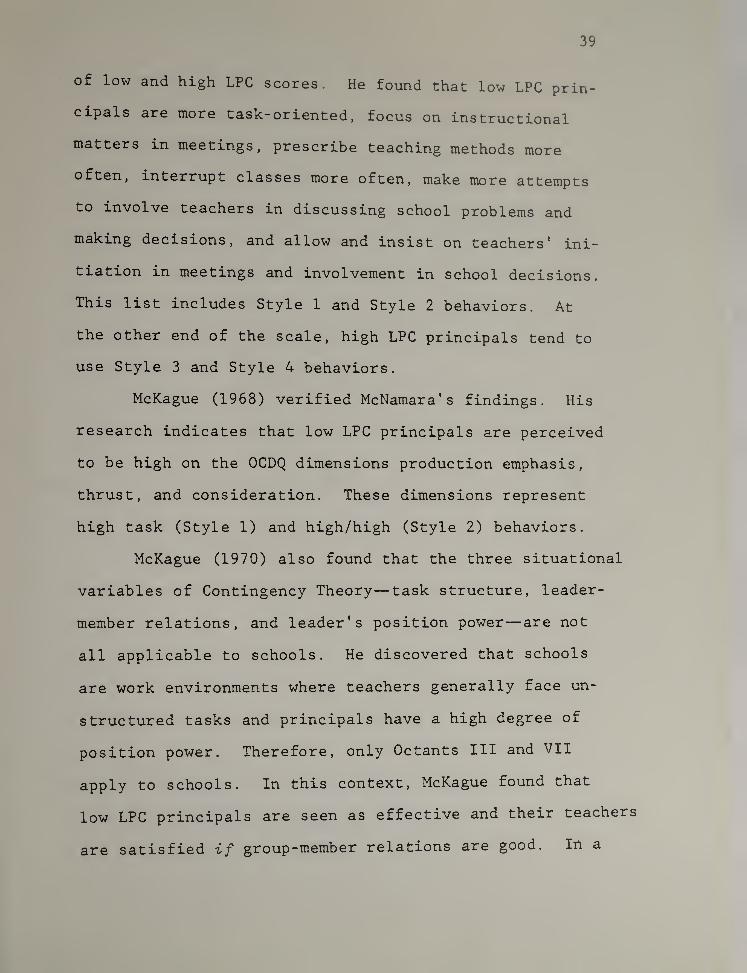
of low and high LPC scores. He found that low LPC prin-
cipals are more task-oriented, focus on instructional
matters in meetings, prescribe teaching methods more
often, interrupt classes more often, make more attempts
to involve teachers in discussing school problems and
making decisions, and allow and insist on teachers' ini-
tiation in meetings and involvement in school decisions.
This list includes Style 1 and Style 2 behaviors. At
the other end of the scale, high LPC principals tend to
use Style 3 and Style 4 behaviors.
McKague (1968) verified McNamara's findings. His
research indicates that low LPC principals are perceived
to be high on the OCDQ dimensions production emphasis,
thrust, and consideration. These dimensions represent
high task (Style 1) and high/high (Style 2) behaviors.
McKague (1970) also found that the three situational
variables of Contingency Theory— task structure, leader-
member relations, and leader's position power— are not
all applicable to schools. He discovered that schools
are work environments where teachers generally face un-
structured tasks and principals have a high degree of
position power. Therefore, only Octants III and VII
apply to schools. In this context, McKague found that
low LPC principals are seen as effective and their teachers
are satisfied i/ group-member relations are good. Iti a
AO
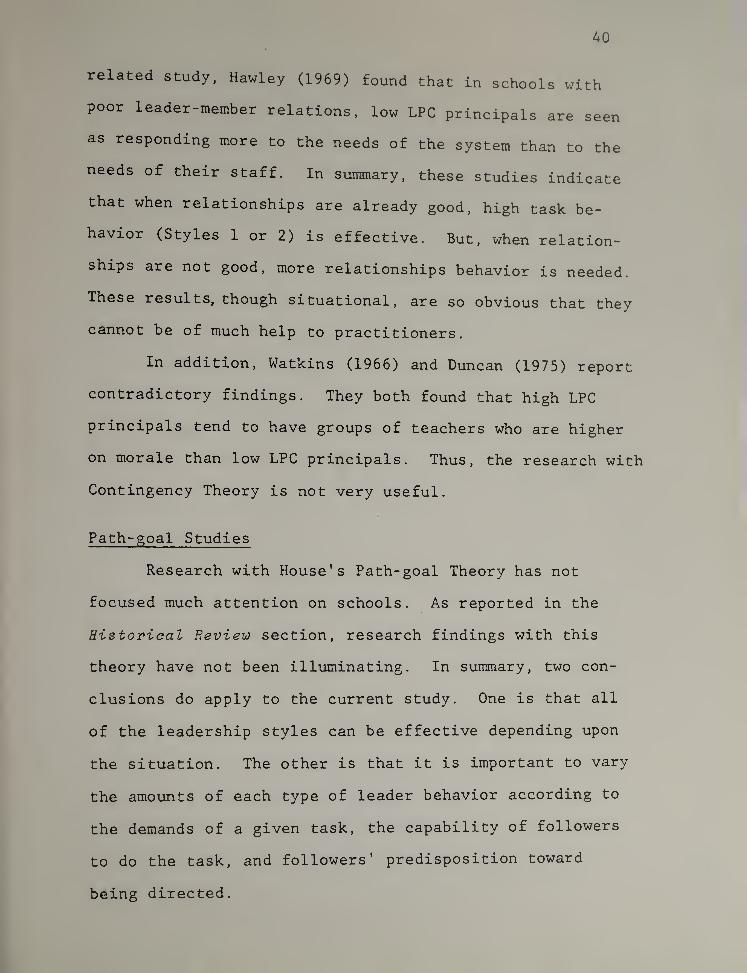
related study, Hawley (1969) found that in schools with
poor leader-member relations, low LPC principals are seen
as responding more to the needs of the system than to the
needs of their staff. In summary, these studies indicate
that when relationships are already good, high task be-
havior (Styles 1 or 2) is effective. But, when relation-
ships are not good, more relationships behavior is needed.
These results, though situational, are so obvious that they
cannot be of much help to practitioners.
In addition, Watkins (1966) and Duncan (1975) report
contradictory findings. They both found that high LPC
principals tend to have groups of teachers who are higher
on morale than low LPC principals. Thus, the research with
Contingency Theory is not very useful.
Path-goal Studies
Research with House's Path-goal Theory has not
focused much attention on schools. As reported in the
Historical Review section, research findings with this
theory have not been illuminating. In summary, two con-
clusions do apply to the current study. One is that all
of the leadership styles can be effective depending upon
the situation. The other is that it is important to vary
the amounts of each type of leader behavior according to
the demands of a given task, the capability of followers
to do the task, and followers' predisposition toward
being directed.
A1
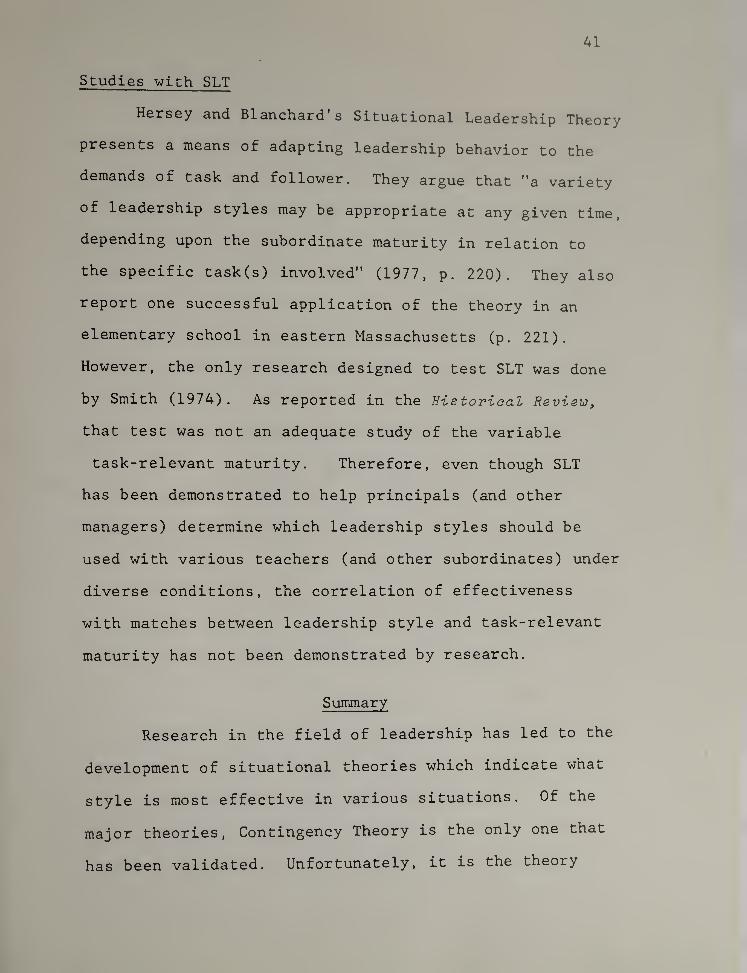
Studies with SLT
Hersey and Blanchard's Situational Leadership Theory
presents a means of adapting leadership behavior to the
demands of task and follower. They argue that "a variety
of leadership styles may be appropriate at any given time,
depending upon the subordinate maturity in relation to
the specific task(s) involved" (1977, p. 220). They also
report one successful application of the theory in an
elementary school in eastern Massachusetts (p. 221).
However, the only research designed to test SLT was done
by Smith (1974). As reported in the Historical Review^
that test was not an adequate study of the variable
task-relevant maturity. Therefore, even though SLT
has been demonstrated to help principals (and other
managers) determine which leadership styles should be
used with various teachers (and other subordinates) under
diverse conditions, the correlation of effectiveness
with matches between leadership style and task-relevant
maturity has not been demonstrated by research.
Summary
Research in the field of leadership has led to the
development of situational theories which indicate what
style is most effective in various situations. Of the
major theories, Contingency Theory is the only one that
has been validated. Unfortunately, it is the theory
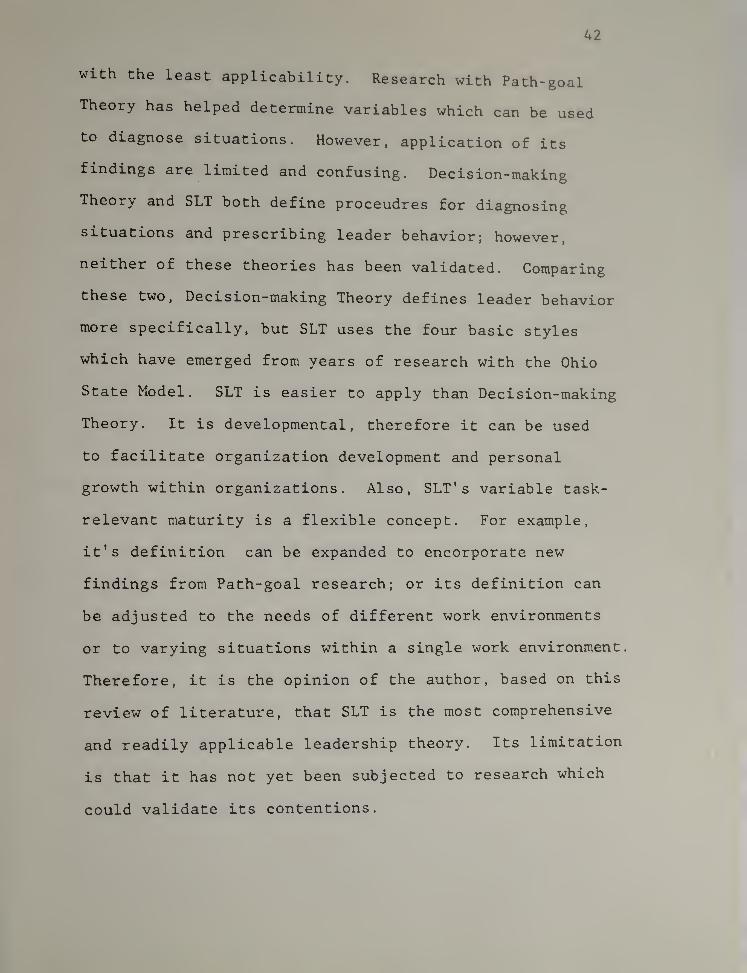
42
with the least applicability. Research with Path-goal
Theory has helped determine variables which can be used
to diagnose situations. However, application of its
findings are limited and confusing. Decision-making
Theory and SLT both define proceudres for diagnosing
situations and prescribing leader behavior; however,
neither of these theories has been validated. Comparing
these two, Decision-making Theory defines leader behavior
more specifically, but SLT uses the four basic styles
which have emerged from years of research with the Ohio
State Model. SLT is easier to apply than Decision-making
Theory. It is developmental, therefore it can be used
to facilitate organization development and personal
growth within organizations. Also, SLT's variable task-
relevant maturity is a flexible concept. For example,
it's definition can be expanded to encorporate new
findings from Path-goal research; or its definition can
be adjusted to the needs of different work environments
or to varying situations within a single work environment.
Therefore, it is the opinion of the author, based on this
review of literature, that SLT is the most comprehensive
and readily applicable leadership theory. Its limitation
is that it has not yet been subjected to research which
could validate its contentions.

CHAPTER IIIMETHODOLOGY
This chapter presents descriptions of the study
and the population, the specific hypotheses, the
instrumentation, and the procedures for data collection
and for data analysis.
Description of the Study
The study was designed to validate Situational
Leadership Theory (SLT) . It was a field test of SLT's
basic premise that adapting leadership style to follower
task-relevant maturity results in leader effectiveness.
The research was done with elementary school principals
and teachers. It involved measurements of task-relevant
maturity, leadership style, and leader effectiveness in
relation to specific teacher responsibilities.
Population
The population consisted of twenty-one elementary
school principals and three to five teachers per principal.
Principals were selected by the researcher solely on the
basis of their willingness to participate in the study.
Teachers were selected by their principals on the same
basis. In exchange for their participation, each principal
43

and his/her teachers attended a free after-school work-
shop about SLT and its application to the school and
classroom management.
Below is a list of the participating schools and
their locations:
Donahy SchoolCrocker FarmCold SpringsDeerfield ElementaryMountain ViewErving ElementaryFederal Street NorthFour CornersHolland ElementaryHazard SchoolSouth RoadWest Kingston ElementaryMonson ElementaryButterfieldDexter ParkBondsville ElementaryPalmer ElementaryThree RiversSunderland ElementaryMcDonough
Agawam, MassachusettsAmherst, MassachusettsBelchertown, MassachusettsDeerfield, MassachusettsEast Longmeadow, MassachusettsErving, MassachusettsGreenfield, MassachusettsGreenfield, MassachusettsHolland, MassachusettsKingston, Rhode IslandKingston, Rhode IslandKingston, Rhode IslandMonson, MassachusettsOrange, MassachusettsOrange, MassachusettsPalmer, MassachusettsPalmer, MassachusettsPalmer, MassachusettsSunderland, MassachusettsWest Springfield, Massachusetts
No questionnaire was used to collect demographic
data about the sample. Even so, some information is known
about the participants. Only one of the principals was a
woman, the other twenty were men. Of the teachers, 73 were
women and 12 were men. The schools were all located in
rural and semi-urban New England towns.
Hypotheses
As stated in Chapter I, the general hypothesis of
this study was:
Principal effectiveness is positivelycorrelated with the congruency between
45
principal leadership style and teachertask-relevant maturity.
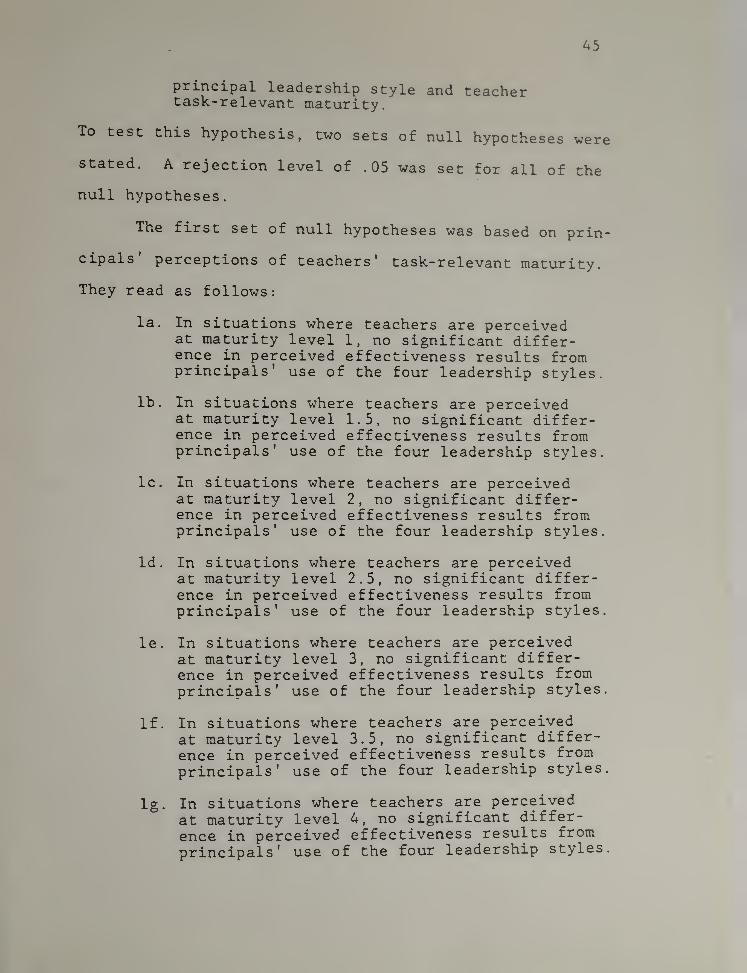
To test this hypothesis, two sets of null hypotheses were
stated. A rejection level of .05 was set for all of the
null hypotheses.
The first set of null hypotheses was based on prin-
cipals' perceptions of teachers' task-relevant maturity.
They read as follows:
la. In situations where teachers are perceivedat maturity level 1, no significant differ-ence in perceived effectiveness results fromprincipals' use of the four leadership styles.
lb. In situations where teachers are perceivedat maturity level 1.5, no significant differ-ence in perceived effectiveness results fromprincipals' use of the four leadership styles.
l c. In situations where teachers are perceivedat maturity level 2, no significant differ-ence in perceived effectiveness results fromprincipals' use of the four leadership styles.
l d. In situations where teachers are perceivedat maturity level 2.5, no significant differ-ence in perceived effectiveness results fromprincipals' use of the four leadership styles.
le. In situations where teachers are perceivedat maturity level 3, no significant differ-ence in perceived effectiveness results fromprincipals' use of the four leadership styles.
l f. In situations where teachers are perceivedat maturity level 3.5, no significant differ-ence in perceived effectiveness results fromprincipals' use of the four leadership styles.
l g. In situations where teachers are perceivedat maturity level 4, no significant differ-
ence in perceived effectiveness results from
principals' use of the four leadership styles.
A6
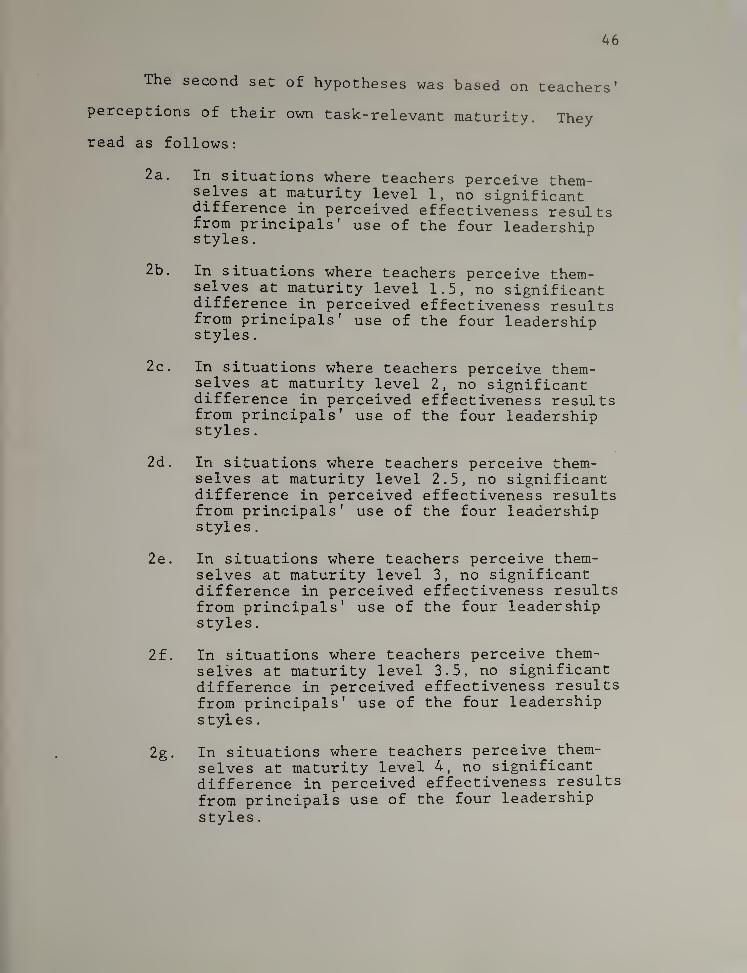
The second set of hypotheses was based on teachers'
perceptions of their own task-relevant maturity. They
read as follows:
2a. In situations where teachers perceive them-selves at maturity level 1, no significantdifference in perceived effectiveness resultsfrom principals' use of the four leadershipstyles
.
2b. In situations where teachers perceive them-selves at maturity level 1.5, no significant<ifff6rence in perceived effectiveness resultsfrom principals' use of the four leadershipstyles
.
2c. In situations where teachers perceive them-selves at maturity level 2, no significantdifference in perceived effectiveness resultsfrom principals' use of the four leadershipstyles
.
2d. In situations where teachers perceive them-selves at maturity level 2.5, no significantdifference in perceived effectiveness resultsfrom principals' use of the four leadershipstyles
.
2e. In situations where teachers perceive them-selves at maturity level 3, no significantdifference in perceived effectiveness resultsfrom principals' use of the four leadershipstyles
.
2f. In situations where teachers perceive them-selves at maturity level 3.5, no significantdifference in perceived effectiveness resultsfrom principals' use of the four leadershipstyl es
.
2g. In situations where teachers perceive them-
selves at maturity level 4, no significantdifference in perceived effectiveness results
from principals use of the four leadershipstyles
.
47
Instrumentation ^
Instruments were developed to help teachers select
job responsibilities and to measure teachers' task-relevant
^^burity,principals leadership style, and principals'
effectiveness. The following paragraphs describe the
instruments used in this research.
Job Responsibilities Form
This form was developed by the researcher speci-
fically for this study. It was designed to help teachers
select job responsibilities, to establish standards for
their selections, to encourage them to choose responsi-
bilities with a range of maturity levels, and to guarantee
that principals and teachers would use the same set of
responsibilities for the other instruments.
The form lists 74 job responsibilities that are
typical for elementary school teachers. It also includes
several blank lines so that teachers can add other respon-
sibilities. The form directs teachers to read through
the list and make any additions they choose. It then
asks them to select five responsibilities about which
they are willing to consider their task-relevant maturity
and their principal's leadership style. Teachers are asked
^The researcher is indebted to Ronald K. Hambleton
who developed similar instruments for a study he is doing
with XEROX and who consented to the modification and use
of his instruments.
48
to select at least one responsibility in which they need
no improvement, one in which they are competent but have
room for improvement, and one in which they need improve-
ment. The last page of the form provides spaces for
teachers to make two copies of their selections, one to
keep and a duplicate to give to their principals.
Piloting of the instrument was done by the researcher
by giving successive drafts to teachers and principals
until no further modifications were suggested. (See
Appendix A for a copy of the Job Responsibilities form.)
Maturity Scale
There are two versions of this instrument, one for
employee self-assessment and another for manager assess-
ment of employees. The forms were developed by Ronald K.
Hambleton, Kenneth H. Blanchard, and Paul Mersey and are
copyrighted (1977) .
The instrument directs respondents to write their
five job responsibilities across the top of the form.
Along the left-hand side of the page is a list of 12
dimensions of job maturity and 12 dimensions of psycho-
logical maturity. Respondents are asked to choose five
diemsnions of job maturity and five of psychological
maturity for each responsibility, and to rate the em-
ployee on a one-to-eight scale for each dimension. Thus,
for each responsibility, the respondent enters ten numbers
between one and eight. These numbers are totalled.
A9
producing a sum for job maturity and another for psycho-
logical maturity. The sums are checked against a scoring
^^^ch designates the level of task-relevant maturity
and the appropriate leadership style to be used with that
level. The matrix designates employees at maturity levels
1, 1-5, 2, 2.5, 3, 3.5, and 4. It also indicates that
for maturity level 1, SI is the appropriate style. For
level 1.5, either SI or S2 is appropriate. And so on for
the other levels. (See Appendices B and C for copies of
the two versions of the Maturity Scale.)
Leadership Style and Performance
This form was developed by the researcher specifi-
cally for this study. It was designed to collect data
from principals. The instrument consists of one item re-
garding principal leadership style and one item regarding
teacher performance. The form includes a page of directions
and a rating form for each teacher. Principals are directed
to write a teacher's job responsibilities across the top
of the rating sheet. Along the left-hand side of the sheet
are the two items. For leadership style, the four leader-
ship styles are described and labelled as SI, S2, S3, and
S4 . Respondents are asked to place a check beside the
leadership style they usually use with each teacher on
each responsibility. For performance, five levels are
described, ranging from unsatisfactory performance to ex-
ceptional performance
.
Respondents are asked to place a
50
check beside the rating that corresponds to their assess-
ment of each teacher's work on each responsibility.
of this instrument was done in two stages.
The first stage involved giving successive drafts to
teachers and principals until no further modifications
were suggested. The second stage involved principals'
filling out the form and then being interviewed by the
researcher to determine the consistency of scores with
verbal accounts of situations. Results of the piloting
suggest that the instrument is valid, but it has not
been submitted to statistical validity tests. (See
Appendix D for a copy of the Leadership Style and Per-
formance Form.)
Leadership Style andEf fectiveness
This form was developed by the researcher speci-
fically for this study. It was designed to collect data
from teachers. The instrument consists of one item re-
garding principal leadership style, one item regarding
teacher performance, two items regarding teacher satis-
faction, and five items regarding principal effectiveness.
The form includes a page of directions, a page for rating
leadership style and performance, and a page for rating
satisfaction and effectiveness. Teachers are directed
to write their job responsibilities across the top of the
rating sheets. Along the left-hand side of the first
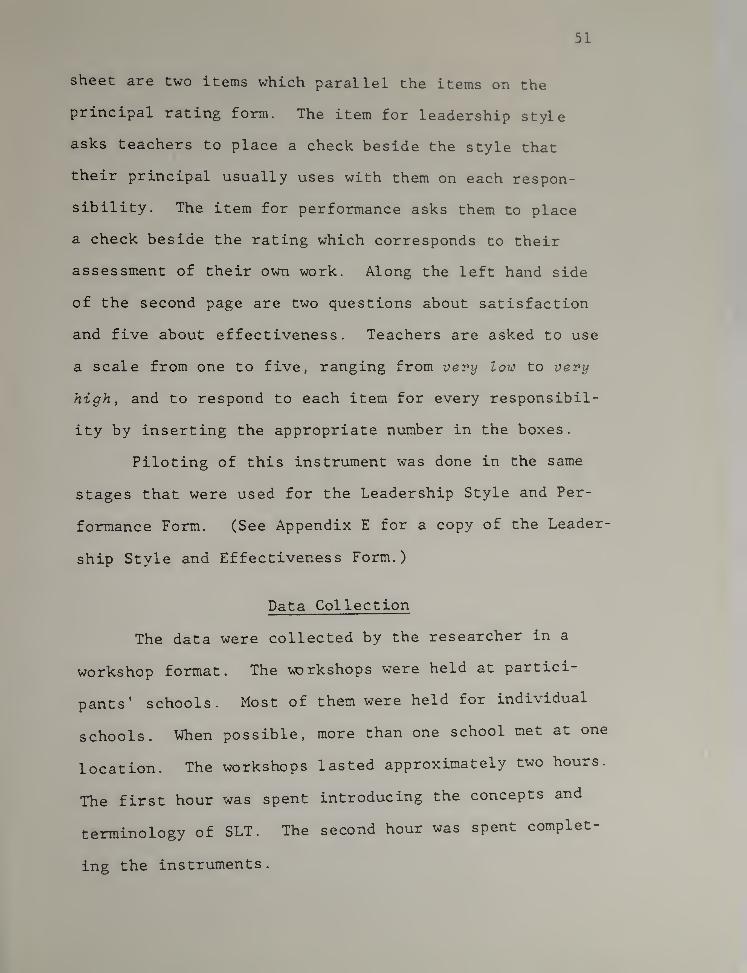
51
sheet are two items which parallel the items on the
principal rating form. The item for leadership style
asks teachers to place a check beside the style that
their principal usually uses with them on each respon-
sibility. The item for performance asks them to place
a check beside the rating which corresponds to their
assessment of their own work. Along the left hand side
of the second page are two questions about satisfaction
and five about effectiveness. Teachers are asked to use
a scale from one to five, ranging from very low to very
high, and to respond to each item for every responsibil-
ity by inserting the appropriate number in the boxes.
Piloting of this instrument was done in the same
stages that were used for the Leadership Style and Per-
formance Form. (See Appendix E for a copy of the Leader-
ship Style and Effectiveness Form.)
Data Collection
The data were collected by the researcher in a
workshop format. The workshops were held at partici-
pants' schools. Most of them were held for individual
schools. When possible, more than one school met at one
location. The workshops lasted approximately two hours.
The first hour was spent introducing the concepts and
terminology of SLT. The second hour was spent complet-
ing the instruments.
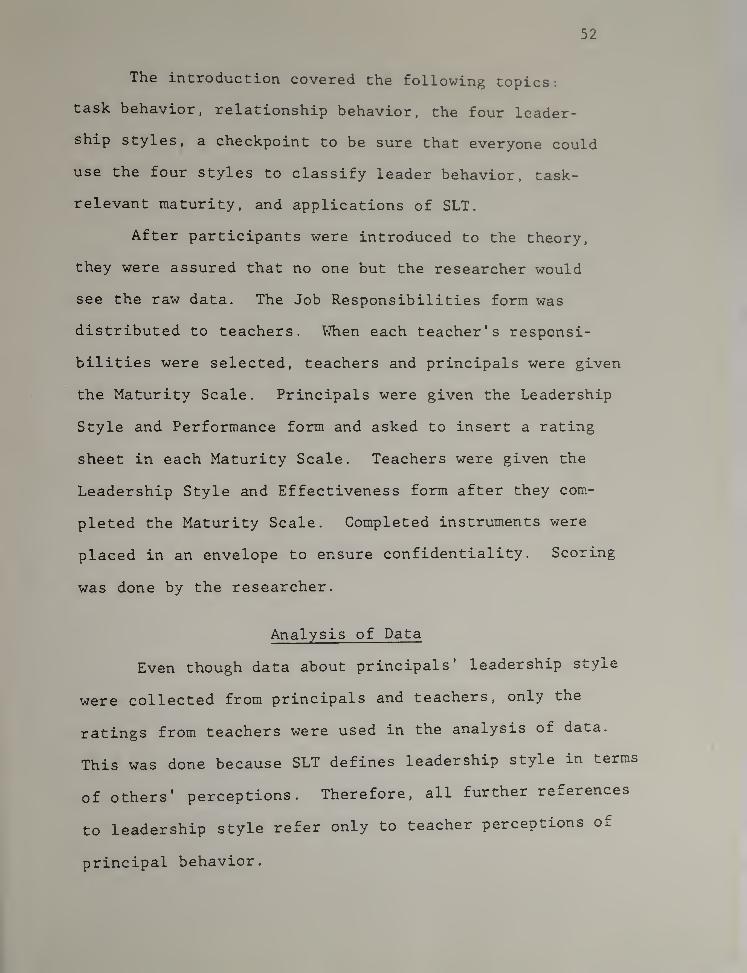
52
The introduction covered the following topics:
task behavior, relationship behavior, the four leader-
ship styles, a checkpoint to be sure that everyone could
use the four styles to classify leader behavior, task-
relevant maturity, and applications of SLT.
After participants were introduced to the theory,
they were assured that no one but the researcher would
see the raw data. The Job Responsibilities form was
distributed to teachers. VThen each teacher's responsi-
bilities were selected, teachers and principals were given
the Maturity Scale. Principals were given the Leadership
Style and Performance form and asked to insert a rating
sheet in each Maturity Scale. Teachers were given the
Leadership Style and Effectiveness form after they com-
pleted the Maturity Scale. Completed instruments were
placed in an envelope to ensure confidentiality. Scoring
was done by the researcher.
Analysis of Data
Even though data about principals' leadership style
were collected from principals and teachers, only the
ratings from teachers were used in the analysis of data.
This was done because SLT defines leadership style in terms
of others' perceptions. Therefore, all further references
to leadership style refer only to teacher perceptions of
principal behavior.
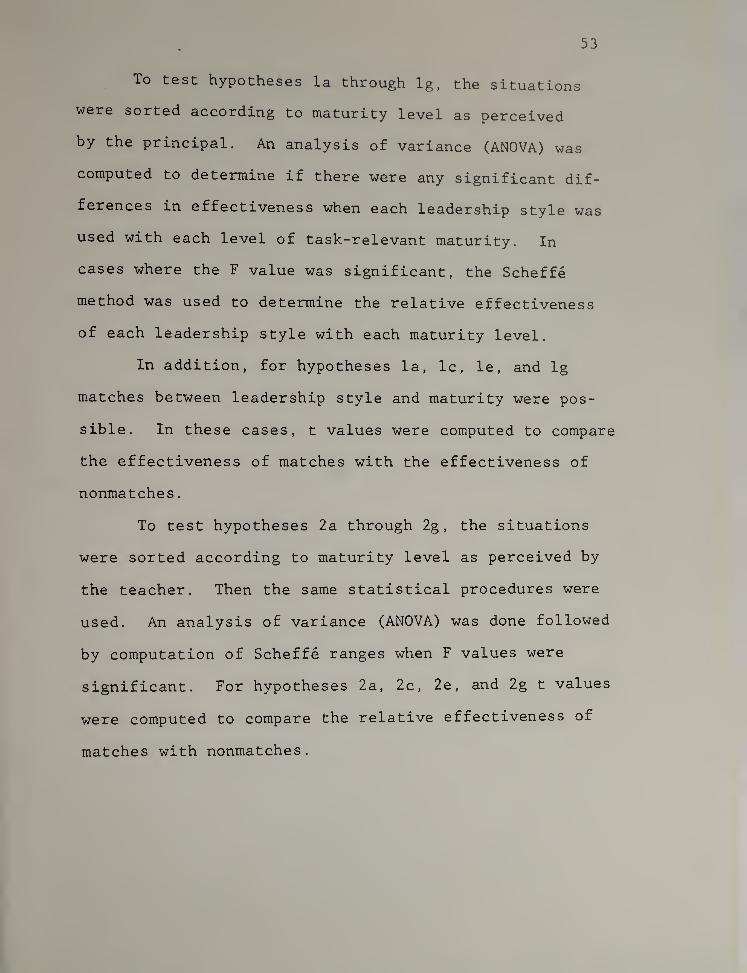
53
To test hypotheses la through Ig, the situations
were sorted according to maturity level as perceived
by the principal. An analysis of variance (ANOVA) was
computed to determine if there were any significant dif-
ferences in effectiveness when each leadership style was
used with each level of task-relevant maturity. In
cases where the F value was significant, the Scheffe
method was used to determine the relative effectiveness
of each leadership style with each maturity level.
In addition, for hypotheses la, Ic, le, and Ig
matches between leadership style and maturity were pos-
sible. In these cases, t values were computed to compare
the effectiveness of matches with the effectiveness of
nonmatches
.
To test hypotheses 2a through 2g ,the situations
were sorted according to maturity level as perceived by
the teacher. Then the same statistical procedures were
used. An analysis of variance (ANOVA) was done followed
by computation of Scheffe ranges when F values were
significant. For hypotheses 2a, 2c, 2e, and 2g t values
were computed to compare the relative effectiveness of
matches with nonmatches.
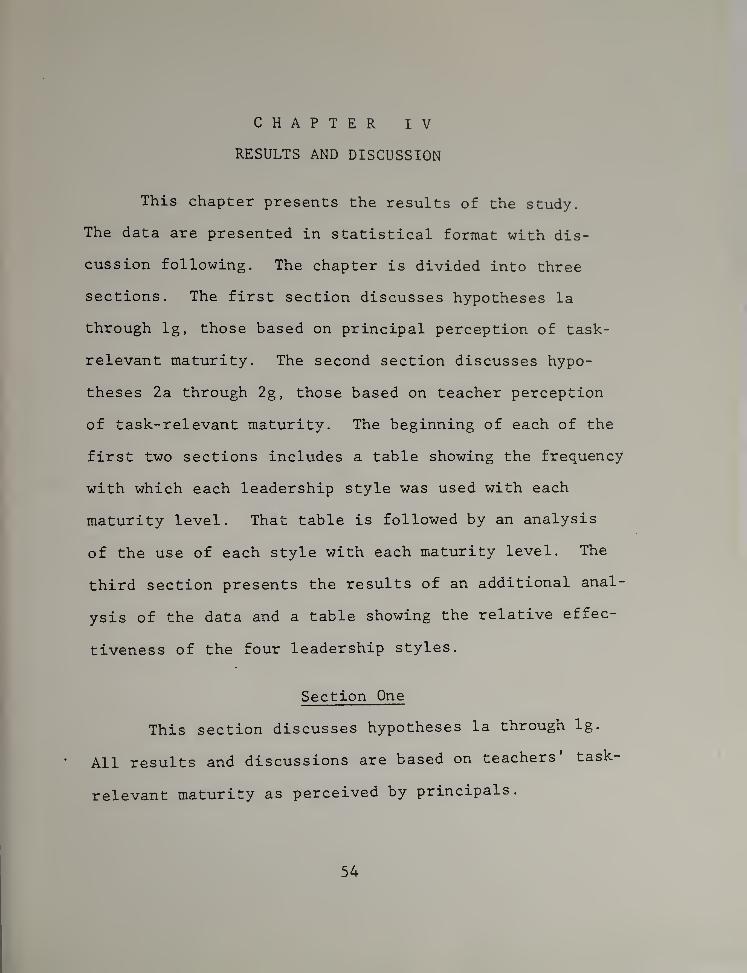
CHAPTER IV
RESULTS AND DISCUSSION
This chapter presents the results of the study.
The data are presented in statistical format with dis-
cussion following. The chapter is divided into three
sections. The first section discusses hypotheses la
through Ig, those based on principal perception of task-
relevant maturity. The second section discusses hypo-
theses 2a through 2g, those based on teacher perception
of task-relevant maturity. The beginning of each of the
first two sections includes a table showing the frequency
with which each leadership style was used with each
maturity level. That table is followed by an analysis
of the use of each style with each maturity level. The
third section presents the results of an additional anal-
ysis of the data and a table showing the relative effec-
tiveness of the four leadership styles.
Section One
This section discusses hypotheses la through Ig.
All results and discussions are based on teachers' task-
relevant maturity as perceived by principals.
54
55
Cross tabulations
Table 3 shows how often each leadership style was
used with each level of maturity. Overall, teachers rated
their principals at SI in 4% of the 409 situations; S2,
217o; S3, 317,; and S4, 447,. Principals rated their teachers
at maturity level 1 in 17o of the 409 situations; maturity
level 1.5, 97,; maturity level 2, 37o; maturity level 2.5,
27o; maturity level 3, 127,; maturity level 3.5, 177o; and
maturity level 4, 677,.
Teachers were perceived at maturity level 1 in 2
situations. Of those 2 situations, S2 was used once and
S4 was used once.
There were no situations in which teachers were
perceived at maturity level 1.5.
Teachers were perceived at maturity level 2 in 12
situations. Of those 12 situations, SI was used 2 times,
52 was used once, S3 was used 3 times, and S4 was used 6
times
.
Teachers were perceived at maturity level 2.5 in
7 situations. Of those 7 situations, SI was used once,
53 was used 3 times, and S4 was also used 3 times.
Teachers were perceived at maturity level 3 in 47
situations. Of those 47 situations, SI was used twice,
S2 was used 9 times, S3 was used 15 times, and S4 was
used 21 times.
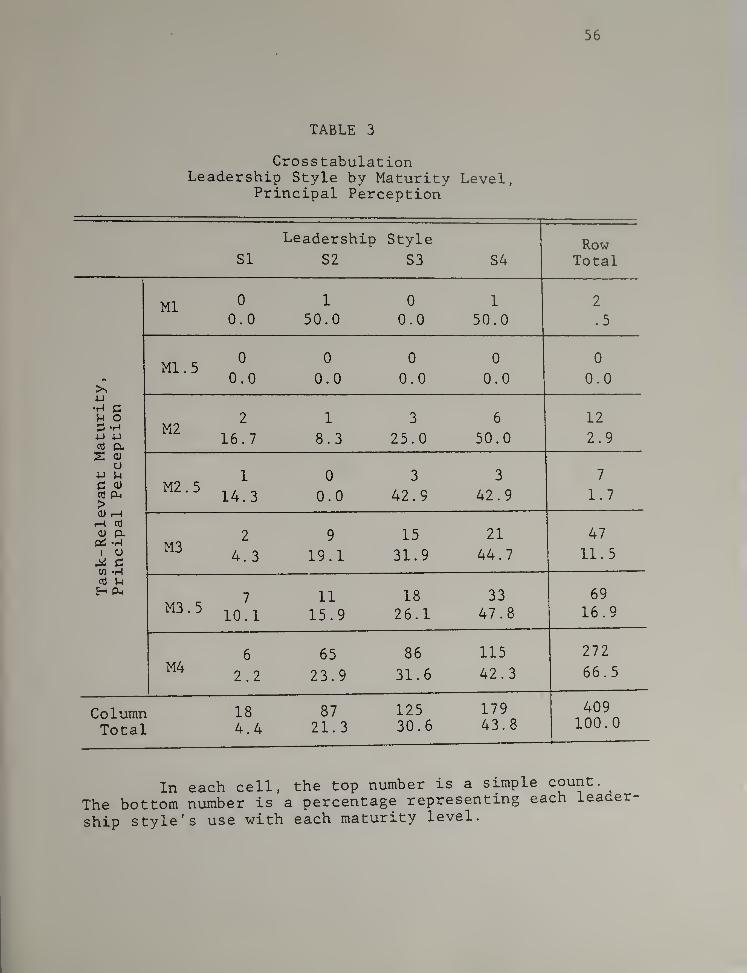
56
TABLE 3
Cross tabulationLeadership Style by Maturity Level,
Principal Perception
Leadership Style RowSI S2 S3 S4 Total
Ml 0 1 0 1 2
0.0 50.0 0.0 50.0 .5
Ml. 50 0 0 0 0
0.0 0.0 0.0 0.0 0.04J
•H C12o 2 1 3 6
:3 -H4-J 4-)
cfl aM2
16.7 8.3 25.0 50.0 2.9
2 (U
ou U 1 0 3 3 7C Q>
cd p-i
>
M2.
5
14.3 0.0 42.9 42.9 1.7O r—{
470) a 2 9 15 21PCj
1 o
ro *pH
M34.3 19.1 31.9 44.7 11.5
cd u
M3.
5
7 11 18 33 69
10.1 15.9 26.1 47.8 16.9
M46 65 86 115 272
2.2 23.9 31.6 42.3 66.5
Column 18 87 125 179 409
Total 4.4 21.3 30.6 43.8 100.0
In each cell, the top number is a simple count.
The bottom number is a percentage representing each leader
ship style's use with each maturity level.
t
57
Teachers were perceived at maturity level 3.5 in
69 situations. Of those 69 situations, SI was used 7
times, S2 was used 11 times, S3 was used 18 times, and
S4 was used 33 times
.
Teachers were perceived at maturity level 4 in 272
situations. Of those 272 situations, SI was used 6 times,
S2 was used 65 times, S3 was used 86 times, and S4 was
used 115 times.
Hypothesis la
The hypothesis was stated as follows; In situations
where teachers are perceived at maturity level 1, no
significant difference in perceived effectiveness results
from principals' use of the four leadership styles.
There were only two situations in which teachers
were perceived at maturity level 1, therefore there were
insufficient data to test this hypothesis.
Hypothesis lb
The hypothesis was stated as follows: In situa-
tions where teachers are perceived at maturity level 1.5,
no significant difference in perceived effectiveness
results from principals' use of the four leadership styles.
There were no situations in which teachers were
perceived at maturity level 1.5, therefore there were
insufficient data to test this hypothesis.
58
Hypothesis Ic
The hypothesis was stated as follows: In situations
where teachers are perceived at maturity level 2, no sig-
nificant difference in perceived effectiveness results
from principals’ use of the four leadership styles.
There were 12 situations in which teachers were per-
ceived at maturity level 2. Of those 12 situations, SI was
only used twice, S2 once, S3 three times and S4 six. There-
fore, there were insufficient data to test this hypothesis.
Hypothesis Id
The hypothesis was stated as follows: In situations
where teachers are perceived at maturity level 2.5, no
significant difference in perceived effectiveness re-
sults from principals' use of the four leadership styles.
There were only seven situations in which teachers
were perceived at maturity level 2.5, therefore there
were insufficient data to test this hypothesis.
Hypothesis le
The hypothesis was stated as follows: In situations
where teachers are perceived at maturity level 3, no signi-
ficant difference in perceived effectiveness results from
principals' use of the four leadership styles.
The 47 situations were sorted into two groups, matches
and nonmatches of leadership style with task-relevant matur-
ity. A t-test was used to compute mean effectiveness scores
for these two groups. Table 4 shows that the mean effective-
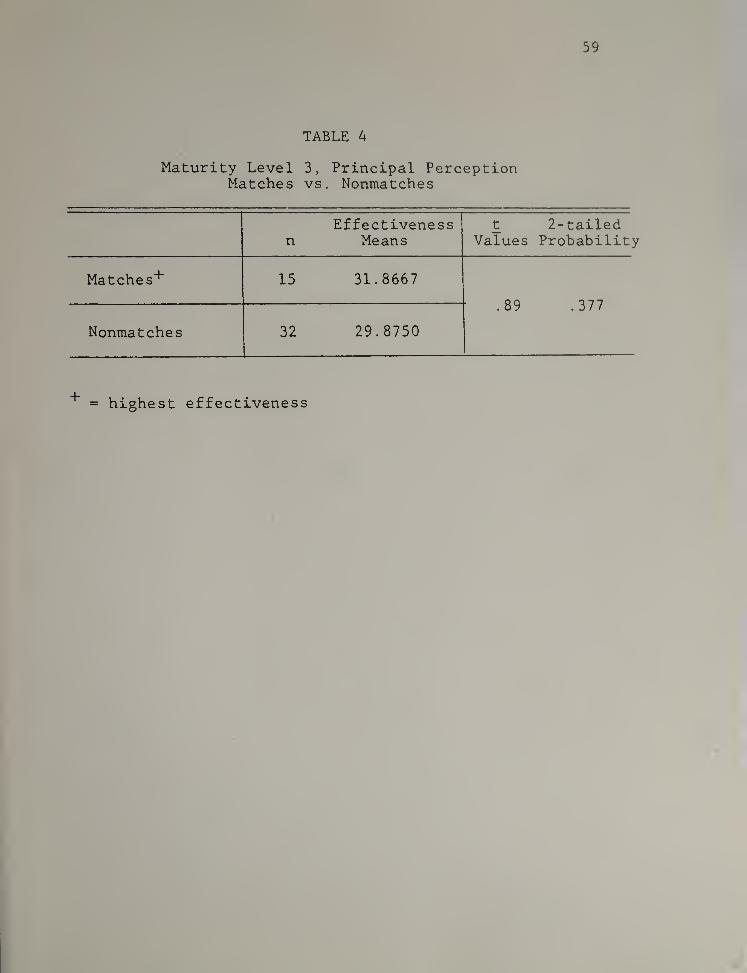
59
TABLE 4
Maturity Level 3, Principal PerceptionMatches vs. Nonmatches
nEffectiveness
Meanst 2-tailed
Values Probability
Matches+ 15 31.8667
.89 .377
Nonmatches 32 29.8750
+ = highest effectiveness
60
ness score for matches was greater than the score for
nonmatches, but the difference between the means was
not significant.
The 47 situations were also sorted into four groups,
one for each of the four leadership styles. Then an anal-
ysis of variance (ANOVA) was used to compute mean effec-
tiveness scores for each group and an F value to compare
the effectiveness scores. Table 5 shows the results of
the ANOVA. The effectiveness means indicate a tendency
for S2 to be perceived as the most effective style, fol-
lowed by S3, S4, and SI. The F probability was greater
than .05, therefore there were no significant relation-
ships among the effectiveness scores of the four groups.
On the basis of the t value and the F value, hypo-
thesis le was accepted in the null form. There were, in
fact, no significant differences resulting from the use of
the four styles.
The fact that there were no significant differences
in perceived effectiveness when the four leadership styles
were used represents a partial rejection of SLT. For SLT
to have been validated, S3 would have had to be perceived
as significantly more effective than the other styles fol-
lowed by S2 and S4. Instead, there was a tendency, though
not significant, for S2 to be perceived as the most ef-
fective style.
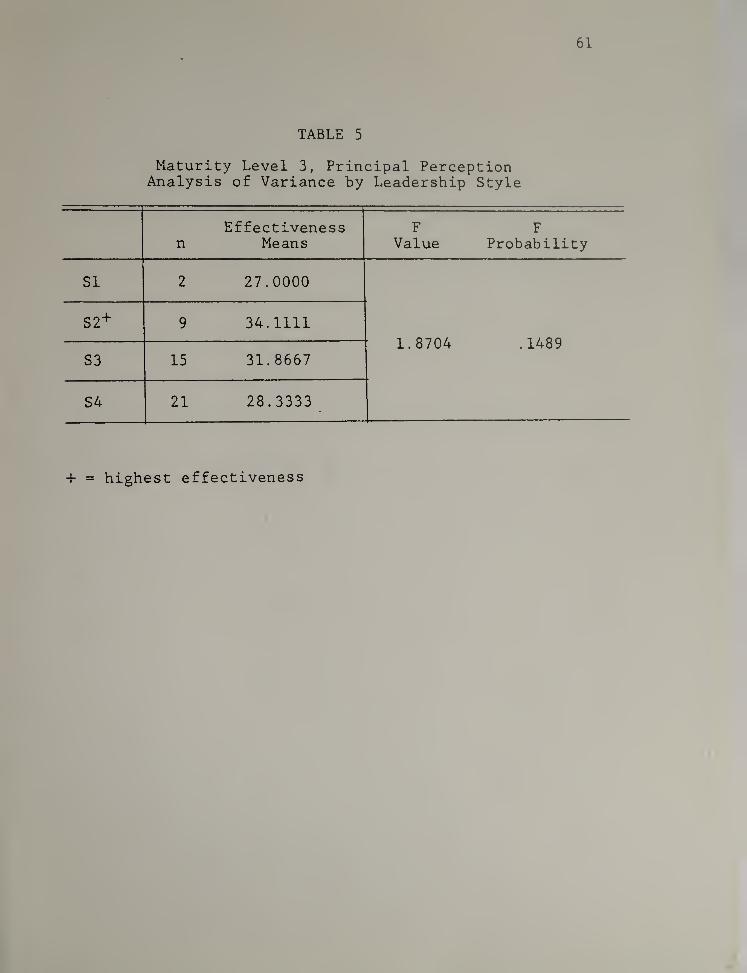
61
TABLE 5
Maturity Level 3, Principal PerceptionAnalysis of Variance by Leadership Style
nEffectiveness
MeansF
ValueF
Probability
SI 2 27.0000
S2+ 9 34.1111
1.8704 .1489S3 15 31.8667
S4 21 28.3333
+ = highest effectiveness
62
Hypothesis If
The hypothesis was stated as follows: In situations
where teachers are perceived at maturity level 3.5, no
significant difference in perceived effectiveness results
from principals use of the four leadership styles.
Since matches of leadership style and task-relevant
maturity were not possible, no t-test was run.
The 69 situations were sorted into four groups, one
for each of the four leadership styles. Then an ANOVA was
used to compute mean effectiveness scores and an F value
to compare the effectiveness scores. Table 6 shows the re-
sults of the ANOVA. The effectiveness means indicate a
tendency for S2 to be perceived as the most effective style,
followed by S3, S4, and SI. The F probability was greater
than .05, therefore there were no significant relationships
among the effectiveness scores of the four groups.
On the basis of the F value, hypothesis If was ac-
cepted in the null form. There were, in fact, no signifi-
cant differences resulting from the use of the four
leadership styles.
The fact that there were no significant differences
in perceived effectiveness when the four leadership styles
were used represents a partial rejection of SLT . For SLT
to have been validated, S3 and S4 would have had to be
perceived as significantly more effective than the other
styles. Instead, there was a tendency for S2 to be per-
ceived as the most effective style even though this result
was not significant.
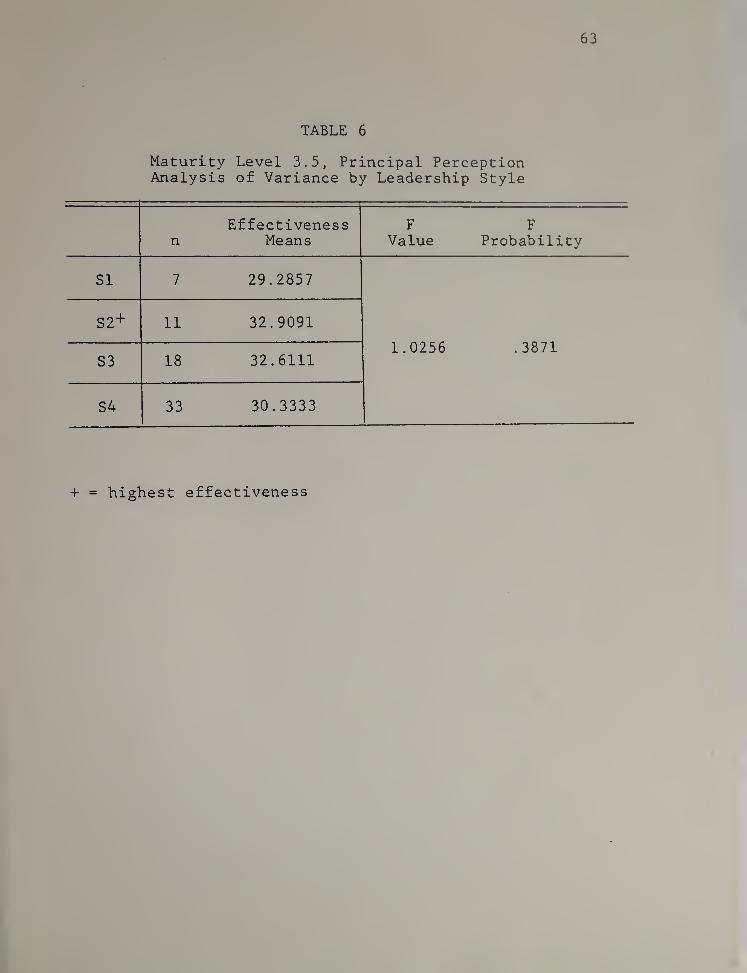
TABLE 6
Maturity Level 3.5, Principal PerceptionAnalysis of Variance by Leadership Style
nEffectiveness
MeansF
ValueF
Probability
SI 7 29.2857
S2+ 11 32.9091
1.0256 .3871S3 18 32.6111
S4 33 30.3333
4- = highest effectiveness
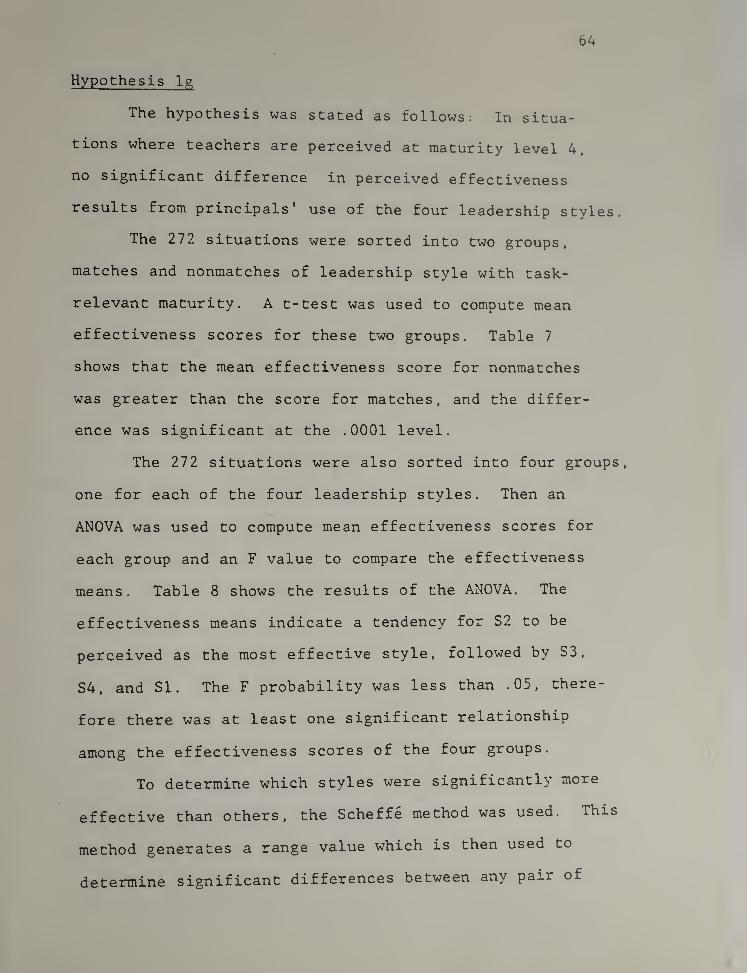
64
Hypothesis Ig
The hypothesis was stated as follows: In situa-
tions where teachers are perceived at maturity level 4,
no significant difference in perceived effectiveness
results from principals' use of the four leadership styles.
The 272 situations were sorted into two groups,
matches and nonmatches of leadership style with task-
relevant maturity. A t-test was used to compute mean
effectiveness scores for these two groups. Table 7
shows that the mean effectiveness score for nonmatches
was greater than the score for matches, and the differ-
ence was significant at the .0001 level.
The 272 situations were also sorted into four groups,
one for each of the four leadership styles. Then an
ANOVA was used to compute mean effectiveness scores for
each group and an F value to compare the effectiveness
means. Table 8 shows the results of the ANOVA. The
effectiveness means indicate a tendency for S2 to be
perceived as the most effective style, followed by S3,
S4, and SI. The F probability was less than .05, there-
fore there was at least one significant relationship
among the effectiveness scores of the four groups.
To determine which styles were significantly more
effective than others, the Scheffe method was used. This
method generates a range value which is then used to
determine significant differences between any pair of
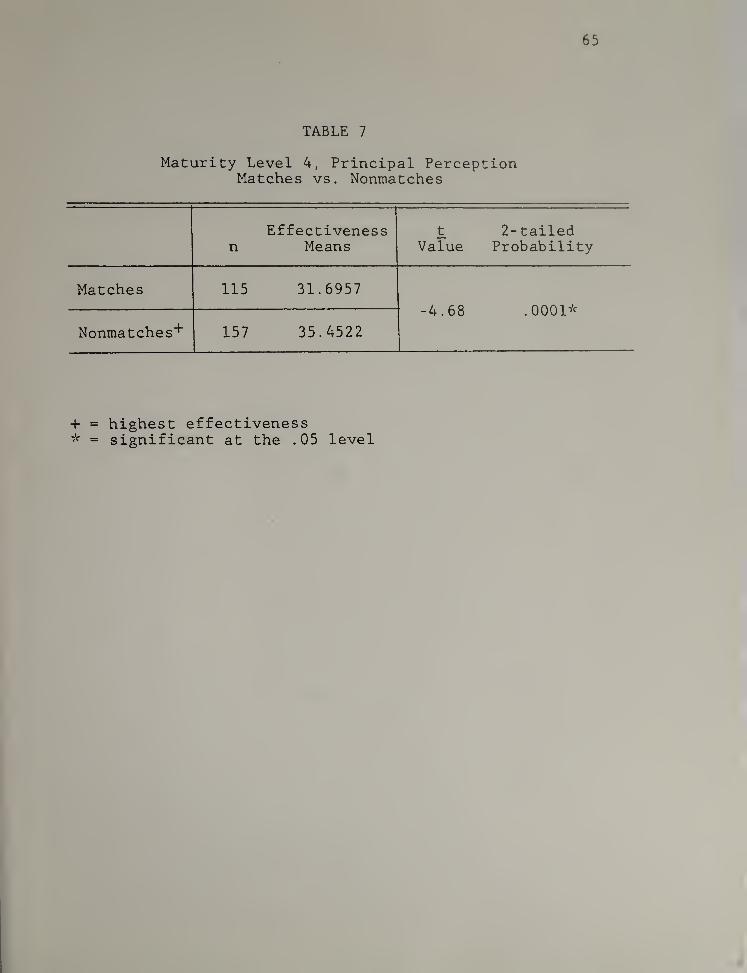
65
TABLE 7
Maturity Level 4, Principal PerceptionMatches vs. Nonmatches
nEffectiveness
Meanst 2-tailed
Value Probability
Matches 115 31.6957
-4.68 .0001*
Nonmatches"^ 157 35.4522
+ = highest effectiveness* = significant at the .05 level
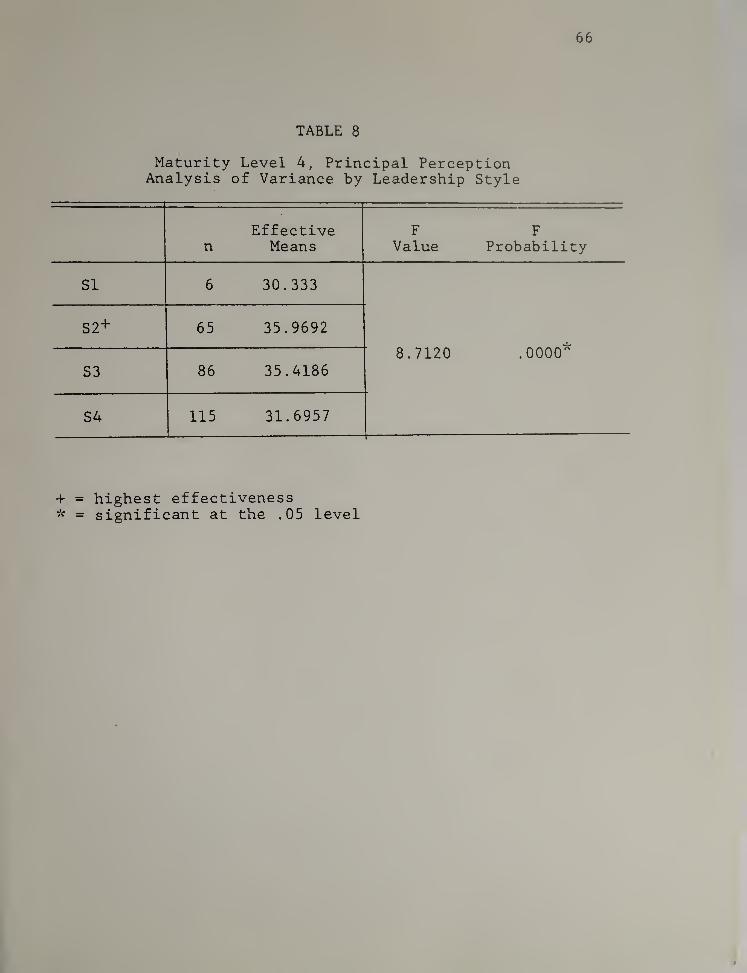
66
TABLE 8
Maturity Level 4, Principal PerceptionAnalysis of Variance by Leadership Style
nEffective
MeansF
ValueF
Probability
SI 6 30.333
S2+ 65 35.9692
8.7120 .0000*
S3 86 35.4186
S4 115 31.6957
+ = highest effectiveness* = significant at the .05 level
t
67
scores. Table 9 shows the results of the Scheffe method.
S3 was perceived to be significantly more effective than
S4. S2 was also perceived to be significantly more ef-
fective than S4.
Based on the t value and the F value, hypothesis
Ig was rejected. A significant difference in effective-
ness did, in fact, result from principals' use of differ-
ent leadership styles.
The rejection of this hypothesis does not represent
a validation of SLT. On the contrary, it represents a
statistically significant rejection of the theory. For
SLT to have been validated, S4 would have had to be per-
ceived as significantly more effective than the other
styles, followed by S3, S2, and SI. Instead, S2 was
perceived to be the most effective style. In addition,
S3 was also perceived to be significantly more effective
than S4
.
Section Two
This section discusses hypotheses 2a through 2g.
All results and discussions are based on teachers' task-
relevant maturity as perceived by teachres.
Cross tabulations
Table 10 shows how often each leadership style was
used with each level of maturity. Overall, teachers
rated their principals at SI in 4% of the 409 situations
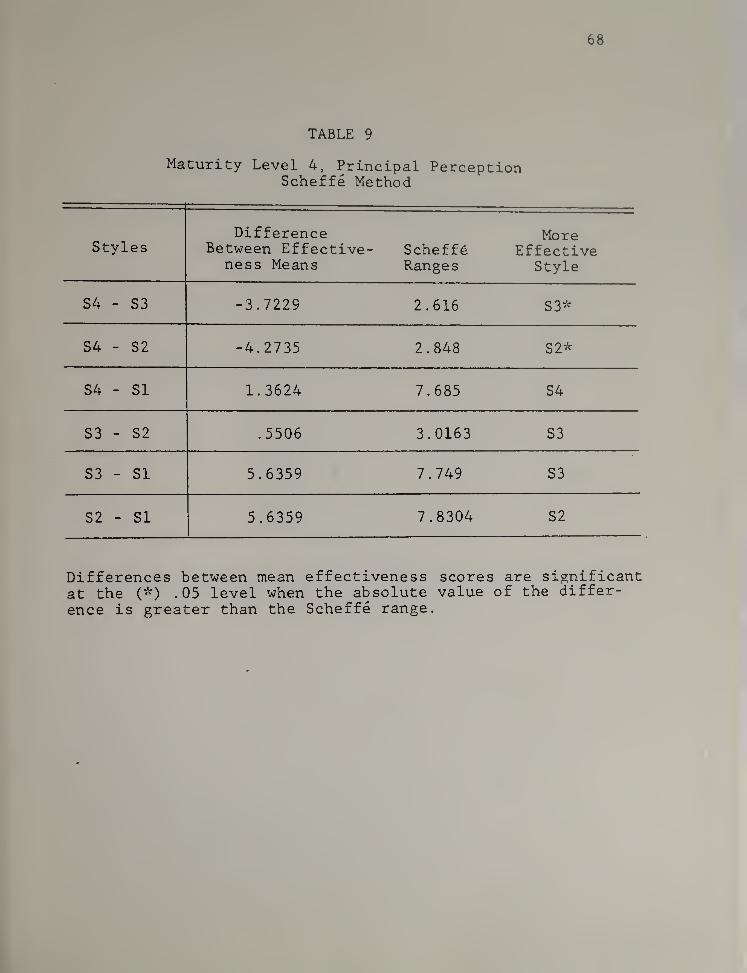
68
TABLE 9
Maturity Level 4, Principal PerceptionScheffe Method
StylesDifference
Between Effective-ness Means
ScheffeRanges
MoreEffective
Style
S4 - S3 -3.7229 2.616 S3*
S4 - S2 -4.2735 2.848 S2*
S4 - SI 1.3624 7.685 S4
S3 - S2 .5506 3.0163 S3
S3 - SI 5.6359 7.749 S3
S2 - SI 5.6359 7.8304 S2
Differences between mean effectiveness scores are significantat the (*) .05 level when the absolute value of the differ-
ence is greater than the Scheffe range.
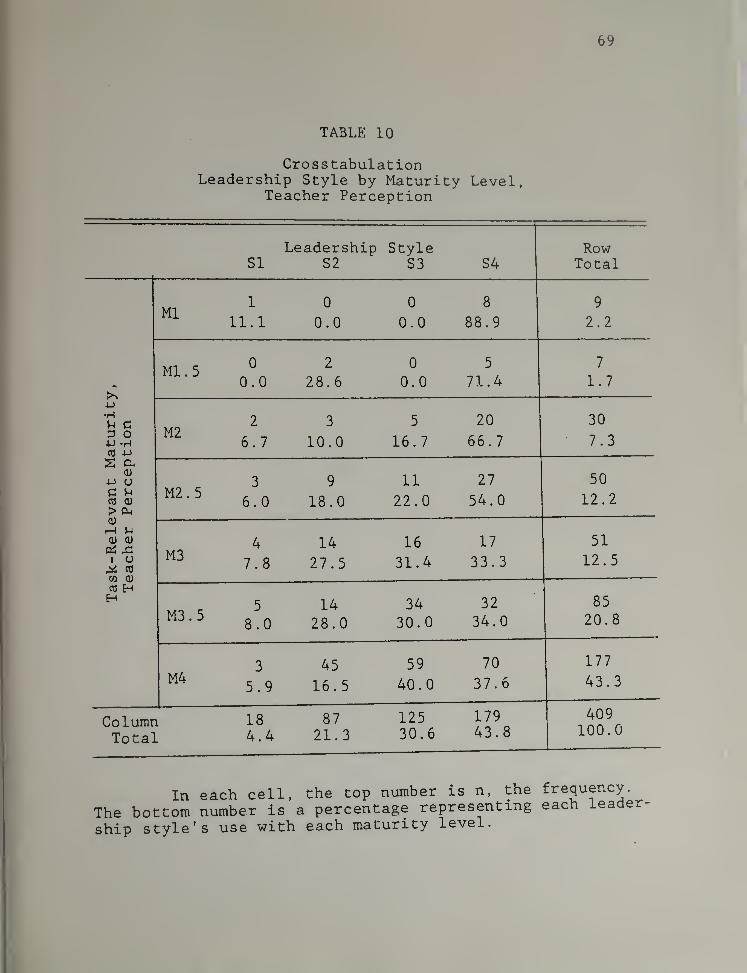
69
TABLE 10
Cross tabulationLeadership Style by Maturity Level,
Teacher Perception
Leadership Style RowSI S2 S3 S4 Total
Ml1 0 0 8 9
11.1 0.0 0.0 88.9 2.2
Ml. 50 2 0 5 7
0.0 28.6 0.0 71.4 1.7>^
4-
1
•H
5-
1 CM2
2 3 5 20 30d oU -H 6.7 10.0 16.7 66.7 7.3nj 4-)
S aOJ
4-) O 3 9 11 27 50C 5-1
C3 <UM2.
5
6.0 18.0 22.0 54.0 12.2> P40)
1—* M51
12.5
0) <U
Pi x:1 o^ cd
W 0)
cO H
M34
7.8
14
27.5
16
31.4
17
33.3
M3.
5
5 14 34 32 85H
8.0 28.0 30.0 34.0 20.8
M43 45 59 70 177
5.9 16.5 40.0 37.6 43.3
Column 18 87 125 179 409
Total 4.4 21.3 30.6 43.8 100.0
In each cell, the top number is n, the frequency.
The bottom number is a percentage representing each leader
ship style's use with each maturity level.
70
S2, 214; S3, 314; and S4, 447o. Teachers rated themselves
at maturity level 1 in 24 of the 409 situations; maturity
level 1.5, 2%; maturity level 2, 7%; maturity level 2.5,
127o; maturity level 3, 13%; maturity level 3.5, 21%; and
maturity level 4, 43%.
Teachers perceived themselves at maturity level 1
in 9 situations. Of those 9 situations, SI was used once
and S4 was used 8 times.
Teachers perceived themselves at maturity level 1.5
in 7 situations. Of those 7 situations, S2 was used
twice and S4 was used 5 times.
Teachers perceived themselves at maturity level 2
in 30 situations. Of those 30 situations, SI was used
twice, S2 was used 3 times, S3 was used 5 times, and S4
was used 20 times.
Teachers perceived themselves at maturity level
2.5 in 50 situations. Of those 50 situations, SI was
used 3 times, S2 was used 9 times, S3 was used 11 times,
and S4 was used 27 times.
Teachers perceived themselves at maturity level 3
in 51 situations. Of those 51 situations, SI was used 4
times, S2 was used 14 times, S3 was used 16 times, and
S4 was used 17 times.
Teachers perceived themselves at maturity level
3.5 in 85 situations. Of those 85 situations, SI was
used 5 times, S2 was used 14 times, S3 was used 34 times,
and S4 was used 32 times.
71
Teachers perceived themselves at maturity level 4
in 177 situations. Of those 177 situations, SI was
used 3 times, S2 was used 45 times, S3 was used 59
times, and S4 was used 70 times.
Hypothesis 2a
The hypothesis was stated as follows; In situa-
tions where teachers perceive themselves to be at
maturity level 1, no significant difference in perceived
effectiveness results from the use of the four leadership
styles
.
There were only 9 situations in which teachers
perceived themselves at maturity level 1. Of those 9
situations, S4 was used 8 times, SI was used once and
S2 and S3 were not used. Therefore, there were insuf-
ficient data to test this hypothesis.
Hypothesis 2b
The hypothesis was stated as follows; In situations
where teachers perceive themselves to be a maturity level
1.5, no significant difference in perceived effectiveness
results from the use of the four leadership styles.
There were only seven situations in which teachers
perceived themselves at maturity level 1.5. Of those
seven situations, S4 was used 5 times and S2 was used
twice. Therefore, there were sufficient data to test
this hypothesis.
72
Hypothesis 2c
The hypothesis was stated as follows: In situta-
tions where teachers perceive themselves to be at maturity
level 2, no significant difference in perceived effective*
ness results from the use of the four leadership styles.
The 30 situations were sorted into two groups,
matches and nonmatches of leadership style with task-
relevant maturity. A t-test was used to compute mean
effectiveness scores for these two groups. Table 11
shows that the mean effectiveness score for matches was
greater than the score for nonmatches and that the differ-
ence was significant at the .05 level.
The 30 situations were also sorted into four groups,
one for each of the four leadership styles. Then an
ANOVA was used to compute mean effectiveness scores for
each group and an F value to compare the effectiveness
scores. Table 12 shows the results of the ANOVA. The
effectiveness means indicate a tendency for S2 to be
perceived as the most effective style, followed by S4,
S3, and SI. The F probability was greater than .05,
therefore there were no significant relationships among
the effectiveness scores of the four groups.
On the basis of the t value alone, hypotheis 2c
would be rejected since the two-tailed probability
indicated that S2 was perceived to be significantly more
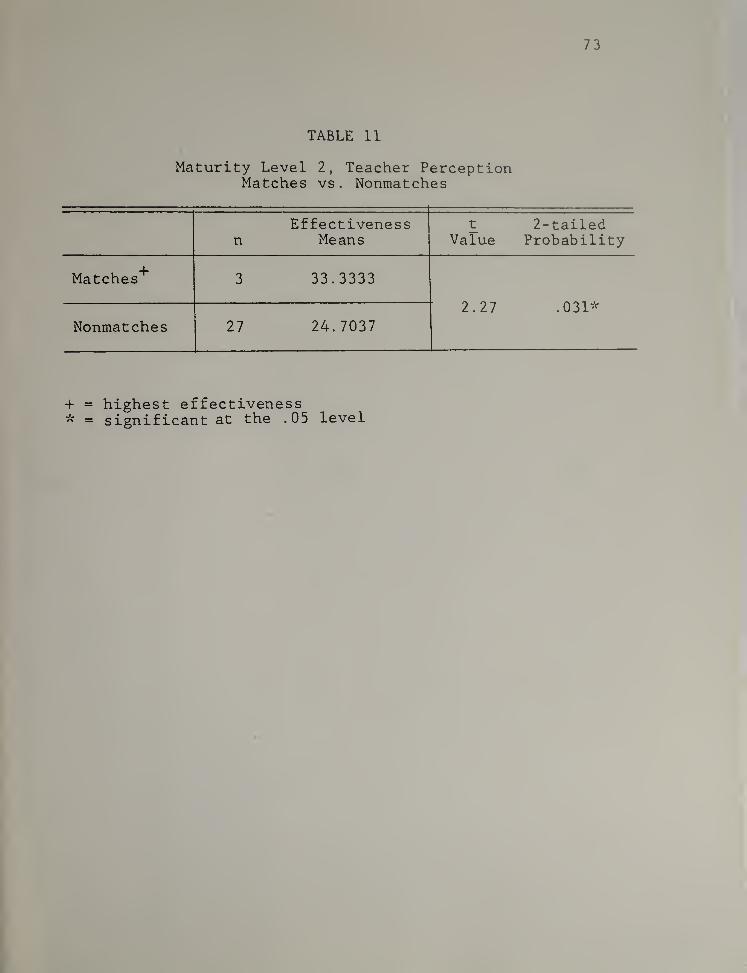
73
TABLE 11
Maturity Level 2, Teacher PerceptionMatches vs. Nonmatches
nEffectiveness
Meanst
Value2- tailed
Probability
Matches'^ 3 33.3333
.031*
Nonmatches 27 24.70372.27
+ = highest effectiveness* = significant at the .05 level
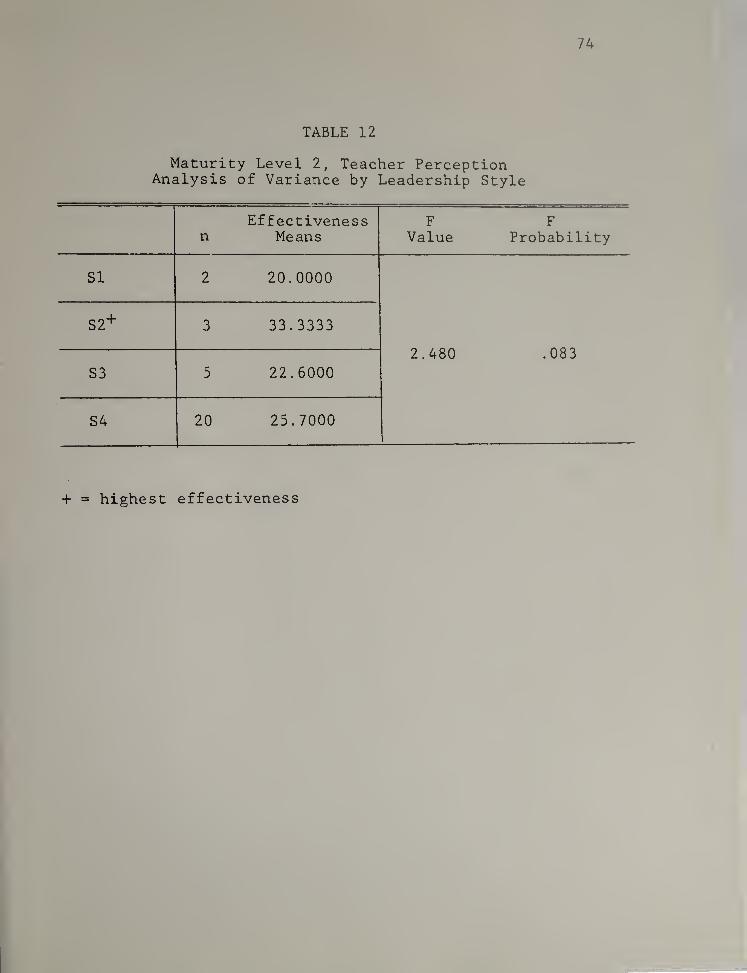
TABLE 12
Maturity Level 2, Teacher PerceptionAnalysis of Variance by Leadership Style
nEffectiveness
MeansF
ValueF
Probability
SI 2 20.0000
S2+ 3 33.3333
2.480 .083
S3 5 22.6000
S4 20 25.7000
+ = highest effectiveness
75
effsctive than tha othar thraa stylas combinad. Howavar,
tha F valua indicatad that thara wara no significant
diffarancas among tha af factivanass maans of tha four
stylas. Tharafora, avan though thara was a tandancy for
S2 to ba parcaivad as tha most affactiva styla with
maturity laval 2, hypothasis 2c was accaptad in tha null
form.
Tha fact that thara wara no significant diffarancas
in parcaivad affactivanass whan tha four laadarship
stylas wara usad raprasants a partial rajaction of SLT.
For SLT to hava baan validatad, S2 would hava had to ba
parcaivad as significantly mora affactiva than tha othar
stylas followad by SI and S3, than S4. Instaad, S2 was
parcaivad to ba tha most affactiva styla but not signi-
ficantly so, and it was followad by S4, not SI or S3.
Hypothasis 2d
Tha hypothasis was statad as follows: In situa-
tions whara taachars parcaiva thamsalvas at maturity laval
2.5, no significant diffaranca in parcaivad affactivanass
rasults from principals' usa of tha four laadarship stylas.
Sinca matchas of laadarship styla and task-ralavant
maturity wara not possible, no t-test was run.
The 50 situations were sorted into four groups,
one for each of the four leadership styles. Then an
ANOVA was used to compute mean effectiveness scores and
76
an F value to compare the effectiveness scores. Table 13
shows the results of the ANOVA. The effectiveness means
indicate a tendency for S2 to be perceived as the most
effective style, followed by SI, S3, and S4 . The F
probability was less than .05, therefore there was at
least one significant relationship among the effective-
ness scores of the four groups.
To determine which styles were significantly more
effective than others, the Scheffe method was used.
Table 14 shows the results of the Scheffe method. S2
was perceived to be significantly more effective than S3.
S2 was also perceived to be significantly more effective
than S4
.
On the basis of the F value, hypothesis 2d was
rejected. A significant difference did result from the
use of different styles.
The rejection of this hypothesis represents a
partial validation of SLT. For SLT to have been fully
validated, S2 and S3 would have had to be perceived as
significantly more effective than SI and S4. Instead,
there was a significant difference in perceived effec-
tiveness between S2 and S3. In addition, SI had a higher
effectiveness score than S3. Therefore, the fact that
S2 was perceived to be the most effective style does
support the theory's contention that matches of leadership
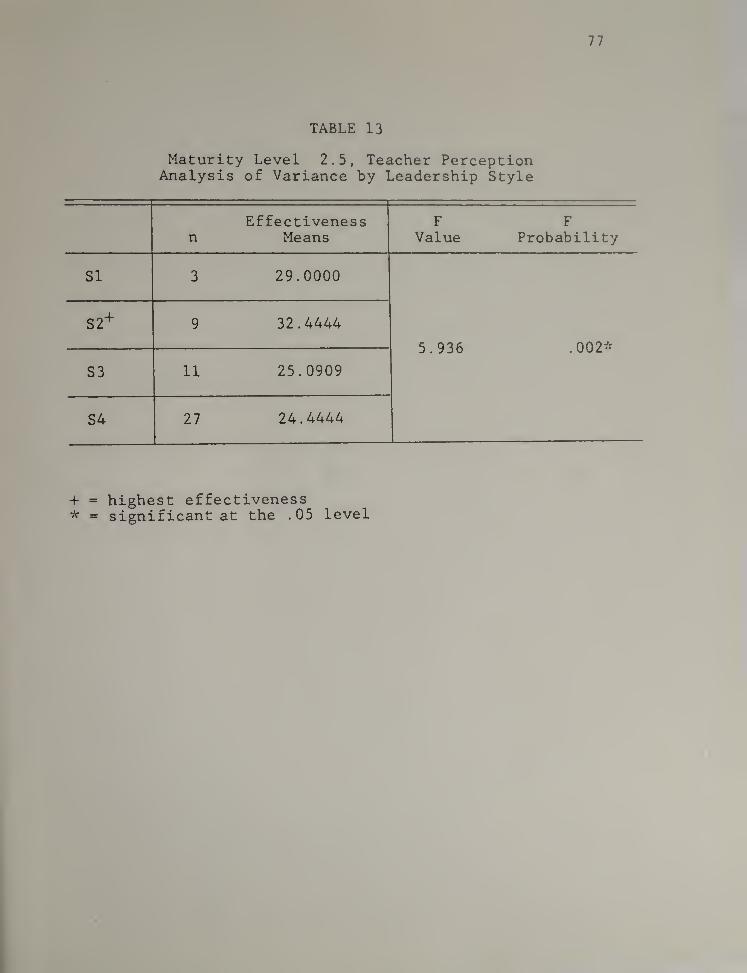
77
TABLE 13
Maturity Level 2.5, Teacher PerceptionAnalysis of Variance by Leadership Style
Effectivenessn Means
F FValue Probability
SI 3 29.0000
5.936 .002*
S2‘'' 9 32.4444
S3 11 25.0909
S4 27 24.4444
+ = highest effectiveness* = significant at the .05 level
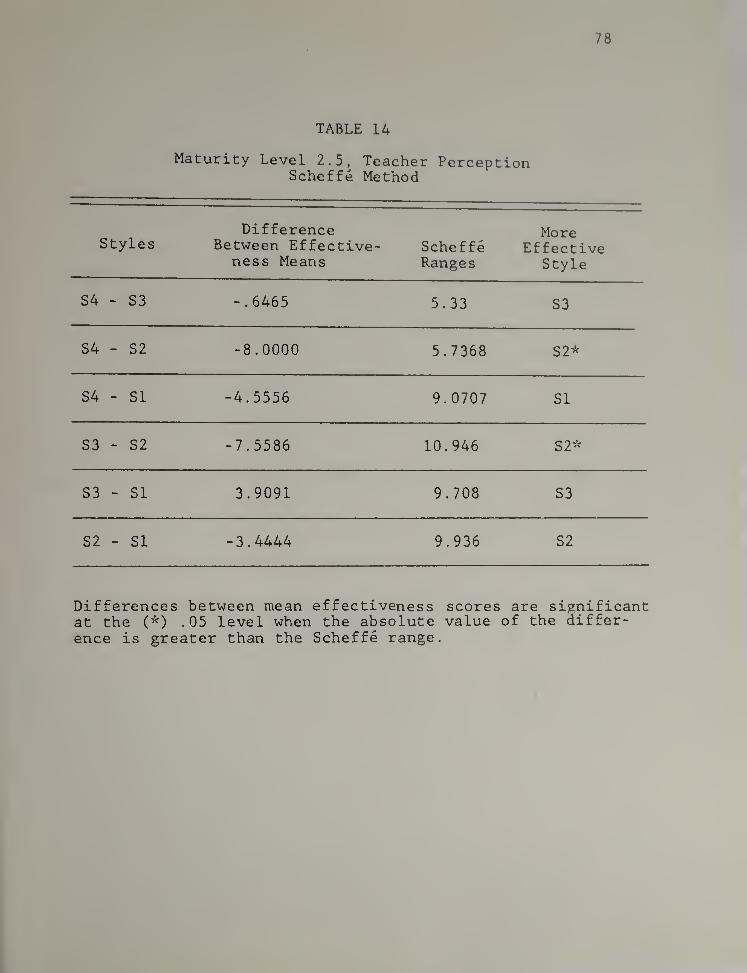
78
TABLE 14
Maturity Level 2.5, Teacher PerceptionScheffe Method
StylesDifference
Between Effective-ness Means
ScheffeRanges
MoreEffective
Style
S4 - S3 -.6465 5.33 S3
S4 - S2 -8.0000 5.7368 S2*
S4 - SI -4.5556 9.0707 SI
S3 - S2 -7.5586 10.946 S2*
S3 - SI 3.9091 9.708 S3
S2 - SI -3.4444 9.936 S2
Differences between mean effectiveness scores are significantat the C"^) .05 level when the absolute value of the differ-ence is greater than the Scheffe range.
79
style with task-relevant maturity do result in leader
effectiveness. On the other hand, the fact that SI
and S2 were perceived to be more effective than S3, and
that S2 was significantly so, represents a contradiction
of SLT.
Hypothesis 2e
The hypothesis was stated as follows: In situations
where teachers perceive themselves at maturity level 3,
no significant difference in perceived effectiveness
results from principals’ use of the four leadership styles.
The 51 situations were sorted into two groups,
matches and nonmatches of leadership style with task-
relevant maturity. A t-test was used to compute mean
effectiveness scores for these two groups. Table 15
shows that the mean effectiveness score for matches was
greater than the score for nonmatches, but the difference
was not significant.
The 51 situations were also sorted into four groups,
one for each of the four leadership styles. Then an
ANOVA was used to compute mean effectiveness scores for
each group and an F value to compare the effectiveness
scores. Table 16 shows the results of the ANOVA. The
effectiveness means indicate that S2 tended to be per-
ceived as the most effective style, followed by S3, SI,
and S4. The F probability was greater than .05, therefore
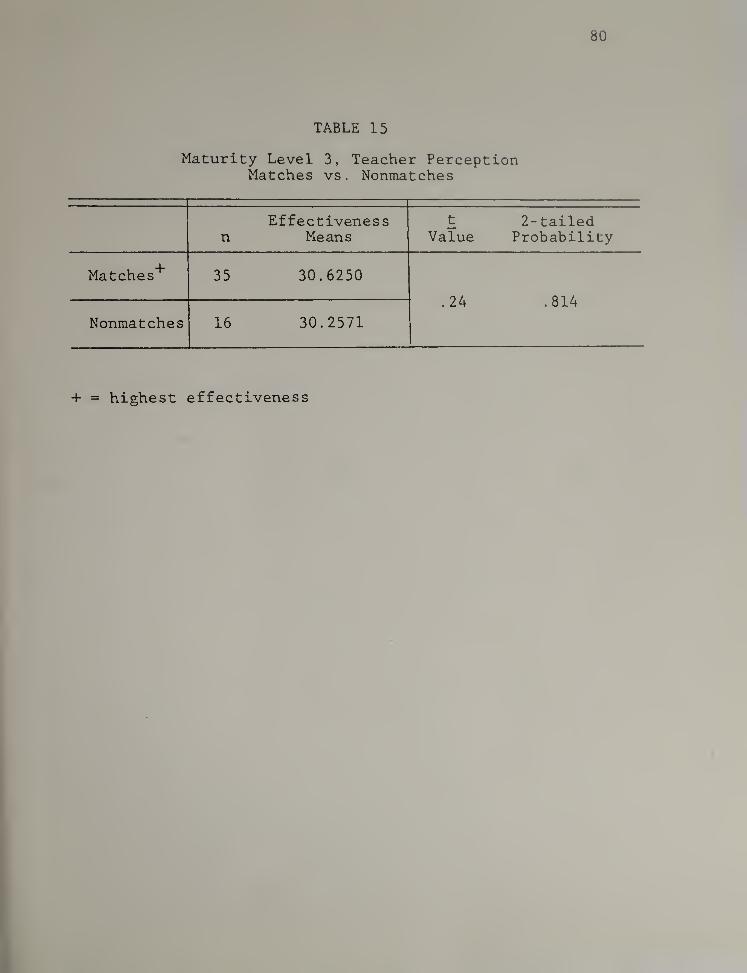
TABLE 15
Maturity Level 3, Teacher PerceptionMatches vs. Nonmatches
Effectivenessn Means
t 2-tailedValue Probability
Matches'^ 35 30.6250
.24 .814
Nonmatches 16 30.2571
+ = highest effectiveness
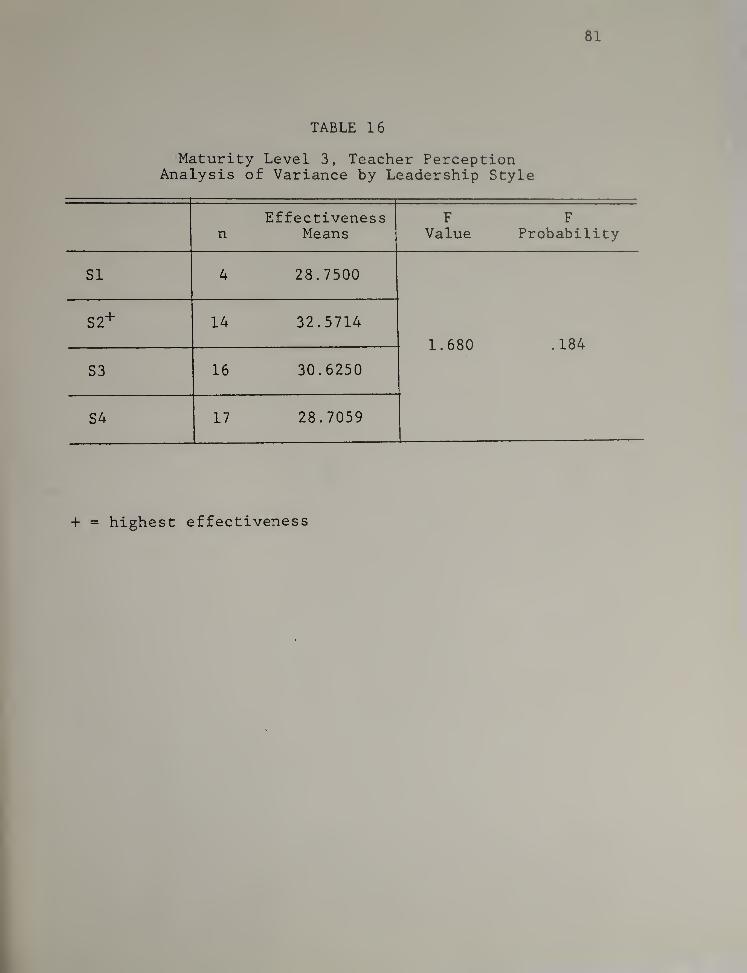
81
TABLE 16
Maturity Level 3, Teacher PerceptionAnalysis of Variance by Leadership Style
Effectivenessn Means
F FValue Probability
SI 4 28.7500
1.680 .184
S2+ 14 32.5714
S3 16 30.6250
S4 17 28.7059
+ = highest effectiveness
82
there were no significant relationships among the effec-
tiveness scores of the four groups.
On the basis of the t value and the F value, hy-
pothesis 2e was accepted in the null form. There were,
in fact, no significant differences resulting from the
use of the four styles.
The fact that there were no significant differences
in perceived effectiveness when the four styles were
used represents a partial rejection of SLT. For SLT to
have been validated, S3 would have had to be perceived as
significantly more effective than the other styles fol-
lowed by S2 and S4, then SI. Instead, there was a tend-
ency, though not significant, for S2 to be perceived as
the most effective style.
Hypothesis 2f
The hypothesis was stated as follows; In situations
where teachers perceive themselves at maturity level
3.5, no significant difference in perceived effectiveness
results from principals* use of the four leadership
styles
.
Since matches of leadership style and task-relevant
maturity were not possible, no t-test was run.
The 85 situations were sorted into four groups, one
for each of the four leadership styles. An ANOVA was
used to compute mean effectiveness scores and an F value
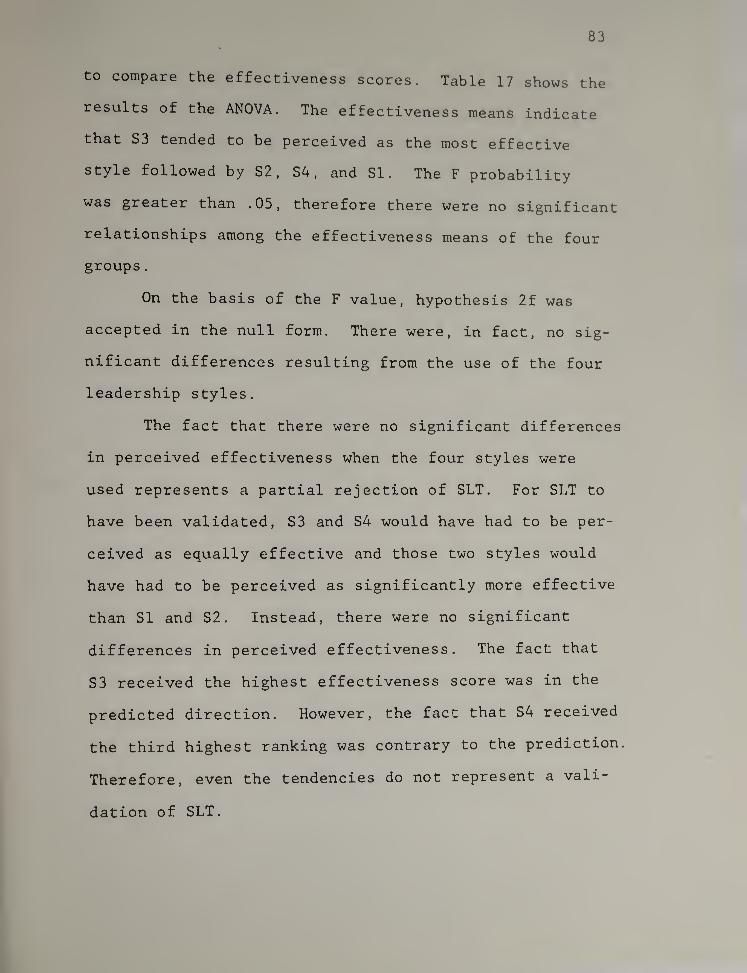
83
to compare the effectiveness scores. Table 17 shows the
results of the ANOVA. The effectiveness means indicate
that S3 tended to be perceived as the most effective
style followed by S2, S4
,and SI. The F probability
was greater than .05, therefore there were no significant
relationships among the effectiveness means of the four
groups
.
On the basis of the F value, hypothesis 2f was
accepted in the null form. There were, in fact, no sig-
nificant differences resulting from the use of the four
leadership styles.
The fact that there were no significant differences
in perceived effectiveness when the four styles were
used represents a partial rejection of SLT. For SLT to
have been validated, S3 and S4 would have had to be per-
ceived as equally effective and those two styles would
have had to be perceived as significantly more effective
than SI and S2. Instead, there were no significant
differences in perceived effectiveness. The fact that
S3 received the highest effectiveness score was in the
predicted direction. However, the fact that S4 received
the third highest ranking was contrary to the prediction.
Therefore, even the tendencies do not represent a vali-
dation of SLT.
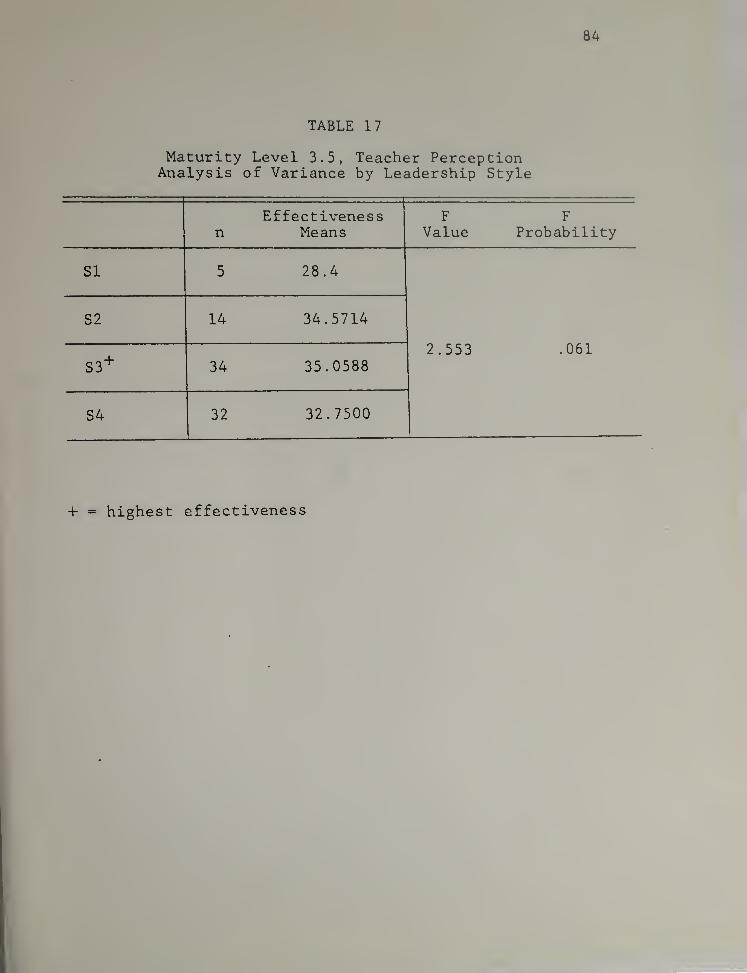
84
TABLE 17
Maturity Level 3.5, Teacher PerceptionAnalysis of Variance by Leadership Style
nEffectiveness
MeansF
ValueF
Probability
SI 5 28.4
S2 14 34.5714
.061
SS"^ 34 35.05882.553
S4 32 32.7500
+ = highest effectiveness
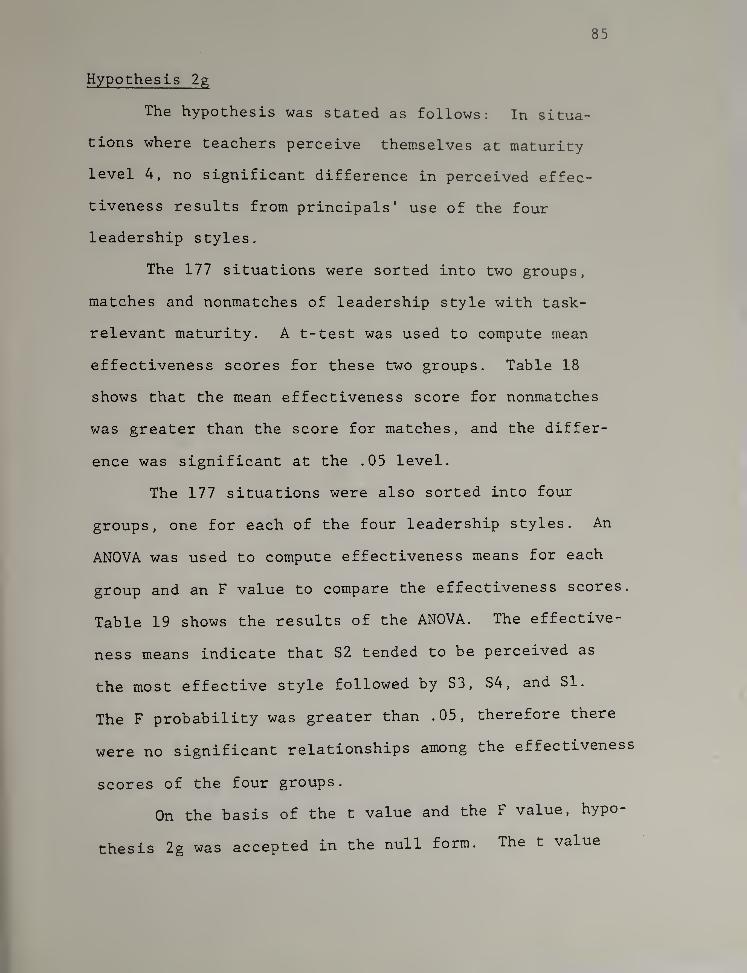
85
Hypothesis Zg
The hypothesis was stated as follows: In situa-
tions where teachers perceive themselves at maturity
level 4, no significant difference in perceived effec-
tiveness results from principals' use of the four
leadership styles.
The 177 situations were sorted into two groups,
matches and nonmatches of leadership style with task-
relevant maturity. A t-test was used to compute mean
effectiveness scores for these two groups. Table 18
shows that the mean effectiveness score for nonmatches
was greater than the score for matches, and the differ-
ence was significant at the .05 level.
The 177 situations were also sorted into four
groups, one for each of the four leadership styles. An
ANOVA was used to compute effectiveness means for each
group and an F value to compare the effectiveness scores.
Table 19 shows the results of the ANOVA. The effective-
ness means indicate that S2 tended to be perceived as
the most effective style followed by S3, S4,and SI.
The F probability was greater than .05, therefore there
were no significant relationships among the effectiveness
scores of the four groups.
On the basis of the t value and the F value, hypo-
thesis 2g was accepted in the null form. The t value
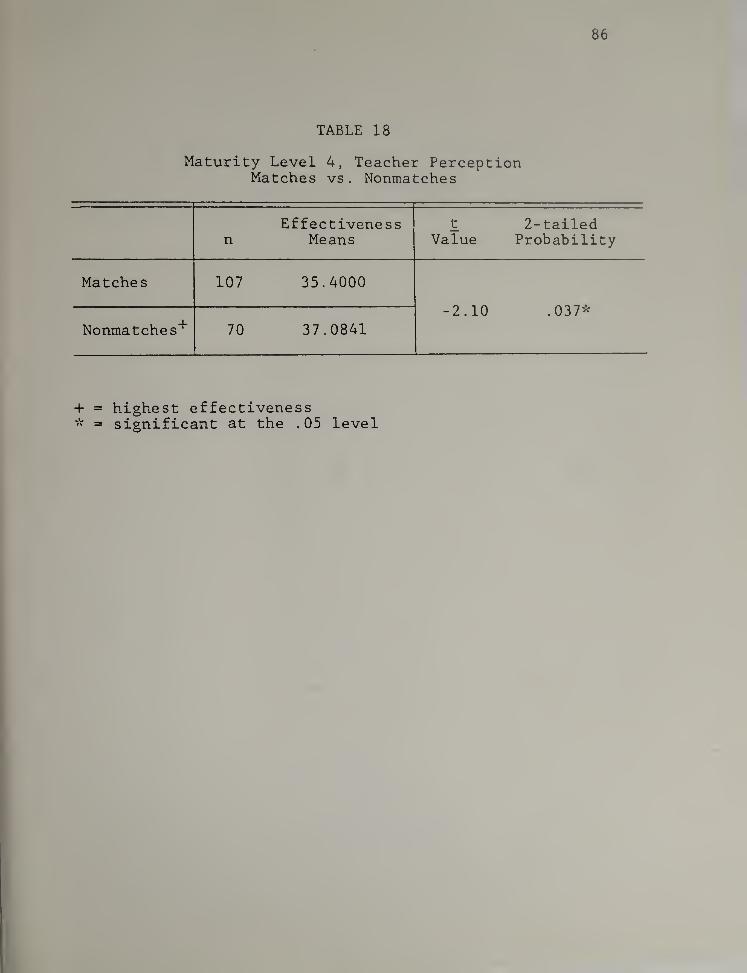
86
TABLE 18
Maturity Level 4, Teacher PerceptionMatches vs . Nonmatches
nEffectiveness
Meanst
Value2- tailed
Prob ability
Matches 107 35.4000
-2.10 .037*
Nonmatches'*’ 70 37.0841
+ = highest effectiveness* = significant at the .05 level
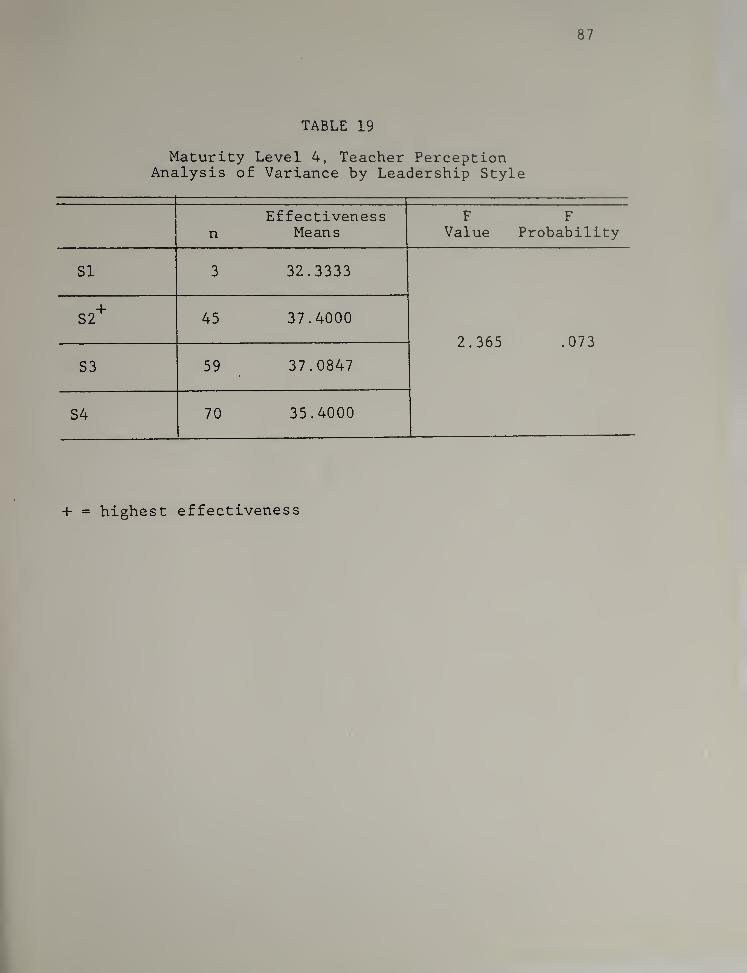
TABLE 19
Maturity Level 4, Teacher PerceptionAnalysis of Variance by Leadership Style
Effectivenessn Means
F FValue Probability
SI 3 32.3333
2.365 .073
S2’^ 45 37.4000
S3 59 37.0847
S4 70 35.4000
+ = highest effectiveness

88
indicatBd that S4 was percaivad to ba lass affactiva
than tha othar stylas combinad and tha F valua indicatad
that thara wara no significant diffarancas in parcaivad
affactivanass rasulting from tha usa of tha four laadar-
ship stylas.
Tha fact that thara wara no significant diffarancas
in parcaivad affactivanass whan tha four stylas wara
used represents a partial rejection of SLT. For SLT to
have been validated, S4 would have had to be perceived as
significantly more effective than S3 followed by S2 and
SI. Instead, there were no significant differences in
perceived effectiveness. In addition, there was a tend-
ency for S2 and S3 to be perceived as more effective
than S4
.
Section Three
This section presents the results of an additional
statistical examination of the data based on the results
reported in sections one and two. Examination of the
results indicated a strong pattern for S2 and S3 to be
the most effective leadership styles. To test the signi-
ficance of this pattern, those situations which were
rated at S2 and S3 were grouped together to form a high
relationship group. Those situations which were rated
at SI and S4 were joined together to form a low relation-
ship group. At every level of maturity where there were
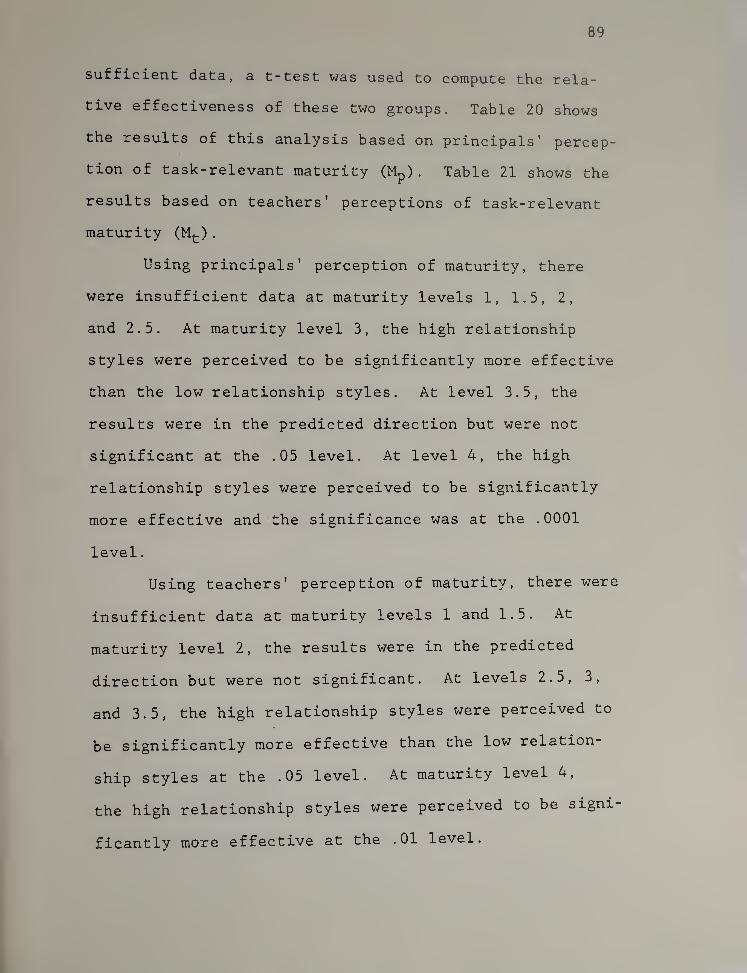
89
sufficient data, a t-test was used to compute the rela-
tive effectiveness of these two groups. Table 20 shows
the results of this analysis based on principals' percep-
tion of task-relevant maturity (Mp) . Table 21 shows the
results based on teachers' perceptions of task-relevant
maturity (Mp)
.
Using principals' perception of maturity, there
were insufficient data at maturity levels 1, 1.5, 2,
and 2.5. At maturity level 3, the high relationship
styles were perceived to be significantly more effective
than the low relationship styles. At level 3.5, the
results were in the predicted direction but were not
significant at the .05 level. At level 4, the high
relationship styles were perceived to be significantly
more effective and the significance was at the .0001
level
.
Using teachers' perception of maturity, there were
insufficient data at maturity levels 1 and 1.5. At
maturity level 2, the results were in the predicted
direction but were not significant. At levels 2.5, 3,
and 3.5, the high relationship styles were perceived to
be significantly more effective than the low relation-
ship styles at the .05 level. At maturity level 4,
the high relationship styles were perceived to be signi-
ficantly more effective at the .01 level.
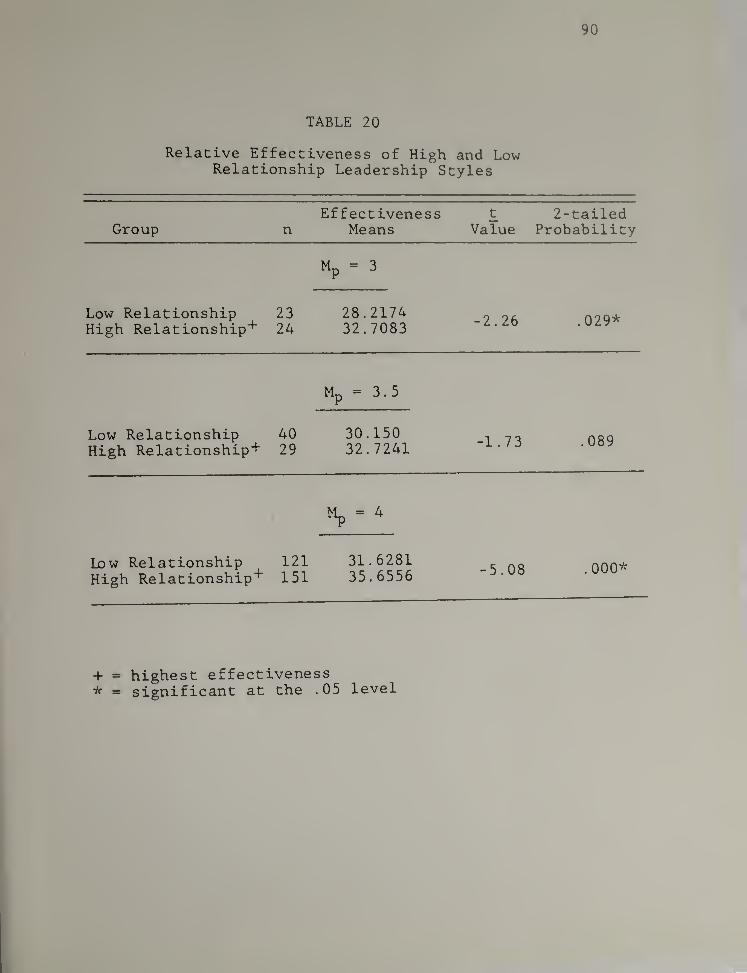
90
TABLE 20
Relative Effectiveness of High and LowRelationship Leadership Styles
Effectiveness t 2-tailedGroup n Means Value Probability
Mp = 3
Low RelationshipHigh Relationship*^
2324
28.217432.7083
-2.26 .029*
Mp = 3.5
Low Relationship 40 30.150-1.73 .089
High Relationship+ 29 32.7241
Mp = 4
Low RelationshipHigh Relationship"^
121151
31.628135.6556 -5.08 .000*
+ = highest effectiveness* = significant at the .05 level
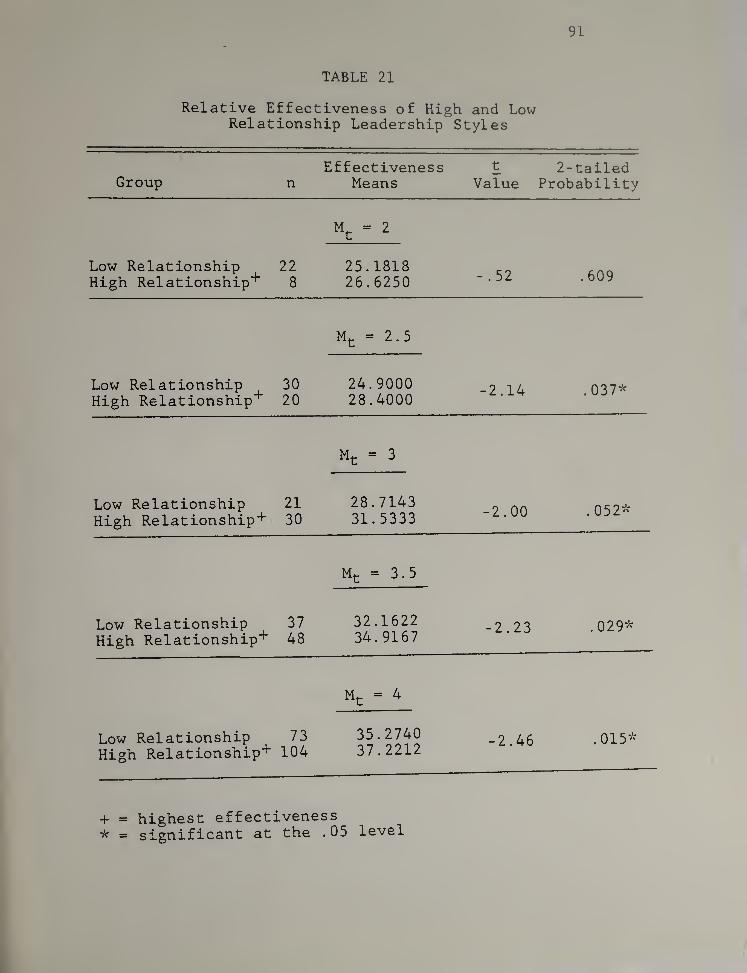
91
TABLE 21
Relative Effectiveness of High and LowRelationship Leadership Styles
Group nEffectiveness
Meanst
Value2- tailed
Probability
M^ = 2
Low RelationshipHigh Relationship"^
228
25.181826.6250 -.52 .609
= 2.5
Low RelationshipHigh Relationship"^
3020
24.900028.4000
-2.14
.037**
= 3
Low RelationshipHigh Relationship'^
2130
28.714331.5333 -2.00 .052*
Mt = 3.5
Low RelationshipHigh Relationship'^
3748
32.162234.9167
-2.23 .029*
Mt = 4
Low Relationship 73 35.2740 -2.46 .015*High Relationship'^ 104 37.2212
+ = highest effectiveness* = significant at the .05 level
92
In summary, eight tests were conducted. At all
eight levels, the results were in the same direction.
At two of those levels, the results were not signifi-
cant. At four levels, they were significant at the .05
level. One was significant at the .01 level. And one
was significant at the .0001 level.
These results indicated that there was a positive
correlation between principals' use of high relation-
ship styles and perceptions of principal effectiveness.
This correlation existed regardless of teachers' task-
relevant maturity, therefore the finding contradicted
SLT's contention that leader effectiveness results from
adapting leadership style to task-relevant maturity.
The above finding indicated that elementary school
principals who used high relationship behavior tended to
be perceived as more effective than those who did not.
However, other data indicated that low relationship be-
havior was effective at times. Table 22 shows that S2,
53, and S4 were all used at the highest levels of effec-
tiveness. Considering the top five effectiveness scores,
SI was not used, S2 was used 17 times; S3, 25 times; and
54, 17 times. Considering the top ten scores, SI was
used once; S2, 40 times; S3, 56 times; and S4, 46 times.
These data indicated that SI was not perceived to be
effective, but the other three styles were all perceived
to be effective in a considerable number of situations.
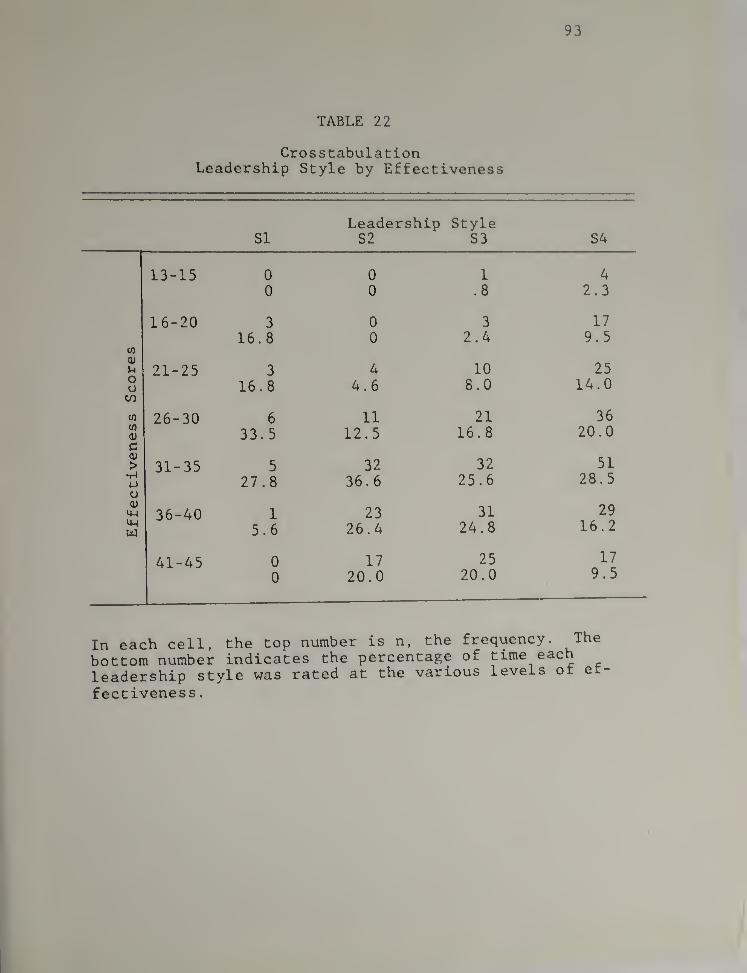
93
TABLE 22
Cross tabulationLeadership Style by Effectiveness
Leadership StyleSI S2 S3 S4
94
Therefore, low relationship behavior can be effective
with elementary school teachers despite the fact that
the high relationship styles tended to be highly effec-
tive more often. In addition, it is clear that a range
of leadership styles is effective in different situations.
CHAPTER V
SUMMARY AND CONCLUSIONS
This chapter presents a suinmary of the results,
interpretations of the findings, suggestions for further
research, and conclusions.
Summary
The purpose of this study was to test the basic prem-
ise of Situational Leadership Theory (SLT), that leader
effectiveness results from the adaptation of leadership
style to follower task-relevant maturity. The general
hypothesis was:
Principal effectiveness is positivelycorrelated with the congruency betweenprincipal leadership style and teachertask-relevant maturity.
Fourteen specific null hypotheses were stated, seven for
task relevant maturity from principals' perspective and
seven for task-relevant maturity from teachers' perspec-
tive. It was hypothesized that, at each level of maturity,
no significant difference in perceived effectiveness
would result from principals' use of the four leadership
styles. The rejection level for the null hypotheses was
established at .05.
95
96
To test the null hypotheses, a field test was
designed with 21 elementary school principals and 85
of their teachers. Each teacher used the Job Respon-
sit)ilities Form to choose five responsibilities about
which the data were collected. The Maturity Scale was
used to obtain measures of teachers' task-relevant
maturity from principals' perspective and from teachers'
perspective. The Leadership Style and Effectiveness
Form was used to measure principals' leadership style,
teachers' performance and satisfaction, and principals'
effectiveness from teachers' perspective. The Leader-
ship Style and Performance Form was used to measure
teachers' performance from principals' perspective (this
form also measured principals' leadership style from
principals' perspective, but those data were not used in
this study)
.
Once the data were collected, they were sorted
according to maturity level from principals' perspective
and teachers' perspective. Within each maturity level,
data were sorted into two groups, matches and nonmatches
of leadership style with maturity. A t-test was used to
determine the relative effectiveness of matches versus
nonmatches. Within each maturity level, the data were
also sorted into four groups, one for each of the four
leadership styles. An analysis of variance (ANOVA) was
used to determine the relative effectiveness of each style
with each maturity level.
97
Seven null hypotheses were stated for principals'
perception of teachers' task-relevant maturity. There
were insufficient data to test the first four of these
hypotheses. At maturity levels 3 and 3.5, the null
hypotheses were accepted. At maturity level 4, the null
hypothesis was rejected, but S4 was perceived to be
significantly less effective than S2 and S3. At all three
maturity levels, there was a tendency for S2 to be per-
ceived as the most effective style followed by S3. These
results contradicted SLT.
Seven null hypotheses were also stated for teachers'
perception of their own task-relevant maturity. There
were insufficient data to test the first two of these
hypotheses. At maturity levels 2, 3, 3.5 and 4, the null
hypotheses were accepted. At level 2.5, S2 was perceived
to be significantly more effective than S3 and S4 repre-
senting a partial validation of SLT. However, this vali-
dation was offset by the fact that S3 was relatively
ineffective and there was no significant difference between
SI and S2. At four of the five levels that were tested,
there was a tendency for S2 to be perceived as the most
effective style followed by S3 twice. At the fifth level,
S3 tended to be perceived as most effective followed by
S2. These results also contradicted SLT.
98
In summary, 14 null hypotheses were stated. Of
those 14, six were not tested due to insufficient data,
six were accepted in the null form and two were rejected.
The accepted hypotheses and one of the rejected hypo-
theses represented contradictions of SLT. The other
rejected hypothesis represented a partial validation of
the theory. There was only one case when a match between
leadership style and task-relevant maturity resulted in
leader effectiveness. This finding suggests the need for
modifications in SLT, the instrumentation that implements
the theory, and/or the methodology for testing the theory.
While testing the null hypotheses, the researcher
discovered a tendency for S2 and S3 to be perceived as
the most effective styles. To test the significance of
this pattern, the situations were sorted according to
maturity level. Then they were sorted into two groups,
high relationship leader behavior (S2 and S3) and low
relationship leader behavior (SI and S4) . A t-test was
used to compute the relative effectiveness of these two
groups
.
There were insufficient data at six of the 14
maturity levels. Eight tests were conducted and, in all
eight cases, the results were in the predicted direction.
At six levels, the results were significant. These re-
sults indicated that there was, in fact, a positive corre
lation between the use of high relationship leadership
styles and perceptions of leader effectiveness. As with
99
the findings based on the null hypotheses, these results
suggest the need for modifications in SLT and/or its
instruments and/or the research methodology.
Another interesting fact emerged from the data.
S2, S3, and S4 were all rated at the highest levels of
effectiveness. This indicated that different styles were
perceived to be effective in varying situations. These
data confirm the importance of further research with SLT
and further efforts to develop situational theories that
do explain which style should be used at different times.
Interpretations of the Findings
The Review of Literature (Chapter II) presented the
findings of several studies which supported the tendency
for S2 to be perceived as the most effective leadership
style. Hemphill (1955) ;Halpin (1956); Evenson (1959);
Peoples (1964); Sergiovani, Metzous, and Burden (1969);
Stotts (1968 and Feldvebel (1964) all found that educational
administrators who used high task and high relationship be-
havior were considered to be the most effective leaders.
There were also findings which supported the result
that high relationship behavior was significantly more
effective than low relationship behavior . Getzels and
Cuba (1957); Harrell (1972); Grassie and Carss (1972);
Chesler, Schmuck, and Lippitt (1963); and Doyle and
100
Ahlbrand (1974) all conducted studies which found that
relationship behavior by principals had a positive
impact on teachers.
However, there were also contradictory findings.
Congreve (1957); Moeller (1964); McKague (1970); Fiedler
(1967); and Filley, House, and Kerr (1976) all reported
positive effects of high task behavior. Research has
indicated that there are situations in which each of the
styles is more effective. Given this history, it would
be unwise to conclude that there is one style or one type
of behavior that is most effective. In fact, the data
from this study indicate that S2, S3, and S4 were all rated
at the highest levels of effectiveness. Furthermore, even
the finding that the high relationship styles were per-
ceived to be most effective still leaves a need for
leaders to know which of those two styles should be used
at different times. Therefore, the real value of this
study was to begin examining alternative explanations of
the findings with the intention of laying a foundation for
future research or improved theories.
The findings of this study suggest three possible
interpretations each of which is examined in the following
sections. One is that SLT needs revisions. The second
is that SLT needs to be operationalized in a different
manner. And the third is that the research methodology
used in this study did not generate accurate data.
101
Revisions of SLT
One confusing aspect of SLT is the variable rela-
tionship behavior
.
In their text, Hersey and Blanchard
(1977, p. 104) define this dimension as "the extent to
which leaders are likely to maintain personal relation-
ships between themselves and members of their group (fol-
lowers) by opening up channels of communication, provid-
ing socioemotional support, psychological strokes, and
facilitating behaviors." However, in their instruments
which diagnose leadership style, the LEAD-Self (See
Appendix F) and the LEAD-Other (See Appendix G),they
operationalize relationship behavior solely in terms of
the extent to which subordinates are involved in decision-
making. The definition refers to supportive leader
behavior and the instruments refer to participative leader
behavior. One solution to this problem would be to change
the definition, another would be to change the instruments.
However, it is the opinion of the researcher that the
best solution would be to split the variable into two
dimensions. The cost of this would be to make the model
more complex and, therefore, more difficult to operation-
alize or apply. The benefit would be that the model would
be more accurate in the sense that it would account for
the situation in which a follower needs support but is not
able to participate in decision-making or the converse in
102
which a follower participates in decision-making but does
not require extrinsic support.
A second confusing aspect of SLT involves the vari-
able task-relevant maturity. Even though the variable
only refers to one's capacity to perform certain tasks and
does not refer to a person's overall maturity, this dis-
tinction is often difficult for people to make. An alter-
native variable has been suggested by Frederic E. Finch
(1976). He prefers the term performance
,
which is defined
as a function of motivation and ability. He argues that
this term is a less threatening, more matter-of-fact var-
iable that can be used in the same way that SLT uses task-
relevant maturity. Since motivation and ability are not
appreciably different from willingness and ability, this
suggestion would create no substantive change in the theory,
just a semantic one. The term performance could be limit-
ing since it implies that the only concern is output
without considering intervening variables. The researcher
suggests a third alternative, performance quotient (PQ),
which refers to a person' s capacity to perform in the
same way that intelligence quotient (IQ) refers to a per-
son's capacity to learn. This variable would be defined
and operationalized in terms of a follower's ability,
need for support, and predisposition toward participation.
103
Revisions in the Operation-alization of SLT
As indicated in Chpater III in the section on
instrumentation, the Maturity Scale has not been statis-
tically validated. On the basis of this study, there
was evidence that the scale skewed scores toward the
higher maturity levels. Since teachers were instructed
to select a range of responsibilities (at least one in
which no improvement was needed, one in which some improve-
ment was needed, and one in which considerable improve-
ment was needed),the maturity ratings should have been
distributed with some at the top, most in the middle,
and some at the bottom. However, Table 1 shows that,
based on principal percpetions, ninety-five per cent of
the situations were rated at maturity levels 3, 3.5, and
4. Table 8 shows that, based on teacher perceptions,
seventy-five per cent of the situations were rated at
the top three levels. In contrast. Table 23, which shows
teachers' and principals' ratings of teachers' perform-
ance, demonstrates that teachers did choose a range of
responsibilities and presents the sort of distribution
that was expected. These data suggest the need to modify
the Maturity Scale. This could be accomplished by
changing the scoring matrix, the instructions, and/or the
rating scales. These data also suggest the possibility
that the results of this study were due to inaccurate
measurement of task-relevant maturity.
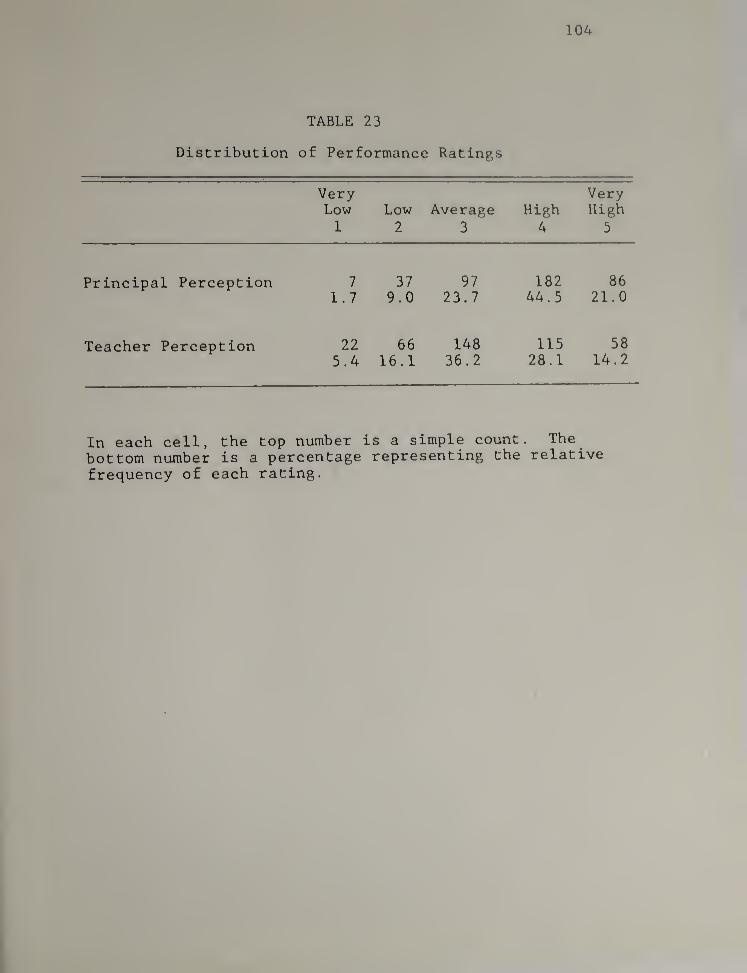
104
TABLE 23
Distribution of Performance Ratings
VeryLow1
Low2
Average3
High4
VeryHigh
5
Principal Perception 7 37 97 182 861.7 9.0 23.7 44.5 21.0
Teacher Perception 22 66 148 115 58
5.4 16.1 36.2 28.1 14.2
In each cell, the top number is a simple count. The
^
bottom number is a percentage representing the relative
frequency of each rating.
105
Alternative ResearchMethodologies ’
As indicated in Chapter III, the instruments which
were designed specifically for this study were validated
only on the basis of piloting and they were not tested
for reliability. Therefore, it is possible that these
instruments did not yield accurate data. Some form of
construct validation in which scores were compared to
objective measures would improve the quality of future
research. In addition, expanded definitions of perform-
ance, satisfaction, and effectiveness which include
quantifiable outcome variables would also improve future
studies
.
Regarding the data collection procedure, there is
a possibility that the sequence of events in the data
collection workshops created a respondent bias. Since
the first hour of each workshop was spent teaching parti-
cipants about SLT and the second hour was spent completing
the instruments, it is possible that teachers and princi-
pals concluded that high maturity levels and high rela-
tionship behavior were the "best” and then tended to use
those ratings more often than the others. To correct
for this bias, the sequence of events in such workshops
should be altered. Teachers should be given the Job
Responsibilities form at the beginning of the workshop.
Then teachers and principals should complete the Maturity
106
Scales and the effectiveness instruments before they
learn anything about SLT. At that point, they should be
taught about the four leadership styles, trained to use
the styles to describe leader behaviors, and reassured
that no style is better than any other. Then, they
should complete the ratings of leadership style. After
all the instrumentation is completed, they should learn
about the maturity levels, effectiveness, and applications
of the model. Such a procedure should raise the prob-
ability that responses reflect situations as they are
instead of the way people think they should be.
Suggestions for Further Research
To answer the questions generated by this study,
further research should focus on three areas; improved
instruments, other populations, and more tightly con-
trolled studies.
Regarding the instruments, tests need to be con-
ducted to establish valid and reliable measures of task-
relevant maturity, leadership style, and effectiveness.
Until measures of these variables can accurauely reflect
leaders ' and subordinates ' behavior ,valid research
with SLT cannot be conducted. One way to begin this
process would be to follow the format used in piloting
the instruments designed for this study. That would
involve getting leaders and subordinates to complete
107
the instrumentation package. This would be followed up
by interviews with and/or observations of respondents.
Scores on the instruments could then be correlated with
i^fo^^stion collected by the interviews and/or observa-
tions to establish validity.
Regarding the population, there are indications
that the sample used in this study was not a typical group
of leaders and subordinates. Since teachers are pro-
fessionals and have the same training as most of their
principals, the differences between these groups of
people may be less than in other leader- subordinate
relationships. Furthermore, some of the research with
Path-goal Theory suggests that school situations may be
particularly conducive to participative leadership be-
havior (high relationship styles). Filley, House, and
Kerr (1976) report that when tasks are ego- involving,
subordinates prefer to participate in decision-making.
In addition, when tasks are not ego- involving ,those
followers who are predisposed to participate will still
prefer leaders to use participative styles. Applying
these findings to schools, most tasks are ego- involving
and, since the respondents were selected on the basis of
their willingness to participate, it is likely that this
particular group may have had a tendency to participate
more than the average teacher. This information may
help to explain the perceived effectiveness of the high
108
relationship styles. It also underscores the need to
replicate this study with other populations.
One recommendation regarding the population is to
replicate the study with other elementary school princi-
pals and teachers. It should also be done with secondary
school personnel, with higher education personnel, with
educators from other parts of the country, from urban or
suburban locales, and from other countries, and with
managers from non- educational work environments. A
second recommendation is to locate a population large
enough to be able to randomly select participants. For
example, if several large school systems would commit
themselves to this type of study, then principals and
teachers could be chosen on a random basis. This would
permit results to be more widely generalized than those
of this study.
In the section on delimitations (Chapter I),refer-
ences were made to the problems with ex post facto re-
search. One way to check the findings of field studies
would be to design and conduct laboratory experiments
with SLT. One example would be to have randomly selected
students tested for math aptitude and interest ,then
sorted into groups based on task-relevant maturity.
These groups could then be given standardized tasks by
leaders trained to behave according to the four leader-
ship styles. After a fixed amount of time, performance
109
could easily be measured and satisfaction could be deter-
mined. Such an experiment would eliminate many of the
extraneous factors inherent in ex post facto research.
Conclusions
There were strong indications that the Maturity
Scale did not discriminate levels of task-relevant matur-
ity accurately. There were also questions raised about
the instruments which measured leadership style and
effectiveness, the data collection procedure, and the
population. Based on these methodological considerations,
it was not possible to make a definitive statement about
the validity of SLT.
Nevertheless, some conclusions were possible. One
was that Styles 2, 3, and 4 were all effective with some
teachers in some situations. Another was that there was
a tendency for S2 to be perceived as the most effective
style regardless of maturity level. A third was that
the high relationship styles (S2 and S3) were perceived
to be significantly more effective than the low relation-
ship styles (SI and S4) regardless of teachers task-
relevant maturity.
The first conclusion affirms the need to continue
conducting research with theories of situational leader-
ship and to use research to develop improved theories.
The second and third conclusions raise enough questions
110
about SLT to dramatize the need for future research to
address methodological issues regarding the measurement
of task-relevant maturity, leadership style, and effec-
tiveness .
In addition to these conclusions, two recommenda-
tions for modifying SLT were suggested. One was to change
the term task-relevant maturity to performance quotient.
The other was to expand the dimension relationship be-
havior to two dimensions, supportive behavior and partici-
pative behavior.
As a final thought, the field of leadership still
faces the problem of defining leader behavior in a form
that helps people in managerial positions adapt their
behavior to the needs of the work environment and of the
people in that environment. In a world full of organiza-
tions, this is one of the keys to developing organiza-
tional effectiveness.
BIBLIOGRAPHYAshour, A. S. The contingency model of leader effective-
ness: An evaluation. Organizational behavior andHuman Performanae, Vol. 9, 1972, pp. 339-355.
Bales, R. F. Task roles and social roles in problem-solving groups. In E. E. Maccoby, T. M. Newcomb,6e E. L. Hartley. Readings in Social Psychology.New York: Holt, Rinehart and Winston, Inc., 1958.
Barnard, C. I. The Functions of the Executive. Cambridge:Harvard University Press, 1938.
Bass, B. M. Leadership j Psychology and OrganizationalBehavior
.
New York: Harper and Brothers, 1960.
Blake, R. R.,& Mouton, J. S. The Managerial Grid.
Houston: Gulf Publishing, 1964.
Brown, R. J. Identifying and classifying organizationalclimates in twin city area elementary schools.Unpublished Ph.D. Dissertation, Department ofEducation, University of Minnesota, 1964.
Campbell, R. F. What peculiarities in education make it
a special case. In A. W. Halpin (Ed.), Administra-tive Theory in Education. Chicago: The MidwestAdministration Center, University of Chicago, 1958.
Cartwright, D.,& Zander, A. (Eds.). Group Dynamics:
Research and Theory^ 3rd Edition. New York:
Harper and Row Publishers, Inc., 1968.
Chase, F. S. Professional leadership and teacher morale.
A.dministrator ' s Notebook, Vol. I, No. 8, March1953.
Chase, F. S. How to meet teachers' expectations of leader-
ship. Administrator's Notebook, Vol. 1, No. 9,
April 1953.
Chemers, M. M.,& Skrzypek, G. J. An experimental test
of the contingency model. Journal of Personality
and Social Psychology
,
Vol. 24, 1972.
Ill
112
Chesler, M., Schmuck, R .
,
& Lippitt, R. The principal'srole in facilitating innovation. Theory IntoPraatiae. Columbus: Ohio State University,Bureau of Educational Research and Service Col-lege of Education, II, December 1963.
Congreve, W. J. Administrative behavior and staff rela-tions. Administrator's Hotehook, VI, October 1957.
Doyle, W. J., & Ahlbrand, W. P. Hierarchical group per-formance and leader orientation. EducationalAdministration Ahstraats
, 9 (Winter 1974), p. 45.
Duncan, F. M. Task and employee oriented styles ofbehavior in selected Minnesota School Administra-tion. Unpublished Specialist Degree Thesis,Mankato State University, 1975.
Eidell, T. L.,
et al. Innovativeness and the organiza-tional attributes of schools. Eugene, Oregon:Center for Advanced Study of Educational Adminis-tration, 1969. Paper presented at American Educa-tional Research Association annual meeting, LosAngeles, California, 1969.
Everson, W. L. The leadership behavior of high schoolprincipals. Unpublished Ph.D. Dissertation,Department of Education, University of Chicago,1958. As reported by the author in the NationalAssociation of Secondary School Principals Bulle-tin, XLII (September 1959), pp . 96-101.
Feitler, F. C. A study of principal leader behavior and
contrasting organizational environments. Paperpresented at American Educational Research Asso- -
ciation annual meeting, Chicago, April 3-7, 1972.
Fiedler, F. E. A Theory of Leadership Effectiveness
.
New
York: McGraw-Hill Book Company, 1967.
Filley, A. C. ,House, R. J., & Kerr, S. Managerial Process
and Organizational Behavior^ 2nd Edition. Glenview,
111.: Scott, Foresman and Company, 1976.
Finch, F. E. A developmental theory of leadership and
decision making. Unpublished article, October
1976.
Finch, F. E., Jones, H. R. ,& bitterer, J. A. Managing
for Organizational Effectiveness : An Exper^ent^al
Approach. New York: McGraw-Hill Book Company,
1976.
113Fleishman, E. A., & Peters, D.
leadership attitudes,’Personnel Psychology
,
A. Interpersonal values,and managerial success.Vol. 15, 1962, pp. 127-143.
Getzels, W., & Cuba, E. G. Social behavior and theadministrative process. Th& School Review LXVNo. 4, Winter 1957.
Ghiselli, E. The validity of management traits relatedto . occupational level. Personnel PsycholoquVol. 16, 1963, pp. 109-113.
Gibb, C. A.^
Leadership. In G. Lindzey (Ed.), Handbook ofSocial Psychology. Cambridge, Mass.: Addison-Wesley Publishing Company, Inc.
, 1954.
Graen, G., Alvares, K., Orris, J., & Martella, J. Con-
tingency model of leadership effectiveness:Antecedent and evidential results. PsychologicalBulletin, 74, 1970.
Grassie, McC. C. , & Carss, B. W. School structure,leadership quality, and teacher satisfaction.Educational Administration Quarterly
,Vol. 9,
Winter 1972.
Gross, N., 5c Herriott, R. E. Staff Leadership in PublicSchools : A Sociological Inquiry. Nexv York: JohnWiley and Sons, Inc., 1965.
Halpin, A. W. The Leadership Behavior of School Superin-tendents. Chicago: Midwest Administration Center,The University of Chicago, 1959.
Harrell, L. W. Innovative tendencies of elementary schoolprincipals as related to self-perception of theirleadership style, belief system, reference groupsidentification, and value system orientation.Dissertation Abstracts
,33A, 1972, 2647.
Hawley, D. E. A study of the relationship between theleader behavior and attitudes of elementary schoolprincipals. Unpublished M. Ed. Thesis, Universityof Saskatchewan, Sadkatoon, 1969.
Hemphill, J. K. Patterns of leadership behavior associ-ates with the administrative reputation of the
departments of a college. Journal of EducationalPsychology ,
XLVI,November 1955, pp. 385-401.
114
Hersey,
P., 6c Blanchard, K. H. Life Cycle Theory of Leader-
ship. Training and Development Journal, May 1969.
Hersey, P• i ^ Blanchard, K. H. Management of Organiza-
tional Behavior : Utilizing Human Resources , 3rdEdition. Englewood Cliffs, N.J.: Prentice HallInc., 1977.
House, R. J. A path-goal theory of leader effectiveness.Administrative Science Quarterly
, 16, 1971.
House, R. J., 6c Mitchell, T. R. Path-goal theory ofleadership. In G. A. Yukl
,6c K. N. Wexley,
Readings in Organizational and Industrial Psychol-ogyy 2nd Edition. New York: Oxford UniversityPress, 1974.
Ignatovich, F. R. Role expectations and performance ofTurkish school principals— empirical findingsand comparative implications. Paper presented atthe American Educational Research Association,Chicago, April 15-19, 1974.
Ignatovich, F. R. Types of elementary school principalleaders: A Q- factor analysis. Paper presented atthe American Educational Research Associationannual meeting, 55th, New York, February 4-7,1971.
Korman, A. K. "Consideration," "Initiating Structure,"and Organizational Criteria: A Review. PersonnelPsychology ,
Vol. 19, 1966, pp . 349-361.
Likert, A. K. Hew Patterns of Management. New York: McGraw-Hill Book Company, 1961.
Lippitt, R.,& White, R. K. The "Social Clim.ate" of_
children's groups. In R. G. Barker, S. Kounin,
6c H. F. Wright (Eds.), Child Behavior and Devel-
opment. New York: McGraw-Hill Book Company, 1943,
pp. 485-508.
Mayo, E. The Social Problems of an Industr^'t^al Civilization.
Boston: Harvard Business School, 1945.
McKague, T. R. A study of the relationship between school
organizational behavior and the variables of
bureaucratization and leader attitudes. Unpub-
lished Ph.D. Thesis, University of Alberta, 1968.
115
McKague,
T. R. LPC— A new perspective on leadership.Educational Administrative Quarterly
,
Vol. 6,’
No. 5, Autumn 1970.
McNamara, V. D. A descriptive-analytic study of directive-permissive variation in the supervisory behaviorof elementary school principals. UnpublishedM.Ed. Thesis, University of Alberta, 1967.
McNamara, V. D. The principal's personal leadership style,the school staff leadership situation and schooleffectiveness. Unpublished Ph.D. Thesis, Universityof Alberta, 1968.
Moeller, G. Bureaucracy and teachers' sense of power.The School Review, LXXII, Summer 1964, p. 139.
Moser, R. P. The leadership patterns of school superinten-dents and school principals. Administrator'sNotebook, VI, 1, September 1957.
Moyer, D. C. Leadership that teachers want. Administra-tor's Notebook, Vol. Ill, No. 7, March 1955.
Peoples, J. A. The relationship of teacher communicationto principal behavior. Journal of ExperimentalEducation
,
XXXII, Summer 1964, pp . 407-410.
Porter, L. W.,Lawler, E. E., Ill, & Hackman, R. J. Be-
havior in Organizations
.
Nev; York: McGraw-Hill
Book Company, 1975.
Raynor, M. R. A study of the relationship among knowledge
of leadership theory, behavior and effectiveness.
Doctoral Dissertation, University of Massachusetts,
Amherst, Mass., 1976.
Reddin, W. J. The 3-D management style theory. Training
and Development Journal. April 1967.
Reddin, W. J. Managerial Effectiveness. New York: McGraW'
Hill Book Company, 1970.
Sales
,
S. M. Supervisory style and productivity:
and theory. Personnel Psychology
,
Vol. 19, i9bo,
pp. 275-286.
Sergiovanni, T. J. ,Metzous, R. ,
Sc Burden, L. toward a
particularistic approach to leadership style.
Some findings. Educational Administration Abstracts,
4, Fall 1969, p. 54.
116
Smith, M. J. Effectiveness in urban elementary schools as^ function of the interaction between leadershipbehavior of principals and maturity of followers.Unpublished dissertation, University of Massachu-setts, 1974.
Stogdill, R. M. Personal factors associated with leader-ship: A survey of literature. Journal ofPsychology
, 25, 1948.
Stogdill, R. M. , 6c Coons, A. E., (Eds.). Leader Behavior:Its Description and Measurement. Research Mono-graph No. 88. Columbus, Ohio; Bureau of BusinessResearch, The Ohio State University, 1957.
Stotts, M. J. Field study of the perceptions of directors'leader behavior in Illinois basic educationcenters. Springifeld: Illinois State Office ofthe Superintendent of Public Instruction, Spring-field Department of Adult Education, 1968.
Tannenbaum, R.,
6c Schmidt, W. H. How to choose a leader-ship pattern. Harvard Business Review. March/April, 1957.
Taylor, F. W. The Principles of Scientific Management.New York: Harper and Brothers, 1911.
Vroom, V. H. Leadership. In M. B. Dunette (Ed.), Hand-book of Industrial and Organizational Psychology
.
Chicago; Rand-McNally and Company, 1976.
Vroom, V. H.,
6c Yetton, P. Leadership and Decision Making.
Pittsburgh; University of Pittsburgh Press, 1973.
Watkins, J. F. The relationship between the principaland his professional staff in the public school.
Unpublished Ph.D. Thesis, Auburn University, 1966.
APPENDIX A:
JOB RESPONSIBILITIES FORM
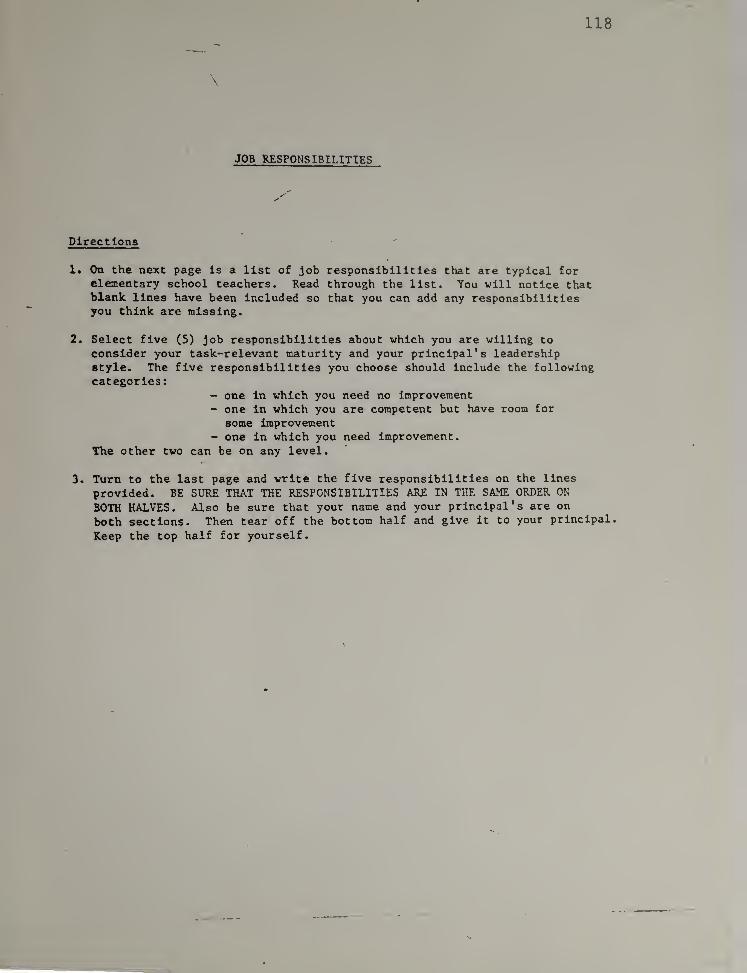
JOB RESPONSIBILITIES
Directions
1. On the next page Is a list of job responsibilities that are typical forelementary school teachers. Read through the list. You will notice thatblank lines have been included so that you can add any responsibilitiesyou think are missing.
2. Select five (5) job responsibilities about which you are willing to
consider your task-relevant maturity and your principal's leadershipstyle. The five responsibilities you choose should include the followingcategories:
- one in which you need no Improvement- one in which you are competent but have room for
some improvement- one in which you need improvement.
The other two can be on any level.
3. Turn to the last page and write the five responsibilities on the lines
provided. BE SURE THAT THE RESPONSIBILITIES ARE IN THE SAME ORDER ON
BOTH HALVES. Also be sure that your name and your principal's are on
both sections. Then tear off the bottom half and give it to your principal.
Keep the top half for yourself.
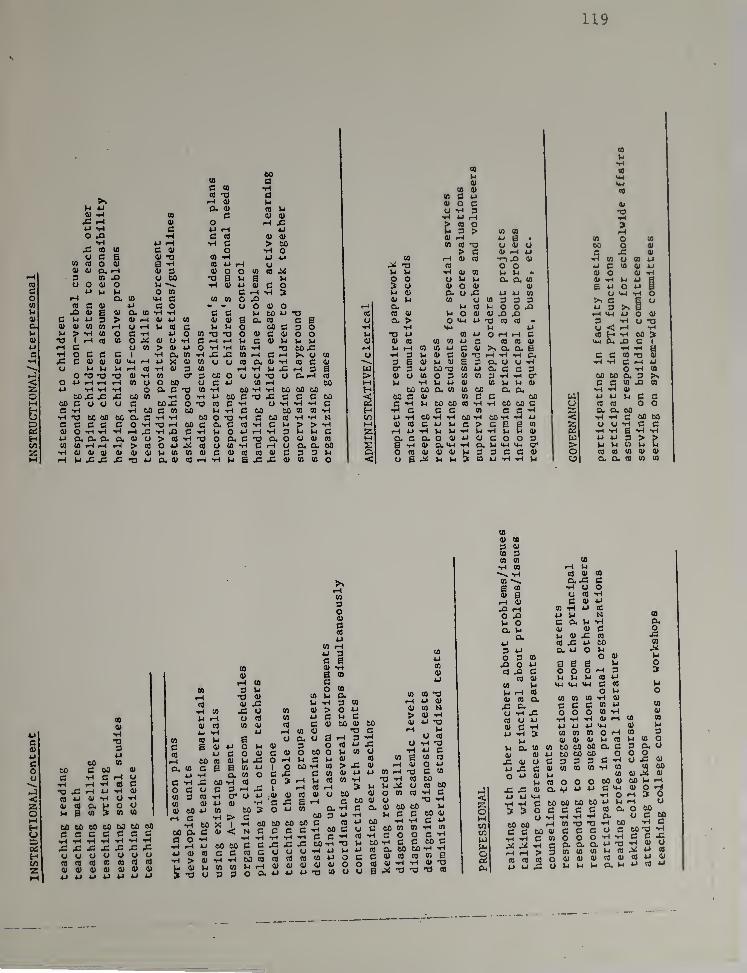
119
to(0 od CO »H(d •d d> d V4
X X cu d) cd X4) X CO d d 4133 X 01 o rH 33X X c 4J XO 33 «ri d td d 41X U r-l •H d > 6033 CD CO d 0) o •rt OU B B 0) CO •H U X
CO CO O 41 B -H cd 4J rH d(U 41 B. X 0) d d O o CO Cd 34X 3 CD 33 o to •d 6 u a X
CO u O lU O V4 •H <U u d d OB X X X O (0 d rH •H >O X a CO ^ c CO CO oCO CO B 41 u c o o o d oX 33 4) a <u cu CO •H -H d d >4 to X 134) c X X 3 > 0) r-i 0) u CO 0) d s 04 (d B aB <u CU CO CO X o M (Q d u o to B 3 OX > X CO o c 4.J 0 CO •d •3 o d d 41 O OCU 1 ^ to CO o 0) U •H d rH rH u d d X X XX B o (Ji > O iJ o •H •H CO ‘H o 60 33B •H O B B B •W CU CO •H pC CO rH d X U 0)ii c 41 41 41 4J X C) CO o U Cd CU d X to B d
o X X X CQ •H Oj 3 U) rH •H M 33 X 3 a•-J o -O 13 13 <D •H CO cr 3 to o o O •d u B. X CO< o X X X X 0) O o to o d iJ CO rH to2: iJ X X X o o. d •d CO •H 60 X •H 60 60 60o oo 33 33 33 to (0 •H o •H 4J to d -d .C B B B toX CO B u u U c tOpd o •d Cd c •H u X X X cH c X *H 00 d (Ji to U •H d 60 60 to to •HO •3 oc oo OC CX c •H -H to O 'O •H c to to X Xs c B B B B O •H •d fH to d CU d CO •H d X ? > •H04 a O X X X H H d •H 0 rH «H 3 X X dH u B Cu B. B. Q) o > cd •H •d O cu d 'd CU o (U 41 Cd
cn CO CO X X X > tQ O 4J pX CO U CO •H d rH u B. B. toVU •H 41 41 41 4) (U (U U (Ji (0 0) d d <C cd d B 3 3 uM iH X 33 33 33 4J cu 0) d fH •H 5 .c pC <u U (A o
CO
Moo COu CMd CM
CO d CQ
es on nt dU -H 3 •d«H U rH> (Q OU 0 > (A CO rHd rH X a • U) o (0(0 Cd "d U 41 U to O d
> c 41 X X d X dCO rH d Cd X) 31 4) •M (0 O CO u
pX 'd Cd O O M d CO d MV4 u «H d CO XX- do d fHo o o u u O. B. (A d •H M U 0u d o d 41 a UJ O M 014 d cu U .c X X tn O CM fH Od u CO u W 3 3 3 d a u
rH CU cd X O O 33 M 3 aCd cd d M o d 41 33 33 f-H CM M O du D. > 0 vu 4J 13 to (0 - 3 -HO 'd•H •H M-t X X O < rH fH
•d CO 4J O X X c ed H •H to :»
d d cd CO CO 4H C to to 41 CM Pm pO d 1
rH »4 rH CO CO 4J d d >> B. a. a •H fH aO •H 3 u d d d Hd X X 1-1 B. d d CO Hs d
3 a d H d a 3 B. U U X fH •rC d rH uKT 3 to *3 CO U B. B B 3 O 'H CO
> d CJ CO o 3 CO CO 3 X X cr to to CU 3 ?sM U4 •H u> 4J d 01 X X 4) C d CO pC 00
H to CO Cu CO CO to B. B. fH fH d< to c d CO d B 60 u X X X B d
d •H u to to Cd -H X 60 60 E o CO td o oH •H c d d CO E B X 5; B. B. 60CO •H to *tH •H to "H 60 X X X < X X C 60 toM d Cd c u u p > B a E to 2- U U X C dZ rH 4J •H u u Ti u X Vi X tU X X a X fHM CU d CU o d 4J d E O O 3 W X X 3 > >z a •H d cu M-l *H O* Vi >x lx cr > X X to X U
o Cd d d d H 9 3 B B 41 o (0 CO to 41 d< o B 34 U4 W ? CO X X X X o B. B. to (A (JO
n(U"H•Oau
OO (A
CO c oo <u
C C i-l Oi-t •*-! ea c
•o x »-t «J -H <U
CO (U 1-1 O "H« <Q 0< P O OM S W > <A (A
u> u) 00 CO 00 eo CO
C C C C C C B1-1 H 1-1 "H lH 1-t lHj: j: j: j: j: jz j:u u u u u u ufO (0 (0 CO (0 a) <4
Oi W V W V 0) VU U t-l U U U *J
mc(0(—
1
CU (A
OO
iHCO1-1 CO
W rH<U CO4- 1-C
CO >-•
B <u
u00 CO
B B1-1 .B 00BUB3 CO 1-t
0) UOO C-l CO
B1^ 00 XB. B <U
O 1-t
U 00<U CO B> 4) -ri
(U h CO
•3 0 3
CD
0)
<-H CO
3 hT3 <UCU XX UO cO
CO <Uu
BU O MB O <U
u vj XB CD uO. CO o1-C cO
3 rH Xcr u iJ
^ •r4
00 5
I 00< N B
CO
CO
CO
r-C
oCU
B U0 I—
i
1 oB X0 »1
.(U <u
B XO W00 00O B
CO4J
B0)
aBO
CO MU 1-1
CU >u BB CU
0)
o Bo
00 o6 M
CO
CO
CO
CO
bo 3 B X Xc ccj B o yiH 00 CO CO cO
CO w< •-* u <u
3 o O. *J *J
Bl-l
cO
CU u
3a•rl
CO
CO
B.3oVI B00 CU 00
•o Br-t 3cO VI Xvi CO uCU CO
> X CU
CU
(0 0.H CU
f-l •B
CO
VJCO
CU
CO CO *3-t VI CU
CU CO N> CU -H41 U -Br-C B
U CO
O 1H "BiH VI B
CO CO
O VI
B (0
O.00 3clH OOB BoO n•rt VI
CO VI
41 4)
•B 10
CO fH 13 X Cd toX 34 u Cd to
oO d O (A cd fH dd t£t d U •3 fH <fH d o. 41 60 to M z4J fH X B d 00 d o(d M to X fH d u Md o d 60 (0 cn fH CO wfH (Q H B O o c •H c/}
•d M to X B d to dM M d B. 60 60 X fH pu
o d c 41 to CO CO a O0 o cd 4) X fH d 'd
u u B 34 13 •d •d cd Pf
n4> CO
3 4)
CO 3CO CD1-1 CD^ 1-1
CO
S CO
41 a1-1 4)
X l-l
O XVi o13. U
B.VI
3OX
CU
u41X 41
U XO X
VI
3 CO
O XCO X B
cQ CU
CO XV. X cO
4) CO B.X B.U X XCO U X
P t!X 5XB. <0
«X XCO 41 «B. X BX o oU CO XB CU X
eo X X COXX NB B. Vi X41 4) BX 4) X CO
CO X X OOB. X O X
Oa 6 Bo o o XX X X CQ
X X X Bo
CO CO CO X
X X 4)XXXX X B>30
uoo 00B B 00X X BX X XX X ^CO cO CO
CO CO
41 41
CO 00 COX 00 ooB 3 341 CO CO
XCO O OCu V X
00 00 00B B BXXXX CO 1341 E BCO o oB B. B.3 CO CO
O 41 41
U X X
B CO
o CO
H 41 XX XCO O X41 X CO
00 B. BOO o3 B XCO X CO
CO
o 00 41
X E XX Ooo X XB cO B.X B.X ooBUBo X XB. X 13CO X CO
41 cO 41
X B. X
CO
B.OJiCO
34Xo3
Xo
CO
41CO
X3
CO OB. U
CO
CU
CO
X3
S5 4,.
4) iS00 X4) OX 3
O OOU B 00X B60 13 XB B 30X 4) U34 X cO
cO X 4)
X CO X
'tU

APPENDIX B
MATURITY SCALE, MANAGER RATING FORM
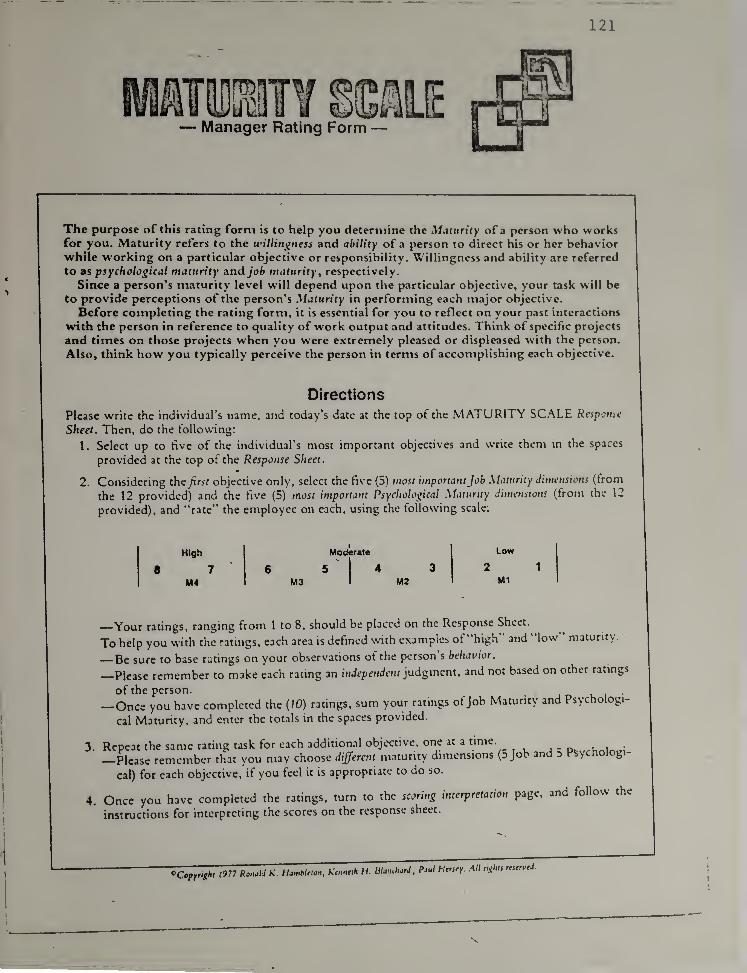
121
The purpose of this rating form is to help you determine the Maturity of a person who worksfor you. Maturity refers to the unllin^uess and ability of a person to direct his or her behaviorwhile working on a particular objective or responsibility. Willingness and ability are referred
to as psychological maturity and job maturity, respectively.
Since a person’s maturity level will depend upon the particular objective, your task will be
to provide perceptions of the person’s Maturity in performing each major objective.
Before completing the rating form, it is essential for you to reflect on your past interactions
with the person in reference to quality of work output and attitudes. Think of specific projects
and times on those projects when you were extremely pleased or displeased with the person.
Also, think how you typically perceive the person in terms of accomplishing each objective.
Directions
Please write the individual’s name, and today’s date at the top of the MATURITY SC.^LE Respouic
Sheet. Then, do the following;
1. Select up to five of the individual’s most important objectives and write them in the spaces
provided at the top of the Response Sheet.
2. Considering the first objective only, select the five (5) most importantJob .Maturity dimensions (from
the 12 provided) and the five (5) most important Psychological .Maturity dimensions (from the 12
provided), and “rate” the employee on each, using the tollowing scale;
8
High
7 6
Moderate
5 '1
4 3
Low
2 1
M4 M3 1 M2 Ml
—Your ratings, ranging from 1 to 8, should be placed on the Response Sheet.
To help you with the ratings, each area is defined with examples of "high and low maturity.
— Be sure to base ratings on your observations ot the person s behavior.
— Please remember to make each rating an iViJcpei/iftvir judgment, and not based on other ratings
of the person.• j n u i
—Once you have completed the (10) ratings, sum your ratings ofjob Maturity and Psychologi-
cal Maturity, and enter the totals in the spaces provided.
3. Repeat the same rating task for each additional objective, one at a tmie.
—Please remember that you may choose dijfercnt maturity dimensions (5 Job and d Psychologi-
cal) for each objective, if you feel it is appropriate to do so.
4. Once you have completed the ratings, turn to the scoring interpretation page, and follow the
instructions for interpreting the scores on the response sheet.
^Copyright 1977 RonjU K. Hamhtnon, Krtinrih H ISUiiilurJ,PjuI Htrsty. .‘\ll rights reservfJ
I
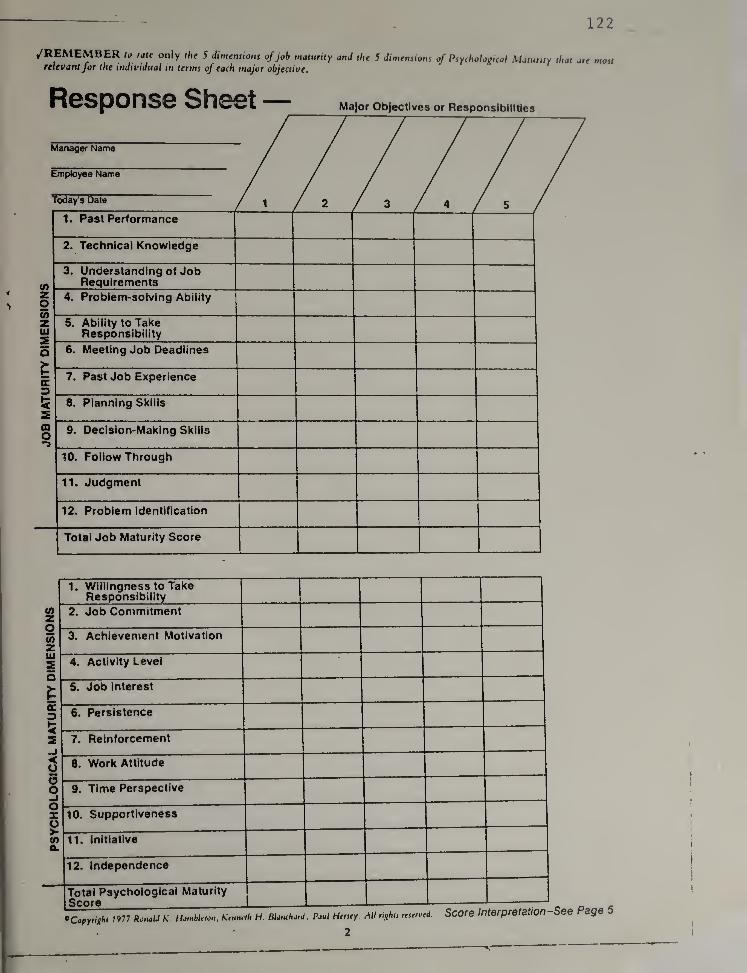
122
/REMEMBER to rate only the 5 dimensions ofjob maturity and the 5 dimensions of Psychological Maturity thatrelevantfor the individual in terms of each major objective.
are most
Response Sheet— Major Objectives or Responsibilities
Manager Name
Employee Name
today's Date
1. Past Performance
2. Technical Knowledge
3. Understanding of JobRequirements
4. Problem-solving Ability
5. Ability to TakeResponsibility
6. Meeting Job Deadlines
7. Past Job Experience
8. Planning Skills
9. Decision-Making Skills
10. Follow Through
11. Judgment
12. Problem Identification
Total Job Maturity Score
1. Willingness to TakeResponsibility
2. Job Commitment
3. Achievement Motivation
4. Activity Level
5. Job Interest
6. Persistence
7. Reinforcement
8. Work Attitude
9. Time Perspective
10. Supportiveness
11. Initiative
12. Independence
Total Psychological Maturity
1 Score
OCtpyrighl 1977 RonaU K HuiHbUton, Ketmtih H. BlJiuhard, Paul Htrity
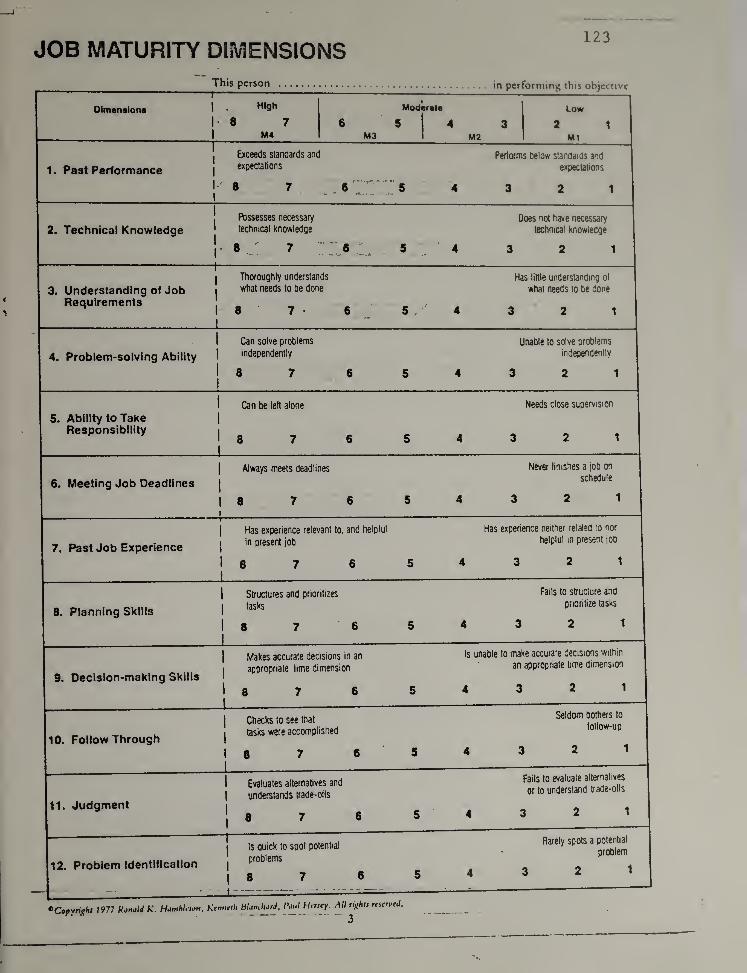
123JOB MATURITY DIMENSIONS
This person in pcrforniing this objective
Olmansions
T
1 . High Moderate Low
I- 8 7 6 51
4 3 2 1
1 M4 M3 1 M2 Ml
IExceeds standards and Performs below standards and
1. Past Peilormancej
expectations expectations
1' 8 71
6« * •* ^ ..
5 4 3 2 1
j
Possesses necessary Does not have necessary
2. Technical Knowledge 'technical knowledge technical knowledge
1- 8.: 7 5 4 3 2 1
1
Thoroughly understands Has little understanding of
3. Understanding of Job1
what needs to be done what needs to be done
Requirements 18 7 •
1
6 5 4 3 2 1
1 Can solve problems Unable to solve problems
4. Problem-solving Ability 1independently independently
1 8 71
8 5 4 3 2 1
1 Can be left alone Needs close supervision
5. Ability to Take1
Responsibility1 8 7J
6 5 4 3 2 1
1Always meets deadlines Never finishes a job on
6. Meeting Job Deadlines1
schedule
18 7
t
6 5 4 3 2 1
1 Has experience relevant to. and helpful Has experience neither related to nor
7. Past Job Experience1
in present job helpful in present |00
1 8 71
6 5 4 3 2 1
1 Structures and prioritizes Fails to structure and
8. Planning Skills 1
tasks prioritize tasks
1 8 71
6 5 4 3 2 1
1Makes accurate decisions in an Is unable to make accurate decisions within
1 aoorooriate time dimension an appropriate lime dimension
9. Decision-making Skills
1 . 21
6 5 4 3 2 1
1 Checks to see thatSeldom bothers to
10. Follow Through1 tasks were accomplished
follow-up
1
1 8 71
6 5 4 3 2 1
1 Evaluates alternatives and
1 understands trade-offs
Fails to evaluate alternatives
or to understand trade-offs
11. Judgment
1
® ^ 6 5 4 3 2 1
12. Problem Identification
j
Is guick to spot potential
j
problems
1
8 7 6 5 4
Rarely spots a potential
problem
3 2 1
ccopynghl 1977 Ronald K. HonihU ton. Krmitihristrvcd.
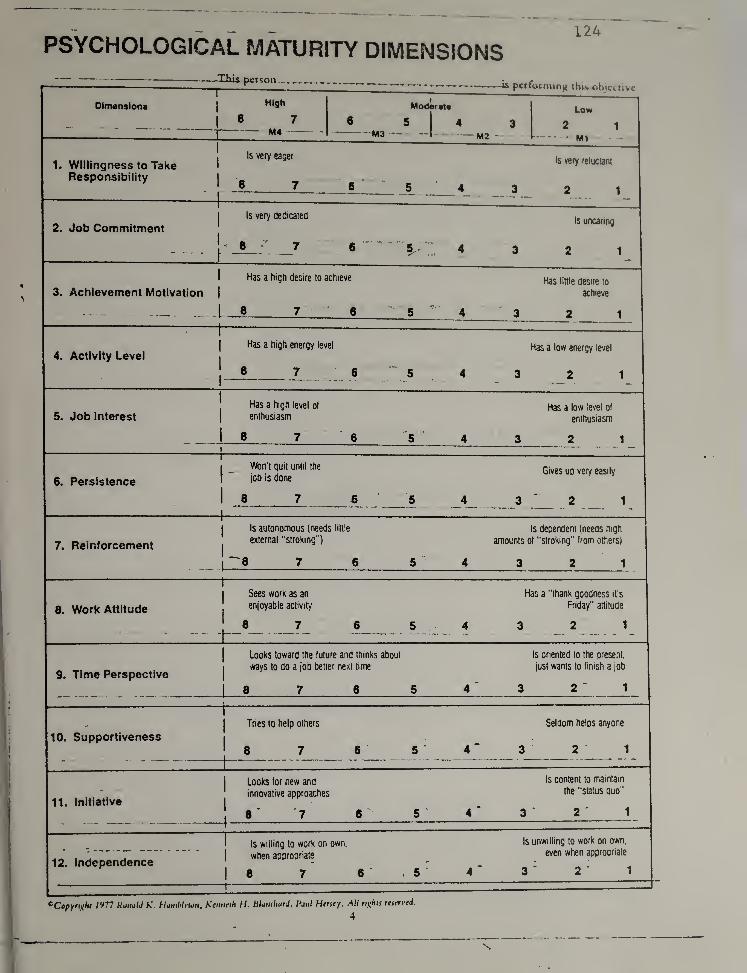
PSYCHOLOGICAL MATURITY DIMENSIONS— This person
124
"—-—is performing thrv objective
OlmansiontI
High
I
• 't M4 -
Mod«rat«
5I
4 3-M3 - I m2
Low
2 1
- Ml
1. Willingness to TakeResponsibility
Is very eager
8 7
Is very reluctant
—42. Job Commitment ^
Is very dedicatedIs uncaring
1
^
. 8 7 6 4 3 2 1
1
3. Achievement Motivation|
Has a high desire to achieve Has little desire to
achieve
- 1 8 7'
6 - 5 4 3 2 1
:
“t
4. Activity Levelj
— - 1
Has a high energy level
8 7 6 "5 4 3
Has a low energy level
2 11 _
5. Job Interest
Has a high level of
enthusiasmHas a low level of
enthusiasm
8 7 6 5 4 ' 3 2 1— ... —
6. Persistence
Won't quit until the
job is doneGives up very easily
8 7 8 5 4 3 2 1
7. Reinforcement
Is autonomous (needs little
external "stroking ")
Is dependent (needs fugfi
amounts of "stroking” from ottiers)
—
u
8. Work Attitude
Sees work as an
enjoyable activity
Has a "thank goodness it's
Friday” attitude
'I
—
9. Time Perspective
Looks toward the future and thinks about
ways to do a job better next time
8
Is oriented to the present,
just wants to finish a job
2 1
10. SupportivenessTries to help others
8 7
Seldom helps anyone
3 2 1
11. Initiative
Looks for new and
innovative approaches
Is content to maintain
the "status ouo"
12. Independence
I Is willing to work on own,
Iwhen appropriate
Is unwilling to work on own,
even when appropriate
*CopYH\lhl 1977 KonalJ K. Hamhtewti. Kemirih H. bland,arJ, baiil Hmty. All nxhis reittvtd.
4
N
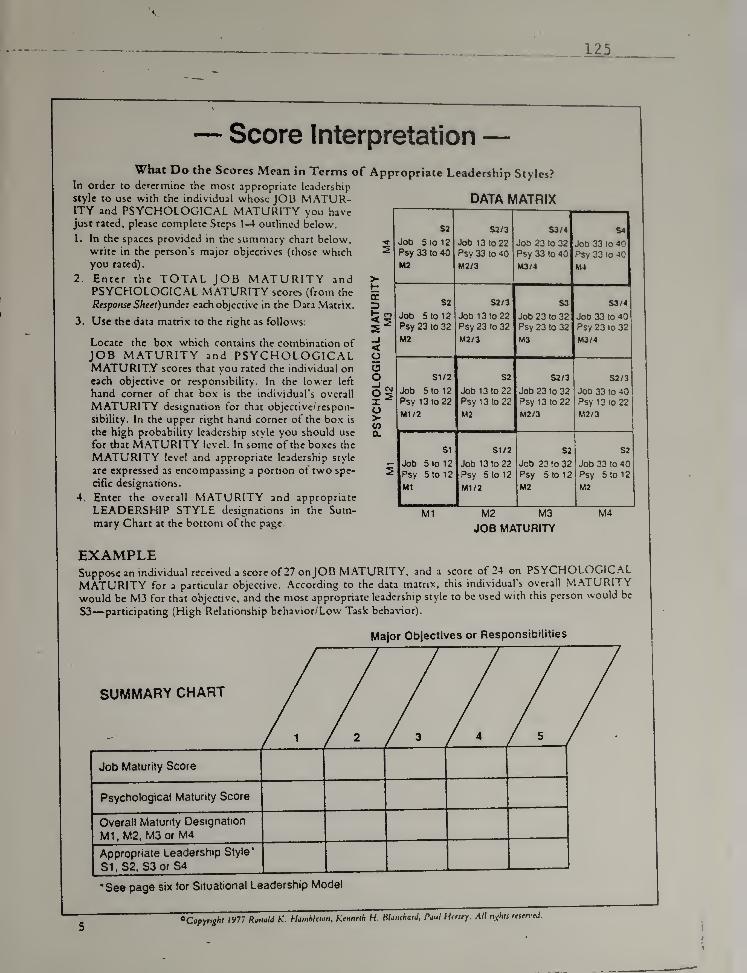
— Score Interpretation—What Do the Scores Mean in Terms of
In order to determine the most appropriate leadership
style to use with the individual whose J013 MATUR-ITY and PSYCHOLOGICAL MATURITY you havejust rated, please complete Steps 1-4 outlined below.
1. In the spaces provided in the summary chart below,write in the person’s major objectives (those whichyou rated).
2. Enter the TOTAL JOB MATURITY andPSYCHOLOGICAL MATURITY scores (from the
Response Sheet)undcT each objective in the Data Matrix.
3. Use the data matrix to the right as follows:
Locate the box which contains the combination of
JOB MATURITY and PSYCHOLOGICALMATURITY scores that you rated the individual oneach objective or responsibility. In the lower left
hand corner of that box is the individual’s overall
MATURITY designation for that objective/respon-
sibility. In the upper right hand corner of the box is
the high probability leadership style you should use
for that MATURITY level. In some of the boxes the
MATURITY level and appropriate leadership style
arc expressed as encompassing a portion of two spe-
cific designations.
4. Enter the overall MATURITY and appropriate
LEADERSHIP STYLE designations in the Sum-mary Chart at the bottom of the page.
Appropriate Leadership Styles?
DATA MATRIX
<oooO i
X '
u>(OOL
S2
Job 5 to 12
Psy 33 (0 40
M2
S2/3
Job 13 to 22Psy 33 to 40
M2/3
S3/4
Job 23 to 32Psy 33 to 40
M3/4
S4
Job 33 to 40Psy 33 to 40
M4
S2
Job 5 to 12
Psy 23 to 32
M2
S2/3
Job 13 to 22Psy 23 to 32
M2/3
S3
Job 23 to 32Psy 23 to 32
M3
S3/4
Job 33 to 40Psy 23 to 32
M3/4
SI/2
Job 5 to 1
2
Psy 13 to 22
Ml/2
S2
Job 13 to 22Psy 13 to 22
M2
S2/3
Job 23 to 32Psy 13 to 22
M2/3
S2/3
Job 33 to 40Psy 13 to 22
M2/3
SI
Job 5 to 1
2
Psy 5 to 12
Ml
SI/2
Job 13 to 22
Psy 5 to 12
Ml/2
S2
Job 23 to 32Psy 5 to 12
M2
S2
Job 33 to 40
j
Psy 5 to 12
M2
Ml M2 M3
JOB MATURITY
M4
EXAMPLESuppose an individual received a score of 27 onJOB MATURITY, and a score of 24 on PSYCHOLOGICALMATURITY for a particular objective. According to the data matrix, this individual’s overall MATURITYwould be M3 for that objective, and the most appropriate leadership style to be used with this person would be
S3—participating (High Relationship behavior/Low Task behavior).
Major Objectives or Responsibilities
SUMMARY CHART
Job Maturity Score
Psychological Maturity Score
Overall Maturity Designation
Ml. M2, M3 or M4
Appropriate Leadership Style*
S1, S2, S3 or S4
•See page six for Situational Leadership Model
5^Copyright »y77 Ronald K. Hamblilan, Kennrih H RlancharJ, Paul Htrsey. All rights rrsen’td.
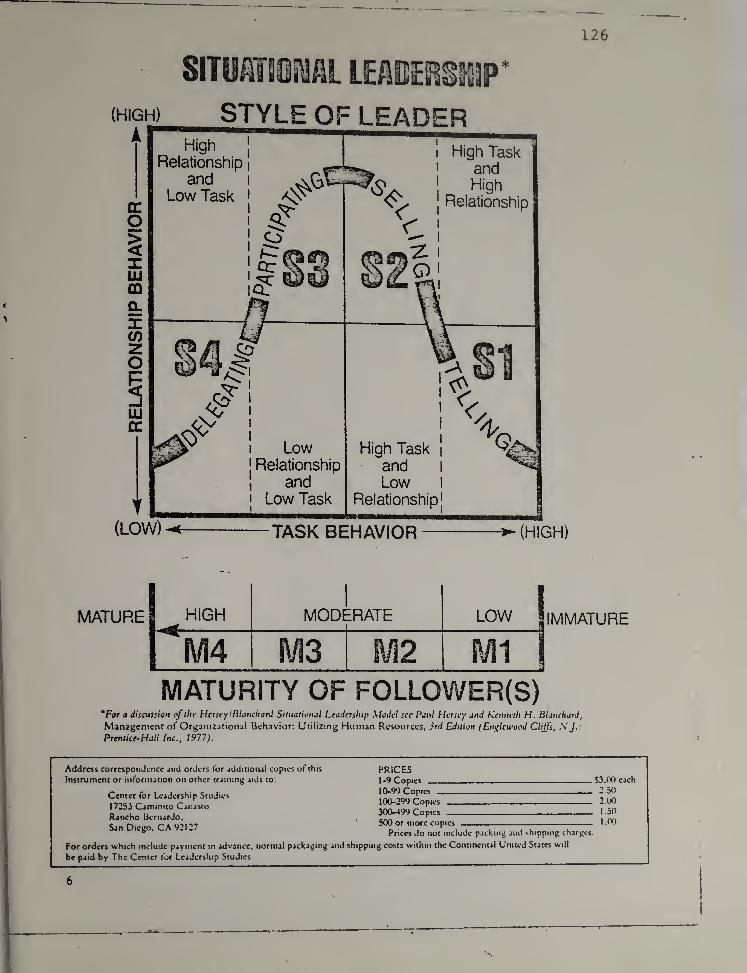
126
SITUfilSOi^fiL LEAil!EifS§2-23P
(HIGH)
CCo$XUJOQ
aX(f)
zO
LUX
(LOW)^
High1
Relationship i ^and 1
Low Task i
1
S3- ^
11
1
, , ^ 1
1 High Task• and
C1
S4^
^ 1LOW
I
Relationship
1and
1 Low Task1
1
High Task1
and 1
Low 1
Relationship! 1
TASK BEHAVIOR (HIGH)
MATURE 1 ^ MODIERATE LOW!IMMATURE
M4 !M3 !\2 1M 1
MATURITY OF FOLLOWER(S)*For a discussion of the HerseylBlotuhard Siinotioniil Leadership Model see Paul Hersey and Kenneth H. Blanchard,
Managenicnc of Organizational Behavior: Utilizing Human Resources, Jrd Edition (En\(lcwood Cliffs, S.J.:
Prentice-Hall Inc., 1977).
Address correspondence and orders for additional copies of this
Instrument or inforination on other training aids to:
Center for Leadership Studies
1725J Caminilo Canasto
Rancho Uernardo,
San Diego, CA V2127
PRICESno
2 50
intL-doy rr.pt,-s 2 no
1 50
500 or more copies 1 00
Prices do not include packing and shipping charges.
costs within the Continental United States willFor orders which include payment in advance, normal packaging and shipping
be paid by The Center for Leadership Studies
6
APPENDIX C
MATURITY SCALE, SELF-RATING FORM
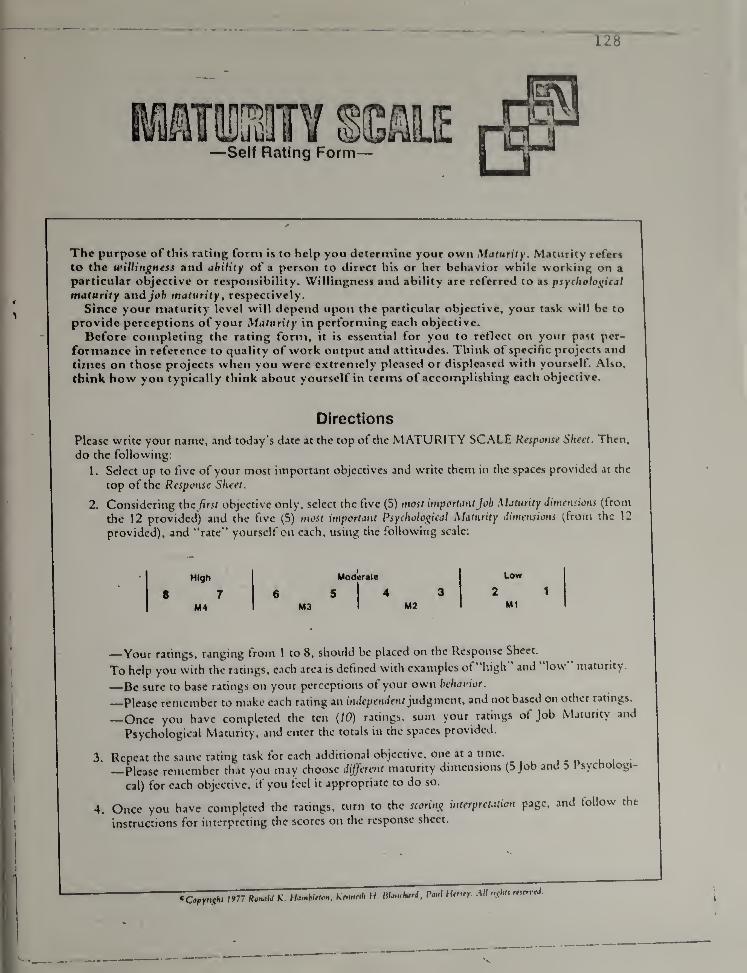
128
The purpose of this rating form is to help you determine your own Maturity. Maturity refers
to the unlltngness and ahility of a person to direct his or her behavior while working on a
particular objective or responsibility. Willingness and ability arc referred to as psychological
maturity and job maturity, respectively.
Since your maturity level will depend upon the particular objective, your task will be to
provide perceptions of your Maturity in performing each objective.
Before completing the rating form, it is essential for you to reflect on your past per-
formance in reference to quality of work output and attitudes. Think of specific projects and
times on those projects when you were extremely pleased or displeased with yourselt. Also,
think how you typically think about yourself in terms of accomplishing each objective.
Directions
Please write your name, and today’s date at the top of the MATURITY SC.^LE Response Sheet. Then,
do the following:
1. Select up to five of your most important objectives and write them in the spaces provided at the
top of the Response Sheet.
2. Considering the first objective only, select the five (5) tnosf importantJob Maturity Jirnensions (from
the 12 provided) and the five (5) most important Psychological Maturity dimensions (from the 12
provided), and “rate" yourself on each, using the following scale:
High Moderate Low
8 7M4
6 5M3
4 3
M2
2 1
Ml
—Your ratings, ranging from 1 to 8, should be placed on the Response Sheet.
To help you with the ratings, each area is defined with examples ot high and low maturity.
—Be sure to base ratings on your perceptions ot your own behavior.
—Please remember to make each rating an independent judgment, and not based on other ratings.
—Once you have completed the ten {W) ratings, sum your ratings of Job Maturity and
Psychological Maturity, and enter the totals in the spaces provided.
3. Repeat the same rating task tor each additional objective, one at a time.. - n
Please remember that you may choose dijjerent maturity dimensions (5 Job and 3 Psychologi-
cal) for each objective, if you feel it appropriate to do so.
4. Once you have completed the ratings, turn to the sfoririij interpretation page, and follow the
instructions for interpreting the scores on the response sheet.
*C0prr.ghi 1977 K. Kr,„mh H HUM. Pa..l Hrnry
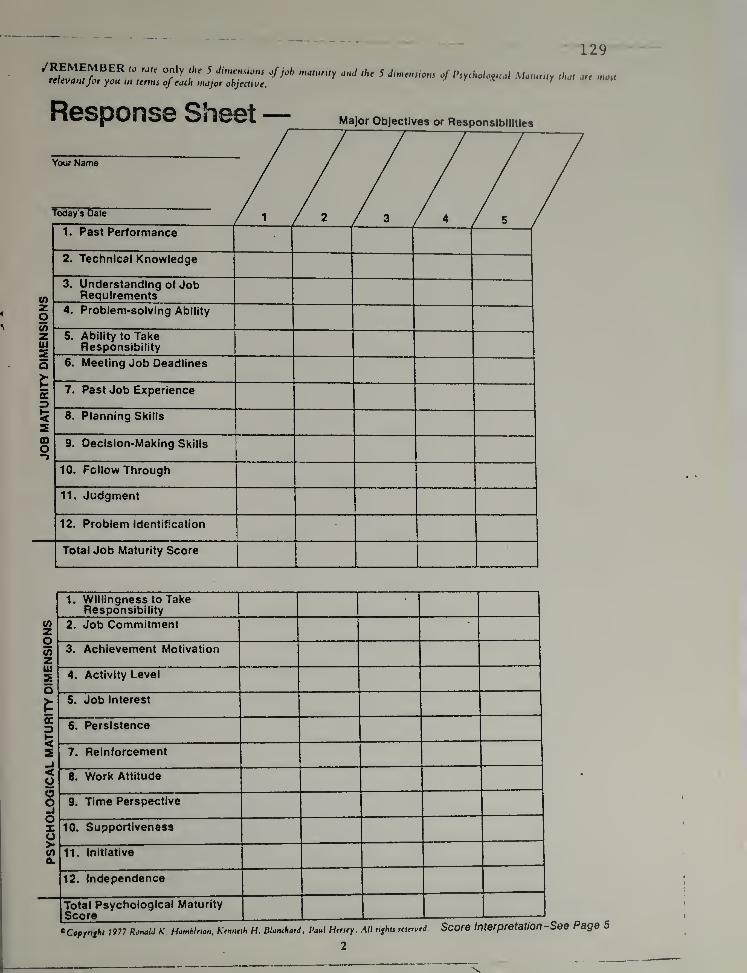
PSYCHOLOGICAL
MATURITY
DIMENSIONS
JOB
MATURITY
DIMENSIONS
129REMEMBER to rate only tUe 5 dintemions ofjob maturity and the 5 dimetisiotis of Psychological Maturity thatrelevantfor you in terms of each major objective.
Response Sheet—tire tnost
Major Objectives or Responsibilities
1. Willingness to TakeResponsibility
2. Job Commitment
3.
Achievement Motivation
4.
Activity Level
5.
Job Interest
6.
Persistence
7.
Reinforcement
8.
Work Attitude
9.
Time Perspective
10.
Supportiveness
11.
Initiative
12.
Independence
Total Psychological MaturityScore _1 -I ^
—
*Copynthl 1977 Ranald K Hamhieion, Kenneth H. Blanchard. Paul Mersey. .All righu reserved. SCOrO Interpretation-See Page 5
2
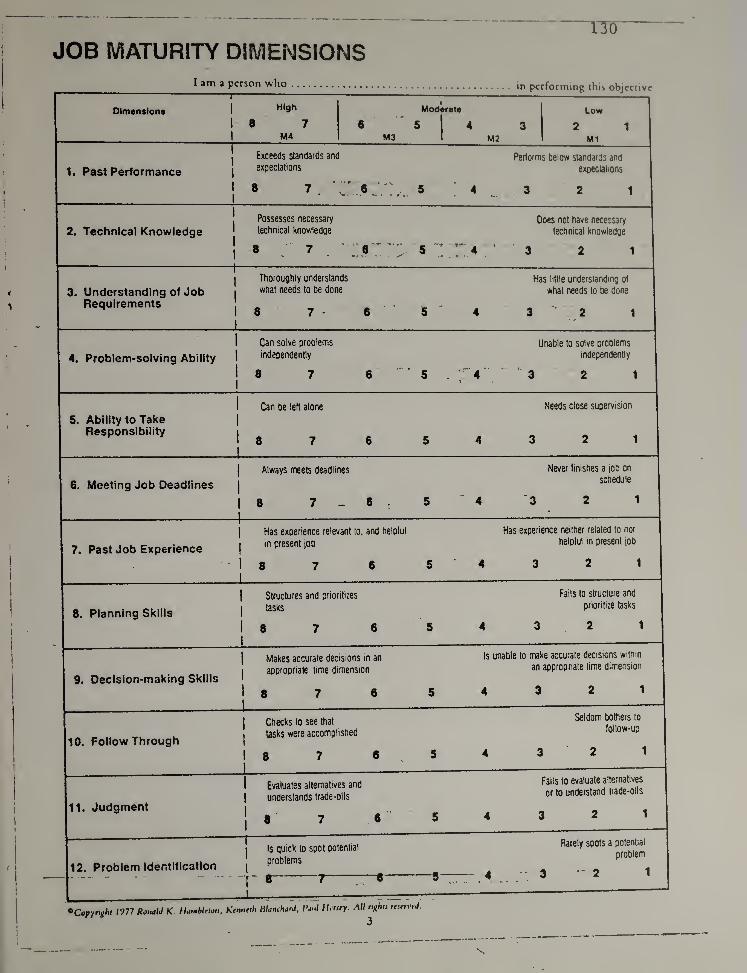
; ncJOB MATURITY DIMENSIONS
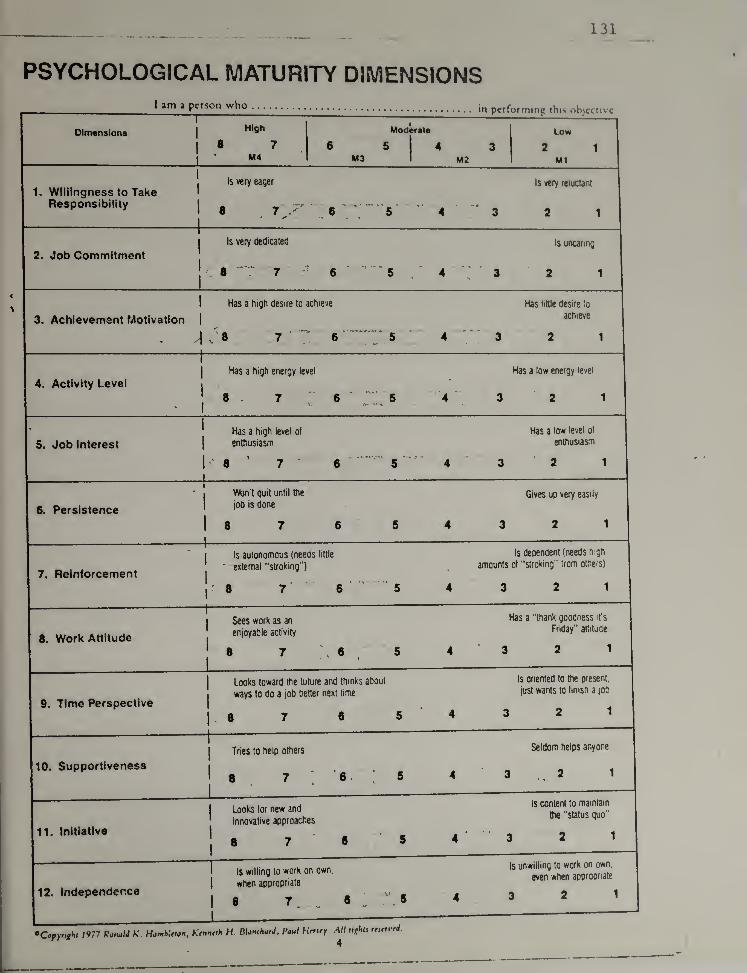
131
PSYCHOLOGICAL MATURITY DIMENSIONS
Dimensions
"T1
High Modmate
in pertorming inis objccuvc
1Low
1® 7
.6 5
1
4 3 2 1
1
M4 M3 1 M2 1 Ml
1Is very eager Is very reluctant
1. Willingness to Take 1
Responsibility1 8 7
1
' - 6 "s' 4 *3 2 1
1
1
Is very dedicated Is uncaring
2. Job CommitmentL-8 7
'
1
6 '5 /* 4 3 2 1
1 Has a high desire to achieve Has little desire to
3. Achievement Motivation1
achieve
- 6~
r.5' *
4 '3 2 1
1
1Has a high energy level Has a low energy level
4. Activity Level1
<
-1
• " 6' "
'.L 5 ' 4 3 2 1
-^ Has a high level of Has a low level of
5. Job Interest1
enthusiasm enthusiasm
18 ' 7
1
6......
^ 4 3 ‘2 1
1
‘1
Won’t quit until the Gives up very easily
6. Persistence 1 job is done
Is 7 6 5 4 3 2 1
;
1 Is autonomous (needs little Is dependent (needs high
7. Reinforcement' external "stroking"] amounts of "stroking" from others)
j: 8 ^ 7- '
6 5 4 3 2 1
1
1
Sees work as an Has a "thank goodness it's
8. Work Attitudeenjoyable activity
Friday" attitude
' 8 71
, 6 5 . 4 - 3 2 1
1 Looks toward the future and thinks about Is oriented to the present.
1 wavs to do a job better next time just wants to finish a|0b
9. Time Perspective1
1. 8 7 6 5 4 3 2 1
1
1Tries to help others Seldom helps anyone
10. Supportiveness1 .1
•
’8. 5 4 3 .. 2 1
1 Looks tor new and
' innovative approaches
Is content to maintain
the "status quo"
11. Initiative
1•
6r
* 4 ‘ * 3 2 1
1 Is willing to work on own,Is unwilling lo work on own.
even when approonale
12. Independence1
when appropriate
18 7..
_J — 6 1.".8 4 3 2 1
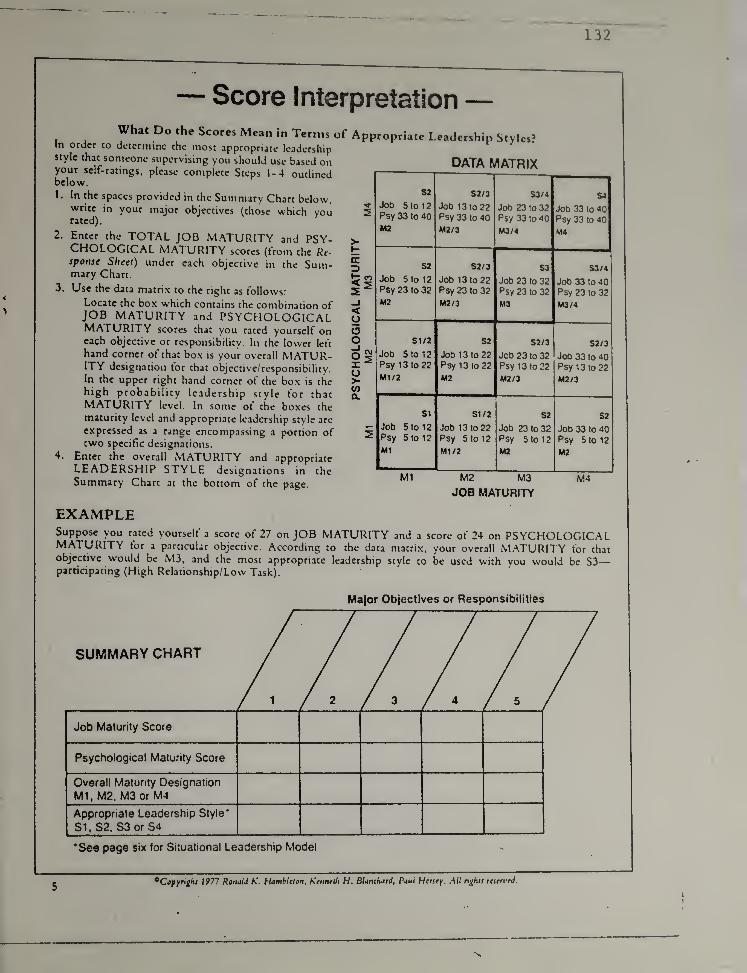
132
— Score Interpretation—What Do the Scores Mean in Terms of Appropriate Leadership Styles’
in order to determine the most appropriate leadershipStyle that someone supervising you should use based onyour self-ratings, please complete Steps 1-4 outlinedbelow.
1. In the spaces provided in the Summary Chart below,write in your major objectives (those which you 5rated).
2. Enter the TOTAL JOB MATURITY and PSY- >CHOLOGICAL MATURITY scores (from the Re- tsponse Sheet) under each objective in the Sum- 5mary Chart. F- „
3. Use the data matrix to the right as follows: S ^Locate the box which contains the combination of ^JOB MATURITY and PSYCHOLOGICAL oMATURITY scores that you rated yourself on Oeach objective or responsibility. In the lower left 2hand corner of that box is your overall MATUR- O ^ITY designation tor that objective/responsibility. qIn the upper right hand corner of the box is the >high probability leadership style for that ^MATURITY level. In some of the boxes thematurity level and appropriate leadership style are
expressed as a range encompassing a portion of 2two specific designations.
4. Enter the overall MATURITY and appropriateLEADERSHIP STYLE designations in theSummary Chart at the bottom of the page.
EXAMPLESuppose you rated yourself a score of 27 on JOB MATURITY and a score of 24 on PSYCHOLOGICALMATURITY for a particular objective. According to the data matrix, your overall M.^TURITY for thatobjective would be M3, and the most appropnate leadership style to be used with you would be S3
—
participating (High Relationship/Low Task).
DATA MATRIX
S2
Job 5 to 12Psy 33 to 40
M2
S2/3
Job 13 to 22Psy 33 to 40
M2/3
S3/4
Job 23 to 32Psy 33 to 40
M3/4
S4
Job 33 to 40Psy 33 to 40
M4
S2
Job 5tot2Psy 23 to 32
M2
S2/3
Job 13 to 22Psy 23 to 32
M2/3
S3
Job 23 to 32Psy 23 to 32
M3
S3/4
Job 33 to 40Psy 23 to 32
M3/4
SI/2
Job 5 to 1
2
Psy 13 to 22
Ml/2
S2
Job 13 to 22Psy 13 to 22
M2
S2/3
Job 23 to 32Psy 13 to 22
M2/3
S2/3
Job 33 to 40Psy 13 to 22
M2/3
SI
Job 5 to 12
Psy 5 to 12
Ml
SI/2
Job 13 to 22Psy 5 to 12
Ml/2
S2
Job 23 to 32Psy 5 to 12
M2
S2
Job 33 to 40Psy 5 to 12
M2
M1 M2 M3 M4
JOB MATURITY
Major Objectives or Responsibilities
SUMMARY CHART
Job Maturity Score
Psychological Maturity Score
Overall Maturity Designation
Ml, M2. M3 or M4
Appropriate Leadership Style*
S1.S2. S3 or S4
*See page six for Situational Leadership Model
5^Ciip/nght 1977 Ronald K. Hamhltton, Kenneth H. Blanchard, Paul Hersey. .All rights reserved.
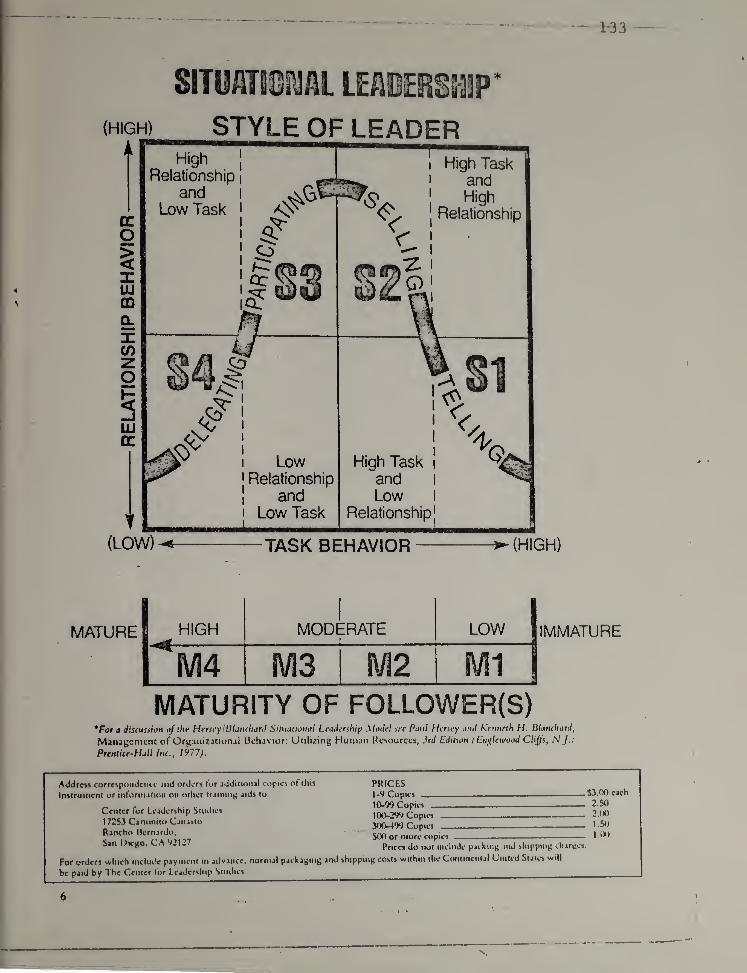
MATURE1 ^ HIGH MODIERATE LOW
1 IMMATURE
/I4 1IV13 1i\yi2 M1MATURITY OF FOLLOWER(S)
*Fora discussion of she HerseylBloncharil Situasiontsl Leadership Model sec Paul Mersey and Kenneth ti. Blanchard,
Management of Organizatjonal Behavior: Utilizing Human Resources, 3rd Edition (Ensilewood Cliffs, NJ.:
PrtntUe^Hall htc., 1977).
Addrof corfc\pondcntc and orders tor additional copies of this
Instrument or information on ocher training aids to;
PRICESS3.00 each
2.50Center for LcaJctihip SiiiJici 2.0017253 Ciniiniiu Cjiutcu 1.50Rancho licriurdn, l.OO
San Dietto. CA V’127Pnccj do not mclndt patkinj; and ^liippiii); charges
For orders which include paynu-nt m advance, normal packaging and shipping costs within the Continental United States will
be paid by The Center tor Leadership Studies
6 \
I
N.
I
APPENDIX D
LEADERSHIP STYLE AND PERFORMANCE FORM
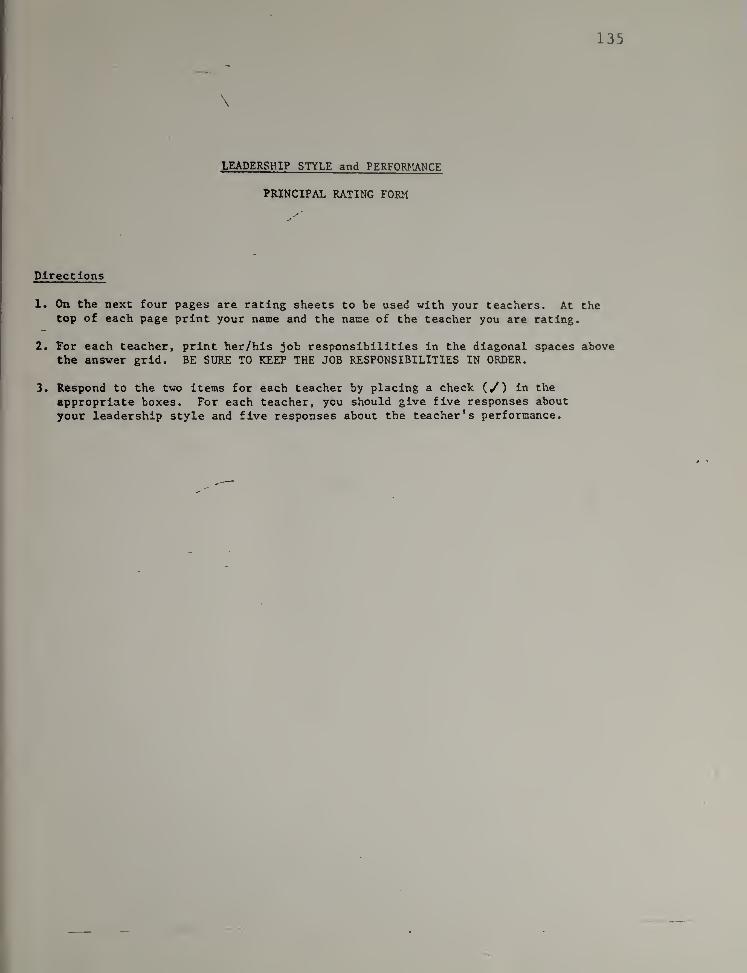
lEADERSHIP STYLE and PERFORMANCE
PRINCIPAL RATING FORM
Directions
1. On the next four pages are rating sheets to be used with your teachers. At thetop of each page print your name and the name of the teacher you are rating.
2. For each teacher, print her/his job responsibilities in the diagonal spaces abovethe answer grid. BE SURE TO KEEP THE JOB RESPONSIBILITIES IN ORDER.
3. Respond to the two items for each teacher by placing a check (,y) in the
appropriate boxes. For each teacher, you should give five responses about
your leadership style and five responses about the teacher's performance.
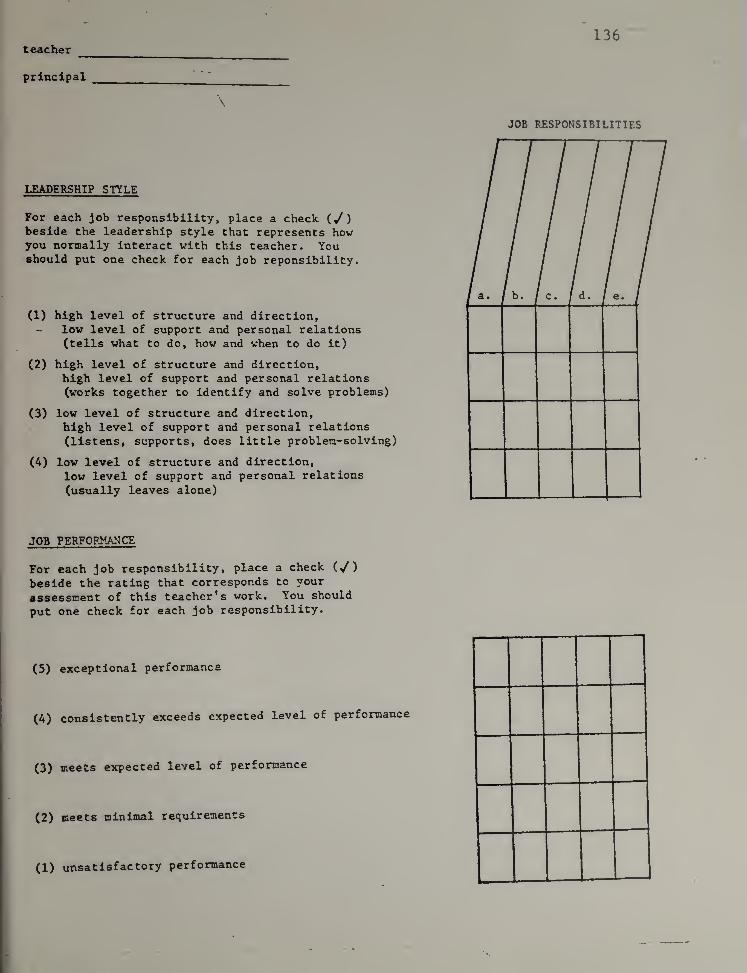
teacher
principal
\
LEADERSHIP STYLE
For each job responsibility, place a check (/)beside the leadership style that represents howyou normally Interact with this teacher. Youshould put one check for each job reponsibility.
(1) high level of structure and direction,low level of support and personal relations(tells what to do, how and when to do it)
(2) high level of structure and direction,high level of support and personal relations(works together to identify and solve problems)
(3) low level of structure and direction,high level of support and personal relations(listens, supports, does little problem-solving)
(A) low level of structure and direction,
low level of support and personal relations
(usually leaves alone)
JOB RESPONSIBILITIES
JOB PERFORMANCE
For each job responsibility, place a check (y)beside the rating that corresponds to your
assessment of this teacher's work. You should
put one check for each job responsibility.
(5) exceptional performance
(A) consistently exceeds expected level of performance
(3) meets expected level of performance
(2) meets minimal requirements
(1) unsatisfactory performance
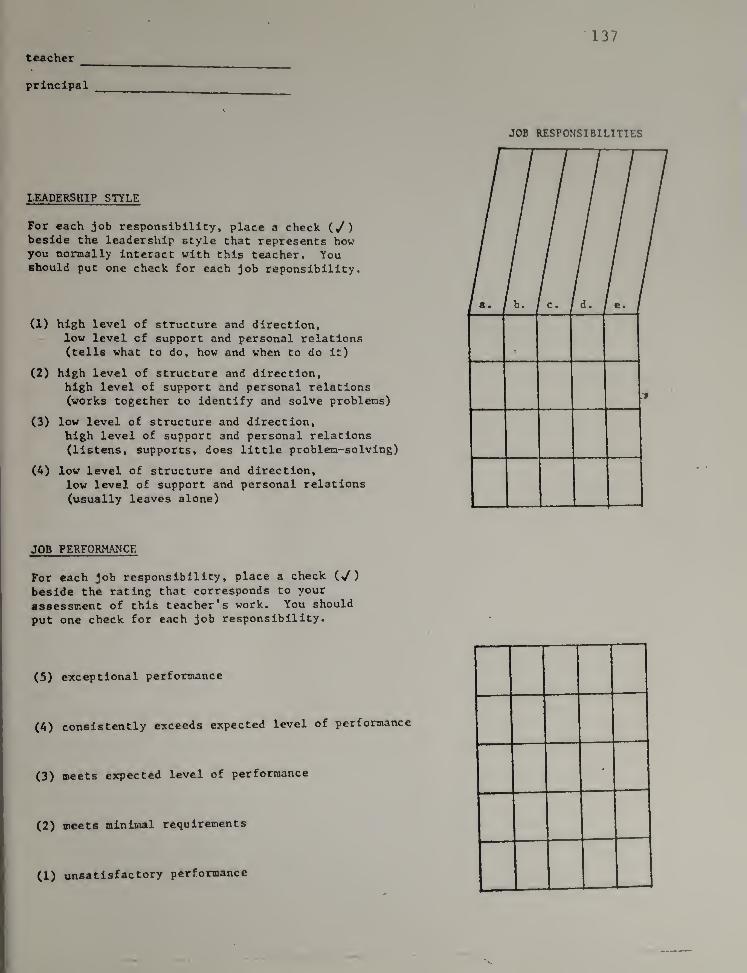
•137
teacher _
principal
LEADERSHIP STYLE
For each job responsibility, place a check C^)beside the leadership style that represents howyou normally interact with this teacher. Youshould put one check for each job reponsibility.
(1) high level of structure and direction,low level of support and personal relations(tells what to do, how and when to do it)
(2) high level of structure and direction,high level of support and personal relations(works together to identify and solve problems)
(3) low level of structure and direction,high level of support and personal relations(listens, supports, does little problem-solving)
(A) low level of structure and direction,low level of support and personal relations
(usually leaves alone)
JOB RESPONSIBILITIES
JOB PERFORMANCE
For each job responsibility, place a check
beside the rating that corresponds to your
assessment of this teacher’s work. You should
put one check for each job responsibility.
(5) exceptional performance
(A) consistently exceeds expected level of performance
(3) meets expected level of performance
(2) meets minimal requirements
(1) unsatisfactory performance
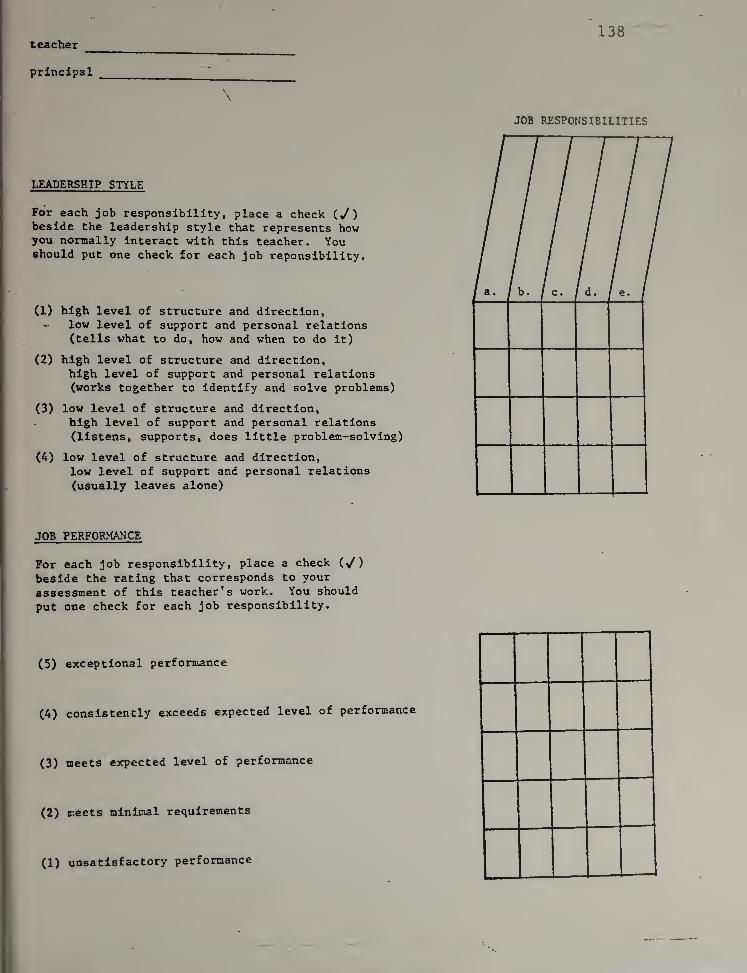
teacher138
principal
\
LEADERSHIP STYLE
For each job responsibility, place a checkbeside the leadership style that represents howyou normally interact with this teacher. Youshould put one check for each job reponsibility.
(1) high level of structure and direction,low level of support and personal relations(tells what to do, how and when to do it)
(2) high level of structure and direction,high level of support and personal relations(works together to identify and solve problems)
(3) low level of structure and direction,high level of support and personal relations(listens, supports, does little problem-solving)
(A) low level of structure and direction,low level of support and personal relations
(usually leaves alone)
JOB RESPONSIBILITIES
JOB PERFORMANCE
For each job responsibility, place a check
beside the rating that corresponds to your
assessment of this teacher’s work. You should
put one check for each job responsibility.
(5) exceptional performance
(A) consistently exceeds expected level of performance
(3) meets expected level of performance
(2) meets minimal requirements
(1) unsatisfactory performance
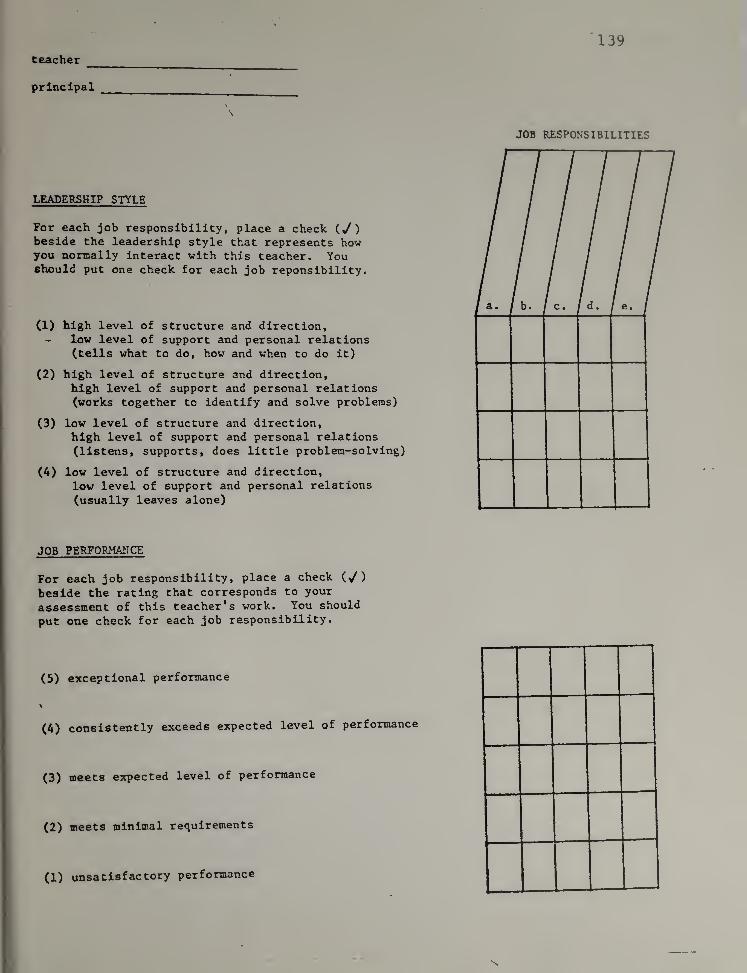
teacher
139
principal
LEADERSHIP STYLE
For each job responsibility, place a check (^J)beside the leadership style that represents howyou normally interact with this teacher. Youshould put one check for each job reponsibility.
(1) high level of structure and direction,- low level of support and personal relations
(tells what to do, how and when to do it)
(2) high level of structure and direction,high level of support and personal relations(works together to identify and solve problems)
(3) low level of structure and direction,high level of support and personal relations(listens, supports, does little problem-solving)
(A) low level of structure and direction,
low level of support and personal relations
(usually leaves alone)
JOB RESPONSIBILITIES
JOB PERFORMANCE
For each job responsibility, place a check C^)beside the rating that corresponds to your
assessment of this teacher's work. You should
put one check for each job responsibility.
(5) exceptional performance
(A) consistently exceeds expected level of performance
(3) meets expected level of performance
(2) meets minimal requirements
(1) unsatisfactory performance
APPENDIX E
LEADERSHIP STYLE AND EFFECTIVENESS FORM
141
\
LEADERSHIP STYLE and EFFECTIVENESS
TEACHER RATING FORM
Directions
1« On the next two pages are rating sheets to be used with your principal.At the top of page one, print your name and your principal's name.
2. Print your five Job responsibilities in the diagonal spaces above theanswer grids on both pages. BE SURE TO KEEP THE JOB RESPONSIBILITIESIN ORDER.
3. Respond to the two items on page 1 by placing a check (y ) in the
appropriate boxes. You should give five responses about your principal'sleadership style and five responses about your own performance.
4. Respond to the seven items on page 2 by writing the numbers 1, 2,3,4, or 5
in the boxes. Each item gets a response for every job responsibility.
Therefore, all the boxes should be filled with numbers.
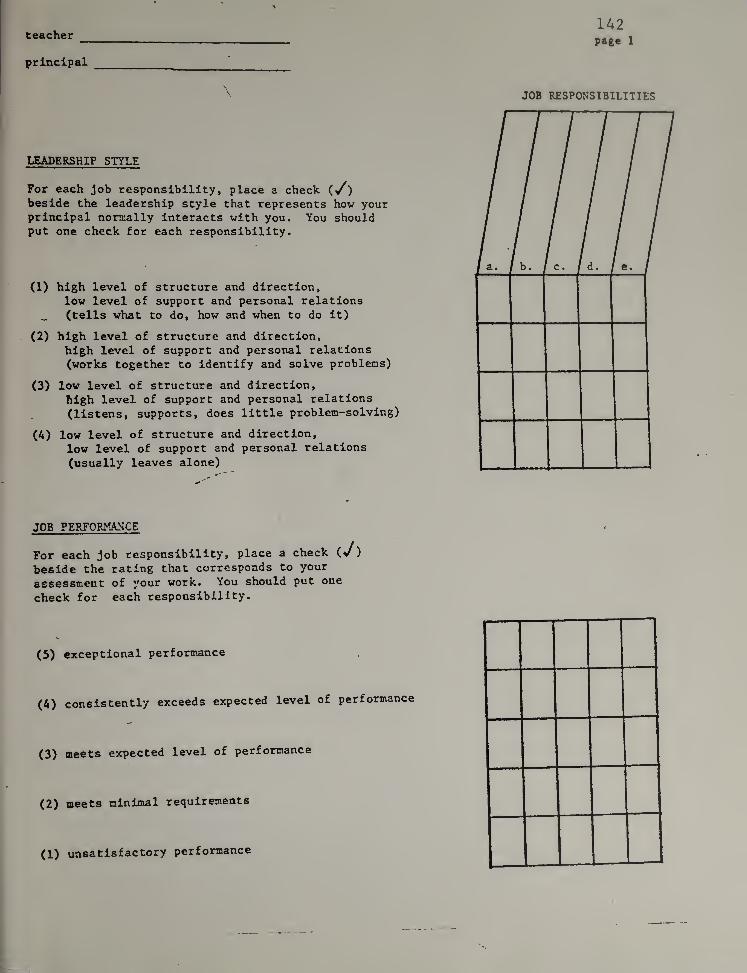
teacher _
principal
\
LEADERSHIP STYLE
For each Job responsibility, place a check (^)beside the leadership style that represents how yourprincipal normally interacts with you. You shouldput one check for each responsibility.
(1) high level of structure and direction,low level of support and personal relations
_ (tells what to do, how and when to do it)
(2) high level of structure and direction,
high level of support and personal relations
(works together to identify and solve problems)
(3) low level of structure and direction,
high level of support and personal relations
(listens, supports, does little problem-solving)
(A) low level of structure and direction,
low level of support and personal relations
(usually leaves alone)
142page 1
JOB RESPONSIBILITIES
JOB PERFORKANCE
For each Job responsibility, place a check (,J )
beside the rating that corresponds to your
assessment of your work. You should put one
check for each responsibility.
(5) exceptional performance
(A) consistently exceeds expected level of performance
(3) meets expected level of performance
(2) meets nlntmal requirements
(1) unsatisfactory performance
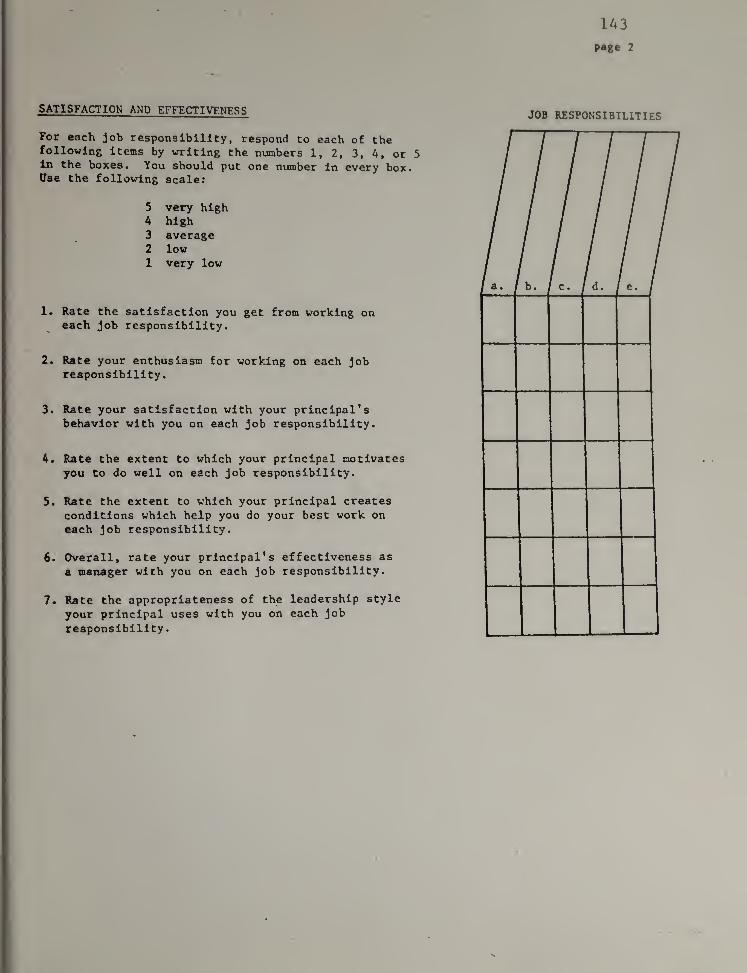
143
page 2
SATISFACTION AND EFFECTIVENESS
For each job responsibility, respond to each of thefollowing items by vrriting the numbers 1, 2, 3, A, or 5in the boxes. You should put one number in every box.Use the following scale:
5 very highA high3 average2 low1 very low
1. Rate the satisfaction you get from working oneach job responsibility.
2. Rate your enthusiasm for working on each jobresponsibility.
3.
Rate your satisfaction with your principal'sbehavior with you on each job responsibility.
A. Rate the extent to which your principal motivatesyou to do well on each job responsibility.
5. Rate the extent to which your principal createsconditions which help you do your best work on
each job responsibility.
6« Overall, rate your principal's effectiveness as
a manager with you on each job responsibility.
7. Rate the appropriateness of the leadership style
your principal uses with you on each job
responsibility.
JOB RESPONSIBILITIES
APPENDIX F
LEAD SELF
145
Directions;
Assume YOU are involved in each of the
following twelve situations. Each situation has
four alternative actions you might uutiate. READeach item carefully. THINK about what YOUwould do in each circumstance Then CIRCLEthe letter of the alternative action choice which
you think would most closely desenbe YOURbehavior in the situation presented. Circle only
one choice.
Reader
^dsptabiSity
escription
Published by
CENTER FOR LEADERSHIP STUDIES
^Copfrighl 1973 by Paul Hi-ney auJ Krnntlh H. BlauclurJ. May no, he reproduced ,n anyform unihou, wr,„en perm,,non ofCenterfor Leadership S,udie,.
i »
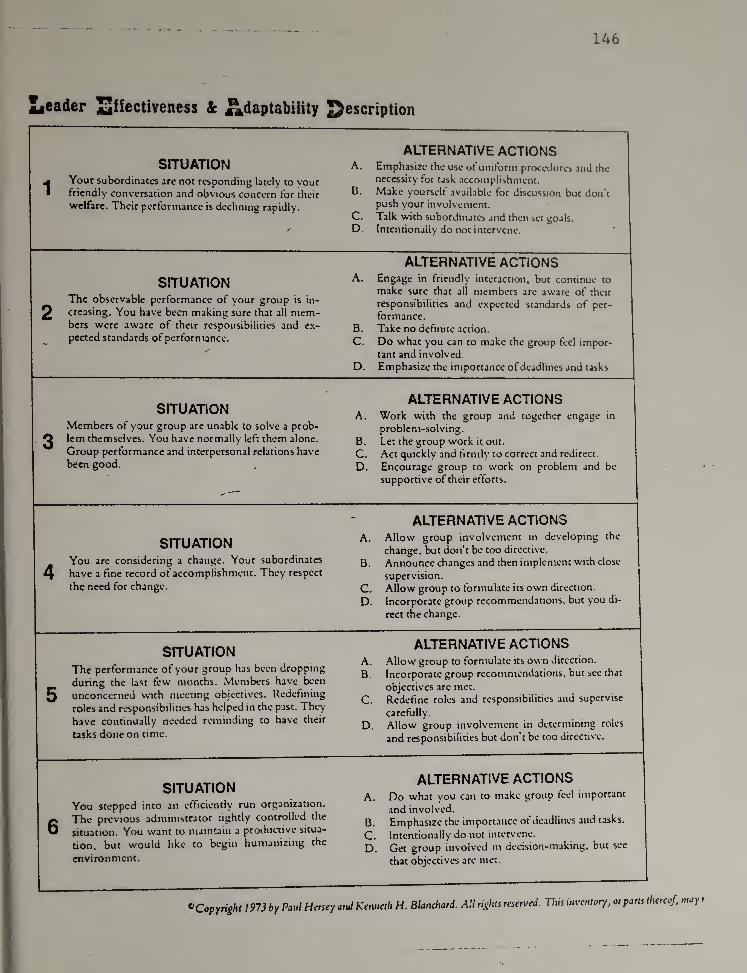
146
Sicader XSliectiveness & adaptability Description
1
SITUATIONYour subordinates are not responding lately to yourfriendly conversation and obvious concern for their
welfare. Their performance is declining rapidly.
ALTERNATIVE ACTIONSA. Emphasize the use of uniform procedures and the
necessity for task .iccoinplishment.
B. Make yourself available for discussion but don'tpush your involvement.
C. Talk with subordinates and then set goals.
D. Intentionally do not intervene.
2
SITUATIONThe observable performance of your group is in-
creasing. You have been making sure that all mem-bers were aware of their responsibilities and ex-
pected standards of performance.
ALTERNATIVE ACTIONSA. Engage in friendly interaction, but continue to
make sure that all members are aware of their
responsibilities and expected standards of per-
formance.
B. Take no definite action.
C. Do what you can to make the group feel impor-tant and involved.
D. Emphasize the importance of deadlines and tasks.
3
SITUATIONMembers of your group are unable to solve a prob-
lem themselves. You have normally left them alone.
Group performance and interpersonal relations have
been good.
ALTERNATIVE ACTIONSA. Work with the group and together engage in
problem-solving.
B. Let the group work it out.
C. Act quickly and firmly to correct and redirect.
D. Encourage group to work on problem and be
supportive of their efforts.
4
SITUATIONYou are considering a change. Your subordinates
have a fine record of accomplishment. They respect
the need for change.
ALTERNATIVE ACTIONSA. Allow group involvement in developing the
change, but don’t be too directive.
B. Announce changes and then implement with close
supervision.
C. Allow group to formulate its own direction.
D. Incorporate group recommendations, but you di-
rect the change.
5
SITUATIONThe performance of your group has been dropping
during the last few months. Members have been
unconcerned with meeting objectives. Redefining
roles and responsibilities has helped in the past. They
have continually needed reminding to have their
usks done on time.
ALTERNATIVE ACTIONSA. Allow group to formulate its own direction.
B. Incorporate group recommendations, but see that
objectives arc met.
C. Redefine roles and responsibilities and supervise
carefully.
D. Allow group involvement in determining roles
and responsibilities but don't be too directive.
6
SITUATIONYou stepped into an efficiently run organization.
The previous administrator tightly controlled the
situation. You want to maintain a productive situa-
tion, but would like to begin humanizing the
environment.
ALTERNATIVE ACTIONSA. Do what you can to make group feel important
and involved.
B. Emphasize the importance ot deadlines and tasks.
C. Intentionally do not intervene.
D. Get group involved in decision-making, but see
that objectives are met.
^Copyright 1973 by Paul Mersey and Kenneth H. Blanchard. All rights reserved. This inventory, or parts thereof, may
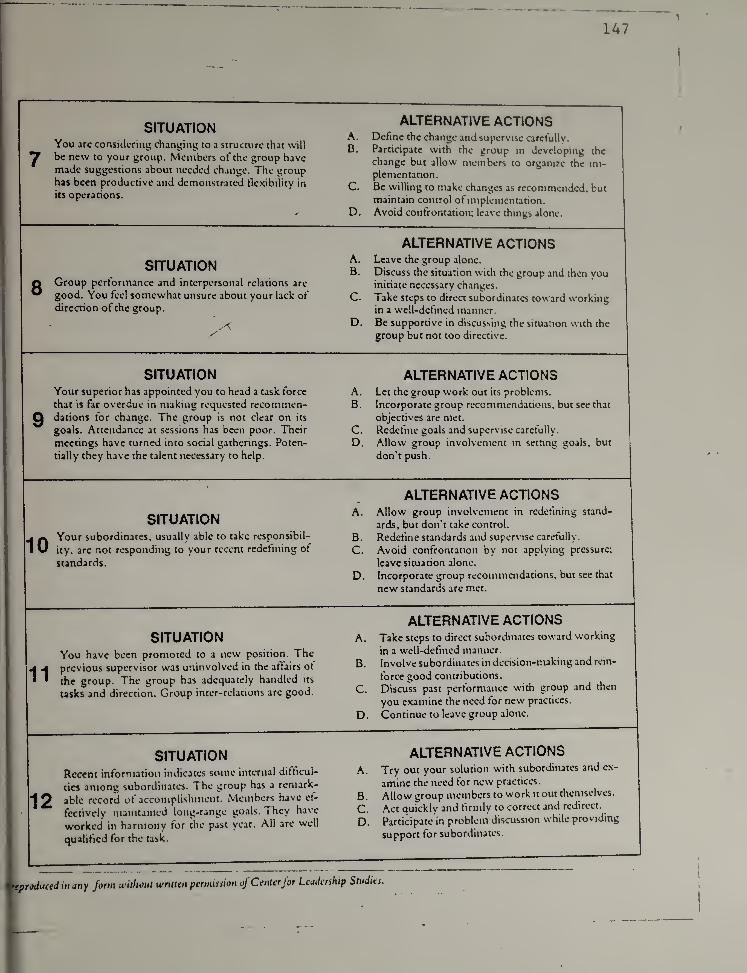
1471
SITUATIONYou are considering changing to a structure that will
^ be new to your group. Members of the group havemade suggestions about needed change. The grouphas been productive and demonstrated flexibility in
its operations.
ALTERNATIVE ACTIONSA. Define the change and supervise carefully.
B. Participate with the group in developing the
change but allow members to organue the im-plementation.
C. Be willing to make changes as recommended, but
maintain control of implementation.
D. Avoid confrontation; leave things alone.
SITUATION
Q Group performance and interpersonal relations are
^ good. You feel somewhat unsure about your lack of
direction of the group.
ALTERNATIVE ACTIONSA. Leave the group alone.
B. Discuss the situation with the group and then youinitiate necessary changes.
C. Take steps to direct subordinates toward workingin a well-defined manner.
D. Be supportive in discussing the situation with the
group but not too directive.
SITUATIONYour superior has appointed you to head a task force
that is far overdue in making requested recommen-
0 dations for change. The group is not clear on its
goals. Attendance at sessions has been poor. Their
meetings have turned into social gathenngs. Poten-
tially they have the talent necessary to help.
ALTERNATIVE ACTIONSA. Let the group work out its problems.
B. Incorporate group reconimcndatioiis, but see that
objectives are met.
C. Redefine goals and supervise carefully.
D. Allow group involvement in setnng goals, but
don’t push.
SITUATION. ^ Your subordinates, usually able to take responsibil-
1 W ity, are not responding to your recent redefining of
standards.
ALTERNATIVE ACTIONSA. Allow group involvement in redefining stand-
ards, but don’t take control.
B. Redefine standards and supervise carefully.
C. Avoid confrontation by not applying pressure;
leave situation alone.
D. Incorporate group recommendations, but see that
new standards are met.
SITUATIONYou have been promoted to a new position. The
.4 <A previous supervisor was uninvolved in the affairs ot
• * the group. The group has adequately handled its
tasks and direction. Group inter-relations are good.
ALTERNATIVE ACTIONSA. Take steps to direct subordinates toward working
in a well-defined manner.
B. Involve subordinates in decision-making and rein-
force good contributions.
C. Discuss past performance with group and then
you examine the need for new practices.
D. Continue to leave group alone.
SITUATIONRecent information indicates some internal difficul-
ties among subordinates. The group has a remark-
^ 2 'ccor'd of accomplishment. Members have ef-
fectively maintained long-range goals. They have
worked in harmony for the past year. All arc well
qualified for the task.
ALTERNATIVE ACTIONS
A. "fry your solution with subordinates and ex-
amine the need for new practices,
fl. Allow group members to work it out themselves.
C. Act quickly and firmly to correct and redirect.
D. Participate in problem discussion while providing
support for subordinates.
j^reproduced in any form mthout written permission of Centerfor Leadership Studies.
i
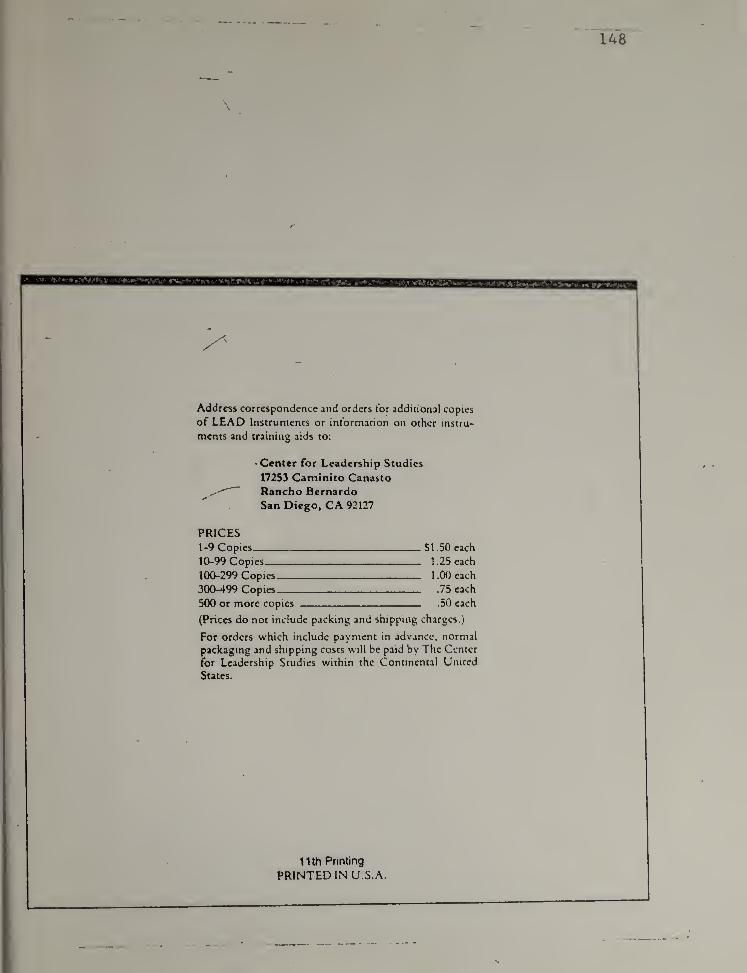
Address correspondence and orders tor additional copies
of LEAD Instruments or information on other instru-
ments and training aids to:
Center for Leadership Studies
17253 Caminito Canasto' Rancho Bernardo
San Diego, CA 92127
PRICES1-9 Copies
10-99 Copies
100-299 Copies
300-499 Copies
500 or more copies
(Prices do not include packing and shipping charges.)
SI .50 each
1.25 each
1 .00 each
.75 each
.50 each
For orders which include payment in advance, normal
packaging and shipping costs w'ill be paid by The Center
for Leadership Studies within the Continental United
States.
11th Printing
PRINTED IN U.S.A.
DIRECTiOS^S FORSELF SCORINGAND ANALYSIS
Publishcii by .
CENTER FOR LEADERSHIP STUDIES Calitornu American University
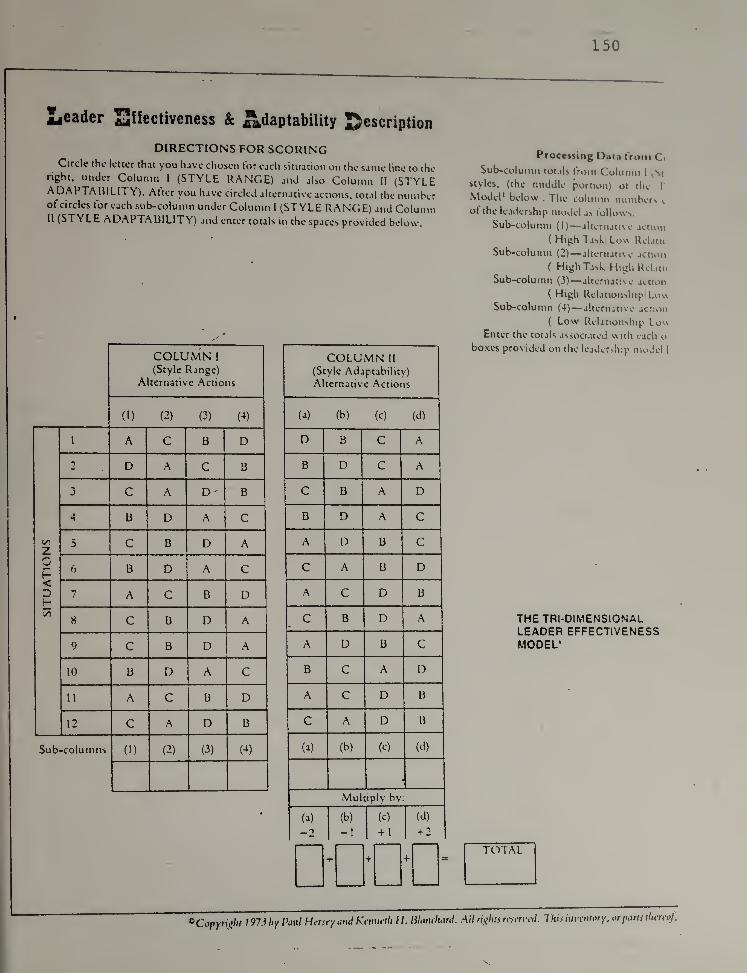
150
Leader S^Jectiveness & ^Adaptability ^description
DIRECTIONS FOR SCORINGCircle the letter that you have chosen tor eacli situation on the same line to the
right, under Column I (STYLE RANGE) and also Column II (STYLEADAPTAHILITY). Alter you have circled alternative actions, total the numberof circles for each sub-column under Column 1 (STYLE RANGE) and Column^1 (STYLE ADARTA13IL1TY) and enter totals in the spaces provided below.
COLUMN 1 COLUMN II
(Style Range)Alternative Actions
(Style Adaptability)
Alternative Actions
(1) (2) (3) (4) (<*) (b) (c) (d)
1 A C B D D B C A
2 D A C B B D C A
3 C A D' B C B A D
4 B D A C B D A C
;/J
z5 C D D A A D B C
Gf-
6 B D A C C A B D<Dh"
7 A C B D A C D B
C/1
8 C B D A C B D A
9 C B D A A D B C
10 B D A C B C A D
11 A C B D A C D B
12 C A D B C A D B
Sub-columns (I) (2) (3) (4)(a) (b) (c) (d)
Multiply by;
•
(a) (b) (c) (d)
_2 -1 + 1 + 2
Processing Data from Ci
Sub-column totals from Column I (St
styles, (the middle portion) of the TModel* below . The column numbers c
ot the leadership model as follows:
Sub-tolumn (1)— alternative action
( High Task'Losv Rel.itu-
Sub-column (2)— alternative actum
( High Task High Relatu
Sub-column (3)—alternative action
( High Relatioiisliip'Locc
Sub-column (4)— alternative action
(Low Relationship Lou
Enter the totals associated with each o’
boxes provided on the leadersliip model I
THETRI-DIMENSIONALLEADER EFFECTIVENESSMODEL’
TOTAL
^Copyrif^ht 1973 hy Paul Mersey ami Keuiietli H. Blimchani. Ail rights reserred. This iiivetitory, or pans ihereoj.
Address correspondence and orders for additional copies
of LEAD Instruments or information on other instru-
ments and training aids to:
Center for Leadership Studies
California American University
- 17253 Caminito Canasto
Rancho Bernardo,
San Diego, CA 92127
PRICES1-9 Copies
10-99 Copies, —l(X)-299 Copies
300-499 Copies
500 or more copies
(Prices do not include packing and shipping charges.)
For orders which include payment in advance, normal
packaging and shipping costs will be paid by The Center
for Leadership Studies within the Continental United
States.
SI .50 each
1 .25 each
l.OOeach
.75 each
.50 each
10th Printing
PRINTED IN U.S.A.
APPENDIX G
LEAD OTHER
154
LEADER’S SUPERIORASSOCIATE
SUBORDINATE
QPERCEPTIONS BY OTHERS (LEADERSHIP STYLE)
Directions:
Assume(name of leader)
is involved in each of the following twelve situations.
Each situation has four alternative actions this leader
might initiate. READ each item carefully. THINKabout what this PERSON would do in each
circumstance. Then CIRCLE the letter of the
alternative action choice which you think would most
closely describe the behavior ofTHIS LEADER in the
situation presented, based upon your experience with
' him. Circle only one choice.
eadsr
^fisctrjGBisss &
Published by
CENTER FOR LEADERSHIP STUDIES California American University
^Copynxht {97J hy PmiI Ihru y M,.l KV,».ri/i / /. .\l.,y ,uu h,- r.rr.Hhu ... .wyform w,tluv„ ... C.-....T /or U.uUrMp SinJUs.
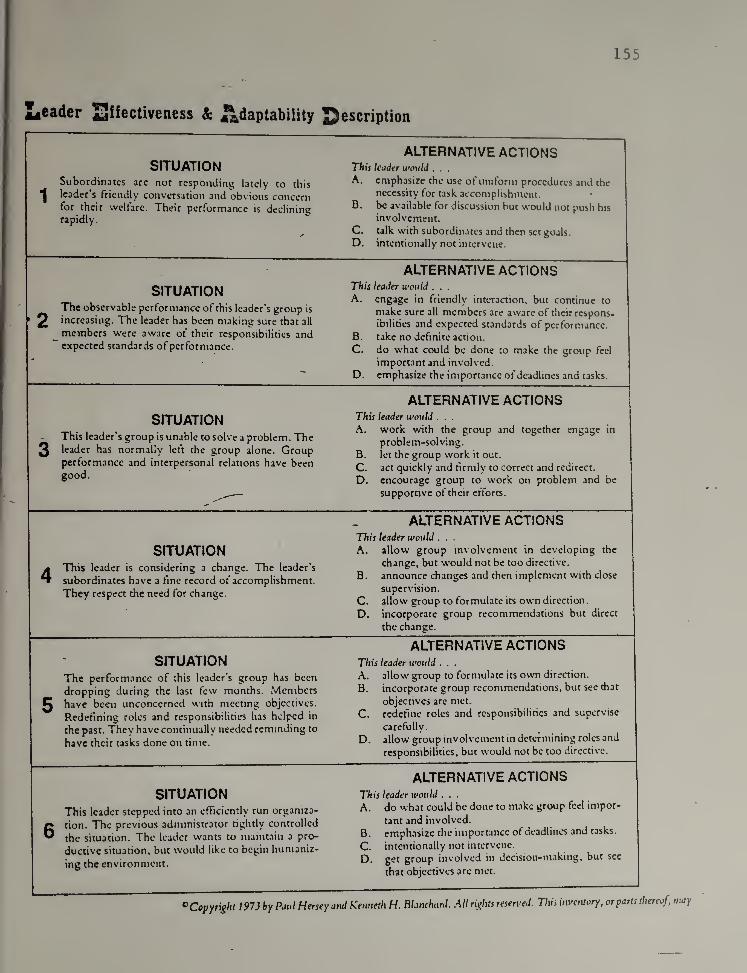
155
Leader Eiiectiveness & I^daptability description
1
SITUATIONSubordinates are not responding lately to this
leader’s friendly conversation and obvious concernfor their welfare. Their performance is decliningrapidly.
ALTERNATIVE ACTIONSThis leader would . . .
A. emphasize the use of uniform procedures and the
necessity for task accomplishment.B. be available for discussion but would not push his
involvement.
C. talk with subordinates and then set goals.
D. intentionally not intervene.
2
SITUATIONThe observable performance of this leader’s group is
increasing. The leader has been making sure that all
members were aware of their responsibilities andexpected standards of performance.
ALTERNATIVE ACTIONSThis leader would . . .
A. engage in friendly interaction, but continue to
make sure all members are aware of their respons-
ibilities and expected standards of performance.
B. take no definite action.
C. do what could be done to make the group feel
important and involved.
D. emphasize the importance of deadlines and tasks.
3
SITUATIONThis leader’s group is unable to solve a problem. Theleader has normally lett the group alone. Groupperformance and interpersonal relations have beengood.
ALTERNATIVE ACTIONSThis leader would . . .
A. work with the group and together engage in
problem-solving.
B. let the group work it out.
C. act quickly and firmly to correct and redirect.
D. encourage group to work on problem and be
supportive of their efforts.
4
SITUATIONThis leader is considering a change. The leader's
subordinates have a fine record of accomplishment.
They respect the need for change.
ALTERNATIVE ACTIONSThis leader would . . .
A. allow group involvement in developing the
change, but would not be too directive.
B. announce changes and then implement with close
supervision.
C. allosv group to formulate its own direction.
D. incorporate group recommendations but direct
the change.
5
SITUATIONThe performance of this leader’s group has been
dropping during the last few months. Membershave been unconcerned with meeting objectives.
Redefining roles and responsibilities has helped in
the past. They have continually needed reminding to
have their tasks done on time.
ALTERNATIVE ACTIONSThis leader would . . .
A. allow group to formulate its own direction.
B. incorporate group recommendations, but see that
objectives are met.
C. redefine roles and responsibiliries and supervise
carefully.
D. allow group involvement in determining roles and
responsibilities, but would not be too directive.
6
SITUATIONThis leader stepped into an efTicicntly run organiza-
tion. The previous administrator tightly controlled
the situation. The leader wants to maintain a pro-
ductive situation, but would like to begin humaniz-
ing the environment.
ALTERNATIVE ACTIONSThis leader would . . .
A. do what could be done to make group feel impor-
tant and involved.
B. emphasize the importance of deadlines and tasks.
C. intentionally not intervene.
D. get group involved in decision-making, but see
that objectives are met.
oCopyright 197J by Paul Mersey and Ketiueth H. Bhuichard. All rights reserved. This inventory, or parts thereof, may
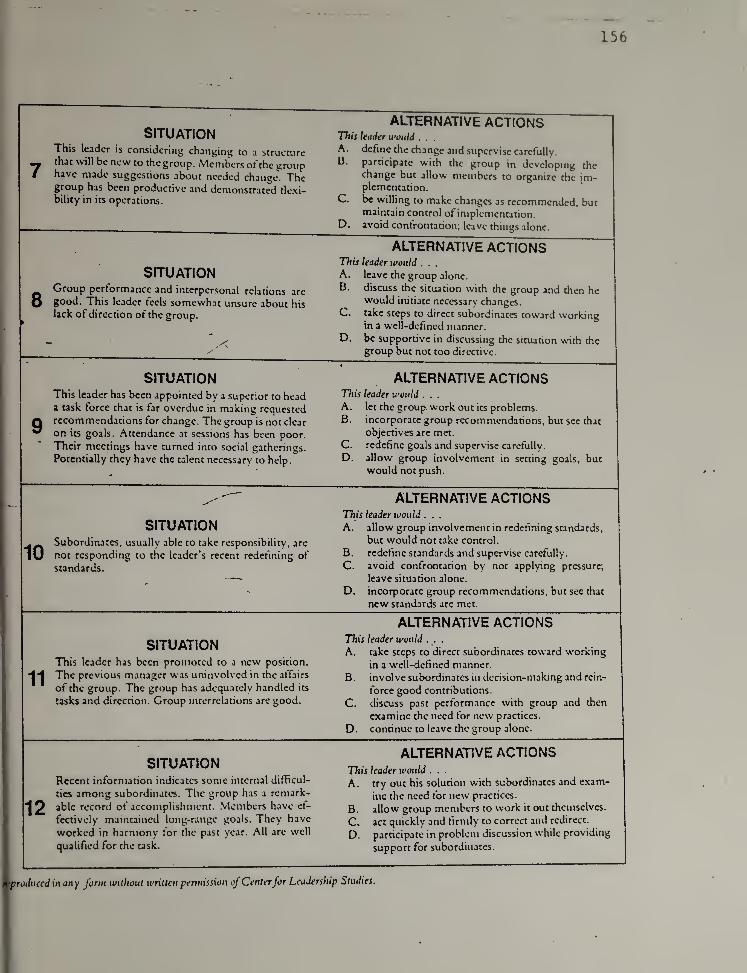
SITUATIONThis Icsdcr is considering changing to a structure_ that will be new to the group. Members ot the group
/ have made suggestions about needed change. Thegroup has been productive and demonstrated tlexi-bility in its operations.
ALTERNATIVE ACTIONSThis leader would . . .
A. define the change and supervise carefully.
U. participate with the group in developing thechange but allow members to organize the im-plementation.
C. be willing to make changes as recommended, butmaintain control of implementation.
D. avoid confrontation; leave things alone.
SITUATIONGroup performance and interpersonal relations are
O good. This leader feels somewhat unsure about his
lack of direction of the group.
ALTERNATIVE ACTIONSThis leader would . . .
A. leave the group alone.
B. discuss the situation with the group and then hewould initiate necessary changes.
C. take steps to direct subordinates toward workingin a well-defined manner.
— D. be supportive in discussing the situation with the
group but not too directive.
SITUATIONThis leader has been appointed by a superior to heada usk force that is far overdue in making requested
Q recommendations for change. The group is not clear
^ on its goals. Attendance at sessions has been poor.
Their meetings have turned into social gatherings.
Potentially they have the talent necessary to help.
ALTERNATIVE ACTIONSThis leader would . . .
A. let the group work out its problems.
B. incorporate group recommendations, but see that
objectives are met.
C. redefine goals and supervise carefully.
D. allow group involvement in setting goals, but
would not push.
ALTERNATIVE ACTIONS
SITUATION. _ Subordinates, usually able to take responsibility, are
lU not responding to the leader's recent redefining of
standards.
This leader loould . . .
A. allow group involvement in redefining standards,
but would not take control.
B. redefine standards and supervise carefully.
C. avoid confrontation by not applying pressure;
leave situation alone.
D. incorporate group recommendations, but see that
new standards are met.
SITUATIONThis leader has been promoted to a new position.
The previous manager was uninvolved in the affairs
of the group. The group has adequately handled its
tasks and direction. Group interrelations are good.
ALTERNATIVE ACTIONSThis leader would . . .
A. take steps to direct subordinates toward working
in a well-defined manner.
B. involve subordinates in decision-making and rein-
force good contributions.
C. discuss past performance with group and then
examine the need for new practices.
D. continue to leave the group alone.
SITUATIONRecent information indicates some internal dilTicul-
tics among subordinates. The group has a remark-
^2 record of accomplishment. .Members have ef-
fectively maintained long-range goals. They have
worked in harmony for the past year. All are well
qualified for the task.
ALTERNATIVE ACTIONSThis leader would . . .
A. try out his solution with subordinates and exam-
ine the need for new practices.
B. allow group members to work it out themselves.
C. act quickly and firmly to correct and redirect.
D. participate in problem discussion while providing
support for subordinates.
‘produced ill any form withoul wriltcii permission ofCenterfor Leadership Studies.

Address correspondence and orders for additional copies
of LEAD Instruments or information on other instru-
ments and training aids to:
Center for Leadership Studies
California American University
17253 Caminito Canasto
^ Rancho Bernardo,
San Diego, CA 92127
PRICES1-9 Copies SI .50 each
1.25 each
1 .00 each
.75 each
.50 each
(Prices do not include packing and shipping charges.)
10-99 Copies
100-299 Copies
300-499 Copies
500 or more copies
For orders which include payment in advance, normal
packaging and shipping costs will be paid by The Center
for Leadership Studies within the Continental United
States.
10th Printing
PRINTED IN U.S.A.