lcia methods - openlca · recipe 8 methods upgraded to version 1.10 from may ... openlca lcia...
TRANSCRIPT
1
LCIA methods Impact assessment methods in Life Cycle Assessment and
their impact categories
Version: 1.5.4
Date: 16 March 2015
Authors: Aitor P. Acero, Cristina Rodríguez, Andreas Ciroth
Changelog
Version Author Changes Date
Version 1.0 Acero, Rodríguez,
Ciroth
1st release 31 January 2014
Version 1.1 Acero, Rodríguez,
Ciroth
Corrected normalization factors for CML 2001 3 February 2014
Version 1.2 Acero, Rodríguez,
Ciroth
Added Social LCIA method, updated TRACI 2.0 to
TRACI 2.1, updated ILCD 2011
17 February 2014
Version 1.3 Acero, Rodríguez,
Ciroth
Updated TRACI 2.1 to add some ecoinvent specific flows 1 April 2014
Version 1.4 Acero, Rodríguez,
Ciroth
Corrected CML and ReCiPe version 28 April 2014
Version 1.4.1 Acero, Rodríguez,
Ciroth
Deleted EDIP 2003 methods as they need further
revision. Only in EcoSpold and openLCA 1.4 formats
4 September 2014
Version 1.4.2 Acero, Rodríguez,
Ciroth
Added normalization/weighting factors for intermediate
endpoint categories in ReCiPe. Only in EcoSpold and
openLCA 1.4 formats
17 October 2014
Version 1.5 Acero, Rodríguez,
Ciroth
ReCiPe 8 methods upgraded to version 1.10 from May
2014. Only in EcoSpold and openLCA 1.4 formats
30 October 2014
Version 1.5.1 Acero, Rodríguez,
Ciroth
Some missing factors in ReCiPe 8 methods added. Only
in EcoSpold and openLCA 1.4 formats
11 November 2014
Version 1.5.2 Acero, Rodríguez,
Ciroth
Cumulative Energy Demand method added. Added
normalisation/weighting factors for intermediate endpoint
5 January 2015
2
categories in Eco-Indicator 99. Weighting reference unit
corrected. Only in EcoSpold and openLCA 1.4 formats
Version 1.5.3 Acero, Rodríguez,
Ciroth
ReCiPe methods: deleted wrong FEP CFs, added missing
FETP End (I) CFs, added new FDP CFs (Update method
to v.1.11). Only in EcoSpold and openLCA 1.4 formats.
Further information in:
http://www.openlca.org/documents/14826/1a4eca5a-
1b08-4471-ab87-e6efd66702c9
4 February 2015
Version 1.5.4 Acero, Rodríguez,
Ciroth
CML methods updated to v.4.4.: abiotic depletion impact
categories updated, CFs for new flows in reference date
added, CFs which were originally from ecoinvent LCIA
methods were deleted or updated. Only in EcoSpold and
openLCA 1.4 formats. Further information in:
http://www.openlca.org/files/openlca/Update_info_open
LCA_LCIA_methods_1_5_4.xlsx
16 March 2015
3
Content
1 Introduction ......................................................................................................................... 4
2 How to use the LCIA methods packs in openLCA ............................................................. 4
2.1 openLCA LCIA methods ............................................................................................. 4 2.2 Social Hotspots Database (SHDB) LCIA Method ...................................................... 6
3 Environmental Impact Assessment Methods ...................................................................... 6
3.1 Impact assessment methods in the pack ...................................................................... 6 3.1.1 CML ..................................................................................................................... 9
3.1.2 Cumulative Energy Demand .............................................................................. 10
3.1.3 Eco-indicator 99 ................................................................................................. 11
3.1.4 Ecological Scarcity Method 2006 ...................................................................... 12
3.1.5 ILCD 2011 .......................................................................................................... 12
3.1.6 ReCiPe ................................................................................................................ 13
3.1.7 TRACI 2.1 .......................................................................................................... 15
3.1.8 USEtox ............................................................................................................... 15
3.2 Limitations ................................................................................................................. 16 3.3 Impact categories ....................................................................................................... 16
3.3.1 Acidification ....................................................................................................... 17
3.3.2 Climate change ................................................................................................... 17
3.3.3 Depletion of abiotic resources ............................................................................ 18
3.3.4 Ecotoxicity ......................................................................................................... 18
3.3.5 Eutrophication .................................................................................................... 19
3.3.6 Human toxicity ................................................................................................... 19
3.3.7 Ionising radiation ................................................................................................ 20
3.3.8 Land use ............................................................................................................. 20
3.3.9 Ozone layer depletion (Stratospheric ozone depletion) ..................................... 21
3.3.10 Particulate matter ................................................................................................ 21
3.3.11 Photochemical oxidation (Photochemical ozone creation potential) ................. 21
4 Social Impact Assessment Method ................................................................................... 22
5 References ......................................................................................................................... 23
6 Contact .............................................................................................................................. 23
4
1 Introduction
The availability of diverse sources for life cycle inventory databases and Life Cycle Impact
Assessment (LCIA) methods should be an asset to better perform life cycle assessment studies.
However, the variability of nomenclature used in each source for e.g. the compounds and
compartments of the elementary exchanges impedes a straightforward combination of the
different data. Thus, an intense work has been conducted for openLCA in order to align and
harmonize the flows from different databases and LCIA methods.
The Nexus website (https://nexus.openlca.org/) contains currently over 30,000 data sets, from
different sources, which can be used independently or combined in a single system in openLCA.
And we are happy to be able to provide now a comprehensive pack of Life Cycle Impact
Assessment (LCIA) methods suitable for all the data sets in Nexus. This pack is meant to replace
the previous “impact methods” archive that was kindly provided by ecoinvent, which was
mainly addressing ecoinvent flows.
In addition, a pack containing a social LCIA method is also provided in order to use it with the
Social Hotspots Database, which is also available at Nexus.
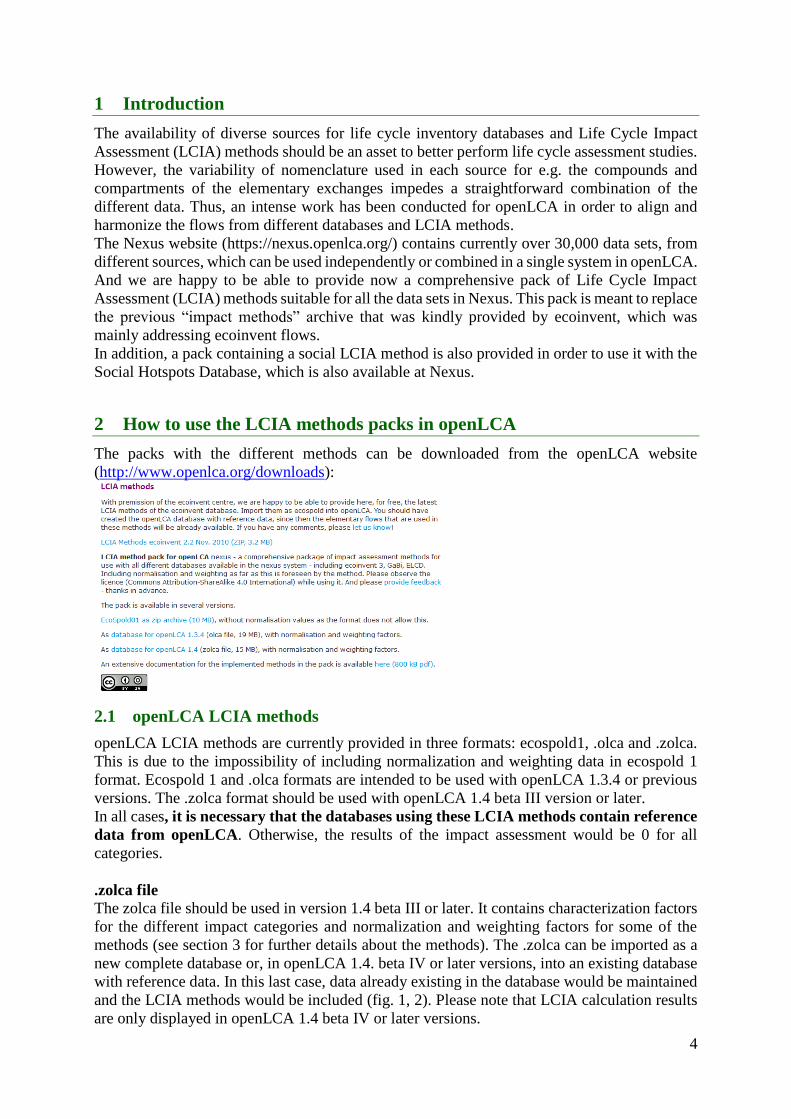
2 How to use the LCIA methods packs in openLCA
The packs with the different methods can be downloaded from the openLCA website
(http://www.openlca.org/downloads):
2.1 openLCA LCIA methods
openLCA LCIA methods are currently provided in three formats: ecospold1, .olca and .zolca.
This is due to the impossibility of including normalization and weighting data in ecospold 1
format. Ecospold 1 and .olca formats are intended to be used with openLCA 1.3.4 or previous
versions. The .zolca format should be used with openLCA 1.4 beta III version or later.
In all cases, it is necessary that the databases using these LCIA methods contain reference
data from openLCA. Otherwise, the results of the impact assessment would be 0 for all
categories.
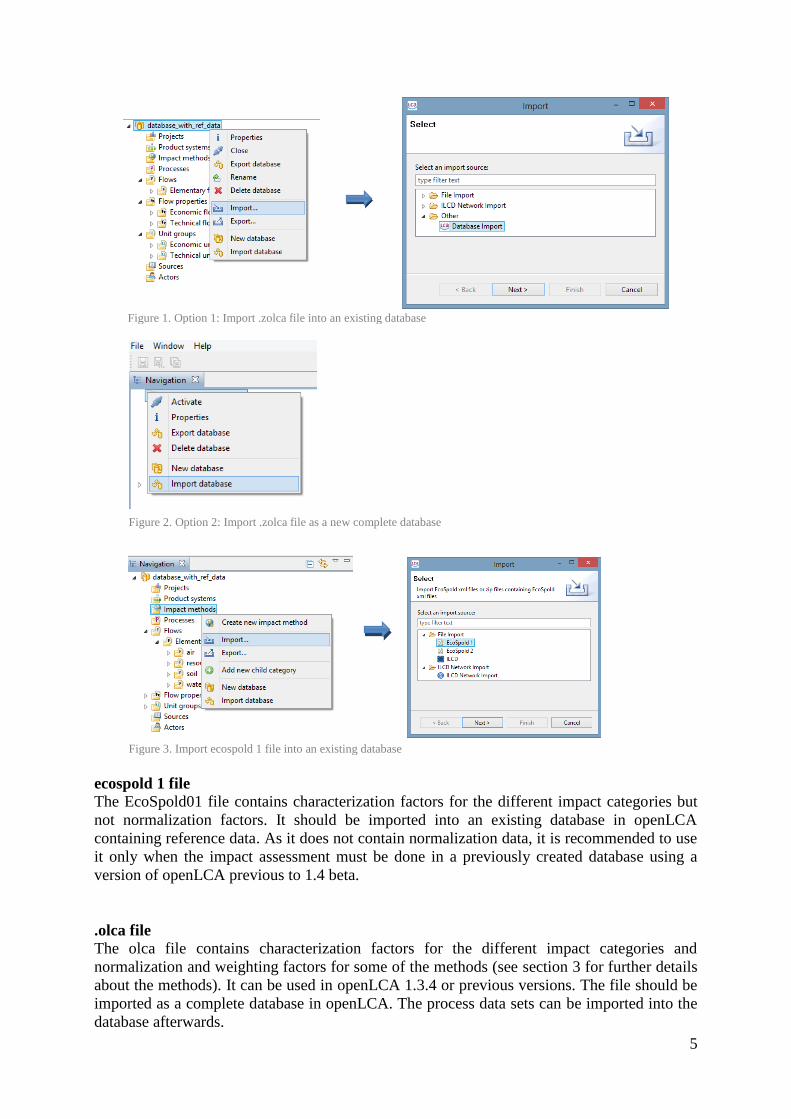
.zolca file
The zolca file should be used in version 1.4 beta III or later. It contains characterization factors
for the different impact categories and normalization and weighting factors for some of the
methods (see section 3 for further details about the methods). The .zolca can be imported as a
new complete database or, in openLCA 1.4. beta IV or later versions, into an existing database
with reference data. In this last case, data already existing in the database would be maintained
and the LCIA methods would be included (fig. 1, 2). Please note that LCIA calculation results
are only displayed in openLCA 1.4 beta IV or later versions.
5
ecospold 1 file
The EcoSpold01 file contains characterization factors for the different impact categories but
not normalization factors. It should be imported into an existing database in openLCA
containing reference data. As it does not contain normalization data, it is recommended to use
it only when the impact assessment must be done in a previously created database using a
version of openLCA previous to 1.4 beta.
.olca file
The olca file contains characterization factors for the different impact categories and
normalization and weighting factors for some of the methods (see section 3 for further details
about the methods). It can be used in openLCA 1.3.4 or previous versions. The file should be
imported as a complete database in openLCA. The process data sets can be imported into the
database afterwards.
Figure 1. Option 1: Import .zolca file into an existing database
Figure 3. Import ecospold 1 file into an existing database
Figure 2. Option 2: Import .zolca file as a new complete database
6
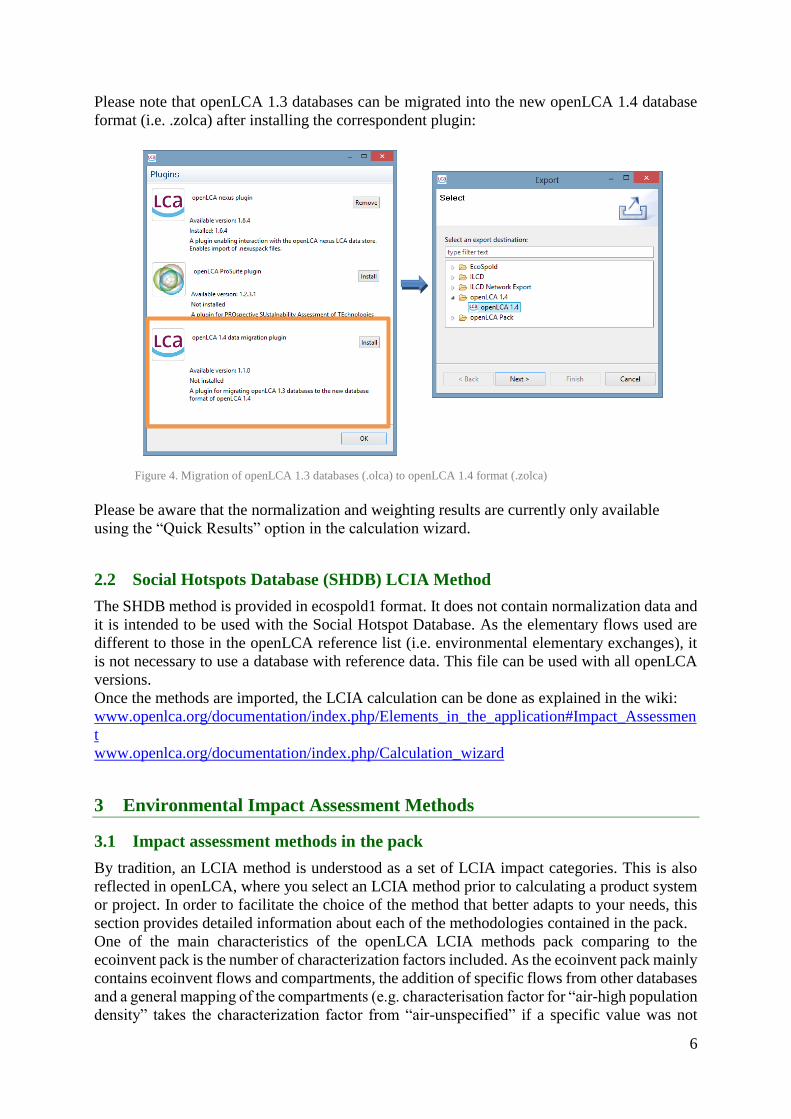
Please note that openLCA 1.3 databases can be migrated into the new openLCA 1.4 database
format (i.e. .zolca) after installing the correspondent plugin:
Please be aware that the normalization and weighting results are currently only available
using the “Quick Results” option in the calculation wizard.
2.2 Social Hotspots Database (SHDB) LCIA Method
The SHDB method is provided in ecospold1 format. It does not contain normalization data and
it is intended to be used with the Social Hotspot Database. As the elementary flows used are
different to those in the openLCA reference list (i.e. environmental elementary exchanges), it
is not necessary to use a database with reference data. This file can be used with all openLCA
versions.
Once the methods are imported, the LCIA calculation can be done as explained in the wiki:
www.openlca.org/documentation/index.php/Elements_in_the_application#Impact_Assessmen
t
www.openlca.org/documentation/index.php/Calculation_wizard
3 Environmental Impact Assessment Methods
3.1 Impact assessment methods in the pack
By tradition, an LCIA method is understood as a set of LCIA impact categories. This is also
reflected in openLCA, where you select an LCIA method prior to calculating a product system
or project. In order to facilitate the choice of the method that better adapts to your needs, this
section provides detailed information about each of the methodologies contained in the pack.
One of the main characteristics of the openLCA LCIA methods pack comparing to the
ecoinvent pack is the number of characterization factors included. As the ecoinvent pack mainly
contains ecoinvent flows and compartments, the addition of specific flows from other databases
and a general mapping of the compartments (e.g. characterisation factor for “air-high population
density” takes the characterization factor from “air-unspecified” if a specific value was not
Figure 4. Migration of openLCA 1.3 databases (.olca) to openLCA 1.4 format (.zolca)
7
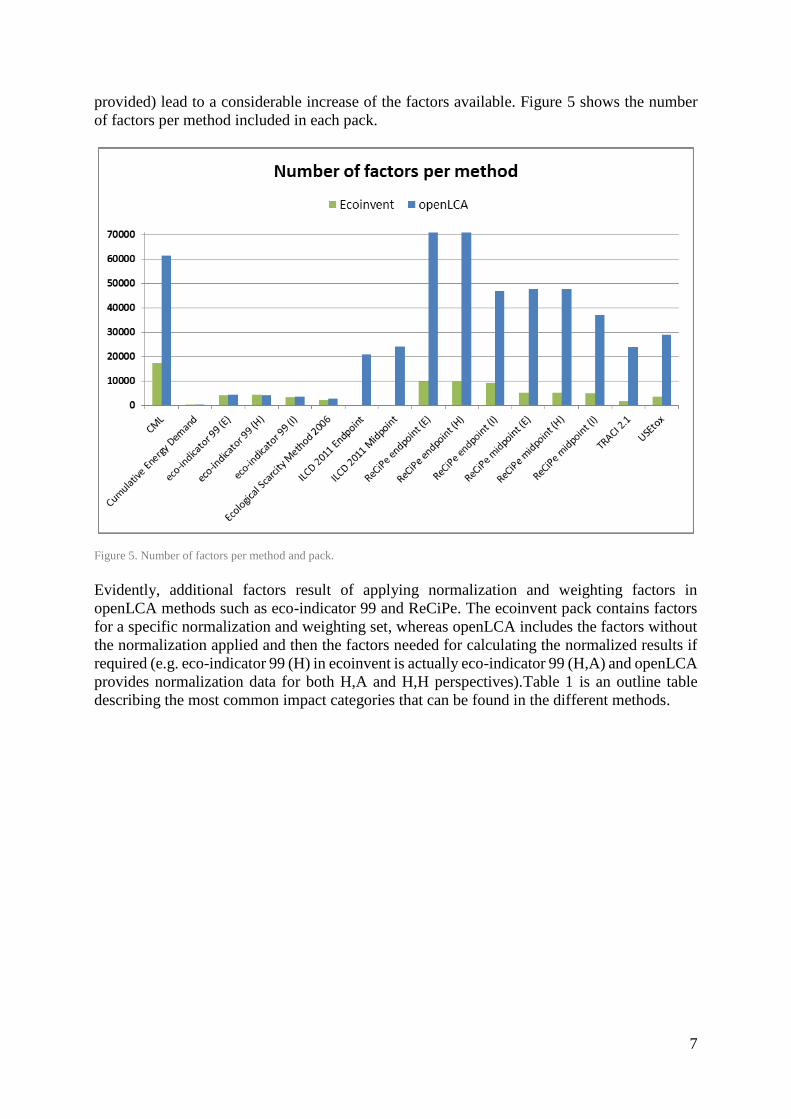
provided) lead to a considerable increase of the factors available. Figure 5 shows the number
of factors per method included in each pack.
Figure 5. Number of factors per method and pack.
Evidently, additional factors result of applying normalization and weighting factors in
openLCA methods such as eco-indicator 99 and ReCiPe. The ecoinvent pack contains factors
for a specific normalization and weighting set, whereas openLCA includes the factors without
the normalization applied and then the factors needed for calculating the normalized results if
required (e.g. eco-indicator 99 (H) in ecoinvent is actually eco-indicator 99 (H,A) and openLCA
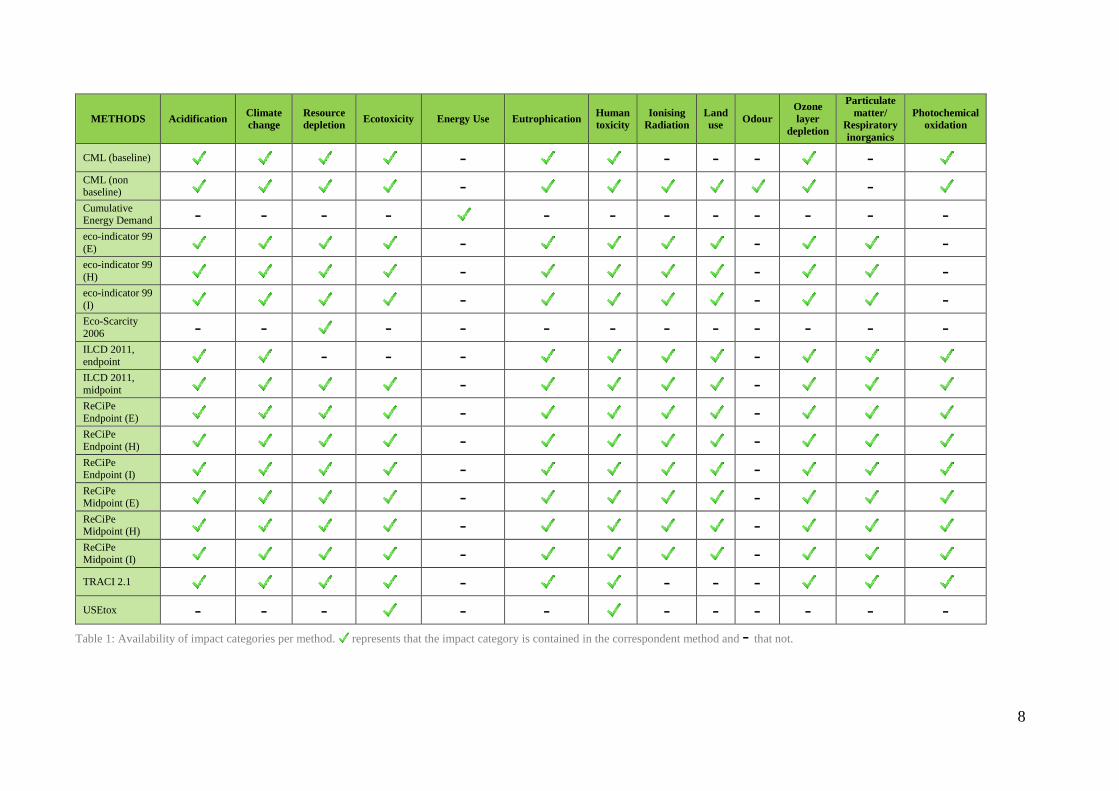
provides normalization data for both H,A and H,H perspectives).Table 1 is an outline table
describing the most common impact categories that can be found in the different methods.
8
METHODS Acidification Climate
change
Resource
depletion Ecotoxicity Energy Use Eutrophication
Human
toxicity
Ionising
Radiation
Land
use Odour
Ozone
layer
depletion
Particulate
matter/
Respiratory
inorganics
Photochemical
oxidation
CML (baseline) - - - - -
CML (non baseline) - -
Cumulative Energy Demand - - - - - - - - - - - -
eco-indicator 99
(E) - - -
eco-indicator 99
(H) - - -
eco-indicator 99
(I) - - -
Eco-Scarcity
2006 - - - - - - - - - - - -
ILCD 2011,
endpoint - - - -
ILCD 2011,
midpoint - -
ReCiPe
Endpoint (E) - -
ReCiPe
Endpoint (H) - -
ReCiPe Endpoint (I) - -
ReCiPe Midpoint (E) - -
ReCiPe Midpoint (H) - -
ReCiPe Midpoint (I) - -
TRACI 2.1 - - - -
USEtox - - - - - - - - - - -
Table 1: Availability of impact categories per method. represents that the impact category is contained in the correspondent method and - that not.
9
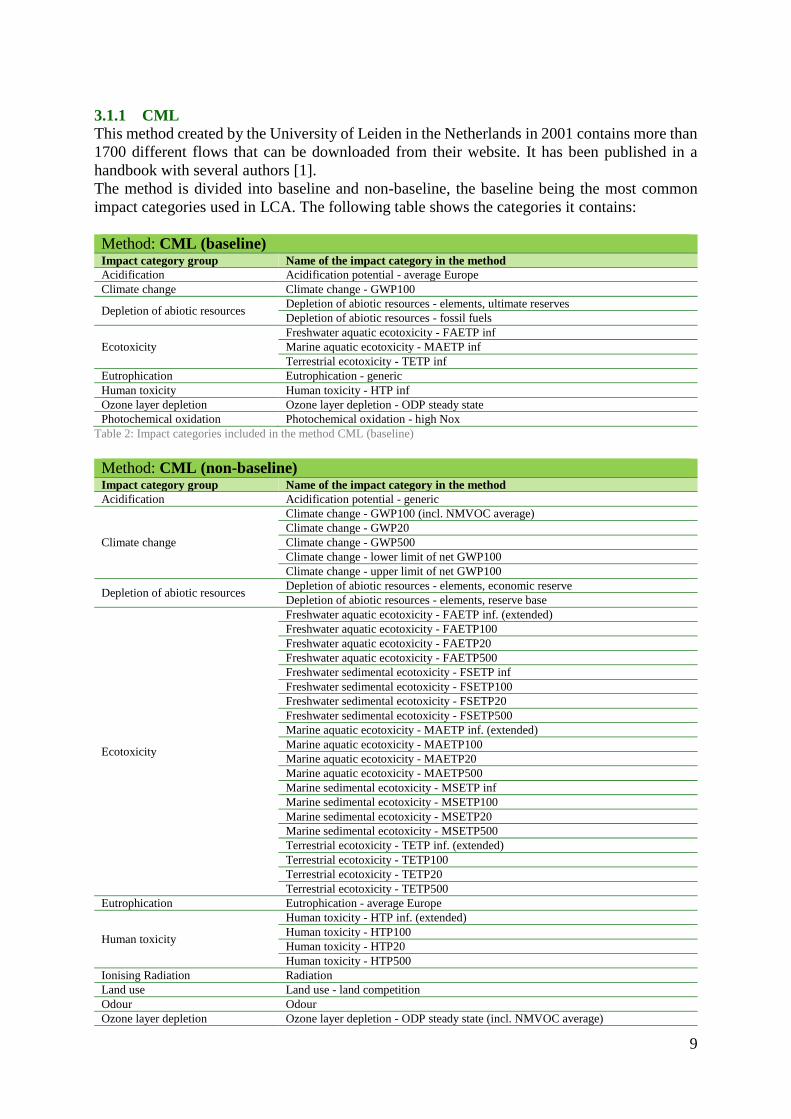
3.1.1 CML
This method created by the University of Leiden in the Netherlands in 2001 contains more than
1700 different flows that can be downloaded from their website. It has been published in a
handbook with several authors [1].
The method is divided into baseline and non-baseline, the baseline being the most common
impact categories used in LCA. The following table shows the categories it contains:
Method: CML (baseline) Impact category group Name of the impact category in the method
Acidification Acidification potential - average Europe
Climate change Climate change - GWP100
Depletion of abiotic resources Depletion of abiotic resources - elements, ultimate reserves
Depletion of abiotic resources - fossil fuels
Ecotoxicity
Freshwater aquatic ecotoxicity - FAETP inf
Marine aquatic ecotoxicity - MAETP inf
Terrestrial ecotoxicity - TETP inf
Eutrophication Eutrophication - generic
Human toxicity Human toxicity - HTP inf
Ozone layer depletion Ozone layer depletion - ODP steady state
Photochemical oxidation Photochemical oxidation - high Nox
Table 2: Impact categories included in the method CML (baseline)
Method: CML (non-baseline) Impact category group Name of the impact category in the method
Acidification Acidification potential - generic
Climate change
Climate change - GWP100 (incl. NMVOC average)
Climate change - GWP20
Climate change - GWP500
Climate change - lower limit of net GWP100
Climate change - upper limit of net GWP100
Depletion of abiotic resources Depletion of abiotic resources - elements, economic reserve
Depletion of abiotic resources - elements, reserve base
Ecotoxicity
Freshwater aquatic ecotoxicity - FAETP inf. (extended)
Freshwater aquatic ecotoxicity - FAETP100
Freshwater aquatic ecotoxicity - FAETP20
Freshwater aquatic ecotoxicity - FAETP500
Freshwater sedimental ecotoxicity - FSETP inf
Freshwater sedimental ecotoxicity - FSETP100
Freshwater sedimental ecotoxicity - FSETP20
Freshwater sedimental ecotoxicity - FSETP500
Marine aquatic ecotoxicity - MAETP inf. (extended)
Marine aquatic ecotoxicity - MAETP100
Marine aquatic ecotoxicity - MAETP20
Marine aquatic ecotoxicity - MAETP500
Marine sedimental ecotoxicity - MSETP inf
Marine sedimental ecotoxicity - MSETP100
Marine sedimental ecotoxicity - MSETP20
Marine sedimental ecotoxicity - MSETP500
Terrestrial ecotoxicity - TETP inf. (extended)
Terrestrial ecotoxicity - TETP100
Terrestrial ecotoxicity - TETP20
Terrestrial ecotoxicity - TETP500
Eutrophication Eutrophication - average Europe
Human toxicity
Human toxicity - HTP inf. (extended)
Human toxicity - HTP100
Human toxicity - HTP20
Human toxicity - HTP500
Ionising Radiation Radiation
Land use Land use - land competition
Odour Odour
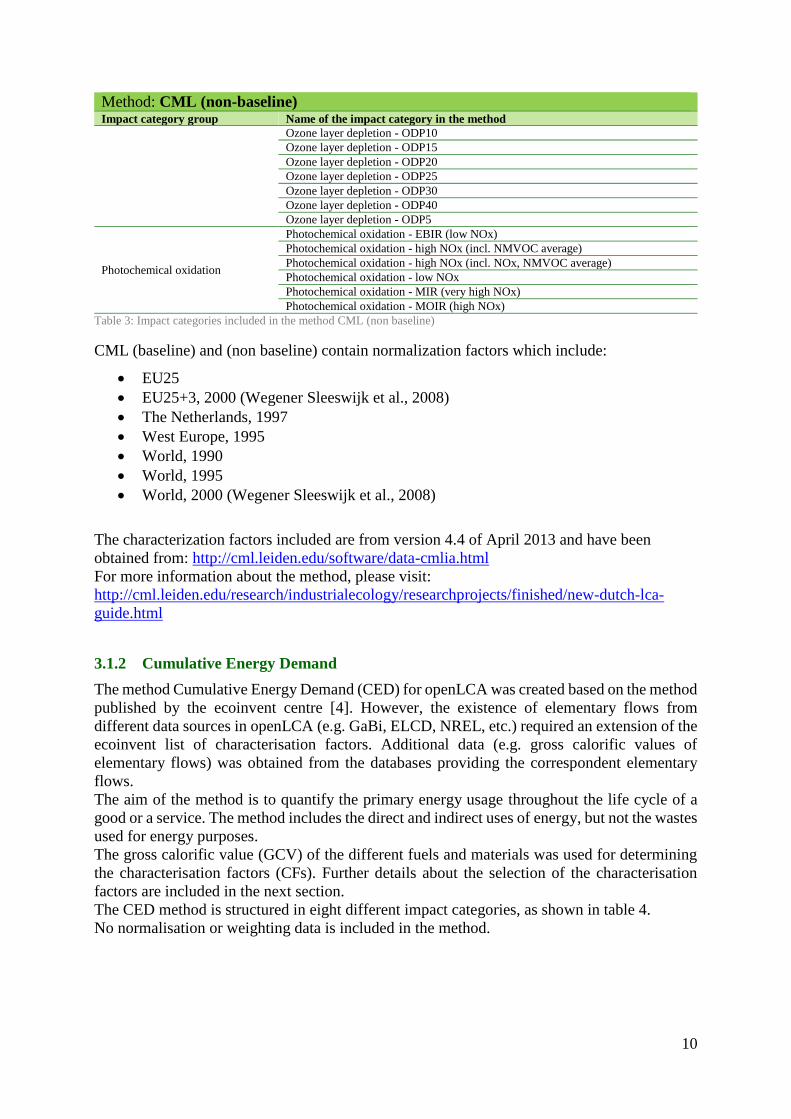
Ozone layer depletion Ozone layer depletion - ODP steady state (incl. NMVOC average)
10
Method: CML (non-baseline) Impact category group Name of the impact category in the method
Ozone layer depletion - ODP10
Ozone layer depletion - ODP15
Ozone layer depletion - ODP20
Ozone layer depletion - ODP25
Ozone layer depletion - ODP30
Ozone layer depletion - ODP40
Ozone layer depletion - ODP5
Photochemical oxidation
Photochemical oxidation - EBIR (low NOx)
Photochemical oxidation - high NOx (incl. NMVOC average)
Photochemical oxidation - high NOx (incl. NOx, NMVOC average)
Photochemical oxidation - low NOx
Photochemical oxidation - MIR (very high NOx)
Photochemical oxidation - MOIR (high NOx)
Table 3: Impact categories included in the method CML (non baseline)
CML (baseline) and (non baseline) contain normalization factors which include:
EU25
EU25+3, 2000 (Wegener Sleeswijk et al., 2008)
The Netherlands, 1997
West Europe, 1995
World, 1990
World, 1995
World, 2000 (Wegener Sleeswijk et al., 2008)
The characterization factors included are from version 4.4 of April 2013 and have been
obtained from: http://cml.leiden.edu/software/data-cmlia.html
For more information about the method, please visit:
http://cml.leiden.edu/research/industrialecology/researchprojects/finished/new-dutch-lca-
guide.html
3.1.2 Cumulative Energy Demand
The method Cumulative Energy Demand (CED) for openLCA was created based on the method
published by the ecoinvent centre [4]. However, the existence of elementary flows from
different data sources in openLCA (e.g. GaBi, ELCD, NREL, etc.) required an extension of the
ecoinvent list of characterisation factors. Additional data (e.g. gross calorific values of
elementary flows) was obtained from the databases providing the correspondent elementary
flows.
The aim of the method is to quantify the primary energy usage throughout the life cycle of a
good or a service. The method includes the direct and indirect uses of energy, but not the wastes
used for energy purposes.
The gross calorific value (GCV) of the different fuels and materials was used for determining
the characterisation factors (CFs). Further details about the selection of the characterisation
factors are included in the next section.
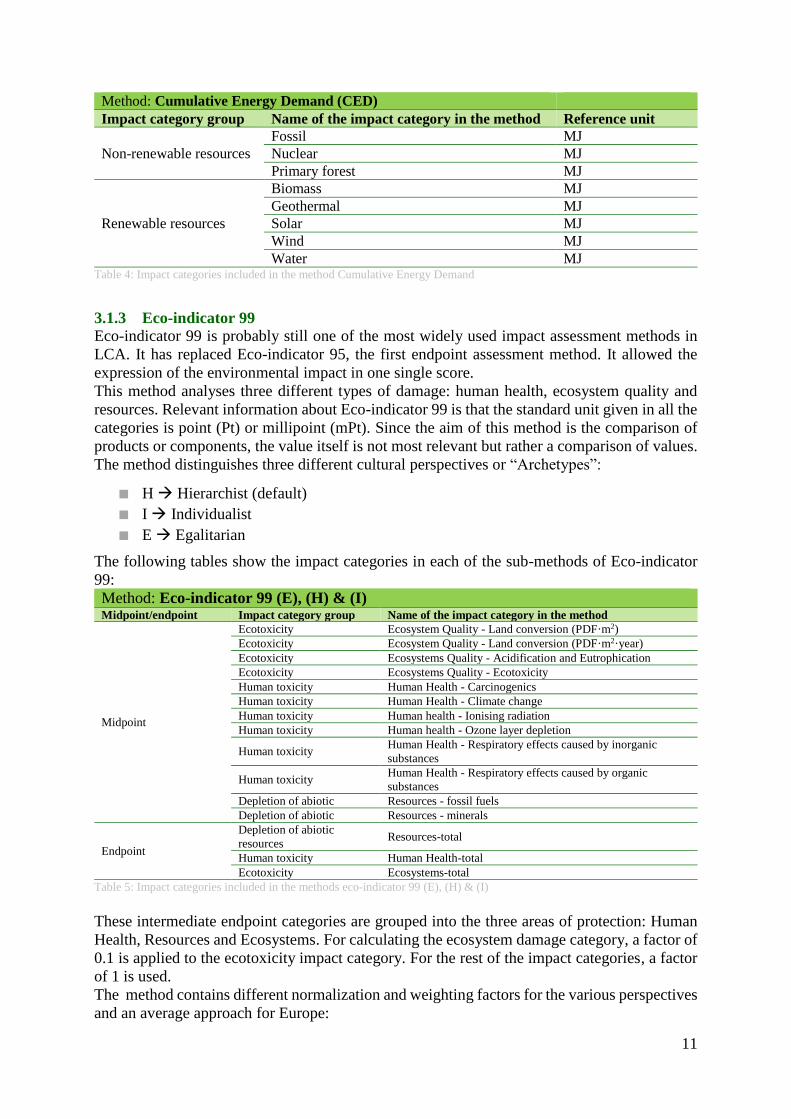
The CED method is structured in eight different impact categories, as shown in table 4.
No normalisation or weighting data is included in the method.
11
Method: Cumulative Energy Demand (CED)
Impact category group Name of the impact category in the method Reference unit
Non-renewable resources
Fossil MJ
Nuclear MJ
Primary forest MJ
Renewable resources
Biomass MJ
Geothermal MJ
Solar MJ
Wind MJ
Water MJ Table 4: Impact categories included in the method Cumulative Energy Demand
3.1.3 Eco-indicator 99
Eco-indicator 99 is probably still one of the most widely used impact assessment methods in
LCA. It has replaced Eco-indicator 95, the first endpoint assessment method. It allowed the
expression of the environmental impact in one single score.
This method analyses three different types of damage: human health, ecosystem quality and
resources. Relevant information about Eco-indicator 99 is that the standard unit given in all the
categories is point (Pt) or millipoint (mPt). Since the aim of this method is the comparison of
products or components, the value itself is not most relevant but rather a comparison of values.
The method distinguishes three different cultural perspectives or “Archetypes”:
■ H Hierarchist (default)
■ I Individualist
■ E Egalitarian
The following tables show the impact categories in each of the sub-methods of Eco-indicator
99:
Method: Eco-indicator 99 (E), (H) & (I) Midpoint/endpoint Impact category group Name of the impact category in the method
Midpoint
Ecotoxicity Ecosystem Quality - Land conversion (PDF·m2)
Ecotoxicity Ecosystem Quality - Land conversion (PDF·m2·year)
Ecotoxicity Ecosystems Quality - Acidification and Eutrophication
Ecotoxicity Ecosystems Quality - Ecotoxicity
Human toxicity Human Health - Carcinogenics
Human toxicity Human Health - Climate change
Human toxicity Human health - Ionising radiation
Human toxicity Human health - Ozone layer depletion
Human toxicity Human Health - Respiratory effects caused by inorganic
substances
Human toxicity Human Health - Respiratory effects caused by organic
substances
Depletion of abiotic Resources - fossil fuels
Depletion of abiotic Resources - minerals
Endpoint
Depletion of abiotic
resources Resources-total
Human toxicity Human Health-total
Ecotoxicity Ecosystems-total
Table 5: Impact categories included in the methods eco-indicator 99 (E), (H) & (I)
These intermediate endpoint categories are grouped into the three areas of protection: Human
Health, Resources and Ecosystems. For calculating the ecosystem damage category, a factor of
0.1 is applied to the ecotoxicity impact category. For the rest of the impact categories, a factor
of 1 is used.
The method contains different normalization and weighting factors for the various perspectives
and an average approach for Europe:
12
Europe EI 99 E/A
Europe EI 99 E/E
Europe EI 99 H/A
Europe EI 99 H/H
Europe EI 99 I/A
Europe EI 99 I/I
The characterization factors for Eco-indicator 99 are also included in the CML 2001
documentation (see section 2.1).
For more information about the method, please see [2].
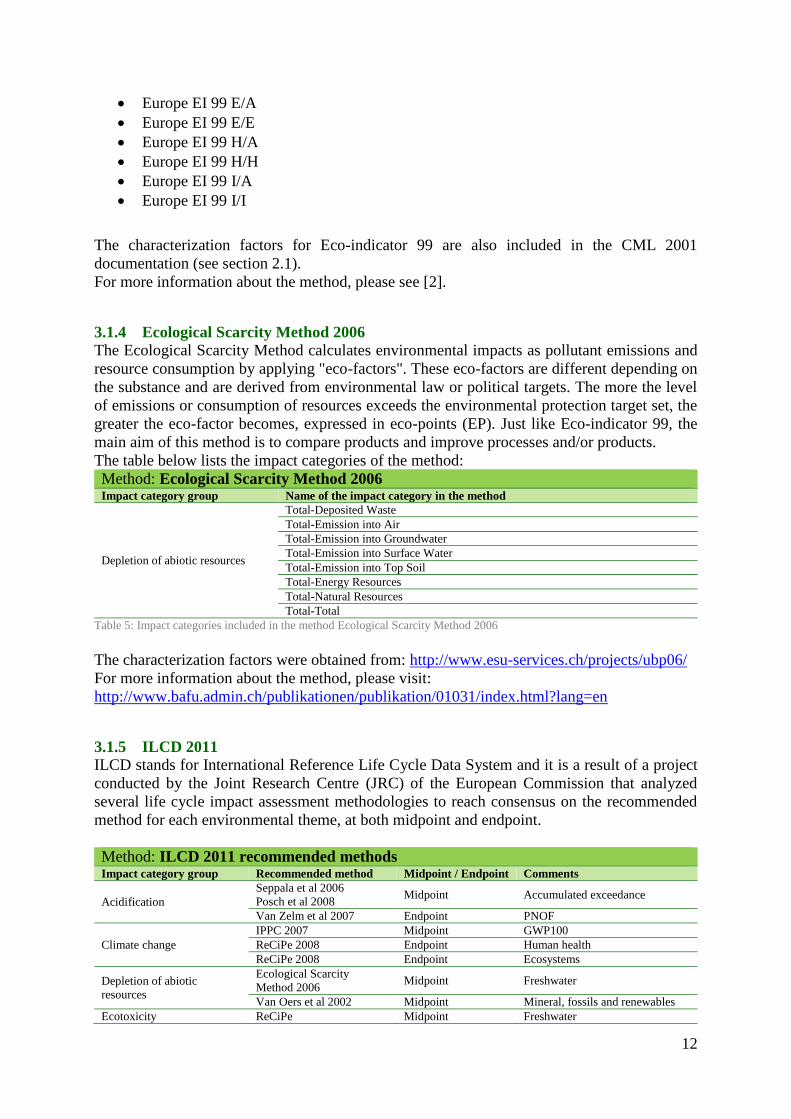
3.1.4 Ecological Scarcity Method 2006
The Ecological Scarcity Method calculates environmental impacts as pollutant emissions and
resource consumption by applying "eco-factors". These eco-factors are different depending on
the substance and are derived from environmental law or political targets. The more the level
of emissions or consumption of resources exceeds the environmental protection target set, the
greater the eco-factor becomes, expressed in eco-points (EP). Just like Eco-indicator 99, the
main aim of this method is to compare products and improve processes and/or products.
The table below lists the impact categories of the method:
Method: Ecological Scarcity Method 2006 Impact category group Name of the impact category in the method
Depletion of abiotic resources
Total-Deposited Waste
Total-Emission into Air
Total-Emission into Groundwater
Total-Emission into Surface Water
Total-Emission into Top Soil
Total-Energy Resources
Total-Natural Resources
Total-Total
Table 5: Impact categories included in the method Ecological Scarcity Method 2006
The characterization factors were obtained from: http://www.esu-services.ch/projects/ubp06/
For more information about the method, please visit:
http://www.bafu.admin.ch/publikationen/publikation/01031/index.html?lang=en
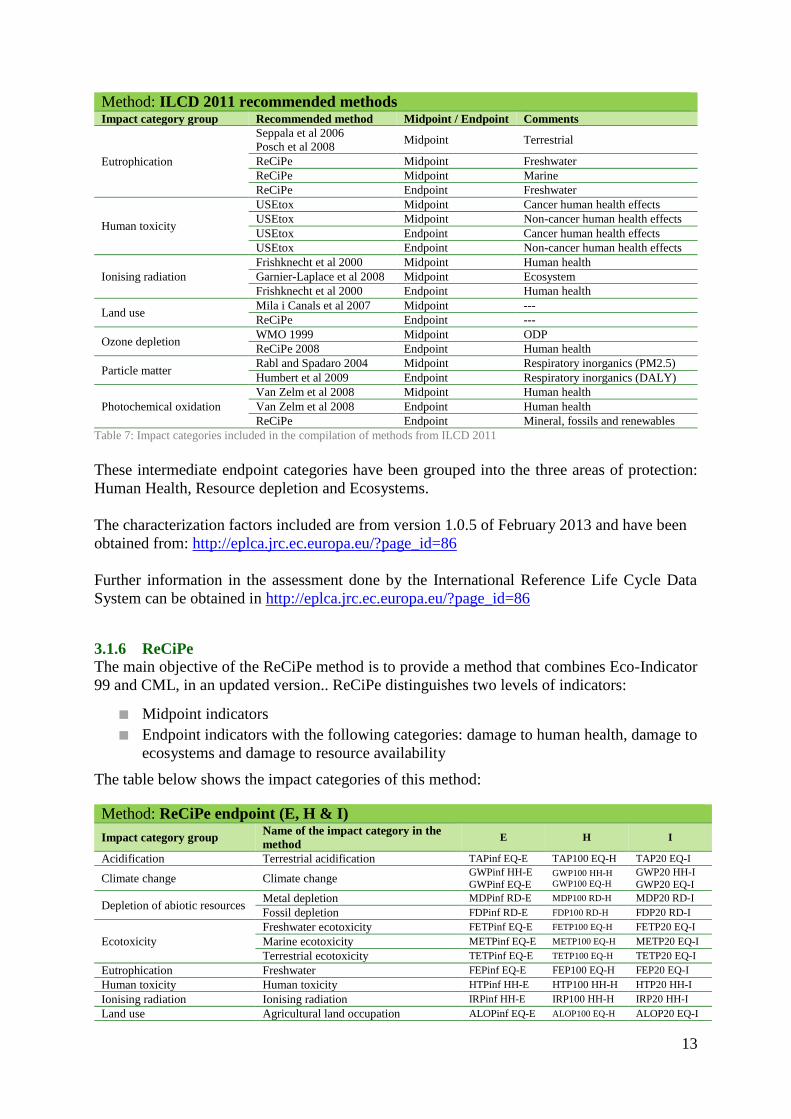
3.1.5 ILCD 2011
ILCD stands for International Reference Life Cycle Data System and it is a result of a project
conducted by the Joint Research Centre (JRC) of the European Commission that analyzed
several life cycle impact assessment methodologies to reach consensus on the recommended
method for each environmental theme, at both midpoint and endpoint.
Method: ILCD 2011 recommended methods Impact category group Recommended method Midpoint / Endpoint Comments
Acidification
Seppala et al 2006
Posch et al 2008 Midpoint Accumulated exceedance
Van Zelm et al 2007 Endpoint PNOF
Climate change
IPPC 2007 Midpoint GWP100
ReCiPe 2008 Endpoint Human health
ReCiPe 2008 Endpoint Ecosystems
Depletion of abiotic
resources
Ecological Scarcity
Method 2006 Midpoint Freshwater
Van Oers et al 2002 Midpoint Mineral, fossils and renewables
Ecotoxicity ReCiPe Midpoint Freshwater
13
Method: ILCD 2011 recommended methods Impact category group Recommended method Midpoint / Endpoint Comments
Eutrophication
Seppala et al 2006
Posch et al 2008 Midpoint Terrestrial
ReCiPe Midpoint Freshwater
ReCiPe Midpoint Marine
ReCiPe Endpoint Freshwater
Human toxicity
USEtox Midpoint Cancer human health effects
USEtox Midpoint Non-cancer human health effects
USEtox Endpoint Cancer human health effects
USEtox Endpoint Non-cancer human health effects
Ionising radiation
Frishknecht et al 2000 Midpoint Human health
Garnier-Laplace et al 2008 Midpoint Ecosystem
Frishknecht et al 2000 Endpoint Human health
Land use Mila i Canals et al 2007 Midpoint ---
ReCiPe Endpoint ---
Ozone depletion WMO 1999 Midpoint ODP
ReCiPe 2008 Endpoint Human health
Particle matter Rabl and Spadaro 2004 Midpoint Respiratory inorganics (PM2.5)
Humbert et al 2009 Endpoint Respiratory inorganics (DALY)
Photochemical oxidation
Van Zelm et al 2008 Midpoint Human health
Van Zelm et al 2008 Endpoint Human health
ReCiPe Endpoint Mineral, fossils and renewables
Table 7: Impact categories included in the compilation of methods from ILCD 2011
These intermediate endpoint categories have been grouped into the three areas of protection:
Human Health, Resource depletion and Ecosystems.
The characterization factors included are from version 1.0.5 of February 2013 and have been
obtained from: http://eplca.jrc.ec.europa.eu/?page_id=86
Further information in the assessment done by the International Reference Life Cycle Data
System can be obtained in http://eplca.jrc.ec.europa.eu/?page_id=86
3.1.6 ReCiPe
The main objective of the ReCiPe method is to provide a method that combines Eco-Indicator
99 and CML, in an updated version.. ReCiPe distinguishes two levels of indicators:
■ Midpoint indicators
■ Endpoint indicators with the following categories: damage to human health, damage to
ecosystems and damage to resource availability
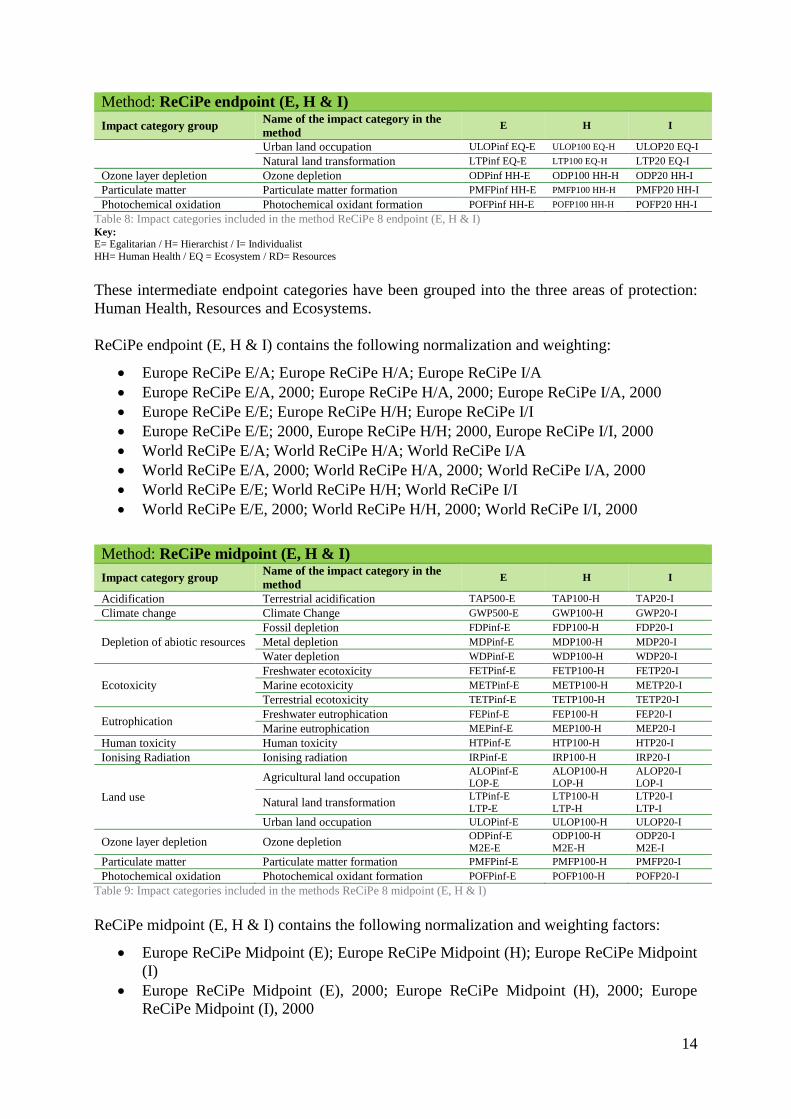
The table below shows the impact categories of this method:
Method: ReCiPe endpoint (E, H & I)
Impact category group Name of the impact category in the
method E H I
Acidification Terrestrial acidification TAPinf EQ-E TAP100 EQ-H TAP20 EQ-I
Climate change Climate change GWPinf HH-E
GWPinf EQ-E GWP100 HH-H
GWP100 EQ-H GWP20 HH-I
GWP20 EQ-I
Depletion of abiotic resources Metal depletion MDPinf RD-E MDP100 RD-H MDP20 RD-I
Fossil depletion FDPinf RD-E FDP100 RD-H FDP20 RD-I
Ecotoxicity
Freshwater ecotoxicity FETPinf EQ-E FETP100 EQ-H FETP20 EQ-I
Marine ecotoxicity METPinf EQ-E METP100 EQ-H METP20 EQ-I
Terrestrial ecotoxicity TETPinf EQ-E TETP100 EQ-H TETP20 EQ-I
Eutrophication Freshwater FEPinf EQ-E FEP100 EQ-H FEP20 EQ-I
Human toxicity Human toxicity HTPinf HH-E HTP100 HH-H HTP20 HH-I
Ionising radiation Ionising radiation IRPinf HH-E IRP100 HH-H IRP20 HH-I
Land use Agricultural land occupation ALOPinf EQ-E ALOP100 EQ-H ALOP20 EQ-I
14
Method: ReCiPe endpoint (E, H & I)
Impact category group Name of the impact category in the
method E H I
Urban land occupation ULOPinf EQ-E ULOP100 EQ-H ULOP20 EQ-I
Natural land transformation LTPinf EQ-E LTP100 EQ-H LTP20 EQ-I
Ozone layer depletion Ozone depletion ODPinf HH-E ODP100 HH-H ODP20 HH-I
Particulate matter Particulate matter formation PMFPinf HH-E PMFP100 HH-H PMFP20 HH-I
Photochemical oxidation Photochemical oxidant formation POFPinf HH-E POFP100 HH-H POFP20 HH-I
Table 8: Impact categories included in the method ReCiPe 8 endpoint (E, H & I) Key:
E= Egalitarian / H= Hierarchist / I= Individualist
HH= Human Health / EQ = Ecosystem / RD= Resources
These intermediate endpoint categories have been grouped into the three areas of protection:
Human Health, Resources and Ecosystems.
ReCiPe endpoint (E, H & I) contains the following normalization and weighting:
Europe ReCiPe E/A; Europe ReCiPe H/A; Europe ReCiPe I/A
Europe ReCiPe E/A, 2000; Europe ReCiPe H/A, 2000; Europe ReCiPe I/A, 2000
Europe ReCiPe E/E; Europe ReCiPe H/H; Europe ReCiPe I/I
Europe ReCiPe E/E; 2000, Europe ReCiPe H/H; 2000, Europe ReCiPe I/I, 2000
World ReCiPe E/A; World ReCiPe H/A; World ReCiPe I/A
World ReCiPe E/A, 2000; World ReCiPe H/A, 2000; World ReCiPe I/A, 2000
World ReCiPe E/E; World ReCiPe H/H; World ReCiPe I/I
World ReCiPe E/E, 2000; World ReCiPe H/H, 2000; World ReCiPe I/I, 2000
Method: ReCiPe midpoint (E, H & I)
Impact category group Name of the impact category in the
method E H I
Acidification Terrestrial acidification TAP500-E TAP100-H TAP20-I
Climate change Climate Change GWP500-E GWP100-H GWP20-I
Depletion of abiotic resources
Fossil depletion FDPinf-E FDP100-H FDP20-I
Metal depletion MDPinf-E MDP100-H MDP20-I
Water depletion WDPinf-E WDP100-H WDP20-I
Ecotoxicity
Freshwater ecotoxicity FETPinf-E FETP100-H FETP20-I
Marine ecotoxicity METPinf-E METP100-H METP20-I
Terrestrial ecotoxicity TETPinf-E TETP100-H TETP20-I
Eutrophication Freshwater eutrophication FEPinf-E FEP100-H FEP20-I
Marine eutrophication MEPinf-E MEP100-H MEP20-I
Human toxicity Human toxicity HTPinf-E HTP100-H HTP20-I
Ionising Radiation Ionising radiation IRPinf-E IRP100-H IRP20-I
Land use
Agricultural land occupation ALOPinf-E LOP-E
ALOP100-H LOP-H
ALOP20-I LOP-I
Natural land transformation LTPinf-E
LTP-E
LTP100-H
LTP-H
LTP20-I
LTP-I
Urban land occupation ULOPinf-E ULOP100-H ULOP20-I
Ozone layer depletion Ozone depletion ODPinf-E
M2E-E
ODP100-H
M2E-H
ODP20-I
M2E-I
Particulate matter Particulate matter formation PMFPinf-E PMFP100-H PMFP20-I
Photochemical oxidation Photochemical oxidant formation POFPinf-E POFP100-H POFP20-I
Table 9: Impact categories included in the methods ReCiPe 8 midpoint (E, H & I)
ReCiPe midpoint (E, H & I) contains the following normalization and weighting factors:
Europe ReCiPe Midpoint (E); Europe ReCiPe Midpoint (H); Europe ReCiPe Midpoint
(I)
Europe ReCiPe Midpoint (E), 2000; Europe ReCiPe Midpoint (H), 2000; Europe
ReCiPe Midpoint (I), 2000
15
World ReCiPe Midpoint (E); World ReCiPe Midpoint (H); World ReCiPe Midpoint (I)
World ReCiPe Midpoint (E), 2000; World ReCiPe Midpoint (H), 2000; World ReCiPe
Midpoint (I), 2000
The characterization factors included in the method pack are from version 1.11 of Agustu 2014
and have been obtained from: https://sites.google.com/site/lciarecipe/file-cabinet. The new
normalization/weighting factors were taken from the SimaPro 8.0.3 implementation as
indicated by the method developers.
For further information about the method please visit: https://sites.google.com/site/lciarecipe/
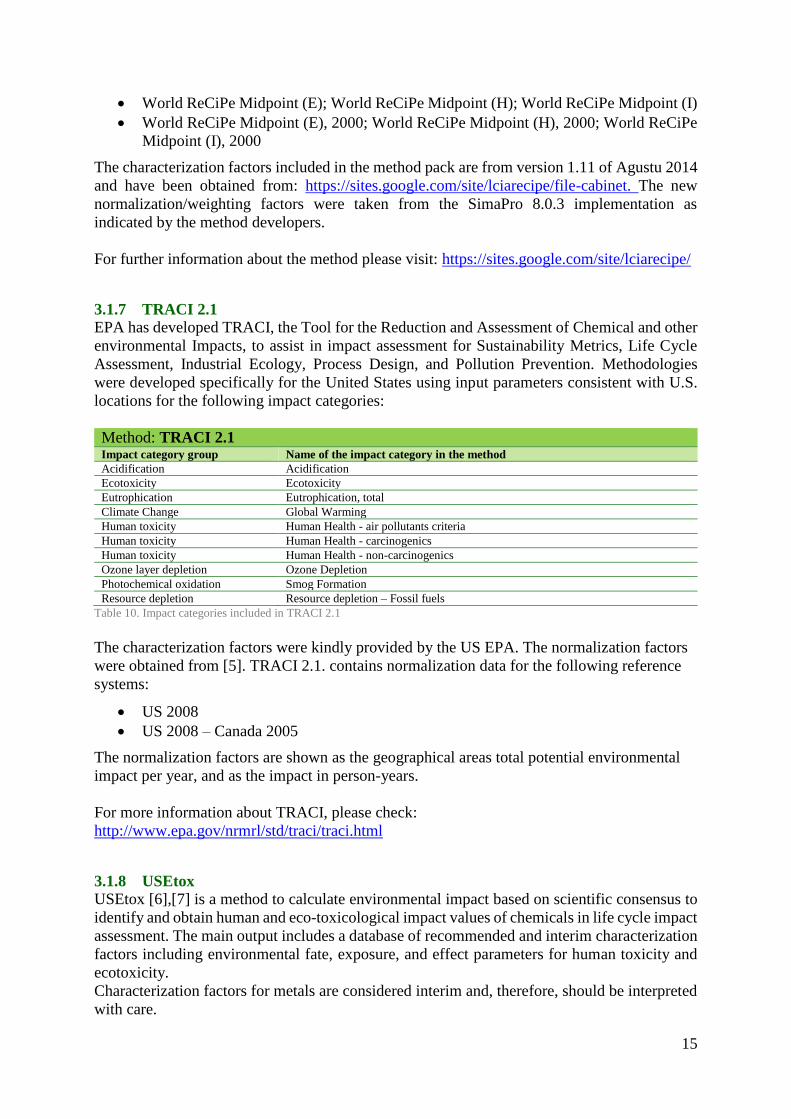
3.1.7 TRACI 2.1
EPA has developed TRACI, the Tool for the Reduction and Assessment of Chemical and other
environmental Impacts, to assist in impact assessment for Sustainability Metrics, Life Cycle
Assessment, Industrial Ecology, Process Design, and Pollution Prevention. Methodologies
were developed specifically for the United States using input parameters consistent with U.S.
locations for the following impact categories:
Method: TRACI 2.1 Impact category group Name of the impact category in the method
Acidification Acidification
Ecotoxicity Ecotoxicity
Eutrophication Eutrophication, total
Climate Change Global Warming
Human toxicity Human Health - air pollutants criteria
Human toxicity Human Health - carcinogenics
Human toxicity Human Health - non-carcinogenics
Ozone layer depletion Ozone Depletion
Photochemical oxidation Smog Formation
Resource depletion Resource depletion – Fossil fuels
Table 10. Impact categories included in TRACI 2.1
The characterization factors were kindly provided by the US EPA. The normalization factors
were obtained from [5]. TRACI 2.1. contains normalization data for the following reference
systems:
US 2008
US 2008 – Canada 2005
The normalization factors are shown as the geographical areas total potential environmental
impact per year, and as the impact in person-years.
For more information about TRACI, please check:
http://www.epa.gov/nrmrl/std/traci/traci.html
3.1.8 USEtox
USEtox [6],[7] is a method to calculate environmental impact based on scientific consensus to
identify and obtain human and eco-toxicological impact values of chemicals in life cycle impact
assessment. The main output includes a database of recommended and interim characterization
factors including environmental fate, exposure, and effect parameters for human toxicity and
ecotoxicity.
Characterization factors for metals are considered interim and, therefore, should be interpreted
with care.
16
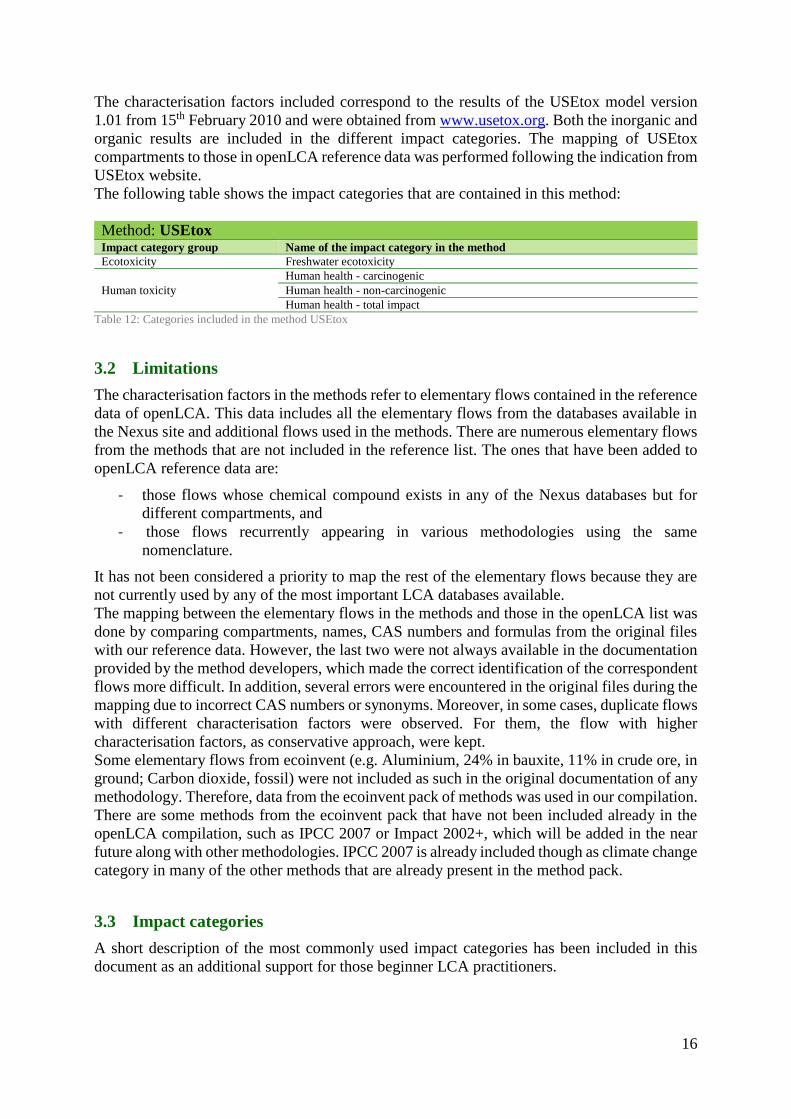
The characterisation factors included correspond to the results of the USEtox model version
1.01 from 15th February 2010 and were obtained from www.usetox.org. Both the inorganic and
organic results are included in the different impact categories. The mapping of USEtox
compartments to those in openLCA reference data was performed following the indication from
USEtox website.
The following table shows the impact categories that are contained in this method:
Method: USEtox Impact category group Name of the impact category in the method
Ecotoxicity Freshwater ecotoxicity
Human toxicity
Human health - carcinogenic
Human health - non-carcinogenic
Human health - total impact
Table 12: Categories included in the method USEtox
3.2 Limitations
The characterisation factors in the methods refer to elementary flows contained in the reference
data of openLCA. This data includes all the elementary flows from the databases available in
the Nexus site and additional flows used in the methods. There are numerous elementary flows
from the methods that are not included in the reference list. The ones that have been added to
openLCA reference data are:
- those flows whose chemical compound exists in any of the Nexus databases but for
different compartments, and
- those flows recurrently appearing in various methodologies using the same
nomenclature.
It has not been considered a priority to map the rest of the elementary flows because they are
not currently used by any of the most important LCA databases available.
The mapping between the elementary flows in the methods and those in the openLCA list was
done by comparing compartments, names, CAS numbers and formulas from the original files
with our reference data. However, the last two were not always available in the documentation
provided by the method developers, which made the correct identification of the correspondent
flows more difficult. In addition, several errors were encountered in the original files during the
mapping due to incorrect CAS numbers or synonyms. Moreover, in some cases, duplicate flows
with different characterisation factors were observed. For them, the flow with higher
characterisation factors, as conservative approach, were kept.
Some elementary flows from ecoinvent (e.g. Aluminium, 24% in bauxite, 11% in crude ore, in
ground; Carbon dioxide, fossil) were not included as such in the original documentation of any
methodology. Therefore, data from the ecoinvent pack of methods was used in our compilation.
There are some methods from the ecoinvent pack that have not been included already in the
openLCA compilation, such as IPCC 2007 or Impact 2002+, which will be added in the near
future along with other methodologies. IPCC 2007 is already included though as climate change
category in many of the other methods that are already present in the method pack.
3.3 Impact categories
A short description of the most commonly used impact categories has been included in this
document as an additional support for those beginner LCA practitioners.
17
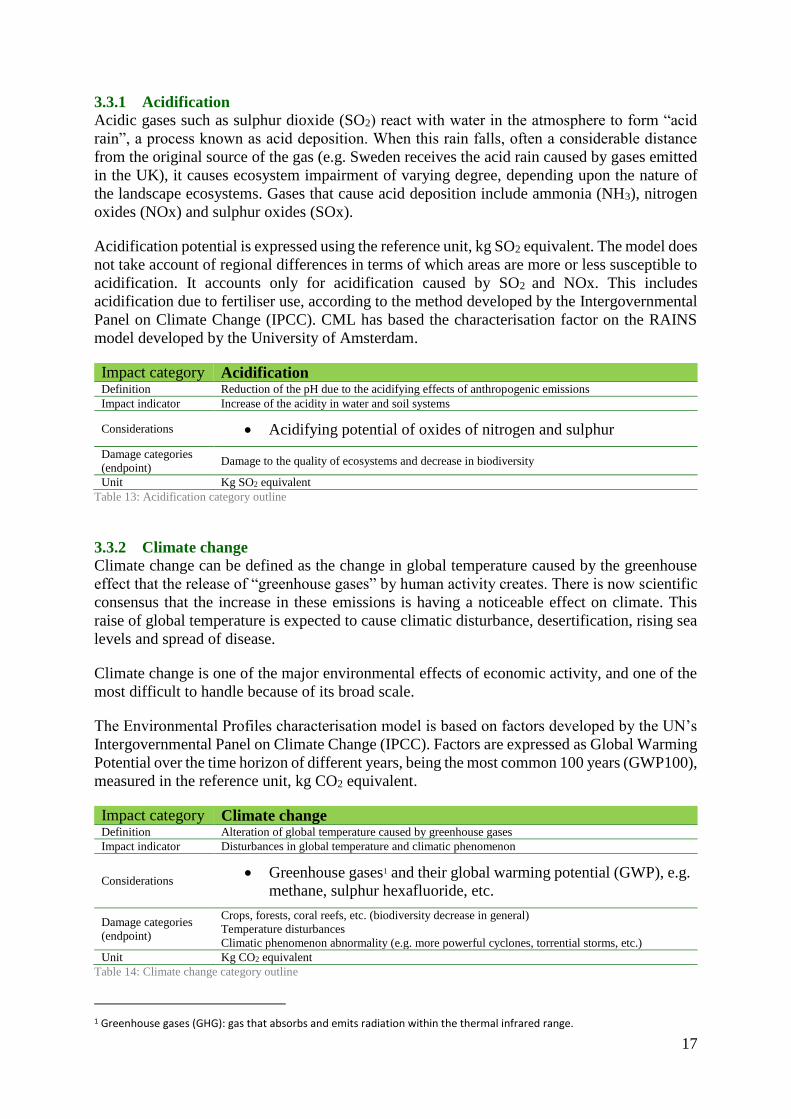
3.3.1 Acidification
Acidic gases such as sulphur dioxide (SO2) react with water in the atmosphere to form “acid
rain”, a process known as acid deposition. When this rain falls, often a considerable distance
from the original source of the gas (e.g. Sweden receives the acid rain caused by gases emitted
in the UK), it causes ecosystem impairment of varying degree, depending upon the nature of
the landscape ecosystems. Gases that cause acid deposition include ammonia (NH3), nitrogen
oxides (NOx) and sulphur oxides (SOx).
Acidification potential is expressed using the reference unit, kg SO2 equivalent. The model does
not take account of regional differences in terms of which areas are more or less susceptible to
acidification. It accounts only for acidification caused by SO2 and NOx. This includes
acidification due to fertiliser use, according to the method developed by the Intergovernmental
Panel on Climate Change (IPCC). CML has based the characterisation factor on the RAINS
model developed by the University of Amsterdam.
Impact category Acidification Definition Reduction of the pH due to the acidifying effects of anthropogenic emissions
Impact indicator Increase of the acidity in water and soil systems
Considerations Acidifying potential of oxides of nitrogen and sulphur
Damage categories
(endpoint) Damage to the quality of ecosystems and decrease in biodiversity
Unit Kg SO2 equivalent
Table 13: Acidification category outline
3.3.2 Climate change
Climate change can be defined as the change in global temperature caused by the greenhouse
effect that the release of “greenhouse gases” by human activity creates. There is now scientific
consensus that the increase in these emissions is having a noticeable effect on climate. This
raise of global temperature is expected to cause climatic disturbance, desertification, rising sea
levels and spread of disease.
Climate change is one of the major environmental effects of economic activity, and one of the
most difficult to handle because of its broad scale.
The Environmental Profiles characterisation model is based on factors developed by the UN’s
Intergovernmental Panel on Climate Change (IPCC). Factors are expressed as Global Warming
Potential over the time horizon of different years, being the most common 100 years (GWP100),
measured in the reference unit, kg CO2 equivalent.
Impact category Climate change Definition Alteration of global temperature caused by greenhouse gases
Impact indicator Disturbances in global temperature and climatic phenomenon
Considerations Greenhouse gases1 and their global warming potential (GWP), e.g.
methane, sulphur hexafluoride, etc.
Damage categories
(endpoint)
Crops, forests, coral reefs, etc. (biodiversity decrease in general)
Temperature disturbances
Climatic phenomenon abnormality (e.g. more powerful cyclones, torrential storms, etc.)
Unit Kg CO2 equivalent
Table 14: Climate change category outline
1 Greenhouse gases (GHG): gas that absorbs and emits radiation within the thermal infrared range.
18
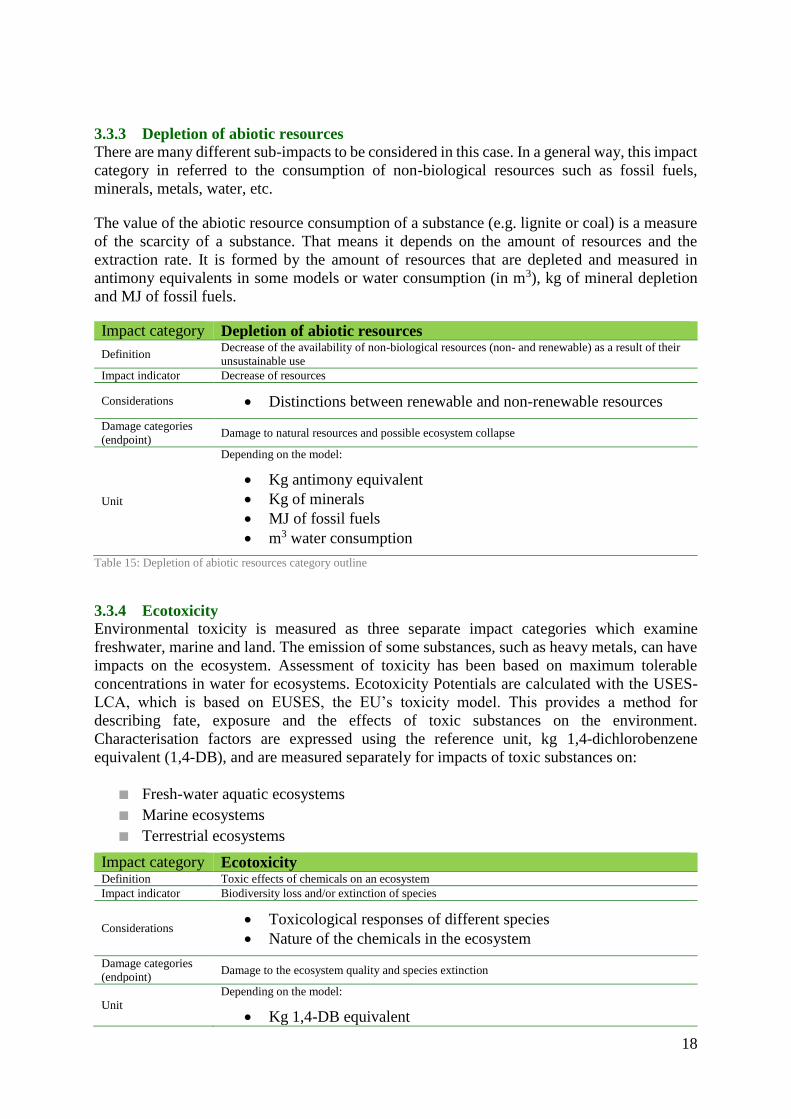
3.3.3 Depletion of abiotic resources
There are many different sub-impacts to be considered in this case. In a general way, this impact
category in referred to the consumption of non-biological resources such as fossil fuels,
minerals, metals, water, etc.
The value of the abiotic resource consumption of a substance (e.g. lignite or coal) is a measure
of the scarcity of a substance. That means it depends on the amount of resources and the
extraction rate. It is formed by the amount of resources that are depleted and measured in
antimony equivalents in some models or water consumption (in m3), kg of mineral depletion
and MJ of fossil fuels.
Impact category Depletion of abiotic resources
Definition Decrease of the availability of non-biological resources (non- and renewable) as a result of their
unsustainable use
Impact indicator Decrease of resources
Considerations Distinctions between renewable and non-renewable resources
Damage categories
(endpoint) Damage to natural resources and possible ecosystem collapse
Unit
Depending on the model:
Kg antimony equivalent
Kg of minerals
MJ of fossil fuels
m3 water consumption
Table 15: Depletion of abiotic resources category outline
3.3.4 Ecotoxicity
Environmental toxicity is measured as three separate impact categories which examine
freshwater, marine and land. The emission of some substances, such as heavy metals, can have
impacts on the ecosystem. Assessment of toxicity has been based on maximum tolerable
concentrations in water for ecosystems. Ecotoxicity Potentials are calculated with the USES-
LCA, which is based on EUSES, the EU’s toxicity model. This provides a method for
describing fate, exposure and the effects of toxic substances on the environment.
Characterisation factors are expressed using the reference unit, kg 1,4-dichlorobenzene
equivalent (1,4-DB), and are measured separately for impacts of toxic substances on:
■ Fresh-water aquatic ecosystems
■ Marine ecosystems
■ Terrestrial ecosystems
Impact category Ecotoxicity Definition Toxic effects of chemicals on an ecosystem
Impact indicator Biodiversity loss and/or extinction of species
Considerations Toxicological responses of different species
Nature of the chemicals in the ecosystem
Damage categories
(endpoint) Damage to the ecosystem quality and species extinction
Unit
Depending on the model:
Kg 1,4-DB equivalent
19
PDF (Potentially Disappeared Fraction of species)
PAF (Potentially Affected Fraction of species)
Table 16: Ecotoxicity category outline
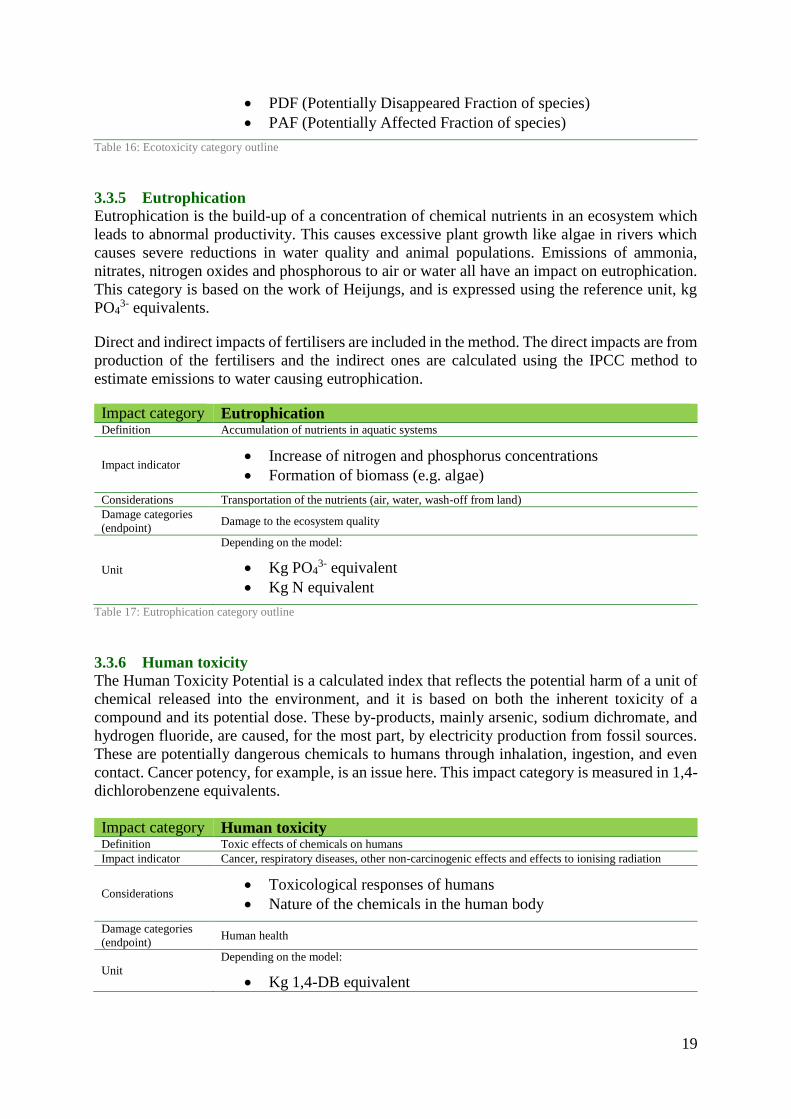
3.3.5 Eutrophication
Eutrophication is the build-up of a concentration of chemical nutrients in an ecosystem which
leads to abnormal productivity. This causes excessive plant growth like algae in rivers which
causes severe reductions in water quality and animal populations. Emissions of ammonia,
nitrates, nitrogen oxides and phosphorous to air or water all have an impact on eutrophication.
This category is based on the work of Heijungs, and is expressed using the reference unit, kg
PO43- equivalents.
Direct and indirect impacts of fertilisers are included in the method. The direct impacts are from
production of the fertilisers and the indirect ones are calculated using the IPCC method to
estimate emissions to water causing eutrophication.
Impact category Eutrophication Definition Accumulation of nutrients in aquatic systems
Impact indicator Increase of nitrogen and phosphorus concentrations
Formation of biomass (e.g. algae)
Considerations Transportation of the nutrients (air, water, wash-off from land)
Damage categories
(endpoint) Damage to the ecosystem quality
Unit
Depending on the model:
Kg PO43- equivalent
Kg N equivalent
Table 17: Eutrophication category outline
3.3.6 Human toxicity
The Human Toxicity Potential is a calculated index that reflects the potential harm of a unit of
chemical released into the environment, and it is based on both the inherent toxicity of a
compound and its potential dose. These by-products, mainly arsenic, sodium dichromate, and
hydrogen fluoride, are caused, for the most part, by electricity production from fossil sources.
These are potentially dangerous chemicals to humans through inhalation, ingestion, and even
contact. Cancer potency, for example, is an issue here. This impact category is measured in 1,4-
dichlorobenzene equivalents.
Impact category Human toxicity Definition Toxic effects of chemicals on humans
Impact indicator Cancer, respiratory diseases, other non-carcinogenic effects and effects to ionising radiation
Considerations Toxicological responses of humans
Nature of the chemicals in the human body
Damage categories
(endpoint) Human health
Unit
Depending on the model:
Kg 1,4-DB equivalent
20
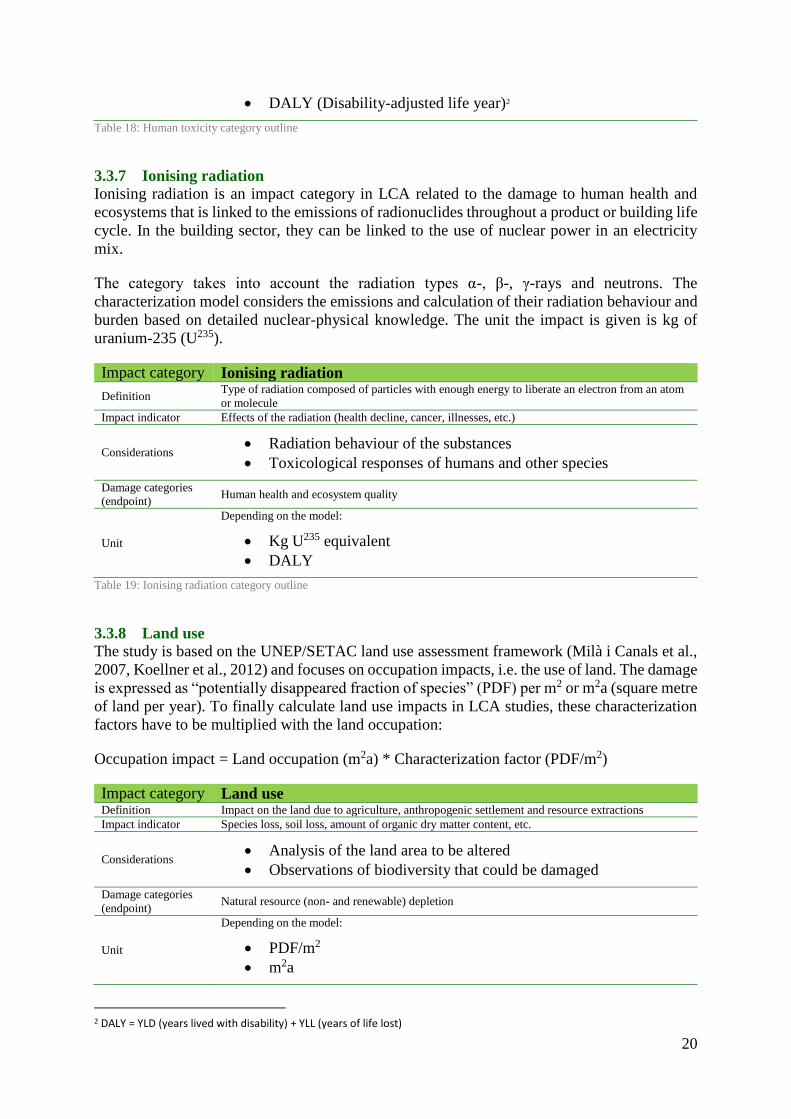
DALY (Disability-adjusted life year)2
Table 18: Human toxicity category outline
3.3.7 Ionising radiation
Ionising radiation is an impact category in LCA related to the damage to human health and
ecosystems that is linked to the emissions of radionuclides throughout a product or building life
cycle. In the building sector, they can be linked to the use of nuclear power in an electricity
mix.
The category takes into account the radiation types α-, β-, γ-rays and neutrons. The
characterization model considers the emissions and calculation of their radiation behaviour and
burden based on detailed nuclear-physical knowledge. The unit the impact is given is kg of
uranium-235 (U235).
Impact category Ionising radiation
Definition Type of radiation composed of particles with enough energy to liberate an electron from an atom
or molecule
Impact indicator Effects of the radiation (health decline, cancer, illnesses, etc.)
Considerations Radiation behaviour of the substances
Toxicological responses of humans and other species
Damage categories
(endpoint) Human health and ecosystem quality
Unit
Depending on the model:
Kg U235 equivalent
DALY
Table 19: Ionising radiation category outline
3.3.8 Land use
The study is based on the UNEP/SETAC land use assessment framework (Milà i Canals et al.,
2007, Koellner et al., 2012) and focuses on occupation impacts, i.e. the use of land. The damage
is expressed as “potentially disappeared fraction of species” (PDF) per m2 or m2a (square metre
of land per year). To finally calculate land use impacts in LCA studies, these characterization
factors have to be multiplied with the land occupation:
Occupation impact = Land occupation (m2a) * Characterization factor (PDF/m2)
Impact category Land use Definition Impact on the land due to agriculture, anthropogenic settlement and resource extractions
Impact indicator Species loss, soil loss, amount of organic dry matter content, etc.
Considerations Analysis of the land area to be altered
Observations of biodiversity that could be damaged
Damage categories
(endpoint) Natural resource (non- and renewable) depletion
Unit
Depending on the model:
PDF/m2
m2a
2 DALY = YLD (years lived with disability) + YLL (years of life lost)
21
Table 20: Land use category outline
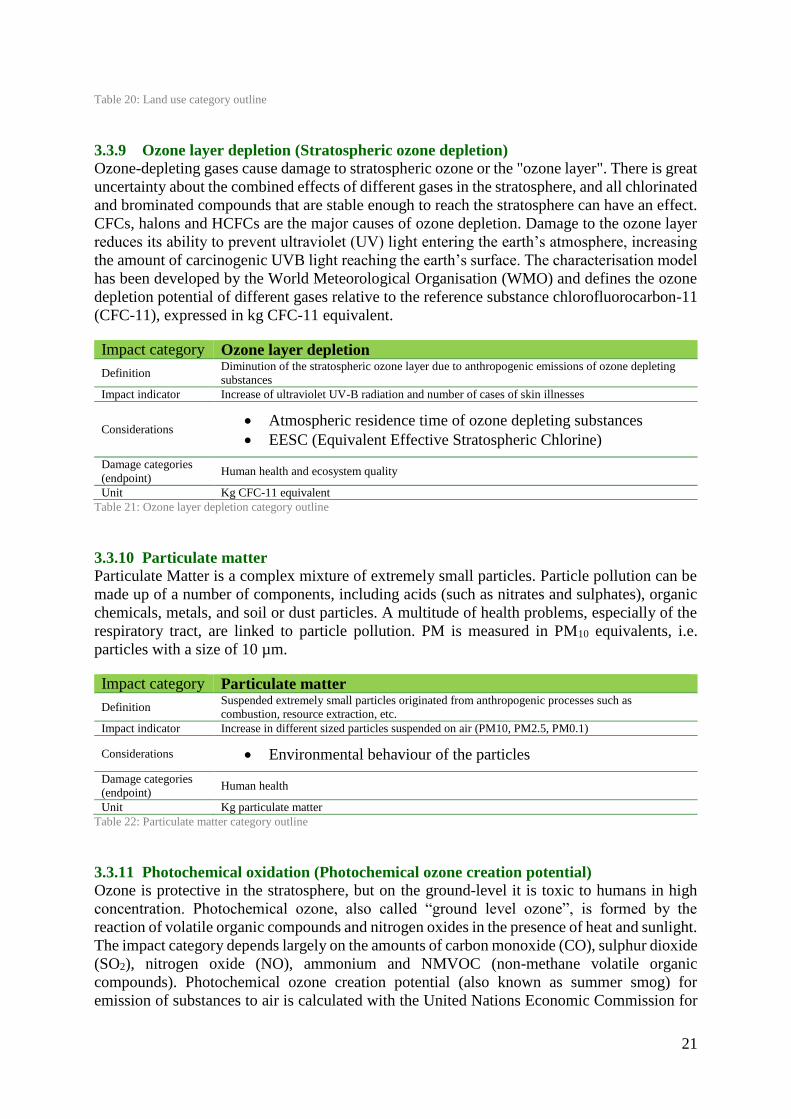
3.3.9 Ozone layer depletion (Stratospheric ozone depletion)
Ozone-depleting gases cause damage to stratospheric ozone or the "ozone layer". There is great
uncertainty about the combined effects of different gases in the stratosphere, and all chlorinated
and brominated compounds that are stable enough to reach the stratosphere can have an effect.
CFCs, halons and HCFCs are the major causes of ozone depletion. Damage to the ozone layer
reduces its ability to prevent ultraviolet (UV) light entering the earth’s atmosphere, increasing
the amount of carcinogenic UVB light reaching the earth’s surface. The characterisation model
has been developed by the World Meteorological Organisation (WMO) and defines the ozone
depletion potential of different gases relative to the reference substance chlorofluorocarbon-11
(CFC-11), expressed in kg CFC-11 equivalent.
Impact category Ozone layer depletion
Definition Diminution of the stratospheric ozone layer due to anthropogenic emissions of ozone depleting
substances
Impact indicator Increase of ultraviolet UV-B radiation and number of cases of skin illnesses
Considerations Atmospheric residence time of ozone depleting substances
EESC (Equivalent Effective Stratospheric Chlorine)
Damage categories
(endpoint) Human health and ecosystem quality
Unit Kg CFC-11 equivalent
Table 21: Ozone layer depletion category outline
3.3.10 Particulate matter
Particulate Matter is a complex mixture of extremely small particles. Particle pollution can be
made up of a number of components, including acids (such as nitrates and sulphates), organic
chemicals, metals, and soil or dust particles. A multitude of health problems, especially of the
respiratory tract, are linked to particle pollution. PM is measured in PM10 equivalents, i.e.
particles with a size of 10 µm.
Impact category Particulate matter
Definition Suspended extremely small particles originated from anthropogenic processes such as
combustion, resource extraction, etc.
Impact indicator Increase in different sized particles suspended on air (PM10, PM2.5, PM0.1)
Considerations Environmental behaviour of the particles
Damage categories
(endpoint) Human health
Unit Kg particulate matter
Table 22: Particulate matter category outline
3.3.11 Photochemical oxidation (Photochemical ozone creation potential)
Ozone is protective in the stratosphere, but on the ground-level it is toxic to humans in high
concentration. Photochemical ozone, also called “ground level ozone”, is formed by the
reaction of volatile organic compounds and nitrogen oxides in the presence of heat and sunlight.
The impact category depends largely on the amounts of carbon monoxide (CO), sulphur dioxide
(SO2), nitrogen oxide (NO), ammonium and NMVOC (non-methane volatile organic
compounds). Photochemical ozone creation potential (also known as summer smog) for
emission of substances to air is calculated with the United Nations Economic Commission for
22
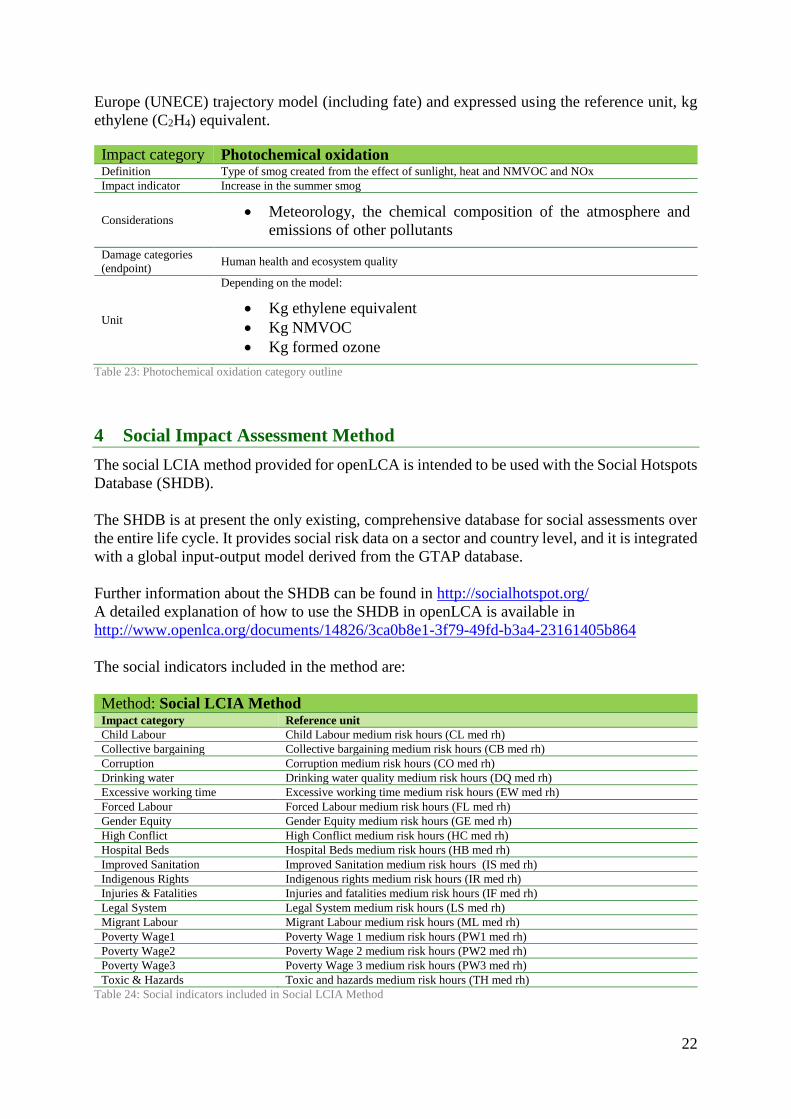
Europe (UNECE) trajectory model (including fate) and expressed using the reference unit, kg
ethylene (C2H4) equivalent.
Impact category Photochemical oxidation Definition Type of smog created from the effect of sunlight, heat and NMVOC and NOx
Impact indicator Increase in the summer smog
Considerations Meteorology, the chemical composition of the atmosphere and
emissions of other pollutants
Damage categories
(endpoint) Human health and ecosystem quality
Unit
Depending on the model:
Kg ethylene equivalent
Kg NMVOC
Kg formed ozone
Table 23: Photochemical oxidation category outline
4 Social Impact Assessment Method
The social LCIA method provided for openLCA is intended to be used with the Social Hotspots
Database (SHDB).
The SHDB is at present the only existing, comprehensive database for social assessments over
the entire life cycle. It provides social risk data on a sector and country level, and it is integrated
with a global input-output model derived from the GTAP database.
Further information about the SHDB can be found in http://socialhotspot.org/
A detailed explanation of how to use the SHDB in openLCA is available in
http://www.openlca.org/documents/14826/3ca0b8e1-3f79-49fd-b3a4-23161405b864
The social indicators included in the method are:
Method: Social LCIA Method Impact category Reference unit
Child Labour Child Labour medium risk hours (CL med rh)
Collective bargaining Collective bargaining medium risk hours (CB med rh)
Corruption Corruption medium risk hours (CO med rh)
Drinking water Drinking water quality medium risk hours (DQ med rh)
Excessive working time Excessive working time medium risk hours (EW med rh)
Forced Labour Forced Labour medium risk hours (FL med rh)
Gender Equity Gender Equity medium risk hours (GE med rh)
High Conflict High Conflict medium risk hours (HC med rh)
Hospital Beds Hospital Beds medium risk hours (HB med rh)
Improved Sanitation Improved Sanitation medium risk hours (IS med rh)
Indigenous Rights Indigenous rights medium risk hours (IR med rh)
Injuries & Fatalities Injuries and fatalities medium risk hours (IF med rh)
Legal System Legal System medium risk hours (LS med rh)
Migrant Labour Migrant Labour medium risk hours (ML med rh)
Poverty Wage1 Poverty Wage 1 medium risk hours (PW1 med rh)
Poverty Wage2 Poverty Wage 2 medium risk hours (PW2 med rh)
Poverty Wage3 Poverty Wage 3 medium risk hours (PW3 med rh)
Toxic & Hazards Toxic and hazards medium risk hours (TH med rh)
Table 24: Social indicators included in Social LCIA Method
23
5 References
[1] Guinée, J.B.; Gorrée, M.; Heijungs, R.; Huppes, G.; Kleijn, R.; Koning, A. de; Oers, L.
van; Wegener Sleeswijk, A.; Suh, S.; Udo de Haes, H.A.; Bruijn, H. de; Duin, R. van;
Huijbregts, M.A.J. Handbook on life cycle assessment. Operational guide to the ISO
standards. I: LCA in perspective. IIa: Guide. IIb: Operational annex. III: Scientific
background. Kluwer Academic Publishers, ISBN 1-4020-0228-9, Dordrecht, 2002, 692
pp.
[2] Goedkoop M., Spriensma, R. : The Eco-indicator 99 - A damage oriented method for
Life Cycle Impact Assessment. Methodology Report". Amersfoort 2001, Third edition
[3] Hauschild, M., Potting, J.: Spatial differentiation in Life Cycle impact assessment – The
EDIP2003 methodology. Institute for Product Development. Technical University of
Denmark. Environmental News No. 80, 2005.
[4] Hischier R., Weidema B., Althaus H.-J., Bauer C., Doka G., Dones R., Frischknecht R.,
Hellweg S., Humbert S., Jungbluth N., Köllner T., Loerincik Y., Margni M. and
Nemecek T. (2010) Implementation of Life Cycle Impact Assessment Methods.
ecoinvent report No. 3, v2.2. Swiss Centre for Life Cycle Inventories, Dübendorf.
[5] Ryberg, M., Vieira, M.D.M., Zgola, M., Bare, J., Rosenbaum, R.K. Updated US and
Canadian normalization factors for TRACI 2.1. Clean Technologies and Environmental
Policy (ISSN: 1618-954X) (DOI: http://dx.doi.org/10.1007/s10098-013-0629-z), 2013.
[6] Rosenbaum, R.K., Bachmann, T.M., Gold, L.S., Huijbregts, M.A.J., Jolliet, O., Juraske,
R., Koehler, A., Larsen, H.F., MacLeod, M., Margni, M.D., McKone, T.E., Payet, J.,
Schuhmacher, M., van de Meent, D., Hauschild, M.Z., 2008. USEtox - The UNEP-
SETAC toxicity model: Recommended characterisation factors for human toxicity and
freshwater ecotoxicity in life cycle impact assessment. The International Journal of Life
Cycle Assessment 13, 532-546.
[7] Hauschild, M.Z., Huijbregts, M.A.J., Jolliet, O., Macleod, M., Margni, M.D., van de
Meent, D., Rosenbaum, R.K., McKone, T.E., 2008. Building a Model Based on
Scientific Consensus for Life Cycle Impact Assessment of Chemicals: The Search for
Harmony and Parsimony. Environmental Science and Technology 42, 7032-7037.
6 Contact
If you have any questions or comments, please let us know.
GreenDelta GmbH, Müllerstrasse 135, 13349 Berlin, GERMANY
Cristina Rodríguez, Dr. Andreas Ciroth
Tel. +49 30 48 496 - 031 | Fax +49 30 48 496 – 991