lcap & kpm report 2018 (1) plan/lcap - kpm report... · lcap & kpm: uc/csu a-g course...
TRANSCRIPT

November 2018
Department of Assessment and Accountability

2
Local Control Accountability Plan Metrics &
Strategic Plan Key Performance Measures
Introduction/Purpose The purpose of this report is to display benchmark data points for the Local Control Accountability Plan (LCAP) and the Key Performance Measures (KPMs) outlined in the East Side Union High School District Strategic Plan and to look at progress made over the last several years towards preparing all students for college and careers. Student achievement data is used to measure the effectiveness of the educational system in producing equitable high level outcomes for all students and to point out areas where the system is producing disproportionality in these outcomes. Student achievement data indicates that many students struggle to meet college and career readiness upon graduation from high school. Furthermore, the district data show disproportionalities between how well Asian students, Hispanic students, and African American students meet this goal as well as special student populations such as Socioeconomically Disadvantaged students, English Language Learner students, and Students With Disabilities. In order to measure how well students graduating from the East Side Union High School District are prepared for our 21st century global economy, we have selected key data points which can be measured over time in both the LCAP and Strategic Plan. History Seven years ago, prior to the strategic plan, the district began to look at the achievement gap among students and determine if the district had systems and policies in place that hindered closing this gap as well as systems that would close the gap. It was found that some course sequences created a fork in the pathway that led some students to college preparedness and others simply to graduation. It was left for students to choose whether or not to take a third year of math and science, again either leading to college preparedness or not. For example, some students entering the district had access to summer programs that accelerated their math placement upon entering high school, thus advancing their road to college preparedness and college application distinction by allowing them to complete Calculus in high school. Placement criteria into higher level course work was not the same at all 11 high schools which disadvantaged some students. The district had several such inequitable systems in place. The district began changing policies and implementing programs to even out the playing field. All core subject sequences now have only one path, which leads to college preparedness. Many schools began to place students by default into a third year of math or science. In the 2010/11 school year, the Board of Trustees approved a default pathway for all students that leads to college and career readiness. The first class to graduate having completed 4 years of high school under the default pathway is the class of 2015. Beginning with this class, the

3
district set consistent placement criteria into core courses for all schools. Resources were prioritized to implement summer programs for all students that would advance or support higher level math placement in high school. Grants were procured to implement programs at sites to support struggling students. Some schools began to widen their instructional program to include greater numbers of Students With Disabilities in mainstream classrooms. The data in this report will show that these system changes have shown improvement in preparing all students for college and careers but that the district still has a long way to go to achieve this goal. The State’s new Local Control Funding Formula and corresponding Local Control Accountability Plan asks districts to widen their focus on the achievement gaps to include English Language Learner students, Students With Disabilities, Socioeconomically Disadvantaged students, and Foster Youth. Data shows that these populations of students are achieving at the lowest levels within our district. The LCAP and The Strategic Plan set the course for further improvement in student outcomes with targeted funding allocation and programmatic system shifts focusing on our academically struggling populations of students. The main priority for high schools is to graduate students and prepare them for their next step post-high school, whether that be college, trade schools, apprenticeships, or work. It is East Side’s goal that every student has choices for post-high school and we recognize that our district is responsible for graduating students prepared to enter college, the trades, or work as they choose. It takes students a minimum of 4 years to graduate high school. It is imperative that the system puts structures in place that are capable of monitoring students and providing warning systems for students likely to fall behind the target of graduating high school so that success for all students is probable. Data Data on student achievement can be provided at many levels of an organization, from district to county to state all the way down to student groups. These differing levels of data metrics have different purposes. For example the district overall graduation rate is a high level metric which can be used to compare the district to other entities such as similar districts, the county, and the state, but it does not point to any specific actions to improve the graduation rate. The scope and level of data can be thought of as data spheres where the outer most sphere provides high level system data and the inner most sphere provides actionable student data that can be used to change the negative trajectory of individual student outcomes. The picture below shows a visual representation of data spheres using graduation rate as an example. In order for district graduation rates to rise and disparities among student subgroup graduation rates to diminish, more students must graduate. More students graduate when they pass all of their classes at each grade level. More students pass their classes at each grade level when progress towards semester grades are monitored and interventions are provided to help students pass their classes.

4
In the picture above, the outer most sphere is the district graduation rate which is high level data, and the spheres progress into the center where actionable student data is placed: marking period grades. The data in this report is provided in order of data spheres. High level metrics will come first and progress toward the inner spheres and when applicable, student level methods for targeting interventions will be discussed. Data Definitions When possible, public data from the California Department of Education’s Data Quest site is used. However much of the data used is a year or more old and does not provide benchmarks that are timely for evaluation and improvement of district programs. In these cases, the district has created data measures based on district database and district-defined calculations, which allow for timely analysis. Furthermore, public data is not available in all areas needed for analysis and in these cases the district database and district calculations will be used.
5
Local Control Accountability Plan (LCAP) The LCAP outcomes center around the eight state priorities; Basic Services, Implementation of State Standards, Parental Involvement, Pupil Achievement, Pupil Engagement, School Climate, Course Access, and Other Pupil Outcomes, with the overarching goal of preparing all students for college and careers. Some data outcomes required in the LCAP are mandated while others are locally defined, and most are common to the KPMs specified in the ESUHSD Strategic Plan. This report will focus on the goals in the LCAP and include those KPMs not specified in the LCAP. LCAP Goals LCAP Goal 1: College and Career: Provide high quality instruction, learning opportunities, as well as guidance supports to prepare every student to graduate ready for college and career. LCAP Goal 2: Graduation Rate: Provide the physical, emotional, social and academic support to ensure students are making appropriate yearly progress towards high school graduation. LCAP Goal 3: English Language Learners: Provide the program, support and instructional strategies to obtain English proficiency and the overall academic success of short-term and long-term English Language Learners. LCAP Goal 4: Decrease Suspensions: Establish and sustain healthy school culture through relationship-centered practices to keep students engaged in their learning environment. LCAP Goal 5: Attendance - Chronic Absenteeism: Engage with and connect students and families to appropriate staff, support, and programmatic alternatives to increase student attendance in school. Key Performance Indicators (KPMs) The Board of Trustees identified the following KPMs to hold the organization accountable: 1. Improved graduation rate 2. Decreased dropout rate 3. Improved A-G completion rate (15 course sequence for UC/CSU qualification) 4. Develop College & Career Readiness Indicators (5Cs) –Critical Thinking, Communication,
Collaboration, Creativity, Civic Engagement 5. Decrease achievement gaps as defined in measures 1-3 and other indicators, such as
suspension and expulsion rates.

6
Demographics The district population should be considered when analyzing statistics. Many displayed subgroups are small in number, which makes these metrics prone to large fluctuations from year to year. The chart below shows the district subgroups by percent of the districts total population as well as the number of students.
Goals and Measures LCAP Goal 1: College and Career: Provide high quality instruction, learning opportunities, as well as guidance supports to prepare every student to graduate ready for college and career. Metrics: LCAP & KPM: UC/CSU A-G Course Completions A-G Completion Rate
Subgroup # of Students % of PopulationAfrican American 581 2.5%American Indian or Alaska Native 58 0.2%Asian 8,612 36.9%Filipino 1,836 7.9%Hispanic or Latino 10,368 44.4%Pacific Islander 135 0.6%White 1,282 5.5%Two or More Races 455 1.9%Socioeconomically Disadvantaged 12862 55.1%Foster Youth 65 0.3%Homeless Youth 198 0.8%English Language Learners 3911 16.8%Students With Disabilities 2454 10.5%Total District Enrollment 23,336
2017-18 ESUHSD Demographics

7
The following graph shows the public data on UC/CSU A-G course completion rates for graduates in ESUHSD, Santa Clara County, and the state. UC/CSU A-G course completion rates are published a year behind so the most current data available is for the class of 2016-17. The California Department of Education released the new 2016-17 Graduation rate. The new 4 year cohort graduation rate called the Adjusted Cohort Graduation Rate (ACGR) begins with the class of 2016/17 which changes the UC/CSU A-G completion rates. Because the calculation and definitions have changed, the Graduation Rate and UC/CSU A-G completion rate cannot be compared to prior years. Furthermore, the public district rates do not include independently reporting charter schools.
• The percent of students graduating who complete the UC/CSU A-G course requirements district wide is 46.5%.
• The district rate is below the state and the county rates. Public Data
The graph above shows the public UC/CSU A-G course completion rates for ESUHSD ethnic subgroups.

8
• As a system, East Side produces disproportionate A-G rates for student groups. • East Side exits Asian students A-G ready at 2.5 times the rate of Hispanic students and
2.3 times the rate of African American students. • The Hispanic subgroup A-G rate is 27.3% which is below the county and state rates. • The Asian subgroup A-G rate is 67.8% which is below the county and state rates. • The African American subgroup A-G rate is 30.1% which is below the county and state
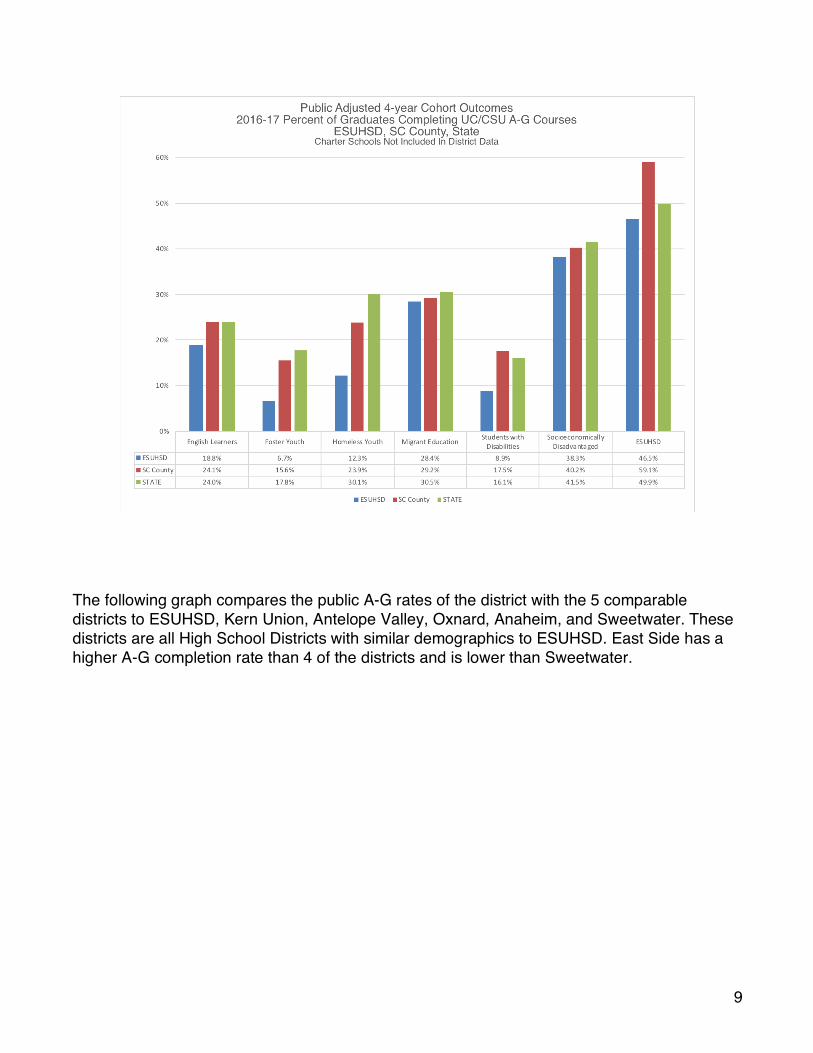
rates. The following chart shows the pubic UC/CSU A-G course completion rates for special populations, English Language Learners (ELL), Socioeconomically Disadvantaged (SED), and Students With Disabilities (SWD).
• East Side graduates ELL, SED, SWD, Foster Youth and Homeless Youth A-G ready at
lower rates when compared to all students. • The ELL subgroup A-G rate is 18.8% and is below both the county and state rates. • The SED subgroup A-G rate is 38.3% and is below both the county and state rates. • The SWD subgroup A-G rate is 8.9% and is below both the county and state rates. • The Foster Youth subgroup A-G rate is 6.7% and is below both the county and state
rates. • The Homeless Youth subgroup A-G rate is 12.3% and is below both the county and
state rates.
9
The following graph compares the public A-G rates of the district with the 5 comparable districts to ESUHSD, Kern Union, Antelope Valley, Oxnard, Anaheim, and Sweetwater. These districts are all High School Districts with similar demographics to ESUHSD. East Side has a higher A-G completion rate than 4 of the districts and is lower than Sweetwater.

10
Local Cohort A-G Rate East Side Union High School District defined a local cohort which includes Students who were enrolled continuously from the first day of 9th grade to the first day of 12th grade. Students are taken out of the cohort in grade 12 if they transfer to another 9-12 high school. Early grads, dropouts, Adult Ed transfers, grads, and non-grads stay in the cohort. The definition changed in 2016-17 to include early grads and account for 12th grade dropouts that exited the system. The following graphs shows UC/CSU A-G course completion rates for the district local cohort.
• The 2018 local cohort UC/CSU A-G course completion rate is 58.4% which is a 3.4 percentage point increase from 2017.
• Students who are enrolled in the district all 4 years have higher UC/CSU A-G course completion rates.
• Hispanic and African American graduates exit East Side high schools with UC/CSU courses completed at lower rates than Asian students.
• The 2018 UC/CSU A-G course completion rate for the local cohort Asian graduate
subgroup is 73.7%, which is an increase of 1.4 percentage points since 2017. • The 2018 UC/CSU A-G course completion rate for the local cohort African American
graduate subgroup is 31.3%, which is a decrease of 6.8 percentage points since 2017.

11
• The 2018 UC/CSU A-G course completion rate for the local cohort Hispanic graduate subgroup is 37.4%, which is an increase of 3.8 percentage points since 2017.

12
The following graph shows the Local Cohort UC/CSU A-G course completion rates for special populations. English Language Learner and Students With Disabilities graduates exit East Side high schools with UC/CSU courses completed at lower rates than all other student subgroups.
• English Language Learner (ELL) and Socioeconomically Disadvantaged (SED), local cohort subgroups have shown increases in the local A-G course completion rates.
• The 2018 UC/CSU A-G course completion rate for the local cohort ELL graduate subgroup is 12.5%, which is an increase of 4.1 percentage points since 2017.
• The 2018 UC/CSU A-G course completion rate for the local cohort SED graduate subgroup is 52.0%, which is an increase of 3.5 percentage points since 2017.
• The 2018 UC/CSU A-G course completion rate for the local cohort SWD graduate subgroup is 6.0%, which is a decrease of 3.5 percentage points since 2017.

13
Grades 9 – 11 on-track for A-G UC/CSU A-G course completion rates are considered a 4-year statistic in that it takes a student 4 years of high school to achieve that status. In order to monitor student progress towards this goal, an On Track for A-G Completion metric has been created. The following chart shows the percentage of students by grade level for the past three years on track to complete A-G at the end of each grade. All core subject area courses and most electives satisfy an A-G requirement with the exception of ELD 1 & 2 and special education special day courses.
• 53.9% of 9th graders are on track for A-G completion by the time they enter the next grade.
• 41.8% of 10th graders are on track for A-G completion by the time they enter the next grade.
• 28.8% of 11th graders are on track for A-G completion by the time they enter the next grade.
• The on track status of students decreases as grade levels increase. • The 2018 on track rates for 9th graders and most 9th grade subgroups increased when
compared to 2017. • The 2018 on track rates for 10th graders and most 910h grade subgroups increased
when compared to 2017.

14
• ESUHSD exits students each year from grades 9 -11disproportionatly when comparing student subgroups.
• ESUHSD exits Asian students on track for A-G at each grade level at higher rates than African American and Hispanic students.
• The on track status of the African American and Hispanic subgroups is lower than the Asian subgroup showing a district-wide disproportionality in on track status.
• ESUHSD exits English Language Learner students on track for A-G at each grade level at significantly lower rates than the district average. The majority of ELL students are enrolled in A-G courses.
Course Passage – English, Math, Science, and Social Science Students must earn a C or higher in A-G courses in order to satisfy the UC/CSU A-G course entrance requirements. The following graphs show the percentage of students earning a C or above, and a D or above, in English, Math, Science, and Social Science each semester. Potentially students who earned a D could earn a C with intervention prior to the end of the semester. The D or above column shows the percentage of students that could have earned A-G credit if they had received C’s instead of D’s. Early warning reports on grades surface these students for intervention.
2015-16 2016-17 2017-18 2015-16 2016-17 2017-18 2015-16 2016-17 2017-18All Students 52.7% 51.8% 53.9% 37.2% 39.3% 41.8% 24.9% 27.2% 28.8%African American 29.8% 27.0% 33.6% 17.4% 18.5% 20.3% 14.5% 12.1% 13.6%Asian 76.9% 75.5% 78.7% 58.2% 62.4% 65.6% 43.9% 42.0% 45.2%Hispanic 30.7% 29.5% 28.5% 16.7% 17.6% 19.3% 9.1% 12.5% 12.3%Native American 31.3% 37.1% 11.8% 14.3% 0.0%Pacific Islander 37.0% 34.2% 41.9% 24.1% 15.4% 21.2% 3.4% 17.2%Two or More Races 61.4% 55.6% 61.9% 41.9% 37.2% 47.2% 22.1% 33.3% 27.6%White 58.1% 54.0% 55.1% 41.1% 43.9% 41.3% 22.4% 28.9% 33.1%ELL 15.7% 17.2% 17.0% 7.4% 6.5% 7.5% 1.4% 4.4% 2.7%SED 41.0% 40.6% 41.9% 27.3% 28.6% 31.0% 17.2% 21.1% 20.7%SWD 7.0% 8.7% 5.6% 2.8% 2.3% 3.6% 2.1% 1.0% 1.3%
Grade 9 Grade 10 Grade 11
On Track for A-G CompletionEast Side Union High School District

15

16
The graphs above show the percent of students who earned a C or above and those who earned a D or above first and second semester in A-G English courses.
• 79% of students received a C or above in English first semester and 78% received a C or above second semester in 2017-18
• 89% of students received a D or above in English first semester and 88% received a C or above.
• 10% of students each semester could have benefited by early intervention to change their D grade to a C grade thus earning A-G credit.
• There are larger gaps between the percent of students earning C’s or above and the percent earning D’s or above for African America, Hispanic, SWD, and ELL student subgroups than the district average.

17
The graphs above show the percent of students who earned a C or above and those who earned a D or above first and second semester in A-G Math courses.
• 68% of students received a C or above in Math first semester and 66% received a C or above second semester in 2017-18
• 82% of students received a D or above in Math first semester and 80% received a C or above.
• 14% of students each semester could have benefited by early intervention to change their D grade to a C grade thus earning A-G credit.
• There are larger gaps between the percent of students earning C’s or above and the percent earning D’s or above for African America, Hispanic, SWD, and ELL student subgroups than the district average.

18

19
The graphs above show the percent of students who earned a C or above and those who earned a D or above first and second semester in A-G Science courses.
• 78% of students received a C or above in Science first semester and 76% received a C or above second semester in 2017-18
• 88% of students received a D or above in Science first semester and 85% received a C or above.
• 10% and 9% of students each semester respectively could have benefited by early intervention to change their D grade to a C grade thus earning A-G credit.
• There are larger gaps between the percent of students earning C’s or above and the percent earning D’s or above for African America, Hispanic, SWD, and ELL student subgroups than the district average.

20
The graphs above show the percent of students who earned a C or above and those who earned a D or above first and second semester in A-G Social Science courses.
• 83% of students received a C or above in Social Science first semester and 80% received a C or above second semester in 2017-18
• 91% of students received a D or above in Social Science first semester and 90% received a C or above.
• 8% and 10% of students each semester respectively could have benefited by early intervention to change their D grade to a C grade thus earning A-G credit.
• There are larger gaps between the percent of students earning C’s or above and the percent earning D’s or above for African America, Hispanic, SWD, and ELL student subgroups than the district average.
In order to increase the number of students completing UC/CSU A-G requirements the district must support the instructional shifts needed by teachers to meet the academic needs of all students and continue to provide credit recovery options for all students beginning in grade 9. LCAP & KPM: SBAC >= 3 & EAP
21
SMARTER Balanced Assessments (SBAC) The purpose of the common core state standards is to indicate course structures and content that prepares all students for college and careers upon graduation. The Smarter Balanced Assessments (SBAC) were given for the first time in the spring of 2015 to all students, grades 3-8 and 11, in English Language Arts and Mathematics. The results are aligned to college and career readiness. All students in grade 11 take the same SBAC level assessment in Mathematics, which is a shift from the previous California Content tests, which required students to take math tests aligned with the math course they were taking that year. For example, grade 11 students enrolled in Common Core Math 1, a grade 9 math course, take the grade 11 SBAC math test. The same is true for English. The grade 11 SBAC exams are also used for the Early Assessment Program (EAP), which qualifies students to enroll in credit-bearing college English and Math courses during their freshman year in college without having to take additional support courses. Students who score Standard Exceeded on the SBAC are considered “College Ready” and students who score Standard Met are considered “Conditionally College Ready”. The following graph shows the percent of students who met or exceeded standard on the SBAC grade 11 exam over the last 4 years and earned conditionally college ready or college ready status on the EAP.

22
SBAC - English Language Arts/Literacy
• 61% of 11th grade students met or exceeded standard on the SBAC ELA exam, which is lower than the county rate and higher than the state rate. This means that 61% of 11th graders scored conditionally college ready or college ready on the EAP for ELA.
• Student scores decreased for ESUHSD, SC County, and the State in ELA.
The following graph shows the district ELA SBAC performance compared to the 5 similar districts for ESUHSD. ESUHSD had a higher percentage of students meeting and exceeding standard in ELA then all 5 similar districts.

23
The following charts show the percent of students meeting or exceeding standard on the 11th grade ELA SBAC exam disaggregated by race/ethnicity.
• 44% of African American students, 79% of Asian students, and 44% of Hispanic students met or exceeded standard on the ELA SBAC 2017-18 exam and met at least conditionally college ready status.
• ESUHSD shows a disproportionality among student groups in the percentage of students scoring conditionally college ready and college ready on the LEA EAP.
• The percent of Asian and African American students meeting or exceeding standard decreased in 2017-18 compared to last year.
• The percent of Hispanic students meeting or exceeding standard decreased in 2017-18 compared to last year.

24

25
The graph below shows the 11th grade ELA SBAC results for special populations.
• SED, SWD and ELL student subgroups showed decreases in the percentage of students meeting or exceeding standard.
• 48% of SED students, 9% of ELL students, and 11% of SWD met or exceeded standard and therefore earned college ready or conditionally college ready status on the ELA EAP.
• ESUHSD shows a disproportionality among student groups in the percentage of students in special population groups scoring conditionally college ready and college ready on the LEA EAP.
SBAC - Mathematics The following chart shows the percent of 11th grade students who met or exceeded standard on the Math SBAC exam over the last 4 years compared to the county and state.

26
• 40% of 11th grade students met or exceeded standard on the SBAC Math exam, which
is lower than the county rate and higher than the state rate. • This means 40% of students earned conditionally college ready or college ready on the
2017-18 Math EAP.
The following results show the grade 11 SBAC results for the district compared to the 5 similar districts.
• ESUHSD had a higher percentage of students meeting or exceeding standard then all 5 similar districts.

27
The charts below shows the results of the Math SBAC results disaggregated by race/ethnicity.
• 16% of African American students, 67% of Asian students, and 15% of Hispanic students met or exceeded standard on the 2016-17 Math SBAC and earned conditionally college ready or college ready status on the EAP.
• The percent of African American, Asian, and Hispanic students meeting or exceeding standard on the EAP decreased in 2017-18 compared to last year.
• ESUHSD shows a disproportionality among student groups in the percentage of students scoring conditionally college ready and college ready on the LEA EAP.

28

29
The following chart shows the Math SBAC results for special populations.
• 27% of SED students, 12% of ELL students, and 2% of SWD met or exceeded standard on the 2016-17 SBAC exam and earned conditionally college ready or college ready status on the Math EAP.
• A higher percentage of ELL students met or exceeded standard in 2017-18 than last year. The ELL subgroup showed a 1 percentage point gain.
• The SWD and SED subgroups showed a 2 and 3 percentage point decrease respectively in the percentage of students meeting or exceeding standard on the 2017-18 Math SBAC exam compared to last year.
• ESUHSD shows a disproportionality among student groups in the percentage of students in special population groups scoring conditionally college ready and college ready on the LEA EAP.

30
LCAP & KPM: Advanced Placement scores - % of students with exams of >=3 or IB >=4 The following table shows the total number of Advanced Placement (AP) exams taken during the last 7 years. Since students can enroll in multiple AP courses simultaneously and take multiple AP tests in a given year, it is important to gauge how many individual students are accessing at least one AP course. An AP score of 3 out of 5 is considered “passing” and is the minimum score required by colleges who accept AP scores for college course credit.
• There were 10577 AP tests taken by 5456 students in 2017-18. • There were 276 less AP tests taken in 2017-18 than the year prior and 110 fewer
students took exams. • However, 3579 more exams were taken in 2017-18 than were taken in 2012, and 1435
more students took at least one exam in 2018 than in 2012. • Using CBEDS enrollment, 31.4% of students took at least one AP test and of those
students, 66.8% scored a 3 or higher on at least one exam.
The following graph shows the percentage of each subgroup of students enrolled in at least one AP/IB course.
• 30.4% of students took at least 1 AP/IB course in 2017-18. • There is a large disproportionality between the percentage of Asian students enrolling in
an AP/IB course and African American and Hispanic students enrolling in those courses.
• 44.2% of Asian students enrolled in at least one AP/IB course while 15% of African American and 21% of Hispanic students enrolled in at least one AP/IB course.
Total CBEDS Enrollment
Grades 10-12Total AP Scores
# AP Scores 3 or Higher
# Of Students Who Took At Least One
AP Test
% Of Students Who Took At Least
One AP Test
# Of AP Students Scoring 3 or
Higher On At Least One AP Test
% Of AP Students Scoring 3 Or
Higher On At Least One AP Test
2012 17960 7038 4182 4021 22.4% 2569 63.9%2013 17863 8077 4639 4579 25.6% 2839 62.0%2014 17591 9280 5377 5046 28.7% 3206 63.5%2015 17462 9931 5686 5143 29.5% 3148 61.2%2016 17486 10353 6276 5392 30.8% 3525 65.4%2017 17424 10853 6503 5566 31.9% 3556 63.9%2018 17402 10577 6610 5456 31.4% 3645 66.8%
*2017 numbers have been updated to reflect additional students test in that year.
East Side Union High School District 2012-18 AP Test Results

31
• 9.3% of ELL students enrolled in AP/IB courses in 2017-18.
The following graph shows the percent of students enrolled in an AP/IB course who scored a 3 or higher on an AP exam or 4 or higher on an IB exam.
• Overall, 51.6% of students enrolled in AP/IB courses passed at least one exam. • 69.5% of Asian students enrolled in AP/IB courses passed at least one exam. • 43.0% of Hispanic students enrolled in AP/IB courses passed at least one exam. • 23.0% of African American students enrolled in AP/IB courses passed at least one
exam. • 31.1% of ELL students enrolled in AP/IB courses passed at least one exam. • 31.6% of SWD enrolled in AP/IB courses passed at least one exam. • All subgroups showed increases in the percentage of students enrolled in AP/IB
courses who passed at least one exam.

32
KPM: PSAT Preliminary Scholastic Aptitude Test (PSAT) The PSAT is taken by 11th graders to prepare for the SAT and qualify for college scholarships through the National Merit Scholarship Program. 10th grade students can elect to take the test in preparation for their junior year. The PSAT was offered free of charge to all 10th grade students in the district beginning in 2013-14, and sites administer the test to all 10th graders. The PSAT underwent changes in 2014-15 to align with new college and career ready benchmarks; therefore, 2015-16 scores are only comparable to 2016-17 scores. Students receive both a Math and an Evidenced Based Reading/Writing score, which is compared to a benchmark. The benchmark indicates that the student is performing on track for their grade in order to exit high school college-ready. The following charts show the results of the 10th grade 2017-18 PSAT administration compared to the 2016-17 and 2015-16 administration.
• In 2017-18 57% of students met the college readiness indicator in English, which is the same as 2016-17.
• In 2017-18 38% of students met the college readiness indicator in math, which is a 1 percentage point decrease from 2016-17.

33
• 36% of Hispanic students who took the PSAT in 2017-18 met the college readiness indicator in English. 15% met the college readiness indicator in Math.
• 35% of African American students who took the PSAT in 2017-18 met the college readiness indicator in English. 18% met the college readiness indicator in Math.
• 75% of Asian students who took the PSAT in 2017-17 met the college readiness indicator in English. 58% met the college readiness indicator in Math.
• 55% of Asian students, 17% of African American students, and 13% of Hispanic students met both the English and Math benchmark.

34

35
LCAP Goal 2: Graduation Rate: Provide the physical, emotional, social and academic support to ensure students are making appropriate yearly progress towards high school graduation. Metrics: LCAP & KPM: Graduation Rate Public Data: 4-Year Cohort Graduation Rate
The graph above shows the public data on graduation rates for ESUHSD, Santa Clara County, and the state. Graduation rates are published a year behind, so the most current data available is for the class of 2016-17. The California Department of Education released the new 2016-17 Graduation rate. The new 4 year cohort graduation rate called the Adjusted Cohort Graduation Rate (ACGR) begins with the class of 2016-17. Because the calculation and definitions have changed the Graduation Rate cannot be compared to prior years. The data above also displays the graduation rate adjusted for a discrepancy in district graduate data.
• The overall district graduation rate is 83.4% • The East Side public graduation rate is below the county rate and above the state rate.

36
• When the data on graduates is adjusted to account for a data certification error, the district graduation rate is higher than both the county and state rates.
• The Asian subgroup graduation rate is 92.9% and is below both the county and state rates.
• The African American subgroup graduation rate is 81.5% and is below the county rate and above the state rate.
• The Hispanic subgroup graduation rate is 75.2% and is above both the county and state rates.
• ESUHSD graduates Hispanic and African American students at lower rates than Asian students.
The graph below shows the ESUHSD graduation rate compared to the 5 comparable districts.
• The ESUHSD graduation rate is below 4 and above 1 of the similar district graduation rates.
The following chart shows the graduation rates for special populations.

37
• The ELL subgroup graduation rate is 68.8% and is above the county and state rates. • The SED subgroup graduation rate is 79.4% and is above the county and state rates. • The SWD subgroup graduation rate is 59.3% and is below both the county and state
rates. • The Foster Youth graduation rate is 46.9% and is below both the county and state rates. • The Homeless Youth graduation rate is 52.9% and is above the county rate and below
the state rate. • ESUHSD graduates students in special populations at significantly lower rates than all
students.
Local Cohort Graduation Rate East Side Union High School District defined a local cohort which includes Students who were enrolled continuously from the first day of 9th grade to the first day of 12th grade. Students are taken out of the cohort in grade 12 if they transfer to another 9-12 high school. Early grads, dropouts, Adult Ed transfers, grads, and non-grads stay in the cohort. The definition changed in 2016-17 to include early grads and account for 12th grade dropouts that exited the system to help us better define those students who are not in the local cohort. The following graph shows the local cohort graduation rates for the district. This data is available in the fall each year and will provide a timely data point for graduation rates for use in both

38
gauging progress on LCAP goals as well as the district KPMs. The chart shows the local cohort graduation rate by ethnicity.
• The overall district rate is 95.7%, which is a decrease of .3 percentage points from 2017.
• Students who attend district schools all 4 years have a high graduation rate. • The gap between ethnic groups is much smaller for students who attend a district
school all 4 years. • A small gap still exists between ethnic groups. The local cohort graduation rate for:
o The Asian subgroup is 98.2%. o The African American subgroup is 94.1%. o The Hispanic subgroup is 92.1%.
The following graph shows the local cohort graduation rate for special populations. The local cohort graduation rate for:
• The SED subgroup is 93.7%. • The ELL subgroup is 86.6%. • The SWD subgroup is 85.6%.

39
Local Non-Cohort Graduation Rate 26% of seniors in 2017-18 were not part of the local cohort, meaning they did not attend a district school all 4 years. The following chart shows the percentage of seniors by subgroups who are not in the local cohort. Some subgroups have a higher percent of students outside the local cohort than others.
• 18% of Asian seniors were outside the cohort. • 46% of African American seniors were outside the cohort. • 34% of Hispanic seniors were outside the cohort. • 55% ELL seniors were outside the cohort. • 32% SED seniors were outside the cohort.

40
Furthermore, students outside of the local cohort graduate at much lower rates than those same student groups in the local cohort. The graph below shows the graduation rates for students outside of the local cohort compared to the same subgroup in the local cohort.
• Overall, students in the local cohort have a graduation rate of 95.7% while students outside the local cohort have a graduation rate of 75.7%, a 20 percentage point difference.
• Hispanic students in the local cohort have a graduation rate of 92.1% while Hispanic students outside the local cohort have a graduation rate of 69.6%, a 22.5 percentage point difference.
• African American students in the local cohort have a graduation rate of 94.1% while African American students outside the local cohort have a graduation rate of 84.5%, a 9.6 percentage point difference.
• ELL students in the local cohort have a graduation rate of 86.6% while students outside the local cohort have a graduation rate of 62.8%, a 23.8 percentage point difference.
• SED students in the local cohort have a graduation rate of 93.7% while students outside the local cohort have a graduation rate of 71.1%, a 22.6 percentage point difference.
Percent of Seniors Not in
CohortNon Cohort
Total SeniorsAfrican American 46% 71Asian 18% 492Hispanic 34% 818Pacific Isl 40% 12Two or more Races 35% 31White 21% 68SED 32% 1010ELL 55% 368SWD 37% 167District 26% 1501
2017-18 ESUHSDPercentage and Number of Seniors
Not in the Local Cohort

41

42
The district is examining policies and practices to ensure all students entering the district from other schools, states, and countries receive equitable and correct credit for courses taken outside of the district. Continued work must be done to ensure a smooth and supportive transition is in place for students who transfer into the district part way through high school in order to ensure the best possible outcomes for all of our students. LCAP: Foster Youth Graduation Rate
• The Foster Youth graduation rate for 2016-17 is 46.9%.
LCAP: Percentage of seniors that graduated by the end of summer In order to have timely data on all graduates, the percent of seniors enrolled at the end of their senior year who graduated is calculated. Students who graduate after summer school are included as are SWD who earn a certificate of completion.
• Overall 89.9% of seniors graduated in 2018. • 95.7% of Asian seniors, 90.3% of African American seniors, and 82.9% of Hispanic
seniors graduated by the end of summer, which are all increases compared to last year. • 76.7% of SWD seniors, 73.6% of ELL seniors, and 85.4% of SED seniors graduated by
the end of summer.
2016 2017 2018All Students 88.3% 88.0% 89.9%Asian 94.2% 94.5% 95.7%African American 88.5% 89.1% 90.3%Hispanic 81.6% 81.0% 82.9%Pacific Islander 92.3% 85.7% 86.2%Two or more races 92.7% 95.2% 88.0%White 93.6% 93.5% 94.7%SWD 75.3% 79.0% 76.7%ELL 65.2% 69.6% 73.6%SED 84.3% 84.0% 85.4%Homeless Youth 66.3%Foster Youth 68.4%Counts SWD Certificate of Completion as Grads
ESUHSD 2016 - 2018 GraduatesPercent of Seniors Graduating by End of Summer

43
LCAP: 9-11 grade on track for graduation High school graduation is a 4-year event in that it takes students 4 years to graduate in most cases. In order to measure student progress each year, an on track metric is calculated that assumes students are on track for that grade level if they earn 60 credits in grade 9, 120 credits in grade 10, and 180 credits in grade 11, all measured after summer school of that year. The following graphs show the percent of students on track for graduation at each grade level disaggregated by student group.
• 70% of 9th graders, 63% of 10th graders, and 61% of 11th graders enter the next grade on track for graduation.
• A lower percentage of African American and Hispanic students are on track at each grade level than Asian students.
• 90% of Asian students, 55% of African American students, and 49% of Hispanic students are on track after Grade 9.
• 85% of Asian students, 47% of African American students, and 42% of Hispanic students are on track after Grade 10.
• 80% of Asian students, 41% of African American students, and 42% of Hispanic students are on track after Grade 11.
• 45% of SWD are on track after grade 9; that reduces to 35% on track after grade 11. • 45% of ELL students are on track after grade 9; that reduces to 37% after grade 11.

44

45

46
The data shows that the same groups of student with lower graduation rates are less likely to be on track to graduate beginning at grade 9 and the likely hood of students earning on track status at each grade level declines as grade level increases. In order to increase graduation rates the district will focus on having all students achieve on track status at teach grade level. Metric: District Dropout Rates KPM Goal: Decrease Dropout Rate Public Data Over the years the district has analyzed student dropouts. The media presents high school dropouts as students who leave high school before graduating. However, for East Side that is not accurate. Most district dropouts are students who completed 4 years of high school but did not earn enough credits in courses to graduate. The following charts show the public data for the district dropout rate. The public data runs a year behind, so the latest information is for the class of 2016-17. The Change in the 4 year adjusted cohort outcomes defined by the California Department of Education (ACGR) also effects the Dropout calculation, therefore the 2016-17 dropout data is not comparable to prior years.
• The district dropout rate is 9.8%. • The district dropout rate is below the county rate and higher than the state rate. • The district dropout rate is higher than the 5 comparable districts’ dropout rates.
Grade 92016
Grade 92017
Grade 92018
Grade 102016
Grade 102017
Grade 102018
Grade 112016
Grade 112017
Grade 112018
All Students 72% 69% 70% 64% 64% 63% 57% 60% 61%Native American 44% 35% 54% 18% 29% 24%Asian 91% 88% 90% 83% 85% 85% 77% 79% 80%African American 55% 53% 55% 54% 41% 47% 47% 48% 41%Hispanic 55% 51% 49% 45% 44% 42% 38% 41% 42%Pacific Islander 59% 55% 63% 62% 50% 47% 41% 59%Two or more races 79% 74% 75% 70% 64% 68% 64% 66% 64%White 72% 72% 72% 67% 65% 65% 60% 61% 64%
SWD 51% 49% 45% 41% 37% 36% 40% 37% 35%ELL 45% 49% 45% 38% 40% 38% 29% 37% 37%Socioeconommically Disadvantaged 58% 60% 61% 54% 55% 53% 43% 53% 53%
Note: On Track for Graduation is based on credits earned by the end of summer. GD 9 = 60, GD 10 = 120, GD 11 = 180
East Side Union High School District 2016, 2017 & 2018Percent of Students On Track for Graduation

47
The district dropout rate disaggregated by ethnicity shows that there is a disproportionality among subgroups. Hispanic and African American students are at higher risk of becoming a dropout than Asian students without district intervention.
• The Hispanic subgroup dropout rate is 15.0% and below the county rate and above the state rate.
• The African American subgroup dropout rate is 8.6% and is higher than the county rate and below the state rate.
• The Asian subgroup dropout rate is 3.4% and is higher than both the county and state rates.

48
The following graph shows the district dropout rate disaggregated by special populations.
• The ELL dropout rate is 16.4% and is below both the county and state rates. • The SED dropout rate is 11.9% and is below the county rate and above the state rate. • The SWD dropout rate is 15.3% and is above both the county and state rates.

49
LCAP Goal 3: English Language Learners: Provide the program, supports and instructional strategies to obtain English proficiency and the overall academic success of short-term and long-term English Language Learners. Metrics: The new California Accountability Dashboard uses the current English proficiency exam and English Language Learner reclassification rates as data indicators. This indicator is on hold due to the change in the English proficiency exam. In past years the English proficiency exam was the CELDT; however, in 2017-18 the exam transitioned to the new ELPAC exam. The following graphs show the 2017-18 ELPAC results.
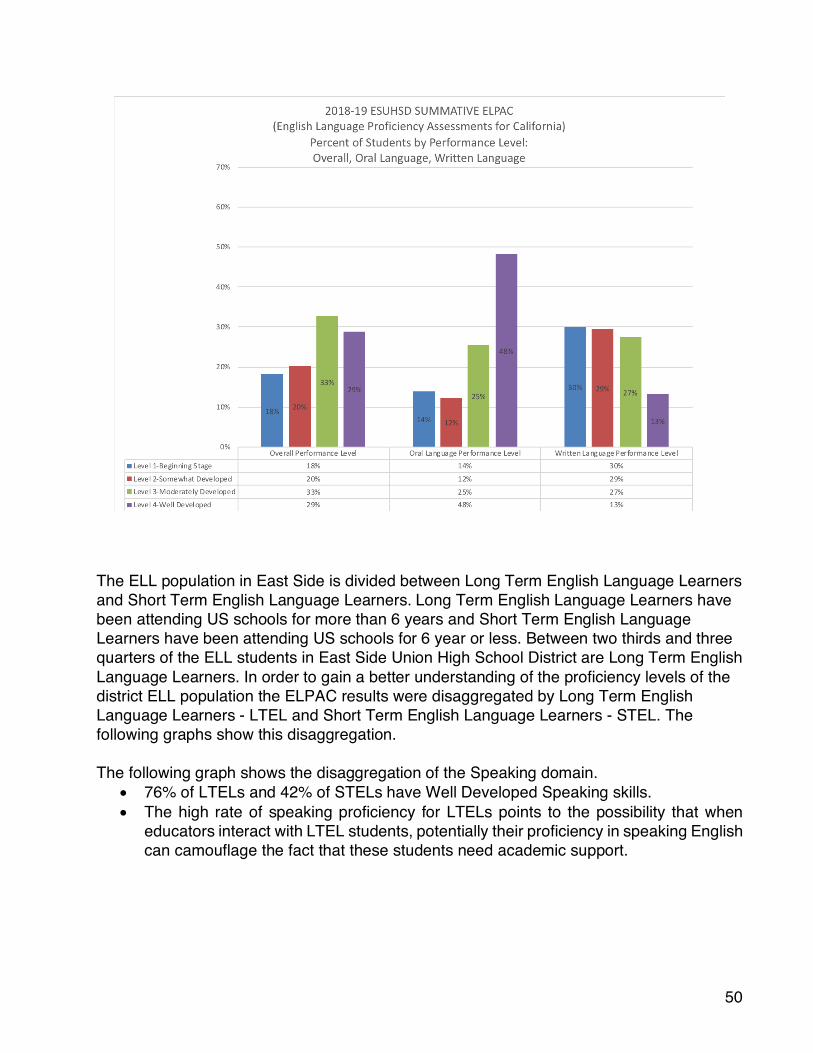
• 29% of ELL students scored Well Developed in overall performance on the ELPAC in 2017-18.
• 48% of ELL students scored Well Developed in overall Oral Language Performance. • 13% of ELL students scored Well Developed in overall Written Language Performance.
50
The ELL population in East Side is divided between Long Term English Language Learners and Short Term English Language Learners. Long Term English Language Learners have been attending US schools for more than 6 years and Short Term English Language Learners have been attending US schools for 6 year or less. Between two thirds and three quarters of the ELL students in East Side Union High School District are Long Term English Language Learners. In order to gain a better understanding of the proficiency levels of the district ELL population the ELPAC results were disaggregated by Long Term English Language Learners - LTEL and Short Term English Language Learners - STEL. The following graphs show this disaggregation. The following graph shows the disaggregation of the Speaking domain.
• 76% of LTELs and 42% of STELs have Well Developed Speaking skills. • The high rate of speaking proficiency for LTELs points to the possibility that when
educators interact with LTEL students, potentially their proficiency in speaking English can camouflage the fact that these students need academic support.

51
The following graph shows how students performed on the Reading domain.
• 16% of LTELs and 12% of STELs show they have Well Developed reading skills. • The data indicate that both LTELs and STELs need classroom academic support to
read and comprehend academic text for learning purposes.

52
The following graphs show both the Listening and Writing domains of the ELPAC.
• 45% of LTELs and 23% of STELs have Well Developed Listening skills. • 29% of LTELs and 18% of STELs have Well Developed Writing skills. • The data implies that LTELs and STELs need academic scaffolding and support to
process and learn from classroom lectures. • LTELs need academic writing support in all content areas.

53

54
LCAP: Percentage of English Language Learners reclassified Each year ELL students are evaluated for reclassification to English Proficient based on state and local board criteria. Students must earn a 4 or 5 on the CELDT, perform comparably to their English Proficient Peers on an English Language Arts exam, and maintain passing grades. The criteria changed when the state testing system moved from the CST - California State Standards Tests to the new CAASPP – California Assessment of Student Performance and Progress. The reclassification criteria will be changing again with the shift from CELT to ELPAC as the English Proficiency exam. The English Language Arts exam under the CSTs was originally used as a mandated criteria for reclassification, and students had to earn a “basic” level to reclassify. With the recent change in state assessments, this criteria is left for districts to define. In the absence of state assessments at the high school level except at grade 11, many districts with high school-aged ELL students are struggling with this criteria. Currently ESUHSD uses the DRP – Degrees of Reading Power - and the ELA/Literacy CAASPP grade 11 exam for this criteria. Statewide, students who are English Language Learners struggle to reclassify if they have not done so prior to grade 5. The chart below shows the district reclassification rate of English Language Learners for the past 4 years.
• 4.7% of ELL students were reclassified in 2017. The district reclassification rate has varied over the last several years as the district has struggled to determine cut points on local exams that ensure students are able to reclassify and at the same time ensure academic success for these students in their remaining years of high school.
2013 2014 2015 2016 2017
* Revised
4.7%
ESUHSDPercentage of English Language Learners Reclassified
Percentage of EL Students Reclassified 13.9% 6.4% 13.6% *16.3%

55
LCAP Goal 4: Decrease Suspensions: Establish and sustain healthy school cultures through relationship-centered practices to keep students engaged in their learning environment. Metrics: LCAP & KPM: Suspension Rate Due to changes in the timelines for the release of publicly available data and the fall release of the California accountability dashboard there is no new data to report on discipline at this time. When the data becomes public it will be added to this document. LCAP Goal 5: Attendance – Chronic Absenteeism: Engage with and connect students and families to appropriate staff, supports, and programmatic alternatives to increase student attendance in school. Metrics: LCAP: Percentage of students chronically absent The California State Dashboard has plans to use a new metric showing students chronically absent. Students are considered chronically absent if they have missed 10% or more days that they have been enrolled in the district. The state data system collected this information for the first time for the 2016-17 school year and continues to work at incorporating this metric into the accountability system. The following table shows the percentage and number of students chronically absent in 2017-18 disaggregated by subgroup.
• 3334 students in the district were chronically absent, which is 13.95% of the student population.
• African American and Hispanic subgroups have a higher percentage of students chronically absent than the district average.

56
College Attendance The ESUHSD contracts with the National Student Clearing House (NSCH), which is an organization that provides information on college enrollment, college persistence, and degrees awarded. There are 3,600 colleges and universities nationwide that participate in the program, and nationally about 98% of students enrolling in post secondary institutions enroll in these schools. The types of schools participating in NSCH are 4 and 2-year public colleges and universities, private 4-year universities, and private 2-year vocational schools. The following charts show data for students in the class of 2011, 2012, 2013, 2014, 2015, 2016, and 2017. Data for the class of 2018 will be available in the winter. The graph below shows college enrollment immediately following graduation, enrollment any time within the first two years, as well as the percent of students enrolling in 2 and 4-year institutions.
• For the class of 2017, 74% of graduates enrolled in college in the fall immediately after high school; this increased to 80% for enrollment at any time during the first year.
• 43% of graduates enrolled in 2-year schools and 31% of graduates enrolled in 4-year schools. 76% of graduates enrolled in public institutions.
• Enrollment 2 years after graduation increases for graduates. • 84% of graduates in the class of 2016 had enrolled in college at some point within 2
years after graduation from high school.
Subgroup % of Students # of StudentsAm Indian/Alskn Nat 39.0% 23Asian 4.6% 400Black/African Am 22.5% 140Filipino 7.7% 145Hispanic 21.8% 2336Multiple 13.1% 61Nat Hwiin/Othr Pac Islndr 18.7% 26White 15.4% 203Socioeconomically Disadvantaged 18.0% 2409English Language Learners 18.9% 779Grand Total 13.95% 3334* SWD is not available at this time
ESUHSD2017-18
Percent of Students Chronically Absent

57

58
The previous graph shows college enrollment at any time during the first year after high school graduation and enrollment at any time during the first two years after graduation disaggregated by ethnicity for the class of 2016. Enrollment in college continues to increase each year for two years after graduation.
• 71.1 % of African American graduates of the class of 2016 enrolled in college the fall after graduation. This rate increases to 74% enrolled any time during the first year, and again increases to 83.8% enrolled any time in the first two years.
• 63.5 % of Hispanic graduates of the class of 2016 enrolled in college the fall after graduation. This rate increases to 68.4% enrolled any time during the first year, and again increases to 77.3% enrolled any time in the first two years.
• 87.5 % of Asian graduates of the class of 2016 enrolled in college the fall after graduation. This rate increases to 89.4% enrolled any time during the first year, and again increases to 93.5% enrolled any time in the first two years.
The following graph shows college enrollment at any time during the first year after high school graduation and enrollment at any time during the first two years after graduation disaggregated by special populations for the class of 2016.
• 81.3% of Female graduates of the class of 2016 enrolled in college the fall after graduation. This rate increases to 84.8% enrolled any time during the first year, and again increases to 87.9% enrolled any time in the first two years.

59
• 76.3% of Male graduates of the class of 2016 enrolled in college the fall after graduation. This rate increases to 78% enrolled any time during the first year, and again increases to 82% enrolled any time in the first two years.
• 81.9% of Socioeconomically Disadvantaged graduates enrolled in college within the first two years of graduation whereas 89.2% of non- Socioeconomically Disadvantaged graduates enrolled in college within the first two years of graduation.
• 72.6% of English Language Learner graduates enrolled in college within the first two years of graduation whereas 85.8% of non-English Language Learner graduates enrolled in college within the first two years of graduation.
• 50.9% of Students With Disabilities graduates enrolled in the fall post-graduation, which increased to 67.6% enrolled within two years post-graduation.
The freshman to sophomore persistence rate is not available yet for the class of 2016. When it becomes available it will be added to this report. The following graph shows the percent of graduates who obtained a degree within 6 years of graduation.
• 41.7% of graduates in the class of 2011 and 42.5% of graduates in the class of 2012 obtained a degree within 6 years of graduation.

60
• 33.7% of African American graduates of the class of 2012 obtained a degree within 6 years of graduation.
• 23.1% of Hispanic graduates of the class of 2012 obtained a degree within 6 years of graduation.
• 58.4% of Asian graduates of the class of 2012 obtained a degree within 6 years of graduation.
The National Student Clearing House provides cumulative enrollment numbers for the top colleges and universities district graduates attend. The top 5 colleges and universities East Side graduates attend are: Two-year schools 1. De Anza College 2. Evergreen Valley College 3. San Jose City College 4. West Valley College 5. Mission College
Four-year schools

61
1. San Jose State University 2. UC Davis 3. UC Santa Cruz 4. San Francisco State University 5. UC Berkeley
Conclusions and Steps Forward: The district has shown improvement in graduation rates, dropout rates, as well as UC/CSU A-G course completion rates over several years. However the district shows disproportionalities in student outcomes for subgroups of students. The district graduates Hispanic and African American students at lower rates than Asian students and exits Hispanic and African American students having complete UC/CSU A-G course work at lower rates than Asian students. Furthermore, English Language Learners, Students With Disabilities, and Socioeconomically Disadvantaged student subgroups graduate at lower rates than the district average, have higher dropout rates than the district average, and complete A-G course work at a lower rate than the district average. Students who attend district schools all 4 years have high graduation rates and higher A-G completion rates than students who move into the district sometime during high school. All 3 of these metrics come at the end of 4 years of high school. In order to be able help more students achieve college and career status at the end of high school, metrics such as “on track for graduation” have been created. The on track data show that the same groups of student with lower graduation rates are less likely to be on track to graduate beginning at grade 9. Work Moving Forward As a district East Side is committed to building capacity amongst all staff members to ensure that equity and inclusion are essential principles of our school system.
Specifically, we will build capacity to attain equitable ESUHSD communities where: • ALL students are welcomed as they are • Strengths and areas of growth for all students are known and supported • Adults positively respond to the social-emotional, wellness, and academic needs of
every student • ALL students are provided tasks that demand production through and beyond DOK
3 so that they can communicate like a scientist, mathematician, historian, artist, literary critic, and more.

62
In order to actualize these outcomes all staff will attend implicit bias training during the 2018-19 school year which will assist sites in their work on building healthy school cultures and equitable school communities. Sites will continue to use student, teacher, and parent perception surveys to target areas of student school connectedness and academic resilience. As a whole system, the district is aligning policies and staff actions with regards to student behavior to ensure all students are welcomed and disciplinary actions are equitable and fair for all students. The district will continue its work centered around on track for graduation for grade 9, positive school cultures, academic success and English proficiency for English Language Learners, and success for late enrollees. Early warning reports linking marking period grades, behavior, and attendance are being used by site leadership teams to develop intervention strategies to support students surfaced by these reports to increase the percentage of students on track for graduation. The district will work to align resources to support credit recovery in key content areas to bring students back on track for graduation and UC/CSU A-G course completion. Teams are building tools that link students’ English proficiency levels with academic lesson supports to help teachers build instruction to support the success of ELL students in their classes. All of these tools will be used by the district-wide multi-tiered system of support MTSS teams to ensure students receive the intervention needed to achieve success in high school. A district committee, with representatives from sites in key job areas, is working toward creating a set of policies, processes, and standards for ensuring students who transfer into our district receive their academic credits from prior schools, are scheduled into the correct courses, and know how to access school supports. A custom early warning system report has been created for sites to use that automatically and continuously updates with current students who have and are enrolling throughout the year so that these students get the services they need. The district has made strides increasing graduation rates, UC/CSU A-G rates, and lowering dropout rates. With new tools to target students for intervention and support classroom instruction, the hope is to make new strides to ensure a greater number of students exiting high school are college and career ready.