lava butte wildlife crossing effectiveness - final …...in their final report (bliss-ketchum and...
TRANSCRIPT
LAVA BUTTE WILDLIFE CROSSING EFFECTIVENESS
Final Report
2015-2017
Prepared for:
Cidney Bowman Oregon Department of Transportation
63055 North Highway 97 Bend, Oregon 97703
Prepared by:
Joel Thompson, Brian Moser, and Leigh Ann Starcevich Western EcoSystems Technology, Inc.
2725 Northwest Walnut Boulevard Corvallis, Oregon 97330
November 6, 2018
Lava Butte Wildlife Crossing Final Report
WEST, Inc. i November 2018
TABLE OF CONTENTS
1 Introduction .................................................................................................................... 1
2 Study Area ..................................................................................................................... 3
3 methods ......................................................................................................................... 3
3.1 Crossing Use .............................................................................................................. 3
3.2 Deer-Vehicle Collisions............................................................................................... 5
4 Results and discussion ................................................................................................... 6
4.1 Crossing Use .............................................................................................................. 6
4.1.1 General Wildlife ...................................................................................................... 6
4.1.2 Mule Deer and Elk .................................................................................................. 7
4.2 Deer and Elk Vehicle Collisions .................................................................................12
5 SUMMARY AND CONCLUSIONS .................................................................................17
6 REFERENCES ..............................................................................................................18
LIST OF TABLES
Table 4.1. Total number of photos analyzed per camera and mule deer detection and use
data. ............................................................................................................................... 8
Table 4.2. Total number of detections from previous monitoring efforts (Overall Detections
2012- 2014) and a breakdown of 2015-2017 species detections by structure. ................ 9
Table 4.3. Structure use data on trigger events from mule deer at jump-outs and fence-
ends. Triggers were categorized as crossing or travelling along a structure.
Structure crossing was further broken down to determine directionality of crossing
and travelling along structure was broken down to indicate whether the deer was on
the outside (forest side) or inside (road side) of the exclusion fence. .............................10
Lava Butte Wildlife Crossing Final Report
WEST, Inc. ii November 2018
LIST OF FIGURES
Figure 1.1. Lava Butte study area vicinity map. .......................................................................... 2
Figure 2.1. Location of wildlife crossing structures and exclusion fence ends along US
Route 97 between Sunriver and Lava Butte, Deschutes County, Oregon. ...................... 4
Figure 4.1. South end of exclusion fence as it crosses northbound onramp from South
Century Drive and abuts the overpass abutment under U.S. Route 97. .........................11
Figure 4.2. Deer and elk vehicle collisions in and around the Lava Butte wildlife crossings
study area from 2006 through 2017. ..............................................................................13
Figure 4.3. Deer and elk vehicle collisions over time in the 12-mile long Lava Butte Study
Area, Deschutes County, Oregon. .................................................................................14
Figure 4.4. Average Annual Daily Traffic (AADT) from mileposts 143.46 to 153.08 on U.S.
Route 97, Deschutes County, Oregon and Upper Deschutes District mule deer
population estimates from 2006 to 2017. AADT were divided by 10 for scaling
purposes. ......................................................................................................................15
Figure 4.5. Deer-vehicle collisions (DVC) per mile per car by year, period (before or after),
and stretch (control or fenced), Deschutes County, Oregon, 2006-2016. .......................15
Figure 4.6. Deer-vehicle collisions per mile per car by year, period (before or after), and
stretch (control, edge, or fenced), Deschutes County, Oregon, 2006-2016. ...................16
LIST OF APPENDICES
Appendix A: Views from remote cameras at wildlife crossing structures along U.S. Route 97
between milepost 149 to MP 153 from Lava butte to South Century Drive.
Lava Butte Wildlife Crossing Final Report
WEST, Inc. 1 November 2018
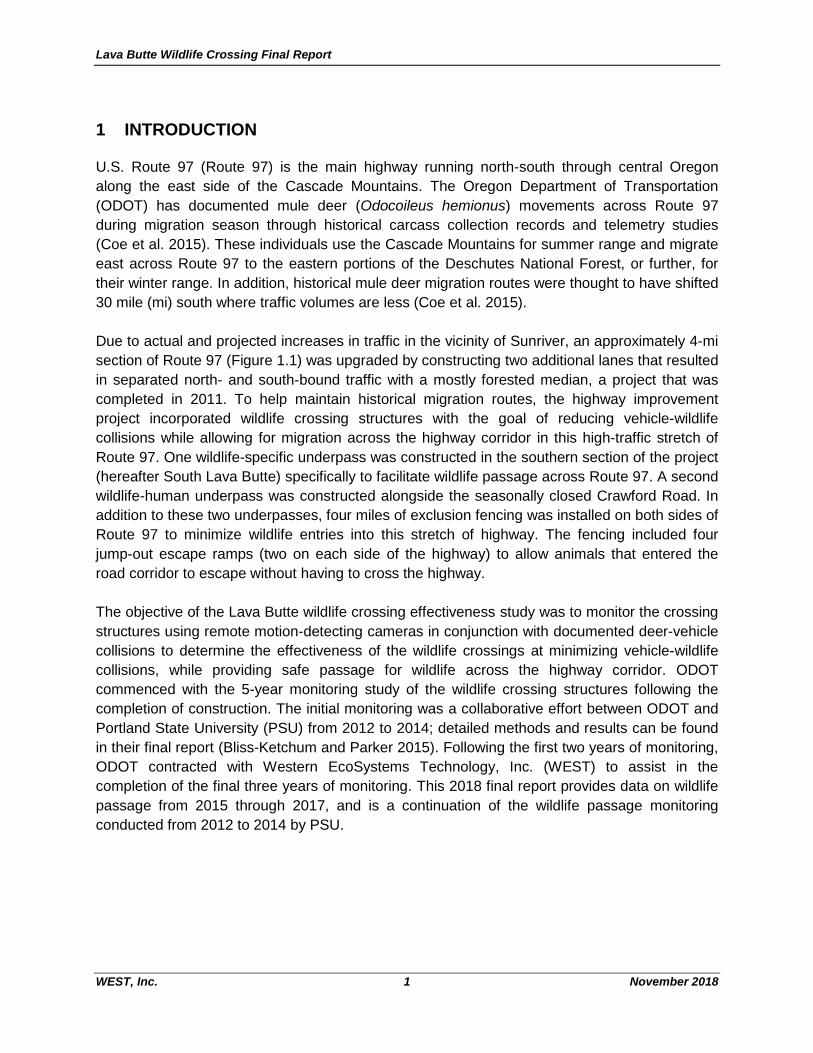
1 INTRODUCTION
U.S. Route 97 (Route 97) is the main highway running north-south through central Oregon
along the east side of the Cascade Mountains. The Oregon Department of Transportation
(ODOT) has documented mule deer (Odocoileus hemionus) movements across Route 97
during migration season through historical carcass collection records and telemetry studies
(Coe et al. 2015). These individuals use the Cascade Mountains for summer range and migrate
east across Route 97 to the eastern portions of the Deschutes National Forest, or further, for
their winter range. In addition, historical mule deer migration routes were thought to have shifted
30 mile (mi) south where traffic volumes are less (Coe et al. 2015).
Due to actual and projected increases in traffic in the vicinity of Sunriver, an approximately 4-mi
section of Route 97 (Figure 1.1) was upgraded by constructing two additional lanes that resulted
in separated north- and south-bound traffic with a mostly forested median, a project that was
completed in 2011. To help maintain historical migration routes, the highway improvement
project incorporated wildlife crossing structures with the goal of reducing vehicle-wildlife
collisions while allowing for migration across the highway corridor in this high-traffic stretch of
Route 97. One wildlife-specific underpass was constructed in the southern section of the project
(hereafter South Lava Butte) specifically to facilitate wildlife passage across Route 97. A second
wildlife-human underpass was constructed alongside the seasonally closed Crawford Road. In
addition to these two underpasses, four miles of exclusion fencing was installed on both sides of
Route 97 to minimize wildlife entries into this stretch of highway. The fencing included four
jump-out escape ramps (two on each side of the highway) to allow animals that entered the
road corridor to escape without having to cross the highway.
The objective of the Lava Butte wildlife crossing effectiveness study was to monitor the crossing
structures using remote motion-detecting cameras in conjunction with documented deer-vehicle
collisions to determine the effectiveness of the wildlife crossings at minimizing vehicle-wildlife
collisions, while providing safe passage for wildlife across the highway corridor. ODOT
commenced with the 5-year monitoring study of the wildlife crossing structures following the
completion of construction. The initial monitoring was a collaborative effort between ODOT and
Portland State University (PSU) from 2012 to 2014; detailed methods and results can be found
in their final report (Bliss-Ketchum and Parker 2015). Following the first two years of monitoring,
ODOT contracted with Western EcoSystems Technology, Inc. (WEST) to assist in the
completion of the final three years of monitoring. This 2018 final report provides data on wildlife
passage from 2015 through 2017, and is a continuation of the wildlife passage monitoring
conducted from 2012 to 2014 by PSU.
Lava Butte Wildlife Crossing Final Report
WEST, Inc. 2 November 2018
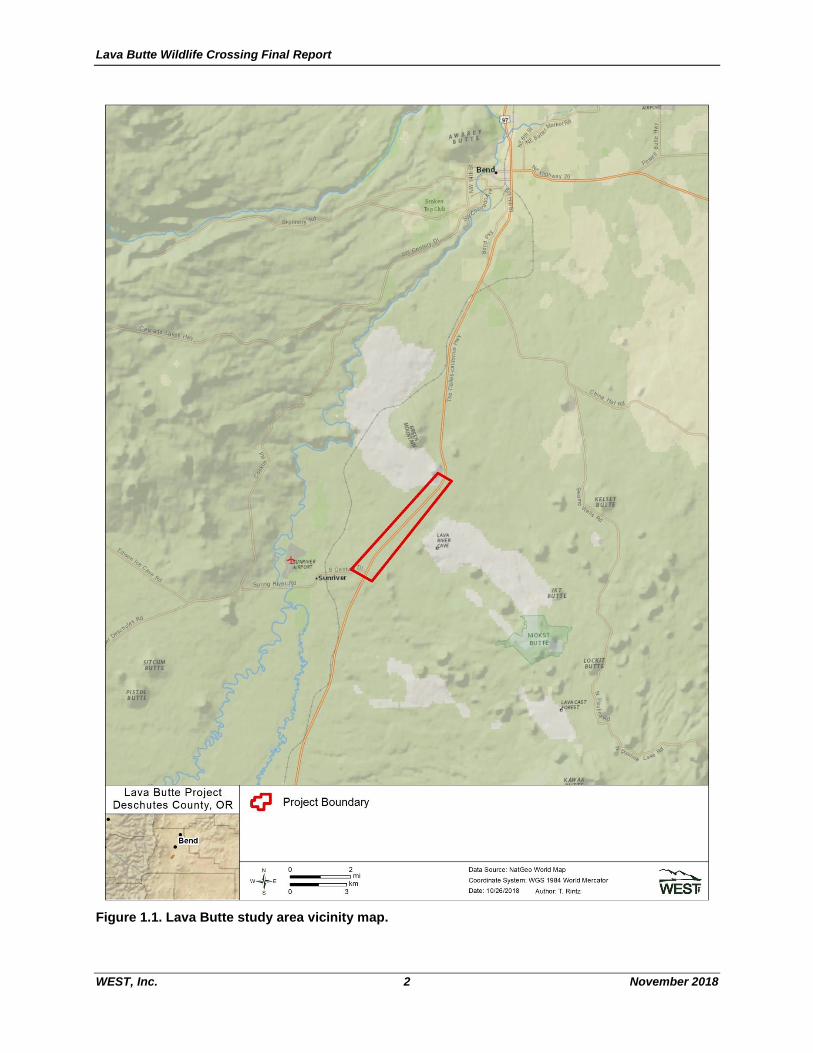
Figure 1.1. Lava Butte study area vicinity map.
Lava Butte Wildlife Crossing Final Report
WEST, Inc. 3 November 2018
2 STUDY AREA
The study area is located along Route 97 in the Deschutes National Forest, approximately 15 mi
south of Bend, Oregon and immediately east of Sunriver, Oregon (Figure 1.1). More specifically,
the north end of the fenced project area is located near Lava Butte within the Newberry National
Volcanic Monument at milepost (MP) 149.3, and the south end of the fenced project area at MP
153.08, where it encompasses the South Century Drive exit to Sunriver (Figures 1.1 - 2.1). For
purposes of a before-after control-impact (BACI) analysis (Green and Green 1979), we defined
the 12-mi stretch of Route 97 from MP 143 – 155 as the Study Area. Within this 12-mi Study
Area, the fenced treatment area was defined as the area between MP 149.3 and 153.08, while
the sections from MP 143.0 – 149.3 and 153.09 – 155.0 were defined as the control area
because they were outside the bounds of the fenced area and contained data on average
annual daily traffic (AADT) consistent with the treatment area.
3 METHODS
3.1 Crossing Use
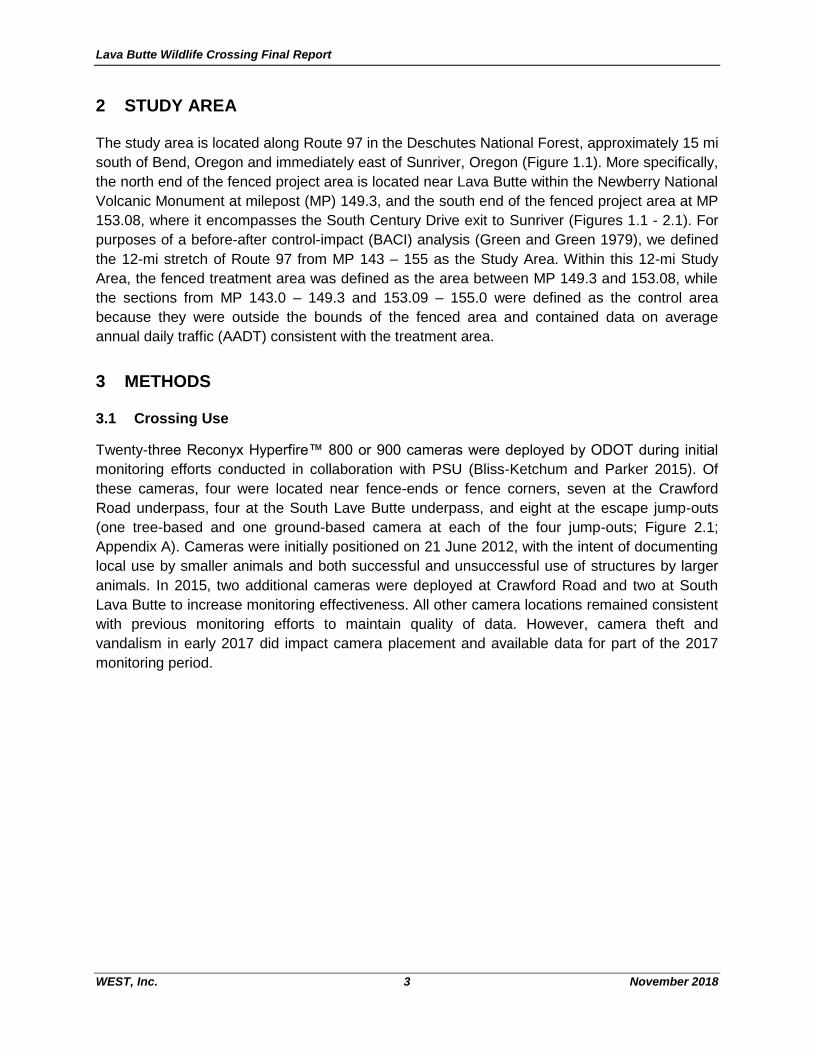
Twenty-three Reconyx Hyperfire™ 800 or 900 cameras were deployed by ODOT during initial
monitoring efforts conducted in collaboration with PSU (Bliss-Ketchum and Parker 2015). Of
these cameras, four were located near fence-ends or fence corners, seven at the Crawford
Road underpass, four at the South Lave Butte underpass, and eight at the escape jump-outs
(one tree-based and one ground-based camera at each of the four jump-outs; Figure 2.1;
Appendix A). Cameras were initially positioned on 21 June 2012, with the intent of documenting
local use by smaller animals and both successful and unsuccessful use of structures by larger
animals. In 2015, two additional cameras were deployed at Crawford Road and two at South
Lava Butte to increase monitoring effectiveness. All other camera locations remained consistent
with previous monitoring efforts to maintain quality of data. However, camera theft and
vandalism in early 2017 did impact camera placement and available data for part of the 2017
monitoring period.
Lava Butte Wildlife Crossing Final Report
WEST, Inc. 4 November 2018
Figure 2.1. Location of wildlife crossing structures and exclusion fence ends along US Route 97
between Sunriver and Lava Butte, Deschutes County, Oregon.
Lava Butte Wildlife Crossing Final Report
WEST, Inc. 5 November 2018
Cameras were scheduled to be checked by an ODOT intern every other week, while WEST was
tasked with managing the data once collected by ODOT. Secure Digital (SD) cards in cameras
were collected, downloaded to ODOT hard drives, and later delivered to WEST for data
management and analysis. Photos for each camera were logged into a database and uploaded
into MapView Professional™ (Reconyx, Holmen, WI) for review and tagging. Each camera was
set to take 1-3 pictures with each motion-activated trigger (each sequence of pictures from a
single trigger are hereafter referred to as an event). The first photo from each event was tagged
with species identification and structure use data (where applicable). Multiple triggers occurring
from the same animal(s) were marked as ‘same as previous’ to indicate their association with an
already identified event and are hereafter referred to as the series. Trigger events or series
occurring within 15 minutes were presumed to be part of the same series (Bliss-Ketchum and
Parker 2015), unless triggering events were explicitly distinct from one another (e.g., doe and
fawn vs. two bucks). This saved time in photo tagging while minimizing duplicate counts of
individuals from multiple events. It is important to note that the numbers of detections reported
are not a count of the number of individual animals using the structures, but an index of use.
Due to differences in camera placement relative to the structures and trigger sensitivity among
the cameras, we were not always able to confirm whether an individual crossed successfully
from one side of the structure to the other. Instead, we report a count of detections for each
camera to compare structure use by side, as opposed to an estimated number of wildlife
crossings. Only pictures of animals positively identified to species were tagged, which resulted
in some events being classified as undetermined. For fence-end and tree-based cameras at the
jump-outs, we collected additional information relative to use of the structure including direction
of travel (i.e., forest side vs. road side) and crossing direction (i.e., forest to road or road to
forest) where the movement past the structure was verified through photos in each event or
series. To be conservative, only series of photos depicting the entire movement through the
structure were tagged as successful. All other photos were tagged as undetermined.
3.2 Deer-Vehicle Collisions
Data on traffic use from MP 143.46 to 153.08 were obtained from ODOT for the years 2006 to
2016. Data from this stretch of highway was used because it was consistently collected over
most of study duration (except 2017 when traffic data were not yet available), contained the
fenced treatment area and most of the control area, and was assumed to be representative of
the entire stretch under study. Wildlife-vehicle collision data were obtained from ODOT for years
2006 to 2017 and deer population estimates for the Upper Deschutes district were obtained
from the Oregon Department of Fish and Wildlife for the years 2006 to 2017. Data from the
Upper Deschutes district were chosen because this district contains a migratory herd of mule
deer that commonly crosses Route 97 while migrating to and from winter ranges to the east in
the Paulina district (Coe et al. 2015). These data were analyzed to determine how effective the
wildlife crossings were on reducing deer-vehicle collisions (DVC) and what (if any) relationships
might occur between deer populations, average annual daily traffic (AADT), and DVC.
Collision rates were calculated by stretch, period, and year, adding zeros for levels where no
roadkill were observed with the exception of 2007, for which no data were provided and were
Lava Butte Wildlife Crossing Final Report
WEST, Inc. 6 November 2018
assumed missing. We assumed that the proportion of any missed collisions was constant over
time. The lengths of each stretch in the study differed so density measurements (animals per
mi) were obtained by dividing the number of collisions in each stretch by the length of the
stretch. To account for the number of cars using the road each year, a second density estimate
(animals per mile per car) was calculated as a standardized index of collision magnitude.
Covariate data such as AADT and deer population size were transformed as appropriate so that
they scaled appropriately with other data for visual presentation.
Linear models were constructed to account for a BACI design (Green and Green 1979) to
examine relationships between DVC in fenced (i.e., treatment) and control areas before (2006-
2011) and after (2012-2017) construction was completed, and whether traffic numbers
influenced DVC. These models included main effects for stretch (e.g., fenced or control) and
period (before or after construction) as well as an interaction term. Using this approach, a
significant interaction effect between the stretch and the period would indicate a significant
effect in the fenced treatment in the period after construction. Several models were examined,
including those incorporating the two density outcomes of interest described above for deer/elk
and for deer (DVC) only. Log transformations and random effects for year were considered but
not needed. All statistical analyses were conducted using R (R Core Team 2013) and Statistix
(Analytical Software 2013).
4 RESULTS AND DISCUSSION
4.1 Crossing Use
4.1.1 General Wildlife
From 2015 to 2017, 174,128 photos were made available to WEST and were analyzed to
evaluate the use of wildlife crossing structures within the Study Area (Tables 4.1 – 4.3). These
photo counts are lower than the actual number of photos taken and actual crossings because
not all photos were available for analysis and data gaps existed among cameras throughout the
monitoring period for various reasons (e.g., ODOT intern availability, dead batteries, camera
vandalism).
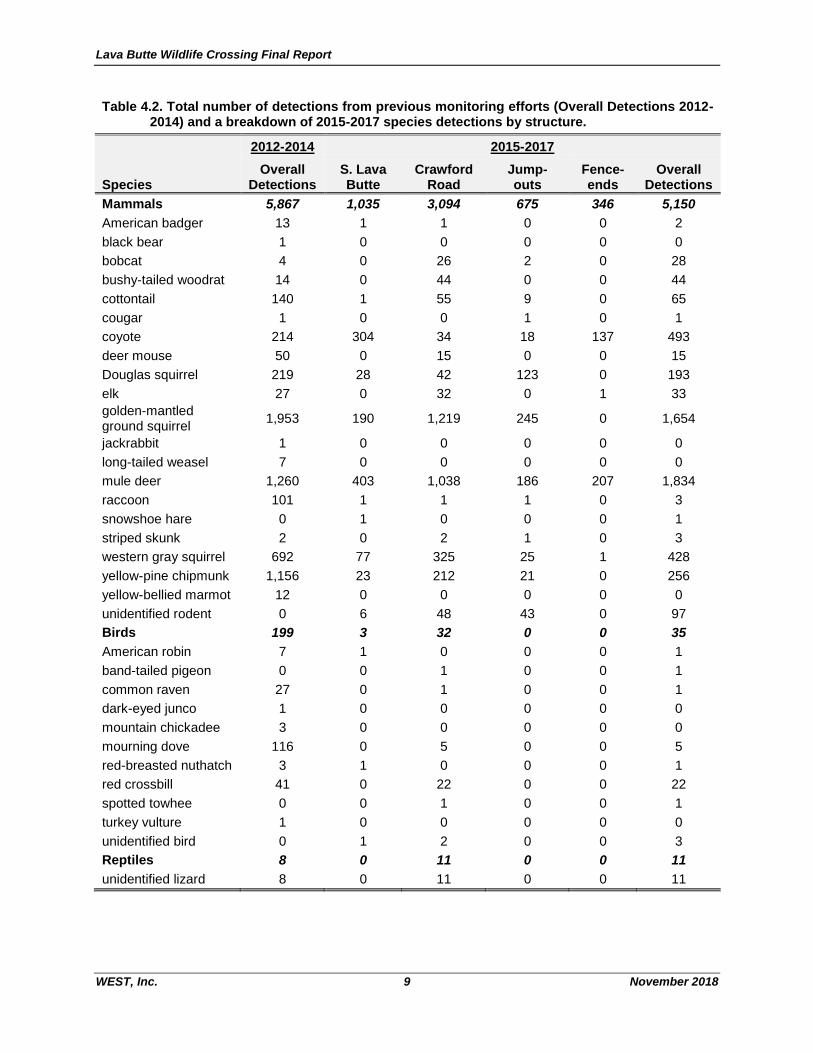
Based on the 174,128 photos analyzed, 15 mammal species, seven bird species, and 11
unidentified lizards were documented during the 2015 to 2017 monitoring period (Table 4.2). In
comparison, Bliss-Ketchum and Parker (2015) documented 19 mammal species, eight bird
species, and eight unidentified lizards during the 2012 to 2014 monitoring period. Neither the
2012 to 2014 nor the 2015 to 2017 data were able to identify reptile detections to species. From
the 2015-2017 dataset, 3,094 mammal detections, 32 bird detections, and 11 reptile detections
were documented at the Crawford Road underpass (Table 4.2). The South Lava Butte
underpass had 1,035 mammal detections and three bird detections (Table 4.2). The jump-outs
had 675 mammal detections, and the fence-ends had 346 mammal detections (Table 4.2). The
majority of all wildlife detections at Crawford Road were triggered by small mammal species
(e.g., golden-mantled ground squirrel [Callospermophilus lateralis]) that use the structure as
habitat, and not necessarily as a movement corridor. Although small mammals accounted for a
Lava Butte Wildlife Crossing Final Report
WEST, Inc. 7 November 2018
majority of detections at Crawford Road, mule deer were consistently detected using the
Crawford Road underpass, suggesting that the underpass is successfully being used by mule
deer. Wildlife detections at South Lava Butte were dominated by mule deer, followed by coyotes
(Canis latrans), indicating this structure is also functioning successfully for other large mammal
species. Based on the data (304 detections at South Lava Butte compared to 34 at Crawford
Road), it appears that coyotes may prefer to use the wildlife-specific crossing structure as
opposed to one alongside a road (i.e., Crawford Road). Bobcats (Lynx rufus) were relatively
common at Crawford Road (n = 26), but rarely documented at other locations. The only large
carnivore detected during this study was a cougar (Puma concolor) on the forest side of a jump-
out (Table 4.2; Appendix A3).
4.1.2 Mule Deer and Elk
4.1.2.1 Crossings
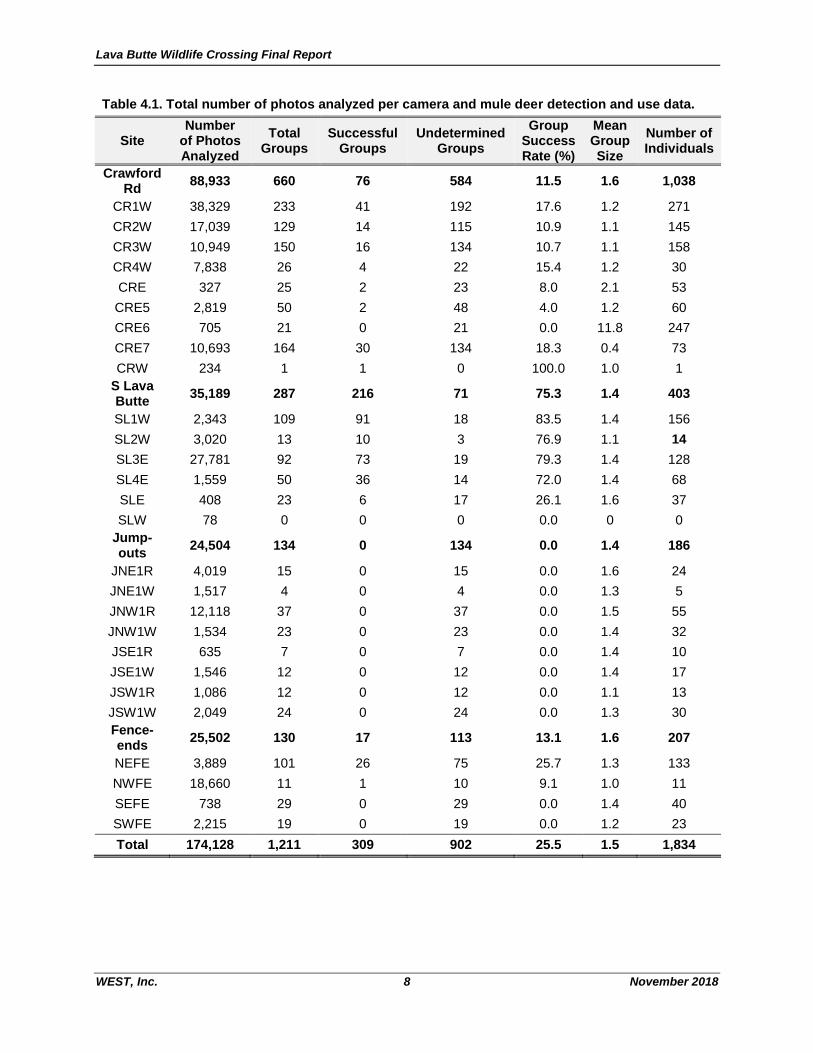
Mule deer were the most commonly detected species from 2015-2017, with 1,834 individuals in
1,211 groups documented (Table 4.1). Mule deer were often detected travelling alone, but the
mean group size across all structures was 1.5 individuals (Table 4.1). There were a limited
number of series where enough pictures of both the approach and exit of mule deer were
captured to evaluate the success of the structures (i.e., animal crossed completely). Crawford
Road had 76 such series that resulted in a minimum 11.5% successful group pass rate and 584
(88.5%) where it was undetermined. South Lava Butte had 216 series that resulted in a
minimum 75.3% successful group pass rate and 71 (24.7%) where it was undetermined (Table
4.1). Successful pass rates were lower than reported in Bliss-Ketchum and Parker (2015) and
Stansbury and Thompson (2016), particularly for Crawford Road. This was likely in part due to
the more conservative approach of classifying success during this phase of the study and the
fact that some of the undetermined passages may have actually been successful but were not
captured on camera.
Based on the evaluation of successful versus undetermined crossing attempts by mule deer, it
appears that the South Lava Butte undercrossing is consistently providing mule deer safe
passage under Route 97. The Crawford Road undercrossing had a much lower confirmed
success rate in the 2015-2017 study period compared to the success rates during 2012 to 2015;
however, it is worth noting that although some deer that approached the crossing structures
were noted as being undetermined, there was no way to determine if these individuals or groups
may have successfully used the crossings on a later attempt. Regardless of the confirmed
success rate, mule deer are using the crossings in relatively large numbers compared to other
wildlife.
Cameras at the Crawford Road crossing also detected 32 elk (Cervus elaphus) in 20 groups
during a period of four days in January 2017. It was undetermined whether any of the groups or
individuals successfully used the crossing. No elk were detected at the South Lava Butte
Crossing.
Lava Butte Wildlife Crossing Final Report
WEST, Inc. 8 November 2018
Table 4.1. Total number of photos analyzed per camera and mule deer detection and use data.
Site Number
of Photos Analyzed
Total Groups
Successful Groups
Undetermined Groups
Group Success Rate (%)
Mean Group Size
Number of Individuals
Crawford Rd
88,933 660 76 584 11.5 1.6 1,038
CR1W 38,329 233 41 192 17.6 1.2 271
CR2W 17,039 129 14 115 10.9 1.1 145
CR3W 10,949 150 16 134 10.7 1.1 158
CR4W 7,838 26 4 22 15.4 1.2 30
CRE 327 25 2 23 8.0 2.1 53
CRE5 2,819 50 2 48 4.0 1.2 60
CRE6 705 21 0 21 0.0 11.8 247
CRE7 10,693 164 30 134 18.3 0.4 73
CRW 234 1 1 0 100.0 1.0 1
S Lava Butte
35,189 287 216 71 75.3 1.4 403
SL1W 2,343 109 91 18 83.5 1.4 156
SL2W 3,020 13 10 3 76.9 1.1 14
SL3E 27,781 92 73 19 79.3 1.4 128
SL4E 1,559 50 36 14 72.0 1.4 68
SLE 408 23 6 17 26.1 1.6 37
SLW 78 0 0 0 0.0 0 0
Jump-outs
24,504 134 0 134 0.0 1.4 186
JNE1R 4,019 15 0 15 0.0 1.6 24
JNE1W 1,517 4 0 4 0.0 1.3 5
JNW1R 12,118 37 0 37 0.0 1.5 55
JNW1W 1,534 23 0 23 0.0 1.4 32
JSE1R 635 7 0 7 0.0 1.4 10
JSE1W 1,546 12 0 12 0.0 1.4 17
JSW1R 1,086 12 0 12 0.0 1.1 13
JSW1W 2,049 24 0 24 0.0 1.3 30
Fence-ends
25,502 130 17 113 13.1 1.6 207
NEFE 3,889 101 26 75 25.7 1.3 133
NWFE 18,660 11 1 10 9.1 1.0 11
SEFE 738 29 0 29 0.0 1.4 40
SWFE 2,215 19 0 19 0.0 1.2 23
Total 174,128 1,211 309 902 25.5 1.5 1,834
Lava Butte Wildlife Crossing Final Report
WEST, Inc. 9 November 2018
Table 4.2. Total number of detections from previous monitoring efforts (Overall Detections 2012- 2014) and a breakdown of 2015-2017 species detections by structure.
Species
2012-2014 2015-2017
Overall Detections
S. LavaButte
Crawford Road
Jump- outs
Fence- ends
Overall Detections
Mammals 5,867 1,035 3,094 675 346 5,150
American badger 13 1 1 0 0 2
black bear 1 0 0 0 0 0
bobcat 4 0 26 2 0 28
bushy-tailed woodrat 14 0 44 0 0 44
cottontail 140 1 55 9 0 65
cougar 1 0 0 1 0 1
coyote 214 304 34 18 137 493
deer mouse 50 0 15 0 0 15
Douglas squirrel 219 28 42 123 0 193
elk 27 0 32 0 1 33
golden-mantled ground squirrel
1,953 190 1,219 245 0 1,654
jackrabbit 1 0 0 0 0 0
long-tailed weasel 7 0 0 0 0 0
mule deer 1,260 403 1,038 186 207 1,834
raccoon 101 1 1 1 0 3
snowshoe hare 0 1 0 0 0 1
striped skunk 2 0 2 1 0 3
western gray squirrel 692 77 325 25 1 428
yellow-pine chipmunk 1,156 23 212 21 0 256
yellow-bellied marmot 12 0 0 0 0 0
unidentified rodent 0 6 48 43 0 97
Birds 199 3 32 0 0 35
American robin 7 1 0 0 0 1
band-tailed pigeon 0 0 1 0 0 1
common raven 27 0 1 0 0 1
dark-eyed junco 1 0 0 0 0 0
mountain chickadee 3 0 0 0 0 0
mourning dove 116 0 5 0 0 5
red-breasted nuthatch 3 1 0 0 0 1
red crossbill 41 0 22 0 0 22
spotted towhee 0 0 1 0 0 1
turkey vulture 1 0 0 0 0 0
unidentified bird 0 1 2 0 0 3
Reptiles 8 0 11 0 0 11
unidentified lizard 8 0 11 0 0 11
Lava Butte Wildlife Crossing Final Report
WEST, Inc. 10 November 2018
4.1.2.2 Jump-outs and Fence-ends
Jump-outs
There were four tree-based and four ground-based cameras at the jump-outs, for which
additional data on structure use were collected. The tree-based jump-out cameras could ideally
capture an event where an individual jumps from the road-side of the fence to the forest-side,
indicating that wildlife were using these structures as intended. The ground-based cameras did
not provide complete information on mule deer use of the jump-outs as they did not provide a
view sufficient to document deer in the road corridor that may not have approached the jump-
out. Given their limited view of the jump-out wall, the ground-based cameras could provide
information on successful use of the jump-outs only if deer actually used them, but could not
document deer approaching the jump-outs on the road side of the fence that did not use the
jump-out. Ultimately the ground based cameras only provided data on mule deer walking past
the jump-out on the forest side of the fence. As such, only the tree-based cameras were used
when analyzing successful use of the jump-outs and deer passage on the road side of the
fence, while ground-based cameras were used to document deer movement on the forest side
of the fence (Table 4.3).
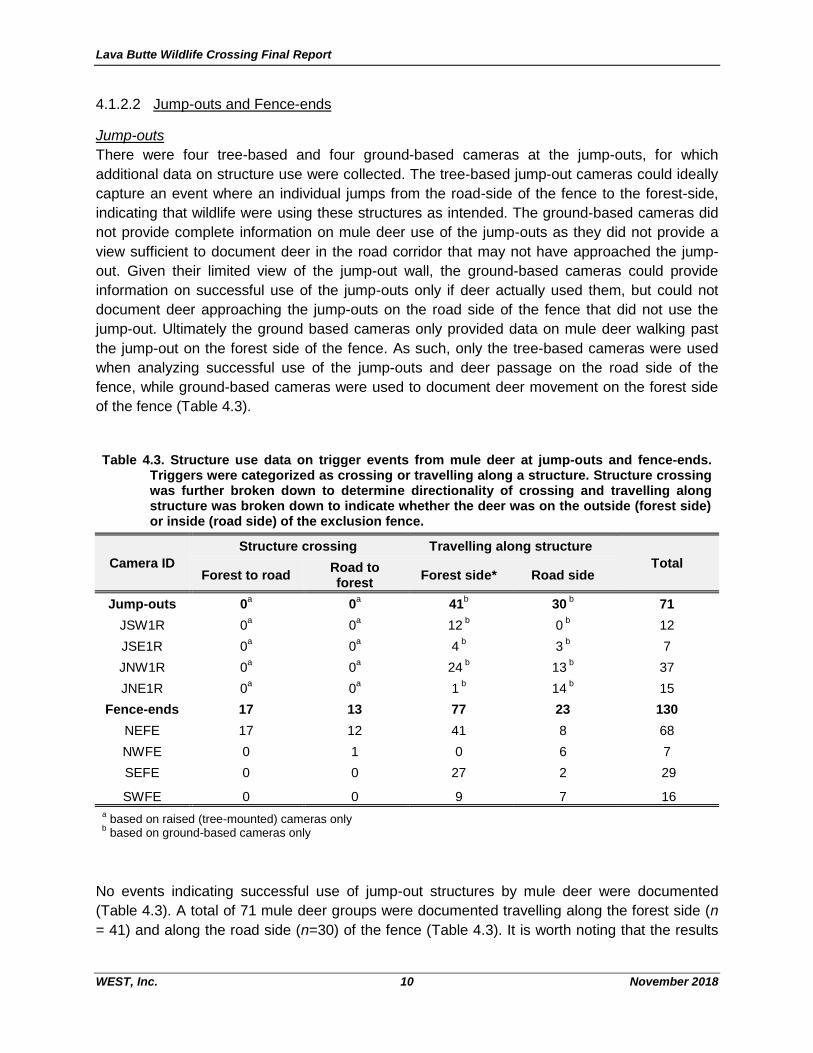
Table 4.3. Structure use data on trigger events from mule deer at jump-outs and fence-ends. Triggers were categorized as crossing or travelling along a structure. Structure crossing was further broken down to determine directionality of crossing and travelling along structure was broken down to indicate whether the deer was on the outside (forest side) or inside (road side) of the exclusion fence.
Camera ID
Structure crossing Travelling along structure
Total Forest to road
Road to forest
Forest side* Road side
Jump-outs 0a
0a
41b
30 b
71
JSW1R 0a
0a
12 b
0 b
12
JSE1R 0a
0a
4 b
3 b
7
JNW1R 0a
0a
24 b
13 b
37
JNE1R 0a
0a
1 b
14 b
15
Fence-ends 17 13 77 23 130
NEFE 17 12 41 8 68
NWFE 0 1 0 6 7
SEFE 0 0 27 2 29
SWFE 0 0 9 7 16
a based on raised (tree-mounted) cameras only
b based on ground-based cameras only
No events indicating successful use of jump-out structures by mule deer were documented
(Table 4.3). A total of 71 mule deer groups were documented travelling along the forest side (n
= 41) and along the road side (n=30) of the fence (Table 4.3). It is worth noting that the results
Lava Butte Wildlife Crossing Final Report
WEST, Inc. 11 November 2018
(i.e., no successful use of jump-outs) should be interpreted with some caution, as large gaps
existed in data for some jump-out cameras, and some successful uses of the jump-outs may
have occurred. However, the very low or lack of use of jump-outs is consistent with that
documented by Bliss-Ketchum and Parker (2015), who reported only 3% successful use of the
jump-outs by mule deer from 2012 to 2014. These data indicate that use of the jump-outs is
likely being hindered for some reason, the most likely of which is jump-out design (e.g.,
structure height too great), as previously noted by Bliss-Ketchum and Parker (2015).
Fence-ends
The north fence-end cameras were positioned at true fence-ends and could capture whether an
individual crossed from one side of the fence to the other (see Appendix A4). The south fence-
end cameras were not on true ends; instead the southwest fence-end camera (SWFE) was
positioned near the farthest southwest corner within the median between the southbound off-
ramp to South Century Drive and Route 97, and the southeast fence-end camera (SEFE) was
positioned along the exclusion fencing just north of the southeast corner on the outside of the
northbound onramp from South Century Drive onto Route 97 (Figure 2.1; Appendix A4). In fact,
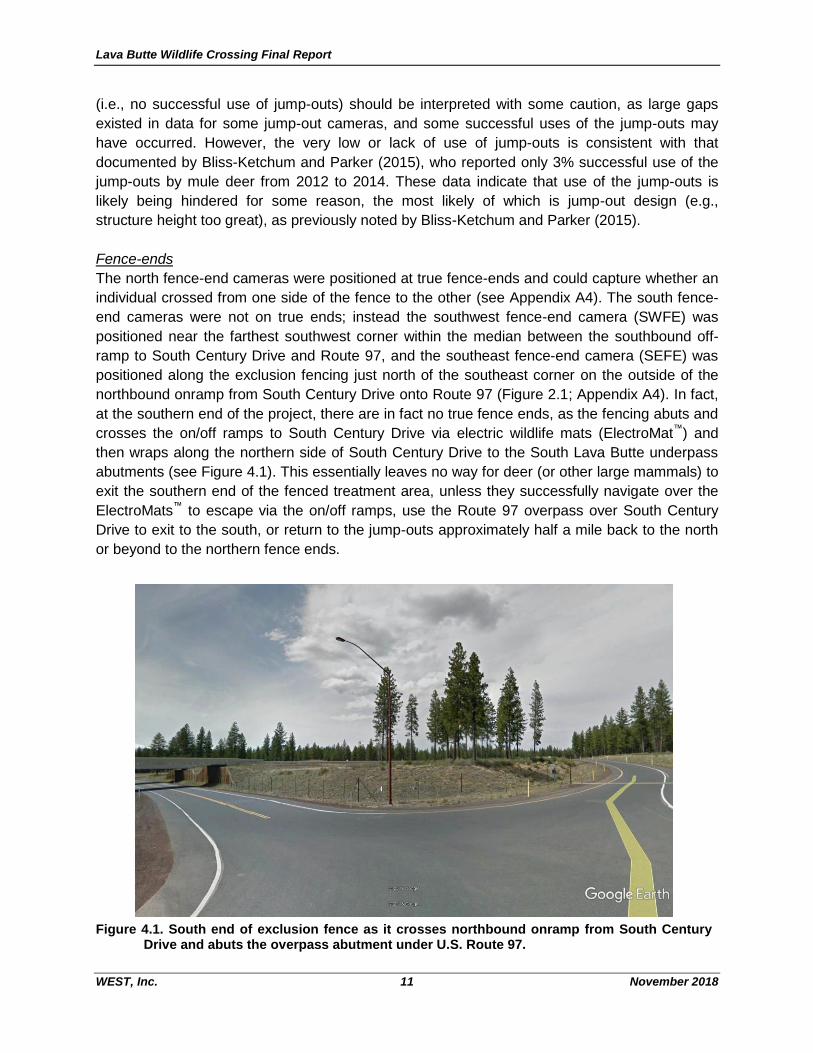
at the southern end of the project, there are in fact no true fence ends, as the fencing abuts and
crosses the on/off ramps to South Century Drive via electric wildlife mats (ElectroMat™) and
then wraps along the northern side of South Century Drive to the South Lava Butte underpass
abutments (see Figure 4.1). This essentially leaves no way for deer (or other large mammals) to
exit the southern end of the fenced treatment area, unless they successfully navigate over the
ElectroMats™ to escape via the on/off ramps, use the Route 97 overpass over South Century
Drive to exit to the south, or return to the jump-outs approximately half a mile back to the north
or beyond to the northern fence ends.
Figure 4.1. South end of exclusion fence as it crosses northbound onramp from South Century Drive and abuts the overpass abutment under U.S. Route 97.
Lava Butte Wildlife Crossing Final Report
WEST, Inc. 12 November 2018
All but one of the 30 mule deer crossing events documented at fence-end cameras occurred at
the northeast fence-end camera (NEFE), with 17 (56.7%) of the crossings being individuals
travelling from the forest-side to the road-side of the exclusion fencing (Table 4.3; Appendix A4).
However, although mule deer actually crossing the fence-end were more often entering the road
corridor than exiting the corridor, the NEFE camera documented more individuals travelling
along the forest-side of the fence than the road-side of the fence, suggesting the majority of
deer are remaining on the forest-side of the fence outside of the roadway. Only one crossing
was detected at the northwest fence-end camera (NWFE; Table 4.3). This fence-end is also the
location of high human-activity with hikers and vehicles actively moving through the area (see
Appendix A4). Additionally, this fence-end terminates next to a large lava flow which likely
further serves as a barrier. This human activity and relative position to the lava flow may deter
deer from crossing at this junction, as would be suggested by the low overall number of deer
detections at this camera. The majority (93%) of trigger events at the SEFE camera were of
mule deer travelling on the forest side of the exclusion fencing whereas the SWFE camera
documented similar occurrences of individuals inside and outside of the fencing (Table 4.3).
This result is not surprising given the position of the cameras relative to roads and off- and on-
ramps for Route 97. The SEFE camera documented the only elk observed at the fence-end
cameras, which was moving south on the inside of the exclusion fence. Unfortunately, it was not
possible to evaluate if this or other individuals on the road-side of the fence were able to exit via
the ElectroMat™ setup across the on/off-ramps on the south end of the project, as there were no
cameras setup to document activity at the ElectroMat™ locations. As noted above, these
animals on the road-side of the fence at the SEFE and SWFE had no clear way to exit the
roadway without returning north to the jump-outs or north fence-ends, crossing the overpass
over South Century Drive, or navigating over the ElectroMat™ to escape via the on/off-ramps.
It should be reiterated that gaps in data existed occasionally and randomly due to non-
functioning cameras and to cameras being vandalized/stolen. Because no formal analysis of the
photo data was conducted, missing data did not likely have a significant influence on the study
results and it is not expected that the missing photos affected the primary goal of evaluating
mule deer/wildlife use of the crossing structures. However, missing data likely affected the
overall species count and may have lowered the chance of detecting less abundant species
such as black bear (Ursus Americana) and cougar.
4.2 Deer and Elk Vehicle Collisions
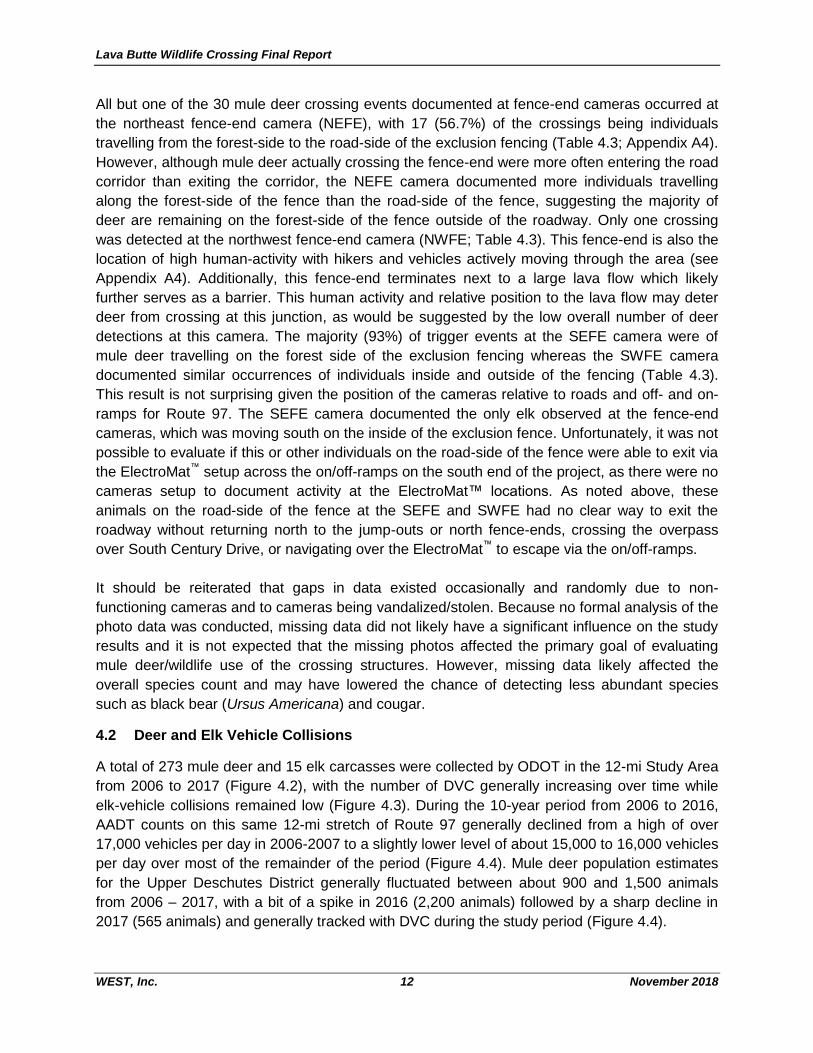
A total of 273 mule deer and 15 elk carcasses were collected by ODOT in the 12-mi Study Area
from 2006 to 2017 (Figure 4.2), with the number of DVC generally increasing over time while
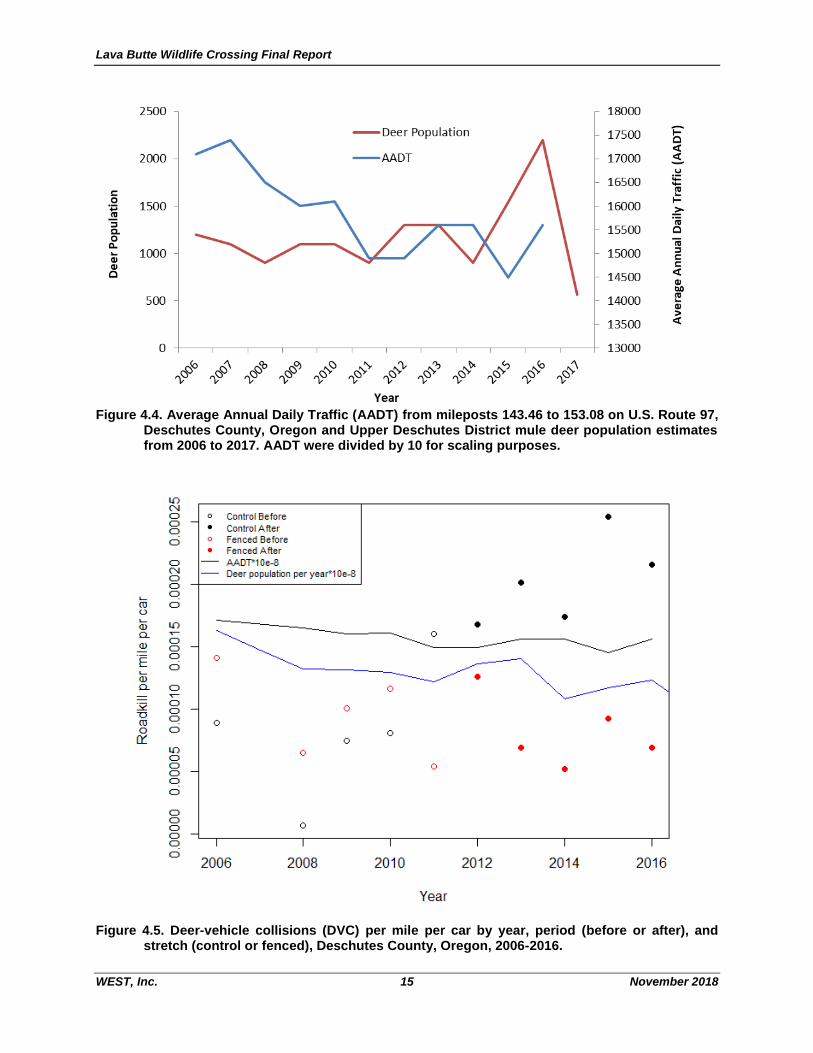
elk-vehicle collisions remained low (Figure 4.3). During the 10-year period from 2006 to 2016,
AADT counts on this same 12-mi stretch of Route 97 generally declined from a high of over
17,000 vehicles per day in 2006-2007 to a slightly lower level of about 15,000 to 16,000 vehicles
per day over most of the remainder of the period (Figure 4.4). Mule deer population estimates
for the Upper Deschutes District generally fluctuated between about 900 and 1,500 animals
from 2006 – 2017, with a bit of a spike in 2016 (2,200 animals) followed by a sharp decline in
2017 (565 animals) and generally tracked with DVC during the study period (Figure 4.4).
Lava Butte Wildlife Crossing Final Report
WEST, Inc. 13 November 2018
Figure 4.2. Deer and elk vehicle collisions in and around the Lava Butte wildlife crossings study
area from 2006 through 2017.
Lava Butte Wildlife Crossing Final Report
WEST, Inc. 14 November 2018
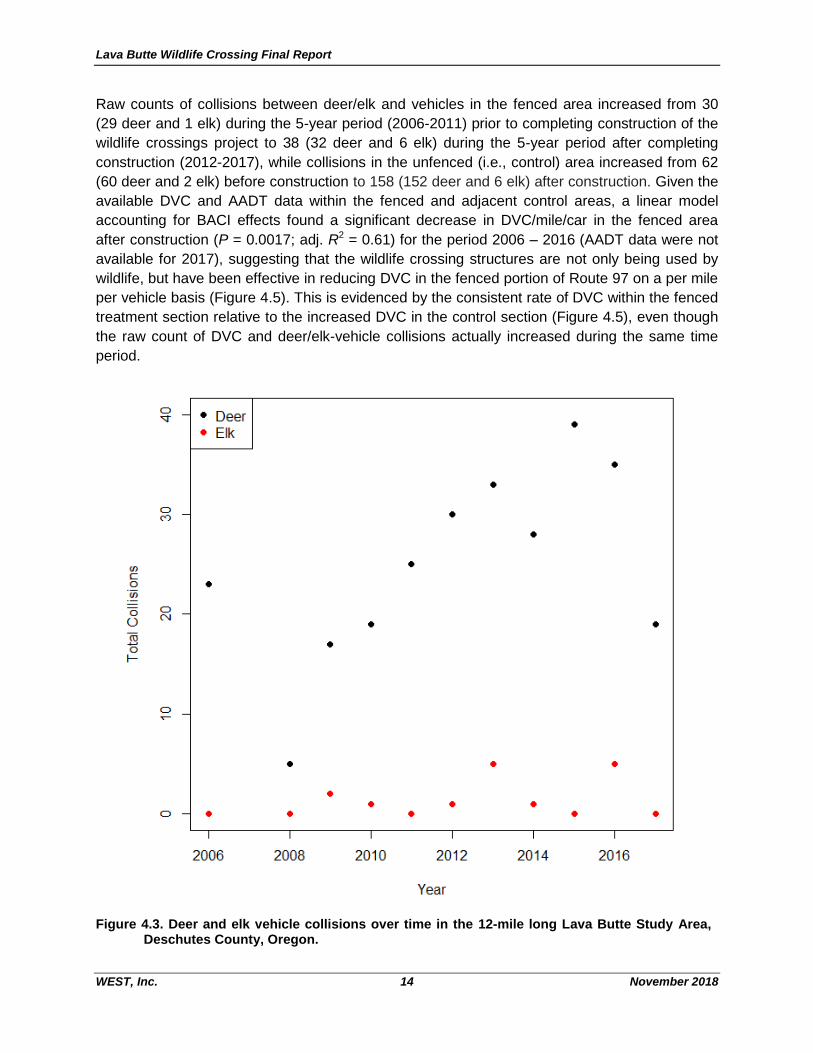
Raw counts of collisions between deer/elk and vehicles in the fenced area increased from 30
(29 deer and 1 elk) during the 5-year period (2006-2011) prior to completing construction of the
wildlife crossings project to 38 (32 deer and 6 elk) during the 5-year period after completing
construction (2012-2017), while collisions in the unfenced (i.e., control) area increased from 62
(60 deer and 2 elk) before construction to 158 (152 deer and 6 elk) after construction. Given the
available DVC and AADT data within the fenced and adjacent control areas, a linear model
accounting for BACI effects found a significant decrease in DVC/mile/car in the fenced area
after construction (P = 0.0017; adj. R2 = 0.61) for the period 2006 – 2016 (AADT data were not
available for 2017), suggesting that the wildlife crossing structures are not only being used by
wildlife, but have been effective in reducing DVC in the fenced portion of Route 97 on a per mile
per vehicle basis (Figure 4.5). This is evidenced by the consistent rate of DVC within the fenced
treatment section relative to the increased DVC in the control section (Figure 4.5), even though
the raw count of DVC and deer/elk-vehicle collisions actually increased during the same time
period.
Figure 4.3. Deer and elk vehicle collisions over time in the 12-mile long Lava Butte Study Area,
Deschutes County, Oregon.
Lava Butte Wildlife Crossing Final Report
WEST, Inc. 15 November 2018
Figure 4.4. Average Annual Daily Traffic (AADT) from mileposts 143.46 to 153.08 on U.S. Route 97,
Deschutes County, Oregon and Upper Deschutes District mule deer population estimates from 2006 to 2017. AADT were divided by 10 for scaling purposes.
Figure 4.5. Deer-vehicle collisions (DVC) per mile per car by year, period (before or after), and
stretch (control or fenced), Deschutes County, Oregon, 2006-2016.
Lava Butte Wildlife Crossing Final Report
WEST, Inc. 16 November 2018
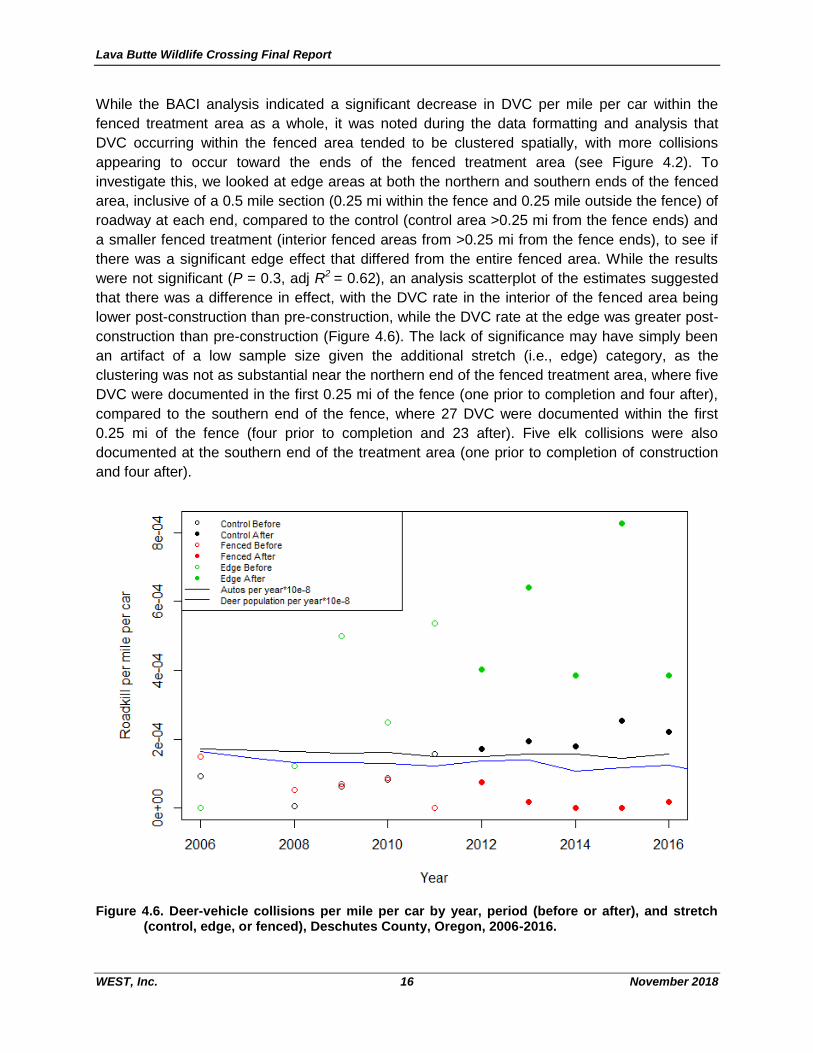
While the BACI analysis indicated a significant decrease in DVC per mile per car within the
fenced treatment area as a whole, it was noted during the data formatting and analysis that
DVC occurring within the fenced area tended to be clustered spatially, with more collisions
appearing to occur toward the ends of the fenced treatment area (see Figure 4.2). To
investigate this, we looked at edge areas at both the northern and southern ends of the fenced
area, inclusive of a 0.5 mile section (0.25 mi within the fence and 0.25 mile outside the fence) of
roadway at each end, compared to the control (control area >0.25 mi from the fence ends) and
a smaller fenced treatment (interior fenced areas from >0.25 mi from the fence ends), to see if
there was a significant edge effect that differed from the entire fenced area. While the results
were not significant (P = 0.3, adj R2 = 0.62), an analysis scatterplot of the estimates suggested
that there was a difference in effect, with the DVC rate in the interior of the fenced area being
lower post-construction than pre-construction, while the DVC rate at the edge was greater post-
construction than pre-construction (Figure 4.6). The lack of significance may have simply been
an artifact of a low sample size given the additional stretch (i.e., edge) category, as the
clustering was not as substantial near the northern end of the fenced treatment area, where five
DVC were documented in the first 0.25 mi of the fence (one prior to completion and four after),
compared to the southern end of the fence, where 27 DVC were documented within the first
0.25 mi of the fence (four prior to completion and 23 after). Five elk collisions were also
documented at the southern end of the treatment area (one prior to completion of construction
and four after).
Figure 4.6. Deer-vehicle collisions per mile per car by year, period (before or after), and stretch
(control, edge, or fenced), Deschutes County, Oregon, 2006-2016.
Lava Butte Wildlife Crossing Final Report
WEST, Inc. 17 November 2018
5 SUMMARY AND CONCLUSIONS
While overall post-construction DVC rates appear to be down within the fenced treatment area
as a whole compared to pre-construction DVC rates, project effectiveness does not appear to
be consistent throughout the fenced treatment area. Data indicate that mule deer (and elk)
routinely get into the roadway, but do not appear to be using the jump-outs to escape. As noted
by Bliss-Ketchum and Parker (2015), it is likely that the jump-outs are too tall and thus not being
used by deer and other mammals. While some of the clustering observed within the fenced area
may be an artifact of ODOT reporting (i.e., carcasses reported to the nearest mile-marker) the
number of carcasses reported at/near the southern fence end seems to suggest an issue with
project design in this area. Although deer are using the wildlife underpasses and are clearly
moving along the fence (both inside and outside), the lack of any exit at the southern end of the
fenced treatment area (i.e., there are no true fence ends) may be creating a zone of increased
collision risk in this area, as evidenced by the substantially higher post-construction DVC count
within the southernmost 0.25 mi of the treatment area. While deer and elk are clearly using the
wildlife underpasses at Crawford Road and South Lava Butte, there is some suggestion that the
fencing and jump-out designs may be contributing to an increase in DVC risk in some areas of
the project (e.g., the southern end).
In conclusion, it appears that the wildlife crossings have provided a means of safe passage for
mule deer and other wildlife that routinely cross Route 97; however, the fence and jump-out
configuration may be limiting the overall effectiveness of the project. While the project has
resulted in a lower DVC over its full length, given the spatial variability observed in DVC since
the fencing and wildlife crossings were constructed, consideration of potential modifications to
the design of jump-outs and fence-ends are recommended. Should any modifications be made,
additional monitoring and analysis to document the effectiveness of modifications would also be
recommended to ensure that the project achieves its full potential of minimizing risk to both
human and animal safety.
Lava Butte Wildlife Crossing Final Report
WEST, Inc. 18 November 2018
6 REFERENCES
Analytical Software. 2013. Statistix 10 User’s Manual. Tallahassee, FL.
Bliss-Ketchum, L., and C. Parker. 2015. Lava Butte wildlife crossing monitoring project. Final report,
Portland State University, Portland, Oregon, USA.
Cleveland, William S., Grosse, Eric., and William M. Shyu, 1992. Local regression models. Chapter 8 In J.
Chambers, and T. Hastie, editors. Statistical Models in S. Wadsworth. Pacific Grove, CA.
Coe, P.K., R.M. Nielson, D.H. Jackson, J.B. Cupples, N.E. Seidel, B.K. Johnson, S.C. Gregory, G.A.
Bjornstrom, A.N. Larkins and D.A. Speten. 2015. Identifying migration corridors of mule deer
threatened by highway development. Wildlife Society Bulletin, 39:256-267.
Green, R.H., and R.M. Green. 1979. Sampling design and statistical methods for environmental
biologists. John Wiley & Sons.
R Core Team. 2013. R: A language and environment for statistical computing. R Foundation for Statistical
Computing, Vienna, Austria.URL http://www.R-project.org/.
Stansbury, C., and J. Thompson. 2016. 2015 Lava Butte Wildlife Crossing Progress Report: monitoring
effectiveness of the Lava Butte Wildlife Crossing Structures. Prepared for the Oregon Department
of Transportation, Bend, Oregon. Prepared by Western EcoSystems Technology, Inc., Corvallis,
Oregon. September 28, 2016.
Appendix A: Views from remote cameras at wildlife crossing structures along U.S. Route
97 between milepost 149 to MP 153 from Lava butte to South Century Drive.
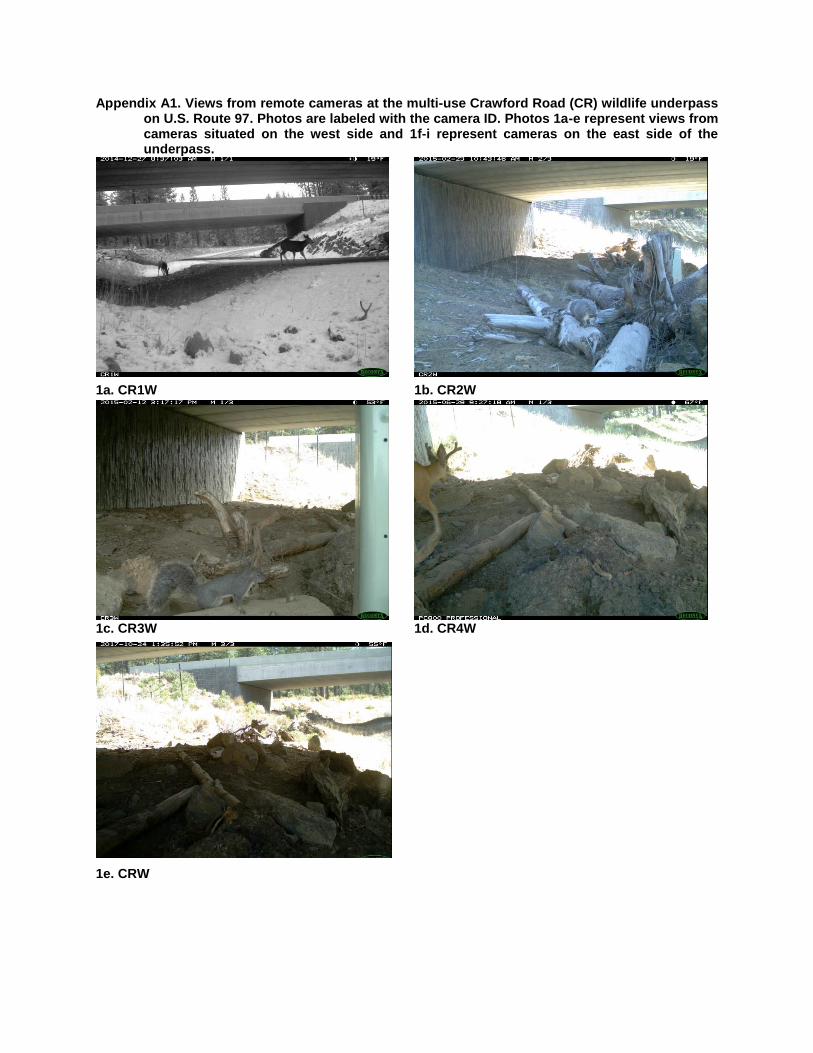
Appendix A1. Views from remote cameras at the multi-use Crawford Road (CR) wildlife underpass on U.S. Route 97. Photos are labeled with the camera ID. Photos 1a-e represent views from cameras situated on the west side and 1f-i represent cameras on the east side of the underpass.
1a. CR1W 1b. CR2W
1c. CR3W 1d. CR4W
1e. CRW
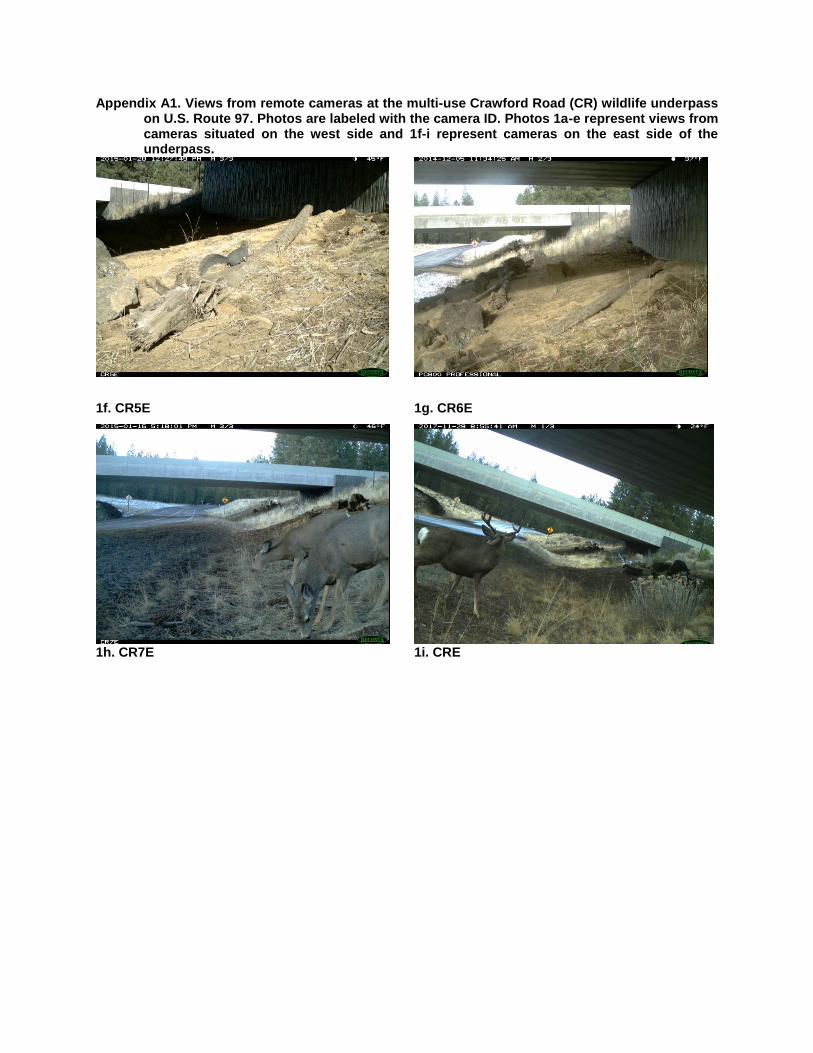
Appendix A1. Views from remote cameras at the multi-use Crawford Road (CR) wildlife underpass on U.S. Route 97. Photos are labeled with the camera ID. Photos 1a-e represent views from cameras situated on the west side and 1f-i represent cameras on the east side of the underpass.
1f. CR5E 1g. CR6E
1h. CR7E 1i. CRE
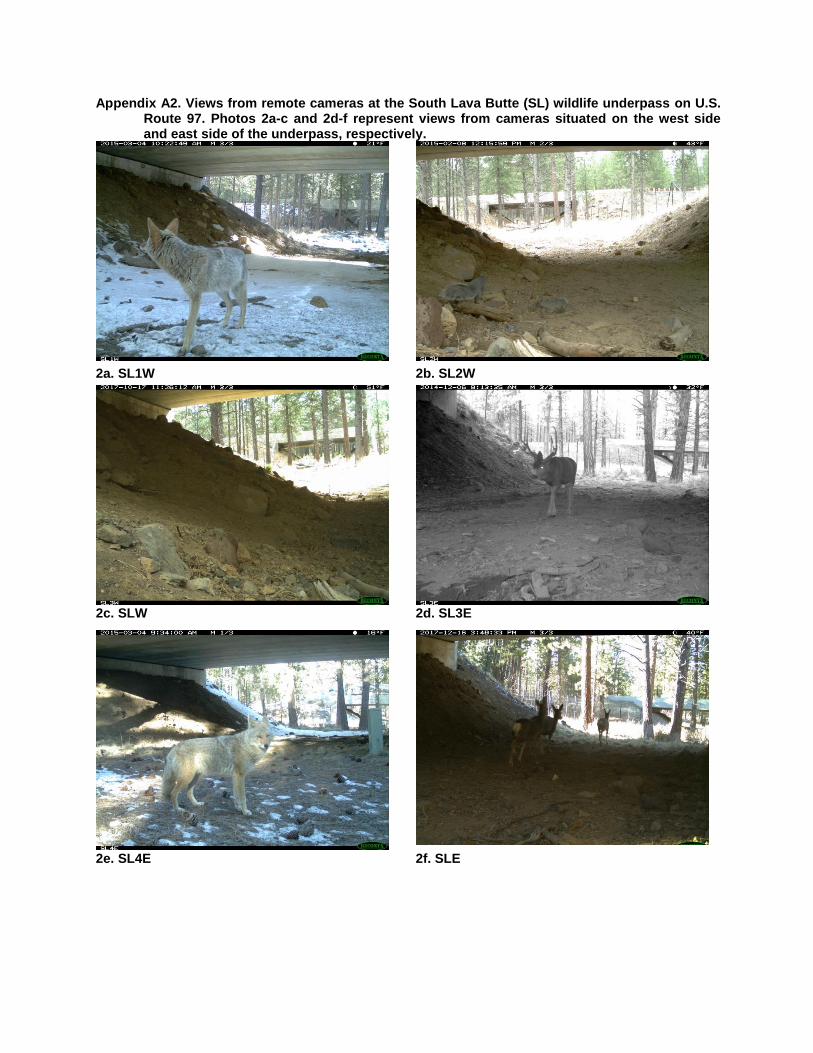
Appendix A2. Views from remote cameras at the South Lava Butte (SL) wildlife underpass on U.S. Route 97. Photos 2a-c and 2d-f represent views from cameras situated on the west side and east side of the underpass, respectively.
2a. SL1W 2b. SL2W
2c. SLW 2d. SL3E
2e. SL4E 2f. SLE
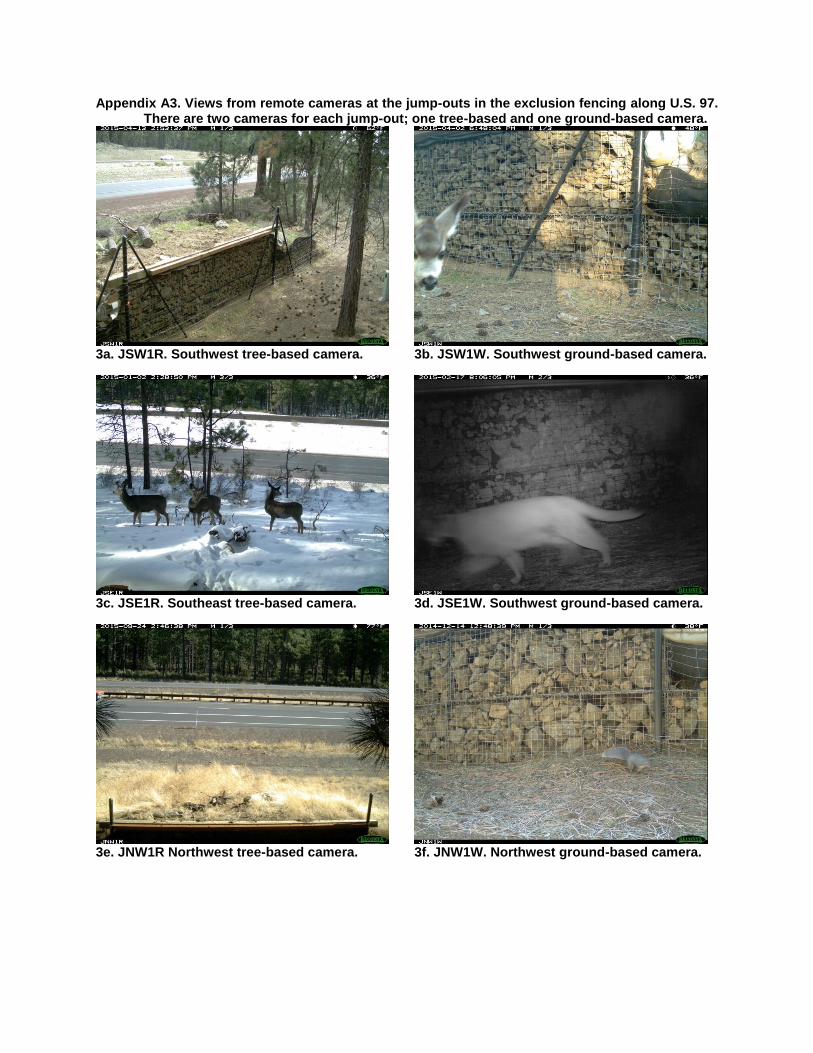
Appendix A3. Views from remote cameras at the jump-outs in the exclusion fencing along U.S. 97. There are two cameras for each jump-out; one tree-based and one ground-based camera.
3a. JSW1R. Southwest tree-based camera. 3b. JSW1W. Southwest ground-based camera.
3c. JSE1R. Southeast tree-based camera. 3d. JSE1W. Southwest ground-based camera.
3e. JNW1R Northwest tree-based camera. 3f. JNW1W. Northwest ground-based camera.
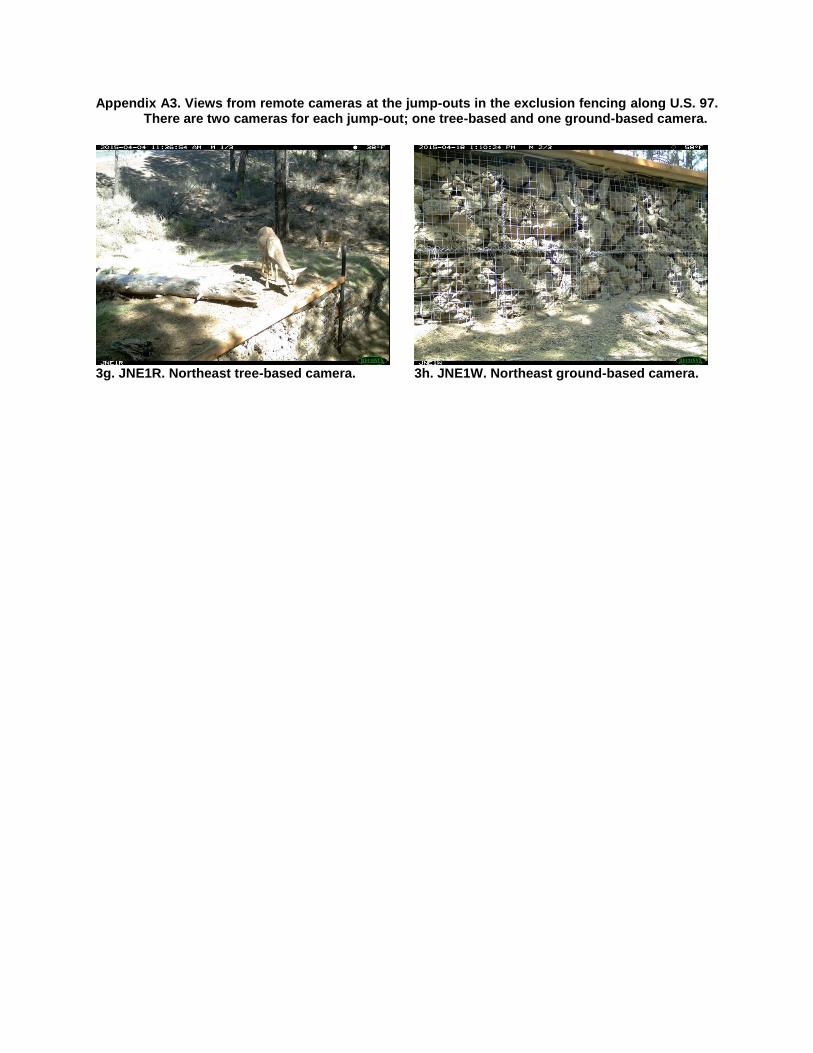
Appendix A3. Views from remote cameras at the jump-outs in the exclusion fencing along U.S. 97. There are two cameras for each jump-out; one tree-based and one ground-based camera.
3g. JNE1R. Northeast tree-based camera. 3h. JNE1W. Northeast ground-based camera.
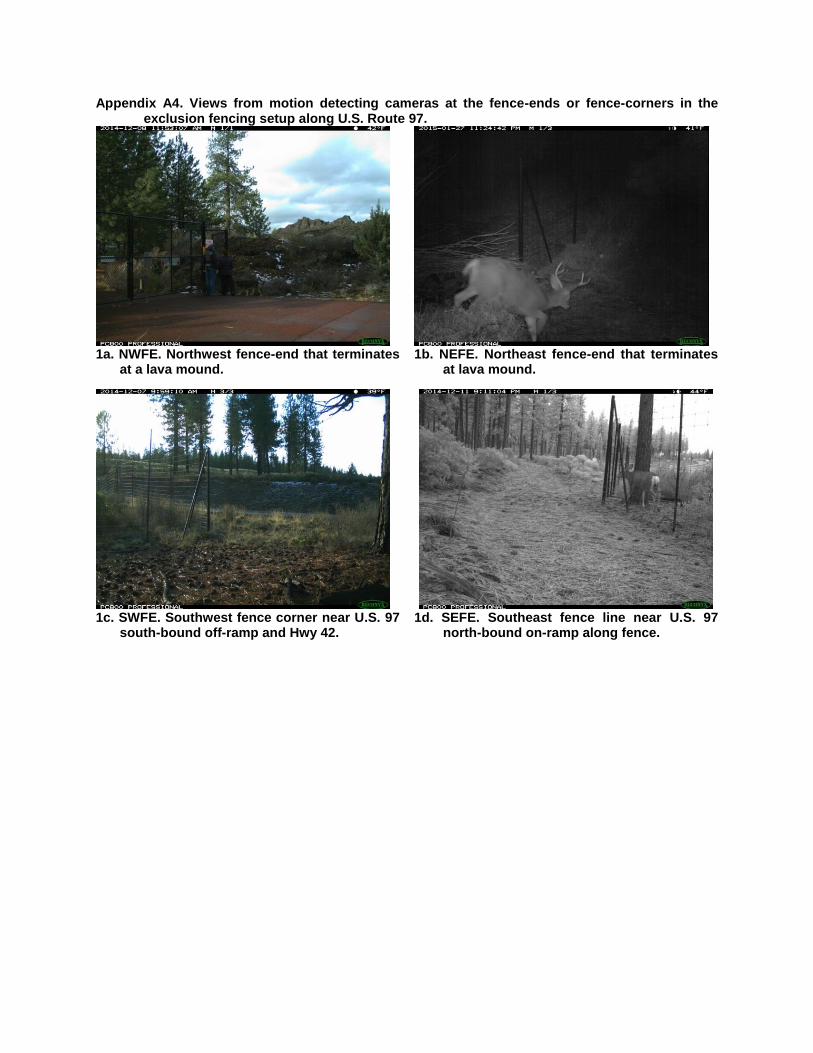
Appendix A4. Views from motion detecting cameras at the fence-ends or fence-corners in the exclusion fencing setup along U.S. Route 97.
1a. NWFE. Northwest fence-end that terminates
at a lava mound. 1b. NEFE. Northeast fence-end that terminates
at lava mound.
1c. SWFE. Southwest fence corner near U.S. 97
south-bound off-ramp and Hwy 42. 1d. SEFE. Southeast fence line near U.S. 97
north-bound on-ramp along fence.