latinos in boston
TRANSCRIPT
imagine
all the
people
Lat
inos
CITY OF BOSTON
Martin J. Walsh
Mayor
New Bostonian Series
Boston’s Latino Population Nationally, Latinos accounted for more than half (53.8%) of the
population growth in the United States from 2000 to 2013. In
Boston, Latinos accounted for 68.2% of the population growth
during the same period. The benefits that Latinos bring to Bos-
ton, while too numerous to list, include a more diverse and
productive labor force that is well-established in nearly every
sector and a richer social and cultural milieu that enriches all of
Boston’s neighborhoods.
“imagine all the people” is a series of publications produced by
the Boston Redevelopment Authority for the Mayor’s Office of
New Bostonians, that provides a comprehensive profile of Bos-
ton’s diverse foreign-born population and their numerous con-
tributions to the city’s social, cultural, and economic landscape.
It is part of an ongoing effort to celebrate new Bostonians and
gain insight into how our city is shaped by their presence.

2
This report adapts U.S. Census data to create the Latino variable for this analysis. The U.S.
Census Bureau identifies Latinos through a question that asks respondents to choose an eth-
nicity of either Hispanic or Latino or Not Hispanic or Latino. These population estimates use
this census designations of Hispanic or Latino origin and ancestry based on previous family
migration from Brazil to estimate the number of Latinos in Boston. Brazilians are not included
in the category Latino, but added here though most Brazilians self-report to the census using
a racial category (e.g., white, black), rather than identifying with an ethnicity of Hispanic or
Latino.
This report analyzes data from the U.S. Census Bureau’s 2013 American Community Survey
(ACS). Data are analyzed by Public Use Microdata Area (PUMA), which consists of a minimum
population of 100,000 and is the smallest geographic area publicly available for individual-
level analysis. Boston comprises five PUMAs. By aggregating them for this report, we are able
to arrive at a more detailed demographic and economic portrait of Boston’s Latino communi-
ty. Latinos are then compared to those in the city who are not Latino.
1 The ACS is a yearly survey conducted by the U.S. Census Bureau. The ACS is based on a sample of the population. While the data are reported as specific numbers or percentages, all results are mean estimates and subject to sampling error. 2 Boston contains the following PUMAs: 3301, 3302, 3303, 3304, and 3305. 3 Unless otherwise noted in this report, all analysis uses 2013, 1-Year American Community Survey, Public Use Microda-ta Sample (PUMS) data.
3
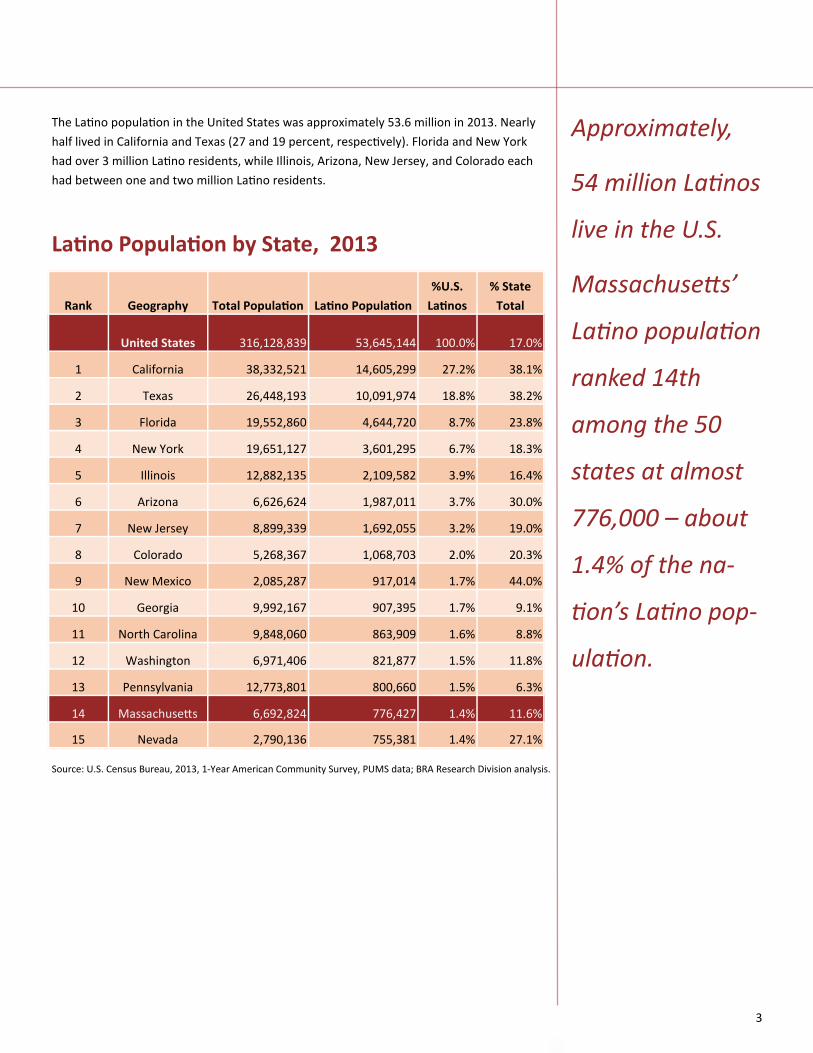
The Latino population in the United States was approximately 53.6 million in 2013. Nearly
half lived in California and Texas (27 and 19 percent, respectively). Florida and New York
had over 3 million Latino residents, while Illinois, Arizona, New Jersey, and Colorado each
had between one and two million Latino residents.
Latino Population by State, 2013
Rank Geography Total Population Latino Population
%U.S.
Latinos
% State
Total
United States 316,128,839 53,645,144 100.0% 17.0%
1 California 38,332,521 14,605,299 27.2% 38.1%
2 Texas 26,448,193 10,091,974 18.8% 38.2%
3 Florida 19,552,860 4,644,720 8.7% 23.8%
4 New York 19,651,127 3,601,295 6.7% 18.3%
5 Illinois 12,882,135 2,109,582 3.9% 16.4%
6 Arizona 6,626,624 1,987,011 3.7% 30.0%
7 New Jersey 8,899,339 1,692,055 3.2% 19.0%
8 Colorado 5,268,367 1,068,703 2.0% 20.3%
9 New Mexico 2,085,287 917,014 1.7% 44.0%
10 Georgia 9,992,167 907,395 1.7% 9.1%
11 North Carolina 9,848,060 863,909 1.6% 8.8%
12 Washington 6,971,406 821,877 1.5% 11.8%
13 Pennsylvania 12,773,801 800,660 1.5% 6.3%
14 Massachusetts 6,692,824 776,427 1.4% 11.6%
15 Nevada 2,790,136 755,381 1.4% 27.1%
Source: U.S. Census Bureau, 2013, 1-Year American Community Survey, PUMS data; BRA Research Division analysis.
Approximately,
54 million Latinos
live in the U.S.
Massachusetts’
Latino population
ranked 14th
among the 50
states at almost
776,000 – about
1.4% of the na-
tion’s Latino pop-
ulation.
4
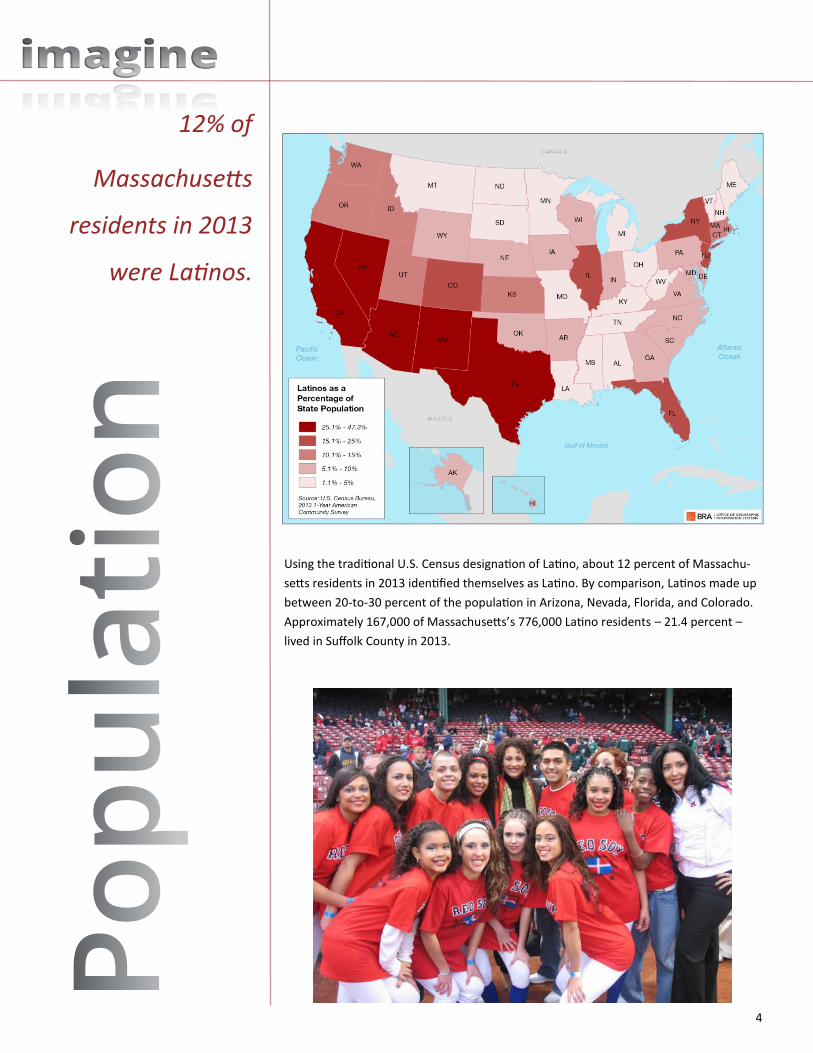
Using the traditional U.S. Census designation of Latino, about 12 percent of Massachu-
setts residents in 2013 identified themselves as Latino. By comparison, Latinos made up
between 20-to-30 percent of the population in Arizona, Nevada, Florida, and Colorado.
Approximately 167,000 of Massachusetts’s 776,000 Latino residents – 21.4 percent –
lived in Suffolk County in 2013.
12% of
Massachusetts
residents in 2013
were Latinos.
5
Since 2000, Bos-
ton’s Latino popu-
lation grew about
44%.
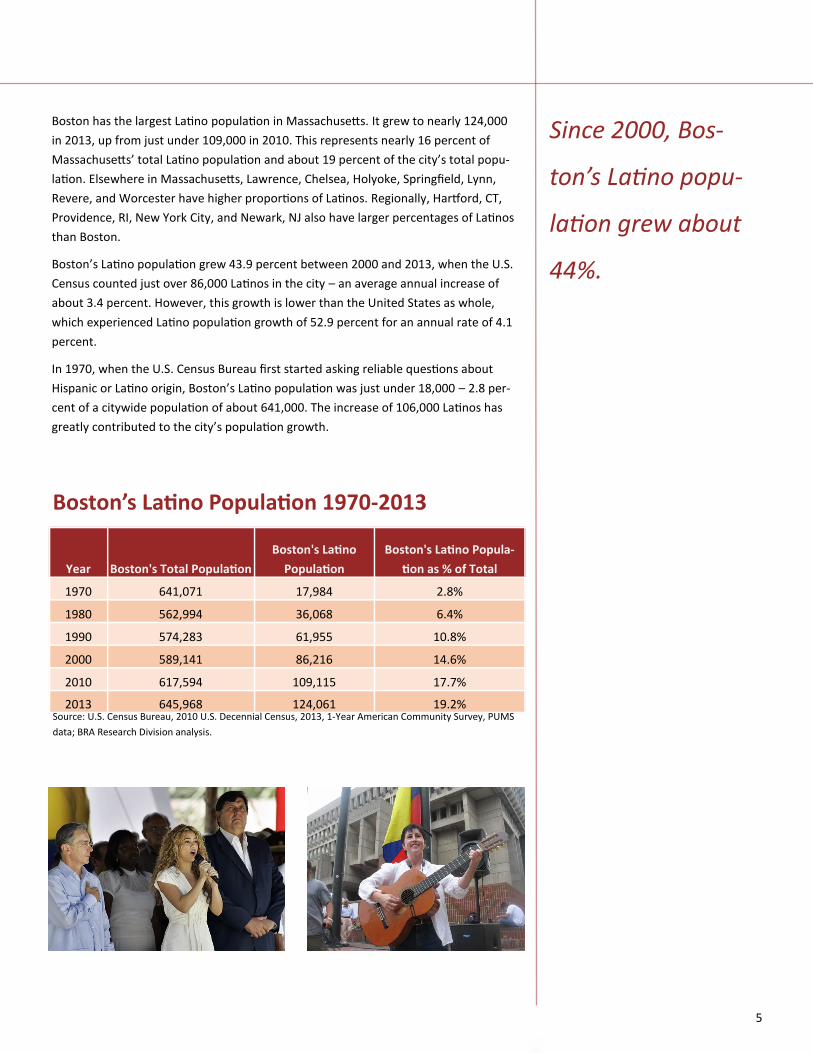
Boston has the largest Latino population in Massachusetts. It grew to nearly 124,000
in 2013, up from just under 109,000 in 2010. This represents nearly 16 percent of
Massachusetts’ total Latino population and about 19 percent of the city’s total popu-
lation. Elsewhere in Massachusetts, Lawrence, Chelsea, Holyoke, Springfield, Lynn,
Revere, and Worcester have higher proportions of Latinos. Regionally, Hartford, CT,
Providence, RI, New York City, and Newark, NJ also have larger percentages of Latinos
than Boston.
Boston’s Latino population grew 43.9 percent between 2000 and 2013, when the U.S.
Census counted just over 86,000 Latinos in the city – an average annual increase of
about 3.4 percent. However, this growth is lower than the United States as whole,
which experienced Latino population growth of 52.9 percent for an annual rate of 4.1
percent.
In 1970, when the U.S. Census Bureau first started asking reliable questions about
Hispanic or Latino origin, Boston’s Latino population was just under 18,000 – 2.8 per-
cent of a citywide population of about 641,000. The increase of 106,000 Latinos has
greatly contributed to the city’s population growth.
Year Boston's Total Population
Boston's Latino
Population
Boston's Latino Popula-
tion as % of Total
1970 641,071 17,984 2.8%
1980 562,994 36,068 6.4%
1990 574,283 61,955 10.8%
2000 589,141 86,216 14.6%
2010 617,594 109,115 17.7%
2013 645,968 124,061 19.2%
Boston’s Latino Population 1970-2013
Source: U.S. Census Bureau, 2010 U.S. Decennial Census, 2013, 1-Year American Community Survey, PUMS
data; BRA Research Division analysis.
6
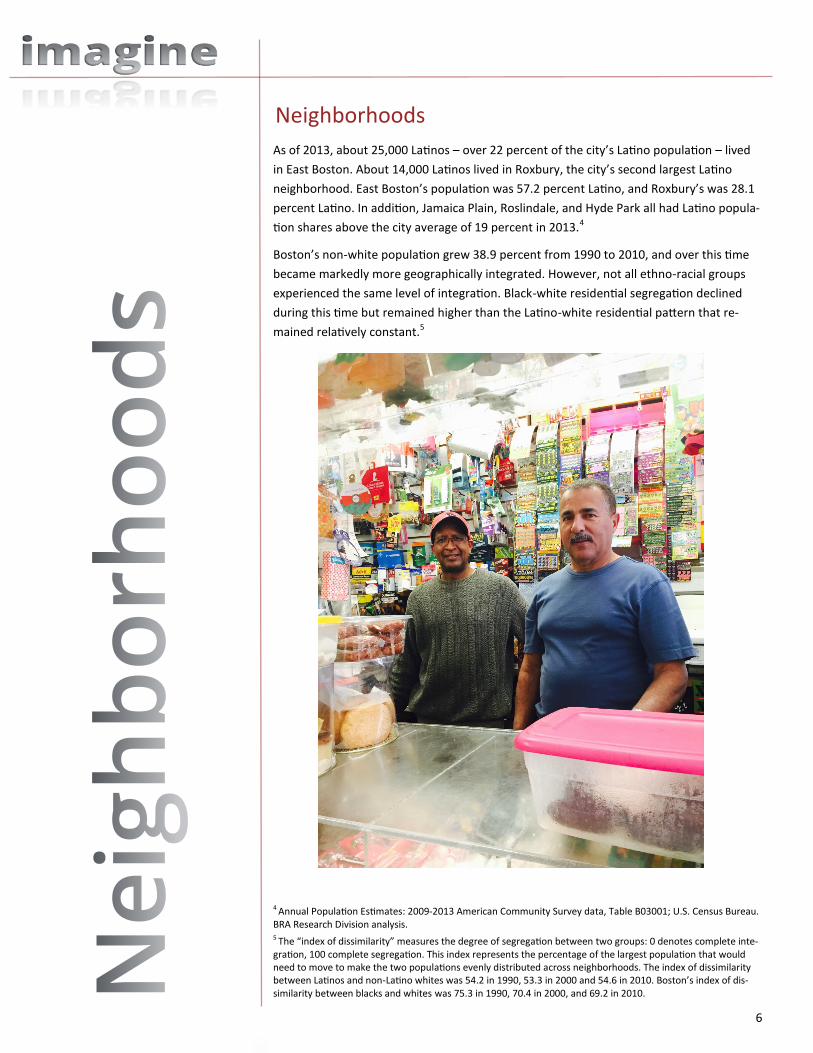
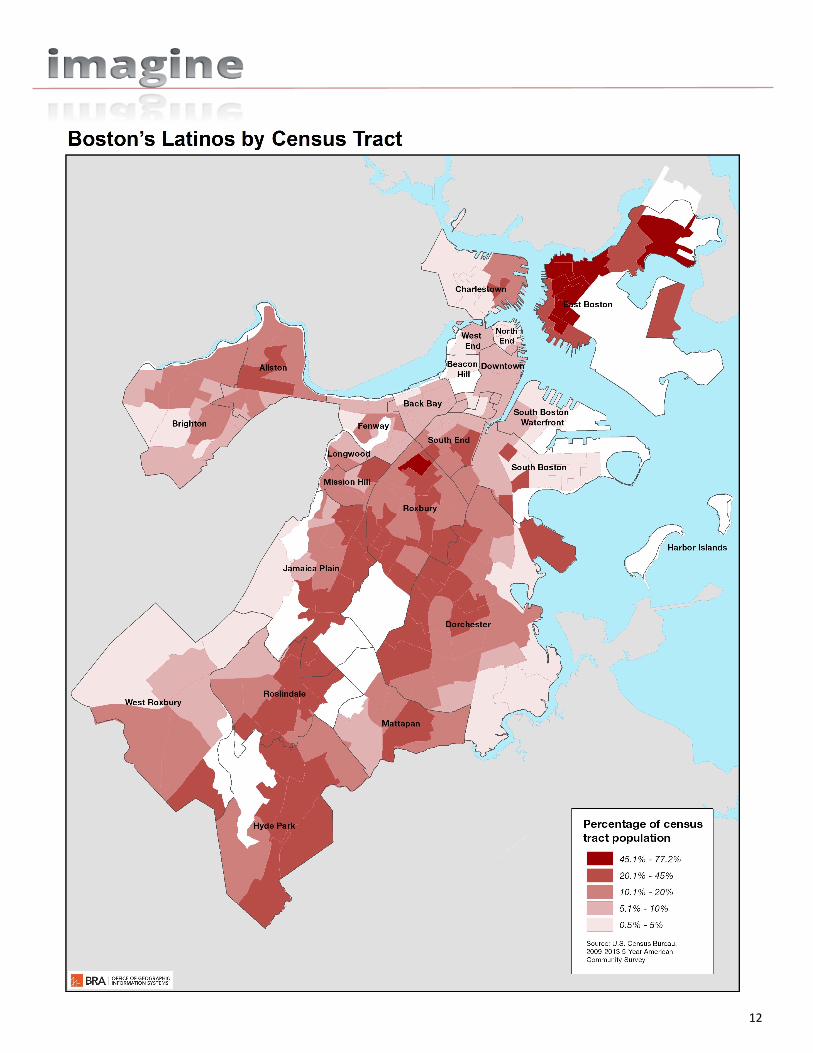
As of 2013, about 25,000 Latinos – over 22 percent of the city’s Latino population – lived
in East Boston. About 14,000 Latinos lived in Roxbury, the city’s second largest Latino
neighborhood. East Boston’s population was 57.2 percent Latino, and Roxbury’s was 28.1
percent Latino. In addition, Jamaica Plain, Roslindale, and Hyde Park all had Latino popula-
tion shares above the city average of 19 percent in 2013.4
Boston’s non-white population grew 38.9 percent from 1990 to 2010, and over this time
became markedly more geographically integrated. However, not all ethno-racial groups
experienced the same level of integration. Black-white residential segregation declined
during this time but remained higher than the Latino-white residential pattern that re-
mained relatively constant.5
Neighborhoods
4 Annual Population Estimates: 2009-2013 American Community Survey data, Table B03001; U.S. Census Bureau. BRA Research Division analysis. 5 The “index of dissimilarity” measures the degree of segregation between two groups: 0 denotes complete inte-gration, 100 complete segregation. This index represents the percentage of the largest population that would need to move to make the two populations evenly distributed across neighborhoods. The index of dissimilarity between Latinos and non-Latino whites was 54.2 in 1990, 53.3 in 2000 and 54.6 in 2010. Boston’s index of dis-similarity between blacks and whites was 75.3 in 1990, 70.4 in 2000, and 69.2 in 2010.
7
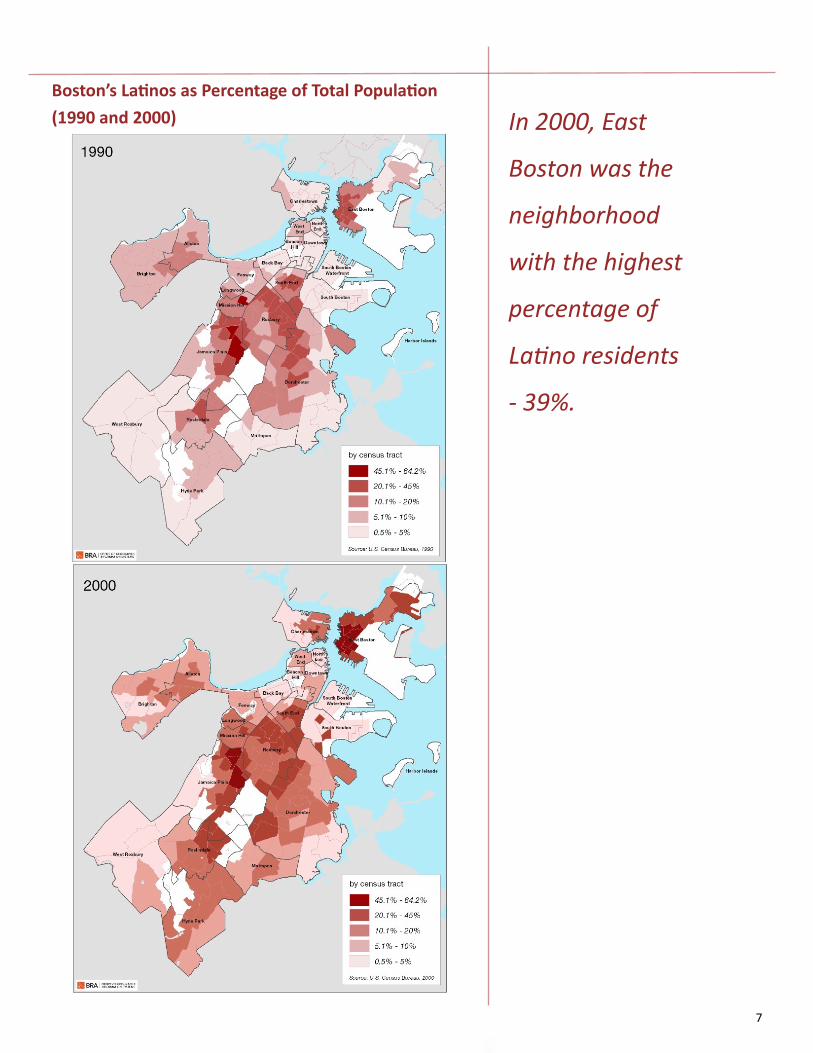
In 2000, East
Boston was the
neighborhood
with the highest
percentage of
Latino residents
- 39%.
Boston’s Latinos as Percentage of Total Population
(1990 and 2000)
8
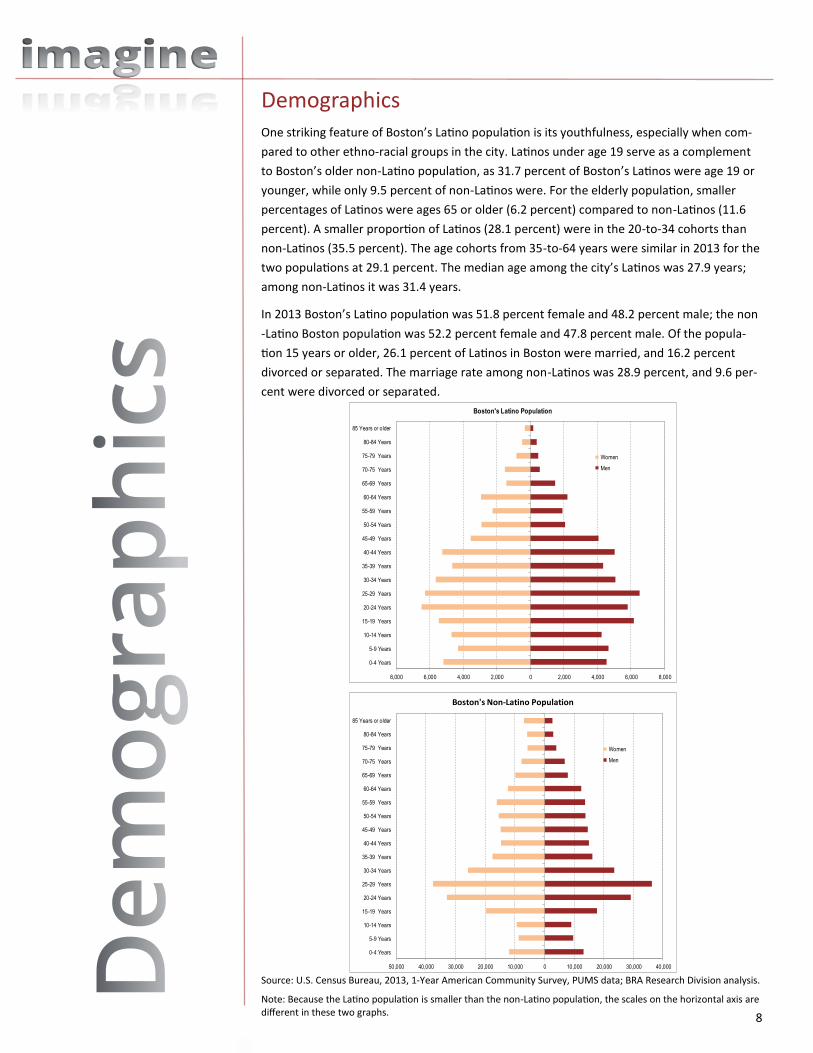
One striking feature of Boston’s Latino population is its youthfulness, especially when com-
pared to other ethno-racial groups in the city. Latinos under age 19 serve as a complement
to Boston’s older non-Latino population, as 31.7 percent of Boston’s Latinos were age 19 or
younger, while only 9.5 percent of non-Latinos were. For the elderly population, smaller
percentages of Latinos were ages 65 or older (6.2 percent) compared to non-Latinos (11.6
percent). A smaller proportion of Latinos (28.1 percent) were in the 20-to-34 cohorts than
non-Latinos (35.5 percent). The age cohorts from 35-to-64 years were similar in 2013 for the
two populations at 29.1 percent. The median age among the city’s Latinos was 27.9 years;
among non-Latinos it was 31.4 years.
In 2013 Boston’s Latino population was 51.8 percent female and 48.2 percent male; the non
-Latino Boston population was 52.2 percent female and 47.8 percent male. Of the popula-
tion 15 years or older, 26.1 percent of Latinos in Boston were married, and 16.2 percent
divorced or separated. The marriage rate among non-Latinos was 28.9 percent, and 9.6 per-
cent were divorced or separated.
Demographics
Source: U.S. Census Bureau, 2013, 1-Year American Community Survey, PUMS data; BRA Research Division analysis.
8,000 6,000 4,000 2,000 0 2,000 4,000 6,000 8,000
0-4 Years
5-9 Years
10-14 Years
15-19 Years
20-24 Years
25-29 Years
30-34 Years
35-39 Years
40-44 Years
45-49 Years
50-54 Years
55-59 Years
60-64 Years
65-69 Years
70-75 Years
75-79 Years
80-84 Years
85 Years or older
Boston's Latino Population
Women
Men
Note: Because the Latino population is smaller than the non-Latino population, the scales on the horizontal axis are different in these two graphs.
50,000 40,000 30,000 20,000 10,000 0 10,000 20,000 30,000 40,000
0-4 Years
5-9 Years
10-14 Years
15-19 Years
20-24 Years
25-29 Years
30-34 Years
35-39 Years
40-44 Years
45-49 Years
50-54 Years
55-59 Years
60-64 Years
65-69 Years
70-75 Years
75-79 Years
80-84 Years
85 Years or older
Boston's Non-Latino Population
Women
Men
9
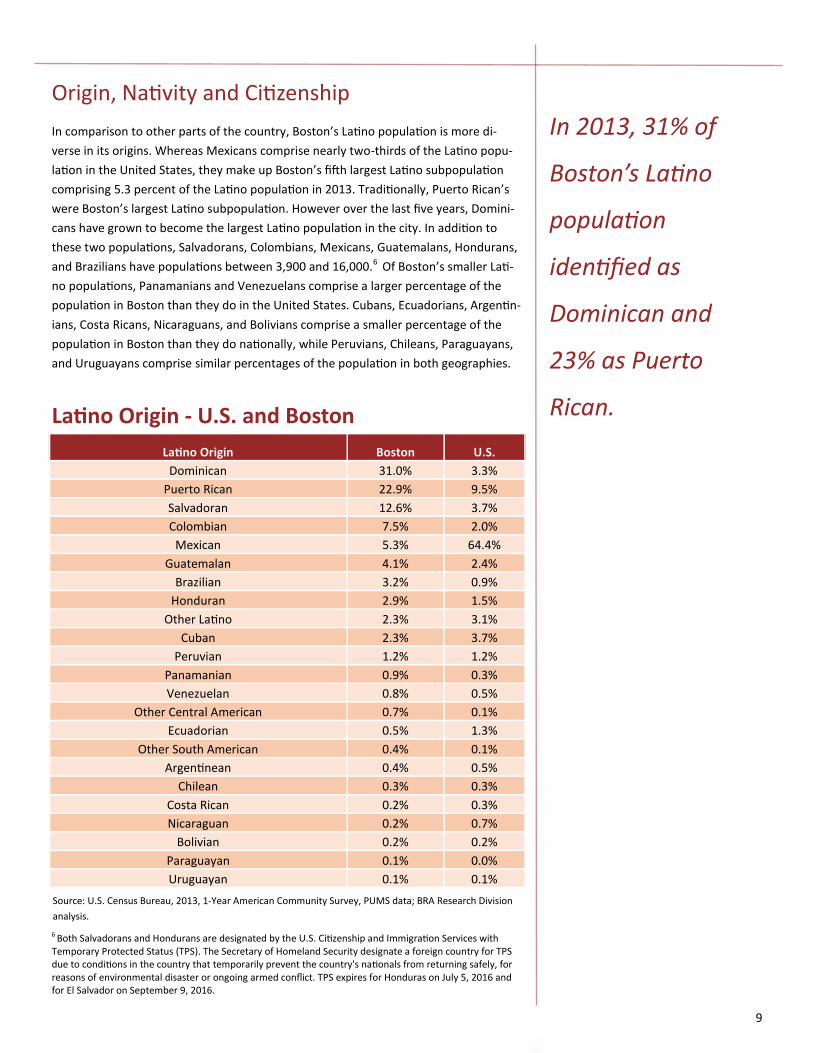
In 2013, 31% of
Boston’s Latino
population
identified as
Dominican and
23% as Puerto
Rican.
In comparison to other parts of the country, Boston’s Latino population is more di-
verse in its origins. Whereas Mexicans comprise nearly two-thirds of the Latino popu-
lation in the United States, they make up Boston’s fifth largest Latino subpopulation
comprising 5.3 percent of the Latino population in 2013. Traditionally, Puerto Rican’s
were Boston’s largest Latino subpopulation. However over the last five years, Domini-
cans have grown to become the largest Latino population in the city. In addition to
these two populations, Salvadorans, Colombians, Mexicans, Guatemalans, Hondurans,
and Brazilians have populations between 3,900 and 16,000.6 Of Boston’s smaller Lati-
no populations, Panamanians and Venezuelans comprise a larger percentage of the
population in Boston than they do in the United States. Cubans, Ecuadorians, Argentin-
ians, Costa Ricans, Nicaraguans, and Bolivians comprise a smaller percentage of the
population in Boston than they do nationally, while Peruvians, Chileans, Paraguayans,
and Uruguayans comprise similar percentages of the population in both geographies.
Latino Origin - U.S. and Boston
Source: U.S. Census Bureau, 2013, 1-Year American Community Survey, PUMS data; BRA Research Division
analysis.
Origin, Nativity and Citizenship
Latino Origin Boston U.S.
Dominican 31.0% 3.3%
Puerto Rican 22.9% 9.5%
Salvadoran 12.6% 3.7%
Colombian 7.5% 2.0%
Mexican 5.3% 64.4%
Guatemalan 4.1% 2.4%
Brazilian 3.2% 0.9%
Honduran 2.9% 1.5%
Other Latino 2.3% 3.1%
Cuban 2.3% 3.7%
Peruvian 1.2% 1.2%
Panamanian 0.9% 0.3%
Venezuelan 0.8% 0.5%
Other Central American 0.7% 0.1%
Ecuadorian 0.5% 1.3%
Other South American 0.4% 0.1%
Argentinean 0.4% 0.5%
Chilean 0.3% 0.3%
Costa Rican 0.2% 0.3%
Nicaraguan 0.2% 0.7%
Bolivian 0.2% 0.2%
Paraguayan 0.1% 0.0%
Uruguayan 0.1% 0.1%
6 Both Salvadorans and Hondurans are designated by the U.S. Citizenship and Immigration Services with Temporary Protected Status (TPS). The Secretary of Homeland Security designate a foreign country for TPS due to conditions in the country that temporarily prevent the country's nationals from returning safely, for reasons of environmental disaster or ongoing armed conflict. TPS expires for Honduras on July 5, 2016 and for El Salvador on September 9, 2016.
10
About 48 percent of Boston’s Latinos were foreign born in 2013, while nationwide the
share was 35.8 percent. Foreign-born Latinos come from many countries, but nearly three
-fourths of the city’s foreign born were Dominican, Salvadoran, or Colombian. It is im-
portant to remember that Puerto Ricans were granted citizenship in 1917 and are not
considered foreign born. In Boston, 38.3 percent of Puerto Ricans were born on the island,
while 30.6 percent of Puerto Ricans nationally were island born. Of the remaining non-
Puerto Rican Latinos in Boston, 36.0 percent were born in one of the 50 states, while 59.4
percent of non-Puerto Rican Latinos in the rest of the country were. It is interesting to
note that while the average year of entry to the United States for the Puerto Rican-born in
Boston was 1990, those born in the Dominican Republic, El Salvador, Colombia or Mexico
entered the United States, on average, between 1997 and 1999.
Nearly 70 percent of Boston’s Latinos were U.S. citizens in 2013, including 37.6 percent
who were foreign-born naturalized citizens, compared to 49.9 percent of foreign-born non
-Latinos who naturalized. The number of Latinos eligible to vote was approximately
57,000. This represents 46 percent of the Latino population and was somewhat dimin-
ished by the twofold fact that almost 27 percent of the city’s Latinos were under the
voting-eligible age of 18 in 2013, and that among those 18 years or older, about 36 per-
cent were not U.S. citizens.
Foreign-born Latinos
in Boston come from
many countries, but
Dominicans,
Salvadorans, and
Colombians make up
75 percent of the
Latino population.
11
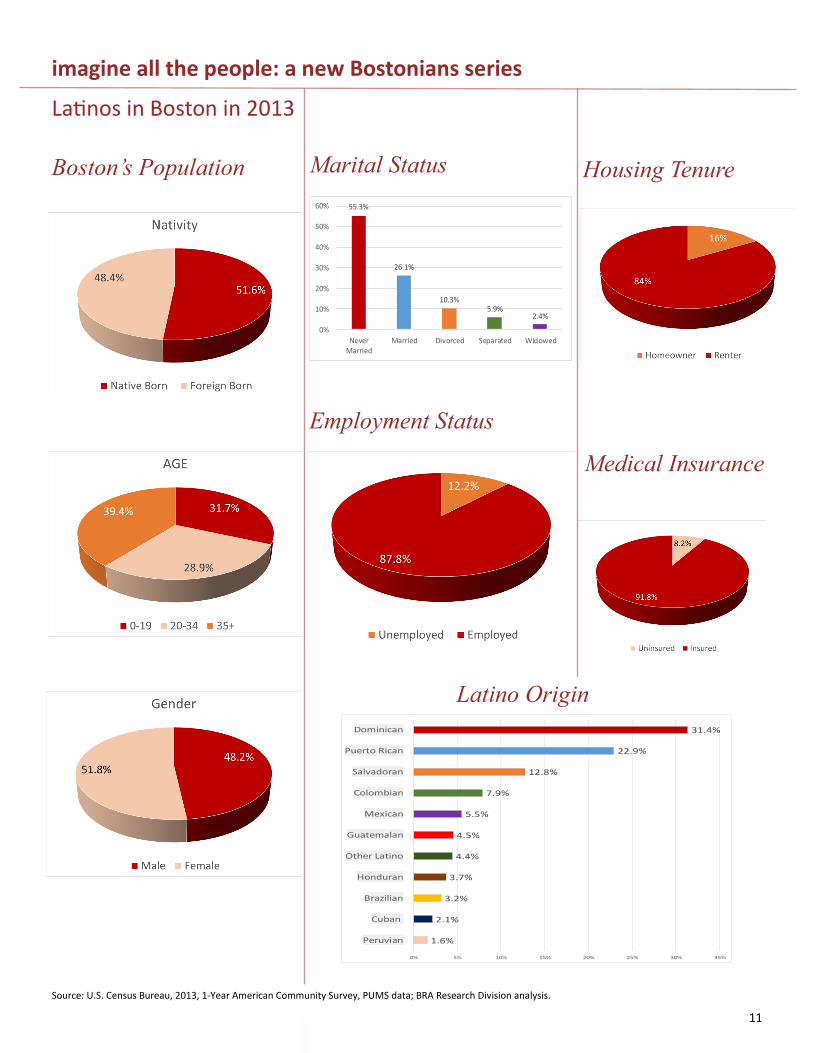
imagine all the people: a new Bostonians series
Latinos in Boston in 2013
Boston’s Population Marital Status
Employment Status
Latino Origin
Medical Insurance
Housing Tenure
55.3%
26.1%
10.3%5.9%
2.4%
0%
10%
20%
30%
40%
50%
60%
NeverMarried
Married Divorced Separated Widowed
1.6%
2.1%
3.2%
3.7%
4.4%
4.5%
5.5%
7.9%
12.8%
22.9%
31.4%
0% 5% 10% 15% 20% 25% 30% 35%
Peruvian
Cuban
Brazilian
Honduran
Other Latino
Guatemalan
Mexican
Colombian
Salvadoran
Puerto Rican
Dominican
Source: U.S. Census Bureau, 2013, 1-Year American Community Survey, PUMS data; BRA Research Division analysis.
12
13
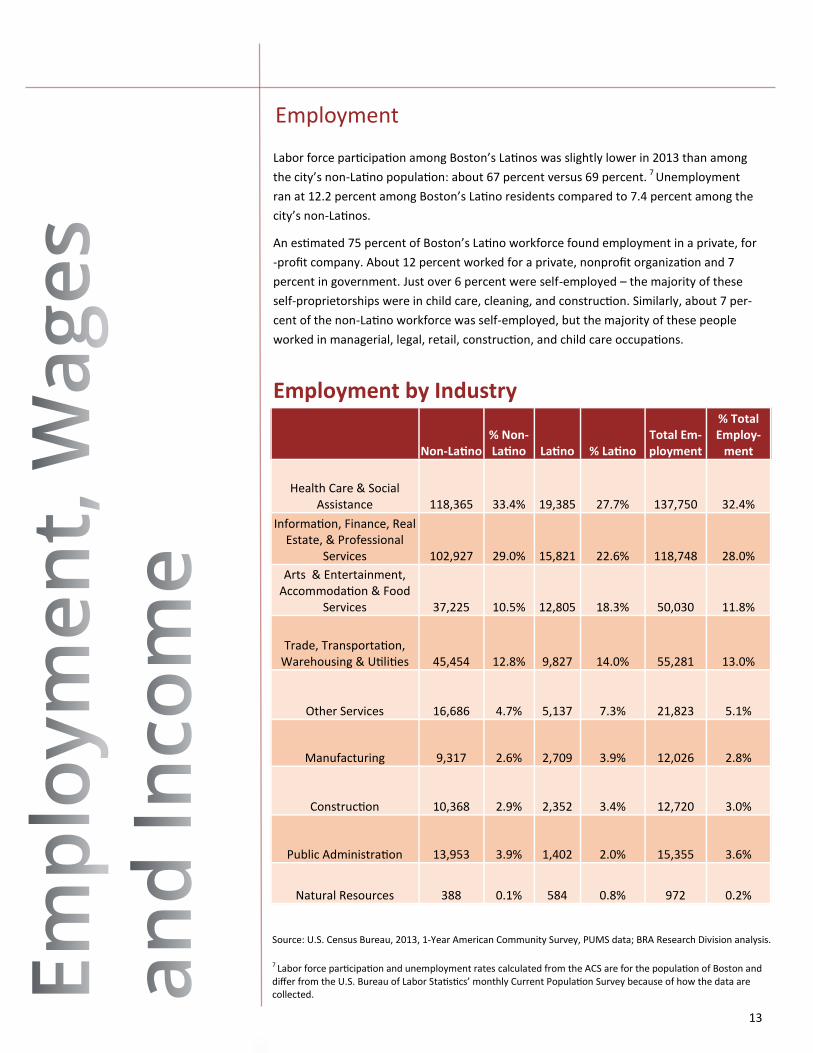
Labor force participation among Boston’s Latinos was slightly lower in 2013 than among
the city’s non-Latino population: about 67 percent versus 69 percent. 7 Unemployment
ran at 12.2 percent among Boston’s Latino residents compared to 7.4 percent among the
city’s non-Latinos.
An estimated 75 percent of Boston’s Latino workforce found employment in a private, for
-profit company. About 12 percent worked for a private, nonprofit organization and 7
percent in government. Just over 6 percent were self-employed – the majority of these
self-proprietorships were in child care, cleaning, and construction. Similarly, about 7 per-
cent of the non-Latino workforce was self-employed, but the majority of these people
worked in managerial, legal, retail, construction, and child care occupations.
Employment
7 Labor force participation and unemployment rates calculated from the ACS are for the population of Boston and differ from the U.S. Bureau of Labor Statistics’ monthly Current Population Survey because of how the data are collected.
Employment by Industry
Source:
Non-Latino % Non-Latino Latino % Latino
Total Em-ployment
% Total Employ-
ment
Health Care & Social Assistance 118,365 33.4% 19,385 27.7% 137,750 32.4%
Information, Finance, Real Estate, & Professional
Services 102,927 29.0% 15,821 22.6% 118,748 28.0%
Arts & Entertainment, Accommodation & Food
Services 37,225 10.5% 12,805 18.3% 50,030 11.8%
Trade, Transportation, Warehousing & Utilities 45,454 12.8% 9,827 14.0% 55,281 13.0%
Other Services 16,686 4.7% 5,137 7.3% 21,823 5.1%
Manufacturing 9,317 2.6% 2,709 3.9% 12,026 2.8%
Construction 10,368 2.9% 2,352 3.4% 12,720 3.0%
Public Administration 13,953 3.9% 1,402 2.0% 15,355 3.6%
Natural Resources 388 0.1% 584 0.8% 972 0.2%
Source: U.S. Census Bureau, 2013, 1-Year American Community Survey, PUMS data; BRA Research Division analysis.
14
Unemployment
ran at 12%
among Boston’s
Latino residents
compared to 7%
among the city’s
non-Latinos.
Employment by industry of Boston’s Latino labor force was broadly similar to that of
Boston’s non-Latino labor force. The education services, health care and social assis-
tance “supersector”8 was the top employer of Boston’s Latino workers (27.7 percent)
and non-Latinos (33.4 percent) in 2013. The information, finance, real estate, and pro-
fessional services supersector employed 22.6 percent of Boston’s Latinos and 29 per-
cent of Boston’s non-Latino workers. The trade, transportation, warehousing and utili-
ties supersector employed about 14 percent of Boston’s Latino workers and 12.8 per-
cent of Boston’s non-Latino workers. The supersector in which there was a significant
difference in employment was arts & entertainment, accommodation & food services,
which employed about 18.3 percent of Boston’s Latinos but only 10.5 percent of Bos-
ton’s non-Latino workers.
The construction and hospital industries employed Boston’s Latinos in large numbers,
and there was not as significant a difference between the percentage of Latinos em-
ployed in these industries and the percentage of the city’s non-Latino labor force.
8 North American Industrial Classification System (NAICS) codes are combined to create nine “supersector” groups. Natural Resources contains sub classifications of agriculture, forestry, fishing and hunting and min-ing, quarrying, and oil and gas extraction. Trade, Transportation, Warehousing, and Utilities contains classifi-cations of wholesale trade, retail trade, and transportation and warehousing, and utilities. Information, Finance, Real Estate, and Professional Services combines the classifications of information, finance and insur-ance, and real estate, and rental and leasing, professional, scientific, and management, and administrative, and waste management services. Care and Social Assistance contains the categories of educational services and health care and social assistance. Other Services contains the category other services, except public administration.
15
Employment by Occupation
Source: U.S. Census Bureau, 2013, 1-Year American Community Survey, PUMS data; BRA Research Division analysis.
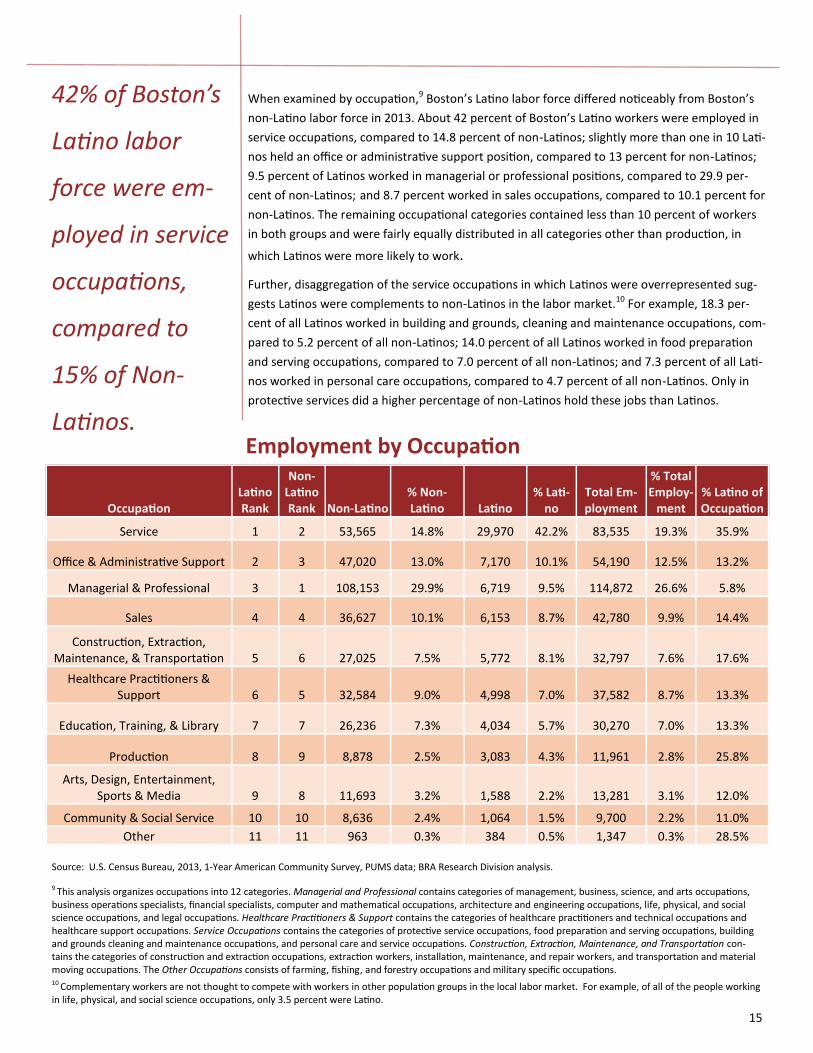
When examined by occupation,9 Boston’s Latino labor force differed noticeably from Boston’s
non-Latino labor force in 2013. About 42 percent of Boston’s Latino workers were employed in
service occupations, compared to 14.8 percent of non-Latinos; slightly more than one in 10 Lati-
nos held an office or administrative support position, compared to 13 percent for non-Latinos;
9.5 percent of Latinos worked in managerial or professional positions, compared to 29.9 per-
cent of non-Latinos; and 8.7 percent worked in sales occupations, compared to 10.1 percent for
non-Latinos. The remaining occupational categories contained less than 10 percent of workers
in both groups and were fairly equally distributed in all categories other than production, in
which Latinos were more likely to work.
Further, disaggregation of the service occupations in which Latinos were overrepresented sug-
gests Latinos were complements to non-Latinos in the labor market.10 For example, 18.3 per-
cent of all Latinos worked in building and grounds, cleaning and maintenance occupations, com-
pared to 5.2 percent of all non-Latinos; 14.0 percent of all Latinos worked in food preparation
and serving occupations, compared to 7.0 percent of all non-Latinos; and 7.3 percent of all Lati-
nos worked in personal care occupations, compared to 4.7 percent of all non-Latinos. Only in
protective services did a higher percentage of non-Latinos hold these jobs than Latinos.
9 This analysis organizes occupations into 12 categories. Managerial and Professional contains categories of management, business, science, and arts occupations, business operations specialists, financial specialists, computer and mathematical occupations, architecture and engineering occupations, life, physical, and social science occupations, and legal occupations. Healthcare Practitioners & Support contains the categories of healthcare practitioners and technical occupations and healthcare support occupations. Service Occupations contains the categories of protective service occupations, food preparation and serving occupations, building and grounds cleaning and maintenance occupations, and personal care and service occupations. Construction, Extraction, Maintenance, and Transportation con-tains the categories of construction and extraction occupations, extraction workers, installation, maintenance, and repair workers, and transportation and material moving occupations. The Other Occupations consists of farming, fishing, and forestry occupations and military specific occupations. 10 Complementary workers are not thought to compete with workers in other population groups in the local labor market. For example, of all of the people working in life, physical, and social science occupations, only 3.5 percent were Latino.
Source:
Occupation Latino Rank
Non-Latino Rank Non-Latino
% Non-Latino Latino
% Lati-no
Total Em-ployment
% Total Employ-
ment % Latino of Occupation
Service 1 2 53,565 14.8% 29,970 42.2% 83,535 19.3% 35.9%
Office & Administrative Support 2 3 47,020 13.0% 7,170 10.1% 54,190 12.5% 13.2%
Managerial & Professional 3 1 108,153 29.9% 6,719 9.5% 114,872 26.6% 5.8%
Sales 4 4 36,627 10.1% 6,153 8.7% 42,780 9.9% 14.4%
Construction, Extraction, Maintenance, & Transportation 5 6 27,025 7.5% 5,772 8.1% 32,797 7.6% 17.6%
Healthcare Practitioners & Support 6 5 32,584 9.0% 4,998 7.0% 37,582 8.7% 13.3%
Education, Training, & Library 7 7 26,236 7.3% 4,034 5.7% 30,270 7.0% 13.3%
Production 8 9 8,878 2.5% 3,083 4.3% 11,961 2.8% 25.8%
Arts, Design, Entertainment, Sports & Media 9 8 11,693 3.2% 1,588 2.2% 13,281 3.1% 12.0%
Community & Social Service 10 10 8,636 2.4% 1,064 1.5% 9,700 2.2% 11.0%
Other 11 11 963 0.3% 384 0.5% 1,347 0.3% 28.5%
42% of Boston’s
Latino labor
force were em-
ployed in service
occupations,
compared to
15% of Non-
Latinos.
16
There is a wide
gap in wages
and income for
Boston’s Latino
population and
Boston’s overall
population.
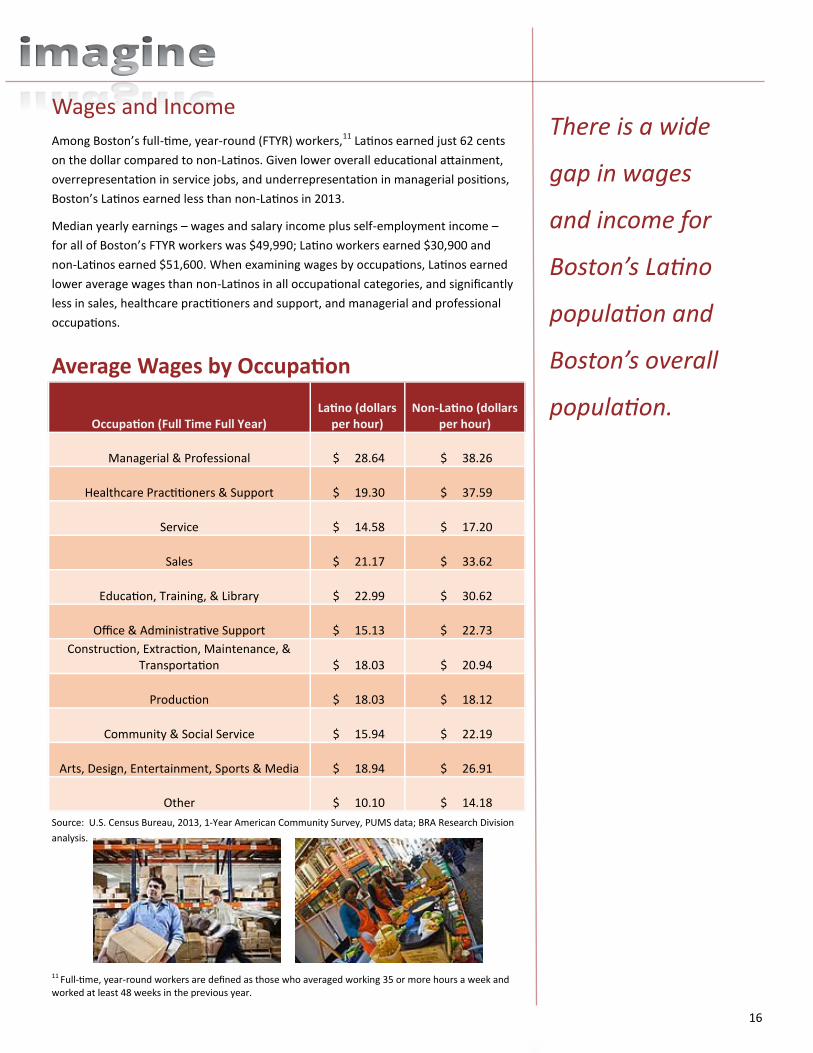
Among Boston’s full-time, year-round (FTYR) workers,11 Latinos earned just 62 cents
on the dollar compared to non-Latinos. Given lower overall educational attainment,
overrepresentation in service jobs, and underrepresentation in managerial positions,
Boston’s Latinos earned less than non-Latinos in 2013.
Median yearly earnings – wages and salary income plus self-employment income –
for all of Boston’s FTYR workers was $49,990; Latino workers earned $30,900 and
non-Latinos earned $51,600. When examining wages by occupations, Latinos earned
lower average wages than non-Latinos in all occupational categories, and significantly
less in sales, healthcare practitioners and support, and managerial and professional
occupations.
Average Wages by Occupation
Source: U.S. Census Bureau, 2013, 1-Year American Community Survey, PUMS data; BRA Research Division
analysis.
Wages and Income
Occupation (Full Time Full Year) Latino (dollars
per hour) Non-Latino (dollars
per hour)
Managerial & Professional $ 28.64 $ 38.26
Healthcare Practitioners & Support $ 19.30 $ 37.59
Service $ 14.58 $ 17.20
Sales $ 21.17 $ 33.62
Education, Training, & Library $ 22.99 $ 30.62
Office & Administrative Support $ 15.13 $ 22.73
Construction, Extraction, Maintenance, & Transportation $ 18.03 $ 20.94
Production $ 18.03 $ 18.12
Community & Social Service $ 15.94 $ 22.19
Arts, Design, Entertainment, Sports & Media $ 18.94 $ 26.91
Other $ 10.10 $ 14.18
11 Full-time, year-round workers are defined as those who averaged working 35 or more hours a week and worked at least 48 weeks in the previous year.
17
With over 40 percent of Latinos working in service occupations paying a mean hourly
wage of $14.58 in 2013, 30.2 percent of Boston’s adult Latinos were living below the fed-
eral poverty level,12 compared with 16.1 percent of the city’s non-Latino adult population,
who earned higher wages than Latinos in all occupational categories.
Standard of Living
Educational Attainment for Boston’s Latino Population
Source: U.S. Census Bureau, 2013, 1-Year American Community Survey, PUMS; BRA Research Division analysis.
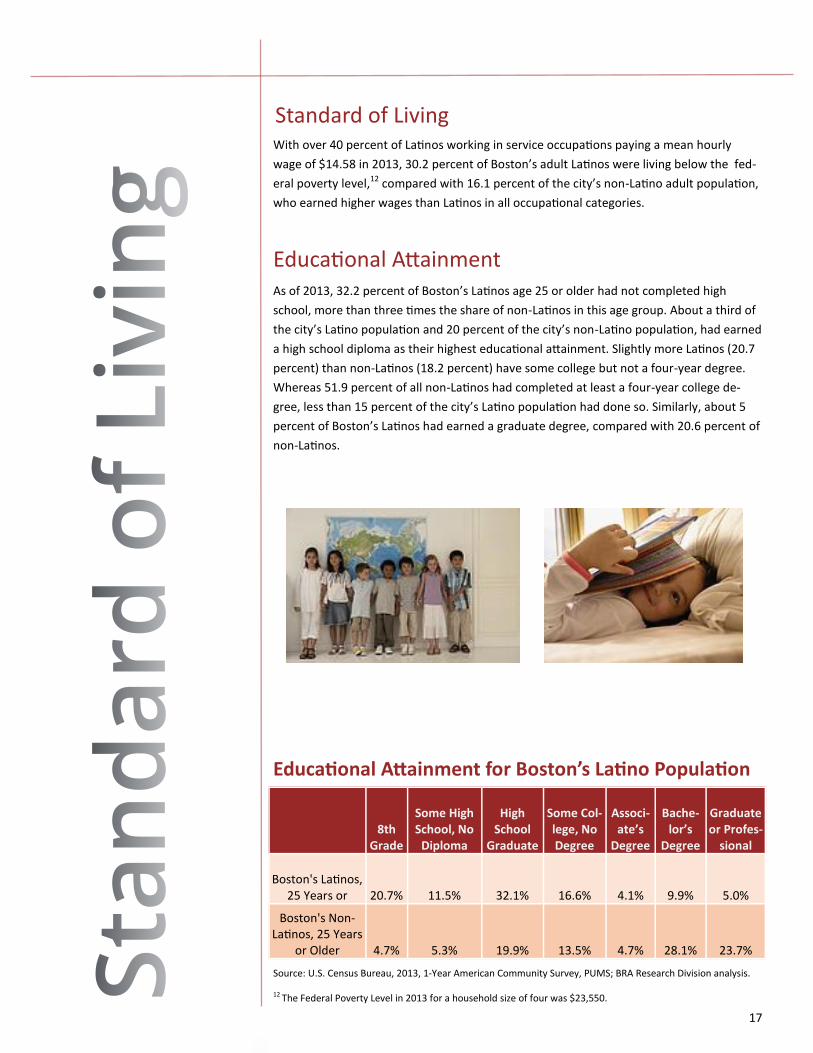
Educational Attainment As of 2013, 32.2 percent of Boston’s Latinos age 25 or older had not completed high
school, more than three times the share of non-Latinos in this age group. About a third of
the city’s Latino population and 20 percent of the city’s non-Latino population, had earned
a high school diploma as their highest educational attainment. Slightly more Latinos (20.7
percent) than non-Latinos (18.2 percent) have some college but not a four-year degree.
Whereas 51.9 percent of all non-Latinos had completed at least a four-year college de-
gree, less than 15 percent of the city’s Latino population had done so. Similarly, about 5
percent of Boston’s Latinos had earned a graduate degree, compared with 20.6 percent of
non-Latinos.
8th
Grade
Some High School, No
Diploma
High School
Graduate
Some Col-lege, No Degree
Associ-ate’s
Degree
Bache-lor’s
Degree
Graduate or Profes-
sional
Boston's Latinos, 25 Years or 20.7% 11.5% 32.1% 16.6% 4.1% 9.9% 5.0%
Boston's Non-Latinos, 25 Years
or Older 4.7% 5.3% 19.9% 13.5% 4.7% 28.1% 23.7%
12 The Federal Poverty Level in 2013 for a household size of four was $23,550.
18
30% of Boston’s
adult Latinos were
living below the
federal poverty lev-
el, compare to 16%
of Non-Latino adult
population.
With its younger population, many of whom were college students, Boston had a
homeownership rate of 33.9 percent that was much lower than Massachusetts’ rate of
65.8 percent in 2013. Even with this housing trend for the city, Latinos’ homeowner-
ship rate of 16.4 percent was strikingly low, compared to non-Latinos’ rate of 36.8 per-
cent. As a comparison, Latino’s homeownership rate was 45.1 percent for the entire
country. As a complement to these percentages, it is evident that 83.6 percent of Lati-
nos in Boston were renters. Latinos paid slightly higher average mortgages ($1,734)
than non-Latinos ($1,705). However, their average monthly rent of $867 was signifi-
cantly lower than non-Latinos ($1,318).
Housing
Medical Insurance Massachusetts was the first state to pass legislation aimed at achieving universal medi-
cal-care coverage. Nevertheless, seven years after passage of this comprehensive
health reform law, 8.3 percent of Latinos remained uninsured, more than double the
3.8 percent of non-Latinos in 2013. Further analysis suggests that medical uninsurance
was related to international migration, as 67.6 percent of uninsured Latinos and 79.2
percent of uninsured non-Latinos were foreign born. On a positive note, less than one
in 100 of Boston’s Latinos and non-Latinos under age 18 were medically uninsured.
19
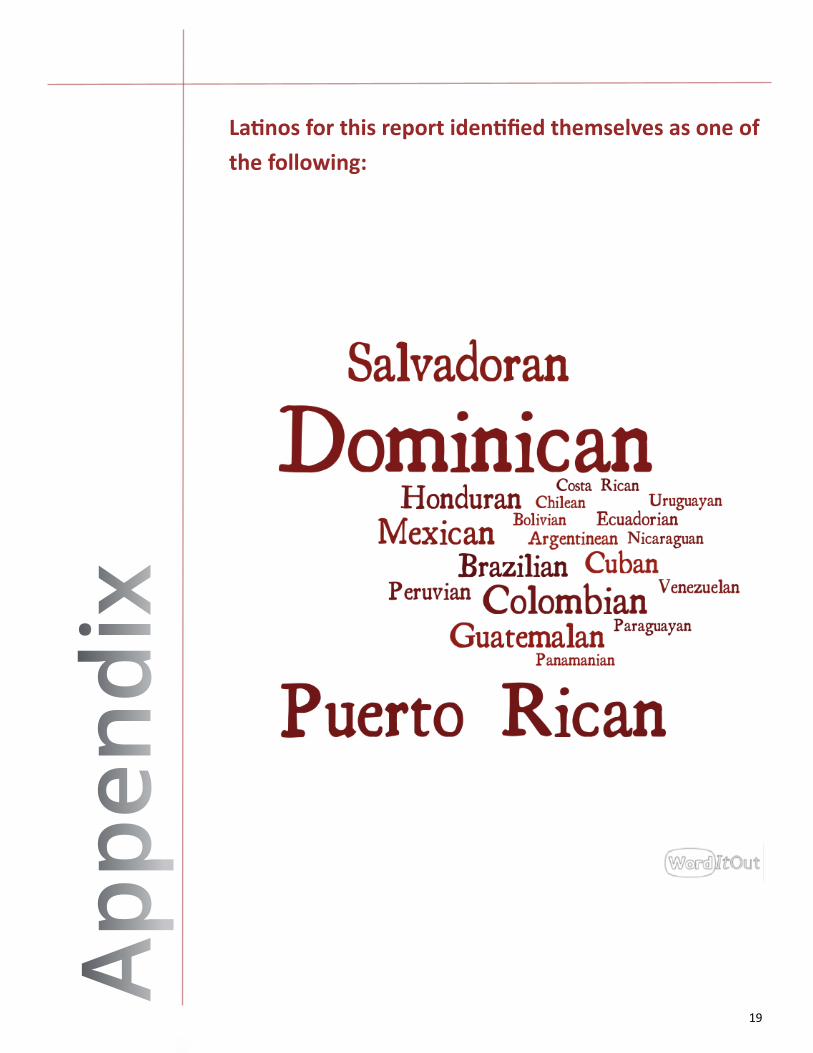
Latinos for this report identified themselves as one of
the following:
20
Produced by the Research Division
Alvaro Lima – Director
Jonathan Lee– Deputy Director
Christina Kim – Research Manager
Phillip Granberry – Senior Researcher/Demographer
Matthew Resseger – Senior Researcher/Economist
Kevin Kang – Research Associate
Kevin Wandrei – Research Assistant
Interns:
Xiaoxiao Ma
Zachery Nelson
Map by the Digital Cartography & GIS
Alla Ziskin
Brian P. Golden, Director
Alvaro Lima, Director of Research