latin american mobile economy snapshot
TRANSCRIPT

The Global Media Intelligence ReportLatin America

The Global Media Intelligence Report: Latin America Copyright ©2012 eMarketer, Inc. All rights reserved. LA-1
Latin AmericaThanks to a wealth of natural resources, rising investment and an expanding consumer base, Latin America has been partly sheltered from economic problems elsewhere, such as the financial turmoil in the eurozone. Yet all parts of the region—Central and South America and the Caribbean—are directly exposed to economic conditions in North America, and may see adverse effects if the US is hurt by Europe’s crises or hobbled by further downturns in domestic demand. Real GDP in Latin America rose 4.5% in 2011, according to the July 2012 “Worldwide Economic Outlook Update” prepared by the International Monetary Fund (IMF). The rate of growth is expected to drop slightly, to 3.4% in 2012, before climbing back to 4.2% in 2013.
These solid economic gains mean bigger budgets for many advertisers. Ad spending in Latin America topped $30 billion in 2011, eMarketer estimates, and will reach nearly $35 billion in 2012, a rise of 12%. Growth rates are expected to average about 10% during the next four years and drive spending on measured media to $51.33 billion. Brazil will continue to account for more than half of all ad spending in the region, but Argentina, representing 14% in 2012, is the area’s fastest-growing advertising market and has already overtaken Mexico to occupy second place in ad dollars regionally.
billions
Total Media Ad Spending in Latin America, by Country,2010-2016
$27.41$30.94
$34.65$38.12
$42.69$46.75
$51.33
Brazil Argentina Mexico Other
Note: includes digital (online and mobile), directories, magazines, newspapers, outdoor, radio and TV; numbers may not add up to total due to roundingSource: eMarketer, Sep 2012141858 www.eMarketer.com
20112010 2012 2013 2014 2015 2016
$14.81
$3.17$3.73
$5.69
$16.58
$4.12$4.05
$6.19
$18.46
$4.95
$4.47
$6.77
$20.12
$5.83
$4.85
$7.33
$22.53
$6.87
$5.28
$8.00
$24.78
$7.57
$5.69
$8.70
$27.63
$8.22
$6.08
$9.39
141858
Internet penetration in Latin America is relatively poor, except in urban areas. As a result, fewer than half (42.6%) of the region’s residents, some 255 million people, will be online in 2012. This proportion is rising by several percentage points each year, an encouraging trend when household penetration of broadband is only 30% in 2012. Countries with more robust infrastructure—notably Argentina—will demonstrate levels of web usage well above the regional average.
% of population in each group
Internet User Penetration in Latin America, byCountry, 2011-2016
2011 2012 2013 2014 2015 2016
Argentina 49.8% 54.3% 58.7% 63.0% 66.8% 68.0%
Brazil 39.0% 42.0% 44.0% 46.0% 47.0% 48.0%
Mexico 35.5% 40.5% 44.5% 48.0% 51.1% 53.8%
Other 37.1% 42.1% 46.1% 49.7% 52.9% 55.4%
Latin America 38.4% 42.6% 46.0% 49.0% 51.5% 53.4%Note: individuals of any age who use the internet from any location via anydevice at least once per monthSource: eMarketer, Feb 2012136973 www.eMarketer.com
136973

The Global Media Intelligence Report: Latin America Copyright ©2012 eMarketer, Inc. All rights reserved. LA-2
Latin America
With internet penetration so low, it is no surprise that digital ads represent a mere fraction of all advertising expenditures. Inevitably, though, that share is climbing. Digital advertising will make up 10.4% of total ad spending in 2012, eMarketer estimates, and will account for 15% by 2016.
billions
Digital Ad Spending in Latin America, by Country,2010-2016
2010 2011 2012 2013 2014 2015 2016
Brazil $1.12 $1.46 $2.05 $2.45 $3.14 $3.61 $4.13
Mexico* $0.28 $0.40 $0.53 $0.70 $0.92 $1.13 $1.34
Argentina $0.22 $0.34 $0.47 $0.59 $0.77 $0.94 $1.11
Other $0.41 $0.48 $0.57 $0.68 $0.84 $1.01 $1.10
Latin America $2.03 $2.67 $3.62 $4.43 $5.67 $6.69 $7.68Note: includes advertising that appears on desktop and laptop computersas well as mobile phones and tablets, and includes all the various formatsof advertising on those platforms; excludes SMS, MMS and P2Pmessaging-based advertising; numbers may not add up to total due torounding; *eMarketer benchmarks its Mexico online ad spendingprojections against the IAB México/PwC data for which the last full yearmeasured was 2011Source: eMarketer, Sep 2012144756 www.eMarketer.com
144756
Latin America boasts far more mobile phone users—nearly 390 million in 2012—than web users. Yet here too there is enormous untapped potential. eMarketer estimates that fewer than two-thirds of the entire population will own a mobile this year, and less than one in four of those individuals will have a smartphone. Across the region, the number of people using a mobile handset to go online in 2012 will reach 100 million.
Despite the slow advance of some technologies, internet users in Latin America have seized many digital opportunities with enthusiasm. For example, the region currently posts some of the world’s most impressive levels of social networking, according to eMarketer calculations. Data from comScore also points to extraordinarily high social networking engagement in early 2012. Brazil is reckoned to have one of the highest proportions of internet users using social networks (74% in 2012) anywhere in the world, eMarketer estimates. Overall, 68.9% of web users in the region will be regular visitors to social sites this year—well above the global average of 61.9%. The regional average will continue to exceed the worldwide average by more than five percentage points through 2014.
% of internet users in each group
Social Network User Penetration Worldwide, byRegion, 2010-2014
2010 2011 2012 2013 2014
Middle East & Africa 55.9% 62.8% 70.2% 76.6% 80.2%
Eastern Europe 65.1% 67.6% 69.0% 71.5% 73.1%
Latin America 60.9% 65.3% 68.9% 72.4% 74.9%
North America 60.0% 63.6% 65.8% 66.9% 68.0%
Asia-Pacific 46.8% 52.3% 58.1% 63.7% 67.9%
Western Europe 44.0% 49.8% 54.2% 57.8% 60.5%
Worldwide 52.2% 57.2% 61.9% 66.4% 69.6%Note: internet users who use a social network site via any device at leastonce per monthSource: eMarketer, Aug 2012143648 www.eMarketer.com
143648

The Global Media Intelligence Report: Latin America Copyright ©2012 eMarketer, Inc. All rights reserved. LA-3
Argentina ■ The influence of TV in Argentina may be waning, but only minimally. Over 95% of residents ages 12 to 75 watched free-to-air broadcasts at least once a week in 2011, according to TGI Latina’s “2011 Argentina Study, Waves 1–4,” and over 71% were monthly cable or satellite TV viewers. Newspapers and magazines appear to have lost readers in 2011, and attracted smaller audiences than the web. Internet usage is higher than elsewhere in Latin America. But penetration, estimated by eMarketer at 54.3% in 2012, remains far below that of North America, Western Europe or parts of Asia-Pacific.
■ Nearly 23 million consumers in Argentina will go online at least once a month in 2012, eMarketer estimates. This group has been expanding by double digits annually, though growth will drop below 10% in 2013. By 2015, two-thirds of the country’s residents will use the web. Demographically, the online population still reveals a younger, male bias. Over 64% of those online in 2011 were ages 12 to 34, and 52% were male, TGI reported. The company also found that more than one-third of internet users came from the lowest socioeconomic levels, and for the first time, the most affluent consumers accounted for less than 20% of web users.
■ Broadband is finally reaching substantial numbers of residents. The tally of fixed broadband subscriptions in Argentina surged by nearly 45% in 2011, to 7.4 million, and will top 9 million in 2012, according to eMarketer projections. But household penetration will likely not pass 50% until 2014.
■ As TGI noted, only television enjoyed wider reach than mobile phones in 2011. More than 33 million people in Argentina will own a mobile phone in 2012—some 79% of the population, according to eMarketer forecasts. Mobile penetration is expected to hit 84% in 2016, as usage spreads through all age and income brackets. In addition, the pronounced female bias among mobile users reported by TGI Latina in 2010 diminished last year. In 2011, 51.2% of Argentina’s mobile phone users were female, vs. 48.8% male.
■ Despite high mobile phone penetration, smartphones are not widespread. The number of smartphone users will leap 40% in 2012, eMarketer predicts, but will amount to no more than 7.7 million—less than one-quarter of Argentina’s mobile phone users and around 18% of the entire population. The market for advanced mobile handsets is still embryonic, and users display several “early adopter” characteristics. Some 59% of smartphone owners were male in 2011, according to TGI, and 64% were ages 12 to 34.
■ As in many other countries, mobile web usage correlates closely with smartphone ownership. eMarketer estimates that just 8 million residents will go online via mobile at least once per month in 2012. But the outlook for mobile web use is excellent. In 2016, nearly half of Argentina’s mobile phone users—around 17 million people—will use a handset to access the web.
■ Research firms agree that 2011 was a boom year for Argentina’s advertising sector. Spending in all measured media grew by a remarkable 30%, according to eMarketer estimates, to reach $4.1 billion. Most other sources also put 2011 growth at similar levels. Looking to 2012 and beyond, eMarketer has projected slightly higher totals than the majority of other firms, but the variation is not great. The clear outlier is PricewaterhouseCoopers (PwC), whose projected spending figures are substantially lower than all others.
■ Spending on digital ads is rising more quickly than any other category—by 55% in 2011 alone, eMarketer estimates. The internet became Argentina’s third most important media channel for advertising in 2011, according to ZenithOptimedia, and will consolidate that position in coming years. Yet digital spending, including online and mobile formats, will constitute only 9.5% of total ad spending in 2012, eMarketer predicts. The actual value of Argentina’s online ad market is also hotly debated. eMarketer has forecast that digital spending will reach $470 million this year. Other recent estimates of 2012 spending range from $110 million (PwC, June 2012) to $358 million (ZenithOptimedia, June 2012). eMarketer’s figure is higher chiefly because it includes several types of digital advertising, such as email and lead generation, which other firms do not. Mobile advertising will amount to an estimated $11 million this year, a gain of 73% compared to 2011.
■ In October 2011, Cristina Fernández de Kirchner was re-elected to a second four-year term as Argentina’s president. Such continuity has its dangers, however, as Fernández has shown a tendency to ad hoc actions that may undermine financial stability and weaken important institutions. According to the Economist Intelligence Unit (EIU), Argentina’s current legal, economic and regulatory environment makes it “one of the less attractive investment locations” among the world’s emerging economies. As of mid-2012, the EIU also noted that inflation—pegged by numerous analysts between 10% and 22%, the highest in the region—and public unease at wage stagnation were both contributing to a looming crisis of consumer and business confidence. GDP did rise by 8.9% in 2011, but the EIU expected the rate of growth to plummet this year, to just 2.1%, prior to a 2.7% gain in 2013.

The Global Media Intelligence Report: Latin America Copyright ©2012 eMarketer, Inc. All rights reserved. LA-4
Argentina
POPULATION
millionsPopulation in Argentina, 2010-2020
2010
41.3
50
100
2012
42.2
2014
43.0
2016
43.8
2018
44.6
2020
45.4
Note: population as of July for each yearSource: US Census Bureau, International Data Base, June 27, 2012142190 www.eMarketer.com
142190
MEDIA
% of populationMedia Penetration in Argentina, 2011
TV viewers (1) 95.2%
Mobile phone owners 76.3%
Cable/satellite TV viewers (1) 71.4%
Radio listeners (2) 68.3%
Internet users (3) 53.6%
Newspaper readers (4) 43.2%
Magazine readers (5)21.4%
Mobile internet users (6)7.1%
Note: ages 12-75; (1) viewed in the past week; (2) listened yesterday; (3)used in the past 30 days; (4) read weekday and Sunday publications; (5)read any publication; (6) mobile phone owners who use WAP internetSource: TGI Latina, "2011 Argentina Study, Waves 2-4, 2011, Wave 1, 2012,"2012; provided by Starcom MediaVest Group, June 1, 2012141184 www.eMarketer.com
141184
% of totalDemographic Profile of Media Users in Argentina, 2011
Internet users (1)
Mobile phone owners
TV viewers (2)
Cable/satellite TV viewers (2)
Radio listeners (3)
Magazine readers (4)
Newspaper readers (5)
GenderMale
Female
Age12-19
20-24
25-34
35-44
45-54
55-64
65-75
Socioeconomic statusABC1
C2
C3
D1
D2
52.0%
48.0%
26.0%
16.0%
22.3%
15.6%
11.7%
5.9%
2.5%
19.2%
15.2%
31.0%
21.9%
12.7%
48.8%
51.2%
17.7%
13.4%
21.7%
18.1%
15.1%
9.2%
4.8%
13.9%
11.9%
26.5%
26.8%
21.0%
47.7%
52.3%
18.8%
11.9%
19.2%
16.7%
14.5%
10.2%
8.8%
10.9%
9.8%
24.5%
27.8%
27.0%
49.0%
51.0%
19.3%
11.5%
19.4%
16.1%
14.6%
10.5%
8.6%
14.7%
12.2%
26.4%
26.4%
20.4%
48.9%
51.1%
17.8%
12.1%
19.3%
16.5%
14.1%
10.9%
9.3%
11.3%
10.0%
24.7%
27.9%
26.0%
38.9%
61.1%
18.9%
11.0%
20.2%
17.6%
15.2%
10.2%
6.9%
16.5%
11.7%
25.5%
25.1%
21.2%
50.5%
49.5%
12.3%
11.2%
20.7%
17.6%
17.1%
11.7%
9.3%
16.9%
11.8%
25.2%
25.0%
21.2%
Note: numbers may not add up to 100% due to rounding; (1) used in the past 30 days; (2) viewed in the past week; (3) listened yesterday; (4) read any publication; (5) read weekday and Sunday publicationsSource: TGI Latina, "2011 Argentina Study, Waves 2-4, 2011, Wave 1, 2012," 2012; provided by Starcom MediaVest Group, June 1, 2012141185 www.eMarketer.com
141185
INTERNET
millions, % of population and % changeInternet Users and Penetration in Argentina, 2011-2016
2011
20.8
49.8%
11.1%
2012
22.9
54.3%
10.1%
2013
25.0
58.7%
9.2%
2014
27.1
63.0%
8.4%
2015
29.0
66.8%
7.0%
2016
29.8
68.0%
2.7%
Internet users % of population % change
Note: individuals of any age who use the internet from any location via anydevice at least once per monthSource: eMarketer, Feb 2012136989 www.eMarketer.com
136989

The Global Media Intelligence Report: Latin America Copyright ©2012 eMarketer, Inc. All rights reserved. LA-5
Argentina
Comparative Estimates: Internet Users andPenetration in Argentina, 2010-2012
2010 2011 2012
Internet users (millions)eMarketer*, Feb 2012 18.7 20.8 22.9comScore Inc.**, May 2012 - 12.9 13.4
Prince & Cooke, Dec 2011 26.5 30.5 -
Internet user penetration (% of population)eMarketer*, Feb 2012 45.3% 49.8% 54.3%TGI Latina***, June 2012 - 53.6% -
ITU, July 2012 - 47.7% -
Note: *individuals of any age who use the internet from any location viaany device at least once per month; **ages 15+; home and work locations;data is for Jan of each year; ***ages 12-75; used in the past 30 daysSource: eMarketer, Feb 2012; various, as noted, 2011 & 2012143240 www.eMarketer.com
143240
Gender Age
Socioeconomic status
% of total
Demographic Profile of Internet Users in Argentina,2011
Male52.0%
Female48.0%
12-1926.0%
20-2416.0%
25-3422.3%
35-4415.6%
45-5411.7%
55-645.9%
65-752.5%
ABC119.2%
C215.2%
C331.0%
D121.9%
D212.7%
Note: used in the past month; numbers may not add up to 100% due toroundingSource: TGI Latina, "2011 Argentina Study, Waves 2-4, 2011, Wave 1, 2012," 2012; provided by Starcom MediaVest Group, June 1, 2012141190 www.eMarketer.com
141190
Fixed Broadband Households and Subscriptions in Argentina, 2010-2016
Households (millions)—% change
—Household penetration
Subscriptions (millions)—% change
2010
4.221.8%
37.5%
5.119.5%
2011
4.814.9%
42.7%
7.444.7%
2012
5.310.4%
46.7%
9.021.4%
2013
5.77.2%
49.6%
10.414.7%
2014
6.05.1%
51.7%
11.38.9%
2015
6.23.6%
53.1%
11.84.8%
2016
6.32.7%
54.1%
12.33.9%
Note: includes connections with permanent access to the internet viacable modem, DSL, fiber and wireless/satellite technologies; excludesmobileSource: eMarketer, April 2012139108 www.eMarketer.com
139108
Comparative Estimates: Fixed Broadband Householdsand Penetration in Argentina, 2010-2012
2010 2011 2012
Fixed broadband households (millions)eMarketer*, April 2012 4.2 4.8 5.3GroupM, April 2012 3.8 4.3 4.7
INDEC**, March 2012 5.1 8.1 -
Fixed broadband household penetration (% of households)PwC, June 2012 43.2% 50.6% 55.6%
eMarketer*, April 2012 37.5% 42.7% 46.7%GroupM, April 2012 33.0% 36.0% 39.0%
Note: *includes connections with permanent access to the internet viacable modem, DSL, fiber and wireless/satellite technologies; excludesmobile; **data is for Dec of each yearSource: eMarketer, April 2012; various, as noted, 2012143241 www.eMarketer.com
143241
Social Network Users and Penetration in Argentina,2010-2014
Social network users (millions)—% change
—% of internet users
—% of population
2010
11.639.4%
61.8%
28.0%
2011
14.122.0%
67.9%
33.8%
2012
15.912.7%
69.5%
37.7%
2013
17.811.5%
71.0%
41.7%
2014
19.59.9%
72.0%
45.4%
Note: internet users who use a social network site via any device at leastonce per monthSource: eMarketer, Aug 2012143662 www.eMarketer.com
143662
% of internet users
Comparative Estimates: Social Network UserPenetration in Argentina, 2011 & 2012
Ipsos*, March 2012
eMarketer, Aug 2012
comScore Inc.**,Dec 2011
Randstad, March 2011
TGI Latina, June 2012
2011
-
67.9%
96.0%
84.0%
64.8%
2012
76.0%
69.5%
-
-
-
Usage
Visited in past 3 months
Use via any device atleast once per month
-
Have a profile
Used in past 30 days
Age
16-64
All ages
15+
18-65
12-75
Note: *includes social network sites, forums or blogs; **home and worklocations; data is for OctSource: eMarketer, Aug 2012; various, as noted, 2011 & 2012143243 www.eMarketer.com
143243
The Global Media Intelligence Report: Latin America Copyright ©2012 eMarketer, Inc. All rights reserved. LA-6
Argentina
% of total
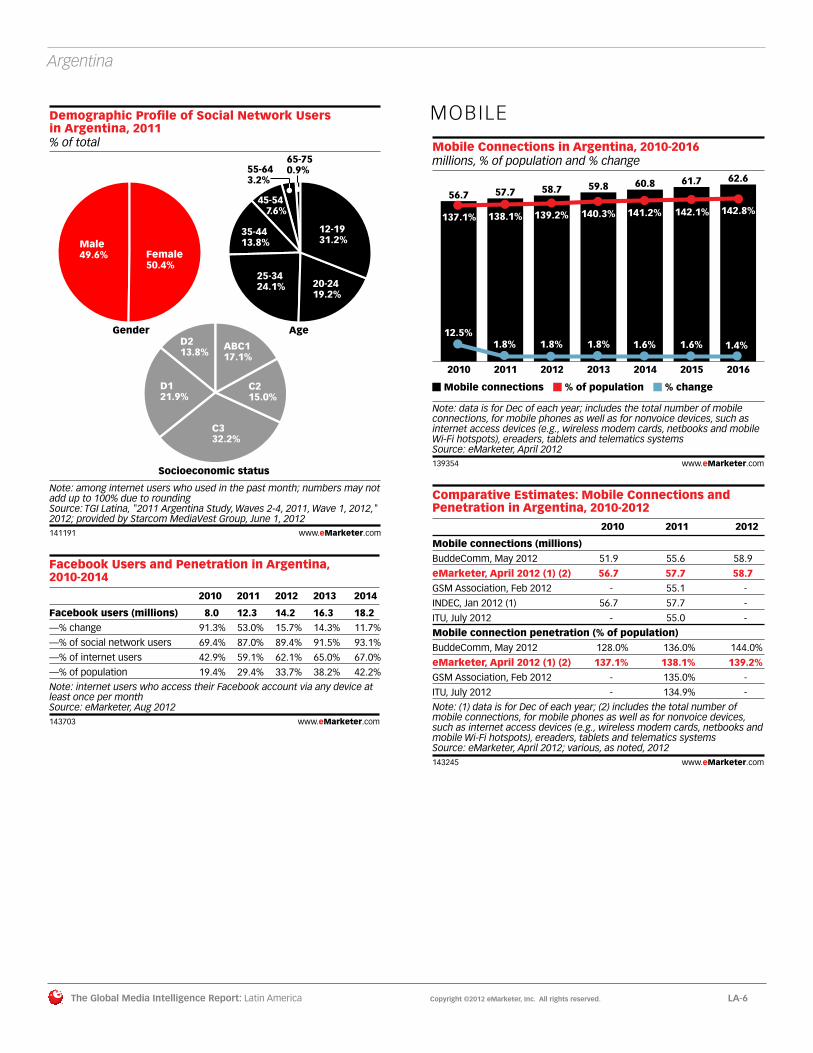
Demographic Profile of Social Network Usersin Argentina, 2011
Note: among internet users who used in the past month; numbers may notadd up to 100% due to roundingSource: TGI Latina, "2011 Argentina Study, Waves 2-4, 2011, Wave 1, 2012," 2012; provided by Starcom MediaVest Group, June 1, 2012141191 www.eMarketer.com
Gender Age
Socioeconomic status
Female50.4%
Male49.6%
12-1931.2%
20-2419.2%
25-3424.1%
35-4413.8%
45-54 7.6%
55-643.2%
65-750.9%
ABC117.1%
C215.0%
C332.2%
D121.9%
D213.8%
141191
Facebook Users and Penetration in Argentina,2010-2014
2010 2011 2012 2013 2014
Facebook users (millions) 8.0 12.3 14.2 16.3 18.2—% change 91.3% 53.0% 15.7% 14.3% 11.7%
—% of social network users 69.4% 87.0% 89.4% 91.5% 93.1%
—% of internet users 42.9% 59.1% 62.1% 65.0% 67.0%
—% of population 19.4% 29.4% 33.7% 38.2% 42.2%
Note: internet users who access their Facebook account via any device atleast once per monthSource: eMarketer, Aug 2012143703 www.eMarketer.com
143703
MOBILE
millions, % of population and % changeMobile Connections in Argentina, 2010-2016
2010
56.7
137.1%
12.5%
2011
57.7
138.1%
1.8%
2012
58.7
139.2%
1.8%
2013
59.8
140.3%
1.8%
2014
60.8
141.2%
1.6%
2015
61.7
142.1%
1.6%
2016
62.6
142.8%
1.4%
Mobile connections % of population % change
Note: data is for Dec of each year; includes the total number of mobileconnections, for mobile phones as well as for nonvoice devices, such asinternet access devices (e.g., wireless modem cards, netbooks and mobileWi-Fi hotspots), ereaders, tablets and telematics systemsSource: eMarketer, April 2012139354 www.eMarketer.com
139354
Comparative Estimates: Mobile Connections andPenetration in Argentina, 2010-2012
2010 2011 2012
Mobile connections (millions)BuddeComm, May 2012 51.9 55.6 58.9
eMarketer, April 2012 (1) (2) 56.7 57.7 58.7GSM Association, Feb 2012 - 55.1 -
INDEC, Jan 2012 (1) 56.7 57.7 -
ITU, July 2012 - 55.0 -
Mobile connection penetration (% of population)BuddeComm, May 2012 128.0% 136.0% 144.0%
eMarketer, April 2012 (1) (2) 137.1% 138.1% 139.2%GSM Association, Feb 2012 - 135.0% -
ITU, July 2012 - 134.9% -
Note: (1) data is for Dec of each year; (2) includes the total number ofmobile connections, for mobile phones as well as for nonvoice devices,such as internet access devices (e.g., wireless modem cards, netbooks andmobile Wi-Fi hotspots), ereaders, tablets and telematics systemsSource: eMarketer, April 2012; various, as noted, 2012143245 www.eMarketer.com
143245

The Global Media Intelligence Report: Latin America Copyright ©2012 eMarketer, Inc. All rights reserved. LA-7
Argentina
millions, % of population and % changeMobile Phone Users in Argentina, 2010-2016
2010
31.0
75.0%
6.7%
2011
32.2
77.0%
3.7%
2012
33.3
79.0%
3.6%
2013
34.5
81.0%
3.5%
2014
35.3
82.0%
2.2%
2015
36.0
83.0%
2.2%
2016
36.8
84.0%
2.1%
Mobile phone users % of population % change
Note: mobile phone users are individuals of any age who own at least onemobile phone and use the phone(s) at least once per monthSource: eMarketer, April 2012139312 www.eMarketer.com
139312
% of total
Demographic Profile of Mobile Phone Ownersin Argentina, 2011
Note: numbers may not add up to 100% due to roundingSource: TGI Latina, "2011 Argentina Study, Waves 2-4, 2011, Wave 1, 2012," 2012; provided by Starcom MediaVest Group, June 1, 2012141192 www.eMarketer.com
Gender Age
Socioeconomic status
Female51.2%
Male48.8%
12-1917.7%
20-2413.4%
25-3421.7%
35-4418.1%
45-5415.1%
55-64 9.2%
65-754.8%
ABC113.9%
C211.9%
C326.5%
D126.8%
D221.0%
141192
Smartphone Users and Penetration in Argentina,2010-2016
Smartphoneusers (millions)—% change
—% of mobilephone users
—% of population
2010
2.5
70.8%
8.0%
6.0%
2011
5.5
120.4%
17.0%
13.1%
2012
7.7
40.2%
23.0%
18.2%
2013
10.0
30.6%
29.0%
23.5%
2014
12.3
23.4%
35.0%
28.7%
2015
14.8
19.7%
41.0%
34.0%
2016
16.6
12.1%
45.0%
37.8%
Note: smartphone users are individuals of any age who own at least onesmartphone and use the smartphone(s) at least once per monthSource: eMarketer, April 2012139344 www.eMarketer.com
139344
% of total
Demographic Profile of Smartphone Owners in Argentina, 2011
Note: numbers may not add up to 100% due to roundingSource: TGI Latina, "2011 Argentina Study, Waves 2-4, 2011, Wave 1, 2012," 2012; provided by Starcom MediaVest Group, June 1, 2012141193 www.eMarketer.com
Gender Age
Socioeconomic status
Male59.0%
Female41.0%
12-1922.0%
20-2413.5%
25-3428.5%
35-4420.5%
45-54 8.5%
55-644.5%
65-752.5%
ABC121.9%
C216.3%
C330.7%
D116.3%
D214.9%
141193
Mobile Internet Users and Penetration in Argentina,2010-2016
2016
Mobile internetusers (millions)
16.9
—% change 11.9%
—% of mobilephone users
46.0%
—% of population
2010
2.8
37.2%
9.0%
6.8%
2011
5.8
107.5%
18.0%
13.9%
2012
8.0
38.2%
24.0%
19.0%
2013
10.4
29.4%
30.0%
24.3%
2014
12.7
22.7%
36.0%
29.5%
2015
15.1
19.2%
42.0%
34.9% 38.6%
Note: mobile phone users of any age who access the internet from amobile browser or an installed application at least once per month;excludes SMS, MMS and IMSource: eMarketer, April 2012139327 www.eMarketer.com
139327
The Global Media Intelligence Report: Latin America Copyright ©2012 eMarketer, Inc. All rights reserved. LA-8
Argentina
% of total
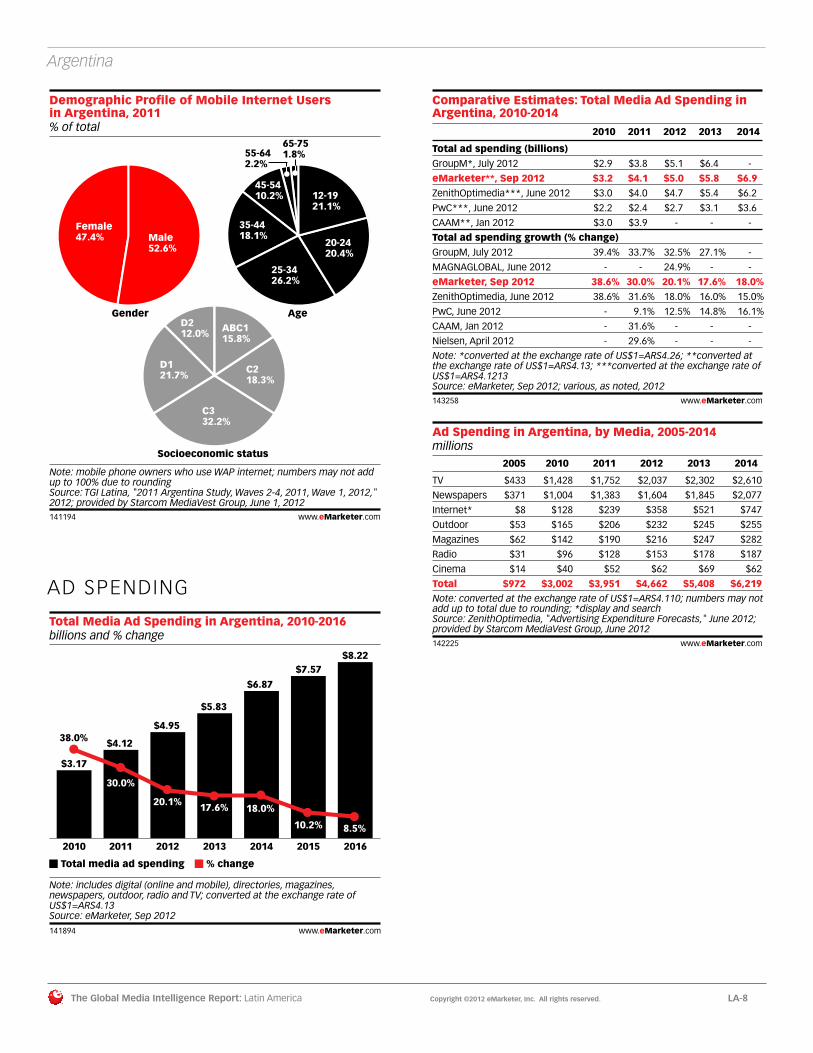
Demographic Profile of Mobile Internet Usersin Argentina, 2011
Note: mobile phone owners who use WAP internet; numbers may not addup to 100% due to roundingSource: TGI Latina, "2011 Argentina Study, Waves 2-4, 2011, Wave 1, 2012," 2012; provided by Starcom MediaVest Group, June 1, 2012141194 www.eMarketer.com
Gender Age
Socioeconomic status
Male52.6%
Female47.4%
12-1921.1%
20-2420.4%
25-3426.2%
35-4418.1%
45-5410.2%
55-642.2%
65-751.8%
ABC115.8%
C218.3%
C332.2%
D121.7%
D212.0%
141194
AD SPENDING
billions and % changeTotal Media Ad Spending in Argentina, 2010-2016
$3.17
38.0% $4.12
30.0%
$4.95
20.1%
$5.83
17.6%
$6.87
18.0%
$7.57
10.2%
$8.22
8.5%
Total media ad spending % change
Note: includes digital (online and mobile), directories, magazines, newspapers, outdoor, radio and TV; converted at the exchange rate of US$1=ARS4.13Source: eMarketer, Sep 2012
141894 www.eMarketer.com
20112010 2012 2013 2014 2015 2016
141894
Comparative Estimates: Total Media Ad Spending inArgentina, 2010-2014
2010 2011 2012 2013 2014
Total ad spending (billions)GroupM*, July 2012 $2.9 $3.8 $5.1 $6.4 -
eMarketer**, Sep 2012 $3.2 $4.1 $5.0 $5.8 $6.9ZenithOptimedia***, June 2012 $3.0 $4.0 $4.7 $5.4 $6.2
PwC***, June 2012 $2.2 $2.4 $2.7 $3.1 $3.6
CAAM**, Jan 2012 $3.0 $3.9 - - -
Total ad spending growth (% change)GroupM, July 2012 39.4% 33.7% 32.5% 27.1% -
MAGNAGLOBAL, June 2012 - - 24.9% - -
eMarketer, Sep 2012 38.6% 30.0% 20.1% 17.6% 18.0%ZenithOptimedia, June 2012 38.6% 31.6% 18.0% 16.0% 15.0%
PwC, June 2012 - 9.1% 12.5% 14.8% 16.1%
CAAM, Jan 2012 - 31.6% - - -
Nielsen, April 2012 - 29.6% - - -
Note: *converted at the exchange rate of US$1=ARS4.26; **converted atthe exchange rate of US$1=ARS4.13; ***converted at the exchange rate ofUS$1=ARS4.1213Source: eMarketer, Sep 2012; various, as noted, 2012143258 www.eMarketer.com
143258
millionsAd Spending in Argentina, by Media, 2005-2014
TV
Newspapers
Internet*
Outdoor
Magazines
Radio
Cinema
Total
2005
$433
$371
$8
$53
$62
$31
$14
$972
2010
$1,428
$1,004
$128
$165
$142
$96
$40
$3,002
2011
$1,752
$1,383
$239
$206
$190
$128
$52
$3,951
2012
$2,037
$1,604
$358
$232
$216
$153
$62
$4,662
2013
$2,302
$1,845
$521
$245
$247
$178
$69
$5,408
2014
$2,610
$2,077
$747
$255
$282
$187
$62
$6,219Note: converted at the exchange rate of US$1=ARS4.110; numbers may notadd up to total due to rounding; *display and searchSource: ZenithOptimedia, "Advertising Expenditure Forecasts," June 2012;provided by Starcom MediaVest Group, June 2012142225 www.eMarketer.com
142225

The Global Media Intelligence Report: Latin America Copyright ©2012 eMarketer, Inc. All rights reserved. LA-9
Argentina
20112010 2012 2013 2014 2015 2016
billions and % changeDigital Ad Spending in Argentina, 2010-2016
$0.22
44.0%
$0.34
55.1%
$0.47
37.0%$0.59
27.0%
$0.77
30.0%
$0.94
22.0%
$1.11
18.0%
Digital ad spending % change
Note: includes advertising that appears on desktop and laptop computers as well as mobile phones and tablets, and includes all the various formats of advertising on those platforms; excludes SMS, MMS and P2P messaging-based advertising; CAGR (2011-2016)=26.6%; converted at the exchange rate of US$1=ARS4.13Source: eMarketer, Sep 2012141947 www.eMarketer.com
141947
Comparative Estimates: Digital Ad Spending inArgentina, 2010-2014
Digital ad spending (millions)eMarketer, Sep 2012GroupM, July 2012 (1) (2)
ZenithOptimedia, June 2012 (1) (3)
PwC, June 2012 (4)
IAB Argentina, April 2012 (4)
CAAM, Jan 2012 (5)
BCG, March 2012
Digital ad spending growth (% change)ZenithOptimedia, June 2012 (1)
eMarketer, Sep 2012GroupM, July 2012 (1)
PwC, June 2012
IAB Argentina, April 2012
CAAM, Jan 2012
2010
$220.0$124.0
$128.0
$87.0
$127.8
$127.8
$300.0
49.5%
44.0%70.3%
-
-
-
2011
$340.0$269.0
$239.0
$95.0
$277.7
$238.2
-
86.5%
55.1%117.2%
9.2%
117.0%
86.5%
2012
$470.0$363.0
$358.0
$110.0
-
-
-
49.5%
37.0%35.0%
15.8%
-
-
2013
$590.0$491.0
$521.0
$126.0
-
-
-
45.5%
27.0%35.0%
14.5%
-
-
2014
$770.0-
$747.0
$144.0
-
-
-
43.4%
30.0%-
14.3%
-
-
Note: (1) excludes mobile; (2) converted at the exchange rate ofUS$1=ARS4.26; (3) converted at the exchange rate of US$1=ARS4.110; (4)converted at the exchange rate of US$1=ARS4.1213; (5) converted at theexchange rate of US$1=ARS4.13Source: eMarketer, Sep 2012; various, as noted, 2012143259 www.eMarketer.com
143259
millions and % changeMobile Ad Spending in Argentina, 2010-2016
$3.7
58.5%
$6.4
72.0%
$11.0
73.0%
$18.1
65.0%
$32.7
80.3%
$51.0
56.0%
$70.4
38.0%
Mobile ad spending % change
Note: includes display (banners, video and rich media) and search; excludesSMS, MMS and P2P messaging-based advertising; includes ad spending ontablets; converted at the exchange rate of US$1=ARS4.13; CAGR(2011-2016)=61.8%Source: eMarketer, Sep 2012142059 www.eMarketer.com
20112010 2012 2013 2014 2015 2016
142059

The Global Media Intelligence Report: Latin America Copyright ©2012 eMarketer, Inc. All rights reserved. LA-10
Brazil ■ Brazil was the world’s sixth largest economy in early 2012, and may rise to fifth position by the end of the year, according to “The World Factbook” prepared by the Central Intelligence Agency. But the country is not immune to financial wobbles. Industrial activity and services are gradually gaining on agriculture as sources of national revenue, but weak infrastructure and an overly complex tax regime have been identified by the EIU as major hindrances to business and investment. Brazilian GDP climbed by just 2.7% in 2011, according to the IMF, and the growth rate will dip slightly, to 2.5%, in 2012. But analysts expect a palpable boost in 2013, as the country prepares for the 2014 FIFA World Cup soccer tournament. Annual rises in GDP should remain at or above 4% between 2013 and 2016, the EIU has forecast. Brazil’s increasing population—approaching 200 million this year—is still seen as a plus, providing an ever-larger labor force, rather than a pressure on resources.
■ Even in towns and cities, most Brazilians are beyond the reach of broadband. Fewer than 30% of households will have a fixed broadband internet connection in 2012, eMarketer estimates, and the proportion will likely remain below 40% until 2016. As a result, web usage has been slow to take off, and the market is underdeveloped. eMarketer projects that just 42% of the population will go online at least once per month in 2012. Even in 2016, less than half (48%) of Brazil’s population is expected to use the web. That will amount to an estimated user base of 103 million people, however, compared to 86.4 million in 2012. eMarketer’s calculations of internet user numbers in Brazil are very close to those of other research firms, with the exception of comScore and Nielsen, which evaluate access from home and work locations only. This approach clearly excludes the many people who go online in public places such as libraries and internet cafes.
■ Despite relatively low levels of internet penetration, Brazil has embraced many aspects of the digital lifestyle. One is social networking. Nearly 64 million people—74% of the country’s online population—will use social sites at least monthly in 2012, eMarketer has projected. Moreover, the number of social networkers is growing by more than 13% annually. In less than two years, an estimated 79.3 million web users in Brazil will be regular visitors to virtual communities. The pre-eminence of Facebook, which will attract some 48% of the online population in Brazil in 2012, is less marked than in several other Latin countries, including Argentina and Mexico. But more than 87% of social network users in Brazil are expected to have Facebook accounts in 2014.
■ Brazil hosts a burgeoning mobile community. The number of mobile device connections jumped by nearly 20% in 2011, and will show similar double-digit growth again this year. By the end of 2013, total connections will reach almost 300 million. eMarketer estimates that in 2012, 58% of all residents will have at least one mobile phone. Females outnumbered males among the mobile population in 2011—by 52.8% to 47.2%—but mobile usage was widely distributed among all age and income groups, with the exception of seniors (ages 65 to 75) and the poorest residents. By contrast, use of smartphones and the mobile web was generally associated with younger, more affluent demographic segments in 2011. And the mobile internet, in particular, remains a minority activity. Just 31% of Brazil’s mobile phone users will go online via handset in 2012, according to eMarketer calculations.
■ Research firms generally agree that the Brazilian advertising industry enjoyed a significant lift in 2011, and most predict another growth spurt in 2012. Estimates for total ad spending this year range from $14.6 billion (GroupM, July 2012) to $20.3 billion (Projeto Inter-Meios [PIM], March 2012), though most projections—including eMarketer’s—cluster between $18 billion and $19.5 billion.
■ Estimates of online ad spending differ widely. eMarketer forecasts that online spending will rise 40.2% this year, and pass $2 billion. GroupM, by contrast, has pegged 2012 online spending at just $983 million, about one-third of the $2.78 billion proposed by PIM. Both PwC and ZenithOptimedia anticipate online ad spending growth of 12% to 13% this year, while PIM and GroupM foresee a leap of approximately 39%. Some of these discrepancies likely arise from differences in methodology, but it also seems clear that analysts have divergent views on the short-term strength and potential of the market.
■ Advertisers are rushing to take advantage of an explosion in mobile usage. eMarketer estimates that spending on mobile display and search ads in Brazil will nearly double this year, to $24.6 million. Annual growth rates will remain above 80% in 2013 and 2014. In 2016, mobile ad spending will approach $200 million.

The Global Media Intelligence Report: Latin America Copyright ©2012 eMarketer, Inc. All rights reserved. LA-11
Brazil
POPULATION
millionsPopulation in Brazil, 2010-2020
Note: population as of July for each yearSource: US Census Bureau, International Data Base, June 27, 2012142195 www.eMarketer.com
2010 2012 2014 2016 2018 2020
200
400
195.8 199.3 202.7 205.8 208.8 211.7
142195
MEDIA
% of populationMedia Penetration in Brazil, 2011
TV viewers (1) 97.3%
Mobile phone owners 81.4%
Internet users (2) 56.5%
Radio listeners (3) 50.3%
Magazine readers (4) 40.2%
Cable/satellite TV viewers (1)34.4%
Newspaper readers (5)33.7%
Mobile internet users (6)10.2%
Note: ages 12-75; (1) viewed in the past week; (2) used in the past 30 days;(3) listened yesterday; (4) read any publication; (5) read weekday andSunday publications; (6) mobile phone owners who use WAP internetSource: TGI Latina, "2011 Brazil Study, Waves 1 & 2," 2012; provided byStarcom MediaVest Group, June 1, 2012141412 www.eMarketer.com
141412
% of totalDemographic Profile of Media Users in Brazil, 2011
GenderMale
Female
Age12-19
20-24
25-34
35-44
45-54
55-64
65-75
Socioeconomic statusAB1
B2
C1
C2
DE
49.0%
51.0%
23.6%
14.6%
25.0%
17.1%
12.1%
5.8%
1.8%
29.6%
24.8%
27.6%
13.4%
4.5%
47.2%
52.8%
15.4%
11.9%
23.5%
19.5%
15.9%
9.5%
4.4%
22.2%
21.0%
29.1%
18.3%
9.5%
47.4%
52.6%
16.9%
10.5%
20.8%
18.5%
16.3%
10.8%
6.2%
18.6%
19.9%
28.9%
20.2%
12.4%
51.0%
49.0%
17.8%
11.3%
21.8%
17.3%
16.7%
10.1%
5.0%
39.1%
24.6%
23.2%
10.3%
2.8%
48.7%
51.3%
16.1%
10.6%
20.9%
19.0%
17.0%
10.7%
5.8%
20.5%
20.0%
27.9%
19.7%
11.9%
39.9%
60.1%
17.4%
10.9%
22.6%
19.9%
15.5%
9.4%
4.4%
31.9%
22.7%
25.7%
14.1%
5.5%
52.4%
47.6%
10.3%
9.3%
23.4%
19.4%
18.3%
12.7%
6.5%
29.4%
21.9%
27.1%
15.3%
6.3%
Note: numbers may not add up to 100% due to rounding; (1) used in the past 30 days; (2) viewed in the past week; (3) listened to AM/FM yesterday; (4) read any publication; (5) read weekday and Sunday publicationsSource: TGI Latina, "2011 Brazil Study, Waves 1 & 2," 2012; provided byStarcom MediaVest Group, June 1, 2012141413 www.eMarketer.com
Internet users (1)
Mobile phone owners
TV viewers (2)
Cable/satellite TV viewers (2)
Radio listeners (3)
Magazine readers (4)
Newspaper readers (5)
141413
INTERNET
millions, % of population and % changeInternet Users and Penetration in Brazil, 2011-2016
2011
79.3
39.0%
9.0%
2012
86.4
42.0%
8.9%
2013
91.5
44.0%
5.9%
2014
96.7
46.0%
5.7%
2015
99.8
47.0%
3.2%
2016
103.0
48.0%
3.2%
Internet users % of population % change
Note: individuals of any age who use the internet from any location via anydevice at least once per monthSource: eMarketer, Feb 2012136990 www.eMarketer.com
136990

The Global Media Intelligence Report: Latin America Copyright ©2012 eMarketer, Inc. All rights reserved. LA-12
Brazil
Comparative Estimates: Internet Users andPenetration in Brazil, 2010-2012
2010 2011 2012
Internet users (millions)eMarketer, Feb 2012 - 79.3 86.4comScore Inc., May 2012 (1) - 40.5 46.3
BCG, April 2012 - 82.0 -
IBOPE, April 2012 (2) 73.9 79.9 -
F/Nazca Saatchi & Saatchi, Dec 2011 (3) - 78.0 -
Nielsen, Dec 2011 (4) 39.3 44.9 -
Internet user penetration (% of population)eMarketer, Feb 2012 - 39.0% 42.0%TGI Latina, June 2012 (5) - 56.5% -
NIC.BR, May 2012 (6) 48.0% 53.0% -
F/Nazca Saatchi & Saatchi, Aug 2011 (7) 47.0% 51.0% -
ITU, July 2012 - 45.0% -
Note: (1) ages 15+; data is for Jan of each year; (2) data is for Q4; (3) ages12+; data is for Aug; (4) data is for July; includes applications; (5) ages12-75; (6) ages 10+; (7) ages 16+Source: eMarketer, Feb 2012; various, as noted, 2011 & 2012143283 www.eMarketer.com
143283
% of totalDemographic Profile of Internet Users in Brazil, 2011
Note: used in the past month; numbers may not add up to 100% due toroundingSource: TGI Latina, "2011 Brazil Study, Waves 1 & 2," 2012; provided byStarcom MediaVest Group, June 1, 2012141414 www.eMarketer.com
Gender Age
Socioeconomic status
Female51.0%
Male49.0%
12-1923.6%
20-2414.6%
25-3425.0%
35-4417.1%
45-5412.1%
55-645.8%
65-751.8%
AB129.6%
B224.8%
C127.6%
C213.4%
DE4.5%
141414
Fixed Broadband Households and Subscriptions in Brazil, 2010-2016
Households (millions)—% change
—Household penetration
Subscriptions (millions)—% change
2010
12.821.8%
23.0%
13.821.1%
2011
15.017.5%
26.6%
16.116.7%
2012
17.013.0%
29.6%
18.112.4%
2013
18.911.4%
32.5%
20.010.3%
2014
20.89.9%
35.2%
21.68.4%
2015
22.68.9%
37.8%
23.47.9%
2016
24.58.1%
40.3%
25.17.4%
Note: eMarketer benchmarks its Brazil broadband subscription numbersagainst Teleco, for which the last full year measured was 2010; includesconnections with permanent access to the internet via cable modem, DSL,fiber and wireless/satellite technologies; excludes mobileSource: eMarketer, April 2012139109 www.eMarketer.com
139109
Comparative Estimates: Fixed Broadband Householdsand Penetration in Brazil, 2010-2012
2010 2011 2012
Fixed broadband households (millions)eMarketer*, April 2012 12.8 15.0 17.0GroupM, April 2012 12.5 14.3 15.7
Telebrasil, May 2011 17.4 - -
Fixed broadband household penetration (% of households)PwC, June 2012 22.1% 27.6% 34.8%
eMarketer*, April 2012 23.0% 26.6% 29.6%GroupM, April 2012 22.0% 24.0% 26.0%
Ofcom**, Dec 2011 25.0% - -
Note: *includes connections with permanent access to the internet viacable modem, DSL, fiber and wireless/satellite technologies; excludesmobile; **includes business broadband linesSource: eMarketer, April 2012; various, as noted, 2011 & 2012143284 www.eMarketer.com
143284
Social Network Users and Penetration in Brazil,2010-2014
Social network users (millions)—% change
—% of internet users
—% of population
2010
47.316.5%
65.0%
23.5%
2011
56.319.0%
71.0%
27.7%
2012
63.913.5%
74.0%
31.1%
2013
72.313.1%
79.0%
34.8%
2014
79.39.7%
82.0%
37.7%
Note: internet users who use a social network site via any device at leastonce per monthSource: eMarketer, Aug 2012143663 www.eMarketer.com
143663

The Global Media Intelligence Report: Latin America Copyright ©2012 eMarketer, Inc. All rights reserved. LA-13
Brazil
% of internet users
Comparative Estimates: Social Network UserPenetration in Brazil, 2011 & 2012
Hi-Mídia & M.sense, March2012
eMarketer, Aug 2012
Ipsos, March 2012 (1)
comScore Inc., Dec 2011 (2)
F/Nazca Saatchi & Saatchi,Dec 2011 (3)
InSites Consulting, Sep2011 (4)
UM, Feb 2012
NIC.BR, May 2012
TGI Latina, June 2012
2011
-
71.0%
-
97.4%
93.0%
86.0%
74.3%
69.0%
67.2%
95.0%
2012
74.0%
62.0%
-
-
-
-
-
-
-
Usage
Use
Use via anydevice atleast onceper month
Visited in past3 months
Use
Use
Used in past6 months
Used in past3 months
Used in past30 days
Age
12+
All ages
16-64
15+
12+
15+
16-54
10+
12-75
Note: (1) includes social network sites, forums or blogs; (2) home and worklocations; data is for Oct; (3) data is for Aug; (4) data is for Q2Source: eMarketer, Aug 2012; various, as noted, 2011 & 2012143285 www.eMarketer.com
143285
% of total
Demographic Profile of Social Network Users in Brazil, 2011
Note: respondents are internet users; used virtual community sites in thepast month; numbers may not add up to 100% due to roundingSource: TGI Latina, "2011 Brazil Study, Waves 1 & 2," 2012; provided byStarcom MediaVest Group, June 1, 2012141419 www.eMarketer.com
Gender Age
Socioeconomic status
Female53.9%
Male46.1%
12-1930.6%
20-2417.8%
25-3427.3%
35-4413.7%
45-54 7.3%
55-642.8%
65-750.5%
AB126.2%
B225.0%
C129.6%
C214.6%
DE4.6%
141419
Facebook Users and Penetration in Brazil, 2010-2014
2010 2011 2012 2013 2014
Facebook users (millions) 7.3 28.2 41.5 60.0 69.2—% change 92.4% 288.0% 46.8% 44.7% 15.3%
—% of social network users 15.4% 50.1% 64.9% 83.0% 87.3%
—% of internet users 10.0% 35.6% 48.0% 65.6% 71.6%
—% of population 3.6% 13.9% 20.2% 28.9% 32.9%
Note: internet users who access their Facebook account via any device atleast once per monthSource: eMarketer, Aug 2012143704 www.eMarketer.com
143704
MOBILE
millions, % of population and % changeMobile Connections in Brazil, 2010-2016
2010
202.9
100.9%
16.6%
2011
242.2
119.1%
19.4%
2012
276.1
134.2%
14.0%
2013
295.5
142.1%
7.0%
2014
307.3
146.2%
4.0%
2015
318.0
149.8%
3.5%
2016
327.6
152.7%
3.0%
Mobile connections % of population % change
Note: data is for Dec of each year; includes the total number of mobileconnections, for mobile phones as well as for nonvoice devices, such asinternet access devices (e.g., wireless modem cards, netbooks and mobileWi-Fi hotspots), ereaders, tablets and telematics systemsSource: eMarketer, April 2012139355 www.eMarketer.com
139355

The Global Media Intelligence Report: Latin America Copyright ©2012 eMarketer, Inc. All rights reserved. LA-14
Brazil
Comparative Estimates: Mobile Connections andPenetration in Brazil, 2010-2012
Mobile connections (millions)BuddeComm, March 2012
eMarketer*, April 2012Anatel*, Jan 2012 (2)
ITU, July 2012
GSM Association, Feb 2012
Mobile connection penetration (% of population)BuddeComm, March 2012
eMarketer*, April 2012Anatel*, Jan 2012
ITU, July 2012
GSM Association, Feb 2012
Pyramid Research, Jan 2012
2010
206.3
202.9202.9
-
-
104.0%
100.9%104.7%
-
-
-
2011
246.4
242.2242.2
242.2
240.1
123.0%
119.1%123.9%
123.2%
123.0%
118.0%
2012
293.0
276.1-
-
-
145.0%
134.2%-
-
-
-
Note: *data is for Dec of each yearSource: eMarketer, April 2012; various, as noted, 2012143286 www.eMarketer.com
143286
millions, % of population and % changeMobile Phone Users in Brazil, 2010-2016
2010
100.6
50.0%
10.0%
2011
109.9
54.0%
9.2%
2012
119.3
58.0%
8.6%
2013
128.9
62.0%
8.1%
2014
137.7
65.5%
6.8%
2015
146.5
69.0%
6.4%
2016
155.5
72.5%
6.1%
Mobile phone users % of population % change
Note: mobile phone users are individuals of any age who own at least onemobile phone and use the phone(s) at least once per monthSource: eMarketer, April 2012139313 www.eMarketer.com
139313
% of total
Demographic Profile of Mobile Phone Owners in Brazil, 2011
Note: numbers may not add up to 100% due to roundingSource: TGI Latina, "2011 Brazil Study, Waves 1 & 2," 2012; provided byStarcom MediaVest Group, June 1, 2012141420 www.eMarketer.com
Gender Age
Socioeconomic status
Female52.8%
Male47.2%
12-1915.4%
20-2411.9%
25-3423.5%
35-4419.5%
45-5415.9%
55-649.5%
65-754.4%
AB122.2%
B221.0%C1
29.1%
C218.3%
DE9.5%
141420
Smartphone Users and Penetration in Brazil,2010-2016
Smartphoneusers (millions)—% change
—% of mobilephone users
—% of population
2010
6.5
78.7%
6.5%
3.3%
2011
20.9
219.3%
19.0%
10.3%
2012
34.6
65.8%
29.0%
16.8%
2013
47.1
36.0%
36.5%
22.6%
2014
63.3
34.6%
46.0%
30.1%
2015
80.6
27.3%
55.0%
38.0%
2016
94.9
17.7%
61.0%
44.2%
Note: smartphone users are individuals of any age who own at least onesmartphone and use the smartphone(s) at least once per monthSource: eMarketer, April 2012139345 www.eMarketer.com
139345

The Global Media Intelligence Report: Latin America Copyright ©2012 eMarketer, Inc. All rights reserved. LA-15
Brazil
% of total
Demographic Profile of Smartphone Owners in Brazil,2011
Note: numbers may not add up to 100% due to roundingSource: TGI Latina, "2011 Brazil Study, Waves 1 & 2," 2012; provided byStarcom MediaVest Group, June 1, 2012141421 www.eMarketer.com
Gender Age
Socioeconomic status
Male51.8%
Female48.2%
12-1918.2%
20-2414.3%
25-3428.1%
35-4419.6%
45-5412.5%
55-645.5%
65-751.8%
AB135.4%
B221.0%
C126.8%
C29.8%
DE7.0%
141421
Mobile Internet Users and Penetration in Brazil,2010-2016
Mobile internetusers (millions)—% change
—% of mobilephone users
—% of population
2010
8.0
46.7%
8.0%
4.0%
2011
25.3
214.1%
23.0%
12.4%
2012
37.0
46.4%
31.0%
18.0%
2013
49.0
32.5%
38.0%
23.6%
2014
64.7
32.1%
47.0%
30.8%
2015
82.1
26.8%
56.0%
38.6%
2016
96.4
17.5%
62.0%
45.0%
Note: mobile phone users of any age who access the internet from amobile browser or an installed application at least once per month;excludes SMS, MMS and IMSource: eMarketer, April 2012139328 www.eMarketer.com
139328
% of total
Demographic Profile of Mobile Internet Users in Brazil, 2011
Note: mobile phone owners who use WAP internet; numbers may not addup to 100% due to roundingSource: TGI Latina, "2011 Brazil Study, Waves 1 & 2," 2012; provided byStarcom MediaVest Group, June 1, 2012141422 www.eMarketer.com
Gender Age
Socioeconomic status
Male50.9%
Female49.1%
12-1920.7%
20-2417.0%
25-3430.5%
35-4416.8%
45-54 9.2%
55-644.5%
65-751.5%
AB134.7%
B223.2%
C128.2%
C210.0%
DE3.8%
141422
AD SPENDING
20112010 2012 2013 2014 2015 2016
billions and % changeTotal Media Ad Spending in Brazil, 2010-2016
$14.81
11.0%
$16.58
12.0%
$18.46
11.3%
$20.12
9.0%
$22.53
12.0%
$24.78
10.0%
$27.63
11.5%
Total media ad spending % change
Note: includes digital (online and mobile), directories, magazines, newspapers, outdoor, radio and TV; converted at the exchange rate of US$1=BRL1.67Source: eMarketer, Sep 2012
141895 www.eMarketer.com141895

The Global Media Intelligence Report: Latin America Copyright ©2012 eMarketer, Inc. All rights reserved. LA-16
Brazil
Comparative Estimates: Total Media Ad Spending inBrazil, 2010-2014
2010 2011 2012 2013 2014
Total ad spending (billions)Projeto Inter-Meios*, March 2012 $16.4 $18.2 $20.3 - -
MAGNAGLOBAL, June 2012 - - $19.5 $21.5 -
ZenithOptimedia*, June 2012 $15.5 $16.8 $18.7 $20.3 $22.2
eMarketer*, Sep 2012 $14.8 $16.6 $18.5 $20.1 $22.5PwC, June 2012 $13.8 $14.6 $15.5 $16.5 $20.3
GroupM**, July 2012 $12.3 $13.3 $14.6 $16.0 -
Total ad spending (% change)Projeto Inter-Meios, April 2012 - 10.6% 11.5% - -
eMarketer, Sep 2012 11.0% 12.0% 11.3% 9.0%12.0%ZenithOptimedia, June 2012 18.1% 8.7% 11.0% 8.8% 9.4%
GroupM, July 2012 13.2% 8.2% 10.0% 10.0% -
Carat, March 2012 - 8.1% 10.5% 8.0% -
Warc, Feb 2012 - 7.1% 8.5% - -
PwC, June 2012 - 5.8% 6.2% 6.5% 23.0%
Nielsen, April 2012 - 13.7% - - -
Note: *converted at the exchange rate of US$1=BRL1.67; **converted atthe exchange rate of US$1=BRL2.06Source: eMarketer, Sep 2012; various, as noted, 2012143287 www.eMarketer.com
143287
millionsAd Spending in Brazil, by Media, 2005-2014
TV
Newspapers
Magazines
Online display
Radio
Outdoor
Cinema
Total
2005
$5,907
$1,555
$839
$159
$399
$407
$32
$9,299
2010
$10,468
$1,938
$1,176
$727
$654
$458
$55
$15,476
2011
$11,480
$2,012
$1,217
$870
$676
$513
$52
$16,819
2012
$12,813
$2,195
$1,329
$983
$747
$539
$54
$18,661
2013
$13,909
$2,356
$1,401
$1,189
$795
$596
$58
$20,302
2014
$15,233
$2,523
$1,514
$1,383
$848
$653
$62
$22,216Note: converted at the exchange rate of US$1=BRL1.67; numbers may notadd up to total due to roundingSource: ZenithOptimedia, "Advertising Expenditure Forecasts," June 2012;provided by Starcom MediaVest Group, June 2012142227 www.eMarketer.com
142227
20112010 2012 2013 2014 2015 2016
billions and % changeDigital Ad Spending in Brazil, 2010-2016
$1.12
25.0%
$1.46
30.0%
$2.05
40.2%
$2.45
20.0%
$3.14
28.0%
$3.61
15.0%
$4.13
14.2%
Digital ad spending % change
Note: includes advertising that appears on desktop and laptop computers as well as mobile phones and tablets, and includes all the various formats of advertising on those platforms; excludes SMS, MMS and P2P messaging-based advertising; CAGR (2011-2016)=23.1%; converted at the exchange rate of US$1=BRL1.67Source: eMarketer, Sep 2012141948 www.eMarketer.com
141948
Comparative Estimates: Digital Ad Spending in Brazil,2010-2014
Digital ad spending (millions)
Projeto Inter-Meios,April 2012 (1)
eMarketer,Sep 2012 (1)
PwC, June 2012 (2)
GroupM, July 2012 (3) (4)
BCG, March 2012
Digital ad spending growth (% change)
eMarketer,Sep 2012Projeto Inter-Meios,April 2012GroupM, July 2012 (4)
ZenithOptimedia,June 2012 (4)
PwC, June 2012
2010
$1,455.1
$1,120.0
$864.0
$591.0
$1,700.0
25.0%
-
28.0%
28.0%
-
2011
$2,000.0
$1,460.0
$1,006.0
$707.0
-
30.0%
37.3%
19.6%
19.6%
16.4%
2012
$2,784.4
$2,050.0
$1,128.0
$983.0
-
40.2%
39.1%
38.9%
13.0%
12.1%
2013
-
$3,140.0
$1,274.0
$1,349.0
-
20.0%
-
37.3%
20.9%
12.9%
2014
-
$3,610.0
$1,440.0
-
-
28.0%
-
-
16.3%
13.0%Note: (1) converted at the exchange rate of US$1=BRL1.67; (2) converted atthe exchange rate of US$1=BRL1.6698; (3) converted at the exchange rateof US$1=BRL2.06; (4) excludes mobileSource: eMarketer, Sep 2012; various, as noted, 2012143298 www.eMarketer.com
143298

The Global Media Intelligence Report: Latin America Copyright ©2012 eMarketer, Inc. All rights reserved. LA-17
Brazil
millions and % changeMobile Ad Spending in Brazil, 2010-2016
$5.4
100.0%
$12.9
140.2%
$24.6
90.4%
$44.4
80.5% $85.2
92.0%$141.4
66.0%
$198.3
40.2%
Mobile ad spending % change
Note: includes display (banners, video and rich media) and search; excludesSMS, MMS and P2P messaging-based advertising; includes ad spending ontablets; converted at the exchange rate of US$1=BRL1.67; CAGR(2011-2016)=72.7%Source: eMarketer, Sep 2012142060 www.eMarketer.com
20112010 2012 2013 2014 2015 2016
142060

The Global Media Intelligence Report: Latin America Copyright ©2012 eMarketer, Inc. All rights reserved. LA-18
Chile ■ As of Q3 2012, Chile had avoided the worst effects of recent economic turmoil in the region and elsewhere in the world, thanks to healthy levels of investment and sound fiscal policies. According to the EIU, Chilean GDP rose by 6% in 2011 (The IMF is marginally more pessimistic, estimating the 2011 increase at 5.9%). Annual growth rates will drop somewhat, to 5% in 2012 and an average 4.8% between 2013 and 2016, the EIU anticipates. Budget surpluses are likely to continue through 2016. President Sebastián Piñera’s efforts to push through productivity reforms threaten a long-standing status quo and will be opposed by many politicians. Yet his popularity reached a record high in July 2012, following resoundingly positive economic performance in Q2.
■ Around 99% of residents ages 12 and older watched television weekly in 2011, according to TGI Latina’s “2011 Chile Study, Waves 1 & 2.” Radio also remained a powerful media platform, listened to by nearly 73% of the population in the day prior to the study. Penetration of cable and satellite TV were much lower, at 40.3% and 16.5%, respectively. As in other markets, print has suffered as Chilean consumers spend more time with online and mobile options. Females outnumbered males in every media audience except that for newspapers. Newspapers were also the medium with the highest proportion of consumers ages 65 and older (8.3%), and the lowest proportion of users ages 12 to 24 (18.9%).
■ Nearly two-thirds of Chilean residents ages 12 and older had home access to the internet in 2011, TGI reported. Since 2010, females have edged ahead of males in the online population, 52% to 48%. Perhaps surprisingly, the proportion of young people online has not shifted; as in 2010, half of those using the web in 2011 were ages 12 to 34. But the distribution of internet users by income has changed dramatically—and in a direction that should encourage digital advertisers. In 2010, an estimated 67% of those online had a monthly income of less than CLP330,000 ($647). In 2011, that proportion had fallen to 39%.
■ Social networking is a major attraction for younger internet users in Chile. Some 72.6% of those visiting virtual communities in 2011 were ages 12 to 34; less than 12% were ages 45 to 64. Females accounted for 52.8% of social network users last year.
■ Mobile has consolidated its place as the second-ranking media platform by reach. An estimated 88% of Chile’s consumers ages 12 and older owned a mobile phone in 2011, a rise of 5 percentage points compared to 2010,
according to TGI. Smartphone penetration also climbed significantly, from 10.8% to 14.4% of respondents. But mobile internet usage remained startlingly low, engaging just 3.9% of the population. Males accounted for 58.8% of smartphone users and 56.5% of mobile web users.
■ Spending in all measured media in Chile will approach $1.38 billion in 2012, up more than 7% in one year, according to ZenithOptimedia forecasts. TV and newspapers together will claim more than $1 billion of the total. Despite the high penetration of mobile phones, mobile and other digital advertising spending will amount to just $71 million, or less than 5.2% of all ad spending. Online spending is rising more rapidly than investment in any other channel, however, and is predicted to draw level with radio ad spending within two years.
POPULATION
millionsPopulation in Chile, 2010-2020
16.8 17.1 17.4 17.4 17.9 18.2
Note: population as of July for each yearSource: US Census Bureau, International Data Base, June 27, 2012142197 www.eMarketer.com
2010
20
40
2012 2014 2016 2018 2020
142197

The Global Media Intelligence Report: Latin America Copyright ©2012 eMarketer, Inc. All rights reserved. LA-19
Chile
MEDIA
% of populationMedia Penetration in Chile, 2011
TV viewers (1) 98.7%
Mobile phone owners 87.7%
Radio listeners (2) 72.7%
Internet users (3) 65.6%
Newspaper readers (4) 47.8%
Cable TV viewers 40.3%
Magazine readers (5) 34.7%
Satellite TV viewers16.5%
Smartphone owners14.4%
Mobile internet users (6)3.9%
Note: ages 12+; (1) viewed in the past week; (2) listened to AM/FMyesterday; (3) home access; (4) read weekday and Sunday publications; (5)read any publication; (6) access via feature phone, PDA, Smartphone,iPhone or BlackBerrySource: TGI Latina, "2011 Chile Study, Waves 1 & 2," 2012; provided byStarcom MediaVest Group, June 1, 2012141437 www.eMarketer.com
141437
% of totalDemographic Profile of Media Users in Chile, 2011
GenderMale
Female
Age12-17
18-24
25-34
35-44
45-54
55-64
65+
Monthly income (CLP)<164K
165K-330K
330K-440K
440K-825K
825K-1,100K
1,100K+
48.0%
52.0%
12.8%
16.5%
20.9%
19.1%
17.5%
8.6%
4.6%
2.4%
36.6%
16.6%
26.0%
9.3%
9.1%
48.7%
51.3%
10.8%
15.7%
21.5%
18.5%
17.2%
10.2%
6.2%
5.8%
43.1%
16.3%
21.3%
6.8%
6.8%
47.8%
52.2%
11.3%
14.9%
19.3%
18.1%
17.3%
11.0%
8.1%
7.3%
44.9%
15.7%
19.9%
6.2%
6.0%
48.0%
52.0%
9.5%
13.4%
19.8%
19.9%
18.4%
11.1%
7.8%
6.2%
44.5%
15.4%
21.0%
6.4%
6.5%
43.4%
56.6%
12.1%
13.9%
22.2%
20.0%
17.1%
9.3%
5.5%
4.4%
40.5%
14.2%
23.5%
9.0%
8.4%
50.6%
49.4%
7.5%
11.4%
19.5%
19.0%
21.0%
13.5%
8.3%
4.8%
40.4%
17.4%
21.7%
8.3%
7.4%
Note: (1) home access; (2) viewed in the past week; (3) listened to AM/FMyesterday; (4) read any publication; (5) read weekday and SundaypublicationsSource: TGI Latina, "2011 Chile Study, Waves 1 & 2," 2012; provided byStarcom MediaVest Group, June 1, 2012141438 www.eMarketer.com
Internet users (1)
Mobile phone owners
TV viewers (2)
Radio listeners (3)
Magazine readers (4)
Newspaper readers (5)
141438
INTERNET
% of totalDemographic Profile of Internet Users in Chile, 2011
Note: home internet accessSource: TGI Latina, "2011 Chile Study, Waves 1 & 2," 2012; provided byStarcom MediaVest Group, June 1, 2012141439 www.eMarketer.com
Gender Age
Monthly income (CLP)
Female52.0%
Male48.0%
12-1712.8%
18-2416.5%
25-3420.9%
35-4419.1%
45-5417.5%
55-64 8.6%
65+4.6%
<164K2.4%
165K-330K36.6%
330K-440K16.6%
440K-825K26.0%
825K-1,100K9.3%
1,100K+9.1%
141439

The Global Media Intelligence Report: Latin America Copyright ©2012 eMarketer, Inc. All rights reserved. LA-20
Chile
% of total
Demographic Profile of Social Network Users in Chile,2011
Note: used a virtual communitySource: TGI Latina, "2011 Chile Study, Waves 1 & 2," 2012; provided byStarcom MediaVest Group, June 1, 2012141440 www.eMarketer.com
Gender Age
Monthly income (CLP)
Female52.8%
Male47.2%
12-1720.6%
18-2424.6%25-34
27.4%
35-4415.0%
45-54 8.2%
55-643.5%
65+0.7%
<164K5.2%
165K-330K36.3%
330K-440K16.6%
440K-825K23.9%
825K-1,100K8.9%
1,100K+9.1%
141440
MOBILE
% of total
Demographic Profile of Mobile Phone Owners in Chile, 2011
Note: numbers may not add up to 100% due to roundingSource: TGI Latina, "2011 Chile Study, Waves 1 & 2," 2012; provided byStarcom MediaVest Group, June 1, 2012141441 www.eMarketer.com
Gender Age
Monthly income (CLP)
Female51.3%
Male48.7%
12-1710.8%
18-2415.7%
25-3421.5%35-44
18.5%
45-5417.2%
55-6410.2%
65+6.2%
<164K5.8%
165K-330K43.1%
330K-440K16.3%
440K-825K21.3%
825K-1,100K6.8%
1,100K+6.6%
141441

The Global Media Intelligence Report: Latin America Copyright ©2012 eMarketer, Inc. All rights reserved. LA-21
Chile
% of total
Demographic Profile of Smartphone Owners in Chile,2011
Note: numbers may not add up to 100% due to roundingSource: TGI Latina, "2011 Chile Study, Waves 1 & 2," 2012; provided byStarcom MediaVest Group, June 1, 2012141442 www.eMarketer.com
Gender Age
Monthly income (CLP)
Male58.8%
Female41.2%
12-1712.1%
18-2416.6%
25-3428.7%
35-4424.0%
45-5411.3%
55-644.8%
65+2.5%
<164K2.9%
165K-330K30.9%
330K-440K12.9%
440K-825K22.7%
825K-1,100K14.0%
1,100K+16.7%
141442
% of total
Demographic Profile of Mobile Internet Users in Chile,2011
Note: access via feature phone, PDA, smartphone, iPhone or BlackBerry;numbers may not add up to 100% due to roundingSource: TGI Latina, "2011 Chile Study, Waves 1 & 2," 2012; provided byStarcom MediaVest Group, June 1, 2012141443 www.eMarketer.com
Gender Age
Monthly income (CLP)
Male56.5%
Female43.5%
12-179.2%
18-2418.7%
25-3450.1%
35-4414.1%
45-544.9%
55-642.1%
65+0.8%
<164K3.1%
165K-330K25.3%
330K-440K10.6%
440K-825K26.3%
825K-1,100K13.4%
1,100K+21.2%
141443
AD SPENDING
millionsAd Spending in Chile, by Media, 2005-2014
TV
Newspapers
Outdoor
Radio
Internet
Magazines
Cinema
Total
2005
$418
$250
$72
$70
$9
$27
$3
$848
2010
$614
$318
$88
$80
$49
$25
$4
$1,179
2011
$663
$350
$97
$86
$59
$27
$5
$1,287
2012
$703
$375
$105
$91
$71
$28
$5
$1,378
2013
$738
$401
$112
$96
$83
$29
$6
$1,465
2014
$770
$425
$121
$99
$99
$31
$6
$1,552Note: converted at the exchange rate of US$1=CLP483.67; numbers maynot add up to total due to roundingSource: ZenithOptimedia, "Advertising Expenditure Forecasts," June 2012;provided by Starcom MediaVest Group, June 2012142229 www.eMarketer.com
142229
The Global Media Intelligence Report: Latin America Copyright ©2012 eMarketer, Inc. All rights reserved. LA-22
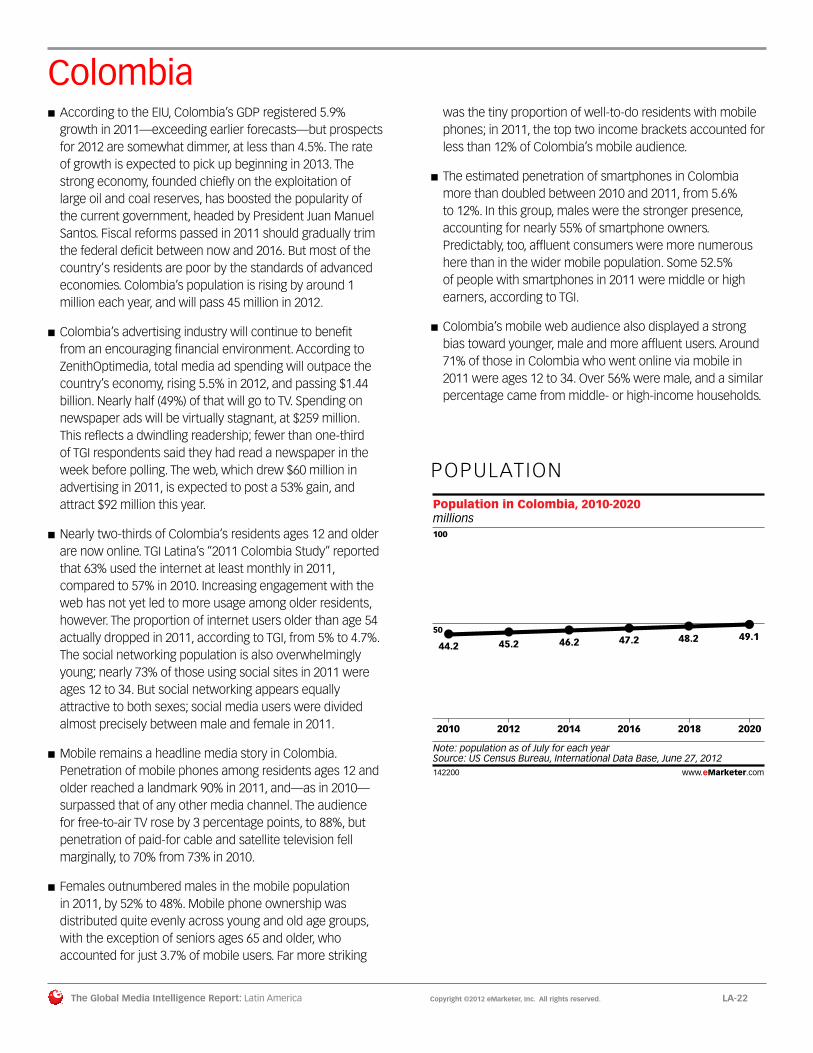
Colombia ■ According to the EIU, Colombia’s GDP registered 5.9% growth in 2011—exceeding earlier forecasts—but prospects for 2012 are somewhat dimmer, at less than 4.5%. The rate of growth is expected to pick up beginning in 2013. The strong economy, founded chiefly on the exploitation of large oil and coal reserves, has boosted the popularity of the current government, headed by President Juan Manuel Santos. Fiscal reforms passed in 2011 should gradually trim the federal deficit between now and 2016. But most of the country‘s residents are poor by the standards of advanced economies. Colombia’s population is rising by around 1 million each year, and will pass 45 million in 2012.
■ Colombia’s advertising industry will continue to benefit from an encouraging financial environment. According to ZenithOptimedia, total media ad spending will outpace the country’s economy, rising 5.5% in 2012, and passing $1.44 billion. Nearly half (49%) of that will go to TV. Spending on newspaper ads will be virtually stagnant, at $259 million. This reflects a dwindling readership; fewer than one-third of TGI respondents said they had read a newspaper in the week before polling. The web, which drew $60 million in advertising in 2011, is expected to post a 53% gain, and attract $92 million this year.
■ Nearly two-thirds of Colombia’s residents ages 12 and older are now online. TGI Latina’s “2011 Colombia Study” reported that 63% used the internet at least monthly in 2011, compared to 57% in 2010. Increasing engagement with the web has not yet led to more usage among older residents, however. The proportion of internet users older than age 54 actually dropped in 2011, according to TGI, from 5% to 4.7%. The social networking population is also overwhelmingly young; nearly 73% of those using social sites in 2011 were ages 12 to 34. But social networking appears equally attractive to both sexes; social media users were divided almost precisely between male and female in 2011.
■ Mobile remains a headline media story in Colombia. Penetration of mobile phones among residents ages 12 and older reached a landmark 90% in 2011, and—as in 2010—surpassed that of any other media channel. The audience for free-to-air TV rose by 3 percentage points, to 88%, but penetration of paid-for cable and satellite television fell marginally, to 70% from 73% in 2010.
■ Females outnumbered males in the mobile population in 2011, by 52% to 48%. Mobile phone ownership was distributed quite evenly across young and old age groups, with the exception of seniors ages 65 and older, who accounted for just 3.7% of mobile users. Far more striking
was the tiny proportion of well-to-do residents with mobile phones; in 2011, the top two income brackets accounted for less than 12% of Colombia’s mobile audience.
■ The estimated penetration of smartphones in Colombia more than doubled between 2010 and 2011, from 5.6% to 12%. In this group, males were the stronger presence, accounting for nearly 55% of smartphone owners. Predictably, too, affluent consumers were more numerous here than in the wider mobile population. Some 52.5% of people with smartphones in 2011 were middle or high earners, according to TGI.
■ Colombia’s mobile web audience also displayed a strong bias toward younger, male and more affluent users. Around 71% of those in Colombia who went online via mobile in 2011 were ages 12 to 34. Over 56% were male, and a similar percentage came from middle- or high-income households.
POPULATION
millionsPopulation in Colombia, 2010-2020
44.2 45.2 46.2 47.2 48.2 49.1
Note: population as of July for each yearSource: US Census Bureau, International Data Base, June 27, 2012142200 www.eMarketer.com
2010
50
100
2012 2014 2016 2018 2020
142200

The Global Media Intelligence Report: Latin America Copyright ©2012 eMarketer, Inc. All rights reserved. LA-23
Colombia
MEDIA
% of populationMedia Penetration in Colombia, 2011
Mobile phone owners 90%
TV viewers (1) 85%
Pay-TV subscribers (2) 70%
Radio listeners (1) 68%
Internet users (3) 63%
Social media users (4) 51%
Magazine readers (5) 40%
Newspaper readers (6)32%
Smartphone owners12%
Note: ages 12+; (1) used yesterday; (2) subscribe to cable or satellite; (3)used in the past 30 days; (4) visited a blog, virtual community (Facebook,hi5, Myspace), shared photo or used IM in the past 30 days; (5) read anypublication in the past 6 months; (6) read any publication in the past weekSource: TGI Latina, "2011 Colombia Study," 2012; provided by StarcomMediaVest Group, June 1, 2012141363 www.eMarketer.com
141363
% of totalDemographic Profile of Media Users in Colombia, 2011
GenderMale
Female
Age12-17
18-24
25-34
35-44
45-54
55-64
65+
Socioeconomic statusA
B
C
D
E
52.5%
47.5%
20.5%
21.8%
27.6%
14.8%
10.6%
3.9%
0.8%
6.4%
9.3%
20.0%
35.7%
28.7%
48.0%
52.0%
12.3%
16.5%
22.8%
19.2%
16.5%
9.0%
3.7%
4.3%
7.1%
14.9%
38.0%
35.7%
47.0%
53.0%
13.0%
15.7%
21.6%
18.6%
17.0%
9.6%
4.6%
3.8%
6.6%
14.0%
37.9%
37.7%
50.4%
49.6%
13.4%
16.6%
22.6%
17.7%
16.0%
9.7%
4.0%
3.7%
7.4%
16.1%
38.8%
33.9%
47.3%
52.7%
14.5%
16.5%
20.9%
17.8%
16.6%
9.4%
4.5%
4.3%
6.6%
14.4%
36.2%
38.6%
42.1%
57.9%
13.4%
16.1%
24.8%
19.0%
15.3%
8.0%
3.4%
6.8%
9.3%
17.6%
35.5%
30.9%
53.2%
46.8%
9.5%
13.9%
22.4%
21.3%
18.4%
10.7%
3.8%
7.2%
10.3%
17.7%
34.7%
30.0%
Note: numbers may not add up to 100% due to rounding; (1) used in thepast 30 days; (2) used yesterday; (3) subscribe to cable or satellite; (4) readany publication in the past 6 months; (5) read any publication in the pastweekSource: TGI Latina, "2011 Colombia Study," 2012; provided by StarcomMediaVest Group, June 1, 2012141364 www.eMarketer.com
Internet users (1)
Mobile phone owners
TV viewers (2)
Pay-TV subscribers (3)
Radio listeners (2)
Magazine readers (4)
Newspaper readers (5)
141364
INTERNET
Gender Age
Socioeconomic status
% of total
Demographic Pro�le of Internet Users in Colombia,2011
Male52.5%
Female47.5%
12-1720.5%
18-2421.8%
25-3427.6%
35-4414.8%
45-5410.6%
55-643.9%
65+0.8%
A6.4%
B9.3%
C20.0%
D35.7%
E28.7%
Note: used in the past 30 days; numbers may not add up to 100% due toroundingSource: TGI Latina, "2011 Colombia Study," 2012; provided by StarcomMediaVest Group, June 1, 2012141372 www.eMarketer.com
141372

The Global Media Intelligence Report: Latin America Copyright ©2012 eMarketer, Inc. All rights reserved. LA-24
Colombia
% of total
Demographic Profile of Social Media Users in Colombia, 2011
Note: visited a blog or virtual community (Facebook, hi5, Myspace), sharedphotos or used IM in the past 30 days; numbers may not add up to 100%due to roundingSource: TGI Latina, "2011 Colombia Study," 2012; provided by StarcomMediaVest Group, June 1, 2012141373 www.eMarketer.com
Gender Age
Socioeconomic status
Male50.2%
Female49.8%
12-1721.4%
18-2423.2%25-34
28.2%
35-4415.0%
45-54 8.2%
55-643.3%
65+0.6%
A6.2%
B9.3%
C19.1%
D34.4%
E30.9%
141373
MOBILE
% of total
Demographic Pro�le of Mobile Phone Ownersin Colombia, 2011
Note: numbers may not add up to 100% due to roundingSource: TGI Latina, "2011 Colombia Study," 2012; provided by StarcomMediaVest Group, June 1, 2012141374 www.eMarketer.com
Gender Age
Socioeconomic status
Female52.0%
Male48.0%
12-1712.3%
18-2416.5%
25-3422.8%
35-4419.2%
45-5416.5%
55-64 9.0%
65+3.7%
A4.3%
B7.1%
C14.9%
D38.0%
E35.7%
141374

The Global Media Intelligence Report: Latin America Copyright ©2012 eMarketer, Inc. All rights reserved. LA-25
Colombia
% of total
Demographic Pro�le of Smartphone Ownersin Colombia, 2011
Note: numbers may not add up to 100% due to roundingSource: TGI Latina, "2011 Colombia Study," 2012; provided by StarcomMediaVest Group, June 1, 2012141375 www.eMarketer.com
Gender Age
Socioeconomic status
Male54.9%
Female45.1%
12-1714.9%
18-2421.7%
25-3426.1%
35-4420.6%
45-54 9.8%
55-644.9%
65+2.0%
A12.1%
B14.9%
C25.5%
D26.1%
E21.4%
141375
% of total
Demographic Pro�le of Mobile Internet Usersin Colombia, 2011
Note: access internet via mobile phone; numbers may not add up to 100%due to roundingSource: TGI Latina, "2011 Colombia Study," 2012; provided by StarcomMediaVest Group, June 1, 2012141376 www.eMarketer.com
Gender Age
Socioeconomic status
Male56.4%
Female43.6%
12-1711.1%
18-2425.0%
25-3434.8%
35-4414.7%
45-54 9.1%
55-644.5%
65+0.9%
A21.6%
B13.2%
C21.2%
D22.0%
E22.0%
141376
AD SPENDING
millionsAd Spending in Colombia, by Media, 2005-2014
TV
Newspapers
Radio
Outdoor
Internet*
Magazines
Cinema
Total
2005
$302
$134
$133
$89
$3
$38
$1
$700
2010
$558
$214
$206
$121
$41
$52
$1
$1,193
2011
$623
$257
$226
$140
$60
$61
$1
$1,368
2012
$663
$259
$248
$129
$92
$50
$1
$1,443
2013
$710
$264
$236
$142
$148
$48
$1
$1,548
2014
$759
$282
$253
$152
$158
$51
$2
$1,657Note: numbers may not add up to total due to rounding; *classifieds,display and searchSource: ZenithOptimedia, "Advertising Expenditure Forecasts," June 2012;provided by Starcom MediaVest Group, June 2012142234 www.eMarketer.com
142234

The Global Media Intelligence Report: Latin America Copyright ©2012 eMarketer, Inc. All rights reserved. LA-26
Mexico ■ A general election on July 1, 2012, elevated the conservative politician Enrique Peña Nieto to the Mexican presidency. Within days, rumors circulated that he had distributed gifts to thousands of voters before the ballot, and had also broken campaign spending rules. The defeated leftist candidate, Andrés Manuel López Obrador, vowed to challenge the election results in court, and in September 2012 announced that he had departed the main leftist coalition to start his own youth movement. Such developments will do little to calm an already volatile political and economic atmosphere. Real GDP in Mexico grew by 3.9% in 2011, according to the IMF’s “World Economic Outlook Update,” and should maintain that pace in 2012, but growth will likely slip 3.6% in 2013.” The country, with a population of 115 million in 2012, faces intractable problems of crime, violence and poverty. Its proximity to the US—a key export market—also makes it more vulnerable than most Latin American nations to the economic and political climate of its northern neighbor.
■ A consensus among most research firms holds that growth in Mexico’s advertising market slowed dramatically in 2011 and is regaining some momentum in 2012. eMarketer estimates that spending on measured media passed $4 billion in 2011 and will reach $4.47 billion this year, a rise of 10.5%. From 2013, annual growth will remain below 10%. Other projections of 2012 ad spending range between $4.5 billion (GroupM, December 2011) and $6.8 billion (PwC, June 2012).
■ The reach of television has declined in the past decade, according to TGI Latina’s “2011 Mexico Study, Waves 1–3.” But TV still commanded the attention of more than 97% of consumers ages 12 to 64 each week in 2011. More than half the population were regular radio listeners, and just over one-quarter said they read either newspapers or magazines. Much smaller audiences subscribed to cable or satellite TV services (23.2% and 7.7% of the population, respectively).
■ As in so many Latin American markets, broadband penetration in Mexico remains disappointing. Barely one-quarter of the country’s households had a fixed high-speed internet connection in 2011, eMarketer estimates. Moreover, uptake is slow, with subscriptions growing at a modest 6% per year. Yet the number of web users will rise by more than 15% this year, to approach 47 million. By 2016, an estimated 64.5 million people in Mexico will be online—almost 54% of Mexico’s population.
■ Sixty-five percent of Mexico’s web users—more than 30 million people—will visit social networks in 2012, eMarketer believes. Within two years, 40 million residents will be social networkers. In 2011, this population was predominantly young and well-to-do. According to TGI, 61% of social network users were ages 12 to 24, and a similar proportion came from upper- and middle-income
segments. Facebook has established a remarkable lead among social sites; in 2012, over 90% of social networkers in Mexico will be registered users, according to eMarketer.
■ Some 73.8% of Mexico’s population ages 12 to 64 were mobile phone owners in 2011, TGI Latina reported. eMarketer, which calculates usage across the entire population, estimates that 55% (63.2 million people) will use a mobile phone in 2012. By 2016, that proportion will rise to 66%.
■ Historically, males made up the majority of Mexico’s mobile audience. The gap between male and female user numbers is shrinking, but this shift is more pronounced in some areas of mobile usage than others. For example, TGI reported that males accounted for 50.5% of mobile phone owners in 2011, compared to 51% in 2010. Among smartphone owners, the percentage of males fell from 58% to 57.4% in 2011. Among mobile web users, the decline was much sharper, though. This group, 58% male in 2010, was estimated to be just 52.5% male in 2011. Younger people continued to play a disproportionate role in the mobile population, too. While an estimated 56% of all mobile phone owners in 2011 were ages 12 to 34 (down from 62% in 2010), some 73% of smartphone owners and nearly 76% of mobile internet users were in that age bracket.
■ The link between newer media platforms and affluence is particularly strong in Mexico. TGI reported that in 2011, nearly 37% of the country’s internet users hailed from the highest income group. The internet also registered the smallest proportion of users (14.3%) from the lowest income level. By contrast, nearly 27% of TV viewers belonged to the lowest income category.
■ Thanks to the growing audience of digital media users, and their attractive demographic profile, investment in online and mobile marketing was up sharply in 2011. Most sources agree that digital ad spending jumped by at least 25% last year; eMarketer put the gain at 40.3%. But as for several markets in Latin America, estimates of actual spending vary enormously. Projections for 2012 digital ad expenditures range from $243 million (PwC, June 2012) to $532.5 million (eMarketer, June 2012). eMarketer’s estimates for future spending are higher than others primarily because the figures are benchmarked against those of Mexico’s Interactive Advertising Bureau (IAB México)/PwC, whose numbers have consistently exceeded those from other research organizations. Mobile ad spending more than doubled in 2011, eMarketer estimates, and will leap by a further 75.6% in 2012, to $41.5 million.

The Global Media Intelligence Report: Latin America Copyright ©2012 eMarketer, Inc. All rights reserved. LA-27
Mexico
POPULATION
millionsPopulation in Mexico, 2010-2020
112.5 115.0 117.5 119.9 122.3 124.7
Note: population as of July for each yearSource: US Census Bureau, International Data Base, June 27, 2012142230 www.eMarketer.com
2010
100
200
2012 2014 2016 2018 2020
142230
MEDIA
% of populationMedia Penetration in Mexico, 2011
TV viewers (1)97.4%
Mobile phone owners73.8%
Radio listeners (2)53.8%
Internet users (3)48.3%
Magazine readers (4)27.3%
Newspaper readers (4)27.0%
Cable TV viewers23.2%
Satellite TV viewers7.7%
Note: ages 12-64; (1) used in the past 7 days; (2) used yesterday; (3) used inthe past 30 days; (4) read any publicationSource: TGI Latina, "2011 Mexico Study, Waves 1-3," 2012; provided byStarcom MediaVest Group, June 1, 2012141751 www.eMarketer.com
141751
% of totalDemographic Profile of Media Users in Mexico, 2011
GenderMale
Female
Age12-19
20-24
25-34
35-44
45-54
55-64
Socioeconomic statusABC+
C
D+
D/E
53.4%
46.6%
33.5%
19.1%
23.5%
14.5%
6.9%
2.5%
36.6%
20.7%
28.4%
14.3%
50.5%
49.5%
20.5%
15.1%
25.7%
20.4%
12.4%
5.9%
28.7%
18.4%
32.0%
20.9%
48.7%
51.3%
21.5%
12.9%
24.2%
19.8%
13.6%
8.0%
22.7%
17.0%
33.7%
26.6%
49.1%
50.9%
20.0%
13.4%
25.2%
20.4%
13.4%
7.6%
23.6%
17.4%
33.5%
25.5%
44.2%
55.8%
26.3%
13.7%
23.6%
17.6%
12.5%
6.3%
32.6%
19.8%
30.0%
17.7%
59.4%
40.6%
13.5%
12.1%
25.5%
23.7%
15.8%
9.4%
29.6%
19.2%
30.8%
20.4%
Note: numbers may not add up to 100% due to rounding; (1) used in thepast 30 days (2) used in the past 7 days; (3) used yesterday; (4) read anypublicationSource: TGI Latina, "2011 Mexico Study, Waves 1-3," 2012; provided byStarcom MediaVest Group, June 1, 2012141752 www.eMarketer.com
Internet users (1)
Mobile phone owners
TV viewers (2)
Radio listeners (3)
Magazine readers (4)
Newspaper readers (5)
141752
INTERNET
millions, % of population and % changeInternet Users and Penetration in Mexico, 2011-2016
2011
40.4
35.5%
15.8%
2012
46.6
40.5%
15.3%
2013
51.7
44.5%
11.1%
2014
56.4
48.0%
9.0%
2015
60.7
51.1%
7.6%
2016
64.5
53.8%
6.4%
Internet users % of population % change
Note: individuals of any age who use the internet from any location via anydevice at least once per monthSource: eMarketer, Feb 2012136991 www.eMarketer.com
136991

The Global Media Intelligence Report: Latin America Copyright ©2012 eMarketer, Inc. All rights reserved. LA-28
Mexico
Comparative Estimates: Internet Users andPenetration in Mexico, 2010-2012
2010 2011 2012
Internet users (millions)eMarketer, Feb 2012 (1) 34.9 40.4 46.6comScore Inc., May 2012 (2) - 18.1 22.1
COFETEL, May 2012 34.9 40.6 -
WIP, July 2011 (3) - 40.0 -
CIU, June 2012 (4) - 34.1 -
Internet user penetration (% of population)eMarketer, Feb 2012 (1) 31.0% 35.5% 40.5%
TGI Latina, June 2012 (5) - 48.3% -
WIP, July 2011 (3) - 40.0% -
ITU, July 2012 - 36.2% -
Note: (1) individuals of any age who use the internet from any location viaany device at least once per month; (2) ages 15+; home and worklocations; data is for Jan of each year; (3) any age; (4) ages 10+; data is forQ4 2011; (5) ages 12-64; used in the past 30 daysSource: eMarketer, Feb 2012; various, as noted, 2011 & 2012143315 www.eMarketer.com
143315
% of totalDemographic Pro�le of Internet Users in Mexico, 2011
Note: used in the past 30 daysSource: TGI Latina, "2011 Mexico Study, Waves 1-3," 2012; provided byStarcom MediaVest Group, June 1, 2012141754 www.eMarketer.com
Gender Age
Socioeconomic status
Male53.5%
Female46.6%
12-1933.5%
20-2419.1%
25-3423.5%
35-4414.5%
45-546.9%
55-642.5%
ABC+36.6%
C20.7%
D28.4%
D/E14.3%
141754
Fixed Broadband Households and Subscriptions in Mexico, 2010-2016
Households (millions)—% change
—Household penetration
Subscriptions (millions)—% change
2010
7.08.1%
24.2%
11.28.1%
2011
7.46.0%
25.2%
11.96.2%
2012
7.96.2%
26.3%
12.65.9%
2013
8.35.6%
27.3%
13.45.7%
2014
8.52.1%
27.4%
13.61.9%
2015
8.61.7%
27.4%
13.91.9%
2016
8.81.7%
27.4%
14.01.0%
Note: includes connections with permanent access to the internet viacable modem, DSL, fiber and wireless/satellite technologies; excludesmobileSource: eMarketer, April 2012139110 www.eMarketer.com
139110
Comparative Estimates: Fixed Broadband Householdsand Penetration in Mexico, 2010-2012
2010 2011 2012
Fixed broadband households (millions)GroupM, April 2012 7.5 8.6 9.6
eMarketer*, April 2012 7.0 7.4 7.9Fixed broadband household penetration (% of households)PwC, June 2012 38.8% 45.1% 52.2%
GroupM, April 2012 28.0% 32.0% 35.0%
eMarketer*, April 2012 24.2% 25.2% 26.3%Note: *includes connections with permanent access to the internet viacable modem, DSL, fiber and wireless/satellite technologies; excludesmobileSource: eMarketer, April 2012; various, as noted, 2012143317 www.eMarketer.com
143317
Social Network Users and Penetration in Mexico,2010-2014
2010 2011 2012 2013 2014
Social network users (millions) 20.0 23.7 30.3 35.2 40.0—% change 35.0% 18.4% 27.9% 16.2% 13.8%
—% of internet users 57.3% 58.6% 65.0% 68.0% 71.0%
—% of population 17.8% 20.8% 26.3% 30.3% 34.1%
Note: internet users who use a social network site via any device at leastonce per monthSource: eMarketer, July 2012143045 www.eMarketer.com
143045
% of internet users
Comparative Estimates: Social Network UserPenetration in Mexico, 2012
AMIPCI, May 2012 (1) 92.0%
comScore, June 2012 (2) 91.4%
Ipsos, March 2012 (3) 68.0%
eMarketer, July 2012 (4) 65.0%
Note: (1) accessed their own social network profile at least once in the past6 months; (2) ages 15+; data is for May; (3) visitors to social network sites,forums or blogs in the past 3 months; (4) internet users who use a socialnetwork site via any device at least once per monthSource: eMarketer, July 2012; various, as noted, 2012143069 www.eMarketer.com
143069

The Global Media Intelligence Report: Latin America Copyright ©2012 eMarketer, Inc. All rights reserved. LA-29
Mexico
% of total
Demographic Pro�le of Social Network Users in Mexico, 2011
Note: among internet users who used social networks and microbloggingsites within the past 30 days; numbers may not add up to 100% due toroundingSource: TGI Latina, "2011 Mexico Study, Waves 1-3," 2012; provided byStarcom MediaVest Group, June 1, 2012141755 www.eMarketer.com
Gender Age
Socioeconomic status
Male52.6%
Female47.4%
12-1938.1%
20-2422.9%
25-3423.4%
35-4410.7%
45-543.7%
55-641.1%
ABC+39.6%
C21.2%
D25.8%
D/E13.5%
141755
Facebook Users and Penetration in Mexico, 2010-2014
2010 2011 2012 2013 2014
Facebook users (millions) 15.2 21.0 27.8 32.7 37.7—% change 129.2% 38.1% 32.4% 17.6% 15.2%
—% of social network users 76.1% 88.7% 91.8% 92.9% 94.1%
—% of internet users 43.6% 52.0% 59.7% 63.2% 66.8%
—% of population 13.5% 18.5% 24.2% 28.1% 32.1%
Note: internet users who access their Facebook account via any device atleast once per monthSource: eMarketer, July 2012143053 www.eMarketer.com
143053
MOBILE
millions, % of population and % changeMobile Connections in Mexico, 2010-2016
2010
90.0
80.0%
7.8%
2011
95.0
83.5%
5.6%
2012
98.0
85.2%
3.2%
2013
100.0
86.0%
2.0%
2014
102.0
86.8%
2.0%
2015
104.0
87.6%
2.0%
2016
106.0
88.4%
1.9%
Mobile connections % of population % change
Note: data is for Dec of each year; includes the total number of mobileconnections, for mobile phones as well as for nonvoice devices, such asinternet access devices (e.g., wireless modem cards, netbooks and mobileWi-Fi hotspots), ereaders, tablets and telematics systemsSource: eMarketer, April 2012139359 www.eMarketer.com
139359
Comparative Estimates: Mobile Connections andPenetration in Mexico, 2010-2012
2010 2011 2012
Mobile connections (millions)BuddeComm, Aug 2011 90.0 96.0 102.0
eMarketer*, April 2012 90.0 95.0 98.0GSM Association, Feb 2012 - 98.8 -
COFETEL, March 2012 91.4 94.6 -
ITU, July 2012 - 94.6 -
Mobile connection penetration (% of population)eMarketer*, April 2012 80.0% 83.5% 85.2%GSM Association, Feb 2012 - 87.0% -
COFETEL, March 2012 81.3% 84.2% -
ITU, July 2012 - 82.4% -
Note: *data is for Dec of each year; includes the total number of mobileconnections, for mobile phones as well as for nonvoice devices, such asinternet access devices (e.g., wireless modem cards, netbooks and mobileWi-Fi hotspots), ereaders, tablets and telematics systemsSource: eMarketer, April 2012; various, as noted, 2011 & 2012143330 www.eMarketer.com
143330

The Global Media Intelligence Report: Latin America Copyright ©2012 eMarketer, Inc. All rights reserved. LA-30
Mexico
millions, % of population and % changeMobile Phone Users in Mexico, 2010-2016
2010
55.1
49.0%
10.1%
2011
59.1
52.0%
7.3%
2012
63.2
55.0%
6.9%
2013
67.4
58.0%
6.6%
2014
71.7
61.0%
6.3%
2015
75.4
63.5%
5.2%2016
79.1
66.0%
5.0%
Mobile phone users % of population % change
Note: mobile phone users are individuals of any age who own at least onemobile phone and use the phone(s) at least once per monthSource: eMarketer, April 2012139314 www.eMarketer.com
139314
% of total
Demographic Pro�le of Mobile Phone Ownersin Mexico, 2011
Source: TGI Latina, "2011 Mexico Study, Waves 1-3," 2012; provided byStarcom MediaVest Group, June 1, 2012141756 www.eMarketer.com
Gender Age
Socioeconomic status
Male50.5%
Female49.5%
12-1920.5%
20-2415.1%
25-3425.7%
35-4420.4%
45-5412.4%
55-645.9%
ABC+28.7%
C18.4%
D32.0%
D/E20.9%
141756
Smartphone Users and Penetration in Mexico,2010-2016
Smartphoneusers (millions)—% change
—% of mobilephone users
—% of population
2010
3.3
120.2%
6.0%
2.9%
2011
8.9
168.3%
15.0%
7.8%
2012
15.2
71.1%
24.0%
13.2%
2013
22.2
46.6%
33.0%
19.1%
2014
28.7
28.8%
40.0%
24.4%
2015
36.2
26.2%
48.0%
30.5%
2016
43.5
20.3%
55.0%
36.3%
Note: smartphone users are individuals of any age who own at least onesmartphone and use the smartphone(s) at least once per monthSource: eMarketer, April 2012139346 www.eMarketer.com
139346
% of total
Demographic Pro�le of Smartphone Owners in Mexico, 2011
Note: numbers may not add up to 100% due to roundingSource: TGI Latina, "2011 Mexico Study, Waves 1-3," 2012; provided byStarcom MediaVest Group, June 1, 2012141757 www.eMarketer.com
Gender Age
Socioeconomic status
Male57.4%
Female42.6%
12-1924.6%
20-2419.4%25-34
29.4%
35-4416.3%
45-54 7.6%
55-642.6%
ABC+45.9%
C15.4%
D27.0%
D/E11.8%
141757
Mobile Internet Users and Penetration in Mexico,2010-2016
Mobile internetusers (millions)—% change
—% of mobilephone users
—% of population
2010
5.0
65.2%
9.0%
4.4%
2011
11.2
126.5%
19.0%
9.9%
2012
17.1
52.0%
27.0%
14.9%
2013
23.6
38.2%
35.0%
20.3%
2014
30.1
27.6%
42.0%
25.6%
2015
37.7
25.2%
50.0%
31.8%
2016
45.1
19.7%
57.0%
37.6%
Note: mobile phone users of any age who access the internet from amobile browser or an installed application at least once per month;excludes SMS, MMS and IMSource: eMarketer, April 2012139330 www.eMarketer.com
139330

The Global Media Intelligence Report: Latin America Copyright ©2012 eMarketer, Inc. All rights reserved. LA-31
Mexico
% of total
Demographic Pro�le of Mobile Internet Usersin Mexico, 2011
Note: among mobile phone owners who access the internet or email viaWAP on their mobile phoneSource: TGI Latina, "2011 Mexico Study, Waves 1-3," 2012; provided byStarcom MediaVest Group, June 1, 2012141758 www.eMarketer.com
Gender Age
Socioeconomic status
Male52.5%
Female47.5%
12-1926.2%
20-2421.3%
25-3428.3%
35-4415.3%
45-546.1%
55-642.8%
ABC+48.7%
C16.8%
D27.8%
D/E6.7%
141758
AD SPENDING
billions and % changeTotal Media Ad Spending in Mexico, 2010-2016
2010
$3.73
8.9%
2011
$4.05
8.4%
2012
$4.47
10.5%
2013
$4.85
8.4%
2014
$5.28
9.0%
2015
$5.69
7.7%
2016
$6.08
6.9%
Total media ad spending % change
Note: includes digital (online and mobile), directories, magazines,newspapers, outdoor, radio and TV; converted at the exchange rate ofUS$1=MXN12.43Source: eMarketer, Sep 2012144700 www.eMarketer.com
144700
Comparative Estimates: Total Media Ad Spending inMexico, 2010-2015
2010 2011 2012 2013 2014 2015
Total ad spending (billions)PwC, June 2012 (1) $6.1 $6.4 $6.8 $7.2 $8.5 $8.2
ZenithOptimedia, June 2012 (2) $5.6 $5.5 $5.1 $6.0 $6.3 -
GroupM, July 2012 (3) $4.1 $4.3 $4.5 $4.7 - -
eMarketer, Sep 2012 (4) $3.7 $4.1 $4.5 $4.9 $5.3 $5.7Total ad spending (% change)eMarketer, Sep 2012 8.9% 8.4% 10.5% 8.4% 9.0% 7.7%PwC, June 2012 - 4.9% 6.2% 5.9% 18.1% -3.5%
GroupM, July 2012 10.2% 4.6% 5.7% 3.7% - -
ZenithOptimedia, June 2012 20.2% -0.7% -7.6%17.4% 5.2% -
Nielsen, April 2012 - -0.4% - - - -
Note: (1) converted at the exchange rate of US$1=MXN12.4183; (2)converted at the exchange rate of US$1=MXN12.42; (3) converted at theexchange rate of US$1=MXN13.95; (4) converted at the exchange rate ofUS$1=MXN12.43Source: eMarketer, Sep 2012; various, as noted, 2012143342 www.eMarketer.com
143342
millionsAd Spending in Mexico, by Media, 2005-2014
TV
Newspapers
Radio
Magazines
Total
2005
$2,207
$382
$335
$325
$3,249
2010
$4,155
$548
$444
$428
$5,575
2011
$3,956
$562
$512
$504
$5,534
2012
$3,533
$546
$520
$515
$5,114
2013
$4,340
$602
$532
$531
$6,005
2014
$4,580
$624
$557
$555
$6,315Note: converted at the exchange rate of US$1=MXN12.42; numbers maynot add up to total due to roundingSource: ZenithOptimedia, "Advertising Expenditure Forecasts," June 2012;provided by Starcom MediaVest Group, June 2012142239 www.eMarketer.com
142239
millions and % changeDigital Ad Spending in Mexico, 2010-2016
2010
$282.0
36.0%
2011
$395.6
40.3%
2012
$532.5
34.6%
2013
$703.4
32.1%
2014
$920.3
30.8%
2015
$1,126.5
22.4%
2016
$1,342.5
19.2%
Digital ad spending % change
Note: eMarketer benchmarks its Mexico digital ad spending projections against the IAB Mexico/PwC data for which the last full year measured was 2011; includes advertising that appears on desktop and laptop computers as well as mobile phones and tablets, and includes all the various formats of advertising on those platforms; excludes SMS, MMS and P2P messaging-based advertising; converted at the exchange rate of US$1=MXN12.43Source: eMarketer, Sep 2012144749 www.eMarketer.com
144749

The Global Media Intelligence Report: Latin America Copyright ©2012 eMarketer, Inc. All rights reserved. LA-32
Mexico
Comparative Estimates: Digital Ad Spending in Mexico, 2010-2014
Digital ad spending (millions)eMarketer, Sep 2012 (1)
GroupM, July 2012 (2) (3)
PwC, June 2012 (4)
IAB México, May 2012 (1)
BCG, March 2012
Digital ad spending growth (% change)eMarketer, Sep 2012PwC, June 2012
GroupM, July 2012 (2)
2010
$282.0$237.0
$162.0
-
$100.0
36.0%-
40.7%
2011
$395.6$330.0
$204.0
$398.9
-
40.3%25.9%
39.4%
2012
$532.5$387.0
$243.0
-
-
34.6%19.1%
17.4%
2013
$703.4$444.0
$288.0
-
-
32.1%18.5%
14.8%
2014
$920.3-
$332.0
-
-
30.8%15.3%
-
Note: (1) converted at the exchange rate of US$1=MXN12.43; (2) excludes mobile; (3) converted at the exchange rate of US$1=MXN13.95; (4) converted at the exchange rate of US$1=MXN12.4183Source: eMarketer, Sep 2012; various, as noted, 2012143343 www.eMarketer.com
143343
millions and % changeMobile Ad Spending in Mexico, 2010-2016
2010
$9.1
82.9%
2011
$23.6
159.0%
2012
$41.5
75.6%
2013
$70.1
68.8%
2014
$122.3
74.5%
2015
$184.9
51.2%
2016
$259.7
40.5%
Mobile ad spending % change
Note: CAGR (2011-2016)=61.5%; eMarketer benchmarks its Mexico mobile ad spending projections against the IAB Mexico/PwC data for which the last full year measured was 2011; includes display (banners, video and rich media) and search; excludes SMS, MMS and P2P messaging-based advertising; converted at the exchange rate of US$1=MXN12.43Source: eMarketer, Sep 2012144751 www.eMarketer.com
144751

The Global Media Intelligence Report: Latin America Copyright ©2012 eMarketer, Inc. All rights reserved. LA-33
Peru ■ Peru proved one of the more resilient economies in Latin America during 2011, with real GDP growth of 6.9%, according to the IMF and the EIU. Another sizeable boost (5.5%) is expected in 2012, as the country’s domestic finances benefit from rising retail and B2B sales, as well as expanding construction and services sectors. However, the EIU noted that exports are suffering as habitual customers—including the US and larger European countries—find themselves strapped for cash. An escalating crisis in the eurozone would dent external demand and hit Peru’s balance of payments.
■ TV maintained its hold on Peru’s population in 2011, with 96.9% of residents ages 12 to 64 watching free-to-air programming at least once a week, according to TGI Latina’s “2011 Peru Study.” Another 70.7% were weekly viewers of pay TV. Peru also remains an important market for radio and newspapers, which attracted 83.2% and 70.9% of the population, respectively, in 2011.
■ In Peru, as in Argentina, Chile and Mexico, mobile devices are challenging all but the most successful traditional media channels, and offering new possibilities for advertisers. Around 72% of the population owned at least one mobile phone in 2011, TGI noted. Young people ages 12 to 24 accounted for nearly 30% of these mobile users. A slight male bias also persisted; some 51.4% of mobile phone owners were male in 2011, and 48.6% female. But the mobile audience is not particularly well-to-do; in 2011, just 26.4% of mobile users belonged to the highest socioeconomic level, while 33.7% came from the lowest income bracket.
■ Internet usage in Peru still lags well behind mobile penetration, but is building gradually. Some 59.4% of the country’s population ages 12 to 64 went online at least once per month in 2011, TGI reported. In 2011, web users were overwhelmingly young—69% were between the ages of 12 and 34—and comparatively well-off.
■ According to TGI data, just 4.9% of Peru’s population ages 12 to 64 owned a smartphone in 2011. As a result, the mobile internet user group was also comparatively tiny. Not surprisingly, going online via mobile was overwhelmingly the preserve of young and affluent consumers in 2011. Some 61.5% of mobile web users were ages 12 to 24, TGI estimated, and 56.4% belonged to the highest socioeconomic category. In terms of gender, though, the mobile web population was almost equally divided between males (50.7%) and females (49.3%).
■ As Peru develops a more advanced and diversified economy, its advertising industry is also gaining in size and sophistication. Spending in measured media will rise 13.4% in 2012, to $675 million, according to ZenithOptimedia’s “Advertising Expenditure Forecasts.” As in previous years, well over half of that ($378 million) will be spent on TV, while newspapers claim $105 million. By comparison, the estimated $29 million destined for the web is disappointingly small. But it does represent a 38% gain compared to 2011. A similar rise (34.5%) is anticipated in 2013.
POPULATION
millionsPopulation in Peru, 2010-2020
28.9 29.5 30.1 30.7 31.3 31.9
Note: population as of July for each yearSource: US Census Bureau, International Data Base, June 27, 2012142241 www.eMarketer.com
2010
30
60
2012 2014 2016 2018 2020
142241

The Global Media Intelligence Report: Latin America Copyright ©2012 eMarketer, Inc. All rights reserved. LA-34
Peru
MEDIA
% of populationMedia Penetration in Peru, 2011
TV viewers (1) 96.9%
Radio listeners (2) 83.2%
Mobile phone owners 72.0%
Newspaper readers (3) 70.9%
Pay-TV households (1) 70.7%
Internet users (4) 59.4%
Social network users (4)32.7%
Magazine readers (5)25.5%
Smartphone owners4.9%
Note: ages 12-64; (1) used in the past 7 days; (2) used yesterday; (3) readany publication in the past 7 days; (4) used in the past 30 days; (5) read anypublication in the past monthSource: TGI Latina, "2011 Peru Study," 2012; provided by StarcomMediaVest Group, June 1, 2012142124 www.eMarketer.com
142124
% of totalDemographic Profile of Media Users in Peru, 2011
GenderMale
Female
Age12-17
18-24
25-34
35-44
45-54
55-64
Socioeconomic statusAB
C
DE
54.4%
45.6%
22.5%
23.3%
23.3%
15.9%
10.3%
4.7%
32.4%
40.8%
26.8%
51.4%
48.6%
10.1%
19.0%
25.4%
21.4%
15.5%
8.7%
26.4%
39.9%
33.7%
49.2%
50.8%
14.7%
17.6%
22.5%
20.1%
14.9%
10.2%
21.7%
38.2%
40.1%
49.5%
50.5%
15.0%
17.7%
22.9%
19.3%
15.1%
10.0%
28.2%
40.8%
31.0%
49.5%
50.5%
15.2%
17.9%
22.3%
20.1%
15.3%
9.2%
20.6%
38.0%
41.4%
42.2%
57.8%
14.5%
15.6%
21.3%
22.4%
16.9%
9.4%
40.5%
37.3%
22.2%
52.4%
47.6%
12.2%
17.5%
22.8%
21.2%
15.9%
10.4%
23.8%
37.6%
38.6%
Note: (1) used in the past 30 days; (2) used in the past 7 days; (3) usedyesterday; (4) read any publication in the past month; (5) read anypublication in the past 7 daysSource: TGI Latina, "2011 Peru Study," 2012; provided by StarcomMediaVest Group, June 1, 2012142127 www.eMarketer.com
Internet users (1)
Mobile phone owners
TV viewers (2)
Pay-TV viewers (2)
Radio listeners (3)
Magazine readers (4)
Newspaper readers (5)
142127
INTERNET
% of totalDemographic Profile of Internet Users in Peru, 2011
Note: used in the past 30 daysSource: TGI Latina, "2011 Peru Study," 2012; provided by StarcomMediaVest Group, June 1, 2012142128 www.eMarketer.com
Gender Age
Socioeconomic status
Male54.4%
Female45.6%
12-1722.5%
18-2423.3%25-34
23.3%
35-4415.9%
45-5410.3%
55-644.7%
AB32.4%
C40.8%
DE26.8%
142128

The Global Media Intelligence Report: Latin America Copyright ©2012 eMarketer, Inc. All rights reserved. LA-35
Peru
% of total
Demographic Profile of Social Network Users in Peru,2011
Note: among population ages 12-64 who used in the past 30 days;numbers may not add up to 100% due to roundingSource: TGI Latina, "2011 Peru Study," 2012; provided by StarcomMediaVest Group, June 1, 2012142129 www.eMarketer.com
Gender Age
Socioeconomic status
Male52.6%
Female47.4%
12-1722.7%
18-2430.2%
25-3424.8%
35-4413.5%
45-546.1%
55-642.7%
AB34.3%
C41.1%
DE24.5%
142129
MOBILE
% of total
Demographic Profile of Mobile Phone Owners in Peru,2011
Note: numbers may not add up to 100% due to roundingSource: TGI Latina, "2011 Peru Study," 2012; provided by StarcomMediaVest Group, June 1, 2012142130 www.eMarketer.com
Gender Age
Socioeconomic status
Male51.4%
Female48.6%
12-1710.1%
18-2419.0%
25-3425.4%
35-4421.4%
45-5415.5%
55-648.7%
AB26.4%
C39.9%
DE33.7%
142130

The Global Media Intelligence Report: Latin America Copyright ©2012 eMarketer, Inc. All rights reserved. LA-36
Peru
% of total
Demographic Profile of Smartphone Owners in Peru,2011
Source: TGI Latina, "2011 Peru Study," 2012; provided by StarcomMediaVest Group, June 1, 2012142131 www.eMarketer.com
Gender Age
Socioeconomic status
Male52.9%
Female47.1%
12-1712.2%
18-2420.5%
25-3430.3%
35-4420.8%
45-5410.4%
55-645.8%
AB51.9%C
36.2%
DE11.9%
142131
% of total
Demographic Profile of Mobile Internet Users in Peru,2011
Note: access internet via mobile phoneSource: TGI Latina, "2011 Peru Study," 2012; provided by StarcomMediaVest Group, June 1, 2012142136 www.eMarketer.com
Gender Age
Socioeconomic status
Female50.7%
Male49.3%
12-178.2%
18-2419.4%
25-3433.9%
35-4419.6%
45-5413.3%
55-645.6%
AB56.4%
C35.9%
DE7.7%
142136
AD SPENDING
millionsAd Spending in Peru, by Media, 2005-2014
TV
Newspapers
Radio
Outdoor
Internet
Magazines
Other
Total
2005
$120
$60
$30
$30
-
$6
$7
$253
2010
$277
$91
$61
$52
$16
$10
$7
$514
2011
$328
$98
$72
$56
$21
$12
$8
$595
2012
$378
$105
$81
$60
$29
$14
$8
$675
2013
$419
$112
$89
$64
$39
$16
$8
$747
2014
$459
$119
$96
$67
$50
$18
$9
$818Note: numbers may not add up to total due to roundingSource: ZenithOptimedia, "Advertising Expenditure Forecasts," June 2012;provided by Starcom MediaVest Group, June 2012142240 www.eMarketer.com
142240

The Global Media Intelligence Report: Latin America Copyright ©2012 eMarketer, Inc. All rights reserved. LA-37
Venezuela ■ Venezuela’s political landscape is dominated by the contentious figure of President Hugo Chávez, who faces re-election in October 2012. Chávez has been fighting cancer since at least 2011 but announced in July 2012 that he had beaten the disease. Many observers doubt the truth of this claim, but most believe that—barring unforeseen events—Chávez will likely win the election if he chooses to contest it. Significant oil reserves continue to buoy the country’s growth, but the economic outlook is clouded by a marked polarization of society between left and right, and by a degree of social unrest. Economic activity and inflation both rose in the first half of 2012. The EIU has forecast weaker economic performance in the long term, due to the country’s overdependence on oil revenues and a relative lack of robust public and social institutions. EIU projections peg GDP expansion at 4.7% in 2012, and anticipate an average annual growth rate of 3.3% between 2013 and 2016.
■ Venezuela mirrors most other nations in Latin America in its heavy usage of mainstream TV. More than 94% of people ages 12 and older polled by TGI Latina in 2011 said they had watched free-to-air television in the previous week. A further 59% were weekly viewers of cable TV. Newspapers retained a strong position, reaching nearly 68% of the population regularly. Magazine readership remained remarkably low, however, at just 8.7%.
■ The short- and medium-term growth prospects for Venezuela’s advertising sector are better than for most of the region. According to ZenithOptimedia’s “Advertising Expenditure Forecasts,” ad spending on measured media will leap by 10% in 2012, and pass $1.11 billion. Television and newspapers are set to claim 40% and 29% of the total, respectively.
■ Online ad spending has rocketed in the past two years, from an estimated $1 million in 2010 to a predicted $82 million in 2012. Yet online advertising will represent a mere 7.4% of all ad spending this year. Most advertisers have yet to grasp the online opportunity in Venezuela, partly because these options are so new, and also because internet penetration has languished at rather low levels. In 2011, just 41.2% of residents ages 12 and older went online once a month or more, according to TGI. But Venezuela registered higher percentage growth in web access than any other Latin American country (66%) in early 2012, according to a comScore report, “Futuro Digital.” This suggests that marketers will soon be able to use the internet for competitive advantage.
■ Another factor inhibiting advertiser commitment to date has been the relative youth and poverty of many web users: in
2011, half were ages 12 to 24, TGI indicated, and the same proportion belonged to the lowest income category. (Social network users displayed a similar demographic skew: Over 55% were ages 12 to 24, and around 44% had low incomes.) Only 5.4% of Venezuela’s web users belonged to the top income bracket. As in 2010, the magazine and cable TV audiences boasted the greatest concentration of high earners. Inevitably, though, any pronounced demographic imbalance will decrease as more people come online.
■ Like several African countries, Venezuela looks to be a market where mobile platforms will revolutionize communications and marketing in ways that fixed-line or Wi-Fi internet access have not. According to TGI Latina, 90% of Venezuela’s residents ages 12 and older used a mobile phone in 2011, meaning that mobiles were second only to TV in audience penetration. Unusually, lower-income consumers made up the bulk of smartphone and mobile web users. Females had the edge in the mobile phone audience, by 51.2% to 48.8%, though males dominated among smartphone owners. Interestingly, the mobile internet audience was most evenly balanced, being 50.5% male and 49.5% female in 2011.
POPULATION
millionsPopulation in Venezuela, 2010-2020
27.2 28.0 28.9 29.7 30.5 31.3
Note: population as of July for each yearSource: US Census Bureau, International Data Base, June 27, 2012142258 www.eMarketer.com
2010
30
60
2012 2014 2016 2018 2020
142258

The Global Media Intelligence Report: Latin America Copyright ©2012 eMarketer, Inc. All rights reserved. LA-38
Venezuela
MEDIA
% of populationMedia Penetration in Venezuela, 2011
TV viewers (1) 94.5%
Mobile phone user 90.6%
Newspaper readers (2) 67.8%
Cable TV viewers (1) 59.0%
Radio listeners (3) 44.6%
Internet users (4) 41.2%
Social network users24.9%
Smartphone owners14.8%
Magazine readers (5)8.7%
Note: ages 12+; (1) watched in the past 7 days; (2) read recently; (3)listened yesterday; (4) used in the past 30 days; (5) read weekly or monthlymagazinesSource: TGI Latina, "2011 Venezuela Study, Waves 1 & 2," 2012; provided byStarcom MediaVest Group, June 1, 2012142147 www.eMarketer.com
142147
% of totalDemographic Profile of Media Users in Venezuela, 2011
GenderMale
Female
Age12-19
20-24
25-34
35-44
45-54
55+
Socioeconomic statusABC+
C
D
E
50.2%
49.8%
30.9%
19.2%
25.3%
14.6%
7.5%
2.4%
5.4%
19.7%
24.3%
50.5%
48.8%
51.2%
19.6%
12.8%
23.7%
19.2%
15.0%
9.7%
4.1%
16.5%
24.3%
55.2%
49.0%
51.0%
19.4%
12.6%
23.1%
19.4%
15.3%
10.2%
3.9%
14.5%
23.1%
58.5%
49.0%
51.0%
19.2%
14.7%
24.4%
19.2%
13.6%
8.9%
5.8%
20.8%
25.8%
47.5%
45.9%
54.1%
19.3%
13.3%
22.5%
19.1%
14.4%
11.3%
3.8%
17.7%
23.1%
55.3%
39.6%
60.4%
20.6%
16.1%
19.8%
17.4%
15.8%
10.3%
7.3%
26.0%
19.4%
47.3%
51.3%
48.7%
13.2%
13.4%
23.8%
21.6%
17.0%
11.0%
4.1%
17.4%
23.8%
54.7%
Note: numbers may not add up to 100% due to rounding; (1) used in thepast 30 days; (2) watched in the past 7 days; (3) listened yesterday; (4) readweekly or monthly magazines; (5) read recentlySource: TGI Latina, "2011 Venezuela Study, Waves 1 & 2," 2012; provided byStarcom MediaVest Group, June 1, 2012142148 www.eMarketer.com
Internet users (1)
Mobile phone owners
TV viewers (2)
Cable TV viewers (2)
Radio listeners (3)
Magazine readers (4)
Newspaper readers (5)
142148
INTERNET
% of total
Demographic Profile of Internet Users in Venezuela,2011
Note: used in the past 30 days; numbers may not add up to 100% due toroundingSource: TGI Latina, "2011 Venezuela Study, Waves 1 & 2," 2012; provided byStarcom MediaVest Group, June 1, 2012142149 www.eMarketer.com
Gender Age
Socioeconomic status
Male50.2%
Female49.8%
12-1930.9%
20-2419.2%
25-3425.3%
35-4414.6%
45-547.5%
55+2.4%
ABC+5.4%
C19.7%
D24.3%
E50.5%
142149

The Global Media Intelligence Report: Latin America Copyright ©2012 eMarketer, Inc. All rights reserved. LA-39
Venezuela
% of total
Demographic Profile of Social Network Usersin Venezuela, 2011
Source: TGI Latina, "2011 Venezuela Study, Waves 1 & 2," 2012; provided byStarcom MediaVest Group, June 1, 2012142150 www.eMarketer.com
Gender Age
Socioeconomic status
Male51.1%
Female48.9%
12-1932.8%
20-2422.6%
25-3423.1%
35-4413.3%
45-546.3%
55+1.9%
ABC+6.8%
C22.6%
D26.8%
E43.8%
142150
MOBILE
% of total
Demographic Profile of Mobile Phone Ownersin Venezuela, 2011
Note: numbers may not add up to 100% due to roundingSource: TGI Latina, "2011 Venezuela Study, Waves 1 & 2," 2012; provided byStarcom MediaVest Group, June 1, 2012142151 www.eMarketer.com
Gender Age
Socioeconomic status
Female51.2%
Male48.8%
12-1916.9%
20-2412.8%
25-3423.7%
35-4419.2%
45-5415.0%
55+9.7%
ABC+4.1%
C16.5%
D24.3%
E55.2%
142151
% of total
Demographic Profile of Smartphone Ownersin Venezuela, 2011
Source: TGI Latina, "2011 Venezuela Study, Waves 1 & 2," 2012; provided byStarcom MediaVest Group, June 1, 2012142152 www.eMarketer.com
Gender Age
Socioeconomic status
Male53.5%
Female46.5%
12-1923.0%
20-2414.0%
25-3421.0%
35-4416.7%
45-5412.9%
55+12.3%
ABC+7.7%
C23.5%
D26.0%
E42.8%
142152

The Global Media Intelligence Report: Latin America Copyright ©2012 eMarketer, Inc. All rights reserved. LA-40
Venezuela
% of total
Demographic Profile of Mobile Internet Usersin Venezuela, 2011
Note: numbers may not add up to 100% due to roundingSource: TGI Latina, "2011 Venezuela Study, Waves 1 & 2," 2012; provided byStarcom MediaVest Group, June 1, 2012142153 www.eMarketer.com
Gender Age
Socioeconomic status
Male50.5%
Female49.5%
12-1916.8%
20-2414.8%
25-3423.4%
35-4426.0%
45-5411.2%
55+7.7%
ABC+7.1%
C19.8%
D25.0%
E48.0%
142153
AD SPENDING
millionsAd Spending in Venezuela, by Media, 2005-2014
2010
TV
Newspapers
Radio*
Outdoor*
Internet**
Magazines
Cinema*
Total
2005
$221
$49
$21
$22
$0
$3
$13
$331
$367
$180
$42
$69
$1
$9
$32
$698
2011
$404
$292
$122
$105
$74
$70
$18
$1,012
2012
$444
$321
$135
$115
$82
$77
$20
$1,113
2013
$475
$344
$144
$123
$88
$82
$22
$1,191
2014
$547
$395
$166
$142
$101
$95
$25
$1,369Note: converted at the exchange rate of US$1=VEB4.289; numbers may notadd up to total due to rounding; *for Caracas only; **classifieds, displayand searchSource: ZenithOptimedia, "Advertising Expenditure Forecasts," June 2012;provided by Starcom MediaVest Group, June 2012142242 www.eMarketer.com
142242
For endnotes related to select charts in this section, see page ELA-1.

The Global Media Intelligence Report: Latin America Copyright ©2012 eMarketer, Inc. All rights reserved. LA-41
eMarketer DefinitionsThe following definitions refer only to charts sourced to eMarketer. For additional information about other charts, please see the Endnotes sections.
MEDIA USAGE AND ADVERTISING ■ Digital ad spending includes advertising that appears on desktop and laptop computers as well as mobile phones and tablets, and includes all the various formats of advertising on those platforms; data through 2011 is derived from IAB/PwC data; excludes SMS, MMS and P2P messaging-based advertising.
■ Facebook users are internet users who access their Facebook account via any device at least once per month.
■ Fixed broadband households have permanent connections to the internet via cable modem, DSL, fiber and wireless/satellite technologies. Fixed broadband estimates exclude mobile broadband subscriptions (data cards, dongles, and 3G- and 4G-enabled mobile phones and PDAs).
■ Fixed broadband subscriptions are permanent connections to the internet via cable modem, DSL, fiber and wireless/satellite technologies. Fixed broadband estimates exclude mobile broadband subscriptions (data cards, dongles, and 3G- and 4G-enabled mobile phones and PDAs). Subscription figures include both residential households and commercial businesses.
■ Internet users are individuals of any age who use the internet from any location via any device at least once per month.
■ Mobile ad spending includes display (banners, rich media and video) and search; excludes SMS, MMS and P2P messaging-based advertising; includes ad spending on tablets. Display data includes banners, rich media and video on WAP sites and mobile HTML sites and embedded in-application/in-game advertising. Search data includes advertising on search engines, search applications and carrier portals.
■ Mobile internet users are mobile phone users of any age who access the internet from a mobile browser or an installed application at least once per month. SMS and MMS are not considered mobile internet access.
■ Mobile connections includes the total number of mobile connections, for mobile phones as well as for nonvoice devices, such as internet access devices (e.g., wireless modem cards, netbooks and mobile Wi-Fi hotspots), ereaders, tablets and telematics systems.
■ Mobile phone users are individuals of any age who own at least one mobile phone and use the phone(s) at least once per month.
■ Smartphone users are individuals who own at least one smartphone and use the smartphone(s) at least once per month. Smartphones are any voice handset with an advanced operating system (e.g., Android, BlackBerry, iOS, Windows Mobile, etc.) and features/capabilities that resemble a PC.
■ Social network ad revenues include paid advertising appearing within social network sites, social network games and social network applications; excludes spending by marketers that goes toward developing or maintaining a social network presence.
■ Social network users are internet users who use a social network site via any device at least once per month. Social network sites are defined as sites where the primary activities involve creating a profile and interacting with a network of contacts by sharing status updates, comments, photos or other content.
■ Total media ad spending includes directories, digital (online and mobile), magazines, newspapers, outdoor, radio and TV.
GEOGRAPHIC REGIONS ■ Asia-Pacific: American Samoa, Armenia, Australia, Azerbaijan, Bangladesh, Bhutan, Brunei, Burma, Cambodia, China, Cook Islands, Fiji, French Polynesia, Guam, Hong Kong, India, Indonesia, Japan, Kiribati, Kyrgyzstan, Laos, Macau, Malaysia, Maldives, Marshall Islands, Micronesia, Mongolia, Nauru, Nepal, New Caledonia, New Zealand, Northern Mariana Islands, North Korea, Pakistan, Palau, Papua New Guinea, Philippines, Samoa, Singapore, Solomon Islands, South Korea, Sri Lanka, Taiwan, Thailand, Tajikistan, Timor-Leste, Tonga, Turkmenistan, Tuvalu, Uzbekistan, Vanuatu, Vietnam, Wallis and Futuna
■ Eastern Europe: Albania, Belarus, Bosnia and Herzegovina, Bulgaria, Croatia, Cyprus, Czech Republic, Estonia, Georgia, Hungary, Kazakhstan, Kosovo, Latvia, Lithuania, Moldova, Montenegro, Republic of Macedonia, Poland, Romania, Russia, Serbia, Slovakia, Slovenia, Turkey, Ukraine

The Global Media Intelligence Report: Latin America Copyright ©2012 eMarketer, Inc. All rights reserved. LA-42
eMarketer Definitions
■ Latin America: Anguilla, Antigua and Barbuda, Argentina, Aruba, Bahamas, Barbados, Belize, Bolivia, Brazil, Cayman Islands, Chile, Colombia, Costa Rica, Cuba, Dominica, Dominican Republic, Ecuador, El Salvador, Grenada, Guatemala, Guyana, Haiti, Honduras, Jamaica, Mexico, Montserrat, Netherlands Antilles, Nicaragua, Panama, Paraguay, Peru, Saint-Barthelemy, Saint Kitts and Nevis, Saint Lucia, Saint Martin, Saint Vincent and the Grenadines, Suriname, Trinidad and Tobago, Turks and Caicos Islands, Uruguay, Venezuela, Virgin Islands (British), Virgin Islands (US)
■ Middle East & Africa: Afghanistan, Algeria, Angola, Bahrain, Benin, Botswana, Burkina Faso, Burundi, Cameroon, Cape Verde, Central African Republic, Chad, Comoros, Congo (Brazzaville), Congo (Kinshasa), Cote d’Ivoire, Djibouti, Egypt, Equatorial Guinea, Eritrea, Ethiopia, Gabon, Gambia, Gaza Strip, Ghana, Guinea, Guinea-Bissau, Iran, Iraq, Israel, Jordan, Kenya, Kuwait, Lebanon, Lesotho, Liberia, Libya, Madagascar, Malawi, Mali, Mauritania, Mauritius, Mayotte, Morocco, Mozambique, Namibia, Niger, Nigeria, Oman, Qatar, Rwanda, Saint Helena, Sao Tome and Principe, Saudi Arabia, Senegal, Seychelles, Sierra Leone, Somalia, South Africa, Sudan, Swaziland, Syria, Tanzania, Togo, Tunisia, Uganda, United Arab Emirates, West Bank/Palestine, Western Sahara, Yemen, Zambia, Zimbabwe
■ North America: Canada, US
■ Western Europe: Andorra, Austria, Belgium, Denmark, Faroe Islands, Finland, France, Germany, Gibraltar, Greece, Greenland, Guernsey, Iceland, Ireland, Isle of Man, Italy, Jersey, Liechtenstein, Luxembourg, Malta, Monaco, Netherlands, Norway, Portugal, San Marino, Spain, Sweden, Switzerland, UK
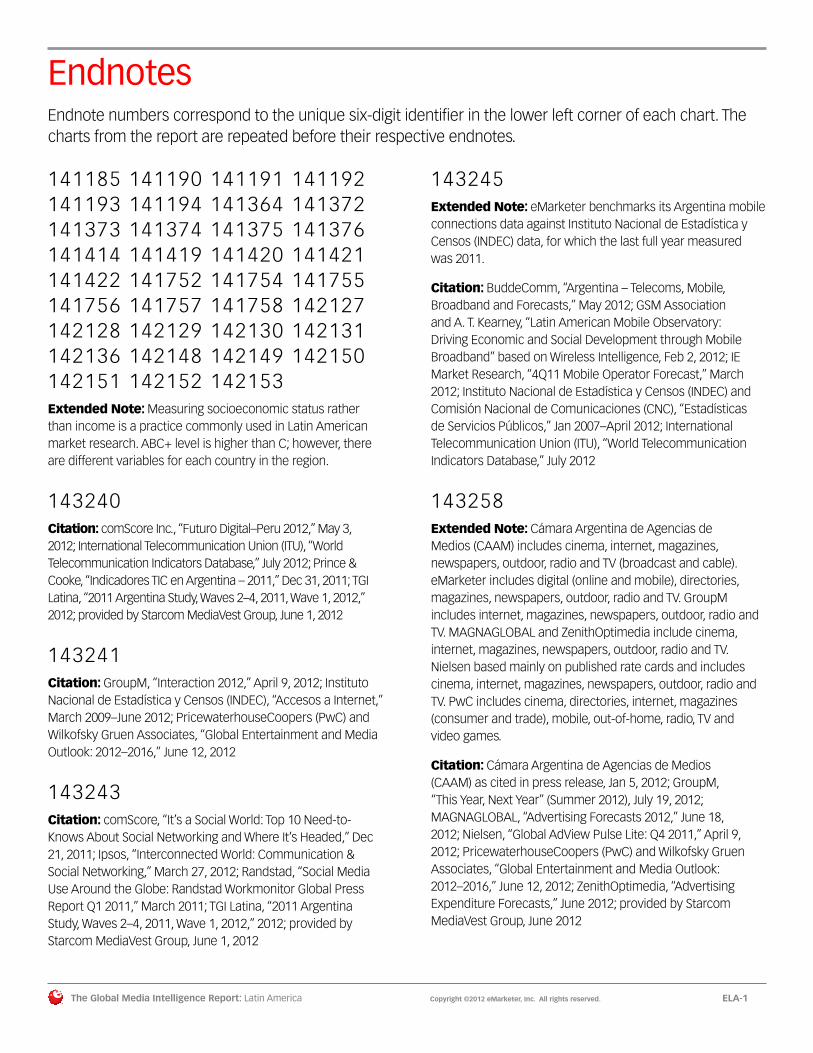
The Global Media Intelligence Report: Latin America Copyright ©2012 eMarketer, Inc. All rights reserved. ELA-1
Endnotes Endnote numbers correspond to the unique six-digit identifier in the lower left corner of each chart. The charts from the report are repeated before their respective endnotes.
141185 141190 141191 141192 141193 141194 141364 141372 141373 141374 141375 141376 141414 141419 141420 141421 141422 141752 141754 141755 141756 141757 141758 142127 142128 142129 142130 142131 142136 142148 142149 142150 142151 142152 142153 Extended Note: Measuring socioeconomic status rather than income is a practice commonly used in Latin American market research. ABC+ level is higher than C; however, there are different variables for each country in the region.
143240Citation: comScore Inc., “Futuro Digital–Peru 2012,” May 3, 2012; International Telecommunication Union (ITU), “World Telecommunication Indicators Database,” July 2012; Prince & Cooke, “Indicadores TIC en Argentina – 2011,” Dec 31, 2011; TGI Latina, “2011 Argentina Study, Waves 2–4, 2011, Wave 1, 2012,” 2012; provided by Starcom MediaVest Group, June 1, 2012
143241Citation: GroupM, “Interaction 2012,” April 9, 2012; Instituto Nacional de Estadística y Censos (INDEC), “Accesos a Internet,” March 2009–June 2012; PricewaterhouseCoopers (PwC) and Wilkofsky Gruen Associates, “Global Entertainment and Media Outlook: 2012–2016,” June 12, 2012
143243Citation: comScore, “It’s a Social World: Top 10 Need-to-Knows About Social Networking and Where It’s Headed,” Dec 21, 2011; Ipsos, “Interconnected World: Communication & Social Networking,” March 27, 2012; Randstad, “Social Media Use Around the Globe: Randstad Workmonitor Global Press Report Q1 2011,” March 2011; TGI Latina, “2011 Argentina Study, Waves 2–4, 2011, Wave 1, 2012,” 2012; provided by Starcom MediaVest Group, June 1, 2012
143245Extended Note: eMarketer benchmarks its Argentina mobile connections data against Instituto Nacional de Estadística y Censos (INDEC) data, for which the last full year measured was 2011.
Citation: BuddeComm, “Argentina – Telecoms, Mobile, Broadband and Forecasts,” May 2012; GSM Association and A. T. Kearney, “Latin American Mobile Observatory: Driving Economic and Social Development through Mobile Broadband” based on Wireless Intelligence, Feb 2, 2012; IE Market Research, “4Q11 Mobile Operator Forecast,” March 2012; Instituto Nacional de Estadística y Censos (INDEC) and Comisión Nacional de Comunicaciones (CNC), “Estadísticas de Servicios Públicos,” Jan 2007–April 2012; International Telecommunication Union (ITU), “World Telecommunication Indicators Database,” July 2012
143258Extended Note: Cámara Argentina de Agencias de Medios (CAAM) includes cinema, internet, magazines, newspapers, outdoor, radio and TV (broadcast and cable). eMarketer includes digital (online and mobile), directories, magazines, newspapers, outdoor, radio and TV. GroupM includes internet, magazines, newspapers, outdoor, radio and TV. MAGNAGLOBAL and ZenithOptimedia include cinema, internet, magazines, newspapers, outdoor, radio and TV. Nielsen based mainly on published rate cards and includes cinema, internet, magazines, newspapers, outdoor, radio and TV. PwC includes cinema, directories, internet, magazines (consumer and trade), mobile, out-of-home, radio, TV and video games.
Citation: Cámara Argentina de Agencias de Medios (CAAM) as cited in press release, Jan 5, 2012; GroupM, “This Year, Next Year” (Summer 2012), July 19, 2012; MAGNAGLOBAL, “Advertising Forecasts 2012,” June 18, 2012; Nielsen, “Global AdView Pulse Lite: Q4 2011,” April 9, 2012; PricewaterhouseCoopers (PwC) and Wilkofsky Gruen Associates, “Global Entertainment and Media Outlook: 2012–2016,” June 12, 2012; ZenithOptimedia, “Advertising Expenditure Forecasts,” June 2012; provided by Starcom MediaVest Group, June 2012

The Global Media Intelligence Report: Latin America Copyright ©2012 eMarketer, Inc. All rights reserved. ELA-2
Endnotes
142225Extended Note: Advertising data for 2005–2011 from Argentine Advertising Agencies Association and 2012–2014 from agency forecasts. Data shown is after discounts and excludes production costs and agency commissions. Outdoor monitoring expanded in 2007 to include new types of “spectacular” display. Data excludes classified advertising.
143259Extended Note: IAB Argentina includes classifieds, directories, display and search. PwC includes wired formats—classifieds, display, email, lead generation, rich media, search, video and other-and mobile. ZenithOptimedia includes display and search.141413 same as 141185
143283Extended Note: comScore Inc. and Nielsen data represents those who used the internet from home and work locations. F/Nazca Saatchi & Saatchi data represents those who accessed the internet from all locations. IBOPE data includes all locations and devices. Núcleo de Informação e Coordenação do Ponto BR (NIC.BR) data represents those who used the internet from any location. TGI Latina data represents those who used the internet in the past 30 days.
Citation: Boston Consulting Group, “China’s Digital Generations 3.0: The Online Empire,” April 12, 2012; comScore Inc., “Futuro Digital–Peru 2012,” May 3, 2012; F/Nazca Saatchi & Saatchi, “F/Radar: 9th Edition,” Aug 2011; F/Nazca Saatchi & Saatchi, “F/Radar: 10th Edition,” Dec 22, 2011; IBOPE Nielsen Online, “NetSpeed Online Report” as cited in press release, April 10, 2012; International Telecommunication Union (ITU), “World Telecommunication Indicators Database,” July 2012; Kantar Media, “Brand Building in the BRICs,” May 1, 2011; Nielsen as cited in Office of Communications (Ofcom) – UK, “International Communications Market Report 2011,” Dec 15, 2011; Núcleo de Informação e Coordenação do Ponto BR (NIC.BR), “TIC Domicílios 2011” conducted by IBOPE Inteligência, May 31, 2012; TGI Latina, “2011 Brazil Study, Waves 1 & 2,” 2012; provided by Starcom MediaVest Group, June 1, 2012
143284Citation: GroupM, “Interaction 2012,” April 9, 2012; Office of Communications (Ofcom) – UK, “International Communications Market Report 2011” with contribution from IDATE and industry data, Dec 15, 2011; PricewaterhouseCoopers (PwC) and Wilkofsky Gruen Associates, “Global Entertainment
and Media Outlook: 2012–2016,” June 12, 2012; Telebrasil (Associação Brasileira de Telecomunicações) as cited in press release; May 6, 2011
143285Citation: comScore, “It’s a Social World: Top 10 Need-to-Knows About Social Networking and Where It’s Headed,” Dec 21, 2011; F/Nazca Saatchi & Saatchi, “F/Radar: 10th Edition,” Dec 22, 2011; Hi-Mídia and M.sense, “Social Networks: User Behavior,” April 30, 2012; InSites Consulting, “Social Media Around the World 2011,” Sep 14, 2011; Ipsos, “Interconnected World: Communication & Social Networking,” March 27, 2012; Núcleo de Informação e Coordenação do Ponto BR (NIC.BR), “TIC Domicílios 2011” conducted by IBOPE Inteligência, May 31, 2012; TGI Latina, “2011 Brazil Study, Waves 1 & 2,” 2012; provided by Starcom MediaVest Group, June 1, 2012; UM, “The Business of Social: Social Media Tracker 2012,” Feb 23, 2012
143286Extended Note: eMarketer benchmarks its Brazil mobile connections data against Agência Nacional de Telecomunicações (Anatel) data, for which the last full year measured was 2011.
Citation: Agência Nacional de Telecomunicações (Anatel), April 17, 2012; BuddeComm, “Brazil – Telecoms, Mobile, Broadband and Forecasts,” March 2012; GSM Association and A. T. Kearney, “Latin American Mobile Observatory: Driving Economic and Social Development through Mobile Broadband” based on Economist Intelligence Unit (EIU), SUBTEL and Wireless Intelligence, Feb 2, 2012; GSM Association and A. T. Kearney, “Latin American Mobile Observatory: Driving Economic and Social Development through Mobile Broadband” based on Wireless Intelligence, Feb 2, 2012; International Telecommunication Union (ITU), “World Telecommunication Indicators Database” July 2012; Pyramid Research, “Brazilian Operators Target Diverse and Growing Telecom Market with Creative Offers” as cited in press release, Jan 17, 2012
143287Extended Note: Carat and MAGNAGLOBAL include cinema, internet, magazines, newspapers, outdoor, radio and TV. eMarketer includes digital (online and mobile), directories, magazines, newspapers, outdoor, radio and TV. GroupM includes cinema, guides and lists, internet, magazines, newspapers, outdoor, radio and TV. Nielsen based mainly on published rate cards and includes cinema, internet,

The Global Media Intelligence Report: Latin America Copyright ©2012 eMarketer, Inc. All rights reserved. ELA-3
Endnotes
magazines, newspapers, outdoor, radio and TV. Projeto Inter-Meios includes cinema, directories, internet, magazines, newspapers, outdoor, radio and TV. PwC includes cinema, directories, internet, magazines (consumer and trade), mobile, out-of-home, radio, TV, video games. Warc includes cinema, internet (display, classifieds and search), magazines, newspapers, outdoor, radio and TV; totals for individual media include both display and classified advertising. ZenithOptimedia includes cinema, magazines, newspapers, online display, outdoor, radio and TV.
Citation: Carat as cited in press release, March 15, 2012; GroupM, “This Year, Next Year Summer 2012,” July 19, 2012; MAGNAGLOBAL, “Advertising Forecasts 2012,” June 18, 2012; Nielsen, “Global AdView Pulse Lite: Q4 2011,” April 9, 2012; PricewaterhouseCoopers (PwC) and Wilkofsky Gruen Associates, “Global Entertainment and Media Outlook: 2012–2016,” June 12, 2012; Projeto Inter-Meios, March 1, 2012; Projeto Inter-Meios and Associação Brasileira das Agências de Publicidade (Abap) as cited by Interactive Advertising Bureau Brasil (IAB Brasil), “Indicadores de Mercado;” eMarketer calculations, April 24, 2012; Warc, “International Advertising Forecast,” Nov 2011 & Feb 2012; ZenithOptimedia, “Advertising Expenditure Forecasts,” June 2012; provided by Starcom MediaVest Group, June 2012
142227Extended Note: Advertising data for 2005–2011 from InterMeios Research and 2012–2014 from agency forecasts. Data shown is after discounts, excludes production costs and includes agency commissions. Data includes classified advertising. TV includes cable TV.
143298Extended Note: PwC includes wired formats—classifieds, display, email, lead generation, rich media, search, video and other-and mobile. ZenithOptimedia excludes search.
Citation: Boston Consulting Group (BCG), “The $4.2 Trillion Opportunity: The Internet Economy in the G-20,” March 19, 2012; GroupM, “This Year, Next Year” (Summer 2012), July 19, 2012; PricewaterhouseCoopers (PwC) and Wilkofsky Gruen Associates, “Global Entertainment and Media Outlook: 2012–2016,” June 12, 2012; Projeto Inter-Meios and Associação Brasileira das Agências de Publicidade (Abap) as cited by Interactive Advertising Bureau Brasil (IAB Brasil), “Indicadores de Mercado,” April 24, 2012; ZenithOptimedia, “Advertising Expenditure Forecasts,” June 2012; provided by Starcom MediaVest Group, June 2012
142229Extended Note: Advertising data for 2005–2011 from ACHAP and 2012–2014 from agency forecasts. Data shown is after discounts and excludes agency commissions and production costs. TV data includes cable TV. Magazine data excludes trade titles.
142234Extended Note: Advertising data for 2005–2010 from ANDA, IAB, LAMAC and IBOPE; 2011 from agency estimates and 2012–2014 from agency forecasts. Data shown is after discounts and excludes production costs and agency commissions. Data excludes classified advertising, except for internet.
143315Citation: Comisión Federal de Telecomunicaciones (COFETEL) as cited in Asociación Mexicana de Internet (AMIPCI) and Elogia, “Hábitos de los Usuarios de Internet en México,” May 17, 2012; comScore Inc., “Futuro Digital–Peru 2012,” May 3, 2012; International Telecommunication Union (ITU), “World Telecommunication Indicators Database,” July 2012; TGI Latina, “2011 Mexico Study, Waves 1-3,” 2012; provided by Starcom MediaVest Group, June 1, 2012; The Competitive Intelligence Unit, June 27, 2012; World Internet Project, “Estudio 2011 de hábitos y percepciones de los mexicanos sobre Internet y diversas tecnologías asociadas,” July 5, 2011
143317Citation: GroupM, “Interaction 2012,” April 9, 2012; PricewaterhouseCoopers (PwC) and Wilkofsky Gruen Associates, “Global Entertainment and Media Outlook: 2012–2016,” June 12, 2012
143069Citation: Asociación Mexicana de Internet (AMIPCI) and Elogia, “Hábitos de los Usuarios de Internet en México,” May 17, 2012; comScore, June 2012; Ipsos, “Interconnected World: Communication & Social Networking, March 27, 2012
143330Citation: BuddeComm, “Mexico – Telecoms, Mobile, Broadband and Forecasts,” Aug 2011; Comisión Federal de Telecomunicaciones (COFETEL) with company reports, March 14, 2012; GSM Association and A. T. Kearney, “Latin

The Global Media Intelligence Report: Latin America Copyright ©2012 eMarketer, Inc. All rights reserved. ELA-4
Endnotes
American Mobile Observatory: Driving Economic and Social Development through Mobile Broadband” based on Economist Intelligence Unit (EIU), SUBTEL and Wireless Intelligence, Feb 2, 2012; GSM Association and A. T. Kearney, “Latin American Mobile Observatory: Driving Economic and Social Development through Mobile Broadband” based on Wireless Intelligence, Feb 2, 2012; International Telecommunication Union (ITU), “World Telecommunication Indicators Database,” July 2012
143342Extended Note: GroupM includes cinema, internet, magazines, newspapers, outdoor, radio and TV. Nielsen based mainly on published rate cards and includes cinema, internet, magazines, newspapers, outdoor, radio and TV. PwC includes cinema, directories, internet, magazines (consumer and trade), mobile, out-of-home, radio, TV, video games. ZenithOptimedia includes magazines, newspapers, radio and TV.
Citation: GroupM, “This Year, Next Year” (Summer 2012), July 19, 2012; Nielsen, “Global AdView Pulse Lite: Q4 2011,” April 9, 2012; PricewaterhouseCoopers (PwC) and Wilkofsky Gruen Associates, “Global Entertainment and Media Outlook: 2012–2016,” June 12, 2012; ZenithOptimedia, “Advertising Expenditure Forecasts,” June 2012; provided by Starcom MediaVest Group, June 2012
142239Extended Note: Advertising data for 2005–2011 from IBOPE and CIMA adjusted by ZenithOptimedia and 2012–2014 from agency forecasts. Data shown is after discounts and excludes production costs. Data excludes agency commission at 15%. Data excludes classified advertising.
143343Extended Note: IAB México includes display, search and mobile (display on mobile sites, apps and games; in-app/in-game advertising; SMS/MMS opt-in; SMS marketing; special event sponsoships and other). PwC includes wired formats—classifieds, display, email, lead generation, rich media, search, video and other; and mobile.
Citation: Boston Consulting Group (BCG), “The $4.2 Trillion Opportunity: The Internet Economy in the G-20,” March 19, 2012; GroupM, “This Year, Next Year” (Summer 2012), July 19, 2012; Interactive Advertising Bureau México (IAB México) and PricewaterhouseCoopers (PwC), “Estudio de Inversión Publicitaria Online en México – Resultados de 2011”; eMarketer calculations, May 16, 2012; PricewaterhouseCoopers (PwC) and Wilkofsky Gruen
Associates, “Global Entertainment and Media Outlook: 2012–2016,” June 12, 2012
142240Extended Note: Advertising data for 2005–2009 from CPI, 2010–2013 agency estimates and 2012–2014 from agency forecasts. Data shown is after discounts and excludes production costs and agency commissions. Data excludes classified advertising. “Other” includes cinema and direct mail only from 2007; includes internet and direct mail until 2006.
142242Extended Note: Advertising data for 2005–2010 from IVP, AGB and agency figures; 2011 ANDA/FEVAP and 2012–2014 from agency forecasts. Data shown is after discounts and excludes production costs. Data includes agency commission at 20%. Data excludes classified advertising except for internet.
141438 141439 141440 141441 141442 141443Extended Note: For the income category, 49% of respondents gave no response.