lateral flow immunoassay for progesterone detection
TRANSCRIPT
ISSN 0027�1314, Moscow University Chemistry Bulletin, 2012, Vol. 67, No. 5, pp. 241–248. © Allerton Press, Inc., 2012.Original Russian Text © V.A. Safronova, J.V. Samsonova, V.G. Grigorenko, A.P. Osipov, 2012, published in Vestnik Moskovskogo Universiteta. Khimiya, 2012, No. 5, pp. 326–334.
241
INTRODUCTION
At present, the early diagnosis of pregnancy in cowsis one of the most important tasks in agriculture. Thedetection of pregnancy shortly after inseminationallows the service period to be significantly reducedand, therefore, is considered to be an essential tool ofeconomically viable reproductive management strat�egy. Traditional rectal examination only yields reliableresults on days 70–90 after insemination. Pregnancydetection using ultrasound scanners, i.e., ultrasonog�raphy, is known to achieve a reliable diagnosis using anumber of different parameters on days 32–37 post�insemination; however, the implication of thisapproach requires the expertise of highly qualified vet�erinarians, as well as the use of expensive equipment.Immunochemical methods of analysis, including theenzyme�linked immunosorbent assay (ELISA) areaccepted as the fastest among all known methods ofpregnancy detection. ELISA allows pregnancy to bediagnosed in cows by detecting the concentration ofthe species�nonspecific hormone progesterone (PG)in milk and blood serum on days 19–21 post�insemi�nation [1]. However, this method requires the use ofspecial equipment.
Immunochemical methods of detecting pregnancyby accessing the content of PG were first developed inthe 1970s [2, 3]. The diagnosis of pregnancy based onthe detection of the PG concentration in milk was firstdescribed in [4]. Later, it was demonstrated that thecontent of PG in cow’s milk correlates with its con�centration in blood serum; therefore, PG can be usedas a marker for detecting pregnancy in cows [5, 6]. Theconcentration of PG in cow milk changes cyclically[7], i.e., it is at a low level (below 2 ng/mL) during ovu�lation, which occurs at the beginning of the reproduc�tive cycle, and rises to the maximum (more than
10 ng/mL) on days 13–15. When no pregnancy hasoccurred, the level of PG drops on days 18–20. How�ever, if insemination was successful, PG remains at ahigh level throughout the whole period of pregnancy.Therefore, the detection of the PG concentration onday 21, i.e., at the end of the reproductive cycle, allowsone to consider the pregnancy status of the investi�gated animals to be positive in the case of high PG andnegative when the PG level is relatively low. A cow isconsidered to be pregnant if the level of PG in milk onday 21 after insemination is above 7 ng/mL.
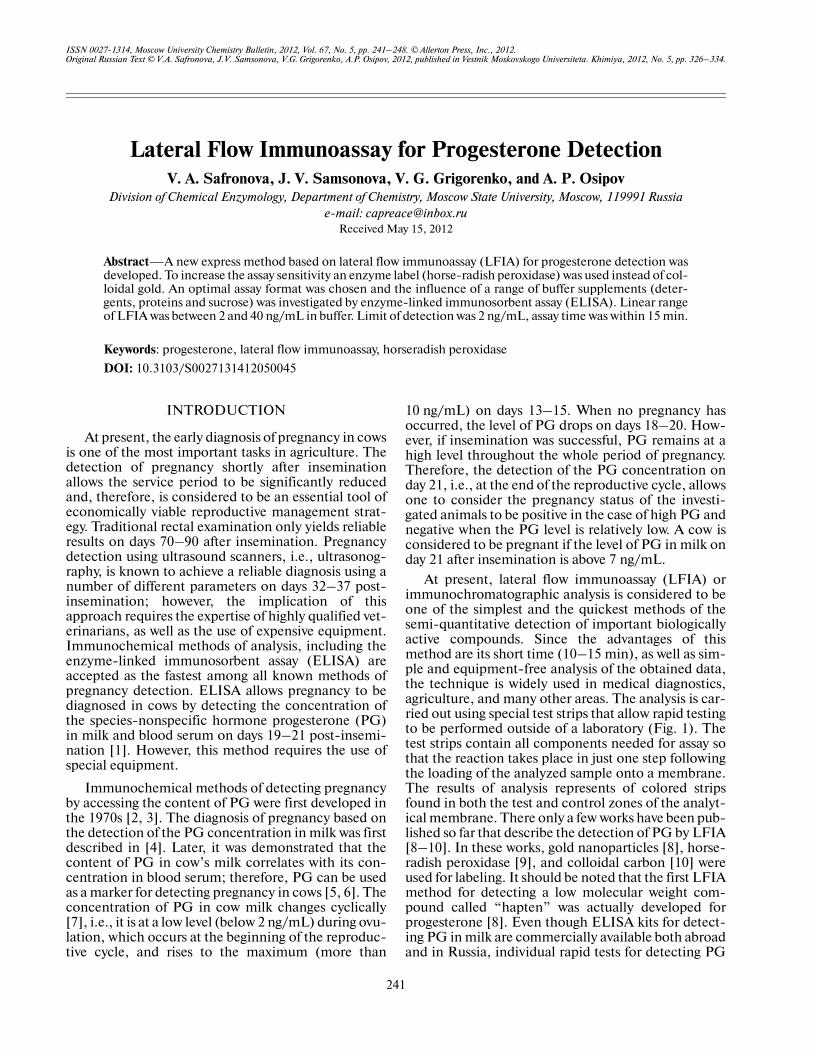
At present, lateral flow immunoassay (LFIA) orimmunochromatographic analysis is considered to beone of the simplest and the quickest methods of thesemi�quantitative detection of important biologicallyactive compounds. Since the advantages of thismethod are its short time (10–15 min), as well as sim�ple and equipment�free analysis of the obtained data,the technique is widely used in medical diagnostics,agriculture, and many other areas. The analysis is car�ried out using special test strips that allow rapid testingto be performed outside of a laboratory (Fig. 1). Thetest strips contain all components needed for assay sothat the reaction takes place in just one step followingthe loading of the analyzed sample onto a membrane.The results of analysis represents of colored stripsfound in both the test and control zones of the analyt�ical membrane. There only a few works have been pub�lished so far that describe the detection of PG by LFIA[8–10]. In these works, gold nanoparticles [8], horse�radish peroxidase [9], and colloidal carbon [10] wereused for labeling. It should be noted that the first LFIAmethod for detecting a low molecular weight com�pound called “hapten” was actually developed forprogesterone [8]. Even though ELISA kits for detect�ing PG in milk are commercially available both abroadand in Russia, individual rapid tests for detecting PG
Lateral Flow Immunoassay for Progesterone DetectionV. A. Safronova, J. V. Samsonova, V. G. Grigorenko, and A. P. Osipov
Division of Chemical Enzymology, Department of Chemistry, Moscow State University, Moscow, 119991 Russiae�mail: [email protected]
Received May 15, 2012
Abstract—A new express method based on lateral flow immunoassay (LFIA) for progesterone detection wasdeveloped. To increase the assay sensitivity an enzyme label (horse�radish peroxidase) was used instead of col�loidal gold. An optimal assay format was chosen and the influence of a range of buffer supplements (deter�gents, proteins and sucrose) was investigated by enzyme�linked immunosorbent assay (ELISA). Linear rangeof LFIA was between 2 and 40 ng/mL in buffer. Limit of detection was 2 ng/mL, assay time was within 15 min.
Keywords: progesterone, lateral flow immunoassay, horseradish peroxidase
DOI: 10.3103/S0027131412050045
242
MOSCOW UNIVERSITY CHEMISTRY BULLETIN Vol. 67 No. 5 2012
SAFRONOVA et al.
in milk have been developed relatively recently. There�fore, the aim of this study was to develop a rapid LFIA�based method for detecting progesterone that can befurther used in practice for the rapid testing of preg�nancy in cows.
MATERIALS AND METHODS
Biochemical and chemical reagents were pur�chased from Sigma (USA); potassium mono� anddihydrogen phosphate, as well as sucrose, were fromHelicon (Russia); tetrachloroauric acid was purchasedfrom Fluka (Switzerland); Tween�20 and Triton X�100were from MP Biomedicals (France); ovalbumin(OVA) was from Reakhim (Russia); ready�to�use sub�strate solution containing 3,3',5,5'�tetramethylbenzi�din (TMB) and H2O2 was from NVO Immunotek(Russia); sulfuric acid and absolute ethanol were pur�chased from Khimmed (Russia); and horseradish per�oxidase (HRP) was from Yarinvest (Russia).
The buffer solutions used in this work were as fol�lows: PB 0.01 M, pH 7.0; PBS 0.01 M; 0.15 M NaCl,pH 7.4; PBST 0.01 M; 0.15 M NaCl; 0.05% Tween�20,pH 7.4; CB 0.01 M, pH 9.5; and BB 0.01 M, pH 8.6.
Standard solutions of PG were prepared by subse�quently diluting 1 mg/mL ethanol solution of PG withPBST buffer.
Polyclonal antisera obtained via the immunizationof rabbits with a conjugate of 11α�hydroxyprogester�one hemisuccinate and hemocyanin and with horse�radish peroxidase were kindly donated by the Labora�tory of Genetic Engineering, Department of Chemi�cal Enzymology, Moscow State University. Theimmunoglobulin fraction of rabbit antiserum was iso�lated by double precipitation with anhydrous ammo�nium sulfate. The excess ammonium sulfate wasremoved via gel filtration using a PD�10 column (GEHealthcare, United Kingdom).
Colloidal gold preparation with the desired averagesize of particles was obtained as described by Frens [11].
Multimembrane test strips were prepared usinganalytical nitrocellulose CNPC membranes with apore diameter of 15 μm, PT�5 conjugate pad, absor�bent pad AP045 (MDI, India), and MAPDS�0300sample pad (Arista Biologicals, USA).
Synthesis of Conjugate of Progesterone 3�O�Carboxymethyloxime with OVA
To obtain the conjugate, 2.9 mg (7.5 μmol) proges�terone 3�O�Carboxymethyloxime (CMO�PG),1.7 mg (15 μmol) N�hydroxysuccinimide (NHS), and3.1 mg (15 μmol) dicyclohexylcarbodiimide (DCC)were dissolved in 500 μL dimethylformamide (DMF).The reaction mixture was then stirred at room temper�ature for 4 h and further incubated at 4°C overnight.The formed precipitate was removed by centrifuga�tion. The supernatant (170 μL) was added to a solutionof 20 mg (0.5 μmol) OVA in 1.5 mL BB with shakingand further incubated at room temperature for 4 h.The obtained solution was dialyzed against distilledwater. The obtained conjugate was lyophilized andstored at 4°C until it was needed.
Preparation of CMO�PG�OVA Conjugate Labeledwith Gold Nanoparticles
To label the conjugate, 1 mL of 50 mg/mL solutionof the CMO�PG�OVA conjugate was added to 10 mLcolloidal gold solution (pH 5.5) and mixed inten�sively for 15 min. To remove the excess of unboundCMO�PG�OVA conjugate, the obtained solution wascentrifuged at 11000 g for 20 min at 4°C. The superna�tant was then removed and the precipitate was resus�pended in 1 mL PB containing 0.1% bovine serumalbumine (BSA), 10% sucrose, and 0.01% NaN3. Analiquot of the obtained solution was applied onto astrip of a conjugate pad of the 4 × 4 mm in size and themembrane was then left to dry at room temperatureovernight.
Preparation of Conjugate of CMO�PG with Horseradish Peroxidase
To obtain the conjugate, 2.6 mg (6.7 μmol) CMO�PG was dissolved in 300 μL DMF followed by theaddition of 0.9 mg (8 μmol) NHS and 2.7 mg(13 μmol) DCC, and the obtained solution wasshaken. The reaction mixture was stirred at room tem�perature for 2 h and further incubated at 4°C over�night. The reaction mixture was then centrifuged, afterwhich 100 μL supernatant were added to a solution of2 mg HRP in 200 μL BB with shaking. The resultingreaction mixture was further stirred at room tempera�ture for 2 h. Following the incubation step, the reac�tion mixture was centrifuged and the supernatant waspurified by gel exclusion chromatography using a PD�10 column (GE Healthcare, United Kingdom). Theoptical density of the obtained conjugate was mea�sured at a wavelength of 403 nm using a UV�1202spectrophotometer (Shimadzu, Japan).
Preparation of Test Strip
To perform LFIA using colloidal gold as a label,specific antibodies at a concentration of 0.2 mg/mL or
Fig. 1. Construction of a test strip for LFIA. 1—samplepad; 2—conjugate pad; 3—absorbent pad; 4—analyticalmembrane; 5—test band; 6—control band; 7—plasticbase.
1 23
4 5 6 7
MOSCOW UNIVERSITY CHEMISTRY BULLETIN Vol. 67 No. 5 2012
LATERAL FLOW IMMUNOASSAY FOR PROGESTERONE DETECTION 243
protein A at a concentration of 0.1 mg/mL in PBSwere applied to an analytical membrane using a pro�grammable semi�automatic dispenser BioJet Quanti3000 equipped with an automatic platform XYZ 3050(BioDot, USA) to form an analytical zone. In the caseof LFIA with an enzymatic label, the antibodies wereapplied at a concentration of 0.015 mg/mL. To form acontrol zone, the antibodies to HRP at a concentra�tion of 0.025 mg/mL were applied onto the strip at adistance of 5 mm from the analytical zone. The fol�lowing parameters of the dispenser pump for antibodyapplication were used: droplet size, 30 nL; line width,0.3 mm; and speed, 50 mm/s. The test strips weredried at 37°C for 24 h.
Procedure of LFIA Employed Colloidal Gold as a Label
The test strips (75 × 4 mm) were prepared accord�ing to the scheme presented in Fig. 1. Prior to theanalysis, the test strips were placed on a horizontal sur�face. The application of reagents was carried out in twodifferent ways. The first approach, which is shown in Fig.2 (scheme 1), was employed when specific antibodieswere absorbed in the analytical zone (120 μL standardPG solution was applied onto a sample pad); the sec�ond approach, which was illustrated by scheme 2(Fig. 2), was used for protein A absorbed in the testzone of a test strip (120 μL standard PG solution and5 μL of an antibody solution at a concentration of0.01 mg/mL were applied onto a sample pad).
All reagent solutions were prepared in PBST buffer.After the solution loaded onto the membrane soakedin completely, the test strips were air dried at roomtemperature. The quantitative evaluation of the inten�sity of the colored control and analytical zones of thetest strips was performed using an Epson PerfectionV700 Photo scanner (Seiko�Epson, Japan) with a res�olution of 600 dpi in the 24�bit color (RGB) setting. Ananalysis of the obtained digital images was carried out in
the TIFF format using the Scion Image program (http://www.scioncorp.com/pages/scion_image_windows.htm).The obtained data were used to plot the calibrationcurves, where the color intensity of the test strips inarbitrary units or the ratio B : B0 = (I/I0) × 100%,where I0 represents the stain intensity at a concentra�tion of PG of 0 ng/mL and I is the color intensity wasalong the x�axis and values of concentration of a stan�dard PG solution were along the y�axis.
ELISA procedure
ELISA was carried out according to three differentschemes illustrated in Fig. 3. In the case of scheme 1,a solution of antibodies in CB at a specific concentra�tion (150 μL per well) was absorbed in the wells of apolystyrene plate. Following the incubation of a plateat 4°C overnight, the well plate was washed three timeswith PBST (150 μL per well), after which 20 μL stan�dard PG solutions followed by 100 μL CMO�PG�HRP conjugate solution at a specific concentrationwas added in each well. The well plate was incubated at37°C for 1 h, the excess unbound reagents was removedby washing with PBST solution (3 × 150 μL per well) and100 μL substrate solution was then added to each well,and the plate was incubated at 37°C for 15 min. Thereaction was stopped by adding 100 μL/well of 0.2 Msulfuric acid. When scheme 2 was used, the protein Aat a concentration of 1 μg/mL in CB was first absorbedin wells (150 μL per well, 2 h incubation at 37°C). Fol�lowing washing with PBST (3 × 150 μL per well), anovernight incubation at 4°C with a solution of specificantibodies in PBST at a desired concentration wasperformed (150 μL per well). Further analysis was per�formed as described above for scheme 1. Analysisaccording to scheme 3 was carried out analogously tothe one described above for scheme 2. The only differ�ence was that, following the stage of protein A absorp�tion, 20 μL standard PG solutions, 50 μL CMO�PG�
60
0
100
80
20
10 100
40 12
3
B/B0, %
[PG], ng/mL
Scheme 1
Scheme 2
Protein A
Progesterone
Antibody
(curves 1, 2 )
(curve 3)
+
+
Labeled progesterone
+
1000
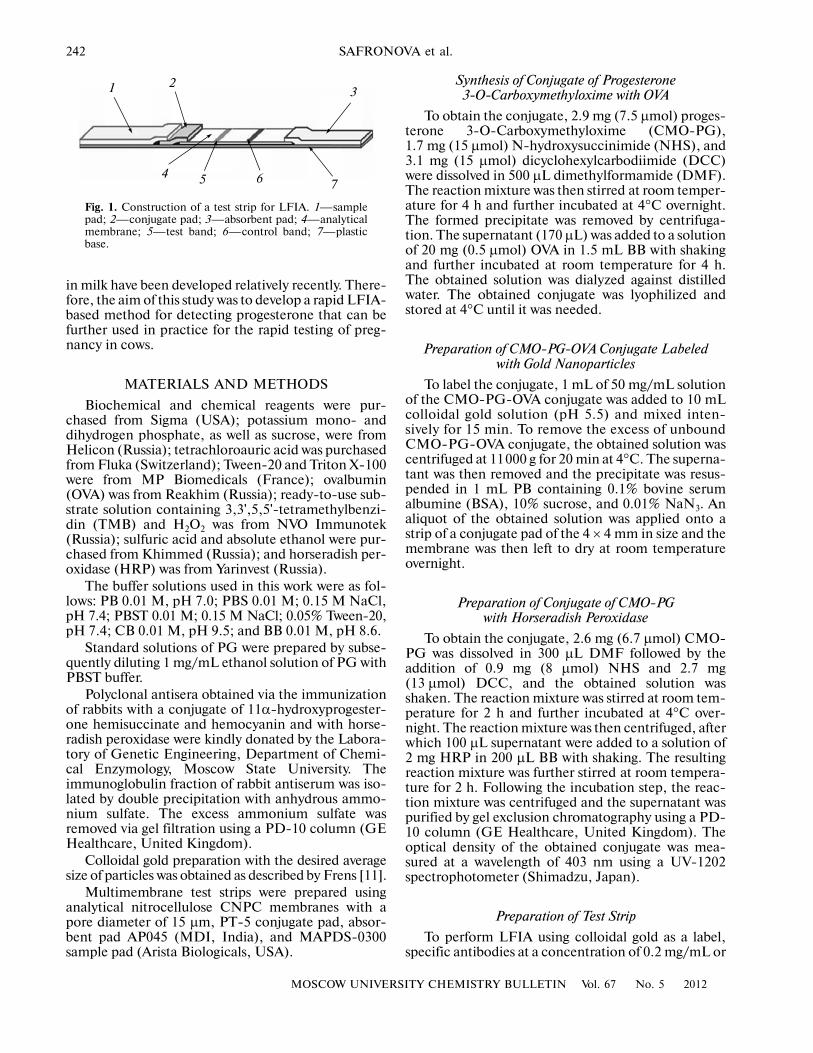
Fig. 2. Calibration curves for PG detection using LFIA employed colloidal gold as a label. Gold particles with a size 16 nm (1)and 35 nm (2, 3) were employed in LFIA according to schemes 1 (1, 2) and 2 (3).
244
MOSCOW UNIVERSITY CHEMISTRY BULLETIN Vol. 67 No. 5 2012
SAFRONOVA et al.
HRP conjugate solution and 50 μL antibody solutionin PBS at a specific concentration were sequentiallyadded to wells, after which the well plate was incu�bated at 37°C for 1 h. The reaction results were ana�lyzed using a vertical�beam spectrophotometer at awavelength of 450 nm (Molecular Devices, UnitedStates). The obtained data were calculated to plot thecalibration dependences where the stain intensity inoptical units or the value B : B0 = (I/I0) × 100% wasalong the abscissa of the graph and concentration val�ues of a standard PG solution were along the ordinate.
LFIA Procedure Using Enzymatic Labeling
The test strips (75 × 4 mm) were constructedaccording to the scheme illustrated in Fig. 1 withoutusing membranes to load the conjugate. To performthe assay, a mixture of 10 μL CMO�PG�HRP conju�gate and 10 μL standard PG solution in PBST wasapplied to the analytical membrane. Following the fullinfiltration of the applied solution, 150 μL of PBSTwas applied to the very end of the membrane to loadthe sample. After the infiltration of the applied PBSTsolution, the test strip was stained via two differentmethods. In the first case, the analytical membranewas cut off and immersed into 500 μL substrate solu�tion containing 10% dextran sulfate and further incu�bated for 5 min with shaking. In the second case,50 μL same solution was applied to an analyticalmembrane. Following staining, the test strips were airdried at room temperature for 30 min. The quantita�tive evaluation of the obtained results was carried outas described in the case of LFIA employed colloidalgold as a label.
RESULTS AND DISCUSSION
LFIA Employed Gold Nanoparticles as Label
Progesterone is a low�molecular�weight com�pound; therefore, a scheme of analysis was employedbased on the principle of competitive binding of labeled
and unlabeled PG with the specific antibody bindingsites. In this case, the resulting analytical signal isinversely correlated with the concentration of PG.
In LFIA, gold nanoparticles are often used as alabel. The main advantages of the use of gold nanopar�ticles for antibody labeling are defined primarily by thesimplicity of preparation of the predicted size particlesand, secondly, by their unique optical characteristics.In the present work, we used colloidal gold nanoparti�cles with sizes of 16 and 35 nm. To perform LFIA withcolloidal gold as a marker, the scheme according towhich the PG specific antibodies were immobilized inthe test zone was initially used. Gold nanoparticleswere used to label a conjugate of a PG derivative withhigh�molecular�weight protein (OVA). The obtainedcalibration curves demonstrate that the use of goldnanoparticles of various sizes does not allow the reli�able detection of PG in the desired range of concen�tration, i.e., below 10 ng/mL (Fig. 2, curves 1 and 2).Therefore, we modified the scheme of analysis andused the immobilization of the protein A in the testzone of a membrane. The main feature of the modifiedscheme is that all reagents, i.e., labeled (PG*) andunlabeled (PG) PG, as well as antibodies specific toPG, are simultaneously applied to a test strip. Thisallows one to create genuine conditions under whichlabeled and unlabeled reagents compete for the anti�body binding sites in solution. Following this step, thebinding of antibodies to the protein A molecules leadsto their directed immobilization on the membrane viathe Fc fragment. As can be seen in Fig. 2 (curve 3), theslope of the calibration curve for this scheme is higherthan that of the calibration curve that characterizes thedirect absorption of antibodies. However, this schemeof analysis also does not allow the working range of thecalibration dependency to be shifted to a region oflower concentration. Therefore, the further develop�ment of a quick method of PG detection used moresensitive enzyme label. LFIA using enzyme as a labelhas previously been described in the literature forhigh� [12–15] and low� [16, 17] molecular�weight
60
0
100
80
20
1000.1 101
40
1
23
B/B0, %
[PG], ng/mL
Scheme 1
Scheme 2
Protein A
Progesterone
Labeled progesterone
Antibody
(curve 1)
(curve 3)
Scheme 1(curve 2)
+
+
+
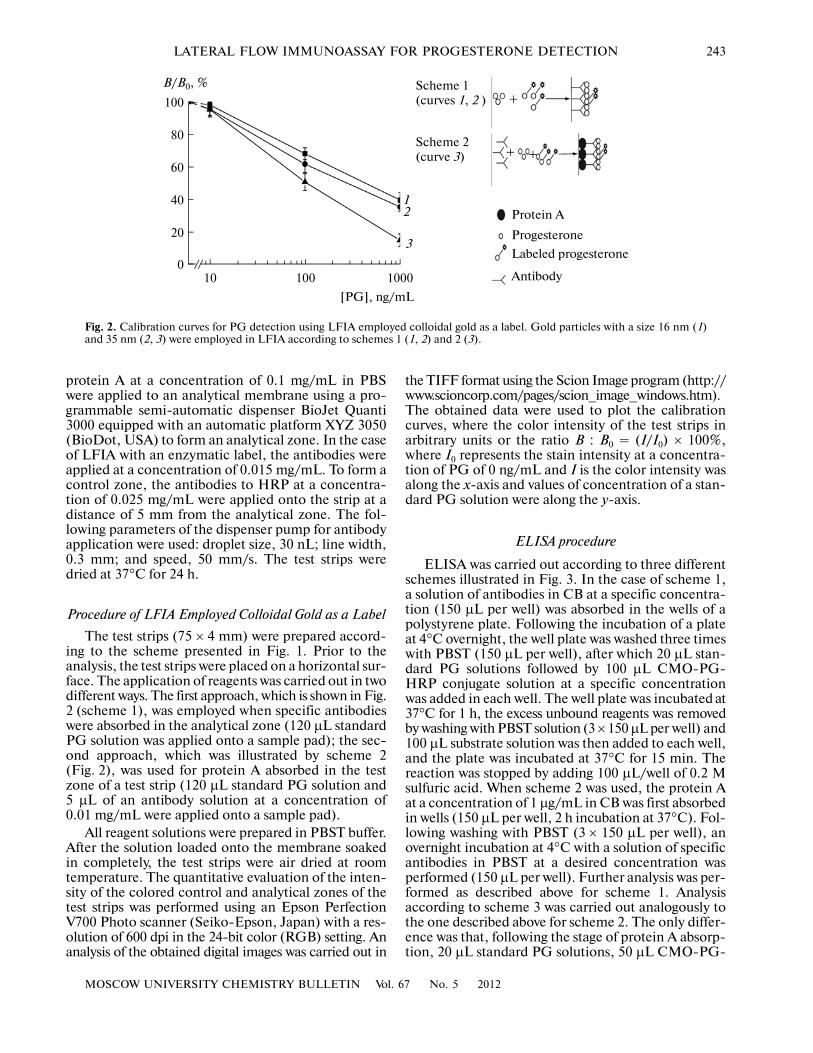
Fig. 3. Calibration dependences for detecting PG using ELISA by three different schemes.
MOSCOW UNIVERSITY CHEMISTRY BULLETIN Vol. 67 No. 5 2012
LATERAL FLOW IMMUNOASSAY FOR PROGESTERONE DETECTION 245
compounds, as well as whole cells [18]. The use of anenzyme as an antibody marker allows the analysis sen�sitivity to be increased by 10–30 times compared toLFIA using colloidal gold for labeling [13, 15, 17]. Tochoose an optimal scheme of the LFIA procedureusing horseradish peroxidase as a label and to study theinfluence of various components, which can be a partof membranes used in the analysis, the enzyme�linkedimmunosorbent assay was used.
Detection of PG using ELISA
Choice of an assay format. The comparative studyof three different schemes of ELISA (Fig. 3) was per�formed. In scheme 1, antibodies were immobilized inwell of plates directly, whereas in schemes 2 and 3 anti�bodies were absorbed directionally through the proteinA. The principal difference of scheme 3 from the oth�ers is that all reagents, i.e., both free and enzyme�labeled PGs, as well as specific antibodies, are addedsimultaneously, which provides the genuine competi�tion of labeled and unlabeled reagents for the bindingsites of antibodies. Simultaneously, the directionalbinding of antibodies with protein A occurs throughthe Fc fragment.
The calibration dependences obtained for theabove�described three assay schemes were almostidentical (Fig. 3). Despite that assay according toscheme 1 requires a higher concentration of antibodiesthan that of both schemes 2 and 3, where the absorp�tion of antibodies is conducted using protein A,scheme 1 prevails significantly in terms of the assayduration, i.e., 1.5 h versus 3 h in the case of schemes 2and 3. Consequently, less complicated and muchquicker scheme 1, which employs the direct absorp�tion of antibodies, was used for further investigations.
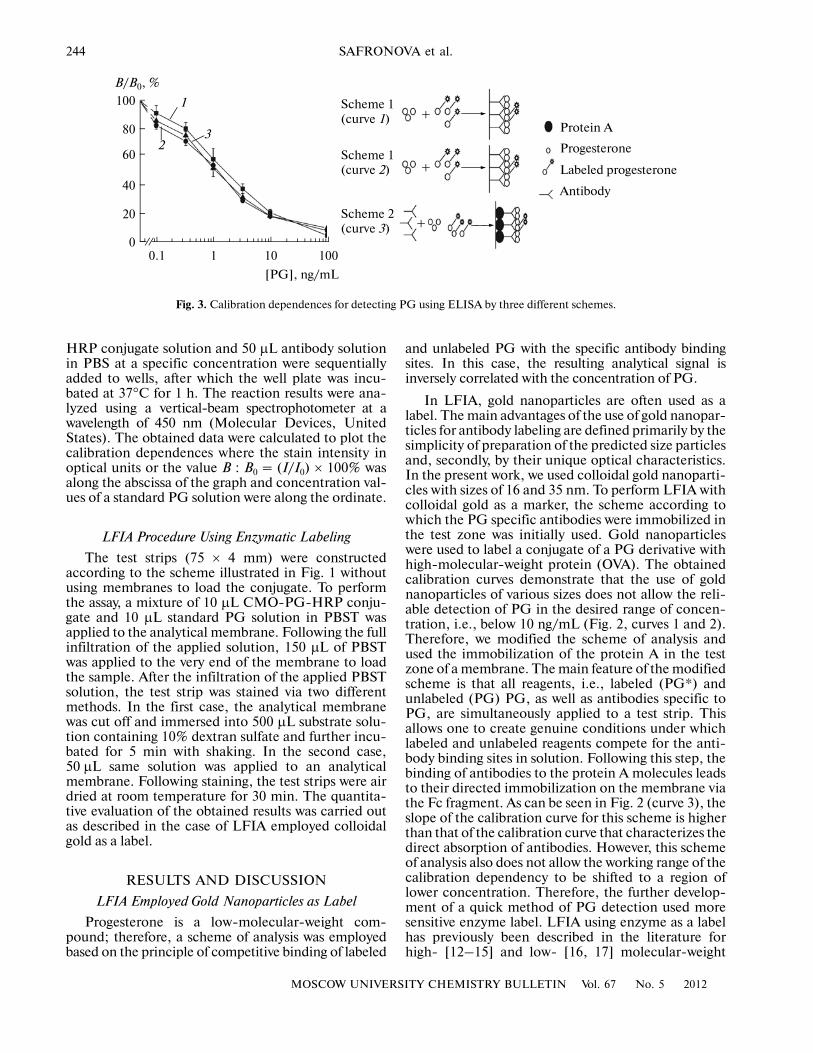
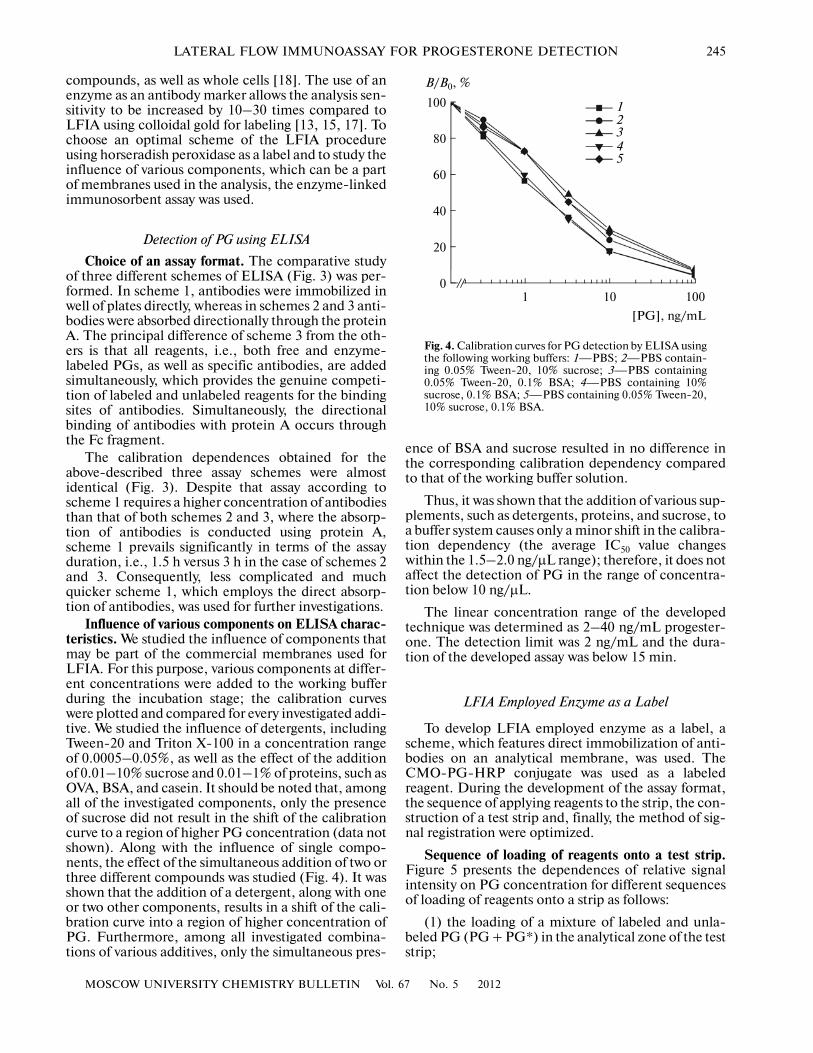
Influence of various components on ELISA charac�teristics. We studied the influence of components thatmay be part of the commercial membranes used forLFIA. For this purpose, various components at differ�ent concentrations were added to the working bufferduring the incubation stage; the calibration curveswere plotted and compared for every investigated addi�tive. We studied the influence of detergents, includingTween�20 and Triton X�100 in a concentration rangeof 0.0005–0.05%, as well as the effect of the additionof 0.01–10% sucrose and 0.01–1% of proteins, such asOVA, BSA, and casein. It should be noted that, amongall of the investigated components, only the presenceof sucrose did not result in the shift of the calibrationcurve to a region of higher PG concentration (data notshown). Along with the influence of single compo�nents, the effect of the simultaneous addition of two orthree different compounds was studied (Fig. 4). It wasshown that the addition of a detergent, along with oneor two other components, results in a shift of the cali�bration curve into a region of higher concentration ofPG. Furthermore, among all investigated combina�tions of various additives, only the simultaneous pres�
ence of BSA and sucrose resulted in no difference inthe corresponding calibration dependency comparedto that of the working buffer solution.
Thus, it was shown that the addition of various sup�plements, such as detergents, proteins, and sucrose, toa buffer system causes only a minor shift in the calibra�tion dependency (the average IC50 value changeswithin the 1.5–2.0 ng/μL range); therefore, it does notaffect the detection of PG in the range of concentra�tion below 10 ng/μL.
The linear concentration range of the developedtechnique was determined as 2–40 ng/mL progester�one. The detection limit was 2 ng/mL and the dura�tion of the developed assay was below 15 min.
LFIA Employed Enzyme as a Label
To develop LFIA employed enzyme as a label, ascheme, which features direct immobilization of anti�bodies on an analytical membrane, was used. TheCMO�PG�HRP conjugate was used as a labeledreagent. During the development of the assay format,the sequence of applying reagents to the strip, the con�struction of a test strip and, finally, the method of sig�nal registration were optimized.
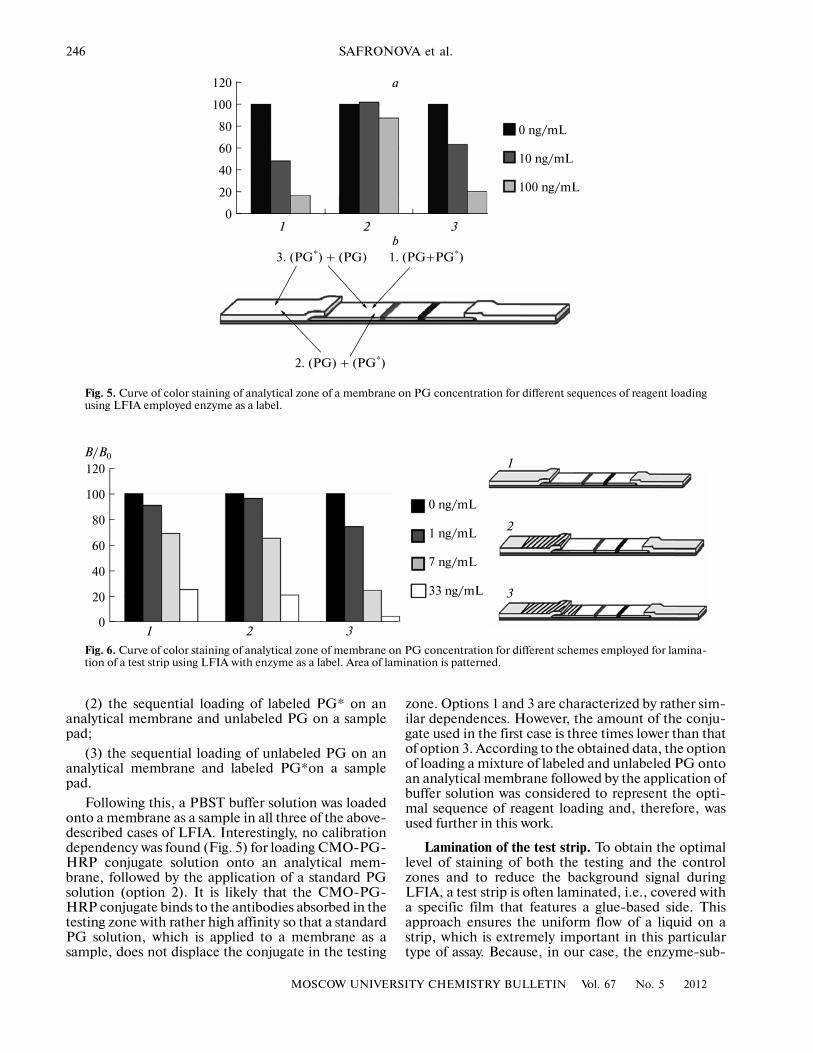
Sequence of loading of reagents onto a test strip.Figure 5 presents the dependences of relative signalintensity on PG concentration for different sequencesof loading of reagents onto a strip as follows:
(1) the loading of a mixture of labeled and unla�beled PG (PG + PG*) in the analytical zone of the teststrip;
60
0
100
80
20
40
123
B/B0, %
[PG], ng/mL
100
45
101
Fig. 4. Calibration curves for PG detection by ELISA usingthe following working buffers: 1—PBS; 2—PBS contain�ing 0.05% Tween�20, 10% sucrose; 3—PBS containing0.05% Tween�20, 0.1% BSA; 4—PBS containing 10%sucrose, 0.1% BSA; 5—PBS containing 0.05% Tween�20,10% sucrose, 0.1% BSA.
246
MOSCOW UNIVERSITY CHEMISTRY BULLETIN Vol. 67 No. 5 2012
SAFRONOVA et al.
(2) the sequential loading of labeled PG* on ananalytical membrane and unlabeled PG on a samplepad;
(3) the sequential loading of unlabeled PG on ananalytical membrane and labeled PG*on a samplepad.
Following this, a PBST buffer solution was loadedonto a membrane as a sample in all three of the above�described cases of LFIA. Interestingly, no calibrationdependency was found (Fig. 5) for loading CMO�PG�HRP conjugate solution onto an analytical mem�brane, followed by the application of a standard PGsolution (option 2). It is likely that the CMO�PG�HRP conjugate binds to the antibodies absorbed in thetesting zone with rather high affinity so that a standardPG solution, which is applied to a membrane as asample, does not displace the conjugate in the testing
zone. Options 1 and 3 are characterized by rather sim�ilar dependences. However, the amount of the conju�gate used in the first case is three times lower than thatof option 3. According to the obtained data, the optionof loading a mixture of labeled and unlabeled PG ontoan analytical membrane followed by the application ofbuffer solution was considered to represent the opti�mal sequence of reagent loading and, therefore, wasused further in this work.
Lamination of the test strip. To obtain the optimallevel of staining of both the testing and the controlzones and to reduce the background signal duringLFIA, a test strip is often laminated, i.e., covered witha specific film that features a glue�based side. Thisapproach ensures the uniform flow of a liquid on astrip, which is extremely important in this particulartype of assay. Because, in our case, the enzyme�sub�
120
100
80
60
40
20
0321
0 ng/mL
10 ng/mL
100 ng/mL
3. (PG*) + (PG) 1. (PG+PG*)
2. (PG) + (PG*)
a
b
Fig. 5. Curve of color staining of analytical zone of a membrane on PG concentration for different sequences of reagent loadingusing LFIA employed enzyme as a label.
120
100
80
60
40
20
0
0 ng/mL
1 ng/mL
7 ng/mL
33 ng/mL
B/B01
2
3
Fig. 6. Curve of color staining of analytical zone of membrane on PG concentration for different schemes employed for lamina�tion of a test strip using LFIA with enzyme as a label. Area of lamination is patterned.
1 2 3
MOSCOW UNIVERSITY CHEMISTRY BULLETIN Vol. 67 No. 5 2012
LATERAL FLOW IMMUNOASSAY FOR PROGESTERONE DETECTION 247
strate reaction should be carried out to obtain a partic�ular result, the test strip was only partially laminatedand an area was left uncovered for loading the sub�strate. LFIA was performed using test strips laminatedas shown in Fig. 6 (options 2 and 3) and the controltest strip with no lamination (Fig. 6, option 1) accord�ing the above�described optimal scheme, and thedegree of inhibition of the signal by free PG was com�pared at the concentrations of choice. It should bementioned that lamination according to options 1 and2 resulted in rather high background staining. Underthese conditions, the relative value of the signal inten�sity corresponding to a PG concentration of 7 ng/μLwas significantly higher than that of the test strip lam�inated according to option 3. This difference is relatedto the existence of a firmer contact between the mem�brane for sample loading and the analytical mem�brane, which contributes to the formation of a moreuniform flow of the solution on the border betweentwo membranes. The lamination of this zone mostlikely reduces the absorption of reagents loaded ontoan analytical membrane by a membrane for sampleloading. Thus, the lamination of a test strip usingoption 3 was considered to be the optimal solution forperforming LFIA.
Selection of signal�detection system. LFIA withenzyme as a label is further complicated by the need toperform an additional final step, i.e., staining the teststrip following the enzyme�substrate reaction. In thiswork, we used a substrate solution based on TMB withthe addition of dextran sulfate, which reacts with theoxidized form of a product of the enzyme�substratereaction and forms an insoluble compound on the sur�face of the analytical zone of the membrane. To opti�mize the staining step of the assay, two differentoptions were tested, first, staining of the analyticalmembrane separated from other parts of a test stripwas performed by immersing the membrane into atube containing substrate solution and, second, an ali�
quot of the substrate solution was applied directly ontoa test strip (analytical membrane). To minimize theamount of operations carried out with the test strip,staining was performed by loading an aliquot of thesubstrate solution in the analytical zone of a mem�brane. The optimized volume of the substrate solutionwas 50 μL. In this case, no blurring of the test or con�trol lines was observed and the visual detection waspossible shortly after 5 min of staining.
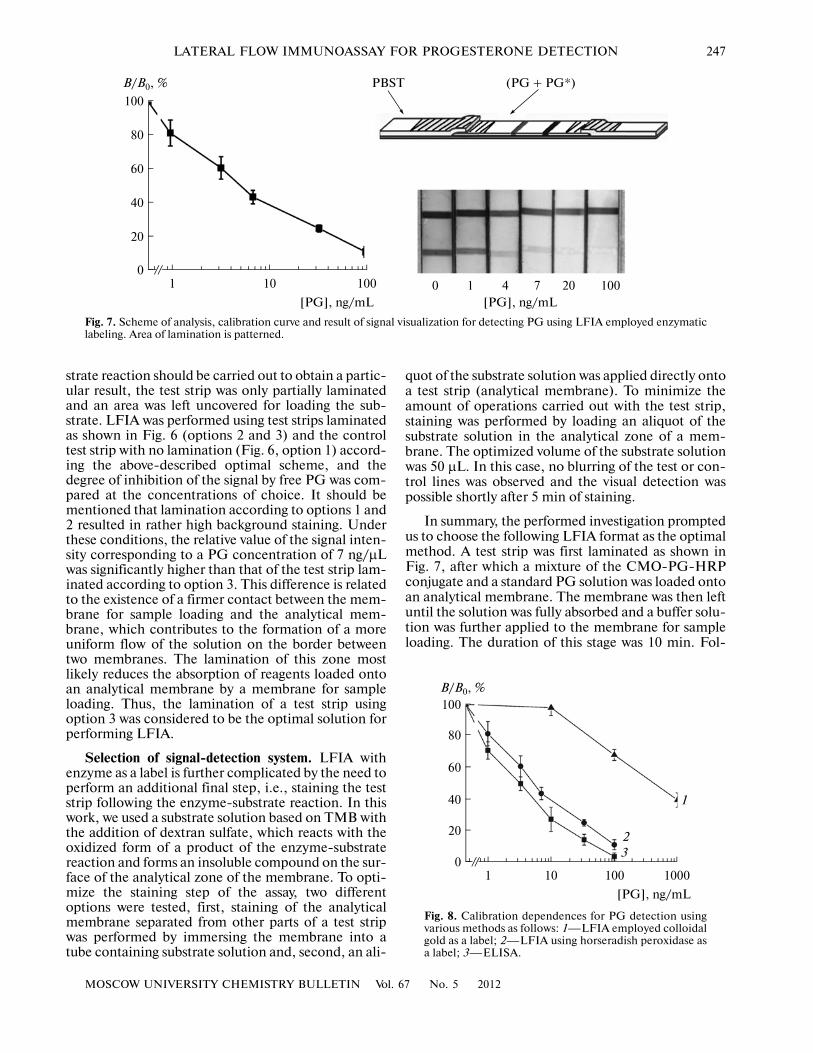
In summary, the performed investigation promptedus to choose the following LFIA format as the optimalmethod. A test strip was first laminated as shown inFig. 7, after which a mixture of the CMO�PG�HRPconjugate and a standard PG solution was loaded ontoan analytical membrane. The membrane was then leftuntil the solution was fully absorbed and a buffer solu�tion was further applied to the membrane for sampleloading. The duration of this stage was 10 min. Fol�
60
0
100
80
20
40
0 1 4
B/B0, %
[PG], ng/mL7 20101 100100
PBST (PG + PG*)
[PG], ng/mL
Fig. 7. Scheme of analysis, calibration curve and result of signal visualization for detecting PG using LFIA employed enzymaticlabeling. Area of lamination is patterned.
60
0
100
80
20
40 1
23
B/B0, %
[PG], ng/mL
101 100 1000
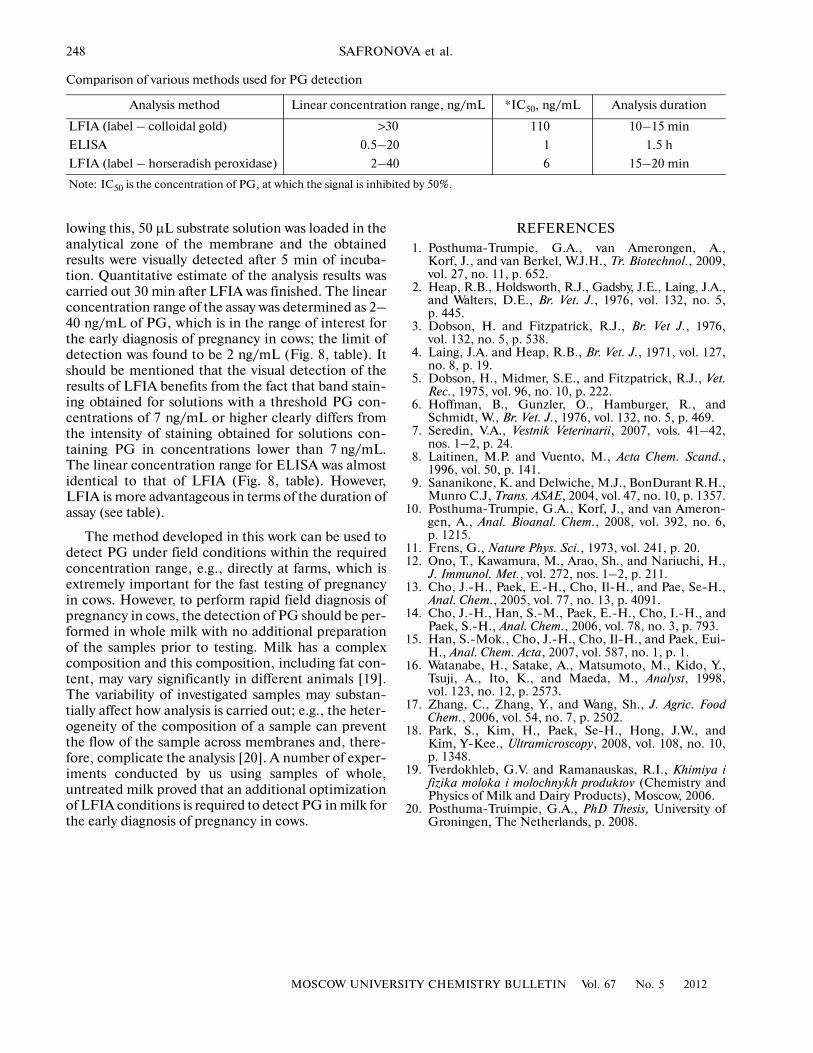
Fig. 8. Calibration dependences for PG detection usingvarious methods as follows: 1—LFIA employed colloidalgold as a label; 2—LFIA using horseradish peroxidase asa label; 3—ELISA.
248
MOSCOW UNIVERSITY CHEMISTRY BULLETIN Vol. 67 No. 5 2012
SAFRONOVA et al.
lowing this, 50 μL substrate solution was loaded in theanalytical zone of the membrane and the obtainedresults were visually detected after 5 min of incuba�tion. Quantitative estimate of the analysis results wascarried out 30 min after LFIA was finished. The linearconcentration range of the assay was determined as 2–40 ng/mL of PG, which is in the range of interest forthe early diagnosis of pregnancy in cows; the limit ofdetection was found to be 2 ng/mL (Fig. 8, table). Itshould be mentioned that the visual detection of theresults of LFIA benefits from the fact that band stain�ing obtained for solutions with a threshold PG con�centrations of 7 ng/mL or higher clearly differs fromthe intensity of staining obtained for solutions con�taining PG in concentrations lower than 7 ng/mL.The linear concentration range for ELISA was almostidentical to that of LFIA (Fig. 8, table). However,LFIA is more advantageous in terms of the duration ofassay (see table).
The method developed in this work can be used todetect PG under field conditions within the requiredconcentration range, e.g., directly at farms, which isextremely important for the fast testing of pregnancyin cows. However, to perform rapid field diagnosis ofpregnancy in cows, the detection of PG should be per�formed in whole milk with no additional preparationof the samples prior to testing. Milk has a complexcomposition and this composition, including fat con�tent, may vary significantly in different animals [19].The variability of investigated samples may substan�tially affect how analysis is carried out; e.g., the heter�ogeneity of the composition of a sample can preventthe flow of the sample across membranes and, there�fore, complicate the analysis [20]. A number of exper�iments conducted by us using samples of whole,untreated milk proved that an additional optimizationof LFIA conditions is required to detect PG in milk forthe early diagnosis of pregnancy in cows.
REFERENCES1. Posthuma�Trumpie, G.A., van Amerongen, A.,
Korf, J., and van Berkel, W.J.H., Tr. Biotechnol., 2009,vol. 27, no. 11, p. 652.
2. Heap, R.B., Holdsworth, R.J., Gadsby, J.E., Laing, J.A.,and Walters, D.E., Br. Vet. J., 1976, vol. 132, no. 5,p. 445.
3. Dobson, H. and Fitzpatrick, R.J., Br. Vet J., 1976,vol. 132, no. 5, p. 538.
4. Laing, J.A. and Heap, R.B., Br. Vet. J., 1971, vol. 127,no. 8, p. 19.
5. Dobson, H., Midmer, S.E., and Fitzpatrick, R.J., Vet.Rec., 1975, vol. 96, no. 10, p. 222.
6. Hoffman, B., Gunzler, O., Hamburger, R., andSchmidt, W., Br. Vet. J., 1976, vol. 132, no. 5, p. 469.
7. Seredin, V.A., Vestnik Veterinarii, 2007, vols. 41–42,nos. 1–2, p. 24.
8. Laitinen, M.P. and Vuento, M., Acta Chem. Scand.,1996, vol. 50, p. 141.
9. Sananikone, K. and Delwiche, M.J., BonDurant R.H.,Munro C.J, Trans. ASAE, 2004, vol. 47, no. 10, p. 1357.
10. Posthuma�Trumpie, G.A., Korf, J., and van Ameron�gen, A., Anal. Bioanal. Chem., 2008, vol. 392, no. 6,p. 1215.
11. Frens, G., Nature Phys. Sci., 1973, vol. 241, p. 20.12. Ono, T., Kawamura, M., Arao, Sh., and Nariuchi, H.,
J. Immunol. Met., vol. 272, nos. 1–2, p. 211.13. Cho, J.�H., Paek, E.�H., Cho, Il�H., and Pae, Se�H.,
Anal. Chem., 2005, vol. 77, no. 13, p. 4091.14. Cho, J.�H., Han, S.�M., Paek, E.�H., Cho, I.�H., and
Paek, S.�H., Anal. Chem., 2006, vol. 78, no. 3, p. 793.15. Han, S.�Mok., Cho, J.�H., Cho, Il�H., and Paek, Eui�
H., Anal. Chem. Acta, 2007, vol. 587, no. 1, p. 1.16. Watanabe, H., Satake, A., Matsumoto, M., Kido, Y.,
Tsuji, A., Ito, K., and Maeda, M., Analyst, 1998,vol. 123, no. 12, p. 2573.
17. Zhang, C., Zhang, Y., and Wang, Sh., J. Agric. FoodChem., 2006, vol. 54, no. 7, p. 2502.
18. Park, S., Kim, H., Paek, Se�H., Hong, J.W., andKim, Y�Kee., Ultramicroscopy, 2008, vol. 108, no. 10,p. 1348.
19. Tverdokhleb, G.V. and Ramanauskas, R.I., Khimiya ifizika moloka i molochnykh produktov (Chemistry andPhysics of Milk and Dairy Products), Moscow, 2006.
20. Posthuma�Truimpie, G.A., PhD Thesis, University ofGroningen, The Netherlands, p. 2008.
Comparison of various methods used for PG detection
Analysis method Linear concentration range, ng/mL *IC50, ng/mL Analysis duration
LFIA (label – colloidal gold) >30 110 10–15 min
ELISA 0.5–20 1 1.5 h
LFIA (label – horseradish peroxidase) 2–40 6 15–20 min
Note: IC50 is the concentration of PG, at which the signal is inhibited by 50%.