laser spectroscopic techniques for combustion diagnostics
TRANSCRIPT

This article was downloaded by: [North West University]On: 18 December 2014, At: 06:02Publisher: Taylor & FrancisInforma Ltd Registered in England and Wales Registered Number: 1072954 Registered office: Mortimer House,37-41 Mortimer Street, London W1T 3JH, UK
Combustion Science and TechnologyPublication details, including instructions for authors and subscription information:http://www.tandfonline.com/loi/gcst20
Laser spectroscopic techniques for combustiondiagnosticsMARCUS ALDÉN aa Division of Combustion Physics , Lund Institute of Technology , P.O Box 118, Lund , S-22100 , SwedenPublished online: 21 Feb 2014.
To cite this article: MARCUS ALDÉN (1999) Laser spectroscopic techniques for combustion diagnostics, Combustion Scienceand Technology, 149:1-6, 1-18, DOI: 10.1080/00102209908952096
To link to this article: http://dx.doi.org/10.1080/00102209908952096
PLEASE SCROLL DOWN FOR ARTICLE
Taylor & Francis makes every effort to ensure the accuracy of all the information (the “Content”) containedin the publications on our platform. However, Taylor & Francis, our agents, and our licensors make norepresentations or warranties whatsoever as to the accuracy, completeness, or suitability for any purpose of theContent. Any opinions and views expressed in this publication are the opinions and views of the authors, andare not the views of or endorsed by Taylor & Francis. The accuracy of the Content should not be relied upon andshould be independently verified with primary sources of information. Taylor and Francis shall not be liable forany losses, actions, claims, proceedings, demands, costs, expenses, damages, and other liabilities whatsoeveror howsoever caused arising directly or indirectly in connection with, in relation to or arising out of the use ofthe Content.
This article may be used for research, teaching, and private study purposes. Any substantial or systematicreproduction, redistribution, reselling, loan, sub-licensing, systematic supply, or distribution in anyform to anyone is expressly forbidden. Terms & Conditions of access and use can be found at http://www.tandfonline.com/page/terms-and-conditions
Combust. Sci. and Tech., 1999, Vol. 149,pp. 1-18Reprintsavailabledirectlyfromlhe publisherPhotocopying permitted by license only
C 1999 OPA(OverseasPublishers Association)N.V.Published by license underthe
Gordonand BreachScience Publishers imprint.Printedin Malaysia
Laser spectroscopic techniquesfor combustion diagnosticsMARCUS ALDEN>
Division of Combustion Physics, Lund Institute of Technology P.D Box 118, 5·22100 Lund Sweden
(Received Apri/20, 1999)
During the last decade various laser spectroscopic techniques have shown great potential for combustion diagnostics, The largest advantages with these techniques are that they permit non-intrusivemeasurements with high spatial, temporal and spectral resolution. The most important parametersmeasurable are; species concentration, temperatureand velocity. In the present review some developmems and applications will be briefly described. This includes Laser-Induced Fluorescence, LIF,Coherent anti-Stokes Raman Scattering, CARS, and Polarization spectroscopy, PS.
INTRODUCTION
During the last decades the awareness of our environment as well as the concernfor efficient energy production have become of utmost importance for our society. Since combustion processes constitute a major part of our energy productionas well as contribute with a considerable amount of air pollutants, e.g. NOx' particulates etc, this area has become of major importance for detailed studies. Thefact that several countries are also considering to reduce or even close downnuclear power plants, puts combustion processes as even more important to
study. Another important aspect of combustion is that it plays a key role in manyindustrial devices, e.g engines, gasturbines, and boilers, which means that effi
cient and environmentally friendly combustion is an important way for industriesto compete on an international market. A problem but also a challenge with combustion phenomena, is the need for interdisciplinary collaborations to create athorough understanding of these processes, thus experts e.g. in physics, chemis-
Dow
nloa
ded
by [
Nor
th W
est U
nive
rsity
] at
06:
02 1
8 D
ecem
ber
2014
2 MARCUS ALDEN
face real practical combustion problems. During the last years two major toolshave appeared which have given the community new possibilities for detailedstudies of combustion processes: new and faster computers which are necessaryto model the processes as well as new diagnostic tools for characterization ofcombustion phenomena and validation of various combustion models. In the latter field it has been shown that various measuring approaches based on lasertechniques have unique properties for diagnostics of combustion processes, seee.g. [Eckbreth (1996») and references in there. The most important features ofthese techniques are non-intrusiveness in combination with high temporal andspatial resolution. These techniques can be used for measurements of speciesconcentrations, temperatures, velocities and particle parameters (number, sizes,volume fractions).
The present paper will describe some applications of laser spectroscopic techniques for studies of combustion processes. Since space will neither allow a fullcoverage of the field nor any basic theory, the paper will be concentrated onexperimental work in the authors laboratory. For further details we refer toaccompanying references.
The techniques which will be covered are Laser-Induced Fluorescence (LIF),Coherent anti-Stokes Raman Scattering (CARS) and a relatively new techniquebased on polarization spectroscopy. This means that for the many techniqueswhich are not discussed, e.g. Rayleigh and Raman scattering, DFWM, REMPIetc., we refer to [Eckbreth (1996)].
LASER-INDUCED FLUORESCENCE, L1F
Introduction
The laser technique which probably has received the largest attention for combustion diagnostics is Laser-Induced. Fluorescence, LIE In this technique thelaser beam is tuned to an atomic or molecular absorption transition and by detecting the atomic/molecular fluorescence emission, it is in principle possible toinfer both species concentration and temperature. For a thorough description ofthe LIF technique we refer to [Kohse-Hoinghaus (1994»).
A major problem with converting LIF signals to absolute species concentrationis deexcitation due to collisions, so called quenching. Since the degree ofquenching is dependent on temperature, pressure and colliding partners, several
Dow
nloa
ded
by [
Nor
th W
est U
nive
rsity
] at
06:
02 1
8 D
ecem
ber
2014
LASER SPECTROSCOPIC TECHNIQUES 3
rendeau, 1986], predissociation, e.g. [Andresen, et al., 1988] and time-resolveddetection, e.g. [Bergano, et aI., 1983]. May be the most important developmentof LIP is the introduction of multiple point measurements, first along a line[Alden, et aI., 1982] shortly followed by two-dimensional visualization; PlanarLaser-Induced Fluorescence, PLIF [Dyer and Crosley, 1987; Kychakoff, et al.,1982]. The PLIF technique has become a very important tool in characterizationof combustion processes, as will be exemplified below. The section of LIF willbe divided in two parts describing developments as well as applications.
L1F developments
From our laboratory two developments of the LIF technique will be described.
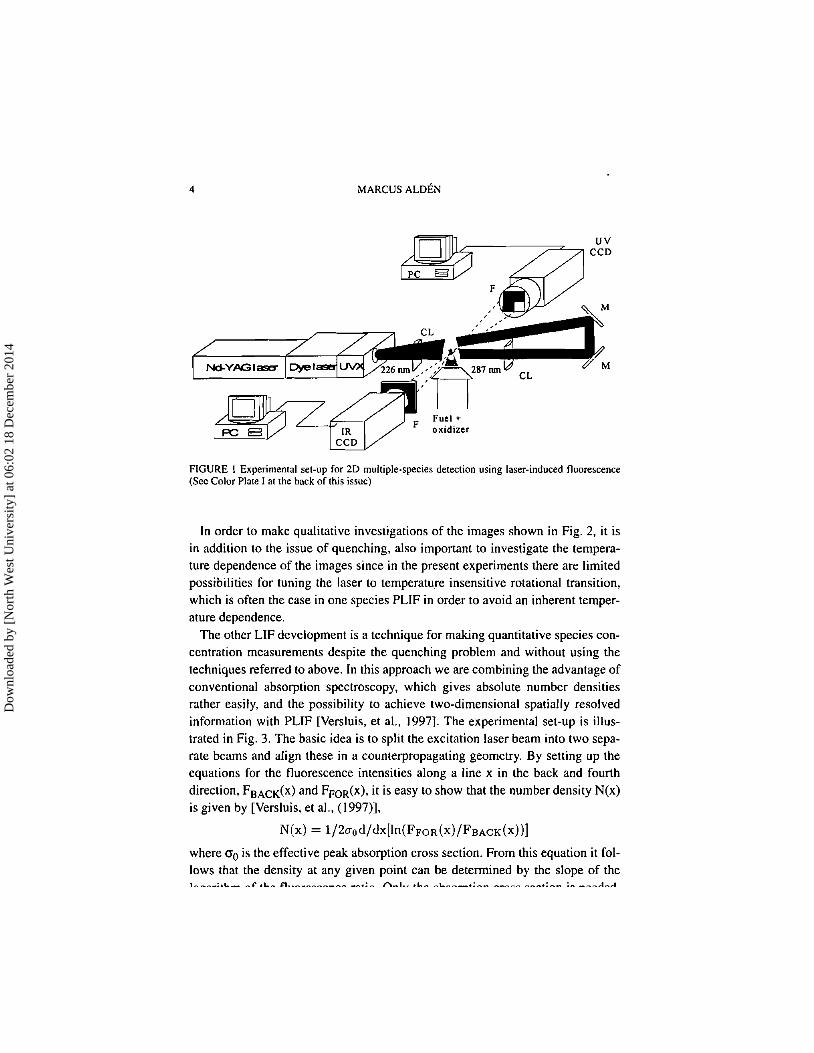
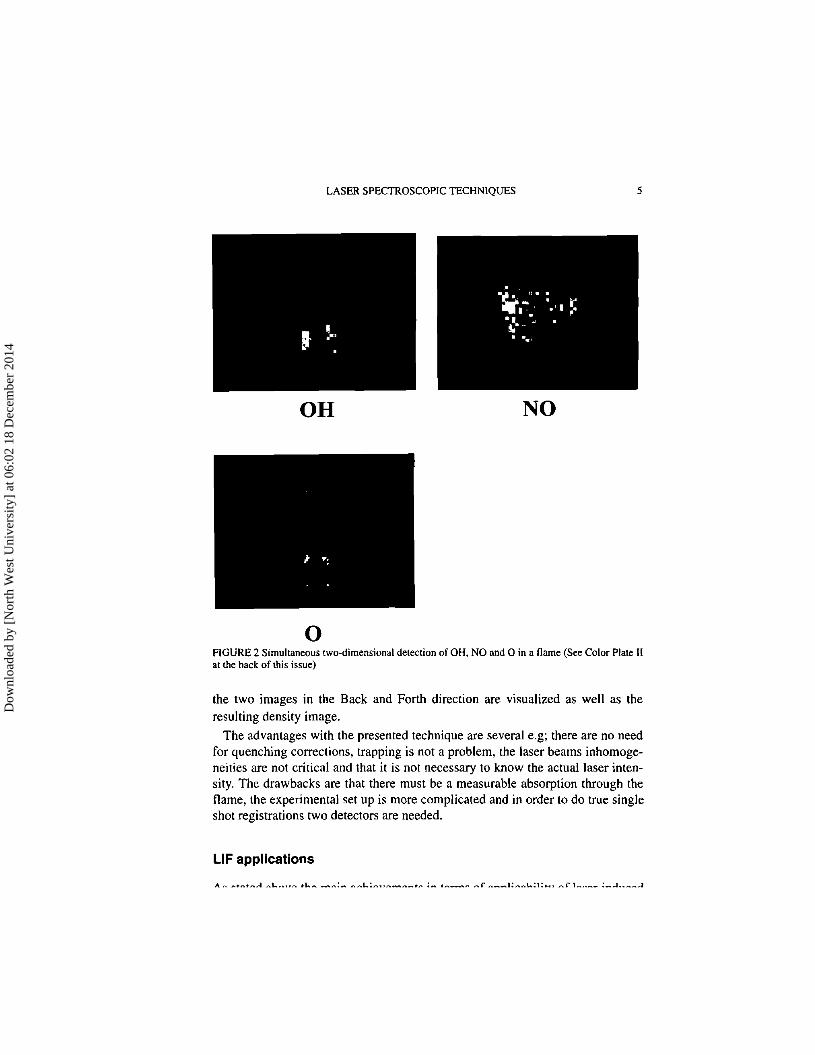
In the first experiment it has been investigated if and to what degree LIF can beused for multiple species detection. LIF has normally been used for one speciesdetection but by using aNd: YAG based laser system it has been shown that several species can be simultaneously detected utilizing spectral coincidences of oneand two-photon resonances using harmonics from the YAG/dye laser system[Westblom and Alden, 1989, 1990]. Recently, it has also been shown that instantaneous multispecies two dimensional visualization can be made [Georgiev andAlden, 1997]. The experimental set-up is shown in Fig I. The YAG/dye laser isprimarily producing 226 nm by frequency doubling the dye laser beam followedby frequency mixing of the doubled dye and the residual IR beam from the YAGlaser. The 226 nm beam is exciting NO by a one-photon resonance in the y-bandat the same time as 0 atoms are excited by a two-photon resonance. The fluorescence emission from NO is in the UV region between 226 and 300 nm, whereasthe 0 atom emission mainly appears at 845 nm. The frequency doubled dyebeam around 287 nm is in these experiments not dumped but used for excitationof OH in the 0-1 transition, followed by fluorescence detection around 3I0 nm.In order to capture more than one image at the same time a special designed Cassegrainian telescope was used, which permitted several images to be capturedwith the same CCD detector. In this specific experiments, however, also a secondCCD camera with enhanced IR sensitivity was used for detection of the 0 atomfluorescence. By using appropriate spectral filters the fluorescence from eachindividual species was isolated. This means that by using one laser shot it waspossible to capture images as illustrated in Fig. 2, which shows the spatial distribution of NO, OH and 0 in an atmospheric pressure HzlOzlNzO flame. Thesame approach can also be used for simultaneous PLIF images of NO, OH and
Dow
nloa
ded
by [
Nor
th W
est U
nive
rsity
] at
06:
02 1
8 D
ecem
ber
2014
4 MARCUS ALDEN
uvc::------;;==--~ CCD
?'S~
FIGURE 1 Experimental set-up for 2D multiple-species detection using laser-induced fluorescence(See Color Plate I at the back of this issue)
In order to make qualitative investigations of the images shown in Fig. 2, it isin addition to the issue of quenching, also important to investigate the temperature dependence of the images since in the present experiments there are limitedpossibilities for tuning the laser to temperature insensitive rotational transition,which is often the case in one species PLIF in order to avoid an inherent temperature dependence.
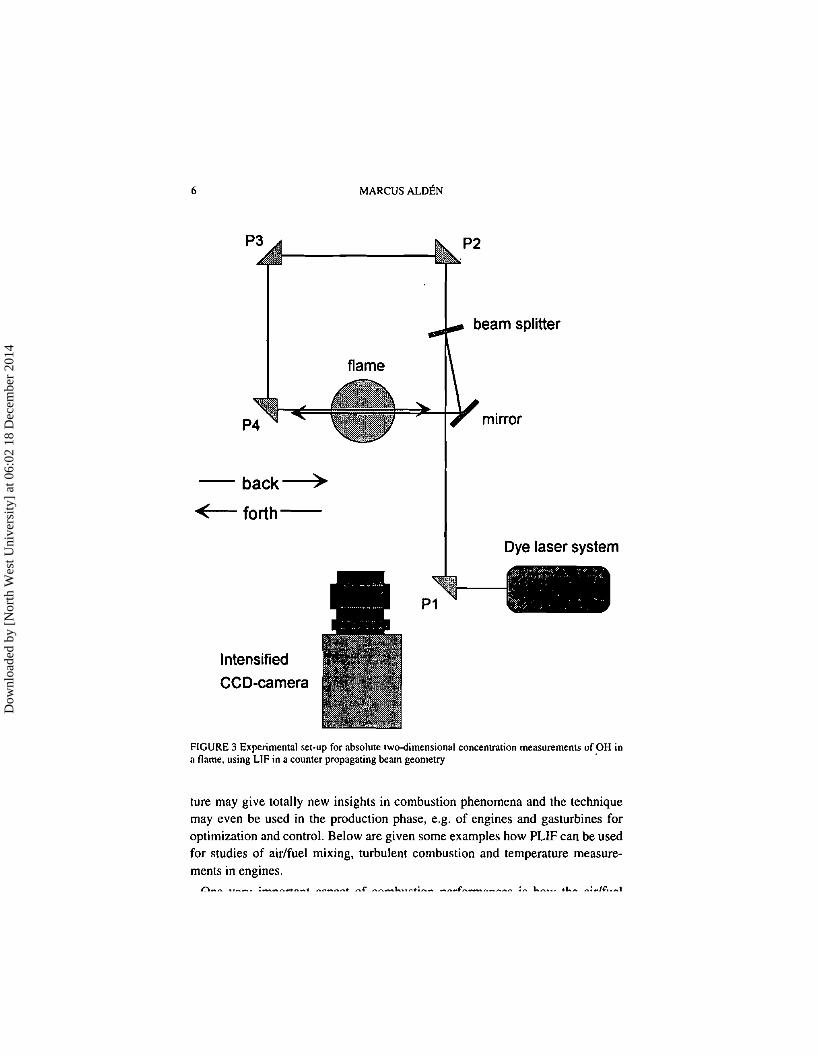
The other LIF development is a technique for making quantitative species concentration measurements despite the quenching problem and without using thetechniques referred to above. In this approach we are combining the advantage ofconventional absorption spectroscopy, which gives absolute number densitiesrather easily, and the possibility to achieve two-dimensional spatially resolvedinformation with PLIF [Versluis, et aI., 1997]. The experimental set-up is illustrated in Fig. 3. The basic idea is to split the excitation laser beam into two separate beams and align these in a counterpropagating geometry. By setting up theequations for the fluorescence intensities along a line x in the back and fourthdirection, FBACK(x) and FFOR(x), it is easy to show that the number density N(x)is given by [Versluis, et aI., (1997)],
N(x) = 1/20'od/dx[ln(FpoR(X)/FBACK(X))]
where ao is the effective peak absorption cross section. From this equation it follows that the density at any given point can be determined by the slope of the
Dow
nloa
ded
by [
Nor
th W
est U
nive
rsity
] at
06:
02 1
8 D
ecem
ber
2014
LASER SPECTROSCOPIC TECHNIQUES 5
OH NO
oFIGURE 2 Simultaneous two-dimensional detection of OH, NO and 0 in a flame (See Color Plate IIat the back of this issue)
the two images in the Back and Forth direction are visualized as well as theresulting density image.
The advantages with the presented technique are several e.g; there are no needfor quenching corrections, trapping is not a problem, the laser beams inhomogeneities are not critical and that it is not necessary to know the actual laser intensity. The drawbacks are that there must be a measurable absorption through theflame, the experimental set up is more complicated and in order to do true singleshot registrations two detectors are needed.
L1F applications
Dow
nloa
ded
by [
Nor
th W
est U
nive
rsity
] at
06:
02 1
8 D
ecem
ber
2014
6
P3
MARCUS ALDEN
beam splitter
mirror
back )
< forth--
Dye laser system
IntensifiedCCD-camera
FIGURE 3 Experimental set-up for absolutetwo-dimensional concentration measurements of OH ina flame,using LIF in a counterpropagating beamgeometry .
ture may give totally new insights in combustion phenomena and the techniquemay even be used in the production phase, e.g. of engines and gasturbines foroptimization and control. Below are given some examples how PUF can be usedfor studies of air/fuel mixing, turbulent combustion and temperature measurements in engines.
Dow
nloa
ded
by [
Nor
th W
est U
nive
rsity
] at
06:
02 1
8 D
ecem
ber
2014
LASER SPECTROSCOPIC TECHNIQUES 7
Back Forth
0.00.0 0.2 0.4 0.6 0.8 1.0 1.2
Distance I cm
I0 2.0 X 10'5
0.8
E 0.6(J-Q)(J
0.4c:III-.!!!C
0.2
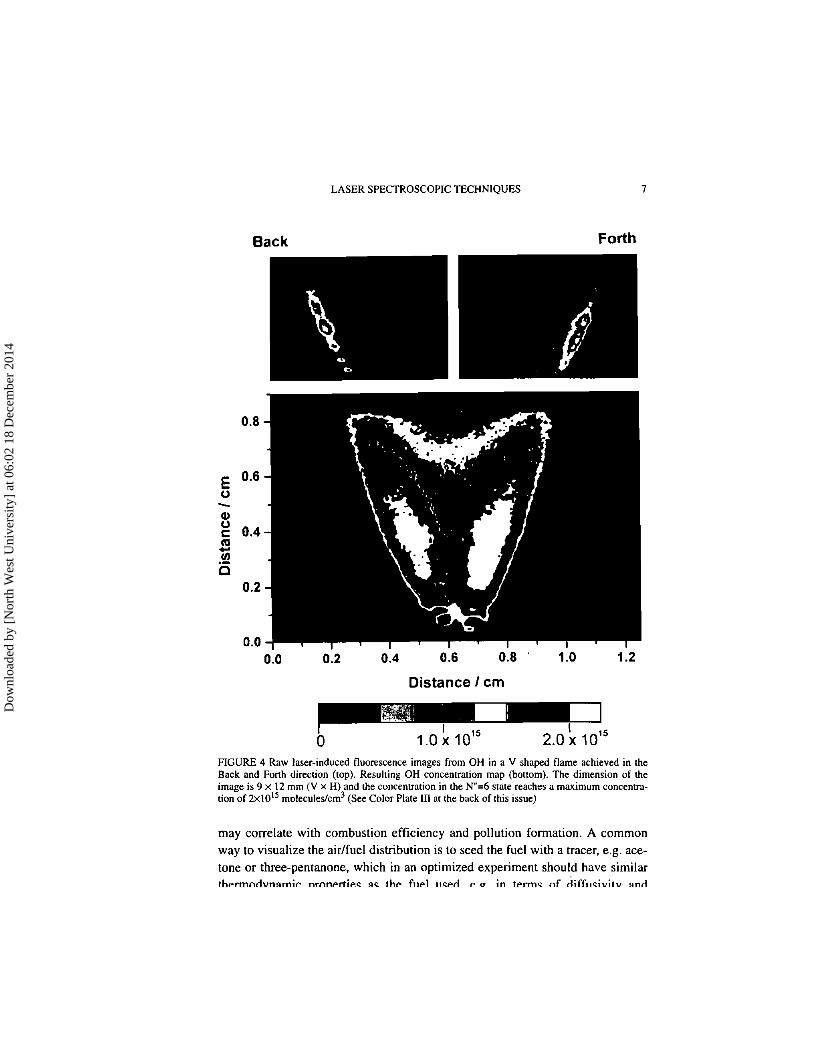
FIGURE 4 Raw laser-induced fluorescence images from OH in a V shaped flame achieved in theBack and Forth direction (top). Resulting OH concentration map (bottom), The dimension of theimage is 9 x 12 mm (V x H) andthe concentration in the Nil=6 statereaches a maximum concentration of 2xlO t5 molecules/cm3 (See Color Plate III at the back of this issue)
may correlate with combustion efficiency and pollution formation. A commonway to visualize the air/fuel distribution is to seed the fuel with a tracer, e.g. acetone or three-pentanone, which in an optimized experiment should have similarthermodvnnrnir- nf'nnp_rtip.~ ~IO:. the fue.l I1~P_rI P.O" in ter-rnc of ciiffll.~lvitv ~nrl
Dow
nloa
ded
by [
Nor
th W
est U
nive
rsity
] at
06:
02 1
8 D
ecem
ber
2014
8 MARCUS ALDEN
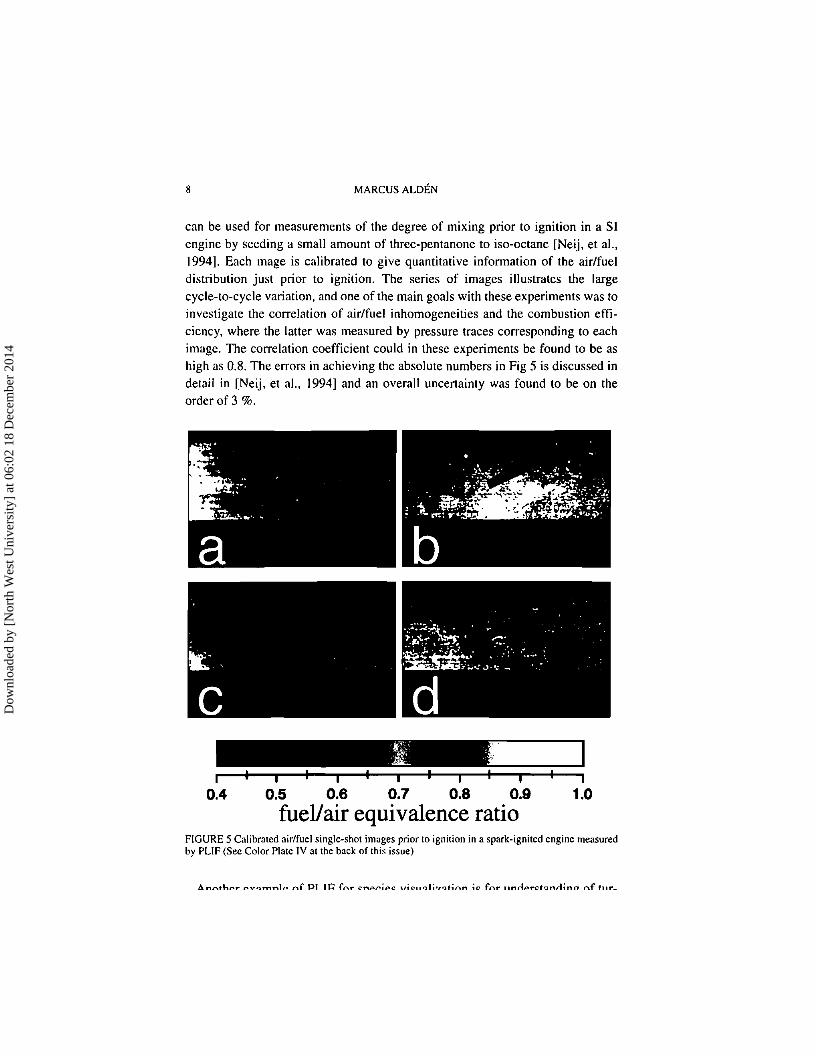
can be used for measurements of the degree of mixing prior to ignition in a SIengine by seeding a small amount of three-pentanone to iso-octane [Neij, et al.,19941. Each mage is calibrated to give quantitative information of the air/fueldistribution just prior to ignition. The series of images illustrates the largecycle-to-cycle variation, and one of the main goals with these experiments was toinvestigate the correlation of air/fuel inhomogeneities and the combustion efficiency, where the latter was measured by pressure traces corresponding to eachimage. The correlation coefficient could in these experiments be found to be ashigh as 0.8. The errors in achieving the absolute numbers in Fig 5 is discussed indetail in [Neij, et al., 19941 and an overall uncertainty was found to be on theorder of 3 %.
0.4i
0.5 0.6 0.7 0.8 0.9fuel/air equivalence ratio
1.0
FIGURE 5 Calibrated air/fuel single-shot images prior to ignition in a spark-ignited engine measuredby PUF (See Color Plate IV at the back of this issue)
Dow
nloa
ded
by [
Nor
th W
est U
nive
rsity
] at
06:
02 1
8 D
ecem
ber
2014
LASER SPECTROSCOPIC TECHNIQUES 9
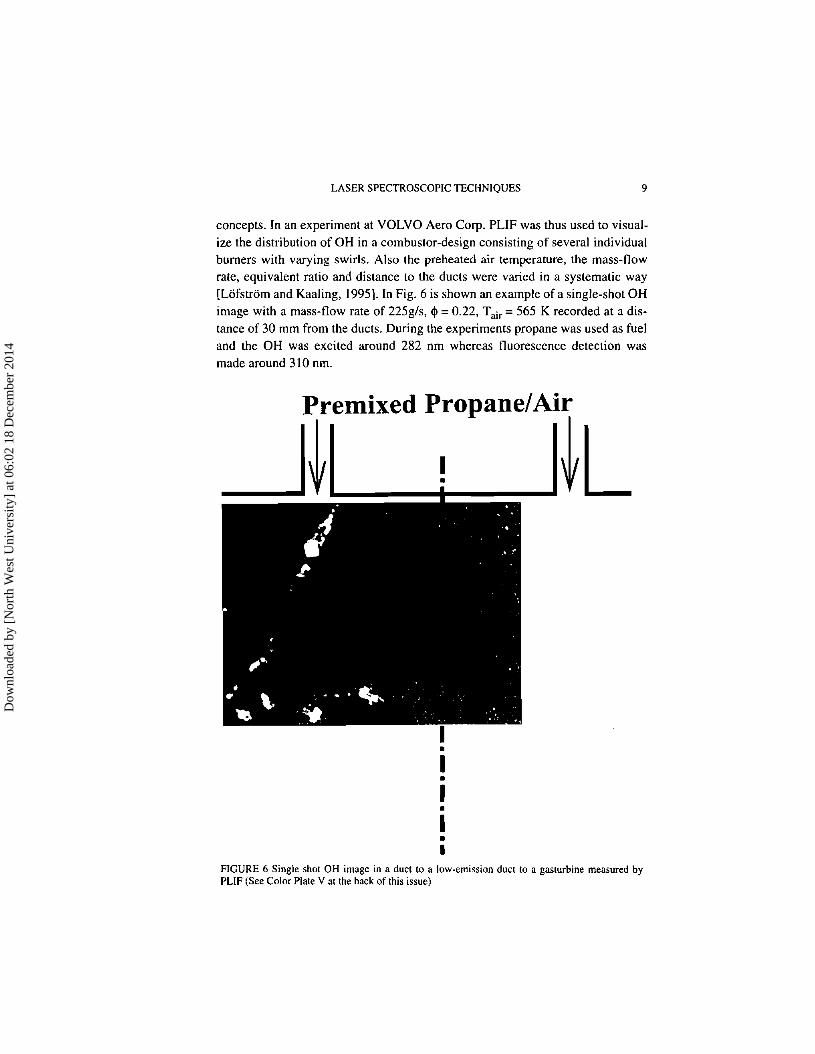
concepts. In an experiment at VOLVO Aero Corp. PLIF was thus used to visualize the distribution of OH in a combustor-design consisting of several individualburners with varying swirls. Also the preheated air temperature, the mass-flowrate, equivalent ratio and distance to the ducts were varied in a systematic way[LOfstrom and KaaJing, 1995]. In Fig. 6 is shown an example of a single-shot OHimage with a mass-flow rate of 225g/s, ep =0.22, Tair =565 K recorded at a distance of 30 mm from the ducts. During the experiments propane was used as fueland the OH was excited around 282 nm whereas fluorescence detection wasmade around 310 nm.
•I
FIGURE 6 Single shot OH image in a duct to a low-emission duct to a gasturbine measured byPLiF (See Color Plate V at the hack of this issue)
Dow
nloa
ded
by [
Nor
th W
est U
nive
rsity
] at
06:
02 1
8 D
ecem
ber
2014
10 MARCUS ALDEN
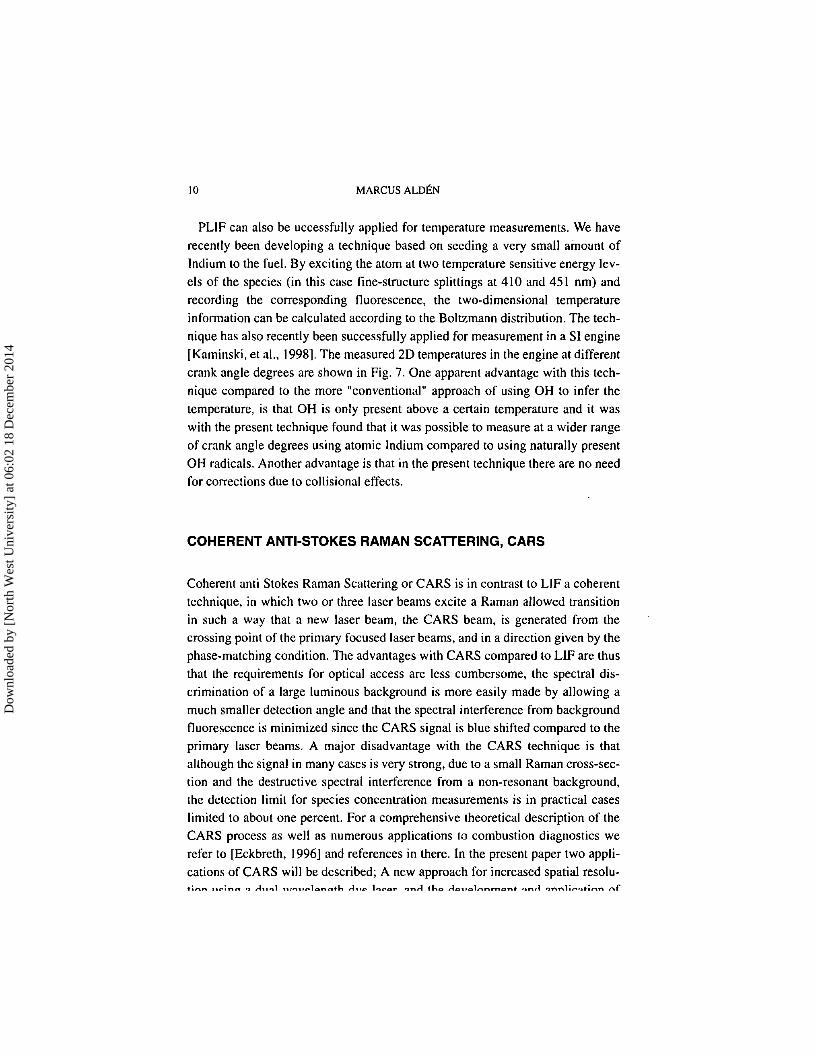
PUF can also be uccessfully applied for temperature measurements. We haverecently been developing a technique based on seeding a very small amount ofIndium to the fuel. By exciting the atom at two temperature sensitive energy levels of the species (in this case fine-structure splittings at 410 and 451 nm) andrecording the corresponding fluorescence, the two-dimensional temperatureinformation can be calculated according to the Boltzmann distribution. The technique has also recently been successfully applied for measurement in a SI engine[Kaminski, et aI., 1998]. The measured 2D temperatures in the engine at different
crank angle degrees are shown in Fig. 7. One apparent advantage with this technique compared to the more "conventional" approach of using OH to infer thetemperature, is that OH is only present above a certain temperature and it waswith the present technique found that it was possible to measure at a wider rangeof crank angle degrees using atomic Indium compared to using naturally presentOH radicals. Another advantage is that in the present technique there are no needfor corrections due to collisional effects.
COHERENT ANTI-STOKES RAMAN SCATIERING, CARS
Coherent anti Stokes Raman Scattering or CARS is in contrast to L1Fa coherenttechnique, in which two or three laser beams excite a Raman allowed transitionin such a way that a new laser beam, the CARS beam, is generated from thecrossing point of the primary focused laser beams, and in a direction given by thephase-matching condition. The advantages with CARS compared to LIF are thusthat the requirements for optical access are less cumbersome, the spectral discrimination of a large luminous background is more easily made by allowing amuch smaller detection angle and that the spectral interference from backgroundfluorescence is minimized since the CARS signal is blue shifted compared to theprimary laser beams. A major disadvantage with the CARS technique is thatalthough the signal in many cases is very strong, due to a small Raman cross-section and the destructive spectral interference from a non-resonant background,the detection limit for species concentration measurements is in practical caseslimited to about one percent. For a comprehensive theoretical description of theCARS process as well as numerous applications to combustion diagnostics werefer to [Eckbreth, 1996] and references in there. In the present paper two applications of CARS will be described; A new approach for increased spatial resolu-
Dow
nloa
ded
by [
Nor
th W
est U
nive
rsity
] at
06:
02 1
8 D
ecem
ber
2014
LASER SPECTROSCOPIC TECHNIQUES II
1800 2300 2800 1300 1800 2300 2800
1300 1800 2300 2800 1300 1800 2300 2800 1300 1800 2300 2800
FIGURE 7 Average two-dimensional temperature distributions at various crank angle positionsmeasured by 2-line fluorescence. Temperatures aregiven in Kelvin
2-1.. CARS
Despite the real-world applicability of CARS, this technique has suffered fromlimited signal strength when either the spatial resolution is to be increased byintroducing a larger crossing angle between the laser beams or when measurements are to be made in a very dense environment. Due to a potential risk ofintroducing saturation effects [Eckbreth, 1996] when increasing the laser power,this alternative is however not an option to increase the signal strength.
We have since several years been working with an alternative approach called2-1.. CARS for increasing the signal strength. In this approach a special designeddye laser is used which emits two wavelengths simultaneously [Alden, et al.,10SlL11 In tbic \1J~nl thp !l\1'.l11!lhlp l~cpr pnprn" i c ('nrnnr""ccpri intn hun n'Arrnu/ h":lnrl
Dow
nloa
ded
by [
Nor
th W
est U
nive
rsity
] at
06:
02 1
8 D
ecem
ber
2014
12 MARCUSALDEN
Fa
..•.....•..........a R
MP
LB
....•.....•....
L
L laser / detectora opticsR receiver
LB laserbeamsFa fiberopticsMP measurem.point
300 5001111 111
700 !IXl 1100 1300 1500 1700 1!1Xl 2100
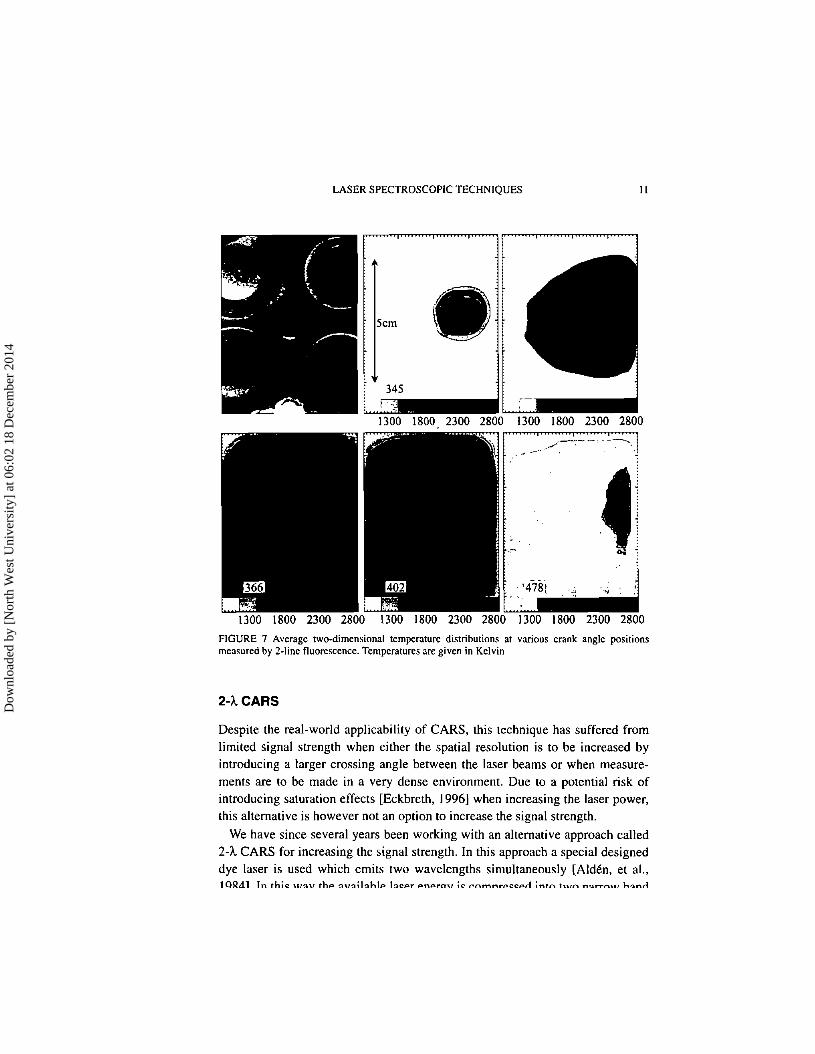
FIGURE 8 Experimental set-up for temperature measurements in a full scale industrial boiler using2-1.. CARS (above). Temperature distribution function of the temperature in the measunnent point(MP) (below)
rotational lines in the vibrational Q-branch of the nitrogen molecule Raman spectrum. During the development of the technique both temperature precision andaccuracy were investigated in heated cells and laboratory flames using different
Dow
nloa
ded
by [
Nor
th W
est U
nive
rsity
] at
06:
02 1
8 D
ecem
ber
2014
LASER SPECTROSCOPIC TECHNIQUES 13
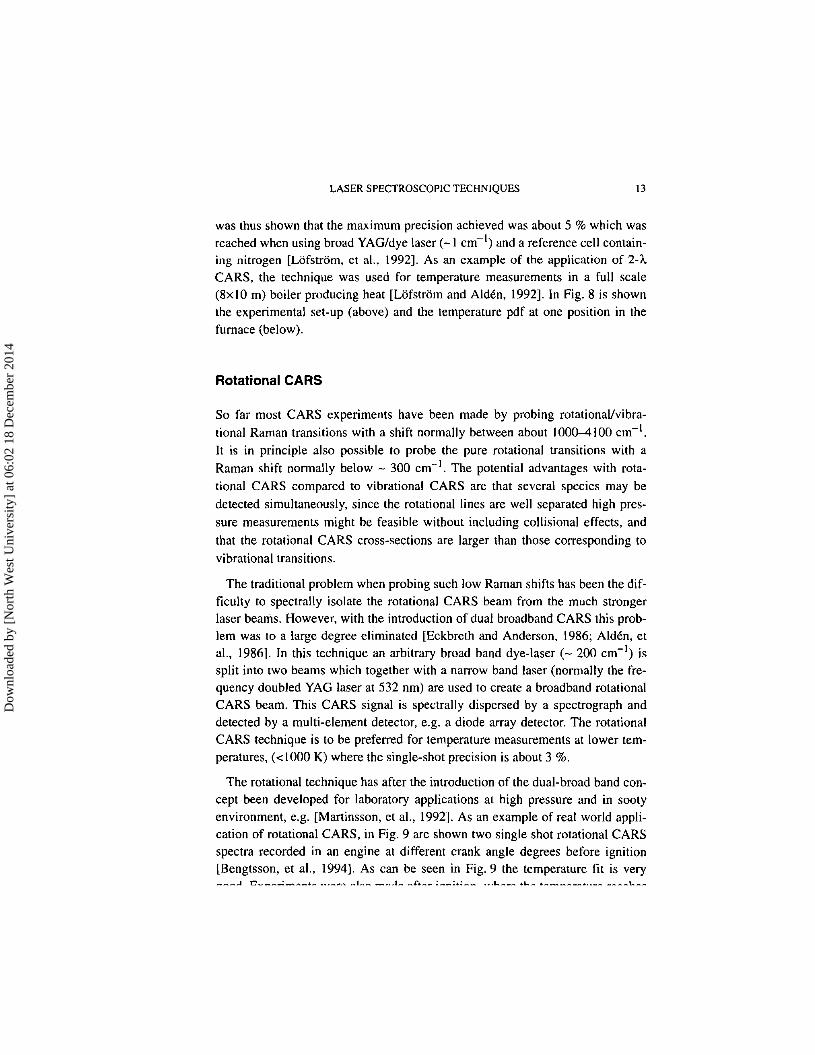
was thus shown that the maximum precision achieved was about 5 % which wasreached when using broad YAG/dye laser (-I cm") and a reference cell containing nitrogen [LOfstrom, et al., 1992]. As an example of the application of 2-1.CARS, the technique was used for temperature measurements in a full scale(Sx 10 m) boiler producing heat [Lofstrom and Alden, 1992]. In Fig. 8 is shownthe experimental set-up (above) and the temperature pdf at one position in thefurnace (below).
Rotational CARS
So far most CARS experiments have been made by probing rotational/vibra
tional Raman transitions with a shift normally between about 1000-4100 cm-l.
It is in principle also possible to probe the pure rotational transitions with a
Raman shift normally below - 300 cm- I . The potential advantages with rotational CARS compared to vibrational CARS are that several species may be
detected simultaneously, since the rotational lines are well separated high pres
sure measurements might be feasible without including collisional effects, and
that the rotational CARS cross-sections are larger than those corresponding to
vibrational transitions.
The traditional problem when probing such low Raman shifts has been the difficulty to spectrally isolate the rotational CARS beam from the much strongerlaser beams. However, with the introduction of dual broadband CARS this problem was to a large degree eliminated [Eckbreth and Anderson, 1986; Alden, eta!., 1986]. In this technique an arbitrary broad band dye-laser (- 200 cm") issplit into two beams which together with a narrow band laser (normally the frequency doubled YAG laser at 532 nm) are used to create a broadband rotationalCARS beam, This CARS signal is spectrally dispersed by a spectrograph anddetected by a multi-element detector, e.g, a diode array detector. The rotationalCARS technique is to be preferred for temperature measurements at lower temperatures, (<1000 K) where the single-shot precision is about 3 %,
The rotational technique has after the introduction of the dual-broad band concept been developed for laboratory applications at high pressure and in sootyenvironment, e.g. [Martinsson, et a!., 1992], As an example of real world application of rotational CARS, in Fig. 9 are shown two single shot rotational CARSspectra recorded in an engine at different crank angle degrees before ignition[Bengtsson, et a!., 1994]. As can be seen in Fig. 9 the temperature fit is very
Dow
nloa
ded
by [
Nor
th W
est U
nive
rsity
] at
06:
02 1
8 D
ecem
ber
2014
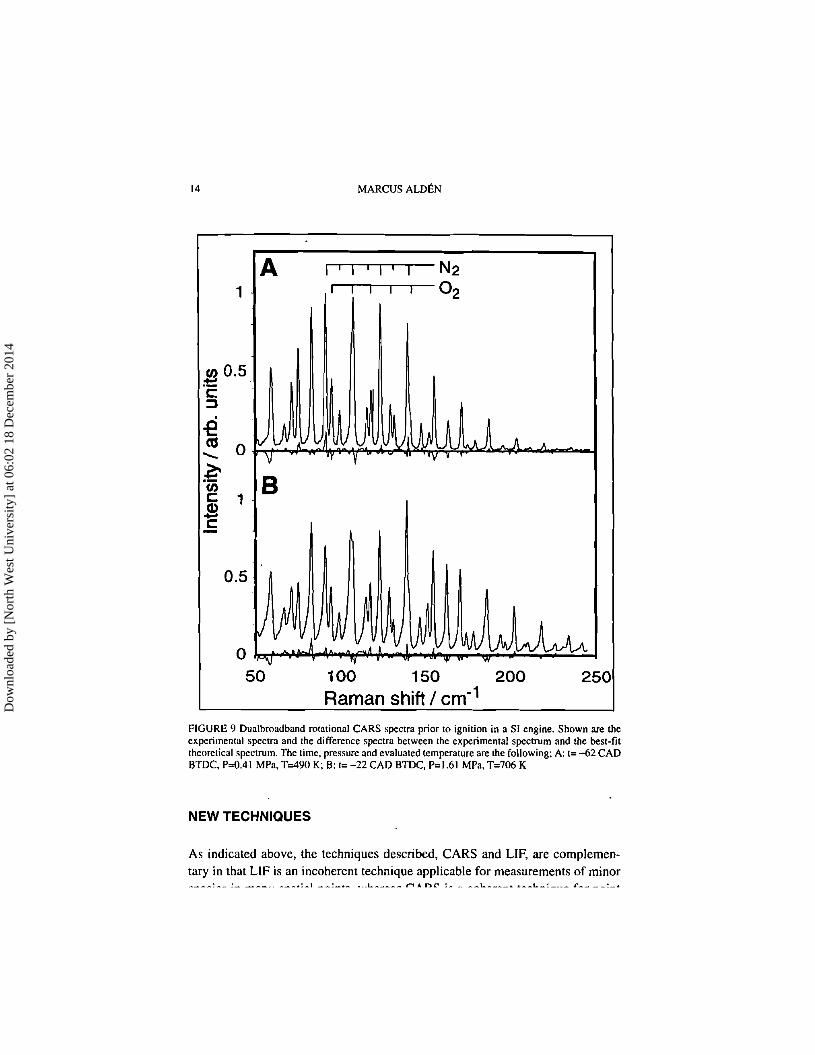
14
A1
en 0.5:!::c:::::]
eas 0-.~ Benc 1sc:-0.5
o50
MARCUS ALDEN
100 150 200Raman shift / cm'
250
FIGURE 9 Dualbroadband rotational CARS spectra prior to ignition in a SI engine. Shown are theexperimental spectra and the difference spectra between the experimental spectrum and the best-fittheoretical spectrum. Thetime,pressure and evaluated temperature arethe following;A: t= -62 CADBTDC, P:OAI MPa, T=490 K; B: t= -22 CAD BTDC, P=1.61 MPa, T=706 K
NEW TECHNIQUES
As indicated above, the techniques described, CARS and LIF, are complementary in that LIP is an incoherent technique applicable for measurements of minor
Dow
nloa
ded
by [
Nor
th W
est U
nive
rsity
] at
06:
02 1
8 D
ecem
ber
2014
LASER SPECTROSCOPIC TECHNIQUES 15
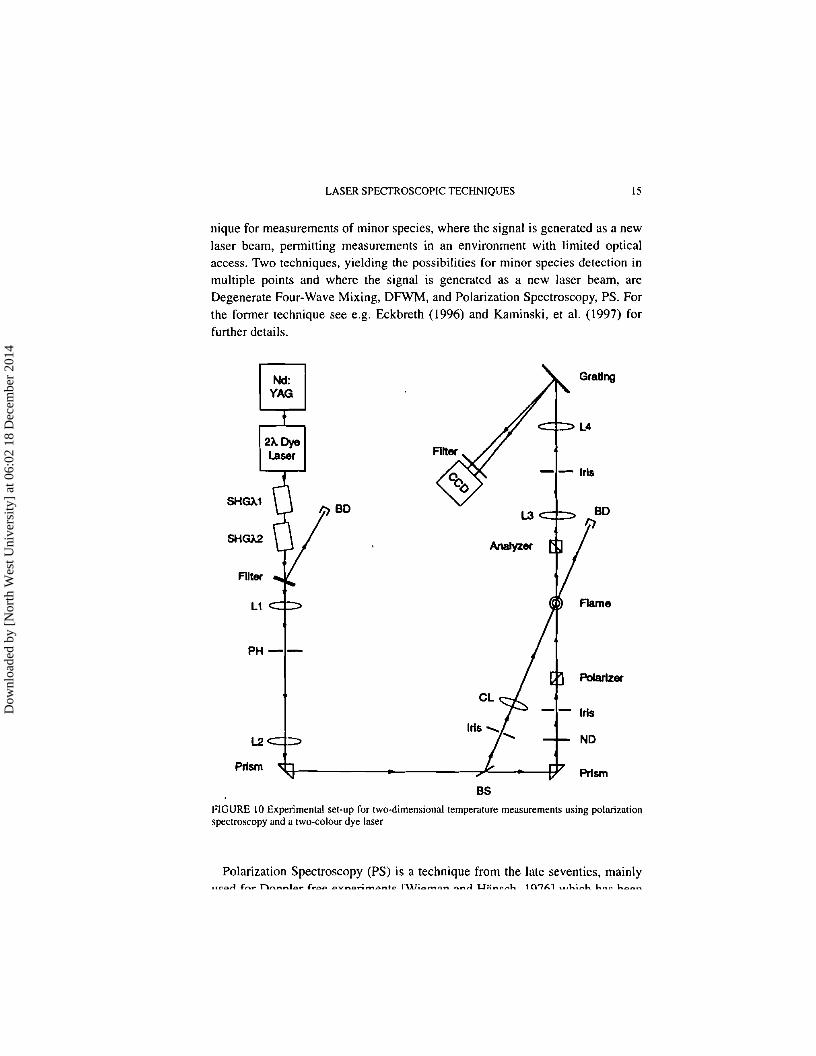
nique for measurements of minor species, where the signal is generated as a newlaser beam, permitting measurements in an environment with limited opticalaccess. Two techniques, yielding the possibilities for minor species detection inmultiple points and where the signal is generated as a new laser beam, areDegenerate Four-Wave Mixing, DFWM, and Polarization Spectroscopy, PS. Forthe former technique see e.g. Eckbreth (1996) and Kaminski, et al. (1997) forfurther details.
FIGURE to Experimental set-upfor two-dimensional temperature measurements using polarizationspectroscopy and a two-colour dye laser
Polarization Spectroscopy (PS) is a technique from the late seventies, mainly
Dow
nloa
ded
by [
Nor
th W
est U
nive
rsity
] at
06:
02 1
8 D
ecem
ber
2014
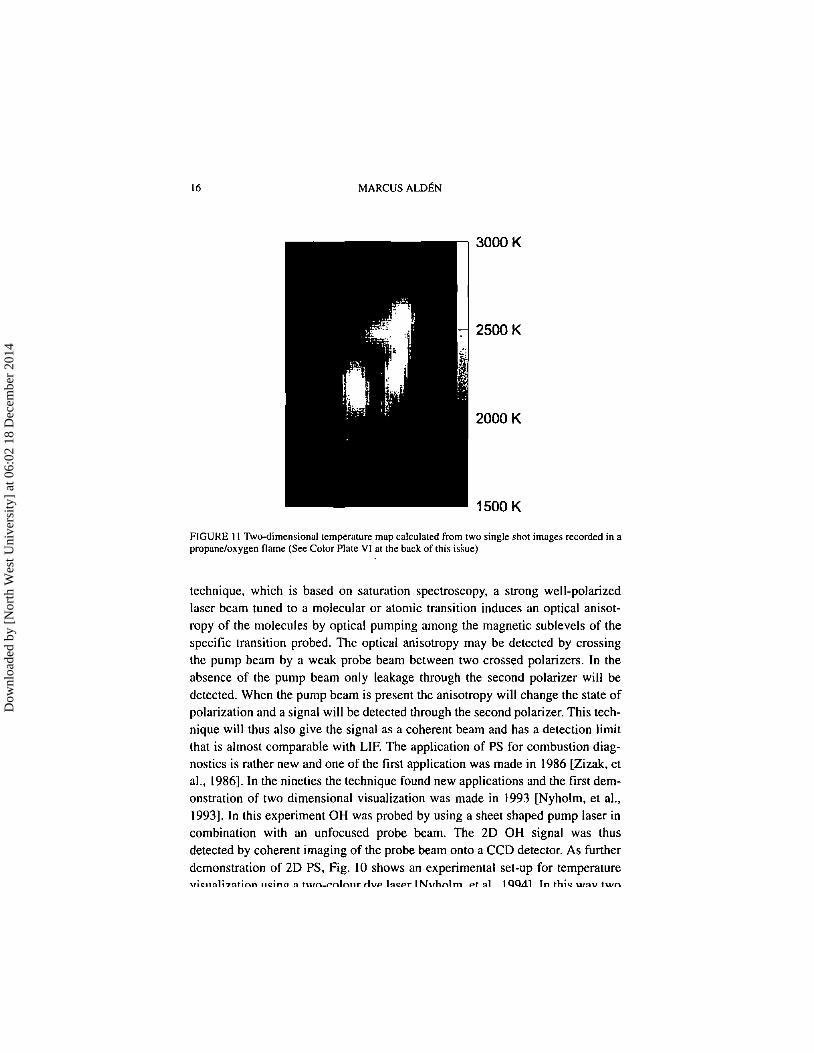
16 MARCUS ALDEN
3000K
2500K
2000K
1500 K
FIGURE 11 Two-dimensional temperature mapcalculated fromtwo single shot images recorded in apropane/oxygen flame (See Color Plate VI at the back of this issue)
technique, which is based on saturation spectroscopy, a strong well-polarizedlaser beam tuned to a molecular or atomic transition induces an optical anisotropy of the molecules by optical pumping among the magnetic sublevels of thespecific transition probed. The optical anisotropy may be detected by crossingthe pump beam by a weak probe beam between two crossed polarizers. In theabsence of the pump beam only leakage through the second polarizer will bedetected. When the pump beam is present the anisotropy will change the state ofpolarization and a signal will be detected through the second polarizer. This technique will thus also give the signal as a coherent beam and has a detection limitthat is almost comparable with LIE The application of PS for combustion diagnostics is rather new and one of the first application was made in 1986 [Zizak, etal., 1986]. In the nineties the technique found new applications and the first demonstration of two dimensional visualization was made in 1993 [Nyholm, et al.,1993]. In this experiment OH was probed by using a sheet shaped pump laser incombination with an unfocused probe beam. The 20 OH signal was thusdetected by coherent imaging of the probe beam onto a CCO detector. As furtherdemonstration of 20 PS, Fig. 10 shows an experimental set-up for temperatureuiC'lIali'7'1otinn IIcincr g tUll"\_rnlnllr rlvp Igcpr rN"hn1tn pt gl 100.11 In th;c u/gV tU/n
Dow
nloa
ded
by [
Nor
th W
est U
nive
rsity
] at
06:
02 1
8 D
ecem
ber
2014
LASER SPECTROSCOPIC TECHNIQUES 17
resulting PS beams, as separated by a diffraction grating, were used to extract thetemperature pixel-by-pixel using the the Boltzman distribution law. A resultingtwo-dimensional temperature image is shown in Fig. 11.
CONCLUSIONS
As have been demonstrated during the last decade and exemplified in this paper,various laser spectroscopic techniques have become of great importance in characterizing various combustion processes. It is strongly believed that fundamentalstudies of existing as well as new techniques are of equal importance as applyingthe more mature techniques, e.g. for characterization and optimization of combustion apparatus. It is also believed that the future will show an increased collaboration between diagnosticians and modellers and that these activities will bemade in close collaboration with relevant industry, so that cars, trucks, aeroplanes, boilers etc of the next millennium are further optimized in terms of fuelefficiency and pollutant formation.
Acknowledgements
The author greatly acknowledge present and former colleagues of the Division ofCombustion Physics for the material presented. It is also important to thank themain financial supporters of the research presented; The Swedish Board forTechnical developents, NUTEK, and the Swedish Research Council for Engineering Sciences, TFR.
ReferencesAlden. M.. Edner, H., Holrnstedt, G., Svanberg, S. and Hogberg, T. (1982) App\. Opt. 21. 1236.Alden. M.• Fredriksson, K. and Wallin. S. (1984) App\. Opt. 23, 2053.Alden. M., Bengtsson, P.E. and Edner, H. (1986) App\. Opt. 25.4493.Andresen, P.A., Bath, A.. Groger, W., Lulf, H.W.. Meijer. G. and ter Meu!en, J,J. (1988) Appl. Opt.
27.365.Baronavski, A.P. and McDonald. J.R. (1977) App\. Opt. 16, 1897.Bengtsson, P.E., Martinsson, L., Alden, M., Johansson, 8., Lassesson, B.• Marforio, K., and Lund
holm. G. (1994) Twenty Fifth Symposium (International) on Combustion/The Combustion Institute, Pittsburgh, pp. 1735-1742.
Bergano. N.S .. Jaanimagi. P.A., Salour, M.M. and Bechtel. J.H. (1983) Opt. Lett. 8. 443.Dyer, MJ. and Crosley, D.R. (1982) Opt. Lett. 7. 382.Eckbreth, A.C and Anderson. TJ. (1986) Appl, Opt. 24. 273 I.Eckbreth, A.C. (1996) Laser diagnostics for combustion temperature and species, Gordon and
Breach Publishers.Georgiev, N. and Alden. M. (1997) Spectr. Chimica Acta B52. 1105.Kaminski. C.F.. Hughes, I.G. and Ewart. P. (1997) J. Chern. Phys. 106.5324.Kaminski. C, Engstrom, J. and Alden. M. (1998) "Quasi-Instantaneous Two-Dimensional Tempera-
Dow
nloa
ded
by [
Nor
th W
est U
nive
rsity
] at
06:
02 1
8 D
ecem
ber
2014
18 MARCUS ALDEN
Kohse-Hoinghaus, K. (1994) "Laser. Techniques for Quantitative Detection ofReactive Intermediatesin Combustion Systems". Prog.EnergyCombust. Sci. 20, 203.
Kychakoff, G., Howe, R.D., Hanson, R.K. and McDaniel, J.e. (1982) Appl. Opt. 21, 3225.LOfstrom, e., Alden, M. and Kroll, S. (1992) Twenty-Fourth Symposium (International) on Combes
non/The Combustion Institute, Pittsburgh. pp. 1637-1644.LOfstrom, C. and Alden. M. (1992) "Temperature measurements by a laser technique in the flame of
a natural gas fired full scale boiler", Lund Report on Combustion Physics, LRCP-7.LOfstrom. e. and Kaaling, H. (1995) Technical Report 9970-1180 from BRITE/EURAM, Low-Emis
sion Combustor Technology, Phase II.Maninsson, L.. Bengtsson, P.E., Alden. M., and Kroll, S. (1992) in Temperature: Its measurements
and control ;11 science and industry, Vol. 6, Ed. J.E Schooley (AlP. New York) pp. 679.Neij, H., Johansson. B. and Alden. M. (1994) Combust. Flame 99, 449.Nyholm, K.• Fritzen. R. and Alden, M. (1993) Opt. Lett. 18.1672.Nyholm, K.• Fritzon R. and Alden. M. (1994) Appl. Phys. 859. 37.Salmon. J.T.and Laurendeau. N.M. (1986) Opt. Letts. 11,419.Verluis. M" Georgiev, N., Martinsson, L.. Alden. M., and Kroll. S. (1997) Appl, Phys. 865. 411.Westblom, U. and Alden. M. ()989) Appl. Opt. 28, 2592.Westblorn, U. and Alden. M. (1990) Appl, Spectr. 44. 881.Wieman, e. and Hansch, T.W. (1976) Phys, Rev. Lett. 36, 1170.Zizak, Z., Lanauze, J. and Winefordner, J.D. (1986) Appl. Opt. 25, 3242.
Dow
nloa
ded
by [
Nor
th W
est U
nive
rsity
] at
06:
02 1
8 D
ecem
ber
2014