laporan interim 2010-v5 - st.gov.my filelaporan interim prestasi perkhidmatan pembekalan elektrik di...
TRANSCRIPT
LAPORAN INTERIM PRESTASI PERKHIDMATAN
PEMBEKALAN ELEKTRIK DI MALAYSIA
INTERIM REPORT ON THE PERFORMANCE OF THE
ELECTRICITY SUPPLY SERVICES IN MALAYSIA
UNTUK SEPARUH TAHUN PERTAMA 2010
FOR THE FIRST HALF YEAR OF 2010
Laporan Interim Separuh Tahun Pertama 2010 Interim Report for the First Half Year of 2010
Jabatan Kawal Selia Pembekalan dan Pasaran Elektrik Electricity Supply and Market Regulation Department - 2 -
Bil. / No. KANDUNGAN / CONTENTS
1.0 PEMBEKALAN DAN PERMINTAAN BEKALAN ELEKTRIK ELECTRICITY SUPPLY AND DEMAND
1.1 Kehendak Maksimum dan Kapasiti Terpasang
Maximum Demand and Installed Generation Capacity
2.0 JUALAN TENAGA ELEKTRIK SALES OF ELECTRICITY
2.1 Jualan Tenaga Bulanan TNB, SESB, Sarawak Energy Berhad (SEB) dan NUR
Monthly Sales of Energy of TNB, SESB Sarawak Energy Berhad (SEB) and NUR
2.2 Jualan Tenaga Tahunan TNB, SESB, Sarawak Energy Berhad (SEB) dan NUR
Yearly Sales of Energy of TNB, SESB Sarawak Energy Berhad (SEB) and NUR
3.0 KEBOLEHARAPAN (RELIABILITY) BEKALAN ELEKTRIK RELIABILITY OF ELECTRICITY SUPPLY
3.1 Statistik Gangguan Bekalan – TNB
Statistics of Supply Interruptions - TNB
3.2 Statistik Gangguan Bekalan – SESB
Statistics of Supply Interruptions - SESB
3.3 Statistik Gangguan Bekalan – SEB Statistics of Supply Interruptions - SEB
3.4 Statistik Gangguan Bekalan – NUR
Statistics of Supply Interruptions - NUR
3.5 Sistem Pengagihan TNB
Distribution System of TNB
3.5.1 System Average Interruption Duration Index (SAIDI)
3.5.2 System Average Interruption Frequency Index (SAIFI)
3.5.3 Customer Average Interruption Duration Index (CAIDI)
3.6 Sistem Pengagihan SESB
Distribution System of SESB
3.6.1 System Average Interruption Duration Index (SAIDI)
3.6.2 System Average Interruption Frequency Index (SAIFI)
3.6.3 Customer Average Interruption Duration Index (CAIDI)
3.7 Sistem Pengagihan SEB
Distribution System of SEB
3.7.1 System Average Interruption Duration Index (SAIDI)
Laporan Interim Separuh Tahun Pertama 2010 Interim Report for the First Half Year of 2010
Jabatan Kawal Selia Pembekalan dan Pasaran Elektrik Electricity Supply and Market Regulation Department - 3 -
3.8 Sistem Pengagihan NUR
Distribution System of NUR
3.8.1 System Average Interruption Duration Index (SAIDI)
3.9 Prestasi Sistem Penghantaran di Semenanjung Malaysia
Performance of Transmission System in Peninsular Malaysia
4.0 PUNCA GANGGUAN BEKALAN ELEKTRIK CAUSES OF ELECTRICITY SUPPLY INTERRUPTIONS
4.1 Punca Gangguan Bekalan Elektrik – TNB
Causes of Electricity Supply Interruptions - TNB
4.2 Punca Gangguan Bekalan Elektrik – SESB
Causes of Electricity Supply Interruptions - SESB
4.3 Punca Gangguan Bekalan Elektrik – SEB
Causes of Electricity Supply Interruptions - SEB
4.4 Punca Gangguan Bekalan Elektrik – NUR
Causes of Electricity Supply Interruptions - NUR
5.0 KUALITI BEKALAN POWER QUALITY
5.1 Insiden Voltage Dips – TNB
Incidents of Voltage Dips – TNB
5.2 Insiden Voltage Dips – NUR
Incidents of Voltage Dips - NUR
Laporan Interim Separuh Tahun Pertama 2010 Interim Report for the First Half Year of 2010
Jabatan Kawal Selia Pembekalan dan Pasaran Elektrik Electricity Supply and Market Regulation Department - 4 -
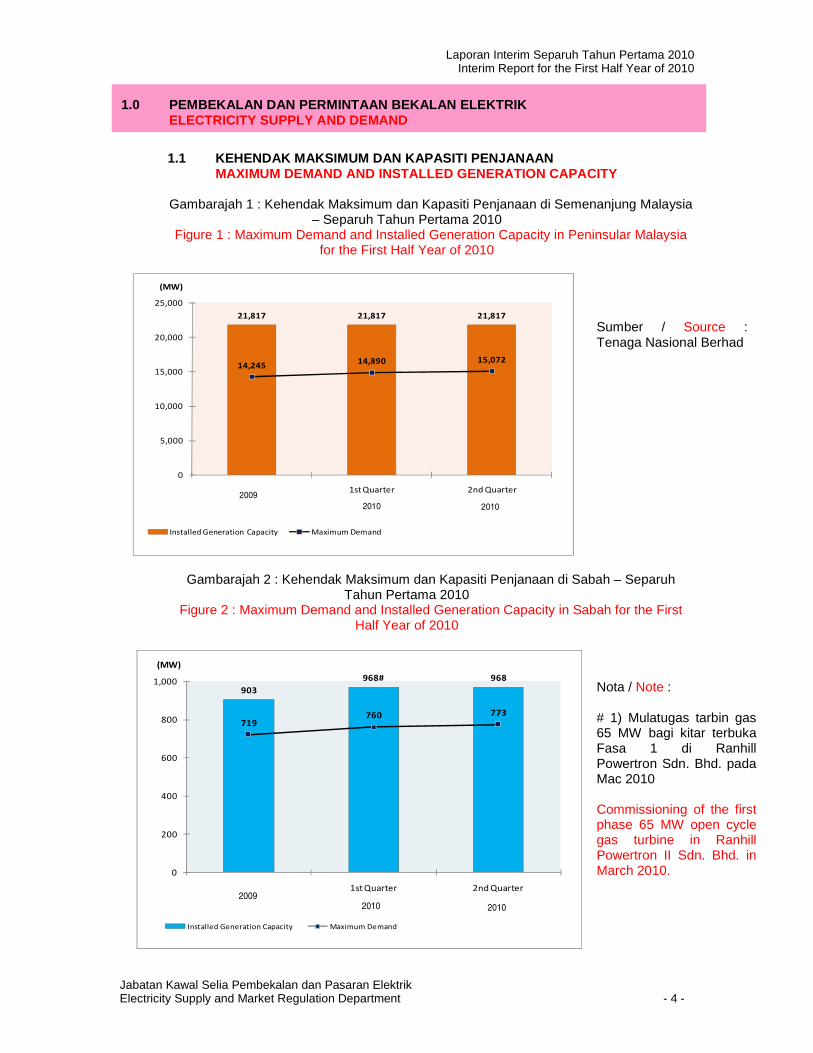
1.1 KEHENDAK MAKSIMUM DAN KAPASITI PENJANAAN MAXIMUM DEMAND AND INSTALLED GENERATION CAPACITY
Gambarajah 1 : Kehendak Maksimum dan Kapasiti Penjanaan di Semenanjung Malaysia – Separuh Tahun Pertama 2010
Figure 1 : Maximum Demand and Installed Generation Capacity in Peninsular Malaysia for the First Half Year of 2010
21,817 21,817 21,817
14,24514,890 15,072
0
5,000
10,000
15,000
20,000
25,000
1st Quarter 2nd Quarter
(MW)
Installed Generation Capacity Maximum Demand
2 2006
2009
2010 2010
Gambarajah 2 : Kehendak Maksimum dan Kapasiti Penjanaan di Sabah – Separuh Tahun Pertama 2010
Figure 2 : Maximum Demand and Installed Generation Capacity in Sabah for the First Half Year of 2010
903
968# 968
719760 773
0
200
400
600
800
1,000
1st Quarter 2nd Quarter
(MW)
Installed Generation Capacity Maximum Demand
20092010 2010
1.0 PEMBEKALAN DAN PERMINTAAN BEKALAN ELEKTRIK ELECTRICITY SUPPLY AND DEMAND
Nota / Note : # 1) Mulatugas tarbin gas 65 MW bagi kitar terbuka Fasa 1 di Ranhill Powertron Sdn. Bhd. pada Mac 2010 Commissioning of the first phase 65 MW open cycle gas turbine in Ranhill Powertron II Sdn. Bhd. in March 2010.
Sumber / Source : Tenaga Nasional Berhad
Laporan Interim Separuh Tahun Pertama 2010 Interim Report for the First Half Year of 2010
Jabatan Kawal Selia Pembekalan dan Pasaran Elektrik Electricity Supply and Market Regulation Department - 5 -
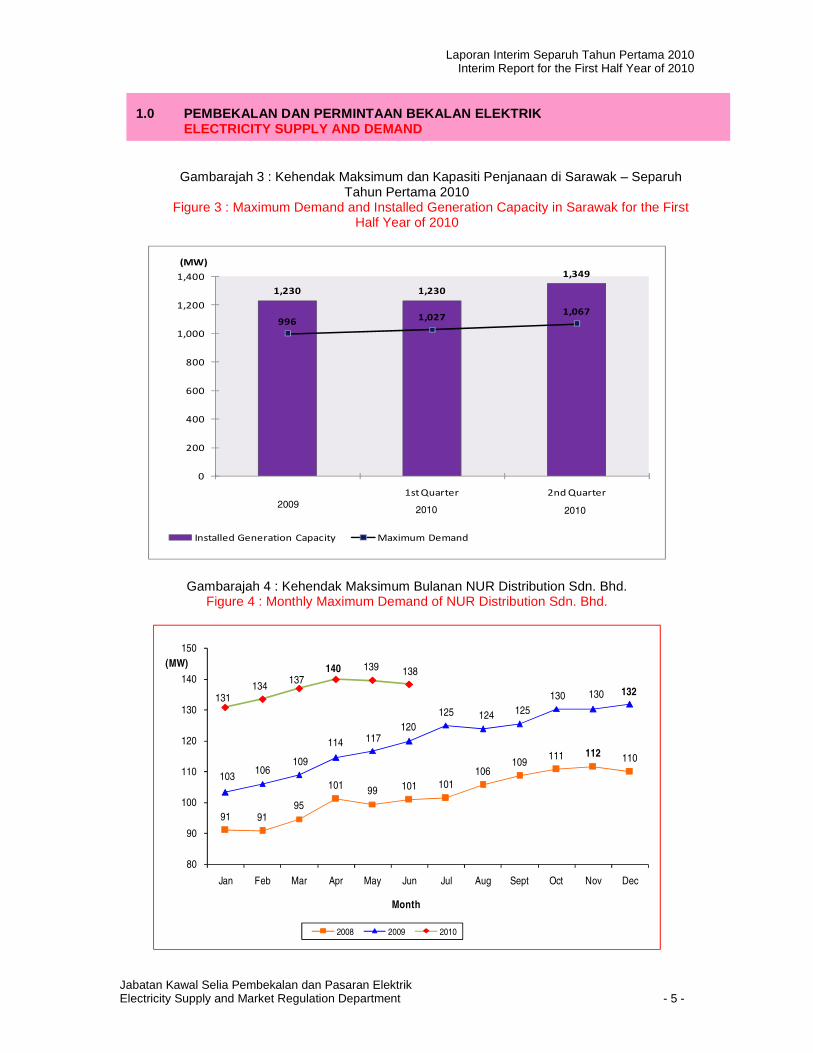
Gambarajah 3 : Kehendak Maksimum dan Kapasiti Penjanaan di Sarawak – Separuh Tahun Pertama 2010
Figure 3 : Maximum Demand and Installed Generation Capacity in Sarawak for the First Half Year of 2010
1,230 1,230
1,349
9961,027
1,067
0
200
400
600
800
1,000
1,200
1,400
1st Quarter 2nd Quarter
(MW)
Installed Generation Capacity Maximum Demand
20092010 2010
Gambarajah 4 : Kehendak Maksimum Bulanan NUR Distribution Sdn. Bhd. Figure 4 : Monthly Maximum Demand of NUR Distribution Sdn. Bhd.
91 9195
10199 101 101
106109
111 112 110
103106
109
114 117120
125 124 125
130 130 132131
134137
140 139 138
80
90
100
110
120
130
140
150
Jan Feb Mar Apr May Jun Jul Aug Sept Oct Nov Dec
(MW)
Month
2008 2009 2010
1.0 PEMBEKALAN DAN PERMINTAAN BEKALAN ELEKTRIK ELECTRICITY SUPPLY AND DEMAND
Laporan Interim Separuh Tahun Pertama 2010 Interim Report for the First Half Year of 2010
Jabatan Kawal Selia Pembekalan dan Pasaran Elektrik Electricity Supply and Market Regulation Department - 6 -
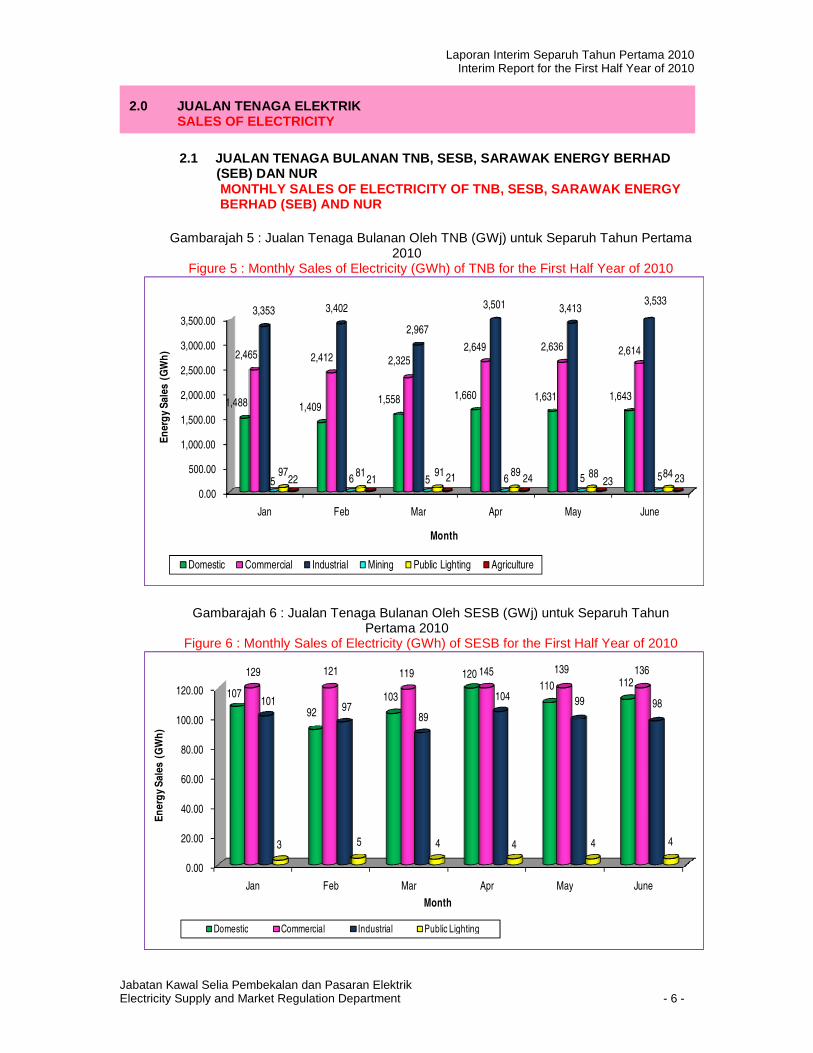
2.1 JUALAN TENAGA BULANAN TNB, SESB, SARAWAK ENERGY BERHAD (SEB) DAN NUR MONTHLY SALES OF ELECTRICITY OF TNB, SESB, SARAWAK ENERGY BERHAD (SEB) AND NUR
Gambarajah 5 : Jualan Tenaga Bulanan Oleh TNB (GWj) untuk Separuh Tahun Pertama
2010 Figure 5 : Monthly Sales of Electricity (GWh) of TNB for the First Half Year of 2010
0.00
500.00
1,000.00
1,500.00
2,000.00
2,500.00
3,000.00
3,500.00
Jan Feb Mar Apr May June
1,488 1,4091,558 1,660 1,631 1,643
2,465 2,412 2,3252,649 2,636 2,614
3,353 3,402
2,967
3,501 3,4133,533
5 6 5 6 5 597 81 91 89 88 8422 21 21 24 23 23
En
erg
y S
ale
s (
GW
h)
Month
Domestic Commercial Industrial Mining Public Lighting Agriculture
Gambarajah 6 : Jualan Tenaga Bulanan Oleh SESB (GWj) untuk Separuh Tahun Pertama 2010
Figure 6 : Monthly Sales of Electricity (GWh) of SESB for the First Half Year of 2010
0.00
20.00
40.00
60.00
80.00
100.00
120.00
Jan Feb Mar Apr May June
107
92
103
120110 112
129 121 119 145 139 136
10197
89
104 99 98
3 5 4 4 4 4
En
erg
y S
ale
s (
GW
h)
Month
Domestic Commercial Industrial Public Lighting
2.0 JUALAN TENAGA ELEKTRIK SALES OF ELECTRICITY
Laporan Interim Separuh Tahun Pertama 2010 Interim Report for the First Half Year of 2010
Jabatan Kawal Selia Pembekalan dan Pasaran Elektrik Electricity Supply and Market Regulation Department - 7 -
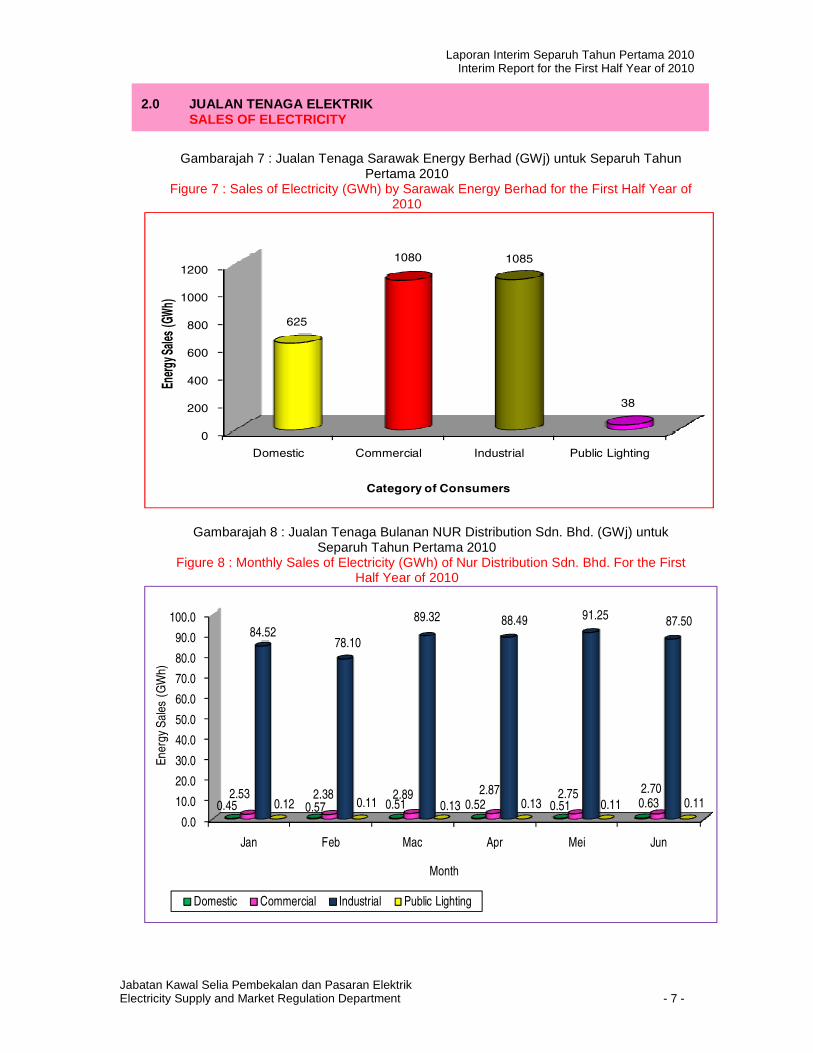
Gambarajah 7 : Jualan Tenaga Sarawak Energy Berhad (GWj) untuk Separuh Tahun Pertama 2010
Figure 7 : Sales of Electricity (GWh) by Sarawak Energy Berhad for the First Half Year of 2010
0
200
400
600
800
1000
1200
Domestic Commercial Industrial Public Lighting
625
1080 1085
38
Ener
gy S
ales
(GW
h)
Category of Consumers
Gambarajah 8 : Jualan Tenaga Bulanan NUR Distribution Sdn. Bhd. (GWj) untuk Separuh Tahun Pertama 2010
Figure 8 : Monthly Sales of Electricity (GWh) of Nur Distribution Sdn. Bhd. For the First Half Year of 2010
0.0
10.0
20.0
30.0
40.0
50.0
60.0
70.0
80.0
90.0
100.0
Jan Feb Mac Apr Mei Jun
0.45 0.57 0.51 0.52 0.51 0.632.53 2.38 2.89 2.87 2.75 2.70
84.5278.10
89.32 88.49 91.25 87.50
0.12 0.11 0.13 0.13 0.11 0.11
En
erg
y S
ales
(G
Wh)
Month
Domestic Commercial Industrial Public Lighting
2.0 JUALAN TENAGA ELEKTRIK SALES OF ELECTRICITY
Laporan Interim Separuh Tahun Pertama 2010 Interim Report for the First Half Year of 2010
Jabatan Kawal Selia Pembekalan dan Pasaran Elektrik Electricity Supply and Market Regulation Department - 8 -
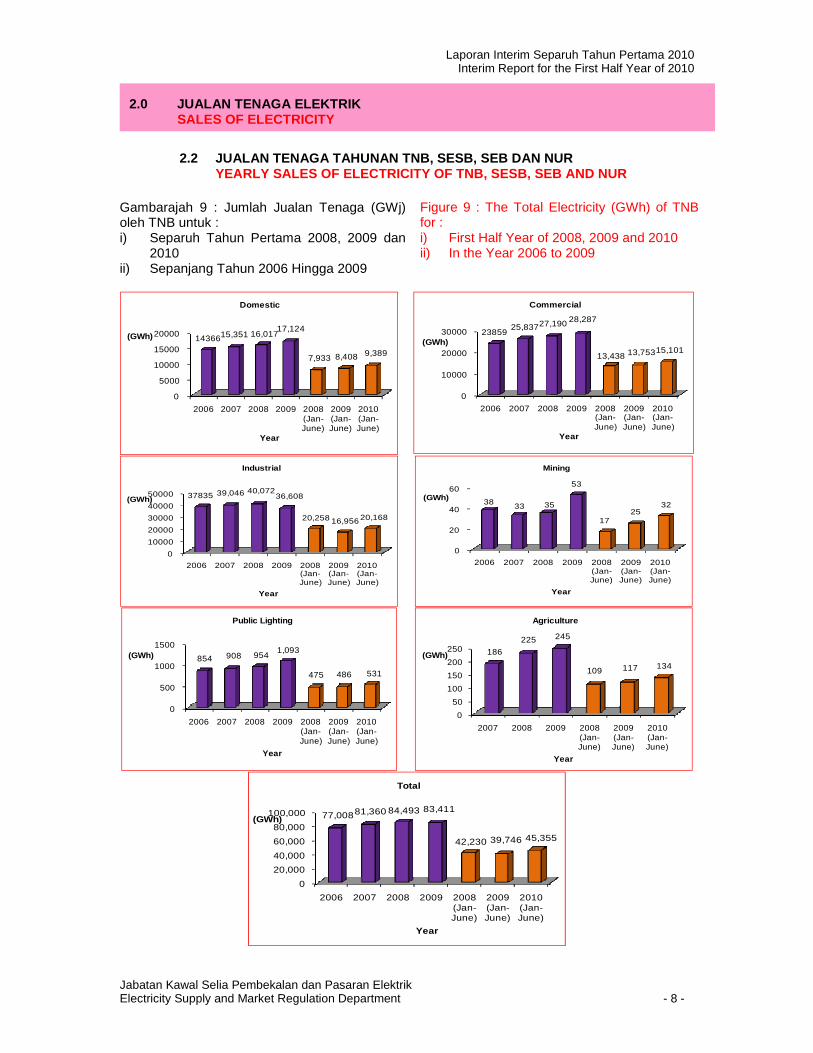
2.2 JUALAN TENAGA TAHUNAN TNB, SESB, SEB DAN NUR YEARLY SALES OF ELECTRICITY OF TNB, SESB, SEB AND N UR
Gambarajah 9 : Jumlah Jualan Tenaga (GWj) oleh TNB untuk : i) Separuh Tahun Pertama 2008, 2009 dan
2010 ii) Sepanjang Tahun 2006 Hingga 2009
Figure 9 : The Total Electricity (GWh) of TNB for : i) First Half Year of 2008, 2009 and 2010 ii) In the Year 2006 to 2009
0
5000
10000
15000
20000
2006 2007 2008 2009 2008 (Jan-June)
2009 (Jan-June)
2010 (Jan-June)
14366 15,351 16,01717,124
7,933 8,408 9,389
(GWh)
Year
Domestic
0
10000
20000
30000
2006 2007 2008 2009 2008 (Jan-June)
2009 (Jan-June)
2010 (Jan-June)
23859 25,83727,190 28,287
13,438 13,75315,101(GWh)
Year
Commercial
0
10000
20000
30000
40000
50000
2006 2007 2008 2009 2008 (Jan-June)
2009 (Jan-June)
2010 (Jan-June)
37835 39,046 40,07236,608
20,258 16,956 20,168
(GWh)
Year
Industrial
0
20
40
60
2006 2007 2008 2009 2008 (Jan-June)
2009 (Jan-June)
2010 (Jan-June)
38 33 35
53
1725
32(GWh)
Year
Mining
0
500
1000
1500
2006 2007 2008 2009 2008 (Jan-June)
2009 (Jan-June)
2010 (Jan-June)
854 908 9541,093
475 486 531
(GWh)
Year
Public Lighting
0
50
100
150
200
250
2007 2008 2009 2008 (Jan-June)
2009 (Jan-June)
2010 (Jan-June)
186
225 245
109 117 134(GWh)
Year
Agriculture
0
20,000
40,000
60,000
80,000
100,000
2006 2007 2008 2009 2008 (Jan-June)
2009 (Jan-June)
2010 (Jan-June)
77,00881,360 84,493 83,411
42,230 39,746 45,355
(GWh)
Year
Total
2.0 JUALAN TENAGA ELEKTRIK SALES OF ELECTRICITY
Laporan Interim Separuh Tahun Pertama 2010 Interim Report for the First Half Year of 2010
Jabatan Kawal Selia Pembekalan dan Pasaran Elektrik Electricity Supply and Market Regulation Department - 9 -
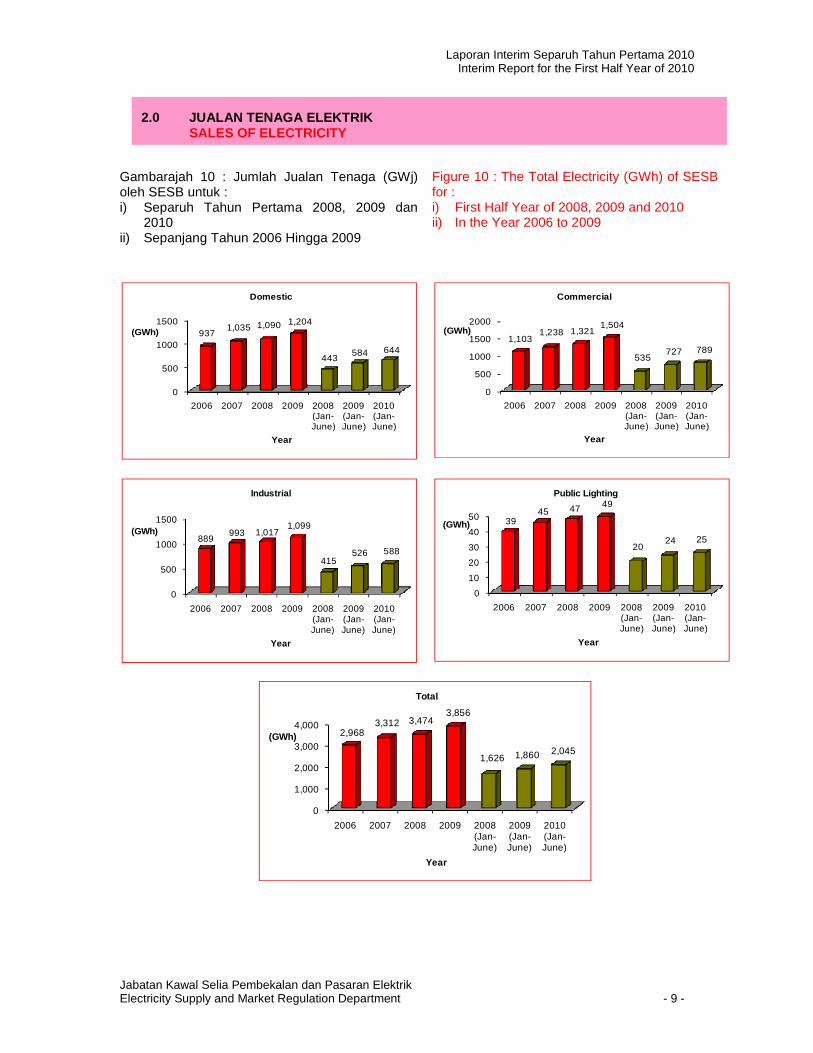
Gambarajah 10 : Jumlah Jualan Tenaga (GWj) oleh SESB untuk : i) Separuh Tahun Pertama 2008, 2009 dan
2010 ii) Sepanjang Tahun 2006 Hingga 2009
Figure 10 : The Total Electricity (GWh) of SESB for : i) First Half Year of 2008, 2009 and 2010 ii) In the Year 2006 to 2009
0
500
1000
1500
2006 2007 2008 2009 2008 (Jan-June)
2009 (Jan-June)
2010 (Jan-June)
937 1,035 1,090 1,204
443 584 644
(GWh)
Year
Domestic
0
500
1000
1500
2000
2006 2007 2008 2009 2008 (Jan-June)
2009 (Jan-June)
2010 (Jan-June)
1,103 1,238 1,321
1,504
535 727 789
(GWh)
Year
Commercial
0
500
1000
1500
2006 2007 2008 2009 2008 (Jan-June)
2009 (Jan-June)
2010 (Jan-June)
889 993 1,017
1,099
415 526 588
(GWh)
Year
Industrial
0
10
20
30
40
50
2006 2007 2008 2009 2008 (Jan-June)
2009 (Jan-June)
2010 (Jan-June)
3945 47 49
2024 25
(GWh)
Year
Public Lighting
0
1,000
2,000
3,000
4,000
2006 2007 2008 2009 2008 (Jan-June)
2009 (Jan-June)
2010 (Jan-June)
2,9683,312 3,474
3,856
1,626 1,860 2,045
(GWh)
Year
Total
2.0 JUALAN TENAGA ELEKTRIK SALES OF ELECTRICITY
Laporan Interim Separuh Tahun Pertama 2010 Interim Report for the First Half Year of 2010
Jabatan Kawal Selia Pembekalan dan Pasaran Elektrik Electricity Supply and Market Regulation Department - 10 -
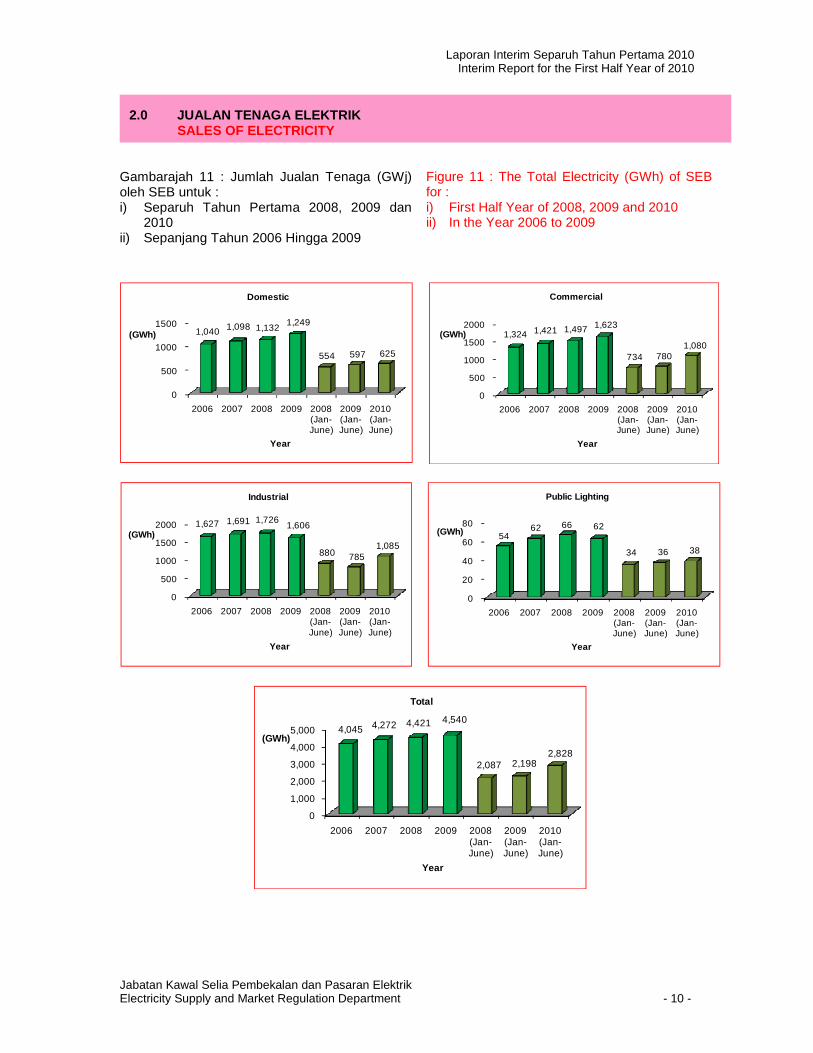
Gambarajah 11 : Jumlah Jualan Tenaga (GWj) oleh SEB untuk : i) Separuh Tahun Pertama 2008, 2009 dan
2010 ii) Sepanjang Tahun 2006 Hingga 2009
Figure 11 : The Total Electricity (GWh) of SEB for : i) First Half Year of 2008, 2009 and 2010 ii) In the Year 2006 to 2009
0
500
1000
1500
2006 2007 2008 2009 2008 (Jan-June)
2009 (Jan-June)
2010 (Jan-June)
1,040 1,098 1,132 1,249
554 597 625
(GWh)
Year
Domestic
0
500
1000
1500
2000
2006 2007 2008 2009 2008 (Jan-June)
2009 (Jan-June)
2010 (Jan-June)
1,324 1,421 1,497 1,623
734 780 1,080
(GWh)
Year
Commercial
0
500
1000
1500
2000
2006 2007 2008 2009 2008 (Jan-June)
2009 (Jan-June)
2010 (Jan-June)
1,627 1,691 1,726 1,606
880 785 1,085
(GWh)
Year
Industrial
0
20
40
60
80
2006 2007 2008 2009 2008 (Jan-June)
2009 (Jan-June)
2010 (Jan-June)
54 62 66 62
34 36 38
(GWh)
Year
Public Lighting
0
1,000
2,000
3,000
4,000
5,000
2006 2007 2008 2009 2008 (Jan-June)
2009 (Jan-June)
2010 (Jan-June)
4,045 4,272 4,421 4,540
2,087 2,1982,828
(GWh)
Year
Total
2.0 JUALAN TENAGA ELEKTRIK SALES OF ELEC TRICITY
Laporan Interim Separuh Tahun Pertama 2010 Interim Report for the First Half Year of 2010
Jabatan Kawal Selia Pembekalan dan Pasaran Elektrik Electricity Supply and Market Regulation Department - 11 -
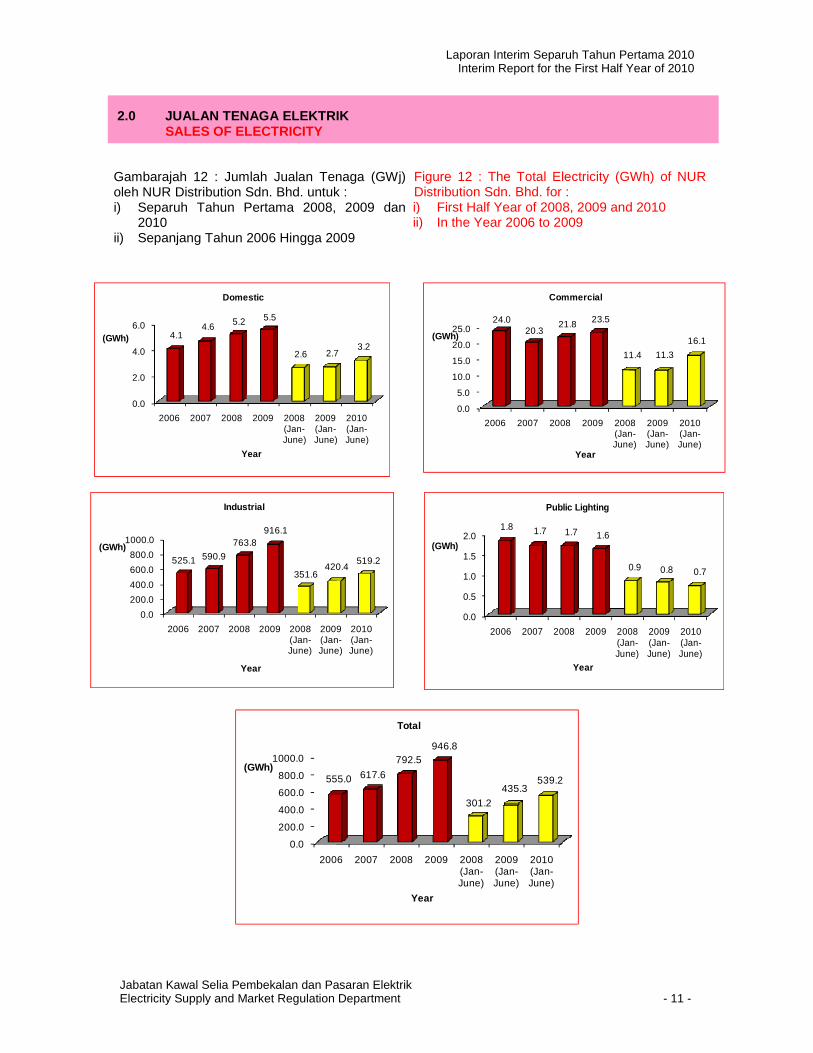
Gambarajah 12 : Jumlah Jualan Tenaga (GWj) oleh NUR Distribution Sdn. Bhd. untuk : i) Separuh Tahun Pertama 2008, 2009 dan
2010 ii) Sepanjang Tahun 2006 Hingga 2009
Figure 12 : The Total Electricity (GWh) of NUR Distribution Sdn. Bhd. for : i) First Half Year of 2008, 2009 and 2010 ii) In the Year 2006 to 2009
0.0
2.0
4.0
6.0
2006 2007 2008 2009 2008 (Jan-June)
2009 (Jan-June)
2010 (Jan-June)
4.14.6 5.2 5.5
2.6 2.73.2
(GWh)
Year
Domestic
0.0
5.0
10.0
15.0
20.0
25.0
2006 2007 2008 2009 2008 (Jan-June)
2009 (Jan-June)
2010 (Jan-June)
24.020.3
21.8 23.5
11.4 11.3
16.1(GWh)
Year
Commercial
0.0
200.0
400.0
600.0
800.0
1000.0
2006 2007 2008 2009 2008 (Jan-June)
2009 (Jan-June)
2010 (Jan-June)
525.1 590.9
763.8916.1
351.6420.4
519.2
(GWh)
Year
Industrial
0.0
0.5
1.0
1.5
2.0
2006 2007 2008 2009 2008 (Jan-June)
2009 (Jan-June)
2010 (Jan-June)
1.8 1.7 1.7 1.6
0.9 0.8 0.7
(GWh)
Year
Public Lighting
0.0
200.0
400.0
600.0
800.0
1000.0
2006 2007 2008 2009 2008 (Jan-June)
2009 (Jan-June)
2010 (Jan-June)
555.0 617.6
792.5946.8
301.2
435.3539.2
(GWh)
Year
Total
2.0 JUALAN TENAGA ELEKTRIK SALES OF ELECTRICITY
Laporan Interim Separuh Tahun Pertama 2010 Interim Report for the First Half Year of 2010
Jabatan Kawal Selia Pembekalan dan Pasaran Elektrik Electricity Supply and Market Regulation Department - 12 -
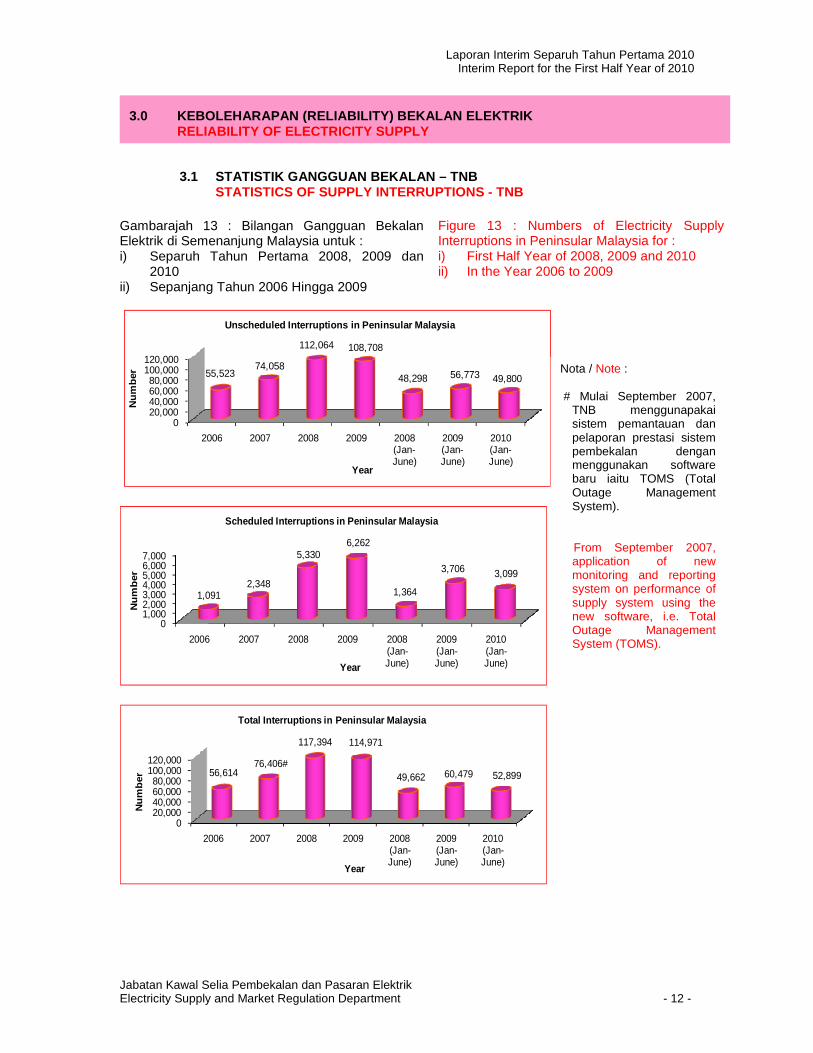
3.1 STATISTIK GANGGUAN BEKALAN – TNB STATISTICS OF SUPPLY INTERRUPTIONS - TNB
Gambarajah 13 : Bilangan Gangguan Bekalan Elektrik di Semenanjung Malaysia untuk : i) Separuh Tahun Pertama 2008, 2009 dan
2010 ii) Sepanjang Tahun 2006 Hingga 2009
Figure 13 : Numbers of Electricity Supply Interruptions in Peninsular Malaysia for : i) First Half Year of 2008, 2009 and 2010 ii) In the Year 2006 to 2009
020,00040,00060,00080,000
100,000120,000
2006 2007 2008 2009 2008 (Jan-June)
2009 (Jan-June)
2010 (Jan-June)
55,52374,058
112,064 108,708
48,298 56,773 49,800
Num
ber
Year
Unscheduled Interruptions in Peninsular Malaysia
01,0002,0003,0004,0005,0006,0007,000
2006 2007 2008 2009 2008 (Jan-June)
2009 (Jan-June)
2010 (Jan-June)
1,0912,348
5,3306,262
1,364
3,706 3,099
Nu
mb
er
Year
Scheduled Interruptions in Peninsular Malaysia
020,00040,00060,00080,000
100,000120,000
2006 2007 2008 2009 2008 (Jan-June)
2009 (Jan-June)
2010 (Jan-June)
56,61476,406#
117,394 114,971
49,662 60,479 52,899
Nu
mb
er
Year
Total Interruptions in Peninsular Malaysia
3.0 KEBOLEHARAPAN (RELIABILITY) BEKALAN ELEKTRIK RELIABILITY OF ELECTRICITY SUPPLY
Nota / Note : # Mulai September 2007,
TNB menggunapakai sistem pemantauan dan pelaporan prestasi sistem pembekalan dengan menggunakan software baru iaitu TOMS (Total Outage Management System).
From September 2007,
application of new monitoring and reporting system on performance of supply system using the new software, i.e. Total Outage Management System (TOMS).
Laporan Interim Separuh Tahun Pertama 2010 Interim Report for the First Half Year of 2010
Jabatan Kawal Selia Pembekalan dan Pasaran Elektrik Electricity Supply and Market Regulation Department - 13 -
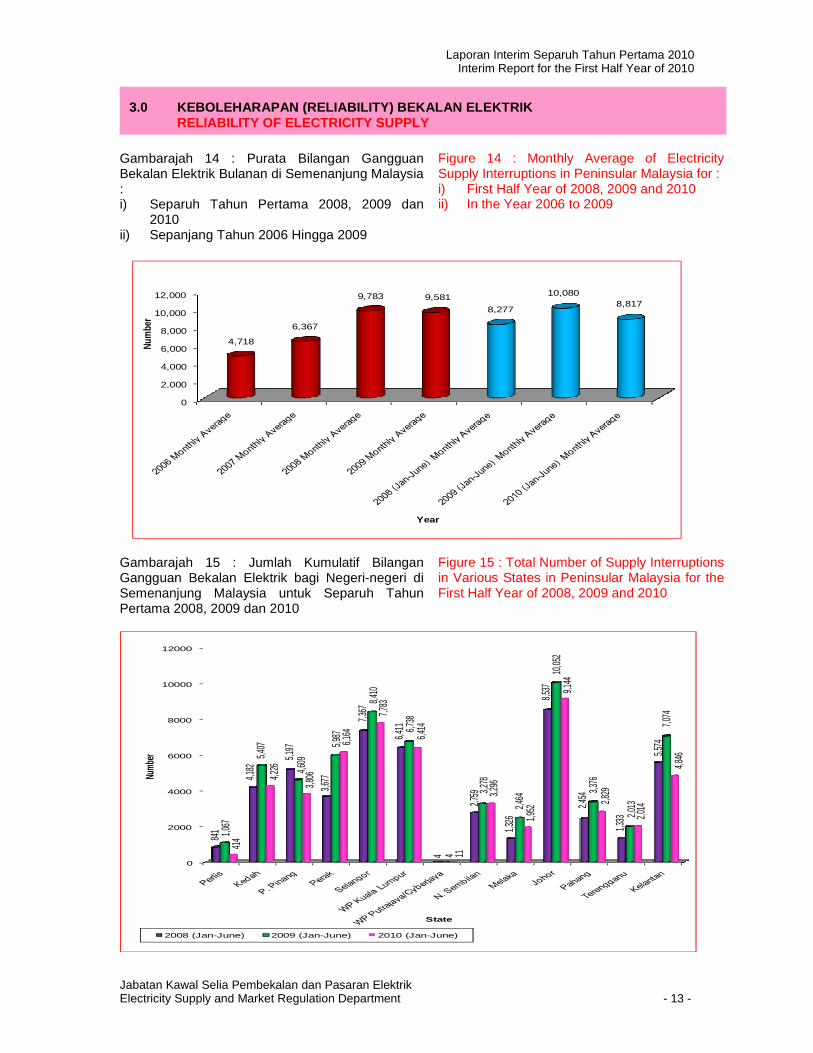
Gambarajah 14 : Purata Bilangan Gangguan Bekalan Elektrik Bulanan di Semenanjung Malaysia : i) Separuh Tahun Pertama 2008, 2009 dan
2010 ii) Sepanjang Tahun 2006 Hingga 2009
Figure 14 : Monthly Average of Electricity Supply Interruptions in Peninsular Malaysia for : i) First Half Year of 2008, 2009 and 2010 ii) In the Year 2006 to 2009
0
2,000
4,000
6,000
8,000
10,000
12,000
4,718
6,367
9,783 9,581
8,277
10,0808,817
Num
ber
Year
Gambarajah 15 : Jumlah Kumulatif Bilangan Gangguan Bekalan Elektrik bagi Negeri-negeri di Semenanjung Malaysia untuk Separuh Tahun Pertama 2008, 2009 dan 2010
Figure 15 : Total Number of Supply Interruptions in Various States in Peninsular Malaysia for the First Half Year of 2008, 2009 and 2010
0
2000
4000
6000
8000
10000
12000
841
4,182
5,197
3,677
7,367
6,411
4
2,759
1,326
8,537
2,454
1,333
5,574
1,067
5,407
4,609
5,987
8,410
6,738
4
3,278
2,464
10,05
2
3,376
2,013
7,074
414
4,226
3,806
6,164
7,783
6,414
11
3,296
1,952
9,144
2,829
2,014
4,846
Numb
er
State
2008 (Jan-June) 2009 (Jan-June) 2010 (Jan-June)
3.0 KEBOLEHARAPAN (RELIABILITY) BEKALAN ELEKTRIK RELIABILITY OF ELECTRICITY SUPPLY
Laporan Interim Separuh Tahun Pertama 2010 Interim Report for the First Half Year of 2010
Jabatan Kawal Selia Pembekalan dan Pasaran Elektrik Electricity Supply and Market Regulation Department - 14 -
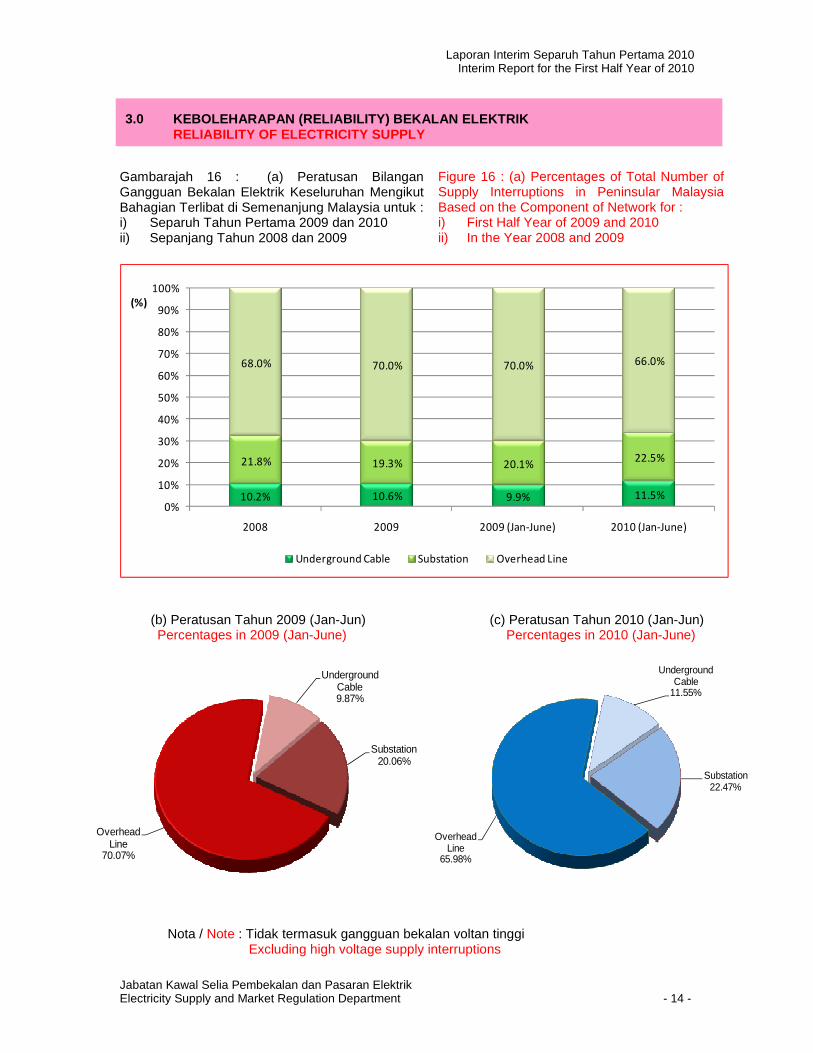
Gambarajah 16 : (a) Peratusan Bilangan Gangguan Bekalan Elektrik Keseluruhan Mengikut Bahagian Terlibat di Semenanjung Malaysia untuk : i) Separuh Tahun Pertama 2009 dan 2010 ii) Sepanjang Tahun 2008 dan 2009
Figure 16 : (a) Percentages of Total Number of Supply Interruptions in Peninsular Malaysia Based on the Component of Network for : i) First Half Year of 2009 and 2010 ii) In the Year 2008 and 2009
10.2% 10.6% 9.9% 11.5%
21.8% 19.3% 20.1% 22.5%
68.0% 70.0% 70.0% 66.0%
0%
10%
20%
30%
40%
50%
60%
70%
80%
90%
100%
2008 2009 2009 (Jan-June) 2010 (Jan-June)
(%)
Underground Cable Substation Overhead Line
(b) Peratusan Tahun 2009 (Jan-Jun)
Percentages in 2009 (Jan-June)
Underground Cable9.87%
Substation20.06%
Overhead Line
70.07%
(c) Peratusan Tahun 2010 (Jan-Jun) Percentages in 2010 (Jan-June)
Underground Cable
11.55%
Substation22.47%
Overhead Line
65.98%
Nota / Note : Tidak termasuk gangguan bekalan voltan tinggi Excluding high voltage supply interruptions
3.0 KEBOLEHARAPAN (RELIABILITY) BEKALAN ELEKTRIK RELIABILITY OF ELECTRICITY SUPPLY
Laporan Interim Separuh Tahun Pertama 2010 Interim Report for the First Half Year of 2010
Jabatan Kawal Selia Pembekalan dan Pasaran Elektrik Electricity Supply and Market Regulation Department - 15 -
3.2 STATISTIK GANGGUAN BEKALAN - SESB STATISTICS OF SUPPLY INTERRUPTIONS - SESB
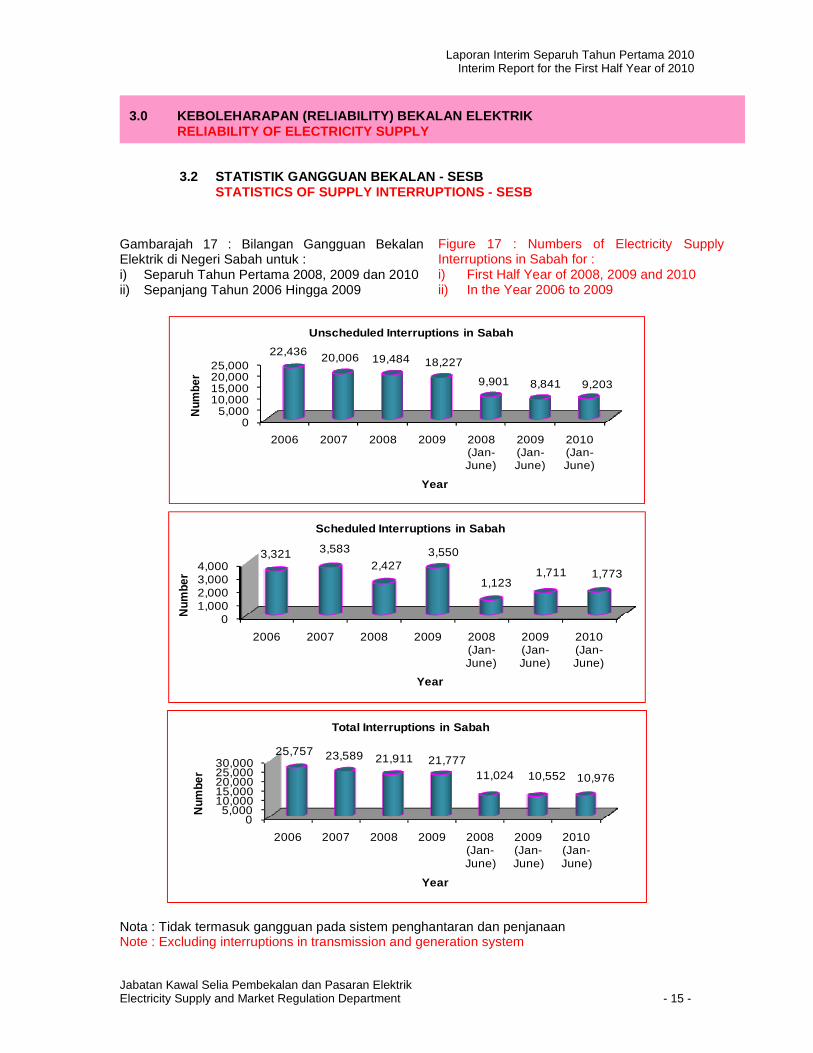
Gambarajah 17 : Bilangan Gangguan Bekalan Elektrik di Negeri Sabah untuk : i) Separuh Tahun Pertama 2008, 2009 dan 2010 ii) Sepanjang Tahun 2006 Hingga 2009
Figure 17 : Numbers of Electricity Supply Interruptions in Sabah for : i) First Half Year of 2008, 2009 and 2010 ii) In the Year 2006 to 2009
05,000
10,00015,00020,00025,000
2006 2007 2008 2009 2008 (Jan-June)
2009 (Jan-June)
2010 (Jan-June)
22,436 20,006 19,484 18,227
9,901 8,841 9,203
Num
ber
Year
Unscheduled Interruptions in Sabah
01,0002,0003,0004,000
2006 2007 2008 2009 2008 (Jan-June)
2009 (Jan-June)
2010 (Jan-June)
3,321 3,583
2,4273,550
1,1231,711 1,773
Num
ber
Year
Scheduled Interruptions in Sabah
05,000
10,00015,00020,00025,00030,000
2006 2007 2008 2009 2008 (Jan-June)
2009 (Jan-June)
2010 (Jan-June)
25,757 23,589 21,911 21,77711,024 10,552 10,976
Num
ber
Year
Total Interruptions in Sabah
Nota : Tidak termasuk gangguan pada sistem penghantaran dan penjanaan Note : Excluding interruptions in transmission and generation system
3.0 KEBOLEHARAPAN (RELIABILITY) BEKALAN ELEKTRIK RELIABILITY OF ELECTRICITY SUPPLY
Laporan Interim Separuh Tahun Pertama 2010 Interim Report for the First Half Year of 2010
Jabatan Kawal Selia Pembekalan dan Pasaran Elektrik Electricity Supply and Market Regulation Department - 16 -
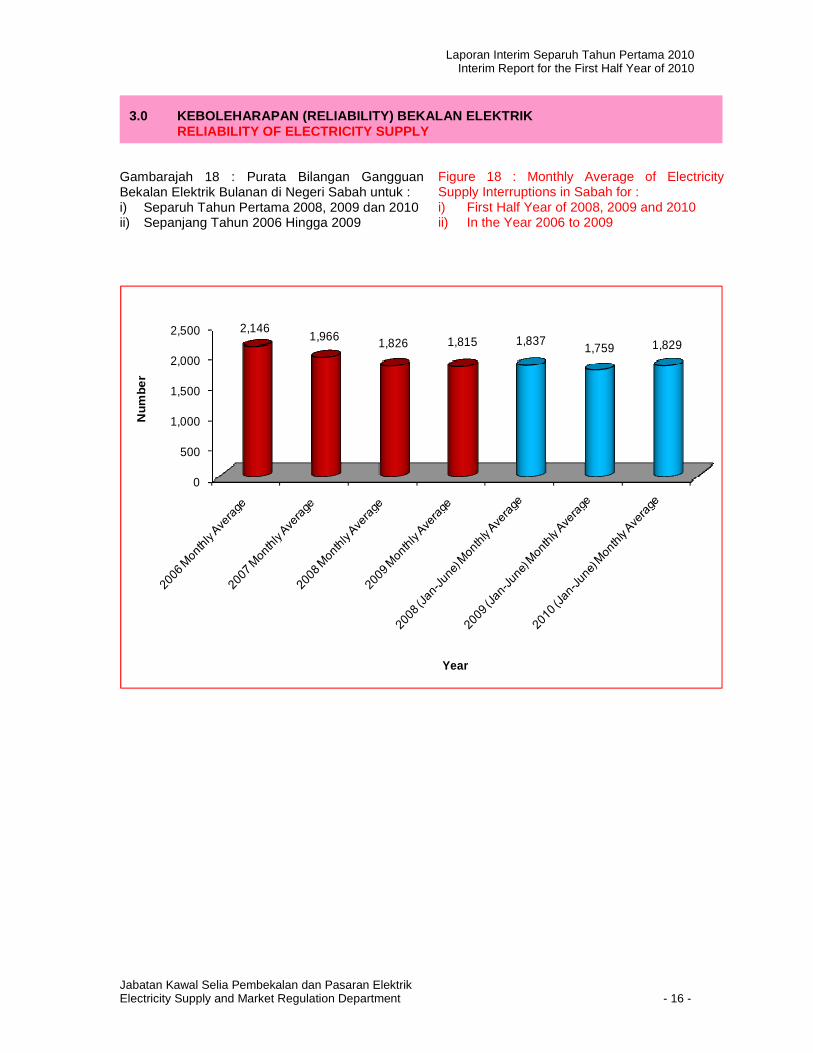
Gambarajah 18 : Purata Bilangan Gangguan Bekalan Elektrik Bulanan di Negeri Sabah untuk : i) Separuh Tahun Pertama 2008, 2009 dan 2010 ii) Sepanjang Tahun 2006 Hingga 2009
Figure 18 : Monthly Average of Electricity Supply Interruptions in Sabah for : i) First Half Year of 2008, 2009 and 2010 ii) In the Year 2006 to 2009
0
500
1,000
1,500
2,000
2,500 2,146 1,966 1,826 1,815 1,837
1,759 1,829
Num
ber
Year
3.0 KEBOLEHARAPAN (RELIABILITY) BEKALAN ELEKTRIK RELIABILITY OF ELECTRICITY SUPPLY
Laporan Interim Separuh Tahun Pertama 2010 Interim Report for the First Half Year of 2010
Jabatan Kawal Selia Pembekalan dan Pasaran Elektrik Electricity Supply and Market Regulation Department - 17 -
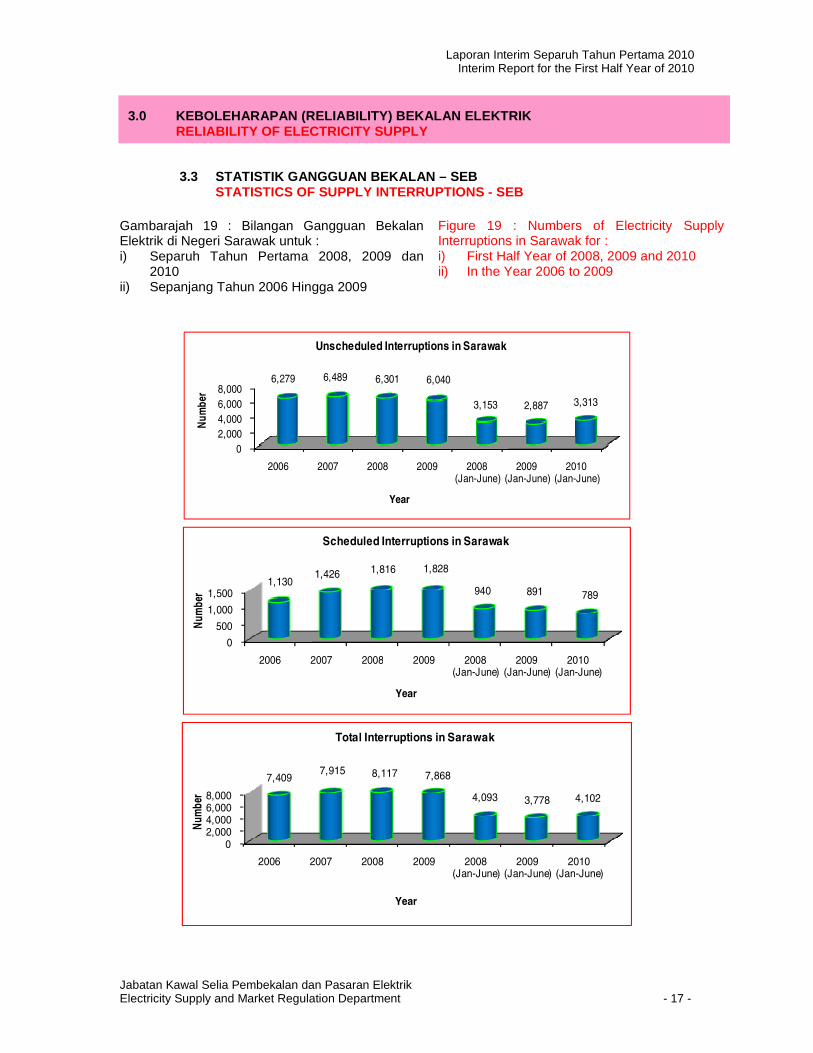
3.3 STATISTIK GANGGUAN BEKALAN – SEB STATISTICS OF SUPPLY INTERRUPTIONS - SEB
Gambarajah 19 : Bilangan Gangguan Bekalan Elektrik di Negeri Sarawak untuk : i) Separuh Tahun Pertama 2008, 2009 dan
2010 ii) Sepanjang Tahun 2006 Hingga 2009
Figure 19 : Numbers of Electricity Supply Interruptions in Sarawak for : i) First Half Year of 2008, 2009 and 2010 ii) In the Year 2006 to 2009
0
2,000
4,000
6,000
8,000
2006 2007 2008 2009 2008 (Jan-June)
2009 (Jan-June)
2010 (Jan-June)
6,279 6,489 6,301 6,040
3,153 2,887 3,313
Nu
mb
er
Year
Unscheduled Interruptions in Sarawak
0
500
1,000
1,500
2006 2007 2008 2009 2008 (Jan-June)
2009 (Jan-June)
2010 (Jan-June)
1,130 1,426 1,816 1,828
940 891 789
Nu
mb
er
Year
Scheduled Interruptions in Sarawak
02,0004,0006,0008,000
2006 2007 2008 2009 2008 (Jan-June)
2009 (Jan-June)
2010 (Jan-June)
7,4097,915 8,117 7,868
4,093 3,778 4,102
Nu
mb
er
Year
Total Interruptions in Sarawak
3.0 KEBOLEHARAPAN (RELIABILITY) BEKALAN ELEKTRIK RELIABILITY OF ELECTRICITY SUPPLY
Laporan Interim Separuh Tahun Pertama 2010 Interim Report for the First Half Year of 2010
Jabatan Kawal Selia Pembekalan dan Pasaran Elektrik Electricity Supply and Market Regulation Department - 18 -
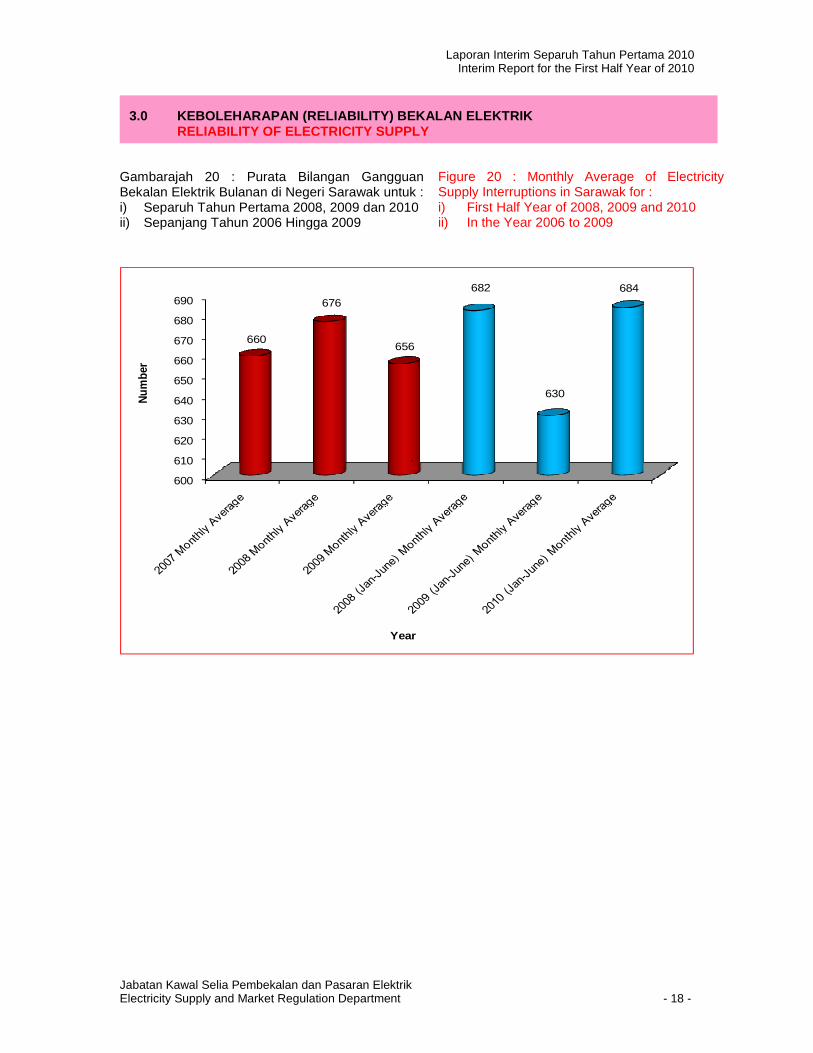
Gambarajah 20 : Purata Bilangan Gangguan Bekalan Elektrik Bulanan di Negeri Sarawak untuk : i) Separuh Tahun Pertama 2008, 2009 dan 2010 ii) Sepanjang Tahun 2006 Hingga 2009
Figure 20 : Monthly Average of Electricity Supply Interruptions in Sarawak for : i) First Half Year of 2008, 2009 and 2010 ii) In the Year 2006 to 2009
600
610
620
630
640
650
660
670
680
690
660
676
656
682
630
684
Num
ber
Year
`
3.0 KEBOLEHARAPAN (RELIABILITY) BEKALAN ELEKTRIK RELIABILITY OF ELECTRICITY SUPPLY
Laporan Interim Separuh Tahun Pertama 2010 Interim Report for the First Half Year of 2010
Jabatan Kawal Selia Pembekalan dan Pasaran Elektrik Electricity Supply and Market Regulation Department - 19 -
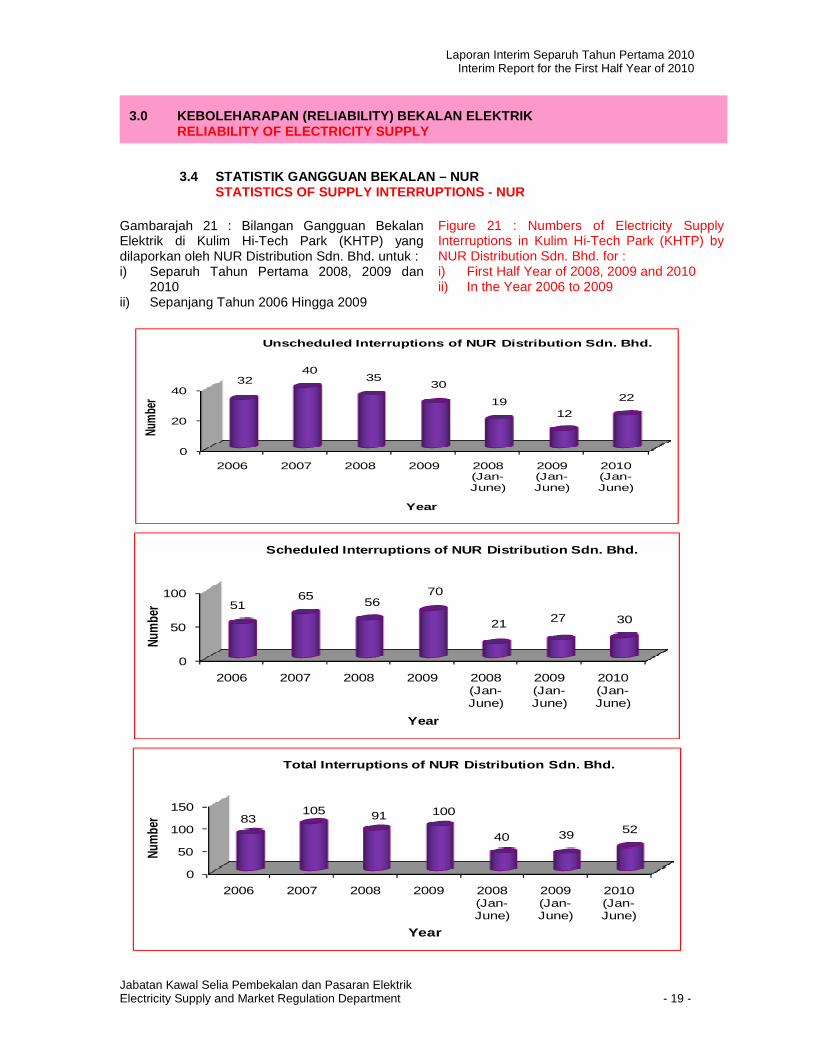
3.4 STATISTIK GANGGUAN BEKALAN – NUR STATISTICS OF SUPPLY INTERRUPTIONS - NUR
Gambarajah 21 : Bilangan Gangguan Bekalan Elektrik di Kulim Hi-Tech Park (KHTP) yang dilaporkan oleh NUR Distribution Sdn. Bhd. untuk : i) Separuh Tahun Pertama 2008, 2009 dan
2010 ii) Sepanjang Tahun 2006 Hingga 2009
Figure 21 : Numbers of Electricity Supply Interruptions in Kulim Hi-Tech Park (KHTP) by NUR Distribution Sdn. Bhd. for : i) First Half Year of 2008, 2009 and 2010 ii) In the Year 2006 to 2009
0
20
40
2006 2007 2008 2009 2008 (Jan-June)
2009 (Jan-June)
2010 (Jan-June)
3240
3530
1912
22
Num
ber
Year
Unscheduled Interruptions of NUR Distribution Sdn. Bhd.
0
50
100
2006 2007 2008 2009 2008 (Jan-June)
2009 (Jan-June)
2010 (Jan-June)
5165
5670
21 27 30
Num
ber
Year
Scheduled Interruptions of NUR Distribution Sdn. Bh d.
0
50
100
150
2006 2007 2008 2009 2008 (Jan-June)
2009 (Jan-June)
2010 (Jan-June)
83105 91 100
40 39 52
Num
ber
Year
Total Interruptions of NUR Distribution Sdn. Bhd.
3.0 KEBOLEHARAPAN (RELIABILITY) BEKALAN ELEKTRIK RELIABILITY OF ELECTRICITY SUPPLY
Laporan Interim Separuh Tahun Pertama 2010 Interim Report for the First Half Year of 2010
Jabatan Kawal Selia Pembekalan dan Pasaran Elektrik Electricity Supply and Market Regulation Department - 20 -
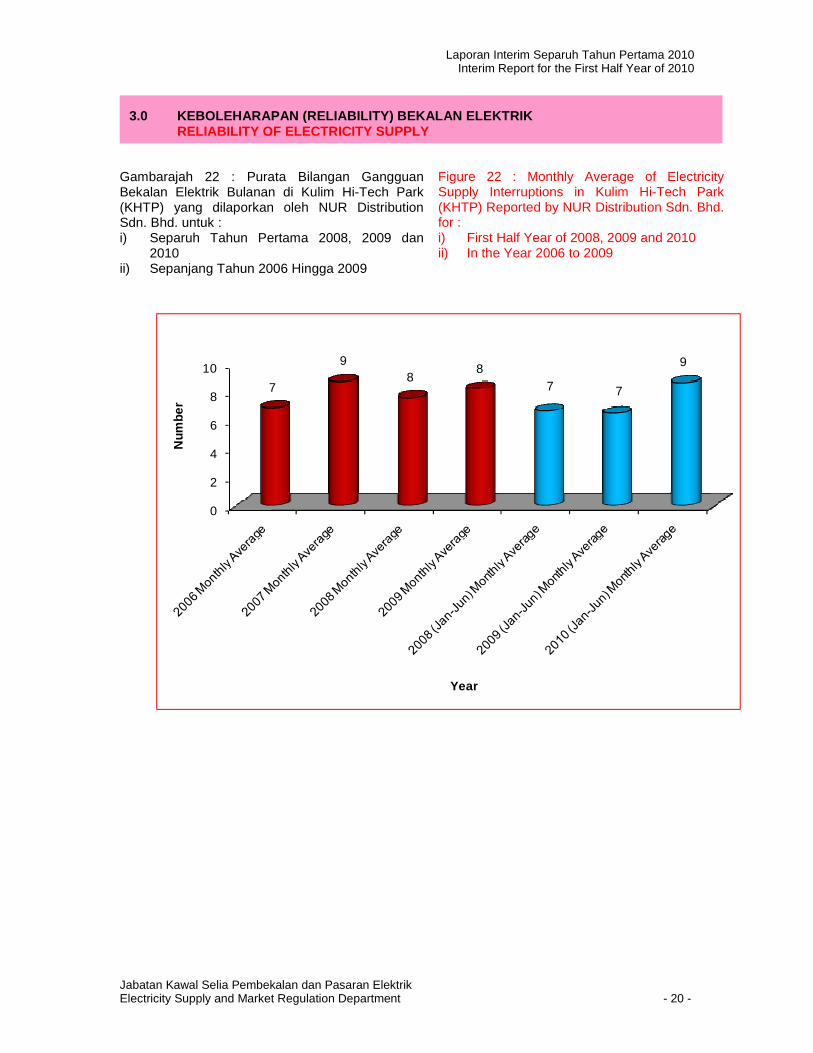
Gambarajah 22 : Purata Bilangan Gangguan Bekalan Elektrik Bulanan di Kulim Hi-Tech Park (KHTP) yang dilaporkan oleh NUR Distribution Sdn. Bhd. untuk : i) Separuh Tahun Pertama 2008, 2009 dan
2010 ii) Sepanjang Tahun 2006 Hingga 2009
Figure 22 : Monthly Average of Electricity Supply Interruptions in Kulim Hi-Tech Park (KHTP) Reported by NUR Distribution Sdn. Bhd. for : i) First Half Year of 2008, 2009 and 2010 ii) In the Year 2006 to 2009
0
2
4
6
8
10
7
98
87 7
9
Num
ber
Year
3.0 KEBOLEHARAPAN (RELIABILITY) BEKALAN ELEKTRIK RELIABILITY OF ELECTRICITY SUPPLY
Laporan Interim Separuh Tahun Pertama 2010 Interim Report for the First Half Year of 2010
Jabatan Kawal Selia Pembekalan dan Pasaran Elektrik Electricity Supply and Market Regulation Department - 21 -
3.5 SISTEM PENGAGIHAN TNB DISTRIBUTION SYSTEM OF TNB
3.5.1 SYSTEM AVERAGE INTERRUPTION DURATION INDEX (SAIDI)
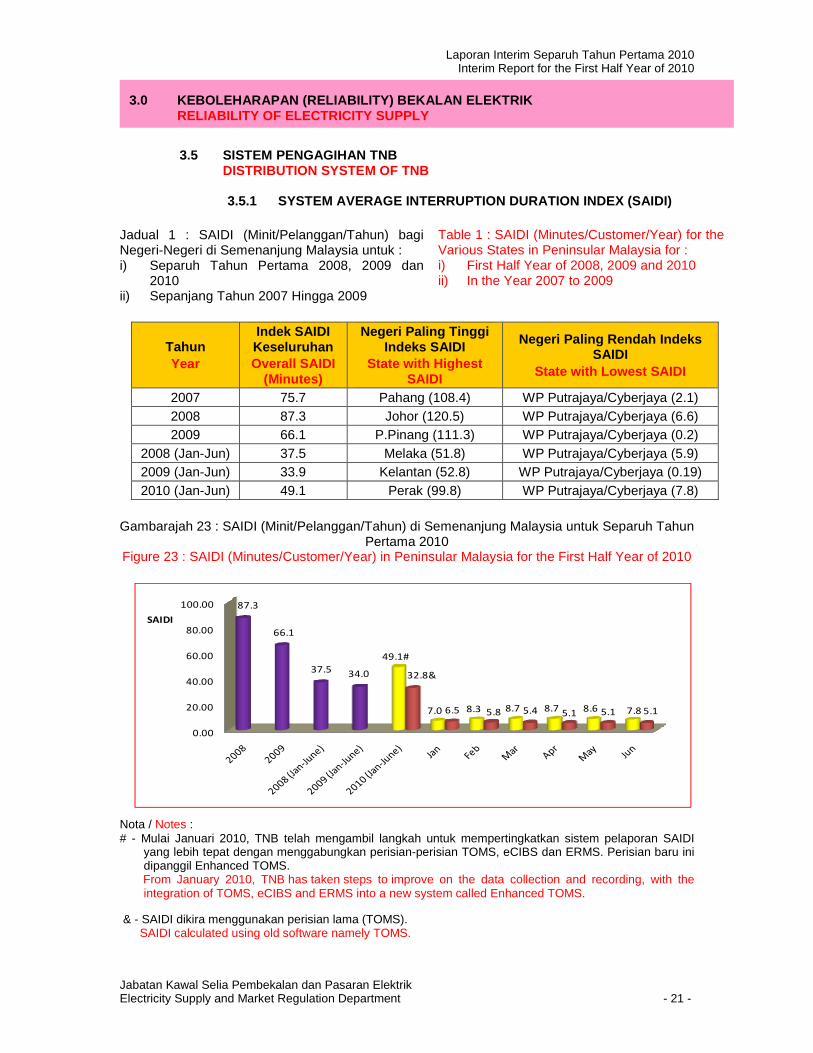
Jadual 1 : SAIDI (Minit/Pelanggan/Tahun) bagi Negeri-Negeri di Semenanjung Malaysia untuk : i) Separuh Tahun Pertama 2008, 2009 dan
2010 ii) Sepanjang Tahun 2007 Hingga 2009
Table 1 : SAIDI (Minutes/Customer/Year) for the Various States in Peninsular Malaysia for : i) First Half Year of 2008, 2009 and 2010 ii) In the Year 2007 to 2009
Tahun Year
Indek SAIDI Keseluruhan Overall SAIDI
(Minutes)
Negeri Paling Tinggi Indeks SAIDI
State with Highest SAIDI
Negeri Paling Rendah Indeks SAIDI
State with Lowest SAIDI
2007 75.7 Pahang (108.4) WP Putrajaya/Cyberjaya (2.1) 2008 87.3 Johor (120.5) WP Putrajaya/Cyberjaya (6.6) 2009 66.1 P.Pinang (111.3) WP Putrajaya/Cyberjaya (0.2)
2008 (Jan-Jun) 37.5 Melaka (51.8) WP Putrajaya/Cyberjaya (5.9) 2009 (Jan-Jun) 33.9 Kelantan (52.8) WP Putrajaya/Cyberjaya (0.19) 2010 (Jan-Jun) 49.1 Perak (99.8) WP Putrajaya/Cyberjaya (7.8)
Gambarajah 23 : SAIDI (Minit/Pelanggan/Tahun) di Semenanjung Malaysia untuk Separuh Tahun
Pertama 2010 Figure 23 : SAIDI (Minutes/Customer/Year) in Peninsular Malaysia for the First Half Year of 2010
0.00
20.00
40.00
60.00
80.00
100.00 87.3
66.1
37.534.0
49.1#
7.0 8.3 8.7 8.7 8.6 7.8
32.8&
6.5 5.8 5.4 5.1 5.1 5.1
SAIDI
Nota / Notes : # - Mulai Januari 2010, TNB telah mengambil langkah untuk mempertingkatkan sistem pelaporan SAIDI
yang lebih tepat dengan menggabungkan perisian-perisian TOMS, eCIBS dan ERMS. Perisian baru ini dipanggil Enhanced TOMS.
From January 2010, TNB has taken steps to improve on the data collection and recording, with the integration of TOMS, eCIBS and ERMS into a new system called Enhanced TOMS.
& - SAIDI dikira menggunakan perisian lama (TOMS). SAIDI calculated using old software namely TOMS.
3.0 KEBOLEHARAPAN (RELIABILITY) BEKALAN ELEKTRIK RELIABILITY OF ELECTRICITY SUPPLY
Laporan Interim Separuh Tahun Pertama 2010 Interim Report for the First Half Year of 2010
Jabatan Kawal Selia Pembekalan dan Pasaran Elektrik Electricity Supply and Market Regulation Department - 22 -
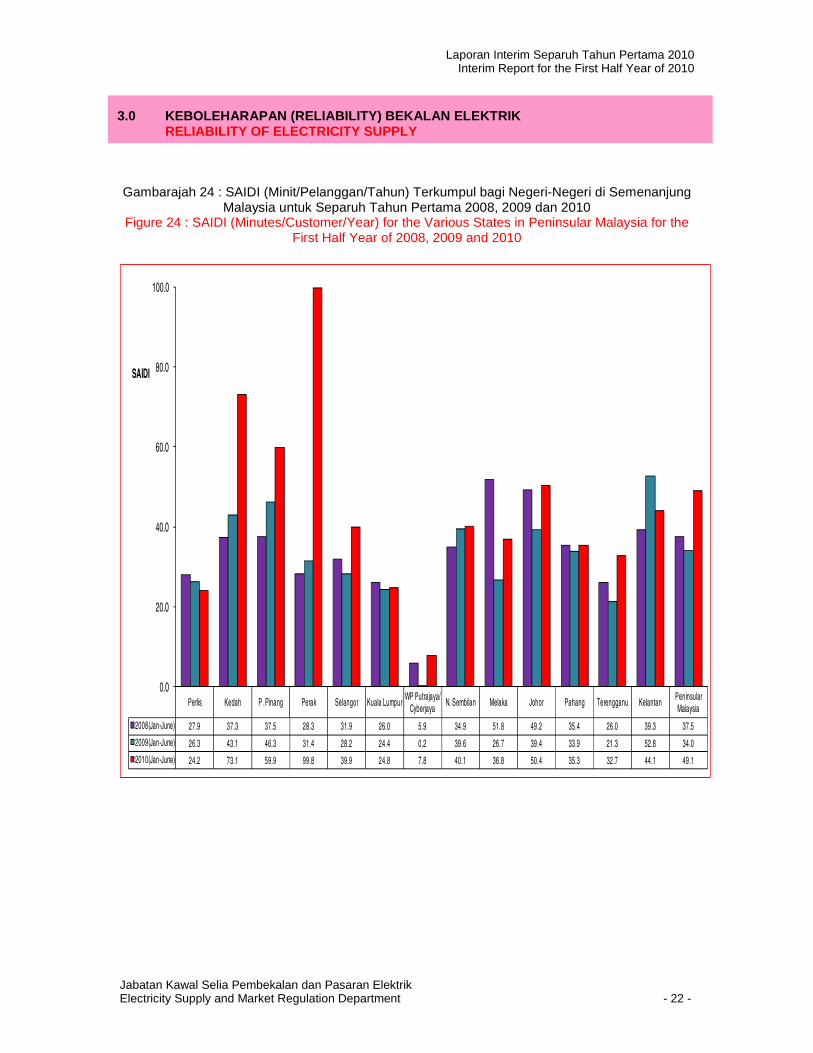
Gambarajah 24 : SAIDI (Minit/Pelanggan/Tahun) Terkumpul bagi Negeri-Negeri di Semenanjung
Malaysia untuk Separuh Tahun Pertama 2008, 2009 dan 2010 Figure 24 : SAIDI (Minutes/Customer/Year) for the Various States in Peninsular Malaysia for the
First Half Year of 2008, 2009 and 2010
Perlis Kedah P. Pinang Perak Selangor Kuala LumpurWP Putrajaya/
CyberjayaN. Sembilan Melaka Johor Pahang Terengganu Kelantan
Peninsular Malaysia
2008(Jan-June) 27.9 37.3 37.5 28.3 31.9 26.0 5.9 34.9 51.8 49.2 35.4 26.0 39.3 37.5
2009(Jan-June) 26.3 43.1 46.3 31.4 28.2 24.4 0.2 39.6 26.7 39.4 33.9 21.3 52.8 34.0
2010(Jan-June) 24.2 73.1 59.9 99.8 39.9 24.8 7.8 40.1 36.8 50.4 35.3 32.7 44.1 49.1
0.0
20.0
40.0
60.0
80.0
100.0
SAIDI
3.0 KEBOLEHARAPAN (RELIABILITY) BEKALAN ELEKTRIK RELIABILITY OF ELECTRICITY SUPPLY

Laporan Interim Separuh Tahun Pertama 2010 Interim Report for the First Half Year of 2010
Jabatan Kawal Selia Pembekalan dan Pasaran Elektrik Electricity Supply and Market Regulation Department - 23 -
3.5.2 SYSTEM AVERAGE INTERRUPTION FREQUENCY INDEX (SAIFI)
Gambarajah 25 : SAIFI (Bil. Gangguan/Pelanggan/Tahun) di Semenanjung Malaysia untuk Separuh Tahun Pertama 2010
Figure 25 : SAIFI (No. of Interruption/Customer/Year) in Peninsular Malaysia for the First Half Year of 2010
0.00
0.20
0.40
0.60
0.80
1.00 0.87
0.76
0.38 0.39
0.63
0.070.10 0.12 0.13 0.11 0.10
SAIFI
Nota / Note : SAIFI pada tahun 2010 dikira menggunakan perisian baru (Enhanced TOMS) SAIFI in 2010 is calculated using new software namely Enhanced TOMS
Gambarajah 25 : SAIFI (Bil. Gangguan/Pelanggan/Tahun) Terkumpul bagi Negeri-Negeri di Semenanjung Malaysia untuk Separuh Tahun Pertama 2008, 2009 dan 2010
Figure 25 : SAIFI (No. of Interruption/Customer/Year) for the Various States in Peninsular Malaysia for the First Half Year of 2008, 2009 and 2010
Perlis Kedah P. Pinang Perak SelangorWP Kuala Lumpur
WP Putrajaya/ Cyberjaya
N. Sembilan Melaka Johor Pahang Terengganu KelantanPeninsular Malaysia
2008(Jan-June) 0.36 0.37 0.57 0.49 0.32 0.21 0.02 0.30 0.45 0.40 0.36 0.44 0.45 0.38
2009(Jan-June) 0.29 0.48 0.67 0.44 0.28 0.27 0.000 0.33 0.43 0.34 0.36 0.44 0.73 0.39
2010(Jan-June) 0.03 0.97 0.74 1.21 0.44 0.26 0.04 0.42 0.40 0.66 0.41 0.69 0.87 0.63
0.00
0.20
0.40
0.60
0.80
1.00
1.20
1.40
SAIFI
3.0 KEBOLEHARAPAN (RELIABILITY) BEKALAN ELEKTRIK RELIABILITY OF ELECTRICITY SUPPLY
Laporan Interim Separuh Tahun Pertama 2010 Interim Report for the First Half Year of 2010
Jabatan Kawal Selia Pembekalan dan Pasaran Elektrik Electricity Supply and Market Regulation Department - 24 -
3.5.3 CUSTOMER AVERAGE INTERRUPTION DURATION INDEX (CAIDI)
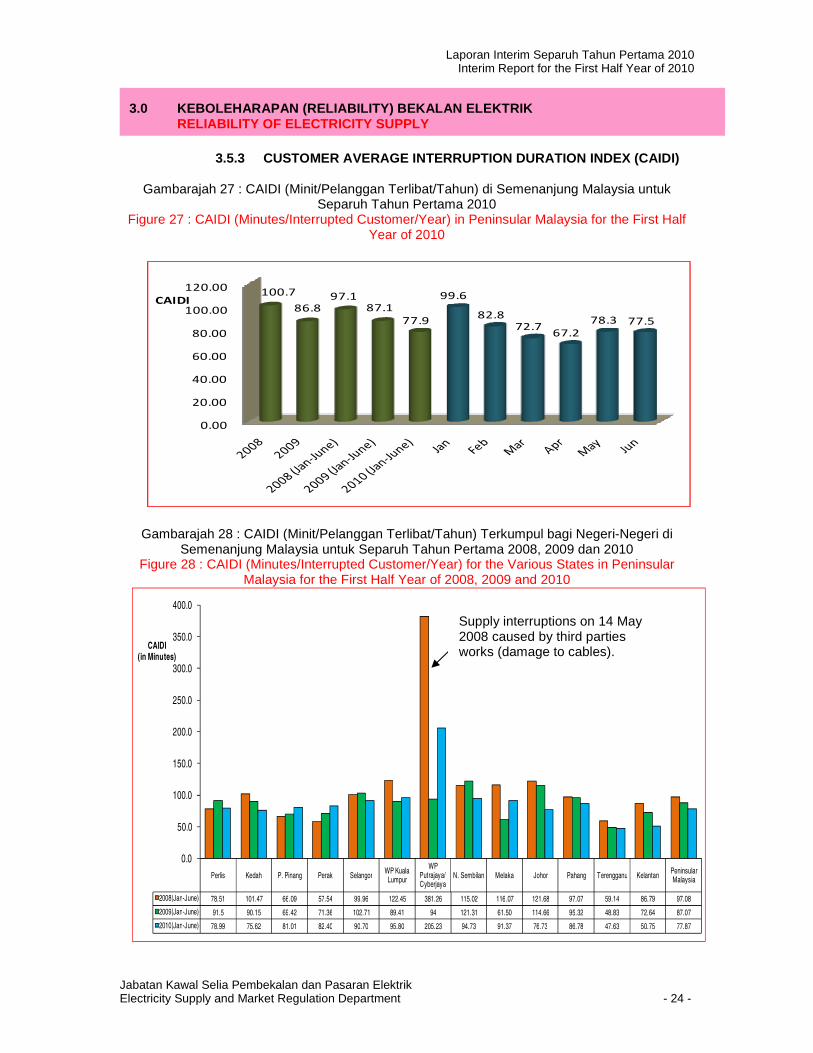
Gambarajah 27 : CAIDI (Minit/Pelanggan Terlibat/Tahun) di Semenanjung Malaysia untuk Separuh Tahun Pertama 2010
Figure 27 : CAIDI (Minutes/Interrupted Customer/Year) in Peninsular Malaysia for the First Half Year of 2010
0.00
20.00
40.00
60.00
80.00
100.00
120.00100.7
86.8
97.1
87.1
77.9
99.6
82.8
72.767.2
78.3 77.5
CAIDI
Gambarajah 28 : CAIDI (Minit/Pelanggan Terlibat/Tahun) Terkumpul bagi Negeri-Negeri di Semenanjung Malaysia untuk Separuh Tahun Pertama 2008, 2009 dan 2010
Figure 28 : CAIDI (Minutes/Interrupted Customer/Year) for the Various States in Peninsular Malaysia for the First Half Year of 2008, 2009 and 2010
Perlis Kedah P. Pinang Perak SelangorWP Kuala Lumpur
WP Putrajaya/ Cyberjaya
N. Sembilan Melaka Johor Pahang Terengganu KelantanPeninsular Malaysia
2008(Jan-June) 78.51 101.47 66.09 57.54 99.96 122.45 381.26 115.02 116.07 121.68 97.07 59.14 86.79 97.08
2009(Jan-June) 91.5 90.15 69.42 71.36 102.71 89.41 94 121.31 61.50 114.66 95.32 48.83 72.64 87.07
2010(Jan-June) 78.99 75.62 81.01 82.40 90.70 95.80 205.23 94.73 91.37 76.73 86.78 47.63 50.75 77.87
0.0
50.0
100.0
150.0
200.0
250.0
300.0
350.0
400.0
CAIDI (in Minutes)
3.0 KEBOLEHARAPAN (RELIABILITY) BEKALAN ELEKTRIK RELIABILITY OF ELECTRICITY SUPPLY
Supply interruptions on 14 May 2008 caused by third parties works (damage to cables).
Laporan Interim Separuh Tahun Pertama 2010 Interim Report for the First Half Year of 2010
Jabatan Kawal Selia Pembekalan dan Pasaran Elektrik Electricity Supply and Market Regulation Department - 25 -
3.6 SISTEM PENGAGIHAN SESB DISTRIBUTION SYSTEM OF SESB
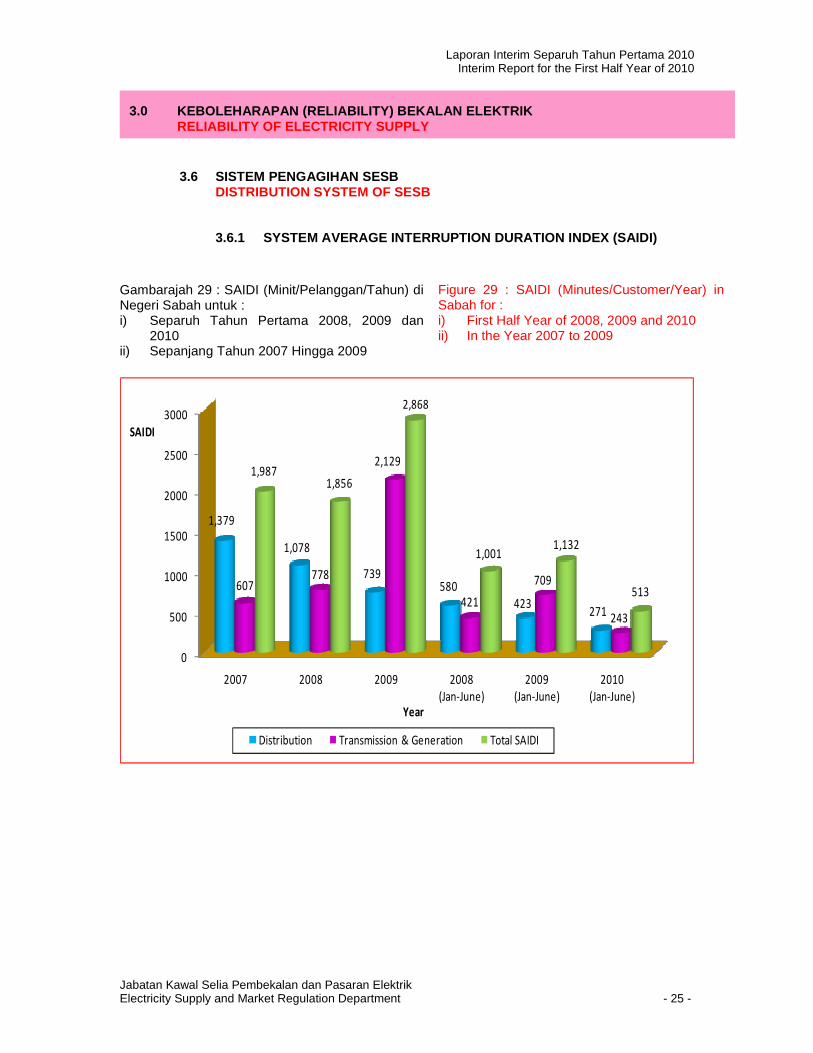
3.6.1 SYSTEM AVERAGE INTERRUPTION DURATION INDEX (SAIDI) Gambarajah 29 : SAIDI (Minit/Pelanggan/Tahun) di Negeri Sabah untuk : i) Separuh Tahun Pertama 2008, 2009 dan
2010 ii) Sepanjang Tahun 2007 Hingga 2009
Figure 29 : SAIDI (Minutes/Customer/Year) in Sabah for : i) First Half Year of 2008, 2009 and 2010 ii) In the Year 2007 to 2009
0
500
1000
1500
2000
2500
3000
2007 2008 2009 2008
(Jan-June)
2009
(Jan-June)
2010
(Jan-June)
1,379
1,078
739 580
423 271
607 778
2,129
421
709
243
1,987 1,856
2,868
1,001 1,132
513
SAIDI
Year
Distribution Transmission & Generation Total SAIDI
3.0 KEBOLEHARAPAN (RELIABILITY) BEKALAN ELEKTRIK RELIABILITY OF ELECTRICITY SUPPLY
Laporan Interim Separuh Tahun Pertama 2010 Interim Report for the First Half Year of 2010
Jabatan Kawal Selia Pembekalan dan Pasaran Elektrik Electricity Supply and Market Regulation Department - 26 -
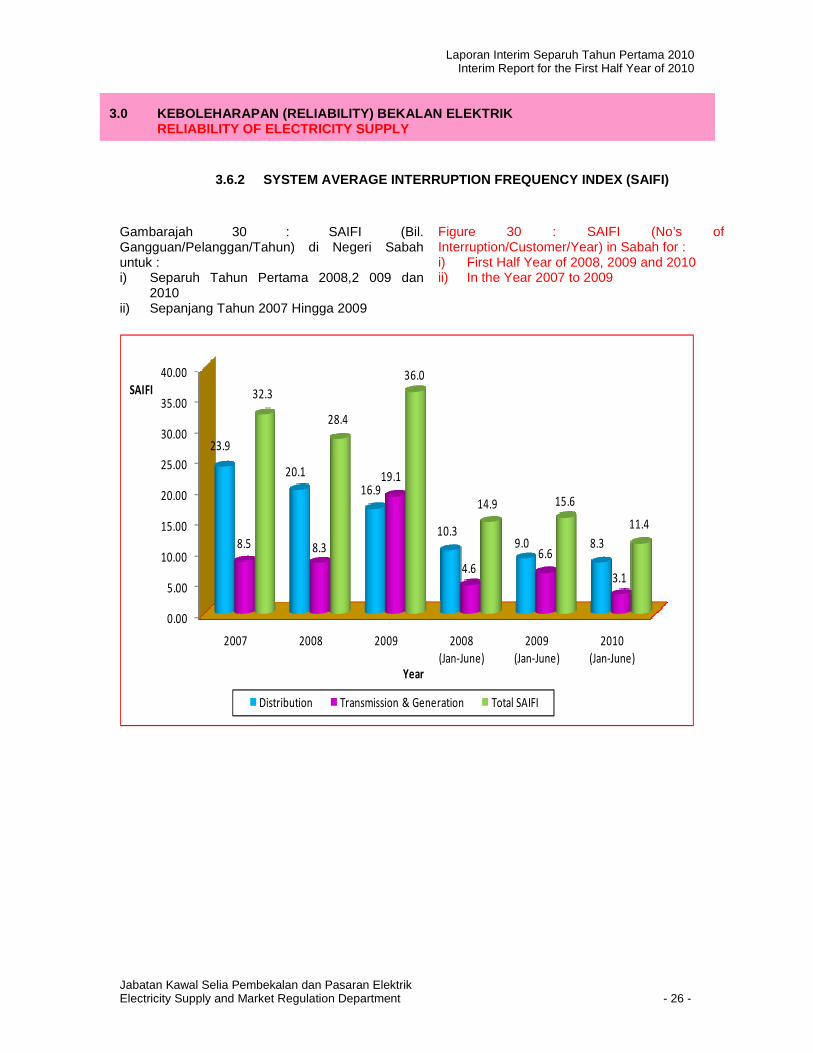
3.6.2 SYSTEM AVERAGE INTERRUPTION FREQUENCY INDEX (SAIFI) Gambarajah 30 : SAIFI (Bil. Gangguan/Pelanggan/Tahun) di Negeri Sabah untuk : i) Separuh Tahun Pertama 2008,2 009 dan
2010 ii) Sepanjang Tahun 2007 Hingga 2009
Figure 30 : SAIFI (No’s of Interruption/Customer/Year) in Sabah for : i) First Half Year of 2008, 2009 and 2010 ii) In the Year 2007 to 2009
0.00
5.00
10.00
15.00
20.00
25.00
30.00
35.00
40.00
2007 2008 2009 2008
(Jan-June)
2009
(Jan-June)
2010
(Jan-June)
23.9
20.1
16.9
10.39.0 8.38.5 8.3
19.1
4.66.6
3.1
32.3
28.4
36.0
14.9 15.6
11.4
SAIFI
Year
Distribution Transmission & Generation Total SAIFI
3.0 KEBOLEHARAPAN (RELIABILITY) BEKALAN ELEKTRIK RELIABILITY OF ELECTRICITY SUPPLY
Laporan Interim Separuh Tahun Pertama 2010 Interim Report for the First Half Year of 2010
Jabatan Kawal Selia Pembekalan dan Pasaran Elektrik Electricity Supply and Market Regulation Department - 27 -
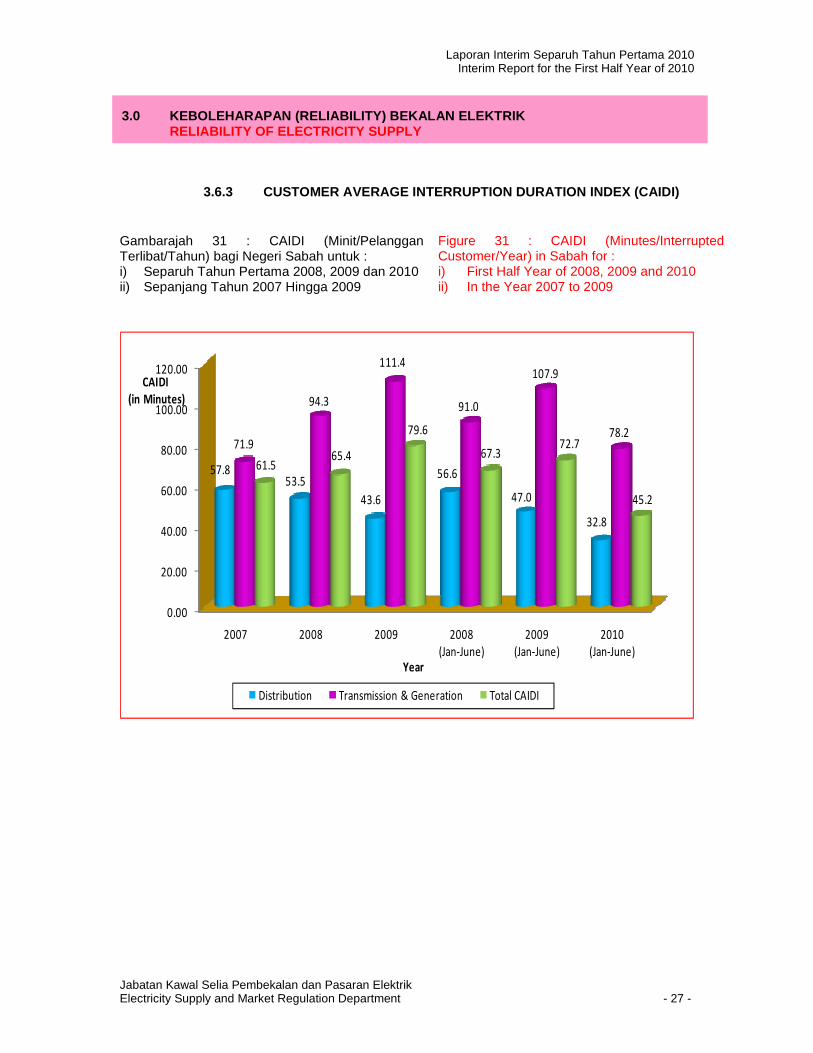
3.6.3 CUSTOMER AVERAGE INTERRUPTION DURATION INDEX (CAIDI)
Gambarajah 31 : CAIDI (Minit/Pelanggan Terlibat/Tahun) bagi Negeri Sabah untuk : i) Separuh Tahun Pertama 2008, 2009 dan 2010 ii) Sepanjang Tahun 2007 Hingga 2009
Figure 31 : CAIDI (Minutes/Interrupted Customer/Year) in Sabah for : i) First Half Year of 2008, 2009 and 2010 ii) In the Year 2007 to 2009
0.00
20.00
40.00
60.00
80.00
100.00
120.00
2007 2008 2009 2008
(Jan-June)
2009
(Jan-June)
2010
(Jan-June)
57.853.5
43.6
56.6
47.0
32.8
71.9
94.3
111.4
91.0
107.9
78.2
61.565.4
79.6
67.372.7
45.2
CAIDI
(in Minutes)
Year
Distribution Transmission & Generation Total CAIDI
3.0 KEBOLEHARAPAN (RELIABILITY) BEKALAN ELEKTRIK RELIABILITY OF ELECTRICITY SUPPLY
Laporan Interim Separuh Tahun Pertama 2010 Interim Report for the First Half Year of 2010
Jabatan Kawal Selia Pembekalan dan Pasaran Elektrik Electricity Supply and Market Regulation Department - 28 -
3.7 SISTEM PENGAGIHAN SEB DISTRIBUTION SYSTEM OF SEB
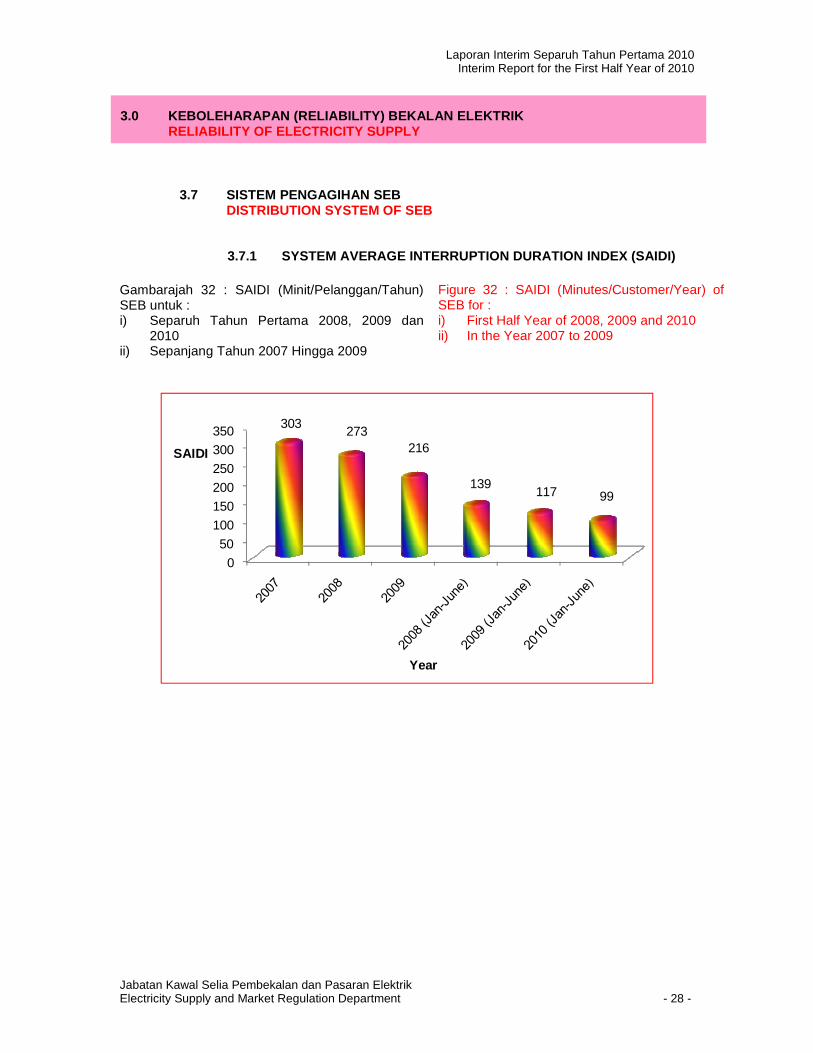
3.7.1 SYSTEM AVERAGE INTERRUPTION DURATION INDEX (SAIDI) Gambarajah 32 : SAIDI (Minit/Pelanggan/Tahun) SEB untuk : i) Separuh Tahun Pertama 2008, 2009 dan
2010 ii) Sepanjang Tahun 2007 Hingga 2009
Figure 32 : SAIDI (Minutes/Customer/Year) of SEB for : i) First Half Year of 2008, 2009 and 2010 ii) In the Year 2007 to 2009
0
50
100
150
200
250
300350
303273
216
139117 99
SAIDI
Year
3.0 KEBOLEHARAPAN (RELIABILITY) BEKALAN ELEKTRIK RELIABILITY OF ELECTRICITY SUPPLY
Laporan Interim Separuh Tahun Pertama 2010 Interim Report for the First Half Year of 2010
Jabatan Kawal Selia Pembekalan dan Pasaran Elektrik Electricity Supply and Market Regulation Department - 29 -
3.8 SISTEM PENGAGIHAN NUR DISTRIBUTION SYSTEM OF NUR
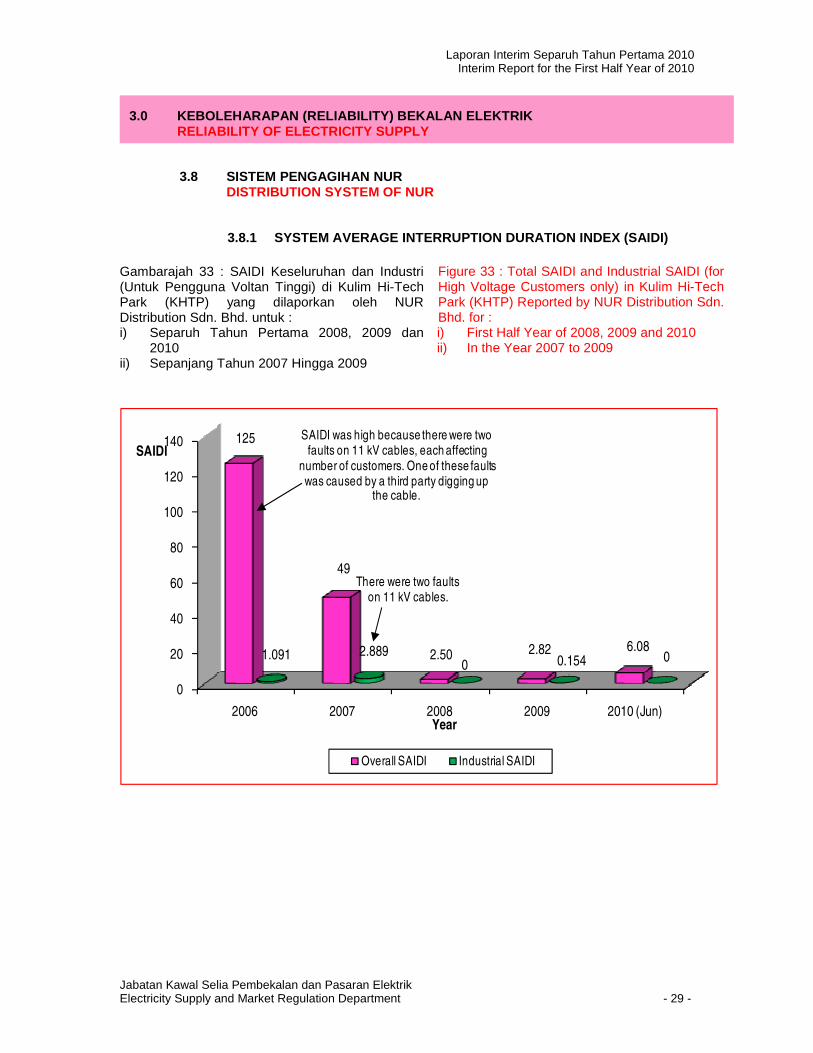
3.8.1 SYSTEM AVERAGE INTERRUPTION DURATION INDEX (SAIDI) Gambarajah 33 : SAIDI Keseluruhan dan Industri (Untuk Pengguna Voltan Tinggi) di Kulim Hi-Tech Park (KHTP) yang dilaporkan oleh NUR Distribution Sdn. Bhd. untuk : i) Separuh Tahun Pertama 2008, 2009 dan
2010 ii) Sepanjang Tahun 2007 Hingga 2009
Figure 33 : Total SAIDI and Industrial SAIDI (for High Voltage Customers only) in Kulim Hi-Tech Park (KHTP) Reported by NUR Distribution Sdn. Bhd. for : i) First Half Year of 2008, 2009 and 2010 ii) In the Year 2007 to 2009
0
20
40
60
80
100
120
140
2006 2007 2008 2009 2010 (Jun)
125
49
2.50 2.82 6.081.091 2.889
0 0.154 0
SAIDI
Year
Overall SAIDI Industrial SAIDI
SAIDI was high because there were two faults on 11 kV cables, each affecting
number of customers. One of these faults was caused by a third party digging up
the cable.
There were two faults on 11 kV cables.
3.0 KEBOLEHARAPAN (RELIABILITY) BEKALAN ELEKTRIK RELIABILITY OF ELECTRICITY SUPPLY
Laporan Interim Separuh Tahun Pertama 2010 Interim Report for the First Half Year of 2010
Jabatan Kawal Selia Pembekalan dan Pasaran Elektrik Electricity Supply and Market Regulation Department - 30 -
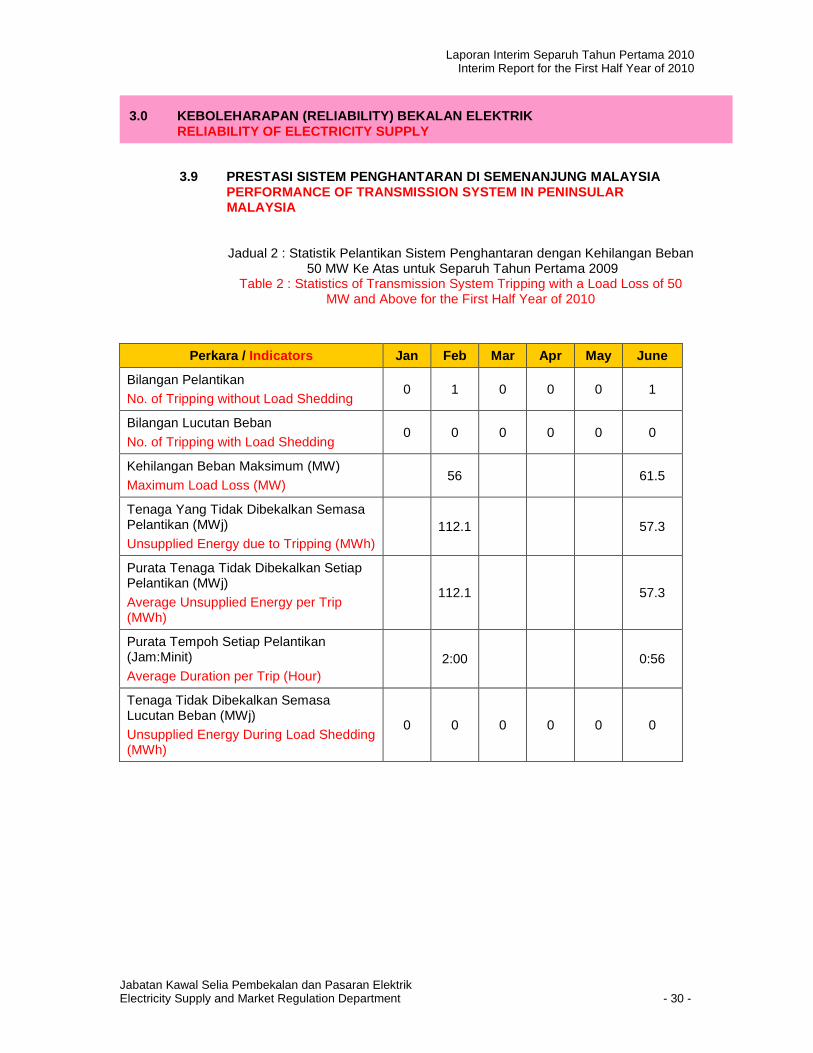
3.9 PRESTASI SISTEM PENGHANTARAN DI SEMENANJUNG MALAYSIA PERFORMANCE OF TRANSMISSION SYSTEM IN PENINSULAR MALAYSIA
Jadual 2 : Statistik Pelantikan Sistem Penghantaran dengan Kehilangan Beban 50 MW Ke Atas untuk Separuh Tahun Pertama 2009
Table 2 : Statistics of Transmission System Tripping with a Load Loss of 50 MW and Above for the First Half Year of 2010
Perkara / Indicators Jan Feb Mar Apr May June
Bilangan Pelantikan No. of Tripping without Load Shedding
0 1 0 0 0 1
Bilangan Lucutan Beban
No. of Tripping with Load Shedding 0 0 0 0 0 0
Kehilangan Beban Maksimum (MW)
Maximum Load Loss (MW) 56 61.5
Tenaga Yang Tidak Dibekalkan Semasa Pelantikan (MWj)
Unsupplied Energy due to Tripping (MWh) 112.1 57.3
Purata Tenaga Tidak Dibekalkan Setiap Pelantikan (MWj)
Average Unsupplied Energy per Trip (MWh)
112.1 57.3
Purata Tempoh Setiap Pelantikan (Jam:Minit)
Average Duration per Trip (Hour) 2:00 0:56
Tenaga Tidak Dibekalkan Semasa Lucutan Beban (MWj) Unsupplied Energy During Load Shedding (MWh)
0 0 0 0 0 0
3.0 KEBOLEHARAPAN (RELIABILITY) BEKALAN ELEKTRIK RELIABILITY OF ELECTRICITY SUPPLY
Laporan Interim Separuh Tahun Pertama 2010 Interim Report for the First Half Year of 2010
Jabatan Kawal Selia Pembekalan dan Pasaran Elektrik Electricity Supply and Market Regulation Department - 31 -
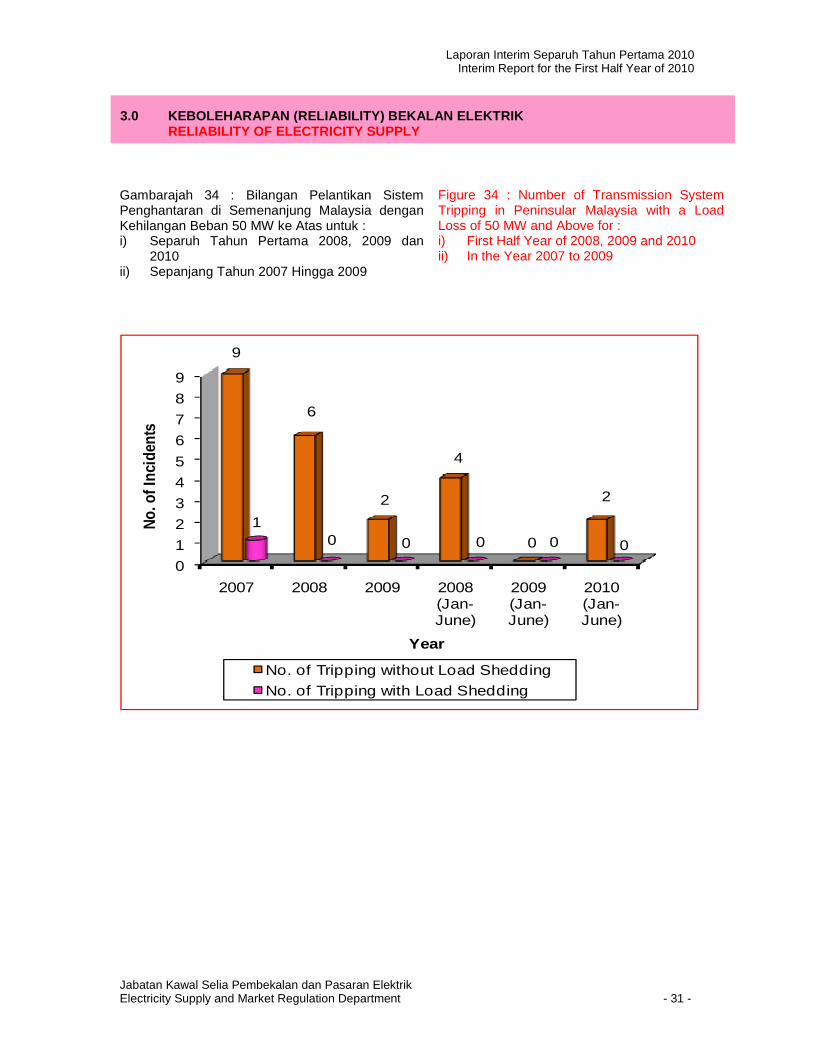
Gambarajah 34 : Bilangan Pelantikan Sistem Penghantaran di Semenanjung Malaysia dengan Kehilangan Beban 50 MW ke Atas untuk : i) Separuh Tahun Pertama 2008, 2009 dan
2010 ii) Sepanjang Tahun 2007 Hingga 2009
Figure 34 : Number of Transmission System Tripping in Peninsular Malaysia with a Load Loss of 50 MW and Above for : i) First Half Year of 2008, 2009 and 2010 ii) In the Year 2007 to 2009
0
1
2
3
4
5
6
7
8
9
2007 2008 2009 2008 (Jan-June)
2009 (Jan-June)
2010 (Jan-June)
9
6
2
4
0
2
10 0 0 0 0
No. o
f Inc
iden
ts
Year
No. of Tripping without Load Shedding
No. of Tripping with Load Shedding
3.0 KEBOLEHARAPAN (RELIABILITY) BEKALAN ELEKTRIK RELIABILITY OF ELECTRICITY SUPPLY
Laporan Interim Separuh Tahun Pertama 2010 Interim Report for the First Half Year of 2010
Jabatan Kawal Selia Pembekalan dan Pasaran Elektrik Electricity Supply and Market Regulation Department - 32 -
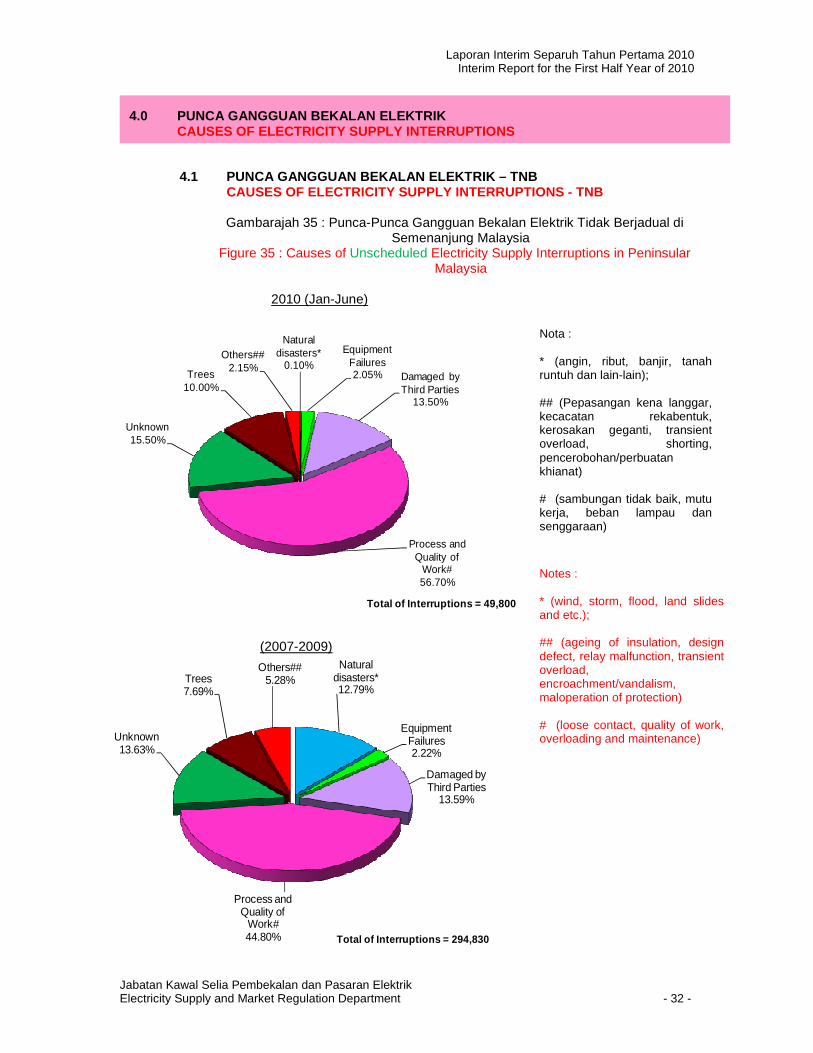
4.1 PUNCA GANGGUAN BEKALAN ELEKTRIK – TNB CAUSES OF ELECTRICITY SUPPLY INTERRUPTIONS - TNB
Gambarajah 35 : Punca-Punca Gangguan Bekalan Elektrik Tidak Berjadual di
Semenanjung Malaysia Figure 35 : Causes of Unscheduled Electricity Supply Interruptions in Peninsular
Malaysia
2010 (Jan-June)
Natural disasters*
0.10%
Equipment Failures2.05% Damaged by
Third Parties13.50%
Process and Quality of
Work#56.70%
Unknown15.50%
Trees10.00%
Others##2.15%
Total of Interruptions = 49,800
(2007-2009)
Natural disasters* 12.79%
Equipment Failures2.22%
Damaged by Third Parties
13.59%
Process and Quality of
Work#44.80%
Unknown13.63%
Trees7.69%
Others##5.28%
Total of Interruptions = 294,830
4.0 PUNCA GANGGUAN BEKALAN ELEKTRIK CAUSES OF ELECTRICITY SUPPLY INTERRUPTIONS
Nota : * (angin, ribut, banjir, tanah runtuh dan lain-lain); ## (Pepasangan kena langgar, kecacatan rekabentuk, kerosakan geganti, transient overload, shorting, pencerobohan/perbuatan khianat) # (sambungan tidak baik, mutu kerja, beban lampau dan senggaraan)
Notes : * (wind, storm, flood, land slides and etc.); ## (ageing of insulation, design defect, relay malfunction, transient overload, encroachment/vandalism, maloperation of protection) # (loose contact, quality of work, overloading and maintenance)
Laporan Interim Separuh Tahun Pertama 2010 Interim Report for the First Half Year of 2010
Jabatan Kawal Selia Pembekalan dan Pasaran Elektrik Electricity Supply and Market Regulation Department - 33 -
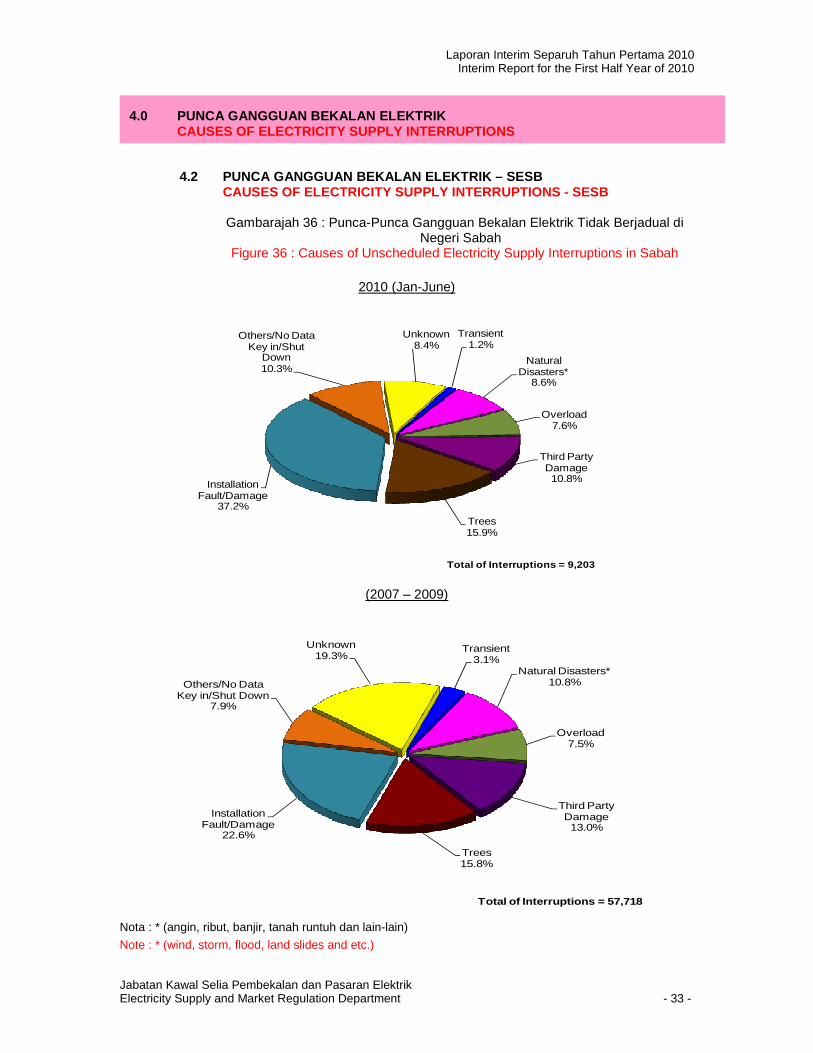
4.2 PUNCA GANGGUAN BEKALAN ELEKTRIK – SESB CAUSES OF ELECTRICITY SUPPLY INTERRUPTIONS - SESB
Gambarajah 36 : Punca-Punca Gangguan Bekalan Elektrik Tidak Berjadual di
Negeri Sabah Figure 36 : Causes of Unscheduled Electricity Supply Interruptions in Sabah
2010 (Jan-June)
Natural Disasters*
8.6%
Overload7.6%
Third Party Damage10.8%
Trees15.9%
Installation Fault/Damage
37.2%
Others/No Data Key in/Shut
Down10.3%
Unknown8.4%
Transient1.2%
Total of Interruptions = 9,203
(2007 – 2009)
Natural Disasters*10.8%
Overload7.5%
Third Party Damage13.0%
Trees15.8%
Installation Fault/Damage
22.6%
Others/No Data Key in/Shut Down
7.9%
Unknown19.3%
Transient3.1%
Total of Interruptions = 57,718
Nota : * (angin, ribut, banjir, tanah runtuh dan lain-lain)
Note : * (wind, storm, flood, land slides and etc.)
4.0 PUNCA GANGGUAN BEKALAN ELEKTRIK CAUSES OF ELECTRICITY SUPPLY INTER RUPTIONS
Laporan Interim Separuh Tahun Pertama 2010 Interim Report for the First Half Year of 2010
Jabatan Kawal Selia Pembekalan dan Pasaran Elektrik Electricity Supply and Market Regulation Department - 34 -
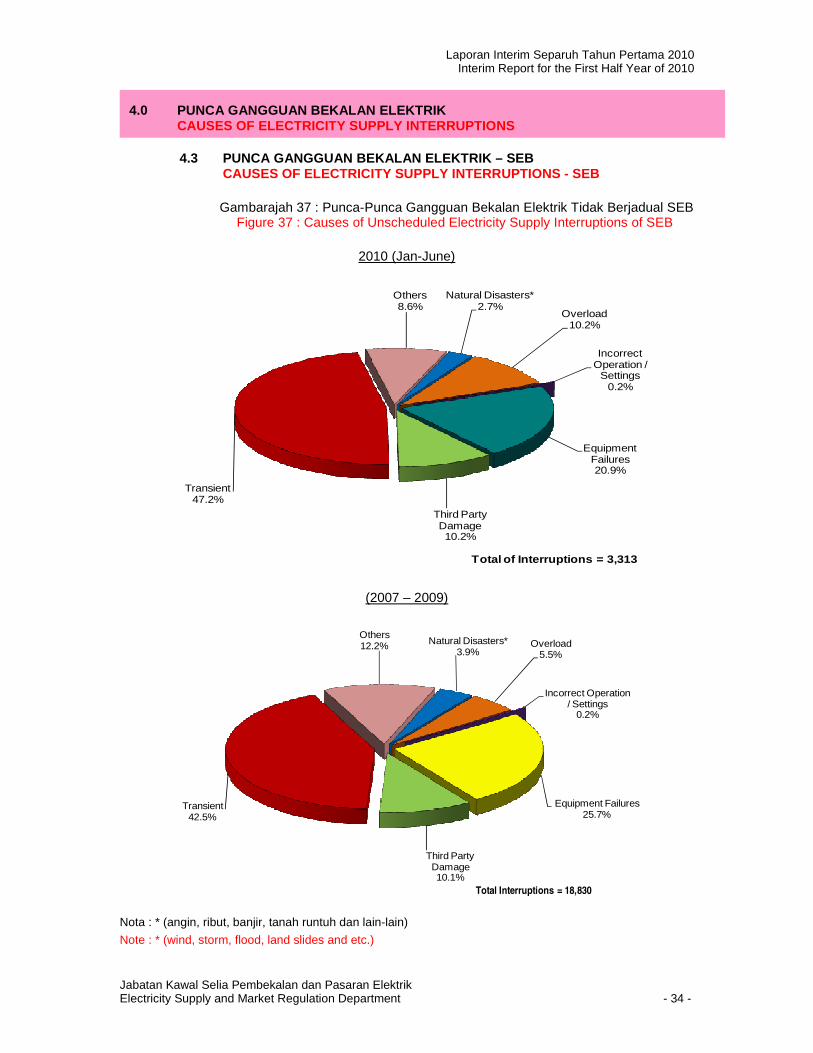
4.3 PUNCA GANGGUAN BEKALAN ELEKTRIK – SEB CAUSES OF ELECTRICITY SUPPLY INTERRUPTIONS - SEB
Gambarajah 37 : Punca-Punca Gangguan Bekalan Elektrik Tidak Berjadual SEB
Figure 37 : Causes of Unscheduled Electricity Supply Interruptions of SEB
2010 (Jan-June)
Natural Disasters* 2.7%
Overload10.2%
Incorrect Operation /
Settings0.2%
Equipment Failures20.9%
Third Party Damage10.2%
Transient47.2%
Others8.6%
Total of Interruptions = 3,313
(2007 – 2009)
Natural Disasters* 3.9%
Overload5.5%
Incorrect Operation / Settings
0.2%
Equipment Failures25.7%
Third Party Damage10.1%
Transient42.5%
Others12.2%
Total Interruptions = 18,830
Nota : * (angin, ribut, banjir, tanah runtuh dan lain-lain)
Note : * (wind, storm, flood, land slides and etc.)
4.0 PUNCA GANGGUAN BEKALAN ELEKTRIK CAUSES OF ELECTRICITY SUPPLY INTERRUPTIONS

Laporan Interim Separuh Tahun Pertama 2010 Interim Report for the First Half Year of 2010
Jabatan Kawal Selia Pembekalan dan Pasaran Elektrik Electricity Supply and Market Regulation Department - 35 -
4.4 PUNCA GANGGUAN BEKALAN ELEKTRIK – NUR CAUSES OF ELECTRICITY SUPPLY INTERRUPTION - NUR
Gambarajah 38 : Punca-Punca Gangguan Bekalan Elektrik Tidak Berjadual NUR
Distribution Figure 38 : Causes of Unscheduled Electricity Supply Interruptions of NUR
Distribution
2010 (Jan-June)
Equipment Failure22.7%
Overload31.8%
Inferior Workmanship
31.8%
Third Party Damage13.6%
Total Interruptions = 22
(2007-2009)
Natural Disasters* 5.7%
Equipment Failure31.4%
Overload13.3%
Incorrect Operation/Settings1.87%
Inferior Workmanship
28.6%
Third Party Damage19.0% Others
1.0%
Total Interruptions = 105
Nota : * (angin, ribut, banjir, tanah runtuh dan lain-lain)
Note : * (wind, storm. Flood, land slides and etc.)
4.0 PUNCA GANGGUAN BEKALAN ELEKTRIK CAUSES OF ELECTRICITY SUPPLY INTERRUPTIONS
Laporan Interim Separuh Tahun Pertama 2010 Interim Report for the First Half Year of 2010
Jabatan Kawal Selia Pembekalan dan Pasaran Elektrik Electricity Supply and Market Regulation Department - 36 -
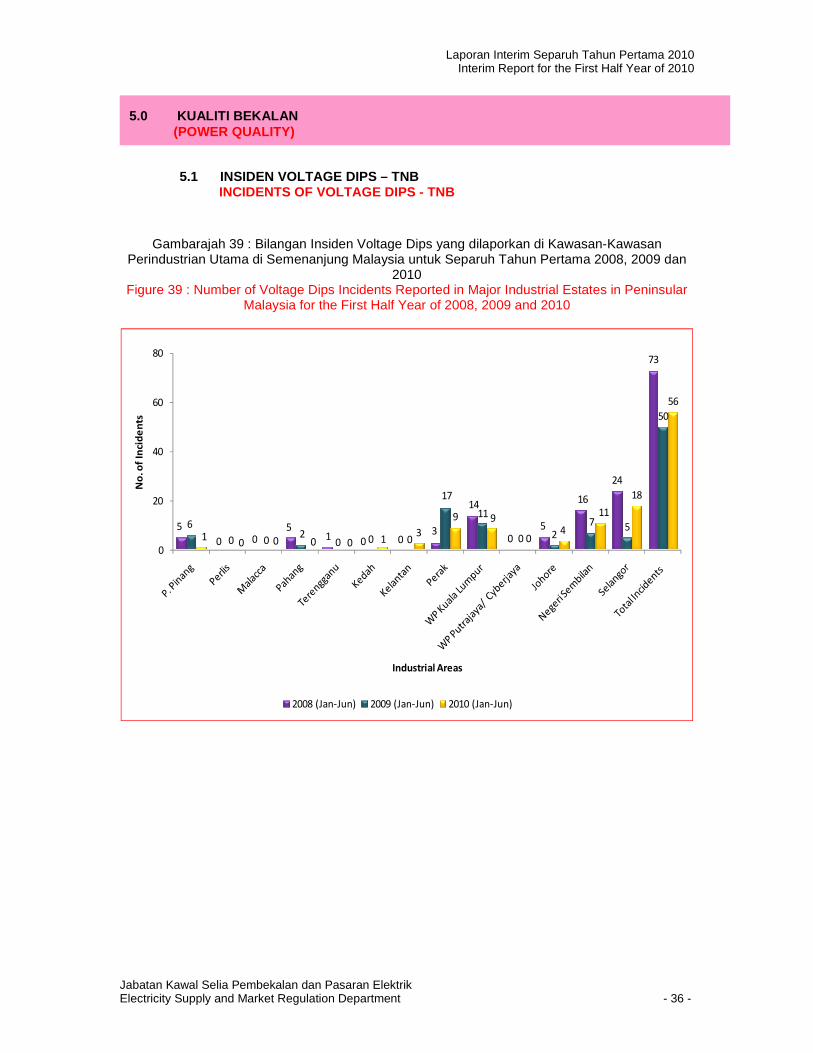
5.1 INSIDEN VOLTAGE DIPS – TNB INCIDENTS OF VOLTAGE DIPS - TNB
Gambarajah 39 : Bilangan Insiden Voltage Dips yang dilaporkan di Kawasan-Kawasan Perindustrian Utama di Semenanjung Malaysia untuk Separuh Tahun Pertama 2008, 2009 dan
2010 Figure 39 : Number of Voltage Dips Incidents Reported in Major Industrial Estates in Peninsular
Malaysia for the First Half Year of 2008, 2009 and 2010
5
0 05
10 0
3
14
0
5
16
24
73
6
0 02
0 0 0
17
11
0 2
75
50
10 0 0 0 1
3
9 9
04
11
18
56
0
20
40
60
80
No
. o
f I
ncid
en
ts
Industrial Areas
2008 (Jan-Jun) 2009 (Jan-Jun) 2010 (Jan-Jun)
5.0 KUALITI BEKALAN (POWER QUALITY)
Laporan Interim Separuh Tahun Pertama 2010 Interim Report for the First Half Year of 2010
Jabatan Kawal Selia Pembekalan dan Pasaran Elektrik Electricity Supply and Market Regulation Department - 37 -
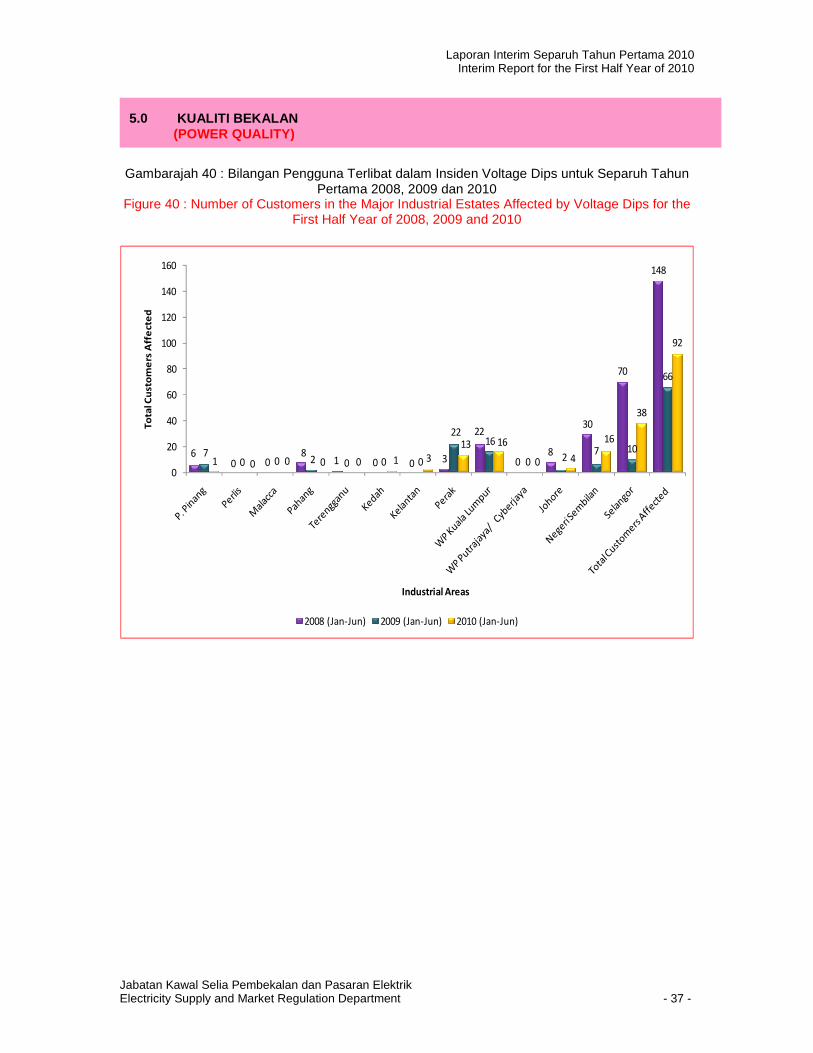
Gambarajah 40 : Bilangan Pengguna Terlibat dalam Insiden Voltage Dips untuk Separuh Tahun Pertama 2008, 2009 dan 2010
Figure 40 : Number of Customers in the Major Industrial Estates Affected by Voltage Dips for the First Half Year of 2008, 2009 and 2010
60 0
81 0 0 3
22
08
30
70
148
70 0 2 0 0 0
2216
0 27 10
66
1 0 0 0 0 1 3
13 16
0 4
16
38
92
0
20
40
60
80
100
120
140
160
To
ta
l C
usto
me
rs A
ffe
cte
d
Industrial Areas
2008 (Jan-Jun) 2009 (Jan-Jun) 2010 (Jan-Jun)
5.0 KUALITI BEKALAN (POWER QUALITY)
Laporan Interim Separuh Tahun Pertama 2010 Interim Report for the First Half Year of 2010
Jabatan Kawal Selia Pembekalan dan Pasaran Elektrik Electricity Supply and Market Regulation Department - 38 -
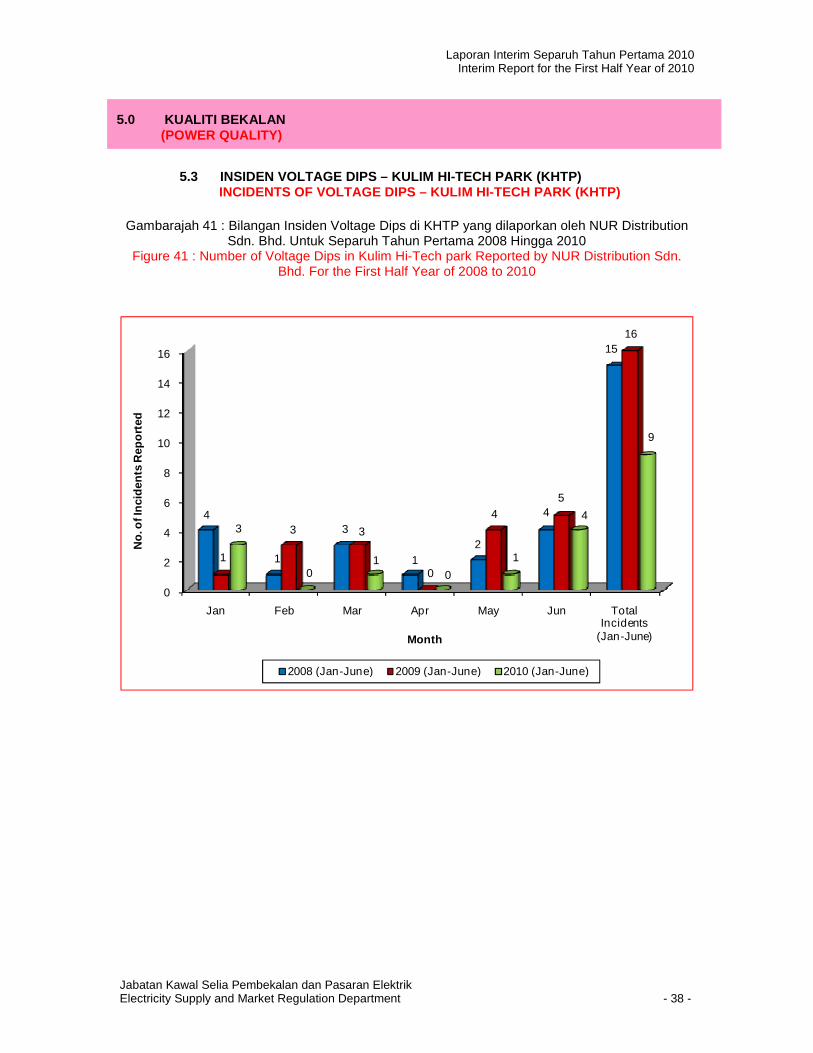
5.3 INSIDEN VOLTAGE DIPS – KULIM HI-TECH PARK (KHTP) INCIDENTS OF VOLTAGE DIPS – KULIM HI-TECH PARK (KH TP)
Gambarajah 41 : Bilangan Insiden Voltage Dips di KHTP yang dilaporkan oleh NUR Distribution
Sdn. Bhd. Untuk Separuh Tahun Pertama 2008 Hingga 2010 Figure 41 : Number of Voltage Dips in Kulim Hi-Tech park Reported by NUR Distribution Sdn.
Bhd. For the First Half Year of 2008 to 2010
0
2
4
6
8
10
12
14
16
Jan Feb Mar Apr May Jun Total Incidents
(Jan-June)
4
1
3
12
4
15
1
3 3
0
45
16
3
01
0
1
4
9
No.
of I
ncid
ents
Rep
orte
d
Month
2008 (Jan-June) 2009 (Jan-June) 2010 (Jan-June)
5.0 KUALITI BEKALAN (POWER QUALITY)
Laporan Interim Separuh Tahun Pertama 2010 Interim Report for the First Half Year of 2010
Jabatan Kawal Selia Pembekalan dan Pasaran Elektrik Electricity Supply and Market Regulation Department - 39 -
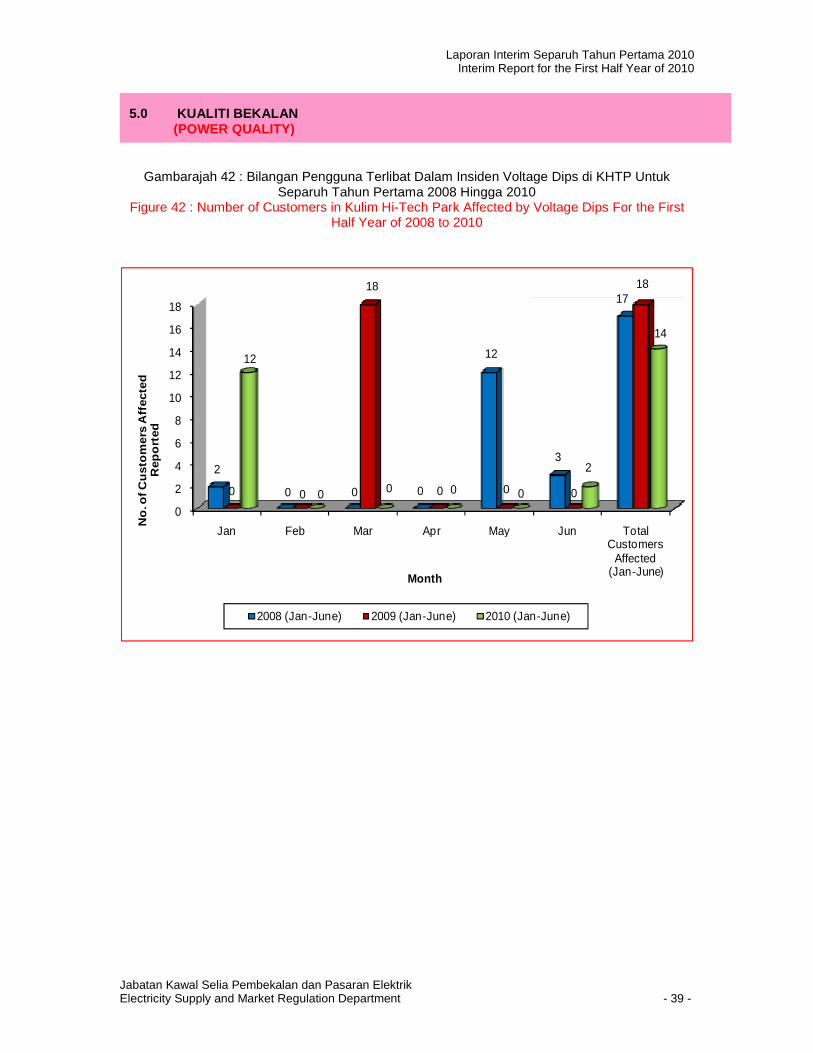
Gambarajah 42 : Bilangan Pengguna Terlibat Dalam Insiden Voltage Dips di KHTP Untuk Separuh Tahun Pertama 2008 Hingga 2010
Figure 42 : Number of Customers in Kulim Hi-Tech Park Affected by Voltage Dips For the First Half Year of 2008 to 2010
0
2
4
6
8
10
12
14
16
18
Jan Feb Mar Apr May Jun Total Customers
Affected (Jan-June)
2
0 0 0
12
3
17
0 0
18
0 0 0
18
12
0 0 0 0
2
14
No
. of C
ust
om
ers
Aff
ecte
d
Rep
ort
ed
Month
2008 (Jan-June) 2009 (Jan-June) 2010 (Jan-June)
5.0 KUALITI BEKALAN (POWER QUALITY)
Laporan Interim Separuh Tahun Pertama 2010 Interim Report for the First Half Year of 2010
Jabatan Kawal Selia Pembekalan dan Pasaran Elektrik Electricity Supply and Market Regulation Department - 40 -
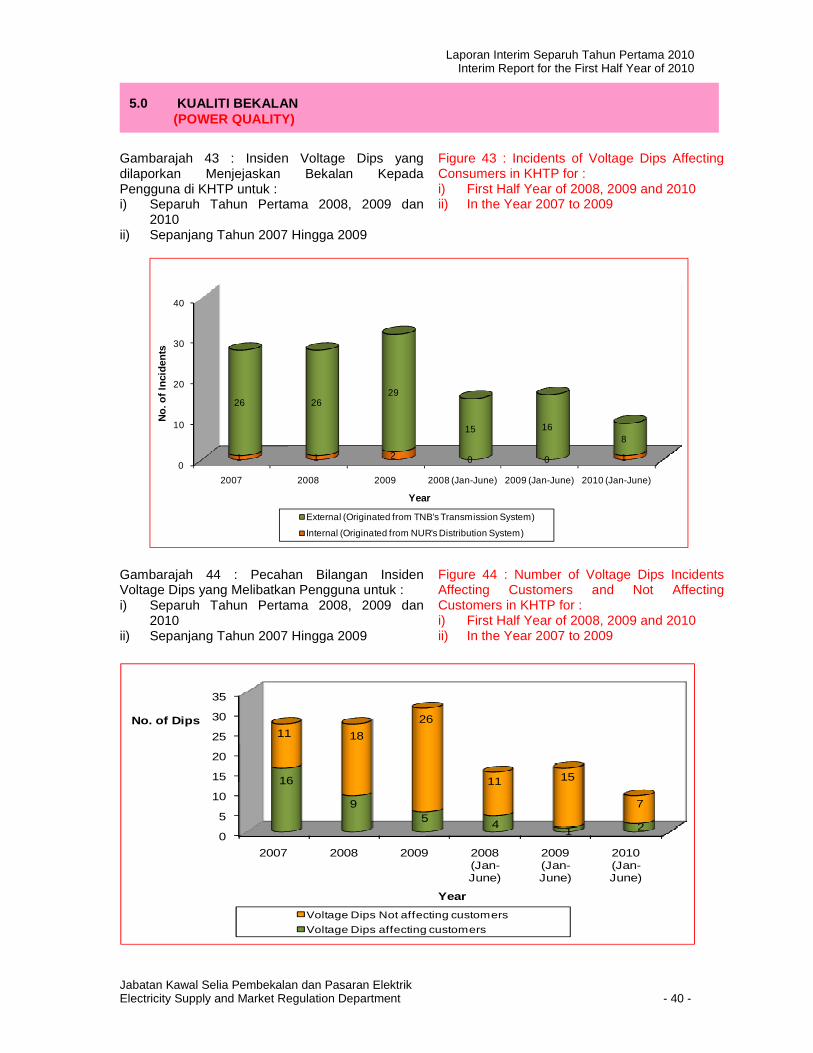
Gambarajah 43 : Insiden Voltage Dips yang dilaporkan Menjejaskan Bekalan Kepada Pengguna di KHTP untuk : i) Separuh Tahun Pertama 2008, 2009 dan
2010 ii) Sepanjang Tahun 2007 Hingga 2009
Figure 43 : Incidents of Voltage Dips Affecting Consumers in KHTP for : i) First Half Year of 2008, 2009 and 2010 ii) In the Year 2007 to 2009
0
10
20
30
40
2007 2008 2009 2008 (Jan-June) 2009 (Jan-June) 2010 (Jan-June)
1 1 2 0 0 1
26 2629
15 168
No.
of I
ncid
ents
Year
External (Originated from TNB's Transmission System)
Internal (Originated from NUR's Distribution System)
Gambarajah 44 : Pecahan Bilangan Insiden Voltage Dips yang Melibatkan Pengguna untuk : i) Separuh Tahun Pertama 2008, 2009 dan
2010 ii) Sepanjang Tahun 2007 Hingga 2009
Figure 44 : Number of Voltage Dips Incidents Affecting Customers and Not Affecting Customers in KHTP for : i) First Half Year of 2008, 2009 and 2010 ii) In the Year 2007 to 2009
0
5
10
15
20
25
30
35
2007 2008 2009 2008 (Jan-June)
2009 (Jan-June)
2010 (Jan-June)
16
95 4
1 2
11 18
26
11 15
7
No. of Dips
Year
Voltage Dips Not affecting customers
Voltage Dips affecting customers
5.0 KUALITI BEKALAN (POWER QUALITY)
Laporan Interim Separuh Tahun Pertama 2010 Interim Report for the First Half Year of 2010
Jabatan Kawal Selia Pembekalan dan Pasaran Elektrik Electricity Supply and Market Regulation Department - 41 -
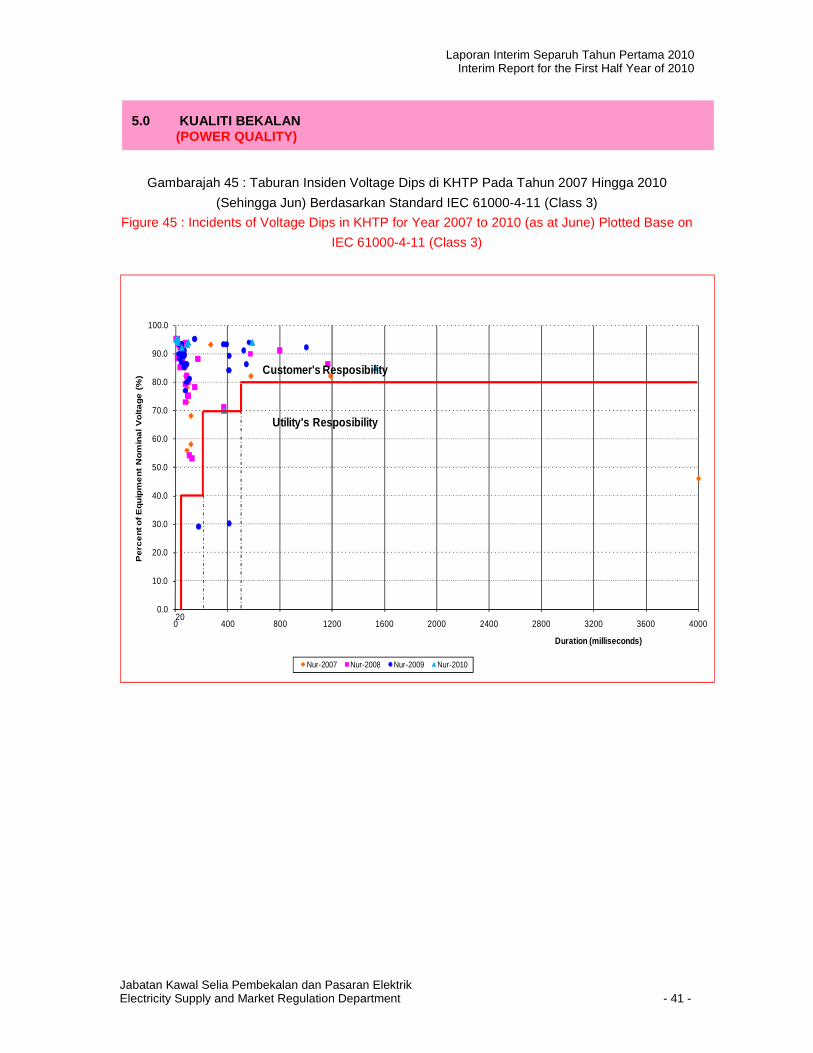
Gambarajah 45 : Taburan Insiden Voltage Dips di KHTP Pada Tahun 2007 Hingga 2010
(Sehingga Jun) Berdasarkan Standard IEC 61000-4-11 (Class 3)
Figure 45 : Incidents of Voltage Dips in KHTP for Year 2007 to 2010 (as at June) Plotted Base on
IEC 61000-4-11 (Class 3)
0.0
10.0
20.0
30.0
40.0
50.0
60.0
70.0
80.0
90.0
100.0
0 400 800 1200 1600 2000 2400 2800 3200 3600 4000
Pe
rce
nt o
f E
quip
me
nt
Nom
ina
l V
olta
ge
(%
)
Duration (milliseconds)
Nur-2007 Nur-2008 Nur-2009 Nur-2010
Customer's Resposibility
Utility's Resposibility
20
5.0 KUALITI BEKALAN (POWER QUALITY)
Laporan Interim Separuh Tahun Pertama 2010 Interim Report for the First Half Year of 2010
Jabatan Kawal Selia Pembekalan dan Pasaran Elektrik Electricity Supply and Market Regulation Department - 42 -
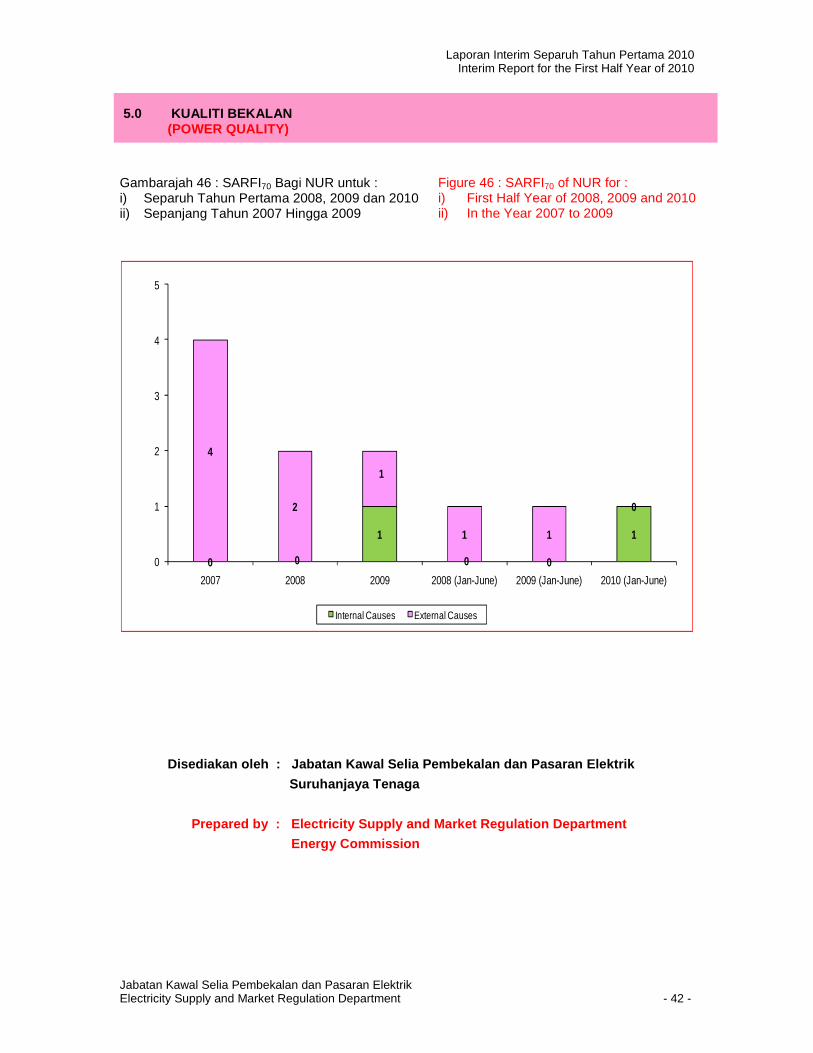
Gambarajah 46 : SARFI70 Bagi NUR untuk : i) Separuh Tahun Pertama 2008, 2009 dan 2010 ii) Sepanjang Tahun 2007 Hingga 2009
Figure 46 : SARFI70 of NUR for : i) First Half Year of 2008, 2009 and 2010 ii) In the Year 2007 to 2009
0 0
1
0 0
1
4
2
1
1 1
0
0
1
2
3
4
5
2007 2008 2009 2008 (Jan-June) 2009 (Jan-June) 2010 (Jan-June)
Internal Causes External Causes
Disediakan oleh : Jabatan Kawal Selia Pembekalan dan Pasaran Elektrik
Suruhanjaya Tenaga
Prepared by : Electricity Supply and Market Regu lation Department
Energy Commission
5.0 KUALITI BEKALAN (POWER QUALITY)