language patterns 2-10 years · language patterns 2-10 years cate taylor child language research...
TRANSCRIPT

Language patterns 2-10 years
Cate Taylor
Child Language Research Conference
22 May 2014, Melbourne, Victoria

Collaborators in studies of language patterns
• LOOKING at Language Study
– Mabel Rice
– Stephen Zubrick
• Longitudinal Study of Australian Children
– Daniel Christensen
– Stephen Zubrick
– David Lawrence
– Francis Mitrou

Practical reasons to look for patterns • We want to know what to expect of children at
different ages, where they are heading next and how predictable the patterns are from one age to the next
• We want to know what factors influence these patterns
• We want to fit policies and services to these patterns
3

Fitting policies and services to language patterns
• The job of fitting policies and services to language patterns will be easier if language patterns are stable and predictable
• The job of fitting policies and services to language patterns will not be easy if language patterns are unstable and unpredictable
• Based on the patterns we see, we have to ask the question, “How well do policies and services fit these language patterns?
4
Fitting our patterns to your context
• Speech pathologists
– The patterns you observe in children in specialist service systems may not fit the patterns we see in the general population
– Your job is to change growth trajectories
– Unstable growth patterns provide more scope for change than stable growth patterns (e.g., height)
5
Fitting our patterns to your context
• Teachers and principals working in schools in disadvantaged communities
– The most vulnerable children in the highest risk contexts are under-represented in our studies and the patterns you see in children in your school may differ from the patterns we see in the general population
– Do our patterns fit your patterns?
6

Fitting our patterns to your context
• Policies and service systems
– Population level cohort studies are designed so the patterns fit the general population
– With the caveats for children in specialist services and the most vulnerable children and families who are under-represented in our studies
7

Children in our studies • Children in our longitudinal population based cohort
studies are recruited from universal service systems (e.g., birth records)
– The most vulnerable children and families are under-represented
• The Australian Early Development Index (AEDI) captures the total population of children in their first year of formal school and includes children who are under-represented in our studies
8
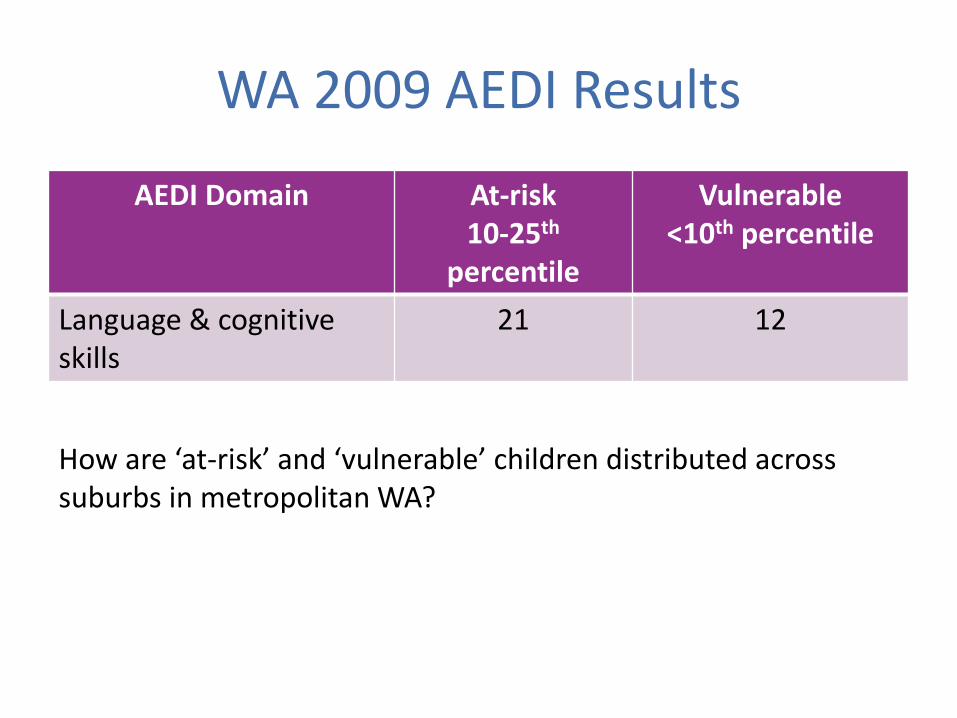
WA 2009 AEDI Results
AEDI Domain At-risk 10-25th
percentile
Vulnerable <10th percentile
Language & cognitive skills
21 12
How are ‘at-risk’ and ‘vulnerable’ children distributed across suburbs in metropolitan WA?

Language patterns 2-7 years (Zubrick et al., 2007 & Rice et al., 2008)
• LOOKING at Language Study
• 1766 single-born children
– Recruited from WA birth records
– English spoken at home
– No developmental disorders (e.g., Intellectual Impairment, Autism)

Low language at 2
• Ages and Stages Questionnaire Item Composite Measure
• Parent-report measure of expressive and receptive language abilities – Pointing to pictures, combining words, following
instructions, naming objects in pictures, pointing to body parts, and using personal pronouns
• Low language was a score 1 SD or more below the mean on the ASQ Item Composite we developed using an IRT approach
Low language at 2 in the prospective cohort study
• 1766 2-year-olds
• 13% prevalence of language delay at age 2
• 3250/25,000 children born each year

Language patterns 2-7 years in a nested case-control study
• 128 children with language delay at 2
• 109 children with typical language development at 2 randomly selected
14
Low language at 7
• Low language defined as a score 1 SD or more below the mean on a test of general language ability (TOLD:P-3)

Four language patterns 2-7 years (Rice et al., 2008)
• Children who started behind and stayed behind
• Children who started behind and caught up
• Children who started on track and stayed on track
• Children who started on track and fell behind
16
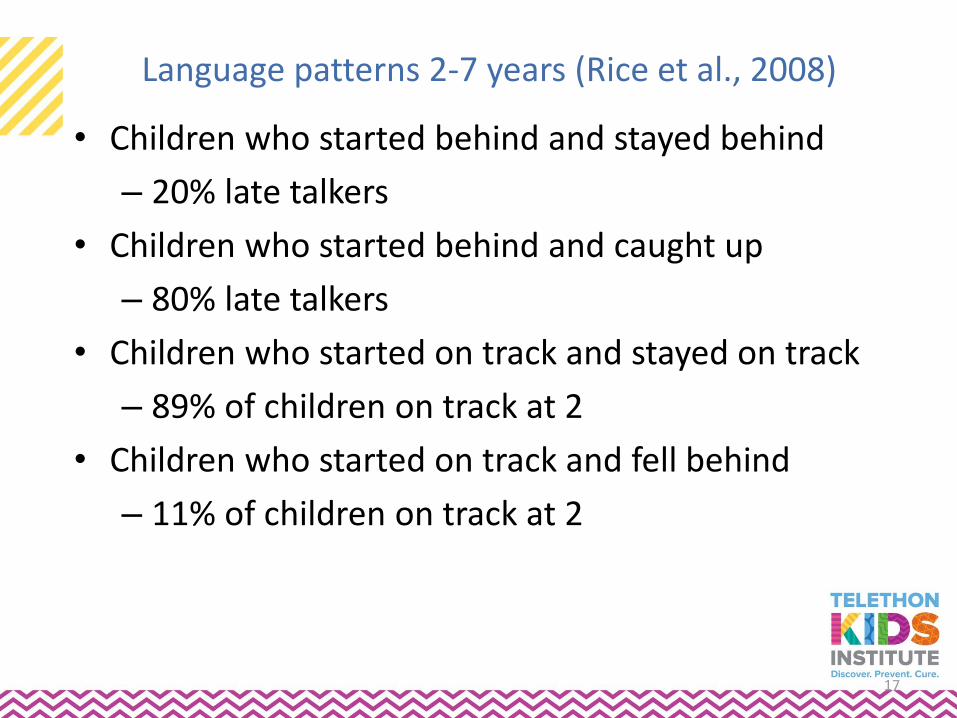
Language patterns 2-7 years (Rice et al., 2008)
• Children who started behind and stayed behind
– 20% late talkers
• Children who started behind and caught up
– 80% late talkers
• Children who started on track and stayed on track
– 89% of children on track at 2
• Children who started on track and fell behind
– 11% of children on track at 2
17

Language growth (Taylor et al., 2013)
• Looking at language patterns from one age to the next is a study of language change not language growth
• To study language growth, we need measures of language at a minimum of 3 ages
18
Longitudinal Study of Australian Children
• National coverage
• Kindergarten cohort – 4, 6, 8 & 10 years
• Extensive data from multiple sources (children, parents, carers, teachers, data linkage)
• http://www.aifs.gov.au/growingup/index.html
19

One dimension of language measured
• Receptive vocabulary
• The Adapted Peabody Picture Vocabulary Test (PPVT) given at 4, 6 and 8 years
• Face-to-face measure of words understood
• Item response theory
• Vertical scaling to allow the measurement of growth
20

Contribution of age to growth
• Age contributed a lot to language growth
– Accounted for 53% of the variance
• The importance of ‘date of manufacture is not as preposterous as Ken Robinson (2009) suggests:
– “Students are educated in batches, according to age, as if the most important thing they have in common is their date of manufacture.”
• Over and above growing older, between 4-8, children started school

Language gain
Mean PPVT Score
Age 4 Age 6 Age 8
Low starters 55 70 75
Middle starters 64 74 79
High starters 74 78 82
• Low starters gained 20 PPVT points • Middle starters gained 15 PPVT points • High starters gained 8 PPVT points
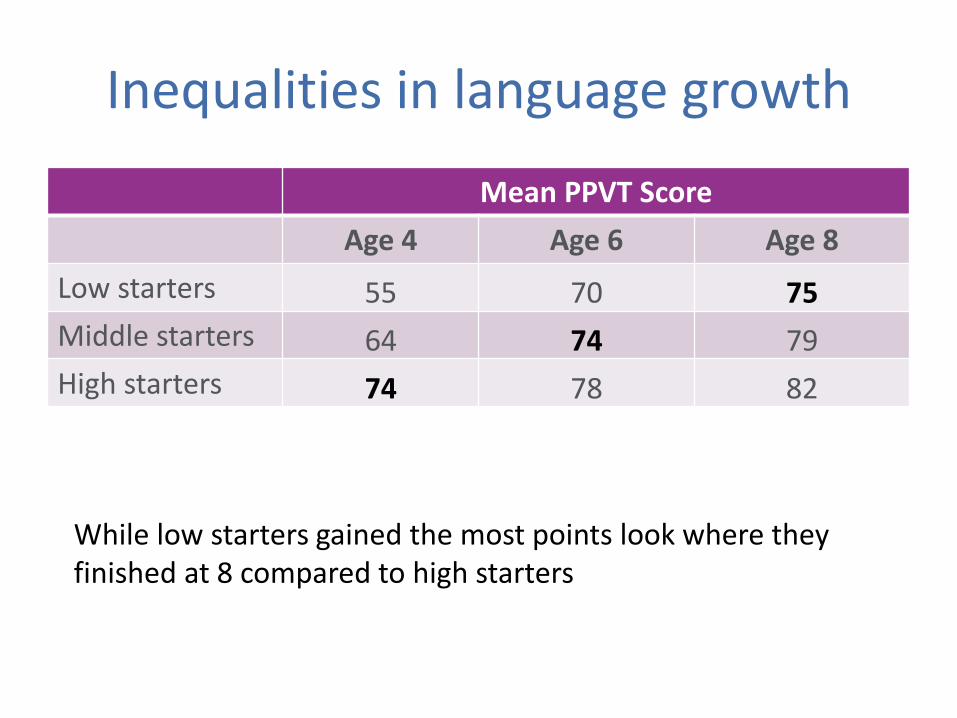
Inequalities in language growth
Mean PPVT Score
Age 4 Age 6 Age 8
Low starters 55 70 75
Middle starters 64 74 79
High starters 74 78 82
While low starters gained the most points look where they finished at 8 compared to high starters
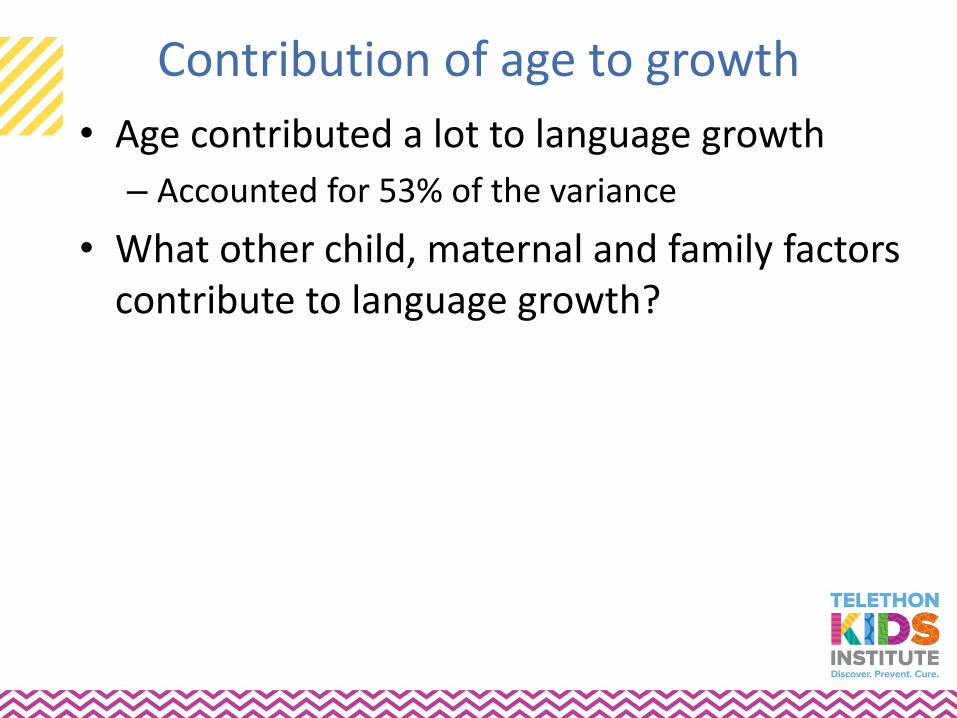
Contribution of age to growth
• Age contributed a lot to language growth
– Accounted for 53% of the variance
• What other child, maternal and family factors contribute to language growth?
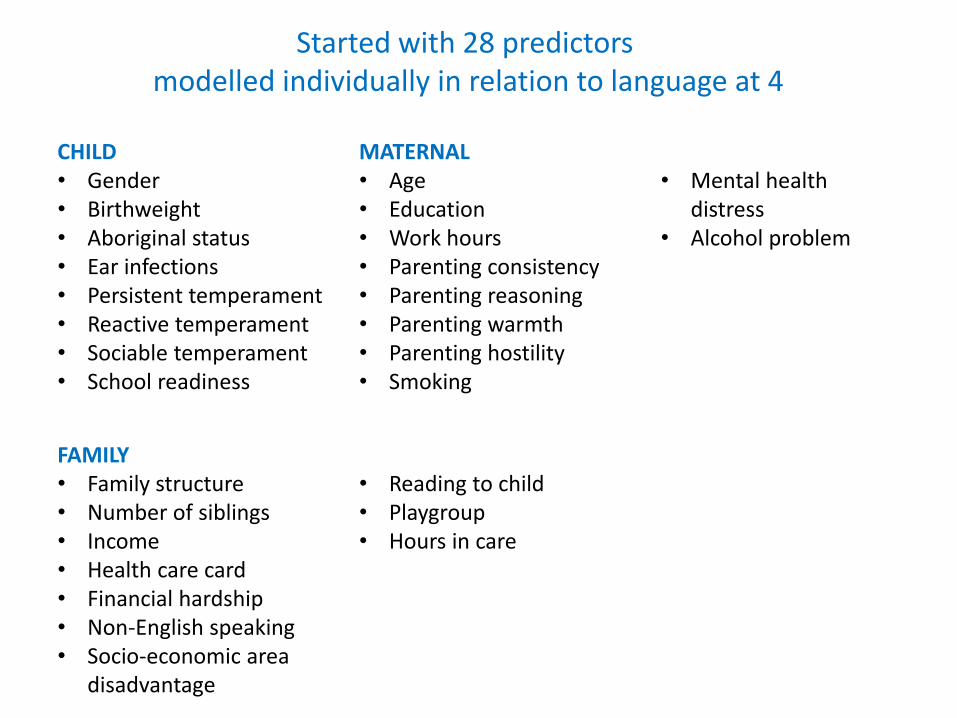
Started with 28 predictors modelled individually in relation to language at 4
CHILD • Gender • Birthweight • Aboriginal status • Ear infections • Persistent temperament • Reactive temperament • Sociable temperament • School readiness
MATERNAL • Age • Education • Work hours • Parenting consistency • Parenting reasoning • Parenting warmth • Parenting hostility • Smoking
• Mental health
distress • Alcohol problem
FAMILY • Family structure • Number of siblings • Income • Health care card • Financial hardship • Non-English speaking • Socio-economic area
disadvantage
• Reading to child • Playgroup • Hours in care

16/28 predictors had an effect size d > 0.30 (small)
CHILD • Gender • Birthweight • Aboriginal status • Ear infections • Persistent temperament • Reactive temperament • Sociable temperament • School readiness
MATERNAL • Age • Education • Work hours • Parenting consistency • Parenting reasoning • Parenting warmth • Parenting hostility • Smoking
• Mental health
distress • Alcohol problem
FAMILY • Family structure • Number of siblings • Income • Health care card • Financial hardship • Non-English speaking • Socio-economic area
disadvantage
• Reading to child • Playgroup • Hours in care

In the multivariate model 10/16 predictors were associated with lower language at 4
CHILD • Birthweight • Aboriginal status • Persistent temperament • Reactive temperament • School readiness
MATERNAL • Age • Education • Work hours • Parenting consistency • Mental health distress
FAMILY • Siblings • Income • Health care card • Financial hardship • Non-English speaking • Socio-economic area
disadvantage
• Reading to child • Playgroup • Hours in care

10 risks for lower language at 4 from highest – lowest risk
Risk variables modeled with the lowest level of risk as the reference category
Maternal NESB compared to English
Low school readiness compared to high
Child not read to at all compared to child read to daily
Four or more siblings compared to none
Low family income compared to high
Low birthweight compared to normal
Low maternal education compared to high
Maternal mental health distress compared to none
Low maternal parenting consistency compared to high
High child temperament reactivity compared to low
High area socio-economic disadvantage compared to low

The effects of these risks on language at 4
Risk factors Age 4 Months behind in language growth
Maternal NESB -16
Low school readiness -15
Child not read to at all -12
Siblings 4+ -10
Low family income -7
Low birthweight -6
Low maternal education -6
Maternal mental health distress -5
Low maternal parenting consistency -5
High child temperament reactivity -3
High area socio-economic disadvantage 0.30 ns

The effects of these risks on language growth from 4-8
Risk factors Age 4 Months behind in language growth
Age 8 Months behind in language growth
Maternal NESB -16 -4
Low school readiness -15 -6
Child not read to at all -12 -7
Siblings 4+ -10 -8
Low family income -7 -3
Low birthweight -6 -4
Low maternal education -6 -6
Maternal mental health distress -5 -0.3
Low maternal parenting consistency -5 -2
High child temperament reactivity -3 -2
High area socio-economic disadvantage 0.30 ns -8

What to make of language growth patterns 4-8
• Starting position mattered
• The gap between children with and without risks narrowed but did not close completely
• Socio-economic area disadvantage was the only risk associated with lower growth
• The risks accounted for an additional 7% of the variance over and above age which accounted for 53%
• Small effect sizes equated to noteworthy developmental differences (language growth in months)

Language and literacy measures
• 4, 6 and 8 years
– Adapted Peabody Picture Vocabulary Test (Adapted PPVT-III)
• 10 years
– Academic Rating Scale
– Teacher-report measure of language and literacy

The academic rating scale
• Teacher rates the child on a five-point scale (not yet -proficient) on these language and literacy skills: – Conveys ideas when speaking – Understands and interprets – Uses strategies to gain information – Reads fluently – Comprehends text – Composes stories – Clarifies and elaborates writing – Corrects written drafts – Uses computer for reports, stories
33

Putting language and literacy on the same scale
• Converted PPVT scores and ARS scores to z scores
– Mean = 0 and standard deviation = 1
• z scores retain the original relationship between the raw scores on the tests
34

Individual language & literacy trajectories for 20 children selected at random

5 most common language and literacy patterns from 16 possible patterns for 2792 children
Age 4 Language
Age 6 Language
Age 8 Language
Age 10 Literacy
n
%
Middle-High Middle-High Middle-High Middle-High 1915 69
Middle-High Middle-High Middle-High Low 202 7
Low Middle-High Middle-High Middle-High 118 4
Low Low Low Middle-High 27 1
Low Low Low Low 26 1
• Start on-track and stay on-track is the most common pattern • Start behind and stay behind is the least common pattern

Observations about language patterns
• We can identify children with low language at all ages starting at 2 years
• We can identify child, maternal and family risks for low language at all ages
• We know that children move in and out of ‘low language’ groups 2-10 years
• We know risks for low language change over time and that children grow out of some risks and into other risks
• Looking forward, from any age, we can’t tell which children will ‘stay the same’, ‘catch up’ or ‘fall behind’
How to respond to language patterns 2-10 years
• Findings point to integrated services to improve child outcomes and reduce parental and family risk factors

How to respond to language patterns 2-10 years
• Identifying children with ‘low language’ at any age will include children who catch-up and miss children who fall behind with age

How to respond to language patterns 2-10 years
• Finland, the highest ranking country on early childhood education quality indicators (Economist Intelligence Unit, 2012) applies a ‘light touch’ to identifying ‘at risk’ children for targeted services and a ‘heavy hand’ to the quality of universal services