landslide hazard analysis and its effect …...landslide hazard analysis and its effect on...
TRANSCRIPT

LANDSLIDE HAZARD ANALYSIS AND ITS EFFECT ON
ENDANGERED SPECIES HABITATS, GRAND COUNTY,
UTAH
12/5/2016
GIS Final Project
Ashlyn Murphy
Fall 2016

Murphy GIS Fall 2016
1
1. Introduction and Problem A well-known geologic hazard that can cause significant damage both physically and economically are landslides. This project focuses on landslides in the state of Utah, which has caused significant physical damage to some of its outdoor attractions as well as extreme economic losses in years with above average rainfall. In 1983, a particularly wet year for Utah, landslides cost an estimated $250 million. This direct cost was mainly attributed to the Thistle landslide in Utah County, which is recognized as the most expensive individual landslide in North America to date. In 2007 the Utah Geological Survey did a study on the landslide susceptibility of the entire state of Utah. This study was based on a statewide 1:500,000 scale geologic map and a 30-meter slope map derived from the National Elevation Dataset Digital Elevation Models for the state of Utah. Although a geologic map was said to be taken into consideration, the final map that was produced was based mainly on slope, with lithology only taken into consideration to obtain an average slope per geologic unit. The fact that only an average slope per geologic unit was used and barely taken into consideration for the final landslide susceptibility categories is insufficient to accurately characterize how landslide susceptibility can vary with lithology. Another issue with the 2007 study was the lack of inclusion of precipitation data. My goal for this project is to answer the question; will the inclusion of lithological variations as well as precipitation data add or subtract areas of moderate to high landslide susceptibility when compared to the 2007 study? This study aims to answer this question through creation of a reclassification scheme that takes into account lithology, slope, precipitation, and location of previous landslides to create a composite map of these parameters to identify areas of moderate to high risk of landslides. Instead of focusing on the entire state of Utah, it was decided to perform this study on the data available for Grand County, Utah. This county was chosen due to the majority of the Book Cliffs being present in this county, but Grand County is also home to two national parks (Arches and Canyonlands), part of the Manti-La Sal National Forest, part of the McInnis Canyons National Conservation Area, and the La Sal Mountain Range. Grand County is also the location of fourteen endangered and threatened species’ habitat areas. It is safe to say that outdoor attractions in Grand County could be economically affected if landslides were to occur, as well as the habitat areas of these threatened and endangered species. A case study within the overall landslide susceptibility analysis is also included and addresses the problem of identifying which endangered and threatened species’ habitats are in moderate to high landslide susceptibility areas.

Murphy GIS Fall 2016
2
2. Data Collection
Layer Name Data Type
Original Projection Source Description
Mosaic_Raster ArcGrid GCS_NAD_1983 National Elevation Dataset: USGS
1 X 1 extent, 1/3 arc-second mosaic
of raster DEMs of N 40 W 110, N 39 W 110, N 40 W 111 and N 39 W 111
Counties Shapefile NAD_1922_UTM_Zone_12N Utah AGRC
Shapefile of the counties of Utah
Geol_Poly Shapefile NAD_1922_UTM_Zone_12N Utah Geological
Survey
Shapefile of the geology of Utah
Geol_Arc Shapefile NAD_1922_UTM_Zone_12N Utah Geological
Survey
Shapefile of the geologic contacts of
Utah UTunits Excel file N/A Utah
Geological Survey
Supplemental spreadsheet to the
Geol_Poly shapefile; used to
reference lithology type of each geologic unit
Precip_Utah Shapefile NAD_1983_UTM_Zone_12N USDA Shapefile of annual precipitation in
inches for the state of Utah from 1981-
2010 LandslideSusceptibility_UT Shapefile NAD_1922_UTM_Zone_12N Utah
Geological Survey
Shapefile of landslide
susceptibility created by the UGS
in 2007 HabitatAreas_shp Shapefile NAD_1983_UTM_Zone_12N Utah
AGRC Folder containing
the shapefiles of the habitat area of the endangered and
threatened animals in Utah
Table 1: GIS Data Compiled
Murphy GIS Fall 2016
3
3. Data Preprocessing
a. The first step was to download all the relevant data (rasters & shapefiles, see Table 1 for dataset). These were then imported into ArcMap with their associated spatial reference. All of the data imported was ArcMap compatible and did not require georeferencing.
b. The second step was to make sure all the shapefile data layers were projected to the same spatial reference as the Data Frame. This was done using the Define Projection (Data Management Tools > Projections and Transformations) tool within ArcToolbox. The spatial coordinate system for this project is NAD_1983_UTM_Zone_12N.
c. A new folder was created to contain new processed data and was named GIS_Project.
d. Four DEM’s were imported, as was stated in part a. and coordinates are stated in
Table 1, and these were combined into one DEM mosaic. This was done using the Mosaic to New Raster (Data Management > Raster > Raster Dataset) tool in ArcToolbox. The new raster was named Mosaic_DEM.
e. All shapefiles listed in Table 1 were clipped to the Grand County boundary using
the Clip (Analysis Tools > Extract) tool in ArcToolbox and the DEM mosaic raster was clipped to the Grand County boundary using the Extract by Mask (Spatial Analyst Tools > Extraction) tool in ArcToolbox.
f. The Geol_Poly shapefile was then dissolved to combine the polygons with the same Unit
Name as one feature. This was done using the Dissolve (Data Management Tools > Generalization) tool in ArcToolbox.
g. Since new rasters will be generated for part of the preprocessing, a mask for
setting the analysis area was set. This was done through the Geoprocessing menu > Environments > Raster Analysis > Mask. The mask was set to the Grand County boundary.
h. To determine which endangered and threatened species’ habitats were located in
areas with different levels of landslide susceptibility, the shapefiles from the HabitatAreas_shp folder needed to be displayed to see which habitats fell within Grand County. The list of endangered and threatened species with habitats within Grand County and the area in mi^2 for the habitat is listed below in Table 2.

Murphy GIS Fall 2016
4
Endangered/Threatened Species Habitat Area (mi^2) Bandtailed Pigeon 183
Bison 431 Black Bear 1188
Blue Grouse 614 California Quail 16
Chukar 2389 Desert Bighorn Sheep 644 Greater Sage Grouse 198
Muledeer 1677 Pronghorn 411
Ring Necked Pheasant 53 Rocky Mountain Bighorn Sheep 1217
Rocky Mountain Elk 1565 Wild Turkey 508
i. All endangered and threatened species shapefiles listed in Table 2 were clipped to the Grand County boundary using the Clip (Analysis Tools > Extract) tool in ArcToolbox.
4. ArcGIS Processing
a. The first processing step was to create a new Slope raster from the DEM mosaic. This was accomplished using the Slope (Spatial Analyst Tools > Surface) tool in ArcToolbox (Figure 1).
Table 2: Endangered/Threatened Species Habitats in Grand County, UT
Figure 1: Screenshot of Slope raster created from DEM mosaic
raster.
Murphy GIS Fall 2016
5
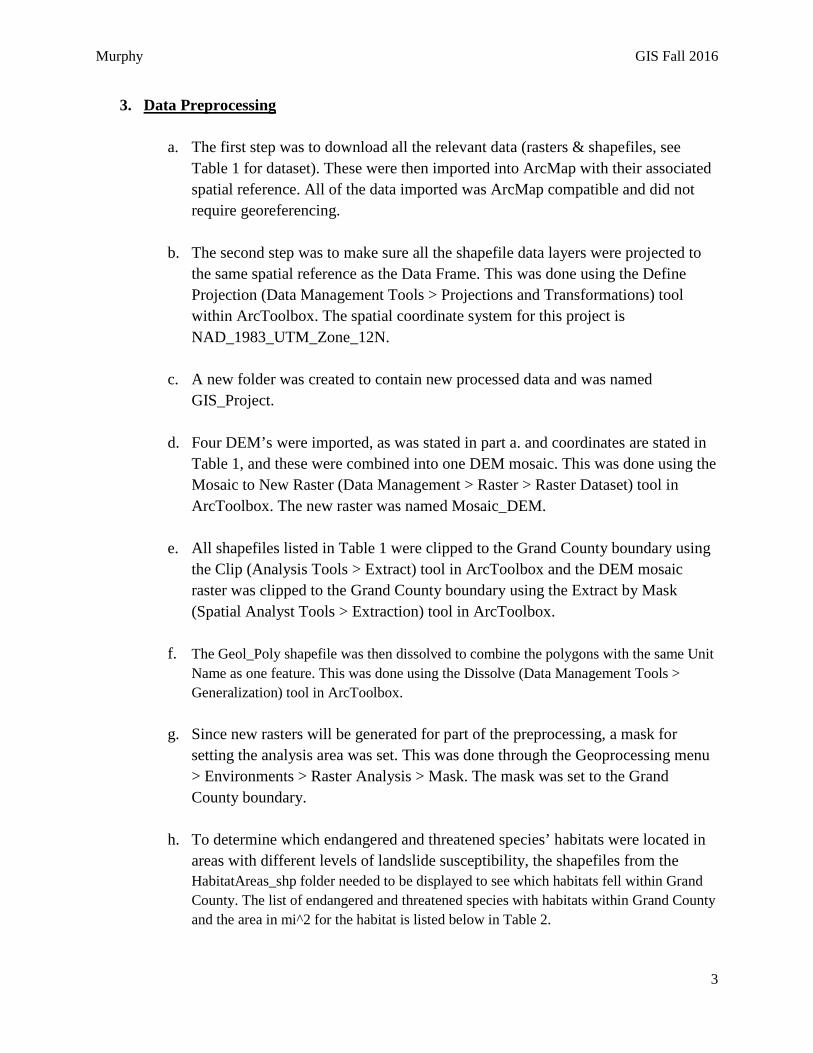
b. The next processing step was to convert the Geol_Poly clipped and dissolved layer to a raster layer. This was done using the Features to Raster (Conversion Tools > To Raster) tool in ArcToolbox, with an output cell size of 100 (Figure 2).
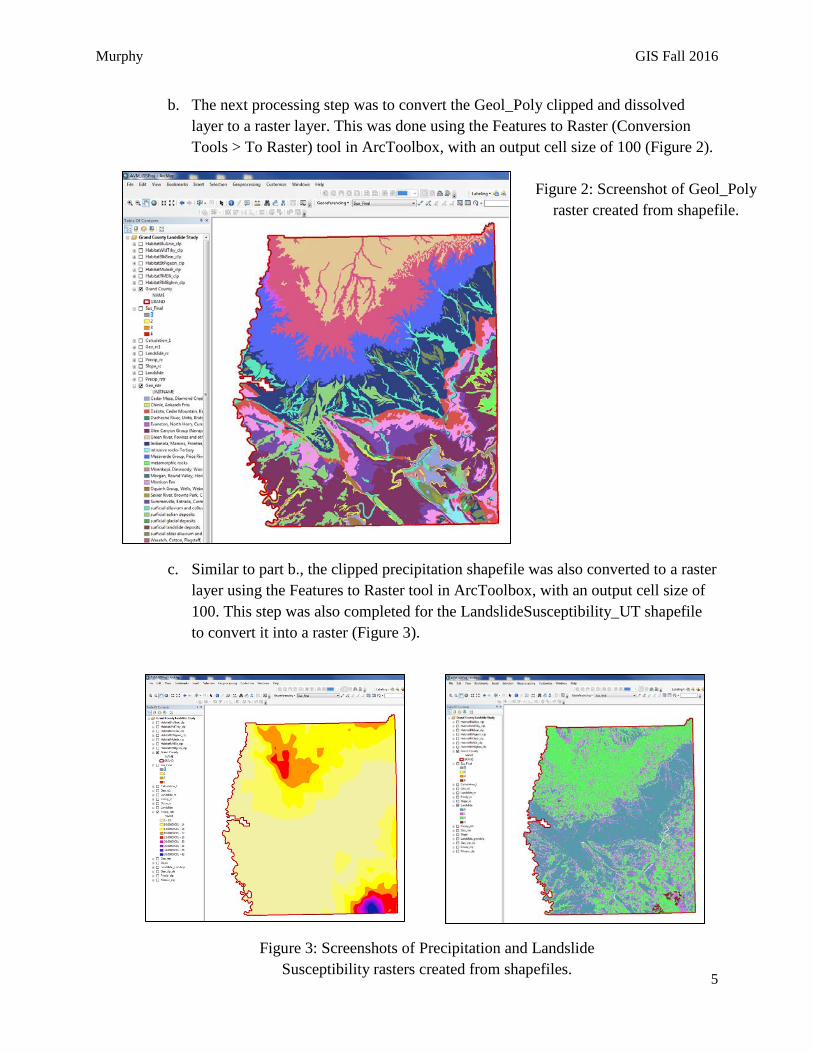
c. Similar to part b., the clipped precipitation shapefile was also converted to a raster layer using the Features to Raster tool in ArcToolbox, with an output cell size of 100. This step was also completed for the LandslideSusceptibility_UT shapefile to convert it into a raster (Figure 3).
Figure 2: Screenshot of Geol_Poly raster created from shapefile.
Figure 3: Screenshots of Precipitation and Landslide Susceptibility rasters created from shapefiles.

Murphy GIS Fall 2016
6
d. The next set of steps has to do with raster reclassification. Reclassification was based on the chart below (Table 3) outlining the ranking system to be used regarding landslide susceptibility. The rasters that were reclassified were the Geology raster, Slope raster, Precipitation raster, and Landslide raster. Reclassification was done using the Reclassify (Spatial Analyst Tools > Reclass) tool in ArcToolbox.
Rank Geology Slope Precipitation Existing Landslide Location
0 - - - NO 1 Igneous/Metamorphic
Rocks < 10° <15 inches -
2 Sandstone/Limestone 10-20° 15-25 inches - 3 Shale/Mudstone 20-30° 25-35 inches - 4 Unconsolidated
Rocks >30° 35-45 inches YES
e. After each of the rasters listed above in Table 3 were reclassified, the rasters were combined using the Raster Calculator (Spatial Analyst Tools > Map Algebra) in ArcToolbox. Each of the rasters were added together and a resultant raster was produced named Calculation_1 (Figure 4).
Table 3: Susceptibility Analysis Parameters
Figure 4: Screenshot of Calculation_1 raster created using the Raster Calculator.
Murphy GIS Fall 2016
7
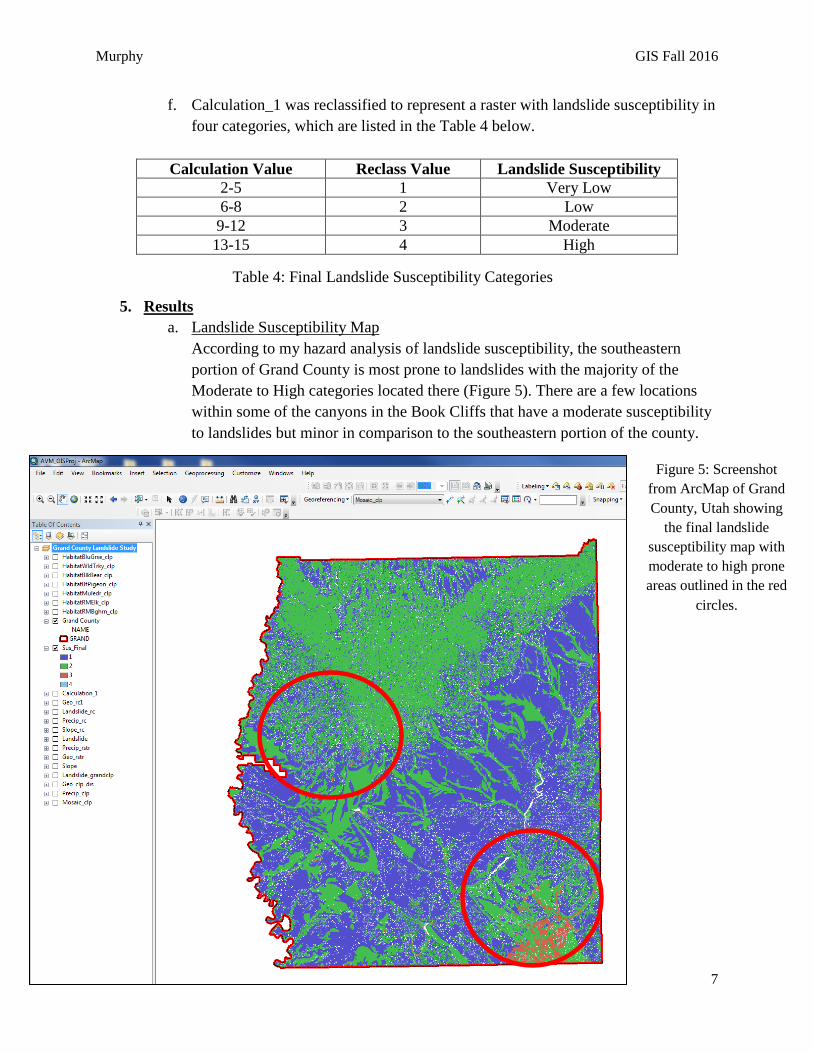
f. Calculation_1 was reclassified to represent a raster with landslide susceptibility in four categories, which are listed in the Table 4 below.
Calculation Value Reclass Value Landslide Susceptibility 2-5 1 Very Low 6-8 2 Low 9-12 3 Moderate 13-15 4 High
5. Results a. Landslide Susceptibility Map
According to my hazard analysis of landslide susceptibility, the southeastern portion of Grand County is most prone to landslides with the majority of the Moderate to High categories located there (Figure 5). There are a few locations within some of the canyons in the Book Cliffs that have a moderate susceptibility to landslides but minor in comparison to the southeastern portion of the county.
Figure 5: Screenshot from ArcMap of Grand County, Utah showing
the final landslide susceptibility map with moderate to high prone areas outlined in the red
circles.
Table 4: Final Landslide Susceptibility Categories
Murphy GIS Fall 2016
8
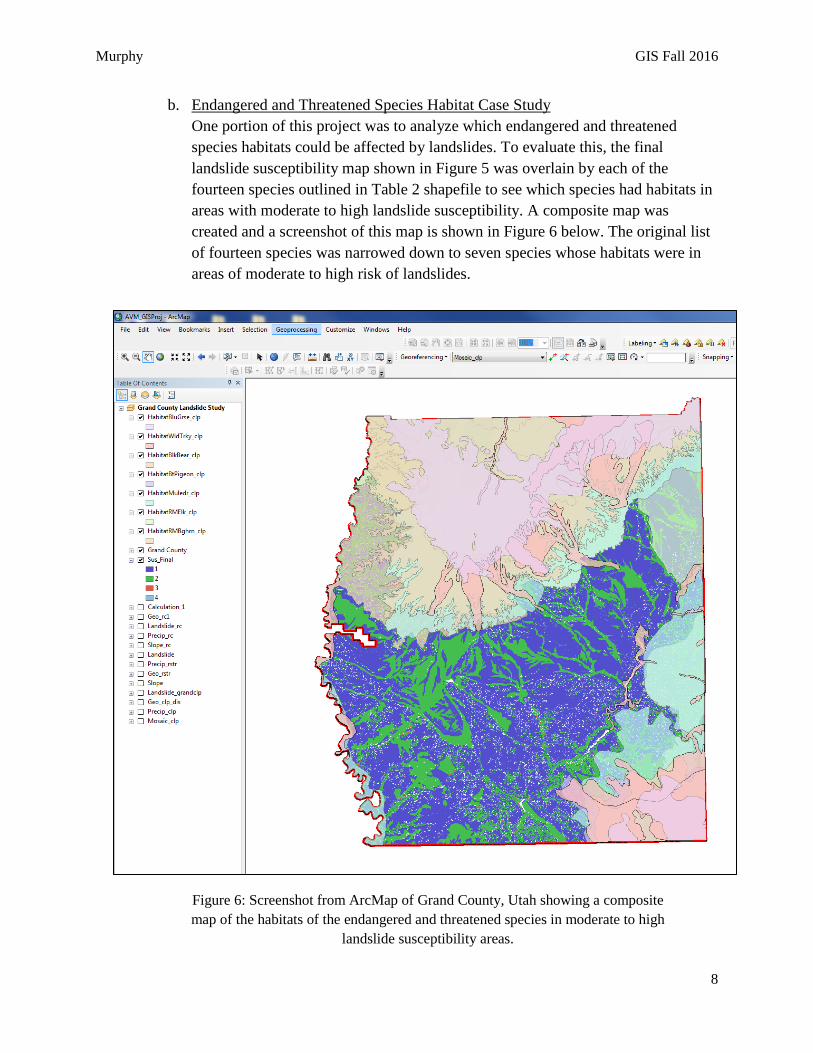
b. Endangered and Threatened Species Habitat Case Study One portion of this project was to analyze which endangered and threatened species habitats could be affected by landslides. To evaluate this, the final landslide susceptibility map shown in Figure 5 was overlain by each of the fourteen species outlined in Table 2 shapefile to see which species had habitats in areas with moderate to high landslide susceptibility. A composite map was created and a screenshot of this map is shown in Figure 6 below. The original list of fourteen species was narrowed down to seven species whose habitats were in areas of moderate to high risk of landslides.
Figure 6: Screenshot from ArcMap of Grand County, Utah showing a composite map of the habitats of the endangered and threatened species in moderate to high
landslide susceptibility areas.
Murphy GIS Fall 2016
9
6. Conclusions
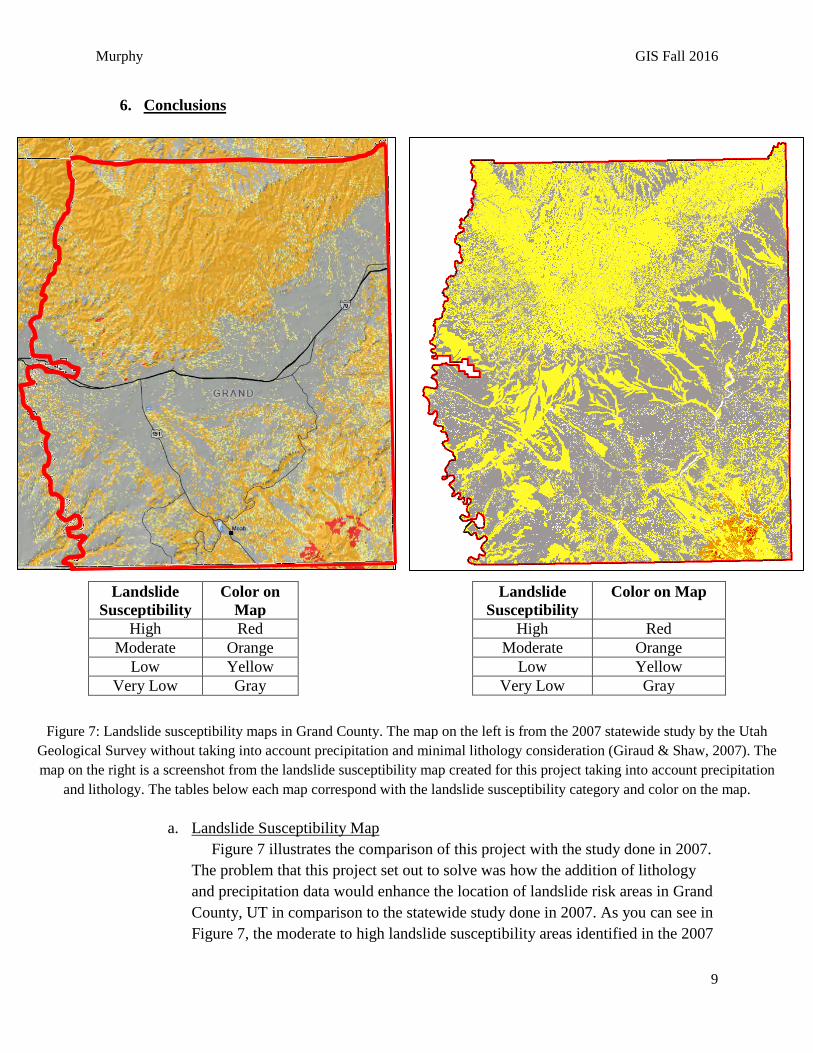
a. Landslide Susceptibility Map Figure 7 illustrates the comparison of this project with the study done in 2007. The problem that this project set out to solve was how the addition of lithology and precipitation data would enhance the location of landslide risk areas in Grand County, UT in comparison to the statewide study done in 2007. As you can see in Figure 7, the moderate to high landslide susceptibility areas identified in the 2007
Landslide Susceptibility
Color on Map
High Red Moderate Orange
Low Yellow Very Low Gray
Landslide Susceptibility
Color on Map
High Red Moderate Orange
Low Yellow Very Low Gray
Figure 7: Landslide susceptibility maps in Grand County. The map on the left is from the 2007 statewide study by the Utah Geological Survey without taking into account precipitation and minimal lithology consideration (Giraud & Shaw, 2007). The map on the right is a screenshot from the landslide susceptibility map created for this project taking into account precipitation
and lithology. The tables below each map correspond with the landslide susceptibility category and color on the map.

Murphy GIS Fall 2016
10
study are in the southeastern corner of the county which is mimicked by the map created for this study, as is shown by the orange and red colors in the southeastern corner of the map to the right. This area to the southeast is the La Sal Mountain Range, and explains the higher landslide susceptibility in this area due to increased precipitation here and steeper slopes. One difference is lower landslide susceptibility was identified at lower elevations in the La Sal range in this study in comparison to the map shown from the 2007 study. The addition of lithology and precipitation information here indicates that these areas are of lower landslide risk than was originally estimated in 2007. This is also apparent in the Book Cliffs area to the north. This area was mainly identified as a moderate risk in 2007 but has been lowered in most areas with the addition of lithology and precipitation information. Another feature that is prevalent in the updated study map in comparison with the 2007 map in Figure 7 is more detail through the middle of the map highlighting some of the canyons on the fringes of the Book Cliffs as low landslide risks where as these are not shown in the 2007 map. These canyons are large recreation areas and easily accessible to the public and should be included in a landslide hazard analysis of the area. A printable map with landslide susceptibility in Grand County, Utah is located in the Appendix (Map 1). Through the addition of lithology and precipitation data, the landslide hazard analysis map produced in 2007 by the Utah Geological Survey was improved upon by creation of a more detailed map of landslide risks in Grand County, Utah.
b. Endangered and Threatened Species Habitat Case Study
One portion of this project was to analyze which endangered and threatened species habitats could be affected by landslides. To evaluate this, the final landslide susceptibility map shown in Figure 5 was overlain by each of the fourteen species outlined in Table 2. A composite map was created and a screenshot of this map is shown in Figure 6 above. The original list of fourteen species was narrowed down to seven species whose habitats were in areas of moderate to high risk of landslides. These species are the Bandtailed Pigeon, the Blue Grouse, Wild Turkey, Black Bear, Muledeer, Rocky Mountain Elk, and Rocky Mountain Bighorn Sheep. The majority of these habitat areas that are at risk for landslide interference are in the La Sal Mountain Range to the southeast and in the Book Cliffs area to the north. A printable map with landslide susceptibility overlain by at risk habitat areas is located in the Appendix (Map 2).
7. References Giraud, Richard E., and Lucas M. Shaw. "Landslide Susceptibility Map of Utah." Utah Geological Survey (2007): 1-16. Google Scholar. Web. 25 Nov. 2016.

Murphy GIS Fall 2016
11
APPENDIX
Map 1: Printable map showing landslide susceptibility areas in Grand County, Utah Map 2: Printable map showing endangered and threatened species habitats and landslide susceptibility areas in Grand County, Utah

580000.000000
580000.000000
600000.000000
600000.000000
620000.000000
620000.000000
640000.000000
640000.000000
660000.000000
660000.000000
4260
000.00
0000
4260
000.00
0000
4280
000.00
0000
4280
000.00
0000
4300
000.00
0000
4300
000.00
0000
4320
000.00
0000
4320
000.00
0000
4340
000.00
0000
4340
000.00
0000
4360
000.00
0000
4360
000.00
0000
Map of Landslide Susceptibility, Grand County, UtahAshlyn Murphy
12/5/2016
ExplanationGrand County
Landslide Susceptibility1: Very Low2: Low3: Moderate4: High
±0 6 12 18 243 Miles0 8 16 24 324 Kilometers
1:600,000 NAD 1983 UTM Zone 12N
Map 1

580000.000000
580000.000000
600000.000000
600000.000000
620000.000000
620000.000000
640000.000000
640000.000000
660000.000000
660000.000000
4260
000.00
0000
4260
000.00
0000
4280
000.00
0000
4280
000.00
0000
4300
000.00
0000
4300
000.00
0000
4320
000.00
0000
4320
000.00
0000
4340
000.00
0000
4340
000.00
0000
4360
000.00
0000
4360
000.00
0000
Map of Endangered and Threatened Species Habitats and Landslide Susceptibility, Grand County, UtahAshlyn Murphy
12/5/2016
ExplanationGrand County
Landslide Susceptibility1: Very Low2: Low3: Moderate4: High
Blue Grouse HabitatWild Turkey HabitatBlack Bear HabitatBandtailed Pigeon HabitatMuledeer HabitatRocky Mountain Elk HabitatRocky Mountain Bighorn Sheep Habitat
±0 8 16 24 324
Kilometers
1:600,000NAD 1983 UTM Zone 12N
Map 2
0 6 12 18 243Miles