landscape irrigation auditor · landscape irrigation auditor blank worksheets • catch device test...
TRANSCRIPT

Landscape Irrigation AuditorBlank Worksheets
• Catch Device Test• Controller Data and Controller Settings• Drip/Micro System Review• Simple Schedule Worksheet• Site Conditions Review• Soil Moisture Irrigation Schedule• Sprinkler System Review• Test Area Flow Rate Calculation• Test Area Map• Water Source and System Data• Watering Days Irrigation Schedule
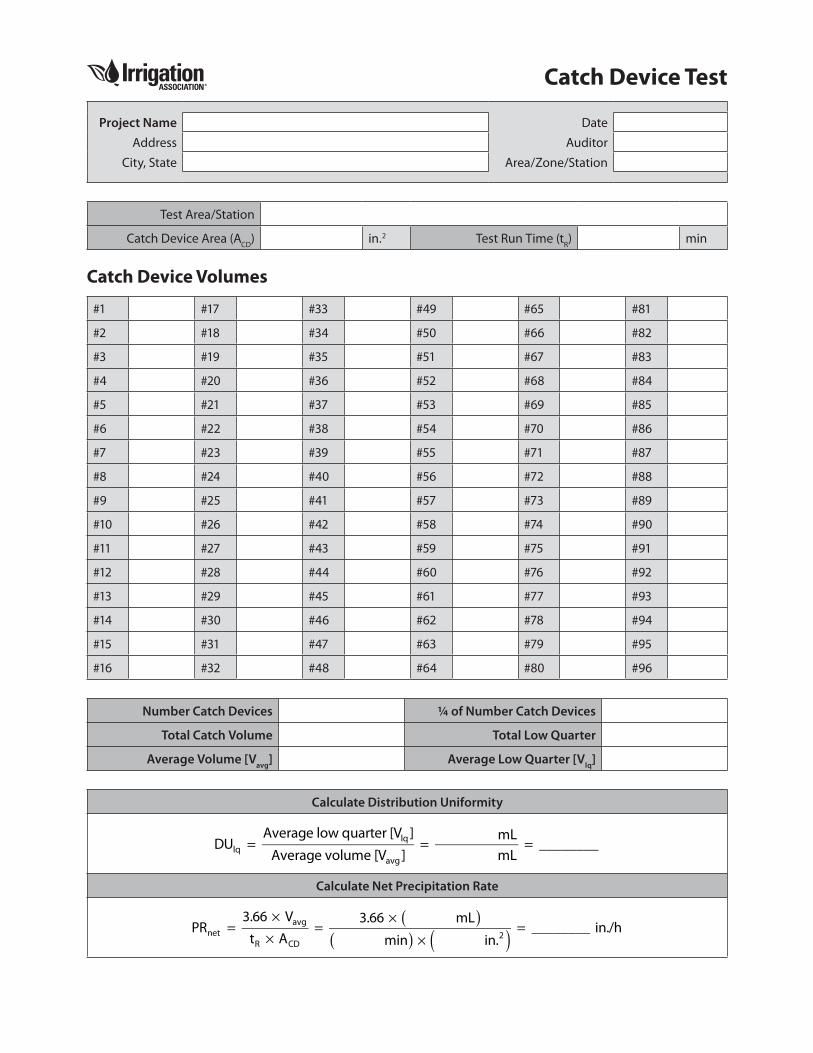
Catch Device Test
Project Name DateAddress Auditor
City, State Area/Zone/Station
Test Area/Station
Catch Device Area (ACD) in.2 Test Run Time (tR) min
Catch Device Volumes
#1 #17 #33 #49 #65 #81
#2 #18 #34 #50 #66 #82
#3 #19 #35 #51 #67 #83
#4 #20 #36 #52 #68 #84
#5 #21 #37 #53 #69 #85
#6 #22 #38 #54 #70 #86
#7 #23 #39 #55 #71 #87
#8 #24 #40 #56 #72 #88
#9 #25 #41 #57 #73 #89
#10 #26 #42 #58 #74 #90
#11 #27 #43 #59 #75 #91
#12 #28 #44 #60 #76 #92
#13 #29 #45 #61 #77 #93
#14 #30 #46 #62 #78 #94
#15 #31 #47 #63 #79 #95
#16 #32 #48 #64 #80 #96
Number Catch Devices ¼ of Number Catch Devices
Total Catch Volume Total Low Quarter
Average Volume [Vavg] Average Low Quarter [Vlq]
Calculate Distribution Uniformity
DUlq =Average low quarter [Vlq ]
Average volume [Vavg ]= mL
mL= ________
Calculate Net Precipitation Rate
PRnet =3.66 × Vavg
tR × ACD
=3.66 × mL( )
min( ) × in.2( ) = ________ in./h

Controller Data
Project Name DateAddress Auditor
City, State Page of
Manufacturer Central Control (check one)
Yes No
Model Number Weather Station (check one)
Yes No
Stations Being Used Smart Controller (check one)
Yes No
Station Run Time Range (min)
Minimum Maximum
Number of Programs Start Times/Program
Calendar Days (check one)
7 days 14 days Other (explain)
Irrigation Interval (check options available)
Daily Even/Odd Custom (explain)
Rain delay (maximum days) Skip Day Period (maximum days)
Percent Adjust Options (check applicable)
Global By program By station By month Seasonal
Sensors Installed (make & model)
Rain
Freeze
Wind
Temperature
Flow
Soil moisture
Tipping bucket
Notes
cont. on back

Controller Data, cont.
Controller Settings
ProgramStart Times
Days On1 2 3 4
A S M T W T F S
B S M T W T F S
C S M T W T F S
D S M T W T F S
Program Station Minutes Program Station Minutes Program Station Minutes
Smart Controller Settings
Station Program PR DU Plant Factor Soil Type Slope Soil Moisture

Drip/Micro System Review
Project Name DateAddress Auditor
City, State Page of
Station # Observed Problems
Plant material Emission devices
Plant condition Missing emitters
Microclimate Clogged emitters
Soil category Emitters in wrong place
Pressure regulator in place (Y/N) Broken stakes
Flow rating gpm
Pressure setting psi Tubing and fittings
Pressure readings Cut tubing
Beginning psi Kinked tubing
Middle psi Broken fittings
End psi Flush plugs buried
Filter in place (Y/N)
Filter type Filter needs servicing
Size (mesh or micron)
Emitter type
Flow rate gph
Emitter spacing in.
Line spacing in.
Tubing size (in./mm)
Air/vacuum relief (Y/N)
Flush plugs accessible (Y/N)
Abbreviation Key
Plant Material Microclimate Soil Category Plant Condition Slope
CSWS
TSN
GCF
= Cool season turf= Warm season turf= Trees = Shrubs = Native plants= Ground cover= Annual flowers
FSPS
SHEX
= Full sun all day= Part shade, less than 6
hours of sun per day= Full shade all day= Extreme conditions
(parking lots, south-facing glass or wall)
CMC
MMF
F
= Coarse= Moderately
coarse= Medium= Moderately
fine= Fine
LM
TRD
HQ
= Low-maintenance, stressed
= Some stress, but generally good condition
= Majority are vigo-rusly growing
FSl
ModStp
= Flat= Slight= Moderate= Steep
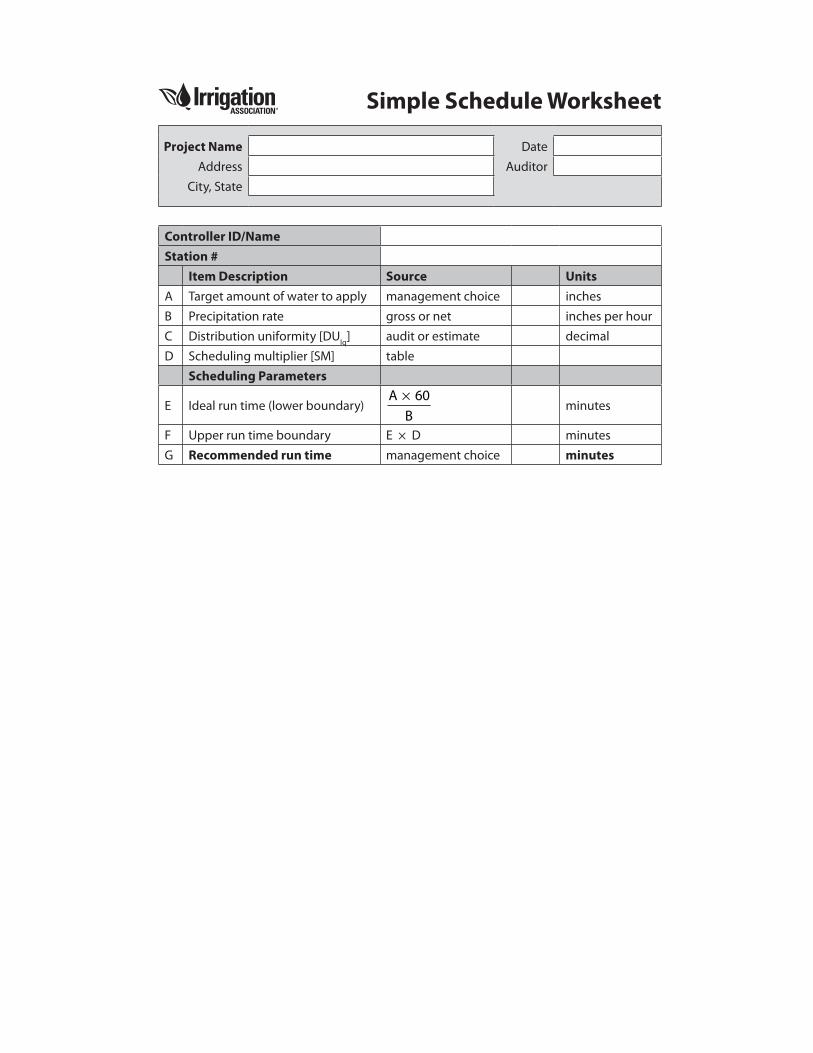
Simple Schedule Worksheet Project Name Date
Address AuditorCity, State
Controller ID/NameStation #
Item Description Source UnitsA Target amount of water to apply management choice inchesB Precipitation rate gross or net inches per hourC Distribution uniformity [DUlq] audit or estimate decimalD Scheduling multiplier [SM] table
Scheduling Parameters
E Ideal run time (lower boundary)A × 60
Bminutes
F Upper run time boundary E × D minutesG Recommended run time management choice minutes

Site Conditions Review
Project Name DateAddress Auditor
City, State Page of
Controller ID/Name
Area/location
Controller station(s) #
Irrigated area ft2 ft2 ft2 ft2 ft2
Plant material (all that apply)
Plant condition (choose one)
Microclimate (choose one)
Soil category (choose one)
Root zone depth in. in. in. in. in.
Slope (choose one)
Compaction (Y/N)
Runtime until runoff min min min min min
Standing water (Y/N)
Turf/shrub separation (Y/N)
Hydrozone separation (Y/N)
Mowing height in. in. in. in. in.
Fertilization (frequency)
Aeration (frequency)
Dethatching (frequency)
Mulch in beds (Y/N)
Abbreviation Key
Plant Material Microclimate Soil Category Plant Condition Slope
CSWS
TSN
GCF
= Cool season turf= Warm season turf= Trees = Shrubs = Native plants= Ground cover= Annual flowers
FSPS
SHEX
= Full sun all day= Part shade, less than 6
hours of sun per day= Full shade all day= Extreme conditions
(parking lots, south-facing glass or wall)
CMC
MMF
F
= Coarse= Moderately
coarse= Medium= Moderately
fine= Fine
LM
TRD
HQ
= Low maintenance, stressed
= Traditional, some stress, but generally good condition
= High quality, majority are vigorously growing
FSl
ModStp
= Flat= Slight= Moderate= Steep

Soil Moisture Irrigation Schedule
Project Name DateAddress Auditor
City, State Area/Zone/Station
Plant Water Requirement Value Units SourceA. ETO reference periodB. ETO reference period in days days Override valueC. Reference ET [ETO] in. weather dataD. Landscape coefficient [KL] (KT or KP) × Kd × Kmc 1) Turf or plant factor [KT or KP] charts & tables 2) Vegetation density factor [Kd] charts & tables 3) Microclimate factor [Kmc] charts & tablesE. Landscape ET [ETL] in. C × DF. Average daily ETL in. E ÷ BSprinkler Performance Value Units SourceG. Precipitation rate [PR] in./h Override/audit or calculationH. Distribution uniformity [DUlq] decimal Override/audit or estimateI. Scheduling multiplier [SM] table or equation Soil Properties Value Units SourceJ. Soil texture category field observationK. Available water [AW] in./in. Override value/chartsL. Root zone depth in. field measurementM. Plant available water [PAW] in. K × LN. Management allowed depletion [MAD] decimal 0.5 for landscapesO. Allowed depletion [AD] in. M × NScheduling Parameters Value Units SourceP. Irrigation interval days O ÷ F [round down]Q. Water to apply in. F × PR. Lower boundary min (Q ÷ G) × 60 [round down]S. Upper boundary min R × I [round up]T. Selected run time, whole number min management decisionU. Determine cycle starts by a. Observed time to runoff Ua. min field observationor b. Site conditions Ub. cycles based on site conditions 1) Soil category C, MC = 1; M = 2; MF, F = 3 2) Slope Fl = 0, Sl = 1, Mod = 2, St = 3 3) Compaction Yes = 1, No = 0 4) Sprinkler type Spray = 1, Rotor = 0Scheduling Summary Value Units Source Water to be applied in. Q Interval days P
V. Cycle starts per day T ÷ Ua [round up] or Ub Minutes per cycle min T ÷ V [round]
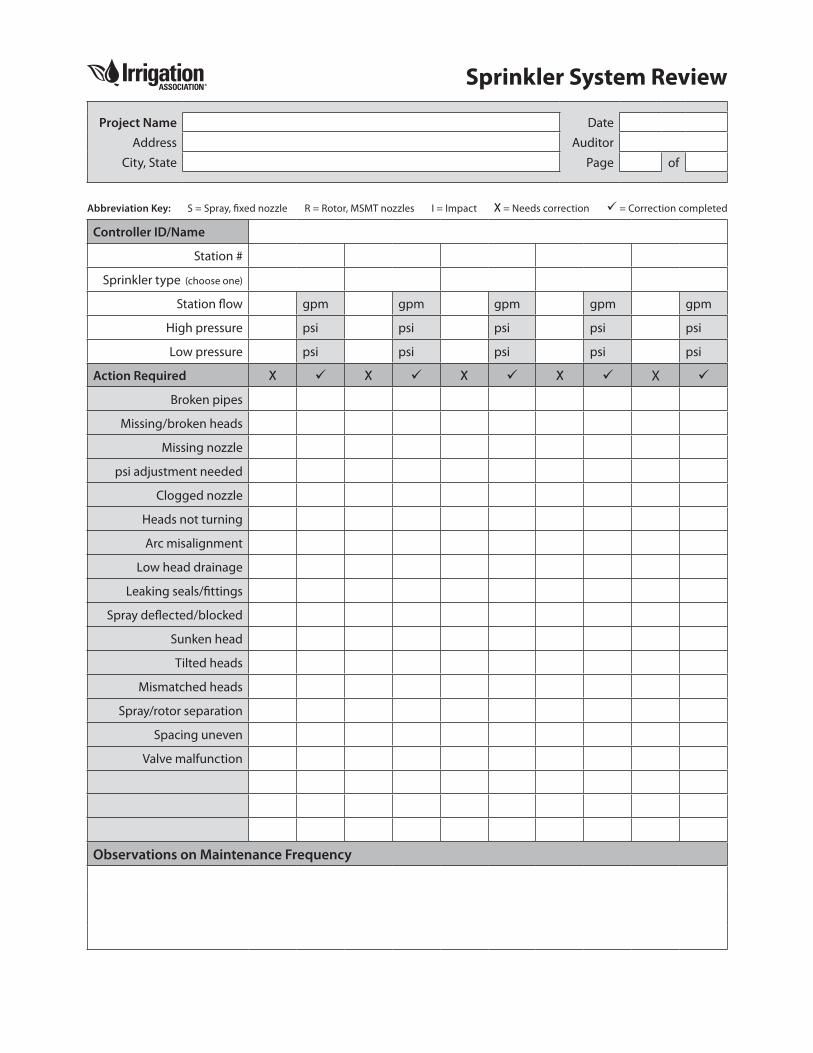
Sprinkler System Review
Project Name DateAddress Auditor
City, State Page of
Abbreviation Key: S = Spray, fixed nozzle R = Rotor, MSMT nozzles I = Impact X = Needs correction = Correction completed
Controller ID/Name
Station #
Sprinkler type (choose one)
Station flow gpm gpm gpm gpm gpm
High pressure psi psi psi psi psi
Low pressure psi psi psi psi psi
Action Required X X X X X
Broken pipes
Missing/broken heads
Missing nozzle
psi adjustment needed
Clogged nozzle
Heads not turning
Arc misalignment
Low head drainage
Leaking seals/fittings
Spray deflected/blocked
Sunken head
Tilted heads
Mismatched heads
Spray/rotor separation
Spacing uneven
Valve malfunction
Observations on Maintenance Frequency
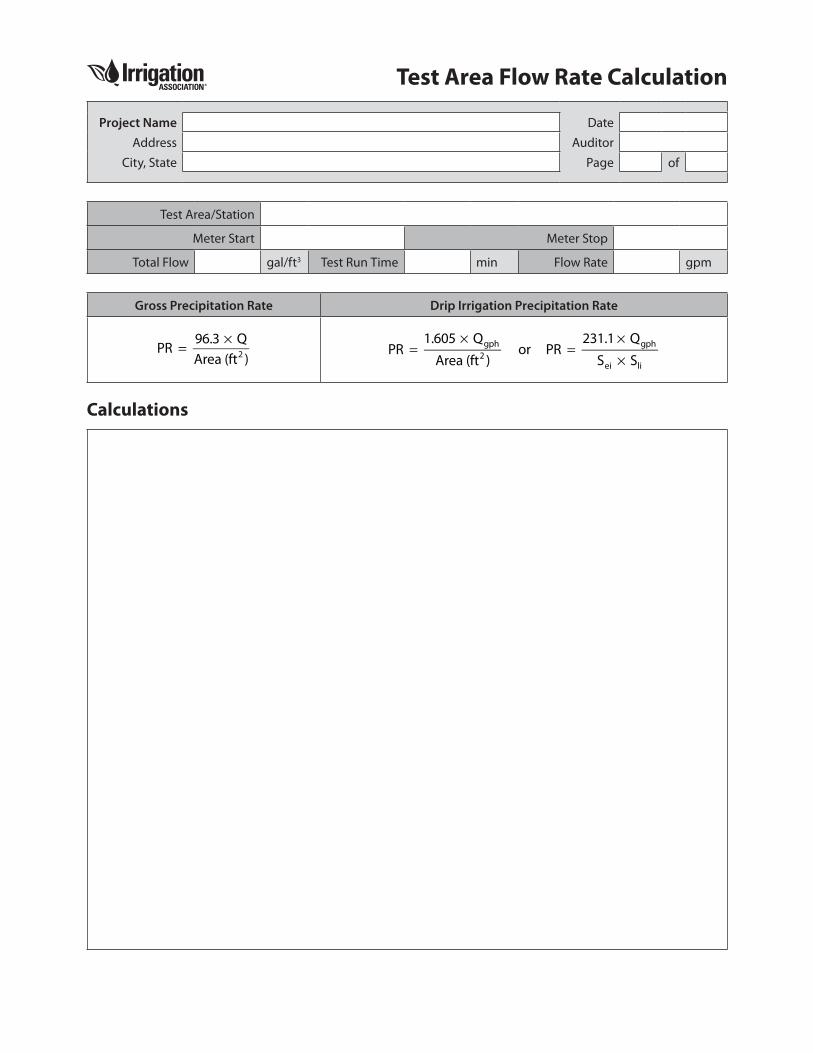
Test Area Flow Rate Calculation
Project Name DateAddress Auditor
City, State Page of
Test Area/Station
Meter Start Meter Stop
Total Flow gal/ft3 Test Run Time min Flow Rate gpm
Gross Precipitation Rate Drip Irrigation Precipitation Rate
PR = 96.3 × QArea (ft2 )
PR =1.605 × Qgph
Area (ft2 ) or PR =
231.1× Qgph
Sei × Sli
Calculations
Test Area Map
Project Name DateAddress Auditor
City, State Page of
Test Area/Station
Test Run Time min Wind mph Pressure psi
Meter Start Meter Stop Total
Water Source and System Data
Project Name DateAddress Auditor
City, State Page of
Water Source DataWater Source (check one)
Potable Reclaimed Well PondOther (explain)
Backflow Device (check one)
None RPA DCV PVB AVBSize in.
Pump or Pump Station (check one)
No YesMaximum flow gpm
Pressure psiMeter (check one)
No YesSize in.
Units (check one) gallons cubic feetAvailable pressure psi (during scheduled irrigation window)
General System Information
Water Utility
Contact person
Phone
Watering restrictions
Landscape Maintenance Co.
Contact person
Phone
Irrigation Service Co.
Contact person
Phone
Pump Service Co.
Contact person
Phone

Watering Days Irrigation Schedule
Project Name DateAddress Auditor
City, State Area/Zone/Station
Plant Water Requirement Value Units SourceA. ETO reference periodB. ETO reference period in days days Override valueC. Reference ET [ETO] in. weather dataD. Landscape coefficient [KL] (KT or KP) × Kd × Kmc 1) Turf or plant factor [KT or KP] charts & tables 2) Vegetation density factor [Kd] charts & tables 3) Microclimate factor [Kmc] charts & tablesE. Landscape ET [ETL] in. C × DF. Average daily ETL in. E ÷ BSprinkler Performance Value Units SourceG. Precipitation rate [PR] in./h Override/audit or calculationH. Distribution uniformity [DUlq] decimal Override/audit or estimateI. Scheduling multiplier [SM] table or equation Scheduling Parameters Value Units SourceJ. Irrigation interval watering days
days Override valueK. Water to apply in. J × FL. Lower boundary min (K ÷ G) × 60 [round down]M. Upper boundary min L × I [round up]N. Selected run time, whole number min management decisionO. Determine cycle starts by a. Observed time to runoff Oa. min field observationor b. Site conditions Ob. cycles based on site conditions 1) Soil category C, MC = 1; M = 2; MF, F = 3 2) Slope Fl = 0, Sl = 1, Mod = 2, St = 3 3) Compaction Yes = 1, No = 0 4) Sprinkler type Spray = 1, Rotor = 0Scheduling Summary Value Units Source Water to be applied in. K Interval days JP. Cycle starts per day N ÷ Oa [round up] or Ob Minutes per cycle min N ÷ P [round]