land use in permanent preservation areas of grande river (mg)
TRANSCRIPT
Floresta e Ambiente 2018; 25(2): e00023015http://dx.doi.org/10.1590/2179-8087.023015
ISSN 2179-8087 (online)
Original Article
Forest Management
Creative Commons License. All the contents of this journal, except where otherwise noted, is licensed under a Creative Commons Attribution License.
Land use in Permanent Preservation Areas of Grande River (MG)
Carlos Delano Cardoso de Oliveira1, Luís Antônio Coimbra Borges2, Fausto Weimar Acerbi Júnior2
1Departamento de Ciência Florestal, Universidade Estadual Paulista “Júlio de Mesquita Filho” – UNESP, Botucatu/SP, Brazil
2Departamento de Ciências Florestais, Universidade Federal de Lavras – UFLA, Lavras/MG, Brazil
ABSTRACTThe Brazilian Forestry Code established the Permanent Preservation Areas (PPAs) to preserve environmentally significant areas, such as the banks of waterways. Grande River is an important Brazilian river whose watercourse contains several hydroelectric plants, with few PPAs containing original features. Thus, this study analyzed land use in PPAs of a non-dammed stretch of the upper Rio Grande, in southern Minas Gerais. For this analysis, we used an image of the Rapideye sensor and the Maximum Likelihood classification method. The results showed the occurrence of pastures (49.63%), exposed soil (9.13%), others (0.77%), water (0.15%) and ornamental vegetation (0.13%) while the remaining native vegetation represented only 40.19% of PPAs. These numbers show that environmental laws have not been fulfilled in this area and there is strong human intervention in the PPAs studied.
Keywords: land occupation, geoprocessing, Brazilian Forestry Code.
2/11 Oliveira CDC, Borges LAC, Acerbi Júnior FW Floresta e Ambiente 2018; 25(2): e00023015
1. INTRODUCTION
Land use is directly related to water availability. Thus, it is extremely important to consider the different forms of land use in the management of watersheds, since they favorably or unfavorably affect water quality and availability (Pinto et al., 2005; Moreira et al., 2015).
Lotic aquatic systems are those that present moving water, such as rivers, while lentic systems are those characterized by stagnant or slow moving water, such as lakes and lagoons (Brasil, 2005). River barriers and the formation of reservoirs for hydroelectric use cause significant impacts on watercourses and surrounding areas. As an example, it can be mentioned the transformation from lotic to lentic aquatic systems, which causes negative effects on aquatic ecosystems due to changes in flow hydrodynamics (EPE, 2012).
Brazil’s significant hydroelectric potential is related to high water availability and relief characteristics. However, the impacts generated by these buildings are significant in the regions where they are installed and few areas manage to retain their original characteristics (Messias, 2012).
The banks of the waterways are ecotone, falling between aquatic and terrestrial ecosystems, which influences the physical-chemical and biological characteristics of these water sources (Tambosi et al., 2015). The Brazilian Forestry Code (Brasil, 1965) established these areas as Permanent Preservation Areas (PPAs), since they are located in extremely important locations from an environmental perspective and provide several ecosystem services (Reis et al., 2009; Valle et al., 2010). PPAs are
[…] areas covered or not by native vegetation, with the environmental function of preserving water resources, landscape, geological stability, biodiversity, the gene flow of fauna and flora, protecting the soil and ensuring the well-being of human populations (Brasil, 2012a).
The PPAs were established by the 1965 Forestry Code (Brasil, 1965) and, over the years, some determinations have been modified, such as their width around watercourses. Currently, the Law 12,651, 2012 (Brasil, 2012a), determines as PPAs in rural areas ranges of 30 m for watercourses with less than 10 m width, 50 m for watercourses with a width between 10 and 50 m, 100 m for watercourses with a width between 50 and 200 m, 200 m for watercourses with a
width between 200 and 600 m, 500 m for watercourses with width over 600 m, 50 m around natural lakes and lagoons with a surface area between 1 and 20 ha and 100 m around natural lakes and lagoons with a surface area over 20 ha.
Frequent anthropic action on the environment has promoted forest fragmentation and the replacement of natural areas with other types of occupancy and land use, mainly pastures and agriculture. Currently, these anthropic actions have led to intense degradation of PPAs (Reis et al., 2012; Luppi et al., 2015; Moreira et al., 2015).
The use of geotechnologies is fundamental for the study of geographic space transformations (Moreira et al., 2015). Remote sensing (RS) consists in the collection and interpretation of information at a distance of objects using the electromagnetic energy that they emit or reflect (Congalton & Green, 2008). Geographic information systems (GIS), in turn, are capable of linking information to geographic space, providing resources for precise and detailed modeling of the Earth’s surface (Oliveira et al., 2008). The integrated use of RS and GIS, in addition to advances in these areas of knowledge, has led to quicker and more efficient mapping of land use and coverage, assisting in decision-making (Reis et al., 2009; Messias, 2012; Moreira et al., 2015).
Grande River starts in the municipality of Bocaina de Minas (MG) and flows into the Paraná River, on the border of the municipalities of Santa Clara do Oeste (SP) and Carneirinho (MG). Its basin covers a drainage area of 143,437.79 km2, including 393 municipalities of São Paulo and Minas Gerais states with approximately nine million inhabitants. The Grande River has 13 dams installed along its extension and three of them are located in the microregion of Lavras: Camargos, Itutinga and Funil (IPT, 2015). The Funil hydroelectric power plant, located in the municipalities of Lavras and Perdões, began operating in 2002. It has affected farms and small towns, and environmental destabilization can be observed both in areas directly affected by damming and downstream from the dam (Messias, 2012).
The analysis of land misuse aims to identify local conditions and to guide planning and management to ensure the life quality of the population and conservation of natural resources (Messias, 2012; Nardini et al., 2012; Moreira et al., 2015). Therefore, this study had
3/11Land use in Permanent Preservation Areas…Floresta e Ambiente 2018; 25(2): e00023015
the objective of analyzing land use in PPAs around the banks of a non-dammed stretch of the Grande River, in southern Minas Gerais, Brazil.
2. MATERIAL AND METHODS
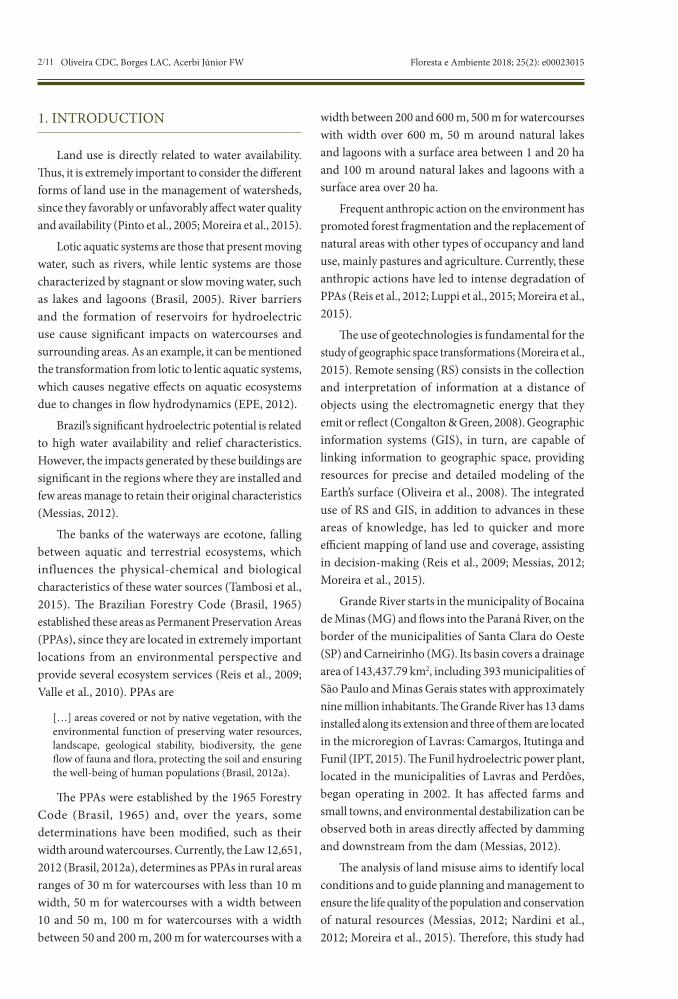
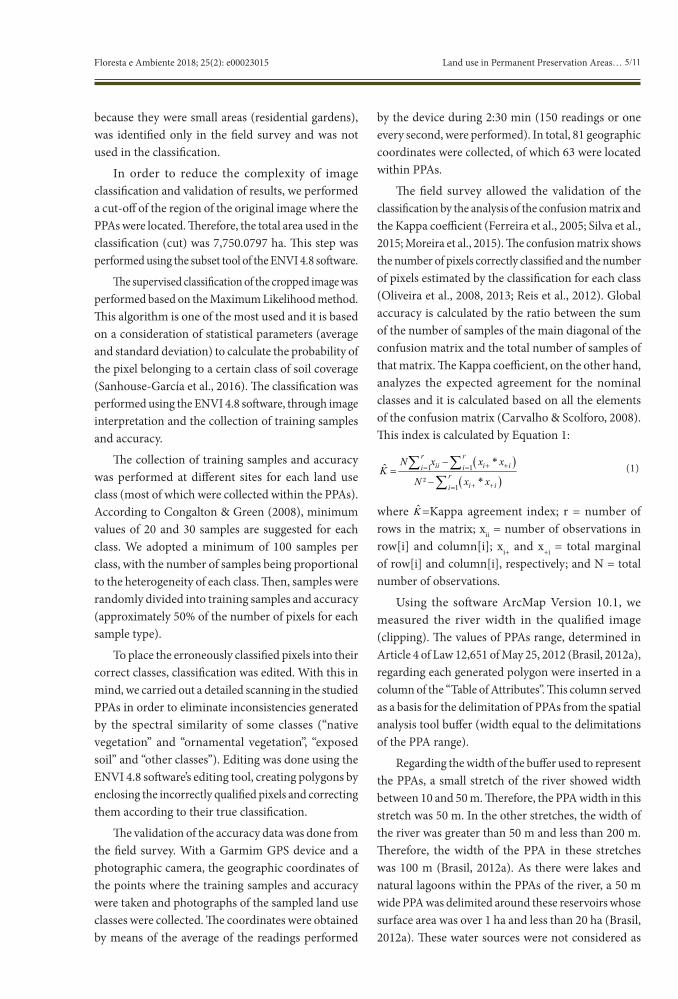
The study area corresponds to a stretch of the Grande River that begins downstream from the Funil hydroelectric power plant dam (21° 10’ 05” S and 45° 07’ 34” W) and ends at the intersection of Grande River and BR-381 (21° 08’ 35” S and 45° 02’ 27” W), including the municipalities of Lavras, Ribeirão Vermelho and Perdões, southern Minas Gerais (Figure 1). This stretch, which corresponds to the end zone of the lotic province, has a length of 20 km and its width varies from 45 to 190 m, approximately.
The area is located on the Southeast plateau. Its predominant relief is undulating and lithology is characterized by the presence of quartzites, mica schists, leucocratic, mesocratic granitic gneisses,
limestone and sand-silty sediments. The soil types present are Latosols (low slopes), Argisols (medium declivities), Argisol/Cambisols (high slopes) and Gleysols (hydromorphic wetland soils) (Messias, 2012).
According to the Köeppen classification, the climate of the region is Cwa type, which corresponds to the subtropical climate characterized by dry winter and hot summer. The annual average temperature is 19.6 °C, reaching averages of 26.5 °C and 14.8 °C in the hottest and coldest months, respectively. The normal annual rainfall is 1,511 mm and the average annual relative humidity is approximately 76% (INMET, 2015).
The natural vegetation is quite diverse, comprised of different physiognomies resulting from the transition between Atlantic Forest and savanna, with a predominance of fragments of Seasonal Semideciduous Forest (Veloso et al., 1991).
To analyze the coverage and use of PPA lands, we used one image (2329314) from the Rapideye sensor system (July 22, 2010). We chose this system due to its
Figure 1. Grande River stretch, in Southern Minas Gerais, whose PPAs were analyzed.
4/11 Oliveira CDC, Borges LAC, Acerbi Júnior FW Floresta e Ambiente 2018; 25(2): e00023015
high precision and availability in the database of the Laboratory for Studies and Projects in Forest Management (LEMAF-UFLA), which also uses information from this sensor to develop the national system of rural environmental records (SICAR).
Rapideye images have 5 m spatial resolution, five-band spectral resolution (blue, 440-510 nm, green, 520-590 nm, red, 630-685 nm, red-edge, 690-730 nm and near infrared, 760 nm-850 nm) and are marketed with high resolution geometric correction preprocessing (Reis et al., 2012). The acquired image was analyzed in the
false 5R 3G 2B color composition and its interpretation was made based on visual elements like texture, shape, tone and size (Pinto et al., 2005; Oliveira et al., 2008; Nardini et al. 2012; Moreira et al., 2015).
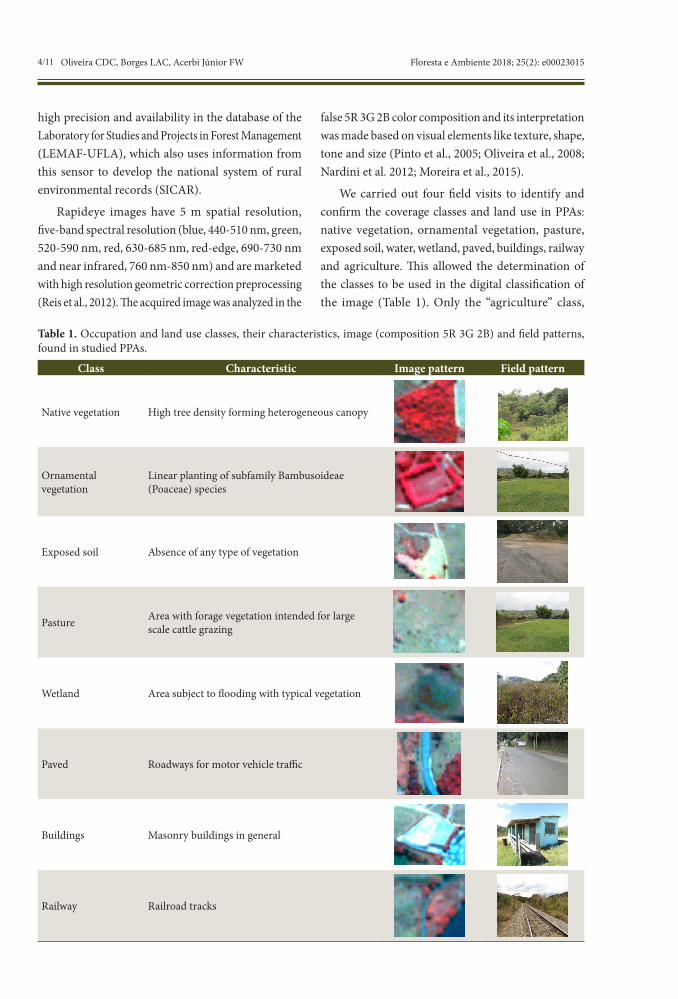
We carried out four field visits to identify and confirm the coverage classes and land use in PPAs: native vegetation, ornamental vegetation, pasture, exposed soil, water, wetland, paved, buildings, railway and agriculture. This allowed the determination of the classes to be used in the digital classification of the image (Table 1). Only the “agriculture” class,
Table 1. Occupation and land use classes, their characteristics, image (composition 5R 3G 2B) and field patterns, found in studied PPAs.
Class Characteristic Image pattern Field pattern
Native vegetation High tree density forming heterogeneous canopy
Ornamental vegetation
Linear planting of subfamily Bambusoideae (Poaceae) species
Exposed soil Absence of any type of vegetation
Pasture Area with forage vegetation intended for large scale cattle grazing
Wetland Area subject to flooding with typical vegetation
Paved Roadways for motor vehicle traffic
Buildings Masonry buildings in general
Railway Railroad tracks
5/11Land use in Permanent Preservation Areas…Floresta e Ambiente 2018; 25(2): e00023015
because they were small areas (residential gardens), was identified only in the field survey and was not used in the classification.
In order to reduce the complexity of image classification and validation of results, we performed a cut-off of the region of the original image where the PPAs were located. Therefore, the total area used in the classification (cut) was 7,750.0797 ha. This step was performed using the subset tool of the ENVI 4.8 software.
The supervised classification of the cropped image was performed based on the Maximum Likelihood method. This algorithm is one of the most used and it is based on a consideration of statistical parameters (average and standard deviation) to calculate the probability of the pixel belonging to a certain class of soil coverage (Sanhouse-García et al., 2016). The classification was performed using the ENVI 4.8 software, through image interpretation and the collection of training samples and accuracy.
The collection of training samples and accuracy was performed at different sites for each land use class (most of which were collected within the PPAs). According to Congalton & Green (2008), minimum values of 20 and 30 samples are suggested for each class. We adopted a minimum of 100 samples per class, with the number of samples being proportional to the heterogeneity of each class. Then, samples were randomly divided into training samples and accuracy (approximately 50% of the number of pixels for each sample type).
To place the erroneously classified pixels into their correct classes, classification was edited. With this in mind, we carried out a detailed scanning in the studied PPAs in order to eliminate inconsistencies generated by the spectral similarity of some classes (“native vegetation” and “ornamental vegetation”, “exposed soil” and “other classes”). Editing was done using the ENVI 4.8 software’s editing tool, creating polygons by enclosing the incorrectly qualified pixels and correcting them according to their true classification.
The validation of the accuracy data was done from the field survey. With a Garmim GPS device and a photographic camera, the geographic coordinates of the points where the training samples and accuracy were taken and photographs of the sampled land use classes were collected. The coordinates were obtained by means of the average of the readings performed
by the device during 2:30 min (150 readings or one every second, were performed). In total, 81 geographic coordinates were collected, of which 63 were located within PPAs.
The field survey allowed the validation of the classification by the analysis of the confusion matrix and the Kappa coefficient (Ferreira et al., 2005; Silva et al., 2015; Moreira et al., 2015). The confusion matrix shows the number of pixels correctly classified and the number of pixels estimated by the classification for each class (Oliveira et al., 2008, 2013; Reis et al., 2012). Global accuracy is calculated by the ratio between the sum of the number of samples of the main diagonal of the confusion matrix and the total number of samples of that matrix. The Kappa coefficient, on the other hand, analyzes the expected agreement for the nominal classes and it is calculated based on all the elements of the confusion matrix (Carvalho & Scolforo, 2008). This index is calculated by Equation 1:
( )( )
1 1
1²
ˆ *
*
r rii i ii i
ri ii
N x x xK
N x x+ += =
+ +=
−=
−
∑ ∑∑
(1)
where ˆ K=Kappa agreement index; r = number of rows in the matrix; xii = number of observations in row[i] and column[i]; xi+ and x+i = total marginal of row[i] and column[i], respectively; and N = total number of observations.
Using the software ArcMap Version 10.1, we measured the river width in the qualified image (clipping). The values of PPAs range, determined in Article 4 of Law 12,651 of May 25, 2012 (Brasil, 2012a), regarding each generated polygon were inserted in a column of the “Table of Attributes”. This column served as a basis for the delimitation of PPAs from the spatial analysis tool buffer (width equal to the delimitations of the PPA range).
Regarding the width of the buffer used to represent the PPAs, a small stretch of the river showed width between 10 and 50 m. Therefore, the PPA width in this stretch was 50 m. In the other stretches, the width of the river was greater than 50 m and less than 200 m. Therefore, the width of the PPA in these stretches was 100 m (Brasil, 2012a). As there were lakes and natural lagoons within the PPAs of the river, a 50 m wide PPA was delimited around these reservoirs whose surface area was over 1 ha and less than 20 ha (Brasil, 2012a). These water sources were not considered as
6/11 Oliveira CDC, Borges LAC, Acerbi Júnior FW Floresta e Ambiente 2018; 25(2): e00023015
an occupancy class of the PPAs and, therefore, were not part of the calculations of the area occupied by the “water” class.
Following this, still using ArcMap Version 10.1, we used the clip tool to select the land use classes that were within the PPAs. Finally, we quantified the area of each class through the value calculator of the table of attributes of the shapefile.
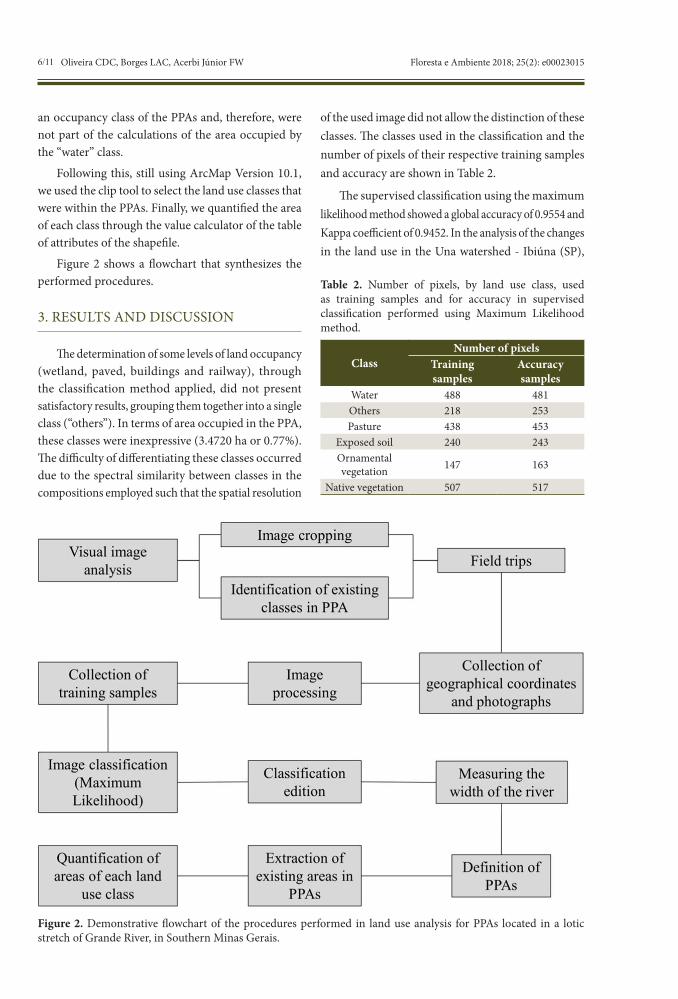
Figure 2 shows a flowchart that synthesizes the performed procedures.
3. RESULTS AND DISCUSSION
The determination of some levels of land occupancy (wetland, paved, buildings and railway), through the classification method applied, did not present satisfactory results, grouping them together into a single class (“others”). In terms of area occupied in the PPA, these classes were inexpressive (3.4720 ha or 0.77%). The difficulty of differentiating these classes occurred due to the spectral similarity between classes in the compositions employed such that the spatial resolution
of the used image did not allow the distinction of these classes. The classes used in the classification and the number of pixels of their respective training samples and accuracy are shown in Table 2.
The supervised classification using the maximum likelihood method showed a global accuracy of 0.9554 and Kappa coefficient of 0.9452. In the analysis of the changes in the land use in the Una watershed - Ibiúna (SP),
Figure 2. Demonstrative flowchart of the procedures performed in land use analysis for PPAs located in a lotic stretch of Grande River, in Southern Minas Gerais.
Table 2. Number of pixels, by land use class, used as training samples and for accuracy in supervised classification performed using Maximum Likelihood method.
ClassNumber of pixels
Training samples
Accuracy samples
Water 488 481Others 218 253Pasture 438 453
Exposed soil 240 243Ornamental vegetation 147 163
Native vegetation 507 517
7/11Land use in Permanent Preservation Areas…Floresta e Ambiente 2018; 25(2): e00023015
Andrade & Lourenço (2016) obtained values of global accuracy between 0.79 and 0.90 and Kappa coefficient between 0.60 and 0.85, using the Maximum Likelihood method. Oliveira et al. (2013), in a comparison of the methods of supervised classification with Rapideye images, achieved Kappa coefficient results of between 0.62 and 0.80 for the Maximum Likelihood method.
The high value obtained for global accuracy (0.9554) led us to conclude this index was excellent and the image produced by the Rapideye sensor is suitable for classification with the method used (Ferreira et al., 2005). The value obtained for the Kappa coefficient (0.9452) was also excellent. The Kappa coefficient is a good indicator of mapping accuracy (Ferreira et al., 2005). According to some authors (Oliveira et al., 2008; Reis et al., 2012), values between 0.8 and 1.0 for this coefficient indicate the classification presented excellent results.
Table 3 shows the confusion matrix. Oliveira et al. (2013) state that the observed pixel frequency on the main diagonal represents the agreement between expected and observed results for each class analyzed. The summation column represents the number of elements for each class, while the summation row shows the number of pixels assigned to each class.
When observing the values of the matrix referring to user accuracy, it can be noted that the great majority of classes were correctly classified according to the field truth (accuracy ≥ 97.84%). The lower user accuracy to class “ornamental vegetation” (66.95%) occurred due to its spectral similarity with the “native vegetation” class. Regarding the producer’s accuracy values, the results showed that all classes present in the field were well represented on the map (accuracy ≥ 84.91%).
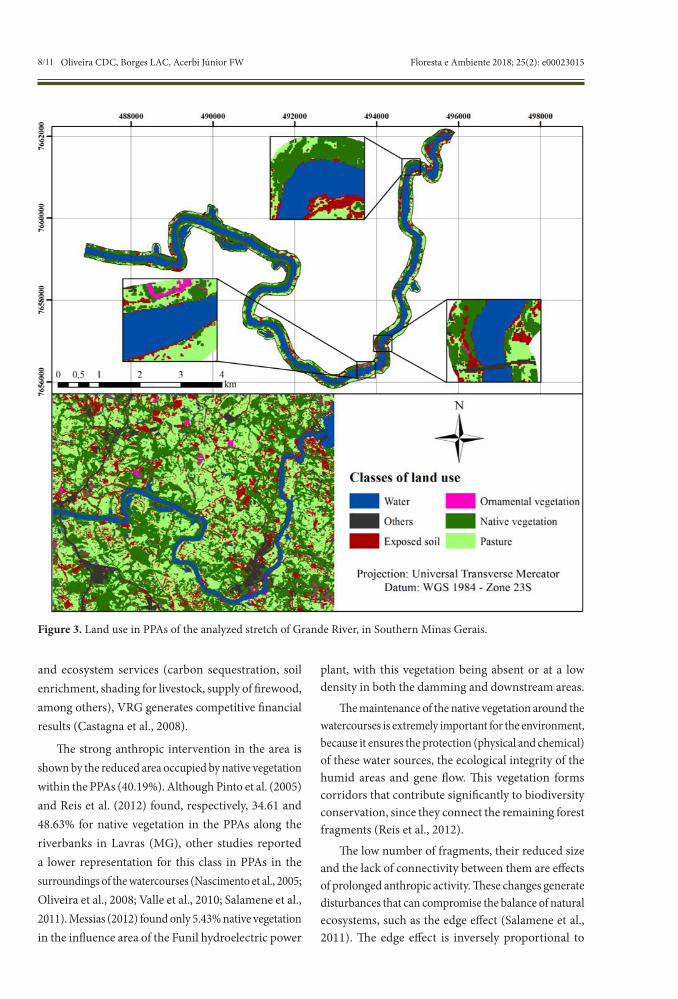
In total, the studied PPAs have an area of 450.8824 ha, which corresponds to 5.82% of the total qualified area (clipping). Figure 3 shows the map of occupancy and land use in PPAs. Table 4 the cover and land use classes found in these PPAs, as well as the total area and percentage occupied by each class.
From the results, it can be observed that pastures (49.63%) occupy most of the PPAs. In land use analysis for the riparian forests of the Ribeirão Santa Cruz watershed (Lavras, MG), Pinto et al. (2005) also identified pastures as the predominant class, occupying 53.23% of these areas. In similar studies, Nascimento et al. (2005), Oliveira et al. (2008) and Salamene et al. (2011) also
identified pasture as the predominant land use class, representing 73.71, 41.24 and 38.30% of analyzed PPAs, respectively. Messias (2012), analyzing land occupancy in the area of influence of the Funil hydroelectric power plant in the municipalities of Lavras and Perdões (MG), also identified pasture as a dominant land use class, occupying 55.45% of the studied area.
Livestock were introduced in the 18th century and stand out as an important economic activity in the region. Currently, livestock farming occurs mainly on a large scale, which increases the demand for bigger areas. This activity presents a medium degree of soil protection, with cattle trampling intensifying erosion processes, such as soil creep and compaction (Messias, 2012). Therefore, pastures tend to be the main threat to PPAs integrity along the studied watercourse.
Voisin’s rational grazing (VRG) is an alternative to combine livestock production and natural resource conservation to reduce pressure on PPAs. It is a pasture management system in which there is permanent human intervention based on pasture physiology and animal needs. Besides providing high environmental protection
Table 4. Land use classes identified in analyzed PPAs and their occupied areas, in hectares and percentage.
Class Area (ha) Area (%)Pasture 223.7897 49.63
Native vegetation 181.2256 40.19Exposed soil 41.1502 9.13
Others 3.4720 0.77Water 0.6548 0.15
Ornamental vegetation 0.5901 0.13Total 450.8824 100.00
Table 3. Confusion matrix obtained through classification of Rapideye image using Maximum Likelihood method.
Class WA NV OV PA ES OC ∑ UA%WA 481 0 0 0 0 0 481 100NV 0 439 5 0 0 0 444 98.87OV 0 78 158 0 0 0 236 66.95PA 0 0 0 453 0 10 463 97.84ES 0 0 0 0 243 1 244 99.59OC 0 0 0 0 0 242 242 100∑ 481 517 163 453 243 253 2110 -
PA% 100 84.91 96.93 100 100 95.65 - -Where WA = water; NV = native vegetation; OV = ornamental vegetation; PA = pasture; ES = exposed soil; OC = other classes; PA = producer accuracy; UA = user accuracy.
8/11 Oliveira CDC, Borges LAC, Acerbi Júnior FW Floresta e Ambiente 2018; 25(2): e00023015
and ecosystem services (carbon sequestration, soil enrichment, shading for livestock, supply of firewood, among others), VRG generates competitive financial results (Castagna et al., 2008).
The strong anthropic intervention in the area is shown by the reduced area occupied by native vegetation within the PPAs (40.19%). Although Pinto et al. (2005) and Reis et al. (2012) found, respectively, 34.61 and 48.63% for native vegetation in the PPAs along the riverbanks in Lavras (MG), other studies reported a lower representation for this class in PPAs in the surroundings of the watercourses (Nascimento et al., 2005; Oliveira et al., 2008; Valle et al., 2010; Salamene et al., 2011). Messias (2012) found only 5.43% native vegetation in the influence area of the Funil hydroelectric power
plant, with this vegetation being absent or at a low density in both the damming and downstream areas.
The maintenance of the native vegetation around the watercourses is extremely important for the environment, because it ensures the protection (physical and chemical) of these water sources, the ecological integrity of the humid areas and gene flow. This vegetation forms corridors that contribute significantly to biodiversity conservation, since they connect the remaining forest fragments (Reis et al., 2012).
The low number of fragments, their reduced size and the lack of connectivity between them are effects of prolonged anthropic activity. These changes generate disturbances that can compromise the balance of natural ecosystems, such as the edge effect (Salamene et al., 2011). The edge effect is inversely proportional to
Figure 3. Land use in PPAs of the analyzed stretch of Grande River, in Southern Minas Gerais.
9/11Land use in Permanent Preservation Areas…Floresta e Ambiente 2018; 25(2): e00023015
fragment size. Its occurrence causes loss of structural connectivity and induces fragmentation and extinction of forest remnants (Silva et al., 2015).
Regarding the exposed soil, the analysis detected a low occurrence of this class in the studied PPAs, corresponding to only 9.13%. In studies on the soil occupancy in the PPAs in the surroundings of watercourses in the municipality of Lavras (MG) and in the influence area of the reservoir of the Funil hydroelectric power plant, Pinto et al. (2005), Reis et al. (2012) and Messias (2012) also found low occupancy for this class (0.04, 4.34, and 0.78%, respectively). The maintenance of native and planted vegetation and the adoption of good pasture management practices ensure soil coverage throughout the year, which reduces surface runoff effects (Pinto et al., 2005).
Although they were present in the studied PPAs, the “others”, “water” and “ornamental vegetation” classes showed little significance, since each one accounted for less than 1% of the occupancy of these areas.
Therefore, through this study, we found that conflicting land use in the analyzed PPAs was the majority, representing at least 58.89% of these areas. Other studies identified significant conflicting use in PPAs of water sources (Nascimento et al., 2005; Valle et al., 2010; Salamene et al., 2011). On the other hand, other studies report higher occupancy of this PPA type by non-conflicting land use classes (Nardini et al., 2012; Reis et al., 2012). Despite these differences, it was noted that non-compliance with environmental legislation is common and it is necessary to increase inspections and the availability of information on land use and environmental recovery (Luppi et al., 2015).
According to Ferreira et al. (2005), the native vegetation cover that was found in the upper Grande River region was reduced to remnants and sparse areas, with most of these areas suffering from fire disturbance, extensive livestock or selective wood cutting. According to these authors, the fragments of Seasonal Semideciduous Forest were drastically reduced, since their occurrence coincides with more fertile and humid soils, mainly exploited for the development of agricultural practices.
PPAs along the watercourses are located in the most sensitive areas of the watersheds. The maintenance of their integrity ensures the reduction of surface runoff and stabilization of the banks, avoiding transportation
of sediment, nutrients and chemicals from the highest areas to the rivers and maintaining water quality, the useful life of the reservoirs, hydroelectric installations and irrigation systems (Luppi et al., 2015).
Ecological restoration is an alternative to reestablish environmental services provided by these areas (Reis et al., 2009; Valle et al., 2010; Moreira et al., 2015). However, the reduction of areas to be restored by part of Article 61-A of Law 12,727 (Brasil, 2012b) to those areas where there is consolidated use (anthropic occupation pre-existing on July 22, 2008) may compromise the recovery of services provided by PPAs (Tambosi et al., 2015).
Ecological restoration policies and practices should be encouraged in order to re-establish the original characteristics of the existing ecosystems in the PPAs. The financial compensation for rural producers and the free or subsidized supply of technical support and inputs to restore these ecosystems can lead to the resumption of their natural functioning and the provision of environmental services provided by these areas (Mattos et al., 2007).
4. CONCLUSIONS
The use of remote sensing and GIS techniques proved to be quite efficient for the analysis of PPAs occupancy, and the supervised classification performed by the Maximum Likelihood method showed satisfactory accuracy results.
The low percentage of areas with remaining natural vegetation (40.19%) and high conflicting land use (58.89%) in the PPAs shows that Law 12,651 is not being fulfilled. It is necessary to increase inspections and provide information regarding these legal determinations and the benefits of preserving PPAs.
The greatest pressure on PPAs was caused by pastures. Technical subsidies and incentives to use simple and low-cost techniques to rehabilitate and optimize degraded pastures are fundamental for intensification of livestock, reducing pressure on PPAs.
The reestablishment of PPAs functionality is essential in regions where anthropic pressure has significantly modified the landscape, as occurs in this region of southern Minas Gerais, where there is strong exploitation of hydroelectric potential.
10/11 Oliveira CDC, Borges LAC, Acerbi Júnior FW Floresta e Ambiente 2018; 25(2): e00023015
ACKNOWLEDGEMENTS
We thank Fundação de Amparo à Pesquisa de Minas Gerais (FAPEMIG) for granting the scholarship for the development of this research.
SUBMISSION STATUS
Received: 26 oct., 2015 Accepted: 9 june, 2017
CORRESPONDENCE TO
Carlos Delano Cardoso de Oliveira Departamento de Ciência Florestal, Faculdade de Ciências Agronômicas – FCA, Universidade Estadual Paulista “Júlio de Mesquita Filho” – UNESP, Rua José Barbosa de Barros, 1780, Jardim Paraíso, CEP 18610-307, Botucatu, SP, Brazil e-mail: [email protected]
REFERENCES
Andrade FM, Lourenço RW. Uso do solo e cobertura vegetal na Bacia Hidrográfica do Rio Una – Ibiúna/SP. Revista do Departamento de Geografia USP 2016; 32: 48-60.
Brasil. Lei nº 4.771 de 15 de setembro de 1965. Institui o novo Código Florestal. Diário Oficial da República Federativa do Brasil, Brasília, DF (1965 set.); Sec. 1: 9531.
Brasil. Resolução nº 357, de 17 de março de 2005. Dispõe sobre a classificação dos corpos de água e diretrizes ambientais para o seu enquadramento, bem como estabelece as condições e padrões de lançamento de efluentes, e dá outras providências. Diário Oficial da República Federativa do Brasil, Brasília, DF (2005 mar.). Sec. 1: 58-63.
Brasil. Lei nº 12.651 de 25 de maio de 2012. Dispõe sobre a proteção da vegetação nativa; altera as Leis nos 6.938, de 31 de agosto de 1981, 9.393, de 19 de dezembro de 1996, e 11.428, de 22 de dezembro de 2006; revoga as Leis nos 4.771, de 15 de setembro de 1965, e 7.754, de 14 de abril de 1989, e a Medida Provisória no 2.166-67, de 24 de agosto de 2001; e dá outras providências. Diário Oficial da República Federativa do Brasil, Brasília, DF (2012a maio); Sec. 1: 1-11.
Brasil. Lei nº 12.727, de 17 de outubro de 2012. Altera a Lei no 12.651, de 25 de maio de 2012, que dispõe sobre a proteção da vegetação nativa; altera as Leis nos 6.938, de 31 de agosto de 1981, 9.393, de 19 de dezembro de 1996, e 11.428, de 22 de dezembro de 2006; e revoga as Leis nos 4.771, de 15 de setembro de 1965, e 7.754, de 14 de abril de 1989, a Medida Provisória no 2.166-67, de 24 de agosto de 2001, o item 22 do inciso II do art. 167 da Lei no 6.015,
de 31 de dezembro de 1973, e o § 2o do art. 4o da Lei no 12.651, de 25 de maio de 2012. Diário Oficial da República Federativa do Brasil, Brasília, DF (2012b out.); Sec. 1: 1-3.
Carvalho LMT, Scolforo JRS. Inventário Florestal de Minas Gerais: monitoramento da Flora Nativa 2005-2007. Lavras: UFLA; 2008.
Castagna AA, Aronovich M, Rodrigues E. Pastoreio Racional Voisin manejo agroecológico de pastagens: manual técnico. Vol. 10. Niterói: Programa Rio Rural; 2008.
Congalton RG, Green K. Assessing the accuracy of remotely sensed data: principles and practices. 2nd ed. Boca Raton: CRC Press; 2008. http://dx.doi.org/10.1201/9781420055139.
Empresa de Pesquisa Energética – EPE. Nota técnica DEA 17/12: metodologia para avaliação socioambiental de usinas hidrelétricas. Rio de Janeiro: EPE; 2012.
Ferreira E, Santos JP, Barreto AC, Dantas AAA. Identificação de fragmentos de floresta nativa, por diferentes intérpretes, com a utilização de imagens Landsat e Cbers em Lavras, MG. Ciência e Agrotecnologia 2005; 29(3): 649-656. http://dx.doi.org/10.1590/S1413-70542005000300021.
Instituto de Pesquisas Tecnológicas – IPT. Diagnóstico da situação dos recursos hídricos na Bacia Hidrográfica do Rio Grande (BHRG) – SP/MG (Relatório Síntese – R3). São Paulo: IPT; 2015 [cited 2015 Oct 8]. Available from: http://www.grande.cbh.gov.br/_docs/outros/DiagnosticodaSituacaodosRHnoRioGrande.pdf
Instituto Nacional de Meteorologia – INMET. Normais climatológicas do Brasil 1961-1990. Brasília: INMET; 2015 [cited 2015 Oct 8]. Available from: http://www.inmet.gov.br/portal/index.php?r=clima/normaisClimatologicas
Luppi ASL, Santos AR, Eugenio FC, Feitosa LS. Utilização de geotecnologia para o mapeamento de Áreas de Preservação Permanente no município de João Neiva, ES. Floresta e Ambiente 2015; 22(1): 13-22. http://dx.doi.org/10.1590/2179-8087.0027.
Mattos ADM, Jacovine LAG, Valverde SR, Souza AL, Silva ML, Lima JE. Valoração ambiental das Áreas de Preservação Permanente da microbacia do ribeirão São Bartolomeu no município de Viçosa, MG. Revista Árvore 2007; 31(2): 347-353. http://dx.doi.org/10.1590/S0100-67622007000200018.
Messias CG. Análise comparativa entre o mapeamento de uso do solo e cobertura vegetal utilizando imagens de média e alta resolução espacial. Revista Geonorte 2012; 2(4): 1230-1243.
Moreira TR, Santos AR, Dalfi RL, Campos RF, Santos GMADA, Eugenio FC. Confronto do uso e ocupação da terra em APPs no município de Muqui, ES. Floresta e Ambiente 2015; 22(2): 141-152. http://dx.doi.org/10.1590/2179-8087.019012.
Nardini RC, Campos S, Gomes LN, Moreira KF, Piza MWT. Analysis of land use and occupancy in Preservation Permanent Areas according to the hydrography of Ribeirão
11/11Land use in Permanent Preservation Areas…Floresta e Ambiente 2018; 25(2): e00023015
Água Fria – Bofete, SP – Brazil. Revista Engenharia Agrícola 2012; 32(5): 944-950. http://dx.doi.org/10.1590/S0100-69162012000500013.
Nascimento MC, Soares VP, Ribeiro CAAS, Silva E. Uso do geoprocessamento na identificação de conflito de uso das terras em Áreas de Preservação Permanente na bacia hidrográfica do Rio Alegre, Espírito Santo. Ciência Florestal 2005; 15(2): 207-220. http://dx.doi.org/10.5902/198050981838.
Oliveira FP, Fernandes EI Fo, Soares VP, Souza AL. Mapeamento de fragmentos florestais com monodominância de aroeira a partir da classificação supervisionada de imagens Rapideye. Revista Árvore 2013; 37(1): 151-161. http://dx.doi.org/10.1590/S0100-67622013000100016.
Oliveira FS, Soares VP, Pezzopane JEM, Gleriani JM, Lima GS, Silva E et al. Identificação de conflito de uso das terras em Áreas de Preservação Permanente no entorno do Parque Nacional do Caparaó, Estado de Minas Gerais. Revista Árvore 2008; 32(5): 899-908. http://dx.doi.org/10.1590/S0100-67622008000500015.
Pinto LVA, Ferreira E, Botelho SA, Davide AC. Caracterização física da bacia hidrográfica do ribeirão Santa Cruz, Lavras, MG e uso conflitante da terra em suas Áreas de Preservação Permanente. Revista Cerne 2005; 11(1): 49-60.
Reis AA, Teixeira MD, Acerbi FW Jr, Mello JM, Leite LR, Silva ST. Land use and occupation analysis of Permanent Preservation Areas in Lavras county, MG. Ciência e Agrotecnologia 2012; 36(3): 300-308. http://dx.doi.org/10.1590/S1413-70542012000300005.
Reis LC, Reis TES, Saab OJGA. Diagnóstico das Áreas de Preservação Permanente das microbacias hidrográficas do município de Bandeirantes – Paraná. Semina:
Ciências Agrárias 2009; 30(3): 527-536. http://dx.doi.org/10.5433/1679-0359.2009v30n3p527.
Salamene S, Francelino MR, Valcarcel R, Lani JL, Sá MMF. Estratificação e caracterização ambiental da Área de Preservação Permanente do Rio Guandu/RJ. Revista Árvore 2011; 35(2): 221-231. http://dx.doi.org/10.1590/S0100-67622011000200007.
Sanhouse-García AJ, Rangel-Peraza JG, Bustos-Terrones Y, García-Ferrer A, Mesas-Carrascosa F. Land use mapping from CBERS-2 images with open source tools by applying different classification algorithms. Physics and Chemistry of the Earth 2016; 91: 27-37. http://dx.doi.org/10.1016/j.pce.2015.12.004.
Silva RA, Pereira JAA, Barros DA, Borges LAC, Teixeira MD, Acerbi-Jr FW. Avaliação da cobertura florestal na paisagem de Mata Atlântica no ano de 2010, na região de Ouro Preto – MG. Cerne 2015; 21(2): 301-309. http://dx.doi.org/10.1590/01047760201521021539.
Tambosi LR, Vidal MM, Ferraz SFB, Metzger JP. Funções eco-hidrológicas das florestas nativas e o Código Florestal. Estudos Avançados 2015; 29(84): 151-162. http://dx.doi.org/10.1590/S0103-40142015000200010.
Valle RF Jr, Passos AO, Abdala VL, Ramos TG. Determinação das Áreas de Preservação Permanente da bacia hidrográfica do rio Uberaba – MG, utilizando o Sistema de Informação Geográfica – SIG. Global Science and Technology 2010; 3(1): 19-29.
Veloso HP, Rangel AL Fo, Lima JCA. Classificação da vegetação brasileira, adaptado a um sistema universal. Rio de Janeiro: Departamento de Recursos Naturais e Estudos Ambientais, IBGE; 1991.