land use and management: the australian...
TRANSCRIPT
Land use and management: the Australian context Rob Lesslie and Jodie Mewett
Research by the Australian Bureau of Agricultural
and Resource Economics and Sciences
Research report 13.1 January 2013
© Commonwealth of Australia 2013 Ownership of intellectual property rights Unless otherwise noted, copyright (and any other intellectual property rights, if any) in this publication is owned by the Commonwealth of Australia (referred to as the Commonwealth). Creative Commons licence All material in this publication is licensed under a Creative Commons Attribution 3.0 Australia Licence, save for content supplied by third parties, logos and the Commonwealth Coat of Arms.
Creative Commons Attribution 3.0 Australia Licence is a standard form licence agreement that allows you to copy, distribute, transmit and adapt this publication provided you attribute the work. A summary of the licence terms is available from creativecommons.org/licenses/by/3.0/au/deed.en. The full licence terms are available from creativecommons.org/licenses/by/3.0/au/legalcode. This publication (and any material sourced from it) should be attributed as: Lesslie, R & Mewett, J 2013, Land use and management: the Australian context, ABARES research report 13.1, Canberra, January. CC BY 3.0. Cataloguing data Lesslie, R & Mewett, J 2013, Land use and management: the Australian context, ABARES research report 13.1, Canberra, January. ISSN 1447-8358 ISBN 978-1-74323-046-6 ABARES project 43374 Internet Land use and management: the Australian context is available at daff.gov.au/abares/publications. Australian Bureau of Agricultural and Resource Economics and Sciences (ABARES) Postal address GPO Box 1563 Canberra ACT 2601 Switchboard +61 2 6272 2010 Facsimile +61 2 6272 2001 Email [email protected] Web daff.gov.au/abares Inquiries regarding the licence and any use of this document should be sent to [email protected].
The Australian Government acting through the Department of Agriculture, Fisheries and Forestry represented by the
Australian Bureau of Agricultural and Resource Economics and Sciences, has exercised due care and skill in the preparation
and compilation of the information and data in this publication. Notwithstanding, the Department of Agriculture, Fisheries
and Forestry, ABARES, its employees and advisers disclaim all liability, including liability for negligence, for any loss,
damage, injury, expense or cost incurred by any person as a result of accessing, using or relying upon any of the information
or data in this publication to the maximum extent permitted by law.
Land use and management: the Australian context ABARES
iii
Contents
List of acronyms .............................................................................................................................................. v
Background ...................................................................................................................................................... vi
1 Introduction .......................................................................................................................................... 1
2 Key land statistics ............................................................................................................................... 2
3 History ..................................................................................................................................................... 4
4 Current situation ................................................................................................................................. 5
Policy/legislation framework ......................................................................................................... 5
Agricultural land management ...................................................................................................... 5
Natural resources ................................................................................................................................ 7
Environment protection ................................................................................................................ 11
5 Outlook ................................................................................................................................................. 13
Climate change .................................................................................................................................. 13
Pests, diseases and weeds ............................................................................................................. 13
Biosecurity .......................................................................................................................................... 13
Land use ............................................................................................................................................... 14
Ecosystem services .......................................................................................................................... 18
6 Research capacity—land use and management ................................................................... 19
Tracking and reporting change ................................................................................................... 19
7 Key issues ............................................................................................................................................ 23
8 Potential areas for collaboration ................................................................................................ 24
References ...................................................................................................................................................... 25
Tables
Table 1 Land use in Australia, 2005–06 ................................................................................................ 3
Table 2 Summary of characteristics and management of Australian farm businesses (farmers) ................................................................................................................................................ 6
Table 3 Weighting factors ........................................................................................................................ 17
Figures
Figure 1 Agricultural land use change, 1992–93 to 2009–10 .................................................... 15
Figure 2 Cultivation practices for crops and pastures, 1995–96 to 2009–10 ..................... 18
Figure 3 MCAS-S project screenshot to determine the extent and severity of wind erosion in Australia ......................................................................................................................... 22
Land use and management: the Australian context ABARES
iv
Maps
Map 1 National land use of Australia, 2005–06 .................................................................................. 2
Map 2 Cultivation practices, by natural resource management region .................................... 7
Map 3 Mean annual rainfall of Australia ............................................................................................... 8
Map 4 Long-term average run-off from Australia's drainage divisions .................................... 9
Map 5 Australian soil types ..................................................................................................................... 10
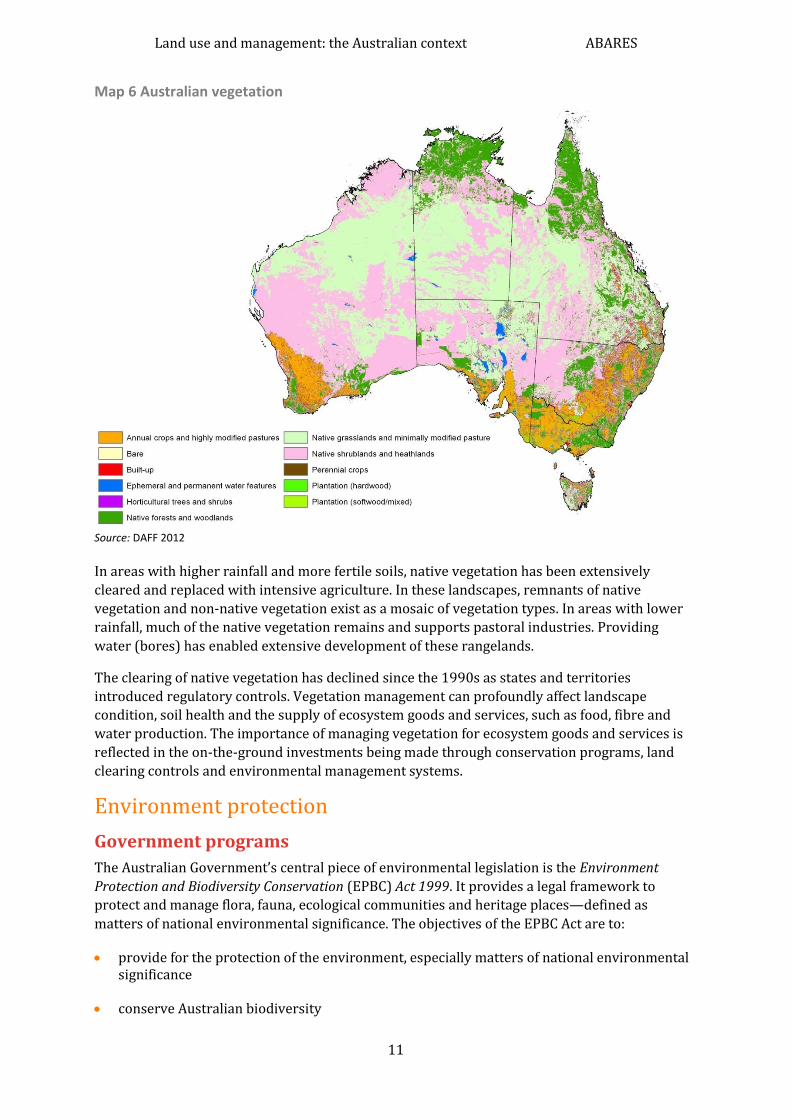
Map 6 Australian vegetation ................................................................................................................... 11
Map 7 Change in area cropped, 1993–94 to 2005–06 .................................................................. 16
Map 8 Change in agricultural land use intensification, 1985–86 to 2005–06 ..................... 17
Land use and management: the Australian context ABARES
v
List of acronyms ABARES Australian Bureau of Agricultural and Resource Economics and Sciences
ABS Australian Bureau of Statistics
ACEDP Australia China Environment Development Partnership
ACLUMP Australian Collaborative Land Use and Management Program
AVHRR Advanced Very High Resolution Radiometer
CSIRO Commonwealth Scientific and Industrial Research Organisation
DAFF Department of Agriculture, Fisheries and Forestry
EPBC Act Environment Protection and Biodiversity Conservation Act 1999
FEDRC China State Forestry Administration – Forestry Economics and Development
Research Center
GIS Geographic information system
MODIS Moderate Resolution Imaging Spectroradiometer
MODIS NBAR MODIS Nadir Bi-directional Reflectance Distribution Function Adjusted
Reflectance
MODIS EVI MODIS Enhanced Vegetation Index
MCAS-S Multi-Criteria Analysis Shell for Spatial Decision Support
Land use and management: the Australian context ABARES
vi
Background This paper is one of two background papers prepared as part of a collaborative project between
ABARES and the Forestry Economics and Development Research Center (FEDRC) of China’s
State Forestry Administration to develop a sustainable land and forest management research
agenda. The other paper is Sustainable forest management: the Australian context (Clancy &
Howell 2013).
The Sustainable Land and Forest Management Research Agenda project, funded through
AusAID’s Australia China Environment Development Partnership (ACEDP) program, has
strengthened technical cooperation in areas of common interest in sustainable forest
management and land resources assessment.
The two background papers supported discussions held by FEDRC and ABARES (in Beijing in
October 2011 and in Canberra in December 2011). The discussions led to agreement on
common areas of research interest in sustainable forest management and land resources
assessment. The project partners ABARES and FEDRC intend to use the papers as background
information to support collaborative engagement and as reports to the ACEDP managing
contractor (GHD Pty Ltd) and AusAID.
Land use and management: the Australian context ABARES
1
1 Introduction Australia has unique land, water, vegetation and biodiversity resources. Australia’s 7.7 million
square kilometres supports a wide range of agricultural and forestry industries. Production from
natural resources earns over $38 billion a year in exports from agriculture, fisheries and
forestry. Competitive pressures are driving the need for improved productivity, which includes
increased diversification and intensification. These trends are occurring against a background of
increased climate variability.
The way land is used has a profound effect on Australia’s social and ecological systems. There is
a strong link between changes in land use and environmental, economic and social conditions.
Information on land use and management is fundamental to understanding landscapes,
agricultural production and the management of natural resources.
Land use choices have a major effect on our food production, natural environment and
communities. Land use change and land management is central to current debate in Australia
around food security, water, climate change adaptation, population and urban expansion.
Informed land use and land management choices are critical to developing effective responses to
natural resource management priorities such as biodiversity protection, sustainable and
productive agriculture, water quality and quantity, salinity, and food security.
Land use and management: the Australian context ABARES
2
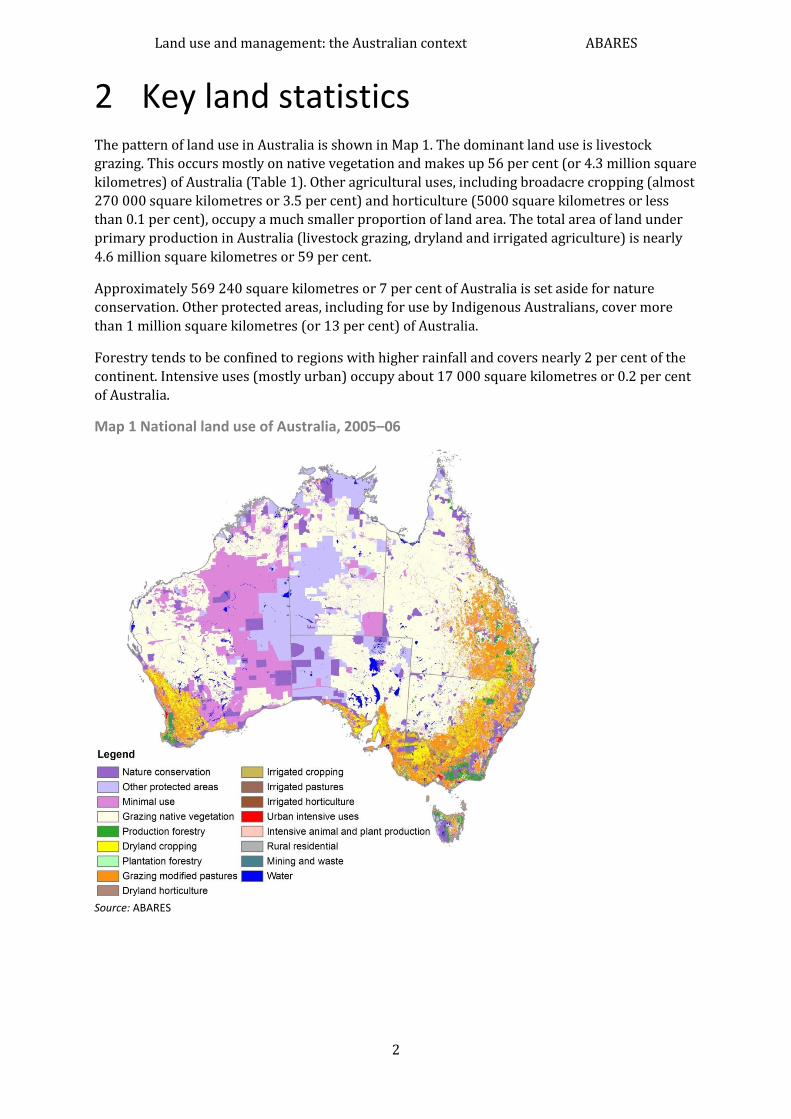
2 Key land statistics The pattern of land use in Australia is shown in Map 1. The dominant land use is livestock
grazing. This occurs mostly on native vegetation and makes up 56 per cent (or 4.3 million square
kilometres) of Australia (Table 1). Other agricultural uses, including broadacre cropping (almost
270 000 square kilometres or 3.5 per cent) and horticulture (5000 square kilometres or less
than 0.1 per cent), occupy a much smaller proportion of land area. The total area of land under
primary production in Australia (livestock grazing, dryland and irrigated agriculture) is nearly
4.6 million square kilometres or 59 per cent.
Approximately 569 240 square kilometres or 7 per cent of Australia is set aside for nature
conservation. Other protected areas, including for use by Indigenous Australians, cover more
than 1 million square kilometres (or 13 per cent) of Australia.
Forestry tends to be confined to regions with higher rainfall and covers nearly 2 per cent of the
continent. Intensive uses (mostly urban) occupy about 17 000 square kilometres or 0.2 per cent
of Australia.
Map 1 National land use of Australia, 2005–06
Source: ABARES
Land use and management: the Australian context ABARES
3
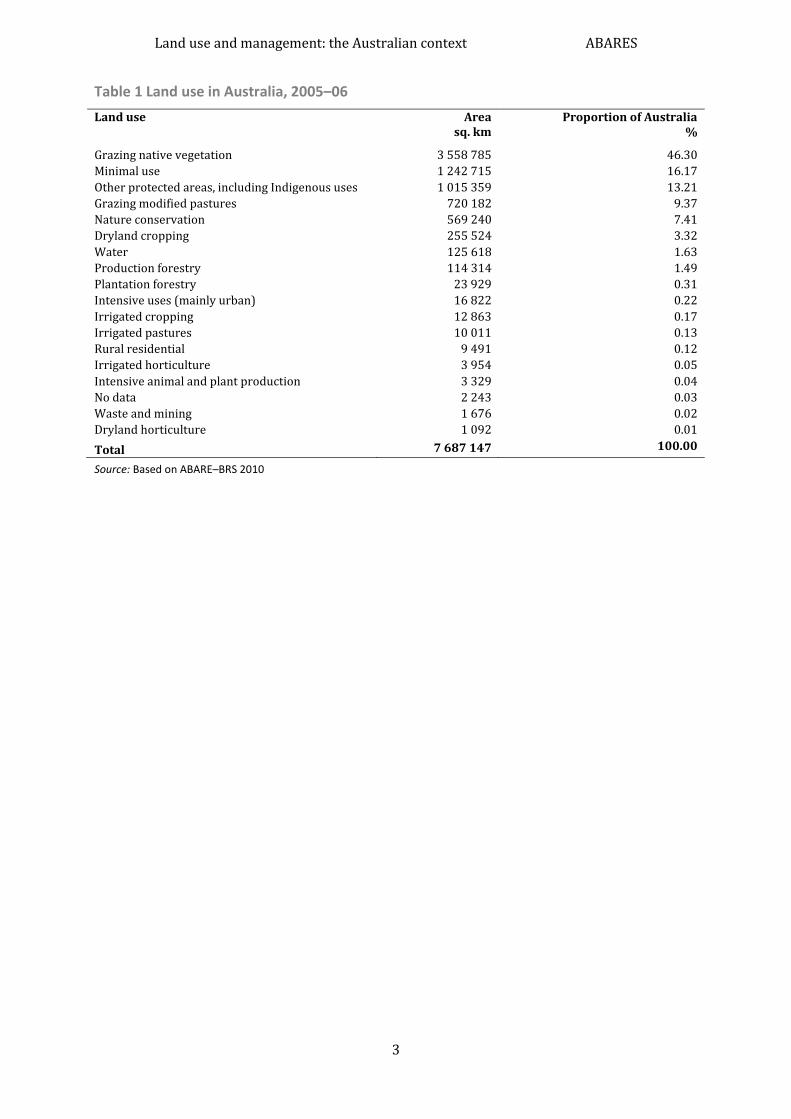
Table 1 Land use in Australia, 2005–06
Land use Area Proportion of Australia sq. km %
Grazing native vegetation 3 558 785 46.30
Minimal use 1 242 715 16.17
Other protected areas, including Indigenous uses 1 015 359 13.21
Grazing modified pastures 720 182 9.37
Nature conservation 569 240 7.41
Dryland cropping 255 524 3.32
Water 125 618 1.63
Production forestry 114 314 1.49
Plantation forestry 23 929 0.31
Intensive uses (mainly urban) 16 822 0.22
Irrigated cropping 12 863 0.17
Irrigated pastures 10 011 0.13
Rural residential 9 491 0.12
Irrigated horticulture 3 954 0.05
Intensive animal and plant production 3 329 0.04
No data 2 243 0.03
Waste and mining 1 676 0.02
Dryland horticulture 1 092 0.01
Total 7 687 147 100.00
Source: Based on ABARE–BRS 2010
Land use and management: the Australian context ABARES
4
3 History Aboriginal occupation of Australia has been associated with systematic burning of vegetation to
increase the availability of plant and animal foods and reduce fuel for wildfires (Gammage
2011). Since European settlement about two centuries ago, Australia’s landscapes have changed
significantly. European settlement began with early pastoralism, cropping and prospecting, and
led to today’s major agricultural, forest and mining industries, reserve landscapes and urban
communities. Land use change over this period was driven by relatively unrestricted access to
land, technological change and growth in productivity and population.
More recently, land has been increasingly managed for multiple objectives, including food, fibre,
minerals, energy, landscape amenity, water, carbon and biodiversity. A well-managed landscape
provides high-quality, essential ecosystem services to farmers and the Australian community.
Australian governments have implemented a mix of programs and regulations to enhance land
management and use. The Australian Government has also invested in programs to improve
land management practices, such as the Natural Heritage Trust, the National Action Plan for
Salinity and Water Quality and Caring for our Country.
Land use and management: the Australian context ABARES
5
4 Current situation
Policy/legislation framework
Significant areas of Australia are used for livestock grazing on native pastures. This may be
freehold or public land leased by private landholders. Agricultural uses, including cropping and
livestock grazing on improved pastures, urban uses, other intensive uses and Indigenous uses
are mainly located on privately owned (freehold) land. Most land allocated to forestry (native
forests) and nature conservation is publicly owned and managed.
Australia has six states and two mainland territories. Under the Australian Constitution, the
state governments have prime responsibility for land administration and public land
management. The Australian Government has a limited land ownership and management role.
Its primary role is to promote more efficient land management and land allocation. An example
is the National Forest Policy process, which has established a nationally agreed basis for
determining forest assessment and resource allocation principles, resource inventory and
national reporting. There are similar national coordination processes for nature conservation;
for example, through the National Reserve System. Important themes of governance at the state
level include urban and rural land zoning, forestry plantations, mining development, and
environmental regulations around native vegetation management.
There are three key challenges:
1. Land use governance and tenure arrangements need to accommodate multi-objective land use and land management options. Modern approaches to nature conservation include joint management and partnership arrangements that can simultaneously provide for multiple uses that can include biodiversity protection, recreation uses, Indigenous cultural uses, mineral exploration, mining and grazing production.
2. Land use and land management incentives for non-market ecosystem goods and services may play an important role. These may be applied where these goods and services are not adequately reflected in market systems.
3. Sufficient data and information is required to support informed land use and management planning. This includes decision support capability to enable informed, transparent consideration of options and trade-offs.
Agricultural land management
In 2007–08 the Australian Bureau of Statistics (ABS) surveyed farmers about their land
management practices. Table 2 shows characteristics of Australian farms broken into four major
industries: broadacre cropping, horticulture, dairying and grazing (beef cattle/sheep meat).
Land use and management: the Australian context ABARES
6
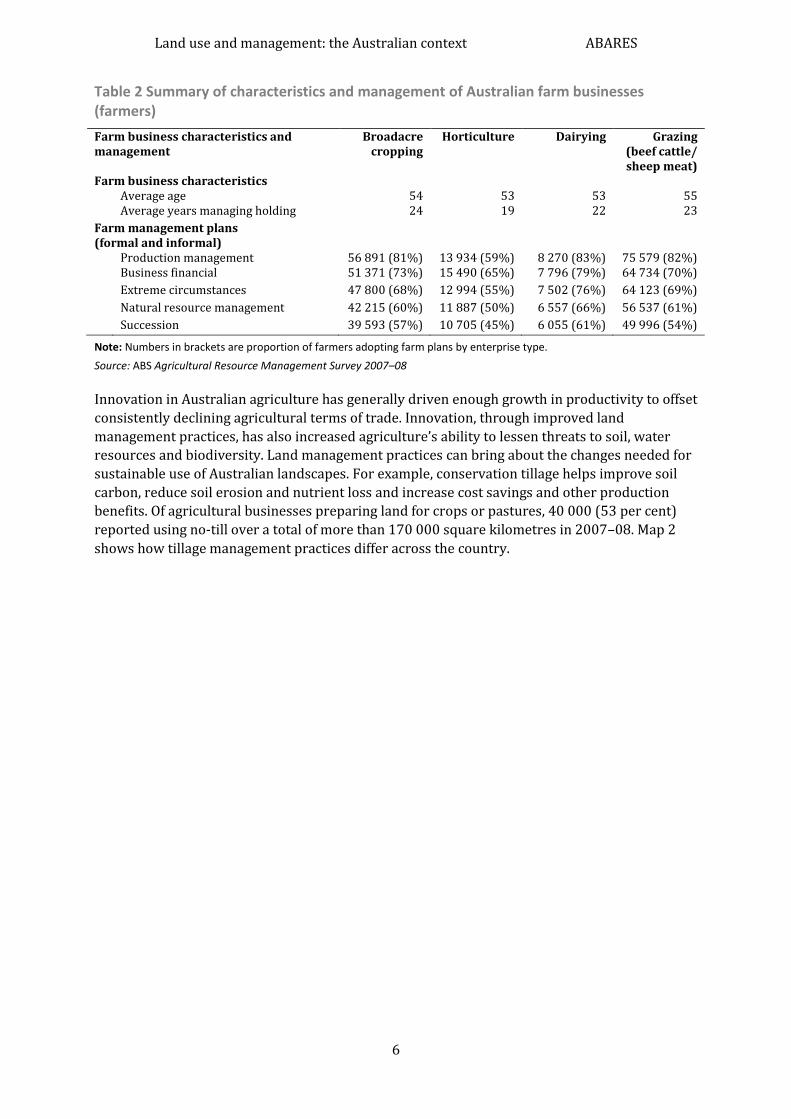
Table 2 Summary of characteristics and management of Australian farm businesses (farmers)
Farm business characteristics and management
Broadacre cropping
Horticulture Dairying Grazing (beef cattle/ sheep meat)
Farm business characteristics Average age 54 53 53 55
Average years managing holding 24 19 22 23
Farm management plans (formal and informal)
Production management 56 891 (81%) 13 934 (59%) 8 270 (83%) 75 579 (82%)
Business financial 51 371 (73%) 15 490 (65%) 7 796 (79%) 64 734 (70%)
Extreme circumstances 47 800 (68%) 12 994 (55%) 7 502 (76%) 64 123 (69%)
Natural resource management 42 215 (60%) 11 887 (50%) 6 557 (66%) 56 537 (61%)
Succession 39 593 (57%) 10 705 (45%) 6 055 (61%) 49 996 (54%)
Note: Numbers in brackets are proportion of farmers adopting farm plans by enterprise type.
Source: ABS Agricultural Resource Management Survey 2007–08
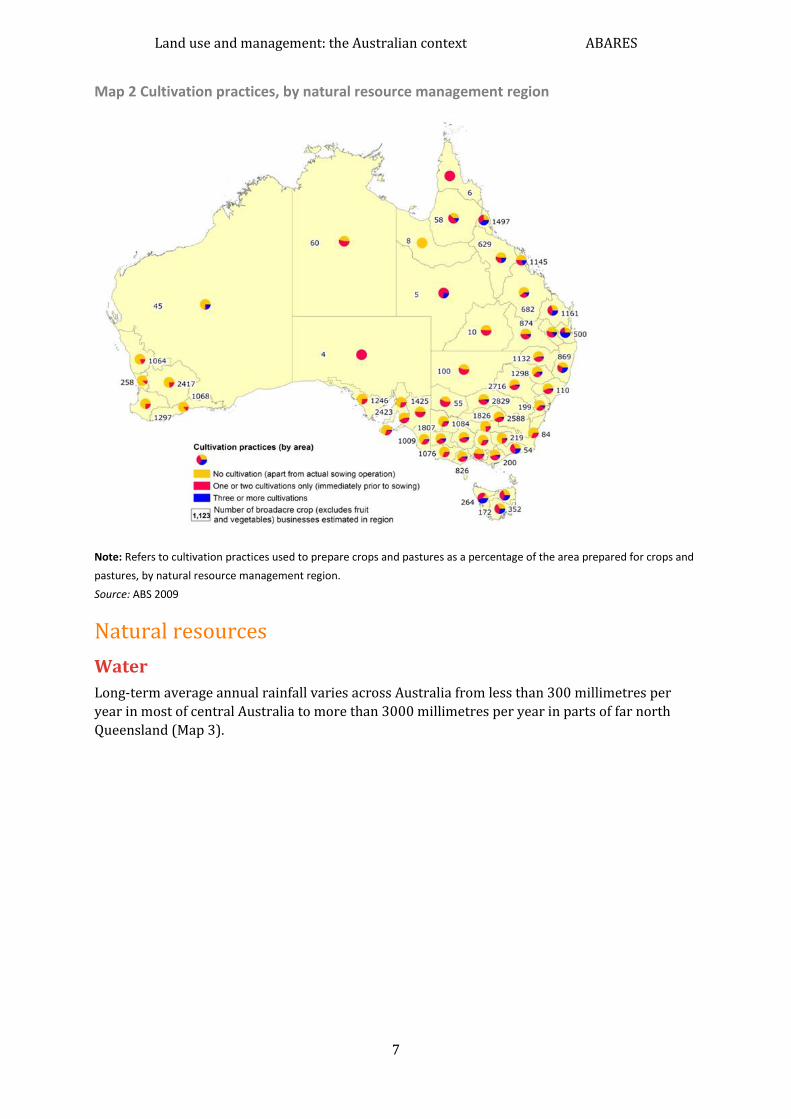
Innovation in Australian agriculture has generally driven enough growth in productivity to offset
consistently declining agricultural terms of trade. Innovation, through improved land
management practices, has also increased agriculture’s ability to lessen threats to soil, water
resources and biodiversity. Land management practices can bring about the changes needed for
sustainable use of Australian landscapes. For example, conservation tillage helps improve soil
carbon, reduce soil erosion and nutrient loss and increase cost savings and other production
benefits. Of agricultural businesses preparing land for crops or pastures, 40 000 (53 per cent)
reported using no-till over a total of more than 170 000 square kilometres in 2007–08. Map 2
shows how tillage management practices differ across the country.
Land use and management: the Australian context ABARES
7
Map 2 Cultivation practices, by natural resource management region
Note: Refers to cultivation practices used to prepare crops and pastures as a percentage of the area prepared for crops and
pastures, by natural resource management region.
Source: ABS 2009
Natural resources
Water
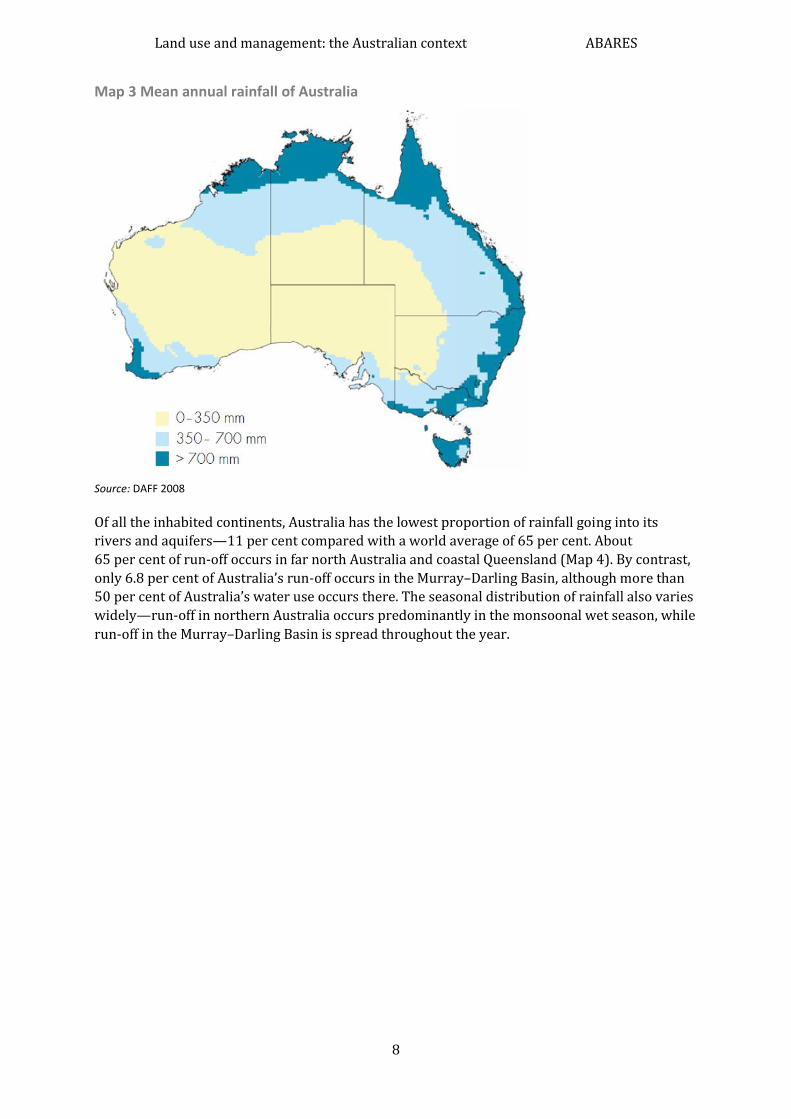
Long-term average annual rainfall varies across Australia from less than 300 millimetres per
year in most of central Australia to more than 3000 millimetres per year in parts of far north
Queensland (Map 3).
Land use and management: the Australian context ABARES
8
Map 3 Mean annual rainfall of Australia
Source: DAFF 2008
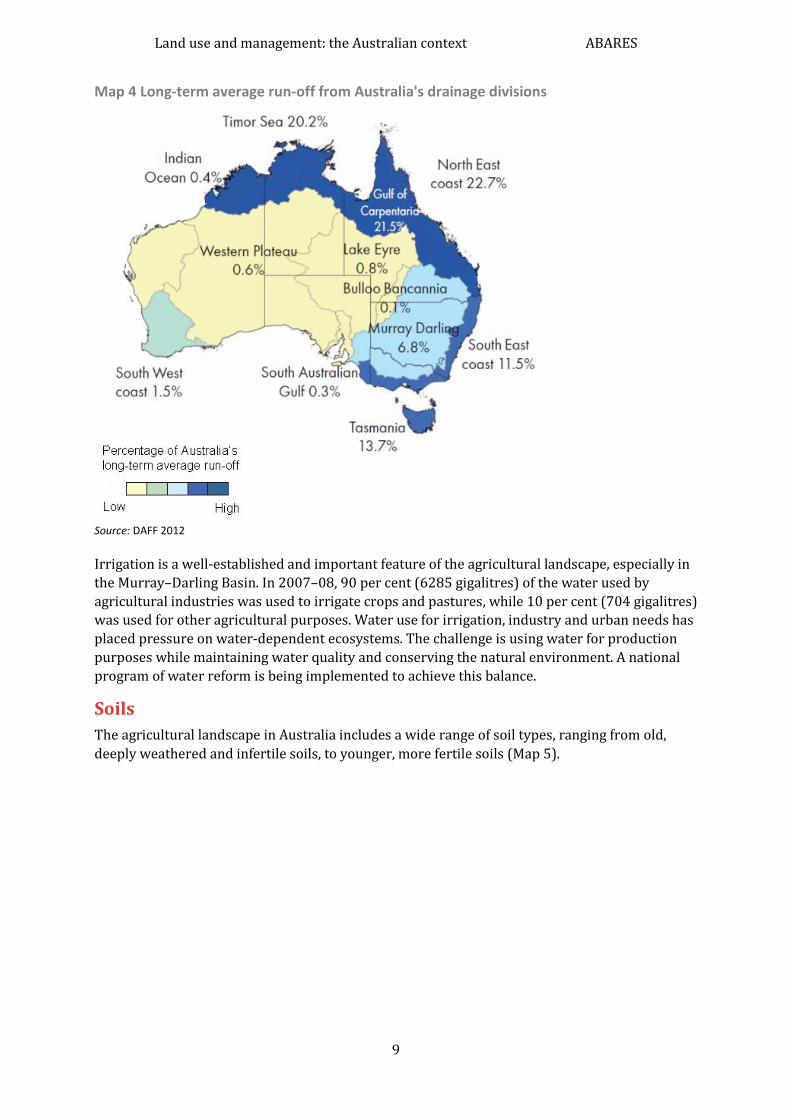
Of all the inhabited continents, Australia has the lowest proportion of rainfall going into its
rivers and aquifers—11 per cent compared with a world average of 65 per cent. About
65 per cent of run-off occurs in far north Australia and coastal Queensland (Map 4). By contrast,
only 6.8 per cent of Australia’s run-off occurs in the Murray–Darling Basin, although more than
50 per cent of Australia’s water use occurs there. The seasonal distribution of rainfall also varies
widely—run-off in northern Australia occurs predominantly in the monsoonal wet season, while
run-off in the Murray–Darling Basin is spread throughout the year.
Land use and management: the Australian context ABARES
9
Map 4 Long-term average run-off from Australia's drainage divisions
Source: DAFF 2012
Irrigation is a well-established and important feature of the agricultural landscape, especially in
the Murray–Darling Basin. In 2007–08, 90 per cent (6285 gigalitres) of the water used by
agricultural industries was used to irrigate crops and pastures, while 10 per cent (704 gigalitres)
was used for other agricultural purposes. Water use for irrigation, industry and urban needs has
placed pressure on water-dependent ecosystems. The challenge is using water for production
purposes while maintaining water quality and conserving the natural environment. A national
program of water reform is being implemented to achieve this balance.
Soils
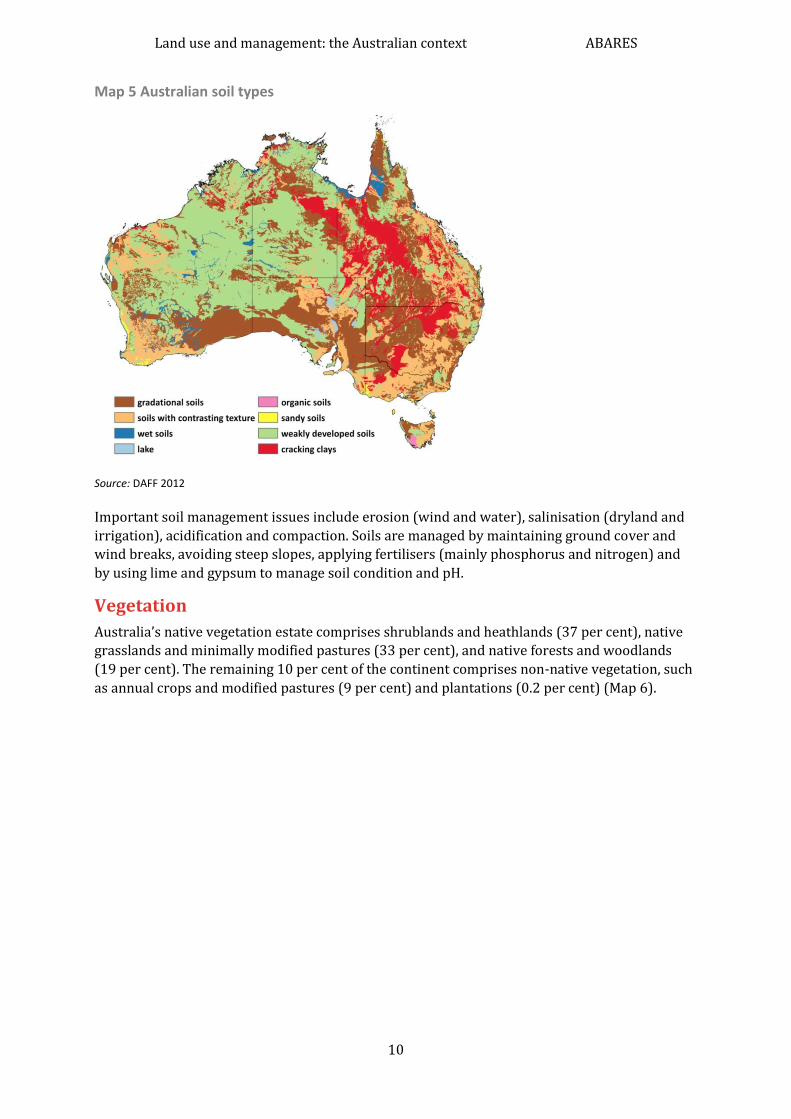
The agricultural landscape in Australia includes a wide range of soil types, ranging from old,
deeply weathered and infertile soils, to younger, more fertile soils (Map 5).
Land use and management: the Australian context ABARES
10
Map 5 Australian soil types
Source: DAFF 2012
Important soil management issues include erosion (wind and water), salinisation (dryland and
irrigation), acidification and compaction. Soils are managed by maintaining ground cover and
wind breaks, avoiding steep slopes, applying fertilisers (mainly phosphorus and nitrogen) and
by using lime and gypsum to manage soil condition and pH.
Vegetation
Australia’s native vegetation estate comprises shrublands and heathlands (37 per cent), native
grasslands and minimally modified pastures (33 per cent), and native forests and woodlands
(19 per cent). The remaining 10 per cent of the continent comprises non-native vegetation, such
as annual crops and modified pastures (9 per cent) and plantations (0.2 per cent) (Map 6).
Land use and management: the Australian context ABARES
11
Map 6 Australian vegetation
Source: DAFF 2012
In areas with higher rainfall and more fertile soils, native vegetation has been extensively
cleared and replaced with intensive agriculture. In these landscapes, remnants of native
vegetation and non-native vegetation exist as a mosaic of vegetation types. In areas with lower
rainfall, much of the native vegetation remains and supports pastoral industries. Providing
water (bores) has enabled extensive development of these rangelands.
The clearing of native vegetation has declined since the 1990s as states and territories
introduced regulatory controls. Vegetation management can profoundly affect landscape
condition, soil health and the supply of ecosystem goods and services, such as food, fibre and
water production. The importance of managing vegetation for ecosystem goods and services is
reflected in the on-the-ground investments being made through conservation programs, land
clearing controls and environmental management systems.
Environment protection
Government programs
The Australian Government’s central piece of environmental legislation is the Environment
Protection and Biodiversity Conservation (EPBC) Act 1999. It provides a legal framework to
protect and manage flora, fauna, ecological communities and heritage places—defined as
matters of national environmental significance. The objectives of the EPBC Act are to:
provide for the protection of the environment, especially matters of national environmental significance
conserve Australian biodiversity
Land use and management: the Australian context ABARES
12
provide a streamlined national environmental assessment and approvals process
enhance the protection and management of important natural and cultural places
control the international movement of plants and animals (wildlife), wildlife specimens and products made or derived from wildlife
promote ecologically sustainable development through the conservation and ecologically sustainable use of natural resources.
Environment protection objectives are also pursued by the Australian Government under the
Caring for our Country initiative, which supports environmental management of natural
resources. The Caring for our Country initiative addresses six national priority issues:
expanding Australia’s National Reserve System
addressing threats to biodiversity and natural icons
managing and protecting coastal environments and critical aquatic habitats, including the Great Barrier Reef
encouraging farmers to adopt sustainable farm practices
promoting sustainable natural resources use and environmental protection in northern and remote Australia
supporting and increasing community skills, knowledge and engagement.
This initiative supports regional natural resource management groups, local, state and territory
governments, Indigenous groups, industry bodies, land managers, farmers, Landcare groups and
communities.
Land use and management: the Australian context ABARES
13
5 Outlook
Climate change
Australia’s climate is changing as part of a global trend. Climate change is expected to continue
and perhaps accelerate, presenting both challenges and opportunities for Australian agriculture.
The effects of climate change will vary across sectors and regions, altering risk profiles both
positively and negatively. Adapting to climate change will require information systems that
identify the effects of climate change alongside other business management risks.
Agriculture is the dominant source of both methane and nitrous oxide emissions in Australia.
Most agricultural emissions come from livestock (methane), burning of savannas and nitrous
oxide emissions from soils.
Pests, diseases and weeds
More than 80 species of exotic vertebrate animals have established wild populations in Australia
and more than 30 of these species have become agricultural or environmental pests. Major
agricultural impacts of pest animals include:
grazing and land degradation by rabbits and feral goats
livestock predation by wild dogs, foxes and feral pigs
damage to grain and fruit crops by mice and birds.
The direct costs to agriculture (including pest impacts and expenditure on management,
administration and research) from wild dogs, rabbits, foxes, pigs, pest birds and mice was
estimated at approximately $745 million in 2009 (DAFF 2012). Introduced insects, such as cattle
ticks and aphids, cost agriculture more than $5 billion per year in production losses and
$1 billion in control costs (DAFF 2012).
Around 28 000 exotic plant species have been introduced into Australia since European
settlement and 3480 of these have become weeds. Many of these weeds are escaped garden
plants. Weeds contaminate crops, displace pasture plants and compete with crop and pasture
plants for water and nutrients. Weeds also harbour diseases and insect pests, reduce livestock
carrying capacity and condition, and can be toxic to livestock. The effect and control of weeds
costs Australian agriculture more than $4 billion per year (DAFF 2012). Farmers consider weed
control as one of their highest priorities to prevent long-term land degradation.
Biosecurity
Australia’s biosecurity system minimises the risk of exotic pests and diseases entering the
country and harming the natural environment. Australia expanding economic ties with
developing regions has led to inherent biosecurity risks. Warmer climates and faster transport
systems can encourage pests and disease. Within Australia, disease and pest security is also
increasing with climate change and improved logistics. The Australian Government is
implementing reforms to Australia’s biosecurity system to ensure it is responsive and targeted
in a changing global trading environment.
Land use and management: the Australian context ABARES
14
Land use
There is an overall trend of land use intensification in Australia, although this varies regionally
and is set against a slow decline in the proportion of Australia’s land area used for agriculture.
According to ABS data, the area planted to crops (excluding pastures and grasses, and crops
harvested for hay and seed) increased between 1992–93 and 2009–10, from almost 17.3 million
hectares to almost 26 million hectares. Projected increased population will create further
pressure for land use intensification for residential, commercial and production purposes. The
potential effect of climate change on agriculture and the possible contraction of food producing
areas, such as the Australian wheatbelt, will add to this pressure.
The causes and drivers of land use change are:
pressures on resource availability including land productivity, resource condition and population
changing opportunities including market development, production costs, new technologies, infrastructure and transport costs
policy interventions including subsidies, taxes, property rights, infrastructure and governance arrangements
vulnerability and adaptive capacity including exposure to natural hazards and the coping capacity of communities and individuals
social changes including changes in access to resources, income distribution and urban-rural interactions.
Land use change needs to be monitored to manage Australian landscapes and implement policy
settings and program arrangements dealing with agricultural productivity, biosecurity, carbon,
natural resources management, biodiversity, and food security.
Australia is improving its capacity to track land use change, drawing on information such as
satellite remote sensing and statistical collections. ABARES is working with the Australian
Collaborative Land Use and Management Program’s (ACLUMP) partners to promote
collaboration among Australian and state government agencies and others with interests in land
use change analysis. The recent move by the Australian Government to establish a National Plan
for Environmental Information and the ABS to introduce land and water accounting will further
promote tracking and reporting on land use change.
More recent statistical evidence from the ABS confirms this general pattern of change in
agricultural land uses. Between 1992–93 and 2005–06 the area of agricultural holdings
decreased by 5.5 per cent to 4 349 250 square kilometres. The most recent ABS information for
2009–10 shows that the area of land used for agriculture continued to decline to 3 985 800
square kilometres (13.4 per cent decrease from 1992–93). The area planted to crops (excluding
pastures and grasses, and crops harvested for hay and seed) increased by 42 per cent between
1992–93 and 2005–06, and increased by 50 per cent between 1992–93 and 2009–10 (Figure 1).
Land use and management: the Australian context ABARES
15
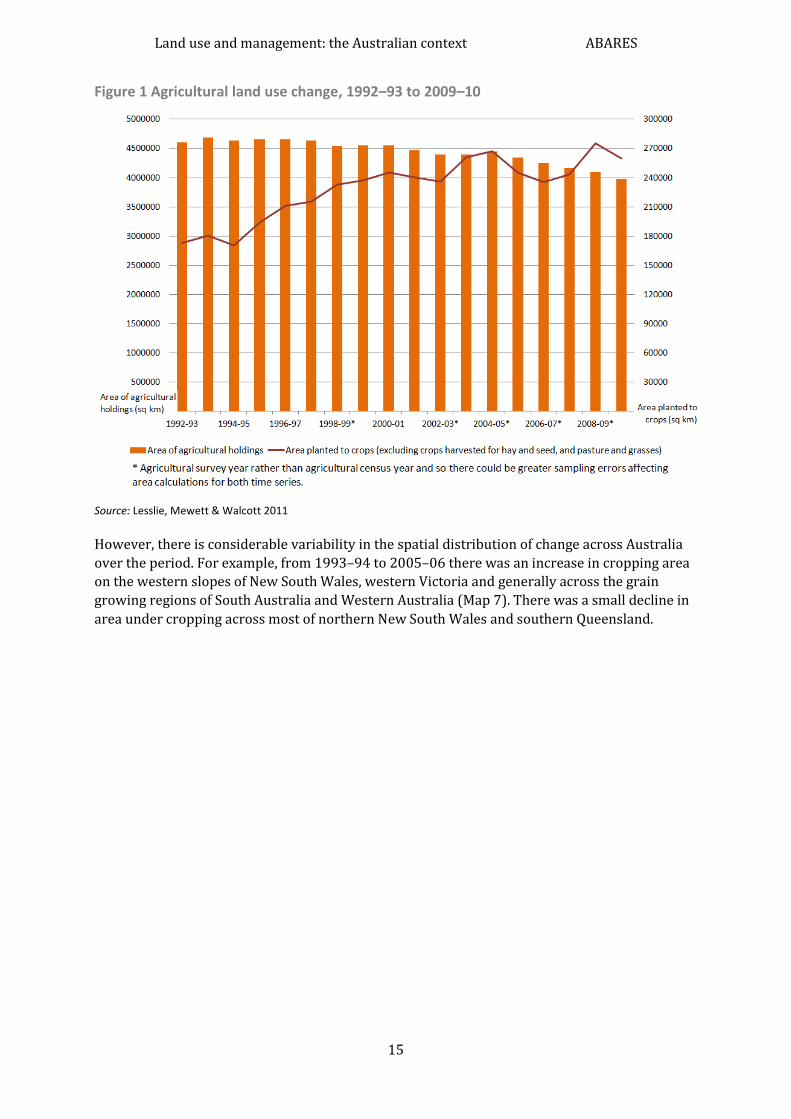
Figure 1 Agricultural land use change, 1992–93 to 2009–10
Source: Lesslie, Mewett & Walcott 2011
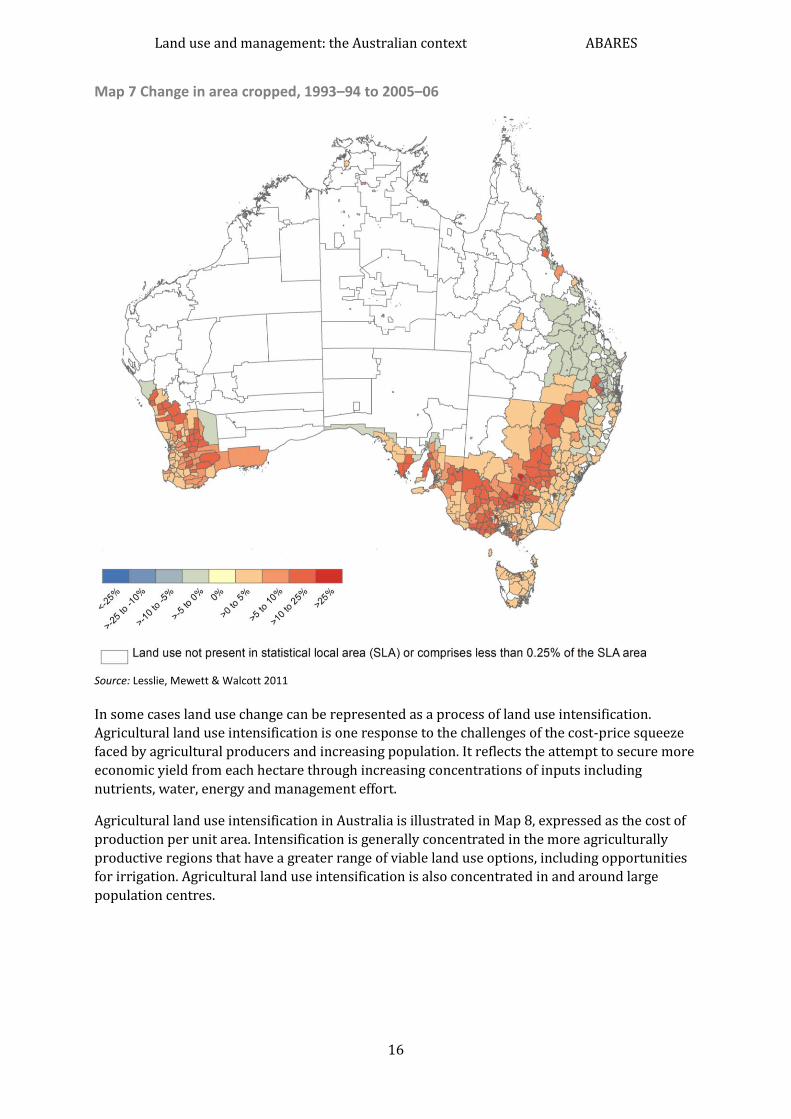
However, there is considerable variability in the spatial distribution of change across Australia
over the period. For example, from 1993–94 to 2005–06 there was an increase in cropping area
on the western slopes of New South Wales, western Victoria and generally across the grain
growing regions of South Australia and Western Australia (Map 7). There was a small decline in
area under cropping across most of northern New South Wales and southern Queensland.
Land use and management: the Australian context ABARES
16
Map 7 Change in area cropped, 1993–94 to 2005–06
Source: Lesslie, Mewett & Walcott 2011
In some cases land use change can be represented as a process of land use intensification.
Agricultural land use intensification is one response to the challenges of the cost-price squeeze
faced by agricultural producers and increasing population. It reflects the attempt to secure more
economic yield from each hectare through increasing concentrations of inputs including
nutrients, water, energy and management effort.
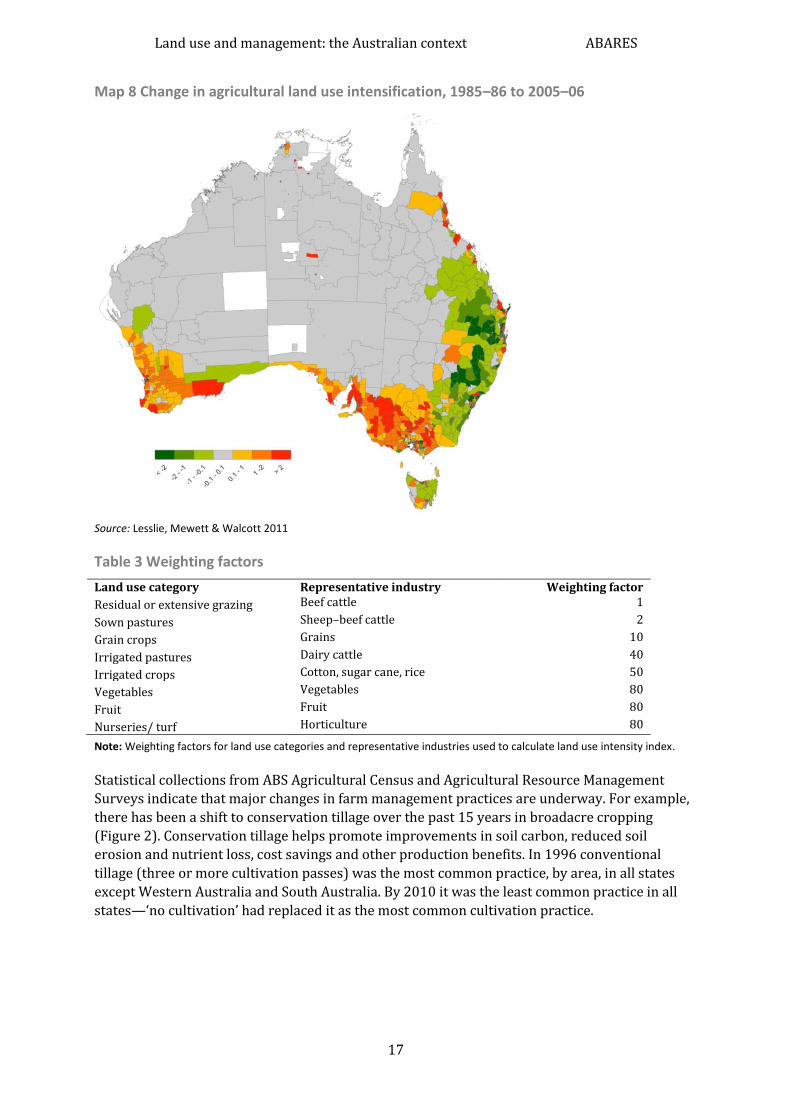
Agricultural land use intensification in Australia is illustrated in Map 8, expressed as the cost of
production per unit area. Intensification is generally concentrated in the more agriculturally
productive regions that have a greater range of viable land use options, including opportunities
for irrigation. Agricultural land use intensification is also concentrated in and around large
population centres.
Land use and management: the Australian context ABARES
17
Map 8 Change in agricultural land use intensification, 1985–86 to 2005–06
Source: Lesslie, Mewett & Walcott 2011
Table 3 Weighting factors
Land use category Representative industry Weighting factor
Residual or extensive grazing Beef cattle 1
Sown pastures Sheep–beef cattle 2
Grain crops Grains 10
Irrigated pastures Dairy cattle 40
Irrigated crops Cotton, sugar cane, rice 50
Vegetables Vegetables 80
Fruit Fruit 80
Nurseries/ turf Horticulture 80
Note: Weighting factors for land use categories and representative industries used to calculate land use intensity index.
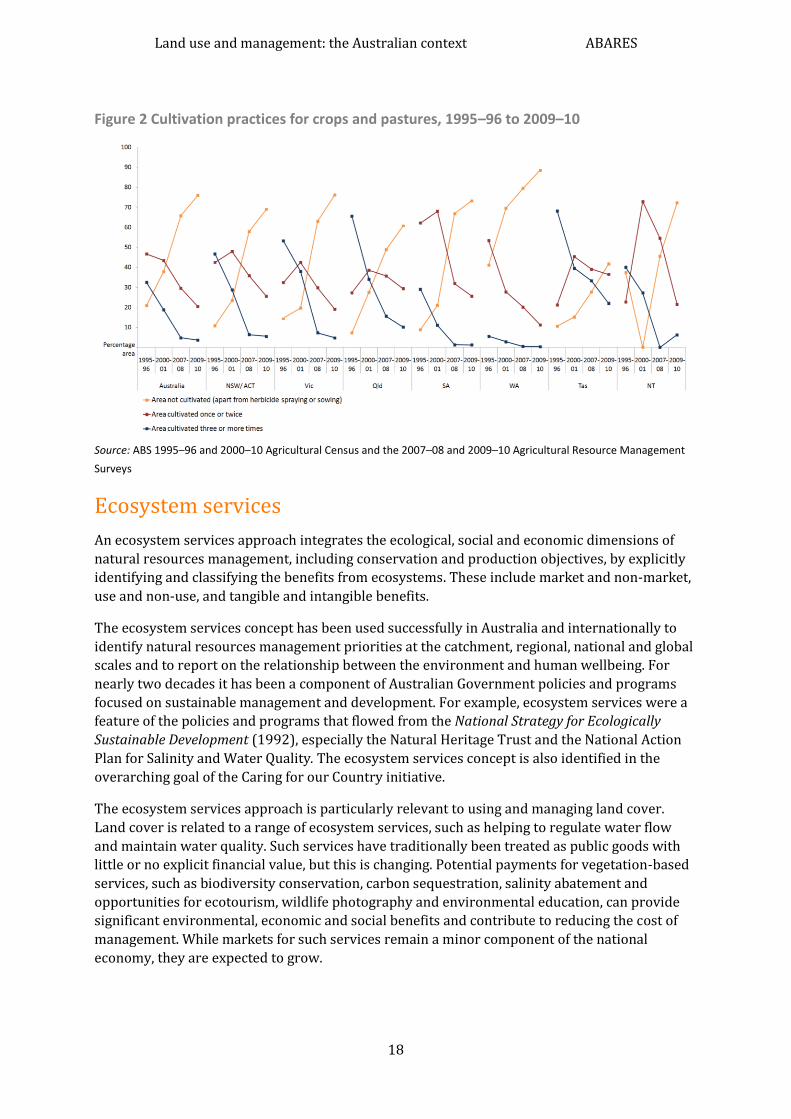
Statistical collections from ABS Agricultural Census and Agricultural Resource Management
Surveys indicate that major changes in farm management practices are underway. For example,
there has been a shift to conservation tillage over the past 15 years in broadacre cropping
(Figure 2). Conservation tillage helps promote improvements in soil carbon, reduced soil
erosion and nutrient loss, cost savings and other production benefits. In 1996 conventional
tillage (three or more cultivation passes) was the most common practice, by area, in all states
except Western Australia and South Australia. By 2010 it was the least common practice in all
states—‘no cultivation’ had replaced it as the most common cultivation practice.
Land use and management: the Australian context ABARES
18
Figure 2 Cultivation practices for crops and pastures, 1995–96 to 2009–10
Source: ABS 1995–96 and 2000–10 Agricultural Census and the 2007–08 and 2009–10 Agricultural Resource Management
Surveys
Ecosystem services
An ecosystem services approach integrates the ecological, social and economic dimensions of
natural resources management, including conservation and production objectives, by explicitly
identifying and classifying the benefits from ecosystems. These include market and non-market,
use and non-use, and tangible and intangible benefits.
The ecosystem services concept has been used successfully in Australia and internationally to
identify natural resources management priorities at the catchment, regional, national and global
scales and to report on the relationship between the environment and human wellbeing. For
nearly two decades it has been a component of Australian Government policies and programs
focused on sustainable management and development. For example, ecosystem services were a
feature of the policies and programs that flowed from the National Strategy for Ecologically
Sustainable Development (1992), especially the Natural Heritage Trust and the National Action
Plan for Salinity and Water Quality. The ecosystem services concept is also identified in the
overarching goal of the Caring for our Country initiative.
The ecosystem services approach is particularly relevant to using and managing land cover.
Land cover is related to a range of ecosystem services, such as helping to regulate water flow
and maintain water quality. Such services have traditionally been treated as public goods with
little or no explicit financial value, but this is changing. Potential payments for vegetation-based
services, such as biodiversity conservation, carbon sequestration, salinity abatement and
opportunities for ecotourism, wildlife photography and environmental education, can provide
significant environmental, economic and social benefits and contribute to reducing the cost of
management. While markets for such services remain a minor component of the national
economy, they are expected to grow.
Land use and management: the Australian context ABARES
19
6 Research capacity—land use and management
ABARES provides professionally independent economic and scientific analysis, including
integrated socio-economic and biophysical analysis that informs the difficult policy issues facing
Australia’s primary industries.
ABARES has staff with skills across a range of economic, science and social science disciplines.
These include scientific and economic analysis and modelling, data (including survey) collection
and statistical analysis, risk assessment and management, geographical mapping particularly in
areas related to natural resource management, commodity and market analysis, and integrated
analysis.
ABARES has an established capacity to compile national land use, land management and land
cover information and track change using regular statistical collections by government and
industry and remotely sensed imagery. These types of information are combined to take
advantage of their complementary spatial and temporal characteristics—for example, in the
national scale land use mapping produced by ABARES.
Tracking and reporting change
ABARES is working with the Australian Collaborative Land Use and Management Program’s
(ACLUMP) partners to promote collaboration among Australian and state government agencies
and others with interests in land use change analysis.
Australia’s large land area means that remote sensing is an attractive option for cost-effective
mapping of aspects of land use change. Free access to imagery archives such as Landsat, MODIS
and AVHRR has resulted in ready uptake in mapping programs. Agricultural statistics compiled
by the ABS and ABARES are also important sources of information for analysing and reporting
change.
National land use mapping
National scale land use mapping is modelled using coarse-scale satellite data (pixel size of
1.1 square kilometres), ABS Agricultural Commodity Census statistics for agricultural land uses
and pre-existing finer resolution data (principally at the 1:250 000 scale) for other uses. The
relatively low cost of national mapping provides an opportunity for time series mapping.
National scale (1:2 500 000) datasets have been completed for 1992–93, 1993–94, 1996–97,
1998–99, 2000–01, 2001–02 and 2005–06 (see Map 1 for the most recent). The next national
scale dataset will be based on the 2010–11 Agricultural Commodity Census. National scale
mapping produced by ABARES is in strong demand for synoptic-level land use assessments and
for strategic planning and evaluation (such as developing programs for natural resource
management). It is also used in modelling applications, such as national carbon accounting and
salinity assessments at the river basin level.
Dynamic land cover mapping
A dynamic land cover map and databases for Australia produced by Geoscience Australia in
partnership with ABARES provides new insights into aspects of land use and land management
change for Australia. The map and time series data, produced for 2000–2008 by ABARES using
MODIS Enhanced Vegetation Index (EVI) data, allows trends and changes in land cover over time
Land use and management: the Australian context ABARES
20
to be investigated. This database can provide insight into the response of land cover to a wide
variety of drivers, both natural and anthropogenic. This allows natural resource managers to
identify emerging patterns of land cover change and provides a broad spatial and historical
context within which to interpret that land cover change.
Ground Cover Monitoring for Australia
Ground Cover Monitoring for Australia is a national program, coordinated by ABARES, that
involves the remote sensing of fractional cover (green cover, dry cover, and bare ground) across
Australia using MODIS NBAR data. The program includes the establishment of a national system
of ground validation sites using nationally agreed methods. The data are being used initially to
support soil erosion modelling and it is intended that this will be extended to mapping
management practices (such as tillage/stubble management) in the cropping zone. Partners
include key national research organisations (CSIRO, Geoscience Australia, and Terrestrial
Ecosystems Research Network) and natural resources management / agriculture departments
in each state.
Land management practices
Land management practices are analysed primarily using agricultural statistics collections such
as those of the ABS and ABARES. In 2007–08 the Agricultural Resource Management Survey was
conducted by the ABS to provide a baseline of key practices to help guide national investment
programs to improve natural resources management. Practices include those relating to tillage,
stubble management, ground cover management, fertiliser use, soil testing and liming. This
survey was also run for 2009–10 and will be again for 2011–12. These results will be used to
measure change in land management practices over time.
ABARES carries out a smaller annual survey, the Australian Agricultural and Grazing Industry
Survey, of the broadacre cropping, grazing and dairy industries. This survey produces estimates
of land area and tenure, labour, farm capital, crop type and production, fertiliser use, irrigation,
farm receipts, farm costs, farm performance measures, farm debt and farm equity.
Spatial decision support
MCAS-S tool
The Multi-Criteria Analysis Shell for Spatial Decision Support (MCAS-S), developed by ABARES,
is an easy-to-use spatial decision support tool designed to help visualise and combine mapped
information in a flexible, interactive way. MCAS-S is the latest of several multi-criteria decision
support aids used by the Australian Government Department of Agriculture, Fisheries and
Forestry since the early 1990s to support policy decision-making.
MCAS-S allows the user to import, select and display spatial data in a dynamic workspace
window, see multiple datasets simultaneously, group datasets under themes, interactively
modify and combine these datasets, and carry out two-way and multi-way comparisons to form
meaningful map-based flow diagrams. Layers can be combined using simple weights, complex
functions or through pair-wise comparison. It also allows users to document their results and
the decision-making process, including assumptions.
A project can be constructed at any scale and resolution and ‘live updates’ are available, which
are particularly helpful at workshops. MCAS-S assists in decision-making where transparency
between different approaches to map combination is needed. Stakeholders can see the effects
their decisions may make. Successful use of the software does not require GIS (geographic
Land use and management: the Australian context ABARES
21
information systems) programming, which removes the usual technical obstacles non-GIS users
have in accessing and analysing spatial information.
MCAS-S is being used at the national, regional and catchment scale for:
wind erosion extent and risk assessment 2009
soil acidification risk assessment 2010
soil carbon potential evaluation 2009
targeting investment—Great Barrier Reef water quality 2009–10
indicators of community vulnerability and adaptive capacity 2010
rabies risk mapping 2011
weeds risk assessment 2011
asian honey bee risk assessment 2009
animal disease risk mapping 2011
re-vegetation planning 2006
land acquisition priorities for conservation 2010
catchment re-vegetation planning 2011
priorities for regional natural resources investment 2011
wildfire assessment (soil erosion) 2011
agricultural land quality evaluation 2011.
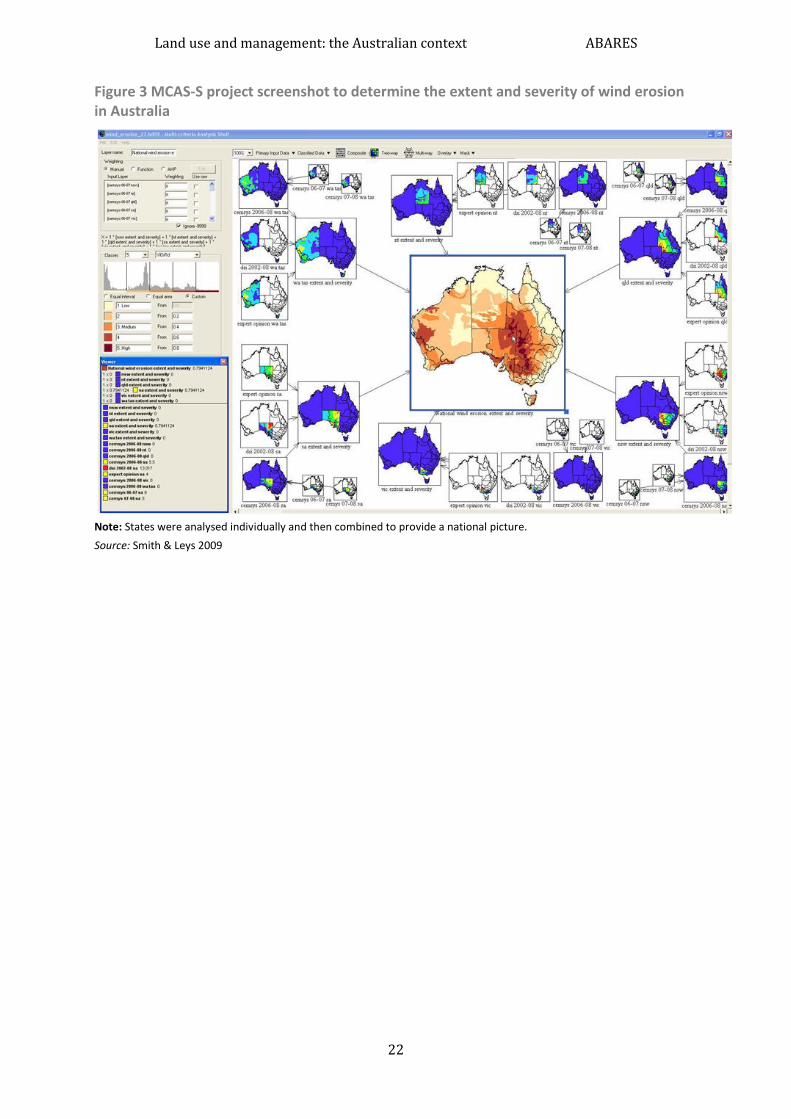
Figure 3 shows data layers that have been combined using MCAS-S to produce a national map of
the extent and severity of wind erosion. These data included modelled wind erosion data
(created using a model), an index of dust storm activity based on observed data, and expert
opinion (rankings by region) of the extent and severity of wind erosion. The input data layers
were weighted for each state according to expert opinion on their confidence in each layer and
were combined spatially using the MCAS-S tool. The darker areas are those with the highest
wind erosion extent and severity in Australia as determined by an expert panel.
Land use and management: the Australian context ABARES
22
Figure 3 MCAS-S project screenshot to determine the extent and severity of wind erosion in Australia
Note: States were analysed individually and then combined to provide a national picture.
Source: Smith & Leys 2009
Land use and management: the Australian context ABARES
23
7 Key issues A number of potential issues in the land use and resources area were identified as context for
discussions between ABARES and FEDRC on common technical interests. These include:
Australia’s food supply system and its potential to contribute to food security domestically and globally
where and how sustainable agriculture can be maintained and developed in response to climate change and loss of productive agricultural land
options for managing carbon in Australian agricultural production systems (including farm forestry)
tracking ‘hotspots’ of land use change, including land use intensification on the fringes of cities and urban areas and loss of productive agricultural land, productive land resources and biodiversity
transitions in irrigated agriculture, forestry and carbon farming, and the trade-offs between biofuels and other forms of agriculture.
Addressing these issues will require:
more effective use of newly available remote sensing and statistical information
new methods for change analysis (including automated change detection) and better measurement of error and uncertainty
better links between existing data collection and analysis activities, including international engagement
better methods for identifying and classifying thematic transitions, cyclic variability and trends
better methods for forecasting land use change, including change in response to increased climate variability and disaster risk (including biosecurity, fire, flood and cyclone)
land use and land management incentives for non-market ecosystem goods and services
decision support capability to enable informed, transparent consideration of options and trade-offs.
Land use and management: the Australian context ABARES
24
8 Potential areas for collaboration The Sustainable Land and Forest Management Research Agenda project has strengthened
technical cooperation in areas of common interest. To further improve the sustainable
management of land and forests, potential areas for collaboration have been identified and
include:
spatial decision support systems
land resources assessment
landscape classification
ecosystem services
remote sensing of land use and land cover change
climate change adaptation
carbon accounting relating to land use and land management change.
Land use and management: the Australian context ABARES
25
References ABARE–BRS 2010, Land Use of Australia 2005-06, version 4, Australian Bureau of Agricultural
and Resource Economics – Bureau of Rural Sciences, Canberra.
ABARES 2011, Guidelines for land use mapping in Australia: principles, procedures and definitions,
A technical handbook supporting the Australian Collaborative Land Use and Management
Program, 4th edn, Australian Bureau of Agricultural and Resource Economics and Sciences,
Canberra.
ABS 2009, Land Management and Farming in Australia 2007-08, no. 4627.0, Australian Bureau of
Statistics, Canberra.
DAFF 2012, Australia’s agriculture, fisheries and forestry at a glance, Department of Agriculture,
Fisheries and Forestry, Canberra.
DAFF 2008, Australia’s agricultural industries at a glance, Department of Agriculture, Fisheries
and Forestry, Canberra.
Clancy, T & Howell, C 2013, Sustainable forest management: the Australian context, ABARES
research report 13.2, Canberra, January.
Gammage, B 2011, The Biggest Estate on Earth, Allen & Unwin, Sydney.
Lesslie, R, Mewett, J & Walcott, J 2011, Landscapes in transition: Tracking land use change in
Australia, Science and Economic Insights, Issue 2.2, ABARES, Canberra.
McKenzie, N, Jacquier, D, Isbell, R & Brown, K 2004, Australian soils and landscapes: an illustrated
compendium, CSIRO Publishing, Melbourne.
Smith, J & Leys, J 2009, Identification of areas within Australia for reducing soil loss by wind
erosion, Bureau of Rural Sciences, Canberra.