lanai high-density irradiance sensor...
TRANSCRIPT
LANAI HIGH-DENSITY IRRADIANCE SENSOR NETWORK FOR CHARACTERIZING SOLAR RESOURCE VARIABILITY OF MW-SCALE PV SYSTEM
Scott Kuszamaul1, Abraham Ellis1, Joshua Stein1, and Lars Johnson2
1Sandia National Laboratories, Albuquerque, NM, USA 2SunPower Corporation, Richmond, CA, USA
ABSTRACT Sandia National Laboratories (Sandia) and SunPower Corporation (SunPower) have completed design and deployment of an autonomous irradiance monitoring system based on wireless mesh communications and a battery operated data acquisition system. The Lanai High-Density Irradiance Sensor Network is comprised of 24 LI-COR® irradiance sensors (silicon pyranometers) polled by 19 RF Radios. The system was implemented with commercially available hardware and custom developed LabVIEW applications. The network of solar irradiance sensors was installed in January 2010 around the periphery and within the 1.2 MW ac La Ola PV plant on the island of Lanai, Hawaii. Data acquired at 1 second intervals is transmitted over wireless links to be time-stamped and recorded on SunPower data servers at the site for later analysis. The intent is to study power and solar resource data sets to correlate the movement of cloud shadows across the PV array and its effect on power output of the PV plant. The irradiance data sets recorded will be used to study the shape, size and velocity of cloud shadows. This data, along with time-correlated PV array output data, will support the development and validation of a PV performance model that can predict the short-term output characteristics (ramp rates) of PV systems of different sizes and designs. This analysis could also be used by the La Ola system operator to predict power ramp events and support the function of the future battery system. This experience could be used to validate short-term output forecasting methodologies.
INTRODUCTION
Economics of scale favor deploying ever larger utility-scale Photovoltaic (PV) plants from 10MW to 100MW and beyond. However, PV power system operations are effected by cloud-induced variations of the temporal and spatial distributions of solar resources. To better understand the impact of the solar resource variability and facilitate the understanding by the electric utilities of the corresponding power system output variability, Sandia is developing a utility-scale PV plant model that can reproduce dynamic plant output behavior based on shading patterns over the PV array footprint. Acquisition of high-resolution solar irradiance measurements and concurrent PV system output data is crucial to this modeling effort. Sandia has partnered with SunPower to deploy a network of low-profile, self-contained, wireless-mesh irradiance sensors on Lanai at the 1.2MW ac La Ola PV plant to collect high temporal and spatial resolution
irradiance data. This data will be used to support research aimed at developing predictive models of solar variability.
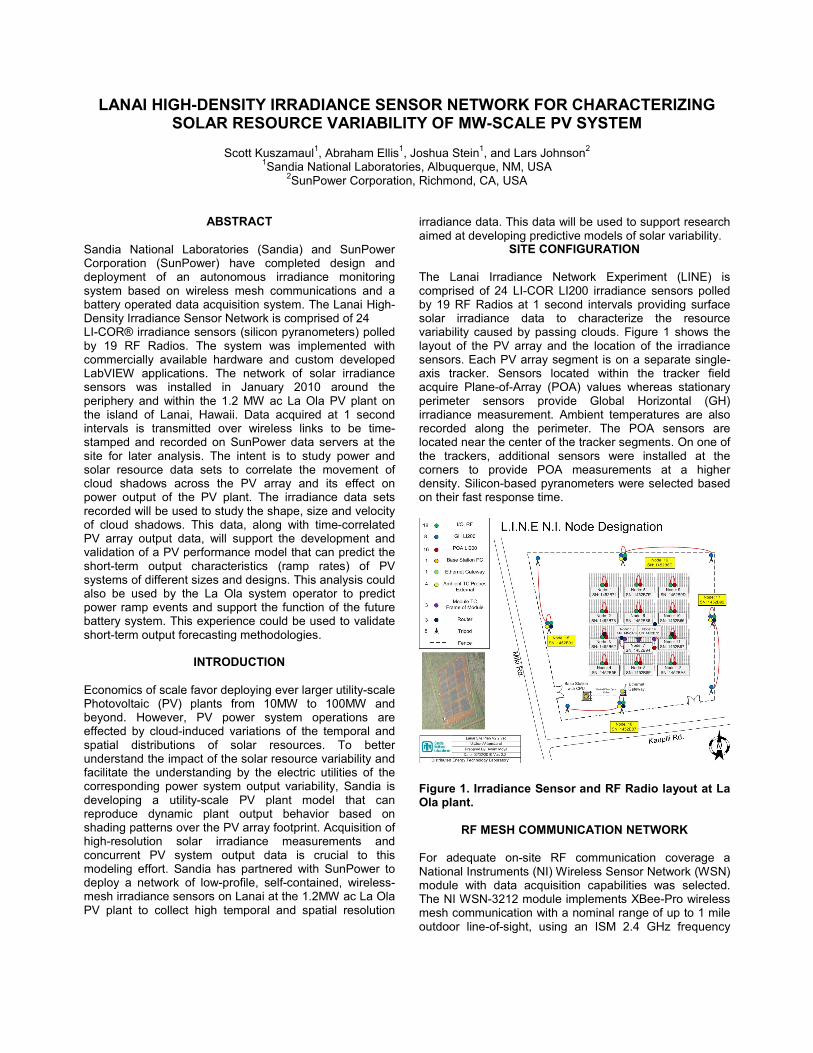
SITE CONFIGURATION The Lanai Irradiance Network Experiment (LINE) is comprised of 24 LI-COR LI200 irradiance sensors polled by 19 RF Radios at 1 second intervals providing surface solar irradiance data to characterize the resource variability caused by passing clouds. Figure 1 shows the layout of the PV array and the location of the irradiance sensors. Each PV array segment is on a separate single-axis tracker. Sensors located within the tracker field acquire Plane-of-Array (POA) values whereas stationary perimeter sensors provide Global Horizontal (GH) irradiance measurement. Ambient temperatures are also recorded along the perimeter. The POA sensors are located near the center of the tracker segments. On one of the trackers, additional sensors were installed at the corners to provide POA measurements at a higher density. Silicon-based pyranometers were selected based on their fast response time.
Figure 1. Irradiance Sensor and RF Radio layout at La Ola plant.
RF MESH COMMUNICATION NETWORK For adequate on-site RF communication coverage a National Instruments (NI) Wireless Sensor Network (WSN) module with data acquisition capabilities was selected. The NI WSN-3212 module implements XBee-Pro wireless mesh communication with a nominal range of up to 1 mile outdoor line-of-sight, using an ISM 2.4 GHz frequency
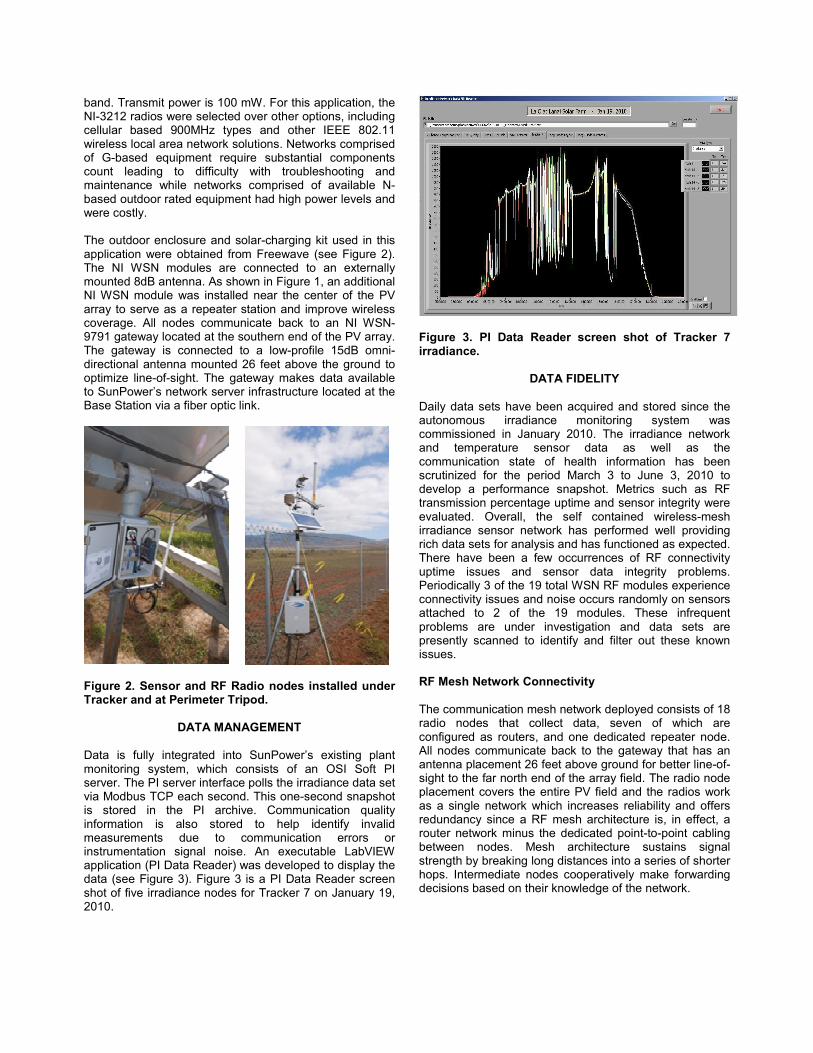
band. Transmit power is 100 mW. For this application, the NI-3212 radios were selected over other options, including cellular based 900MHz types and other IEEE 802.11 wireless local area network solutions. Networks comprised of G-based equipment require substantial components count leading to difficulty with troubleshooting and maintenance while networks comprised of available N-based outdoor rated equipment had high power levels and were costly. The outdoor enclosure and solar-charging kit used in this application were obtained from Freewave (see Figure 2). The NI WSN modules are connected to an externally mounted 8dB antenna. As shown in Figure 1, an additional NI WSN module was installed near the center of the PV array to serve as a repeater station and improve wireless coverage. All nodes communicate back to an NI WSN-9791 gateway located at the southern end of the PV array. The gateway is connected to a low-profile 15dB omni-directional antenna mounted 26 feet above the ground to optimize line-of-sight. The gateway makes data available to SunPower’s network server infrastructure located at the Base Station via a fiber optic link.
Figure 2. Sensor and RF Radio nodes installed under Tracker and at Perimeter Tripod.
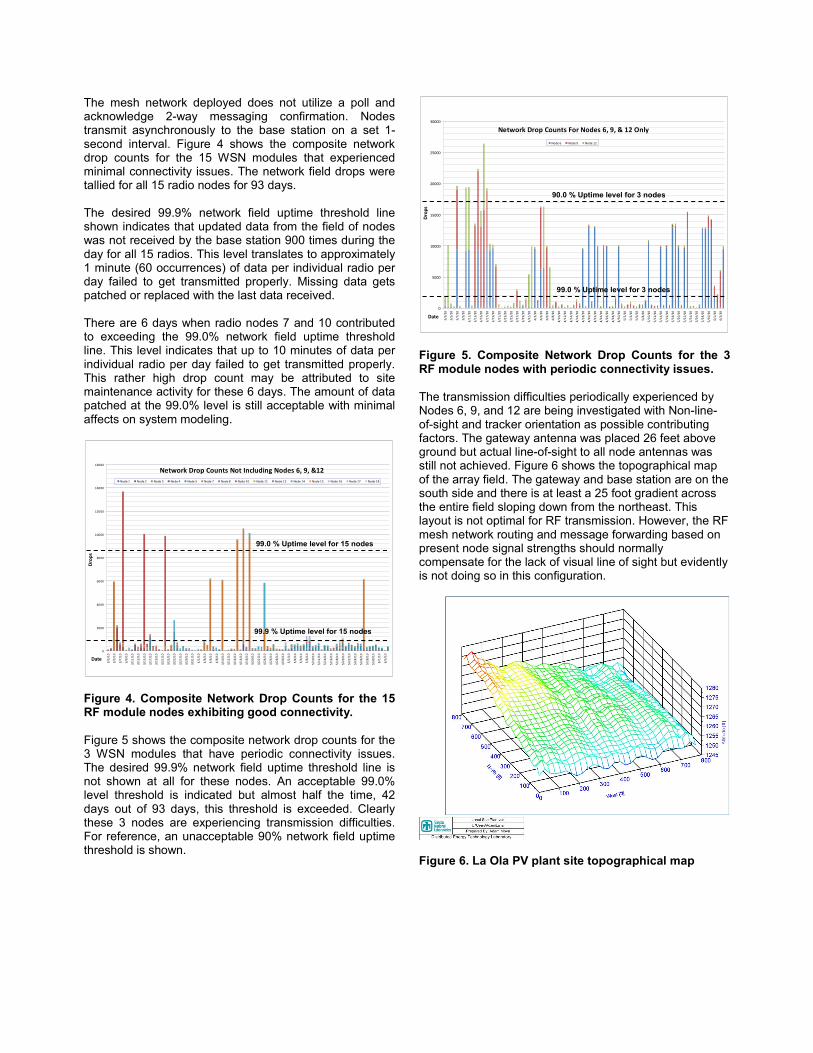
DATA MANAGEMENT Data is fully integrated into SunPower’s existing plant monitoring system, which consists of an OSI Soft PI server. The PI server interface polls the irradiance data set via Modbus TCP each second. This one-second snapshot is stored in the PI archive. Communication quality information is also stored to help identify invalid measurements due to communication errors or instrumentation signal noise. An executable LabVIEW application (PI Data Reader) was developed to display the data (see Figure 3). Figure 3 is a PI Data Reader screen shot of five irradiance nodes for Tracker 7 on January 19, 2010.
Figure 3. PI Data Reader screen shot of Tracker 7 irradiance.
DATA FIDELITY Daily data sets have been acquired and stored since the autonomous irradiance monitoring system was commissioned in January 2010. The irradiance network and temperature sensor data as well as the communication state of health information has been scrutinized for the period March 3 to June 3, 2010 to develop a performance snapshot. Metrics such as RF transmission percentage uptime and sensor integrity were evaluated. Overall, the self contained wireless-mesh irradiance sensor network has performed well providing rich data sets for analysis and has functioned as expected. There have been a few occurrences of RF connectivity uptime issues and sensor data integrity problems. Periodically 3 of the 19 total WSN RF modules experience connectivity issues and noise occurs randomly on sensors attached to 2 of the 19 modules. These infrequent problems are under investigation and data sets are presently scanned to identify and filter out these known issues. RF Mesh Network Connectivity The communication mesh network deployed consists of 18 radio nodes that collect data, seven of which are configured as routers, and one dedicated repeater node. All nodes communicate back to the gateway that has an antenna placement 26 feet above ground for better line-of-sight to the far north end of the array field. The radio node placement covers the entire PV field and the radios work as a single network which increases reliability and offers redundancy since a RF mesh architecture is, in effect, a router network minus the dedicated point-to-point cabling between nodes. Mesh architecture sustains signal strength by breaking long distances into a series of shorter hops. Intermediate nodes cooperatively make forwarding decisions based on their knowledge of the network.
The mesh network deployed does not utilize a poll and acknowledge 2-way messaging confirmation. Nodes transmit asynchronously to the base station on a set 1-second interval. Figure 4 shows the composite network drop counts for the 15 WSN modules that experienced minimal connectivity issues. The network field drops were tallied for all 15 radio nodes for 93 days. The desired 99.9% network field uptime threshold line shown indicates that updated data from the field of nodes was not received by the base station 900 times during the day for all 15 radios. This level translates to approximately 1 minute (60 occurrences) of data per individual radio per day failed to get transmitted properly. Missing data gets patched or replaced with the last data received. There are 6 days when radio nodes 7 and 10 contributed to exceeding the 99.0% network field uptime threshold line. This level indicates that up to 10 minutes of data per individual radio per day failed to get transmitted properly. This rather high drop count may be attributed to site maintenance activity for these 6 days. The amount of data patched at the 99.0% level is still acceptable with minimal affects on system modeling.
Network Drop Counts Not Including Nodes 6, 9, &12
0
2000
4000
6000
8000
10000
12000
14000
16000
3/3
/10
3/5
/10
3/7
/10
3/9
/10
3/11
/10
3/13
/10
3/15
/10
3/17
/10
3/19
/10
3/21
/10
3/23
/10
3/25
/10
3/27
/10
3/29
/10
3/31
/10
4/2
/10
4/4
/10
4/6
/10
4/8
/10
4/10
/10
4/12
/10
4/14
/10
4/16
/10
4/18
/10
4/20
/10
4/22
/10
4/24
/10
4/26
/10
4/28
/10
4/30
/10
5/2
/10
5/4
/10
5/6
/10
5/8
/10
5/10
/10
5/12
/10
5/14
/10
5/16
/10
5/18
/10
5/20
/10
5/22
/10
5/24
/10
5/26
/10
5/28
/10
5/30
/10
6/1
/10
6/3
/10
Date
Dro
ps
Node 1 Node 2 Node 3 Node 4 Node 5 Node 7 Node 8 Node 10 Node 11 Node 13 Node 14 Node 15 Node 16 Node 17 Node 18
99.0 % Uptime level for 15 nodes
99.9 % Uptime level for 15 nodes
Figure 4. Composite Network Drop Counts for the 15 RF module nodes exhibiting good connectivity. Figure 5 shows the composite network drop counts for the 3 WSN modules that have periodic connectivity issues. The desired 99.9% network field uptime threshold line is not shown at all for these nodes. An acceptable 99.0% level threshold is indicated but almost half the time, 42 days out of 93 days, this threshold is exceeded. Clearly these 3 nodes are experiencing transmission difficulties. For reference, an unacceptable 90% network field uptime threshold is shown.
Network Drop Counts For Nodes 6, 9, & 12 Only
0
5000
10000
15000
20000
25000
30000
3/3/
10
3/5/
10
3/7/
10
3/9/
10
3/1
1/10
3/1
3/10
3/1
5/10
3/1
7/10
3/1
9/10
3/2
1/10
3/2
3/10
3/2
5/10
3/2
7/10
3/2
9/10
3/3
1/10
4/2/
10
4/4/
10
4/6/
10
4/8/
10
4/1
0/10
4/1
2/10
4/1
4/10
4/1
6/10
4/1
8/10
4/2
0/10
4/2
2/10
4/2
4/10
4/2
6/10
4/2
8/10
4/3
0/10
5/2/
10
5/4/
10
5/6/
10
5/8/
10
5/1
0/10
5/1
2/10
5/1
4/10
5/1
6/10
5/1
8/10
5/2
0/10
5/2
2/10
5/2
4/10
5/2
6/10
5/2
8/10
5/3
0/10
6/1/
10
6/3/
10
Date
Dro
ps
Node 6 Node 9 Node 12
99.0 % Uptime level for 3 nodes
90.0 % Uptime level for 3 nodes
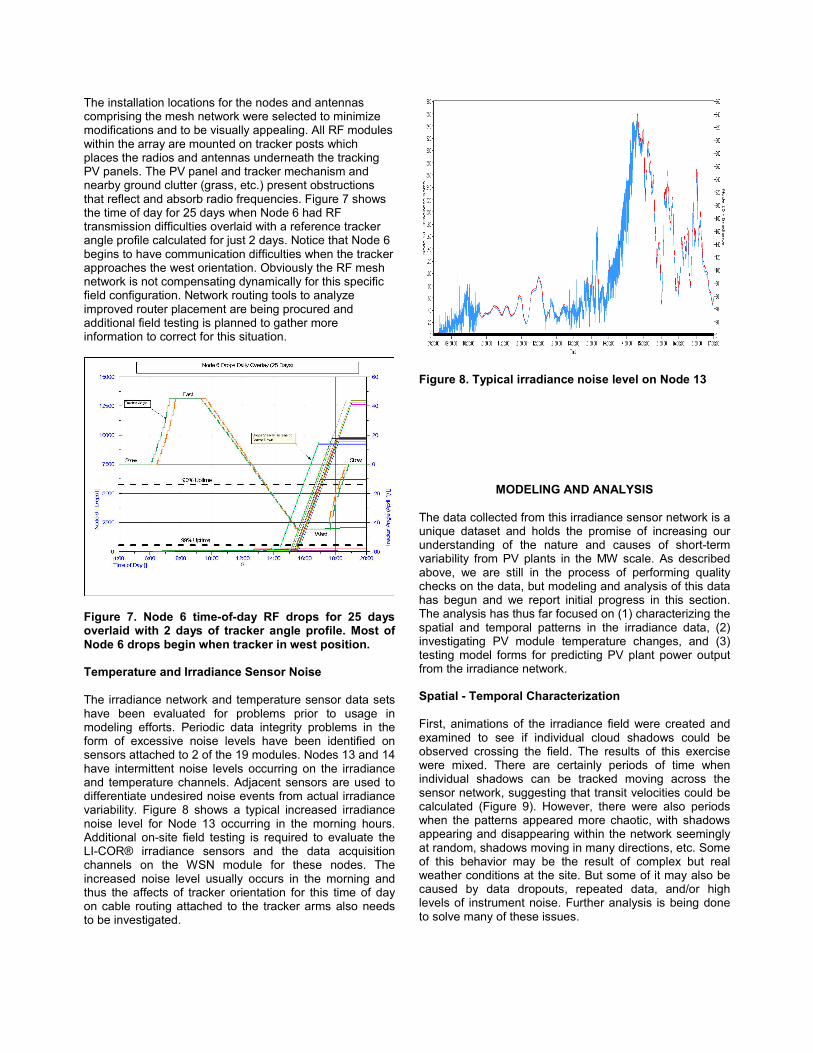
Figure 5. Composite Network Drop Counts for the 3 RF module nodes with periodic connectivity issues. The transmission difficulties periodically experienced by Nodes 6, 9, and 12 are being investigated with Non-line-of-sight and tracker orientation as possible contributing factors. The gateway antenna was placed 26 feet above ground but actual line-of-sight to all node antennas was still not achieved. Figure 6 shows the topographical map of the array field. The gateway and base station are on the south side and there is at least a 25 foot gradient across the entire field sloping down from the northeast. This layout is not optimal for RF transmission. However, the RF mesh network routing and message forwarding based on present node signal strengths should normally compensate for the lack of visual line of sight but evidently is not doing so in this configuration.
Figure 6. La Ola PV plant site topographical map
The installation locations for the nodes and antennas comprising the mesh network were selected to minimize modifications and to be visually appealing. All RF modules within the array are mounted on tracker posts which places the radios and antennas underneath the tracking PV panels. The PV panel and tracker mechanism and nearby ground clutter (grass, etc.) present obstructions that reflect and absorb radio frequencies. Figure 7 shows the time of day for 25 days when Node 6 had RF transmission difficulties overlaid with a reference tracker angle profile calculated for just 2 days. Notice that Node 6 begins to have communication difficulties when the tracker approaches the west orientation. Obviously the RF mesh network is not compensating dynamically for this specific field configuration. Network routing tools to analyze improved router placement are being procured and additional field testing is planned to gather more information to correct for this situation.
Figure 7. Node 6 time-of-day RF drops for 25 days overlaid with 2 days of tracker angle profile. Most of Node 6 drops begin when tracker in west position. Temperature and Irradiance Sensor Noise The irradiance network and temperature sensor data sets have been evaluated for problems prior to usage in modeling efforts. Periodic data integrity problems in the form of excessive noise levels have been identified on sensors attached to 2 of the 19 modules. Nodes 13 and 14 have intermittent noise levels occurring on the irradiance and temperature channels. Adjacent sensors are used to differentiate undesired noise events from actual irradiance variability. Figure 8 shows a typical increased irradiance noise level for Node 13 occurring in the morning hours. Additional on-site field testing is required to evaluate the LI-COR® irradiance sensors and the data acquisition channels on the WSN module for these nodes. The increased noise level usually occurs in the morning and thus the affects of tracker orientation for this time of day on cable routing attached to the tracker arms also needs to be investigated.
Figure 8. Typical irradiance noise level on Node 13
MODELING AND ANALYSIS The data collected from this irradiance sensor network is a unique dataset and holds the promise of increasing our understanding of the nature and causes of short-term variability from PV plants in the MW scale. As described above, we are still in the process of performing quality checks on the data, but modeling and analysis of this data has begun and we report initial progress in this section. The analysis has thus far focused on (1) characterizing the spatial and temporal patterns in the irradiance data, (2) investigating PV module temperature changes, and (3) testing model forms for predicting PV plant power output from the irradiance network. Spatial - Temporal Characterization First, animations of the irradiance field were created and examined to see if individual cloud shadows could be observed crossing the field. The results of this exercise were mixed. There are certainly periods of time when individual shadows can be tracked moving across the sensor network, suggesting that transit velocities could be calculated (Figure 9). However, there were also periods when the patterns appeared more chaotic, with shadows appearing and disappearing within the network seemingly at random, shadows moving in many directions, etc. Some of this behavior may be the result of complex but real weather conditions at the site. But some of it may also be caused by data dropouts, repeated data, and/or high levels of instrument noise. Further analysis is being done to solve many of these issues.
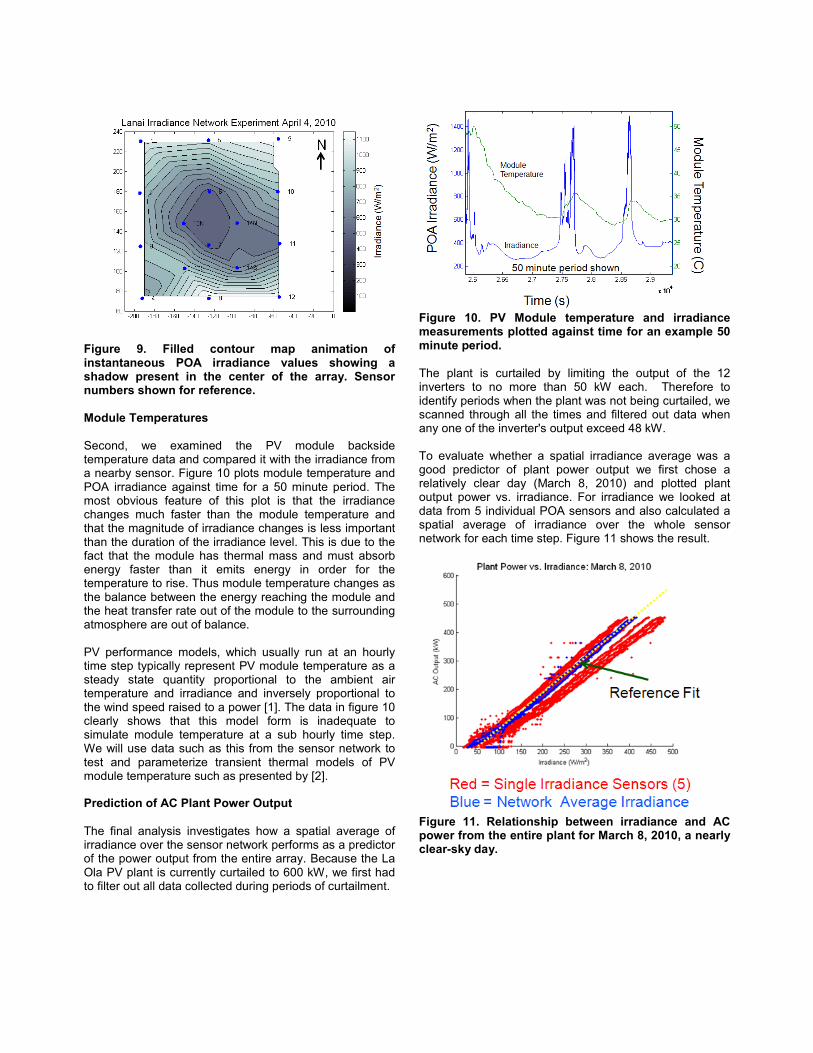
Figure 9. Filled contour map animation of instantaneous POA irradiance values showing a shadow present in the center of the array. Sensor numbers shown for reference. Module Temperatures Second, we examined the PV module backside temperature data and compared it with the irradiance from a nearby sensor. Figure 10 plots module temperature and POA irradiance against time for a 50 minute period. The most obvious feature of this plot is that the irradiance changes much faster than the module temperature and that the magnitude of irradiance changes is less important than the duration of the irradiance level. This is due to the fact that the module has thermal mass and must absorb energy faster than it emits energy in order for the temperature to rise. Thus module temperature changes as the balance between the energy reaching the module and the heat transfer rate out of the module to the surrounding atmosphere are out of balance. PV performance models, which usually run at an hourly time step typically represent PV module temperature as a steady state quantity proportional to the ambient air temperature and irradiance and inversely proportional to the wind speed raised to a power [1]. The data in figure 10 clearly shows that this model form is inadequate to simulate module temperature at a sub hourly time step. We will use data such as this from the sensor network to test and parameterize transient thermal models of PV module temperature such as presented by [2]. Prediction of AC Plant Power Output The final analysis investigates how a spatial average of irradiance over the sensor network performs as a predictor of the power output from the entire array. Because the La Ola PV plant is currently curtailed to 600 kW, we first had to filter out all data collected during periods of curtailment.
Figure 10. PV Module temperature and irradiance measurements plotted against time for an example 50 minute period. The plant is curtailed by limiting the output of the 12 inverters to no more than 50 kW each. Therefore to identify periods when the plant was not being curtailed, we scanned through all the times and filtered out data when any one of the inverter's output exceed 48 kW. To evaluate whether a spatial irradiance average was a good predictor of plant power output we first chose a relatively clear day (March 8, 2010) and plotted plant output power vs. irradiance. For irradiance we looked at data from 5 individual POA sensors and also calculated a spatial average of irradiance over the whole sensor network for each time step. Figure 11 shows the result.
Figure 11. Relationship between irradiance and AC power from the entire plant for March 8, 2010, a nearly clear-sky day.
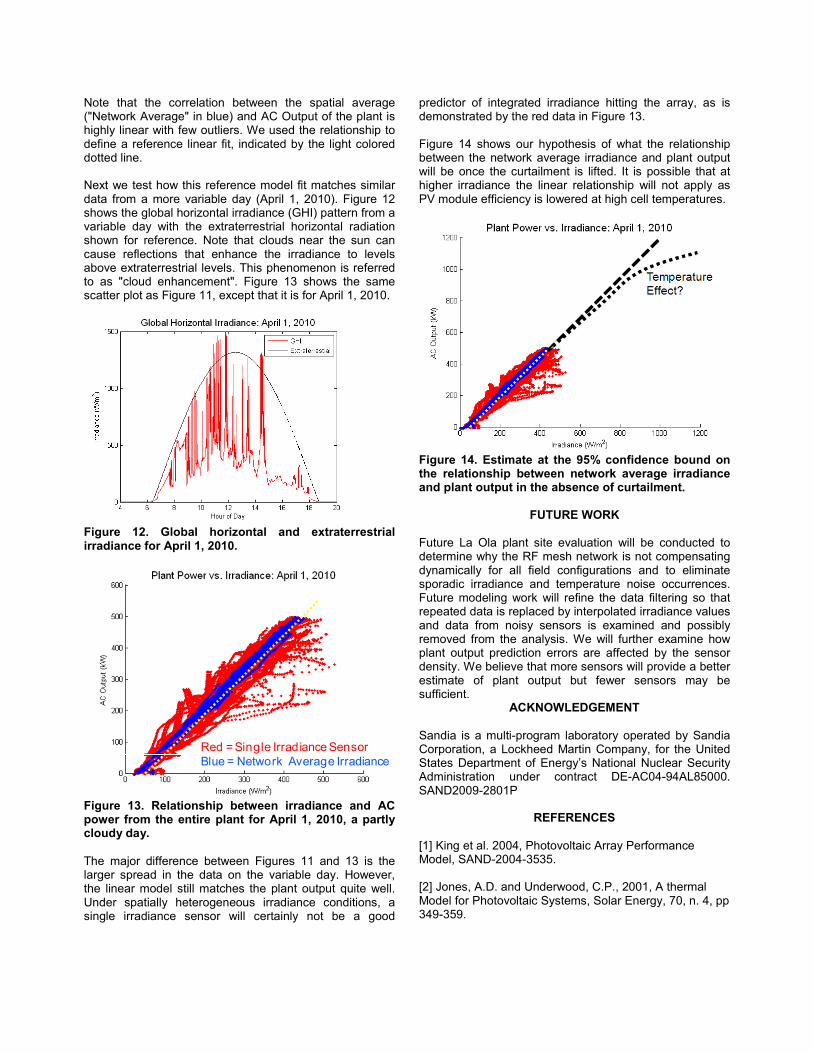
Note that the correlation between the spatial average ("Network Average" in blue) and AC Output of the plant is highly linear with few outliers. We used the relationship to define a reference linear fit, indicated by the light colored dotted line. Next we test how this reference model fit matches similar data from a more variable day (April 1, 2010). Figure 12 shows the global horizontal irradiance (GHI) pattern from a variable day with the extraterrestrial horizontal radiation shown for reference. Note that clouds near the sun can cause reflections that enhance the irradiance to levels above extraterrestrial levels. This phenomenon is referred to as "cloud enhancement". Figure 13 shows the same scatter plot as Figure 11, except that it is for April 1, 2010.
Figure 12. Global horizontal and extraterrestrial irradiance for April 1, 2010.
Red = Single Irradiance SensorBlue = Network Average Irradiance
Figure 13. Relationship between irradiance and AC power from the entire plant for April 1, 2010, a partly cloudy day. The major difference between Figures 11 and 13 is the larger spread in the data on the variable day. However, the linear model still matches the plant output quite well. Under spatially heterogeneous irradiance conditions, a single irradiance sensor will certainly not be a good
predictor of integrated irradiance hitting the array, as is demonstrated by the red data in Figure 13. Figure 14 shows our hypothesis of what the relationship between the network average irradiance and plant output will be once the curtailment is lifted. It is possible that at higher irradiance the linear relationship will not apply as PV module efficiency is lowered at high cell temperatures.
Figure 14. Estimate at the 95% confidence bound on the relationship between network average irradiance and plant output in the absence of curtailment.
FUTURE WORK
Future La Ola plant site evaluation will be conducted to determine why the RF mesh network is not compensating dynamically for all field configurations and to eliminate sporadic irradiance and temperature noise occurrences. Future modeling work will refine the data filtering so that repeated data is replaced by interpolated irradiance values and data from noisy sensors is examined and possibly removed from the analysis. We will further examine how plant output prediction errors are affected by the sensor density. We believe that more sensors will provide a better estimate of plant output but fewer sensors may be sufficient.
ACKNOWLEDGEMENT Sandia is a multi-program laboratory operated by Sandia Corporation, a Lockheed Martin Company, for the United States Department of Energy’s National Nuclear Security Administration under contract DE-AC04-94AL85000. SAND2009-2801P
REFERENCES [1] King et al. 2004, Photovoltaic Array Performance Model, SAND-2004-3535. [2] Jones, A.D. and Underwood, C.P., 2001, A thermal Model for Photovoltaic Systems, Solar Energy, 70, n. 4, pp 349-359.