lampiran 1 - repo.darmajaya.ac.idrepo.darmajaya.ac.id/316/7/lampiran.pdf · lampiran 1 kuisioner...
TRANSCRIPT
Lampiran 1
KUISIONER
Pertanyaan dibawah ini dalam rangka penelitian skripsi dengan judul :
Analisis Pengaruh Event Sponsorship Terhadap Brand Image Rokok Sampoerna A
Mild Pada PT HM Sampoerna. TBK Cabang Bandar Lampung.
Petunjuk Pengisian :
1. Jawablah pertanyaan yang diajukan dibawah ini dengan benar .
2. Berilah tanda ( X ) pada salah satu jawaban yang paling benar.
3. Pertanyaan / Pernyataan harus dijawab semua.
SS = Sangat Setuju
S = Setuju
R = Ragu
TS = Tidak Setuju
STS = Sangat tidak setuju
Identitas responden :
Nama :
Umur :
Pekerjaan :
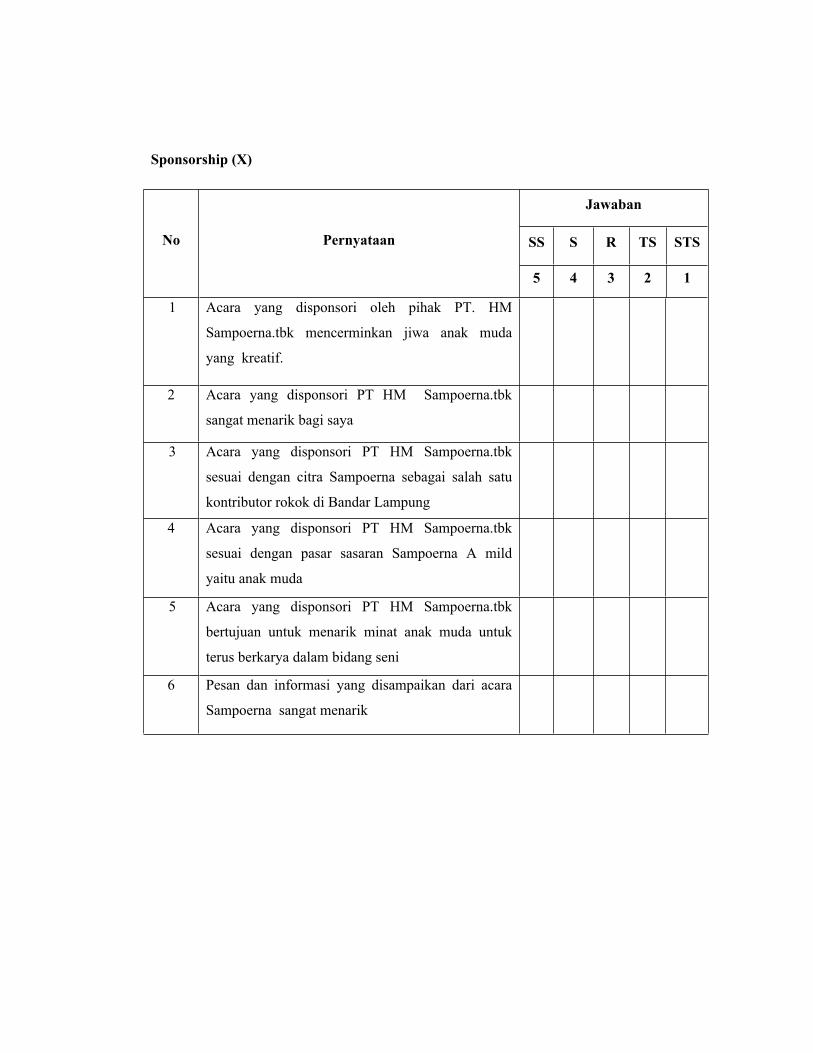
Sponsorship (X)
Jawaban
SS S R TS STSNo Pernyataan
5 4 3 2 1
1 Acara yang disponsori oleh pihak PT. HM
Sampoerna.tbk mencerminkan jiwa anak muda
yang kreatif.
2 Acara yang disponsori PT HM Sampoerna.tbk
sangat menarik bagi saya
3 Acara yang disponsori PT HM Sampoerna.tbk
sesuai dengan citra Sampoerna sebagai salah satu
kontributor rokok di Bandar Lampung
4 Acara yang disponsori PT HM Sampoerna.tbk
sesuai dengan pasar sasaran Sampoerna A mild
yaitu anak muda
5 Acara yang disponsori PT HM Sampoerna.tbk
bertujuan untuk menarik minat anak muda untuk
terus berkarya dalam bidang seni
6 Pesan dan informasi yang disampaikan dari acara
Sampoerna sangat menarik
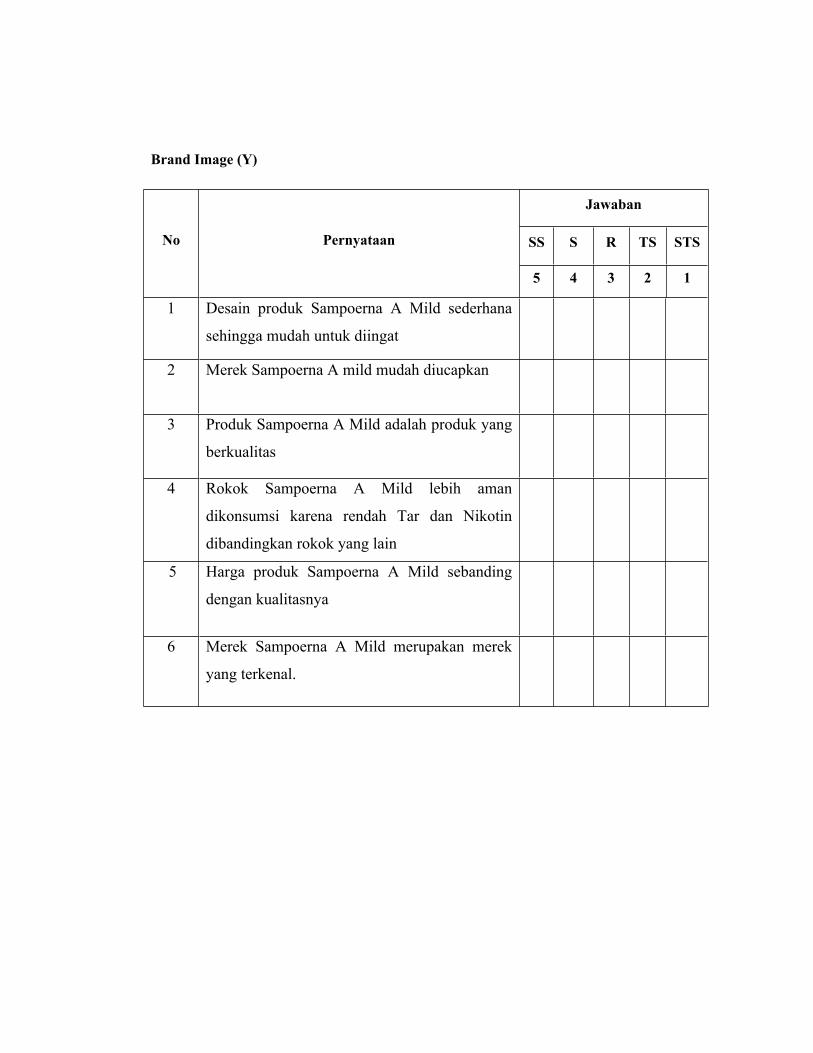
Brand Image (Y)
Jawaban
SS S R TS STSNo Pernyataan
5 4 3 2 1
1 Desain produk Sampoerna A Mild sederhana
sehingga mudah untuk diingat
2 Merek Sampoerna A mild mudah diucapkan
3 Produk Sampoerna A Mild adalah produk yang
berkualitas
4 Rokok Sampoerna A Mild lebih aman
dikonsumsi karena rendah Tar dan Nikotin
dibandingkan rokok yang lain
5 Harga produk Sampoerna A Mild sebanding
dengan kualitasnya
6 Merek Sampoerna A Mild merupakan merek
yang terkenal.
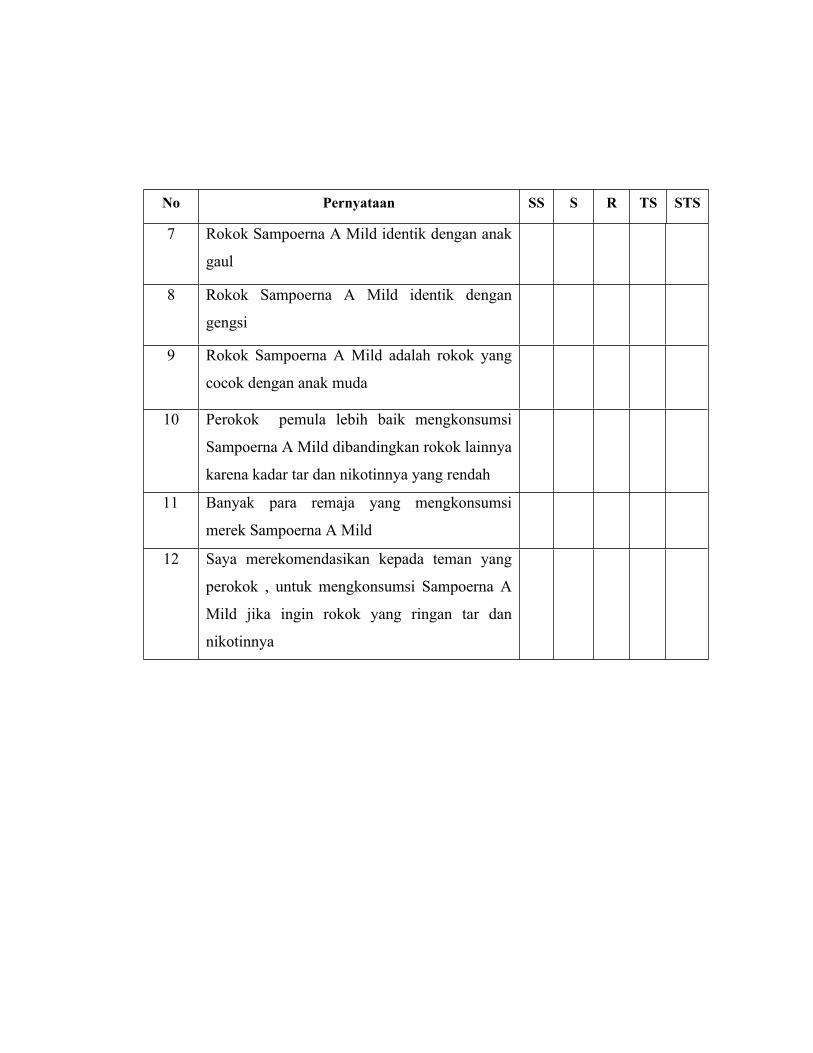
No Pernyataan SS S R TS STS
7 Rokok Sampoerna A Mild identik dengan anak
gaul
8 Rokok Sampoerna A Mild identik dengan
gengsi
9 Rokok Sampoerna A Mild adalah rokok yang
cocok dengan anak muda
10 Perokok pemula lebih baik mengkonsumsi
Sampoerna A Mild dibandingkan rokok lainnya
karena kadar tar dan nikotinnya yang rendah
11 Banyak para remaja yang mengkonsumsi
merek Sampoerna A Mild
12 Saya merekomendasikan kepada teman yang
perokok , untuk mengkonsumsi Sampoerna A
Mild jika ingin rokok yang ringan tar dan
nikotinnya
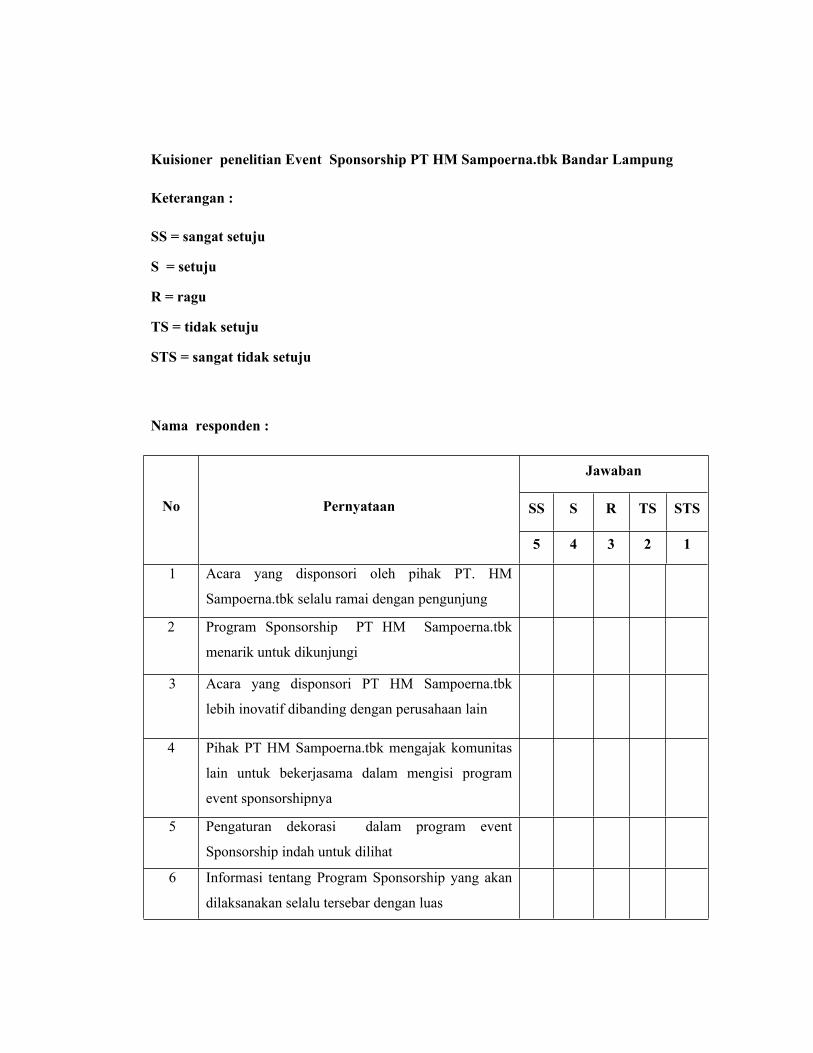
Kuisioner penelitian Event Sponsorship PT HM Sampoerna.tbk Bandar Lampung
Keterangan :
SS = sangat setuju
S = setuju
R = ragu
TS = tidak setuju
STS = sangat tidak setuju
Nama responden :
Jawaban
SS S R TS STSNo Pernyataan
5 4 3 2 1
1 Acara yang disponsori oleh pihak PT. HM
Sampoerna.tbk selalu ramai dengan pengunjung
2 Program Sponsorship PT HM Sampoerna.tbk
menarik untuk dikunjungi
3 Acara yang disponsori PT HM Sampoerna.tbk
lebih inovatif dibanding dengan perusahaan lain
4 Pihak PT HM Sampoerna.tbk mengajak komunitas
lain untuk bekerjasama dalam mengisi program
event sponsorshipnya
5 Pengaturan dekorasi dalam program event
Sponsorship indah untuk dilihat
6 Informasi tentang Program Sponsorship yang akan
dilaksanakan selalu tersebar dengan luas
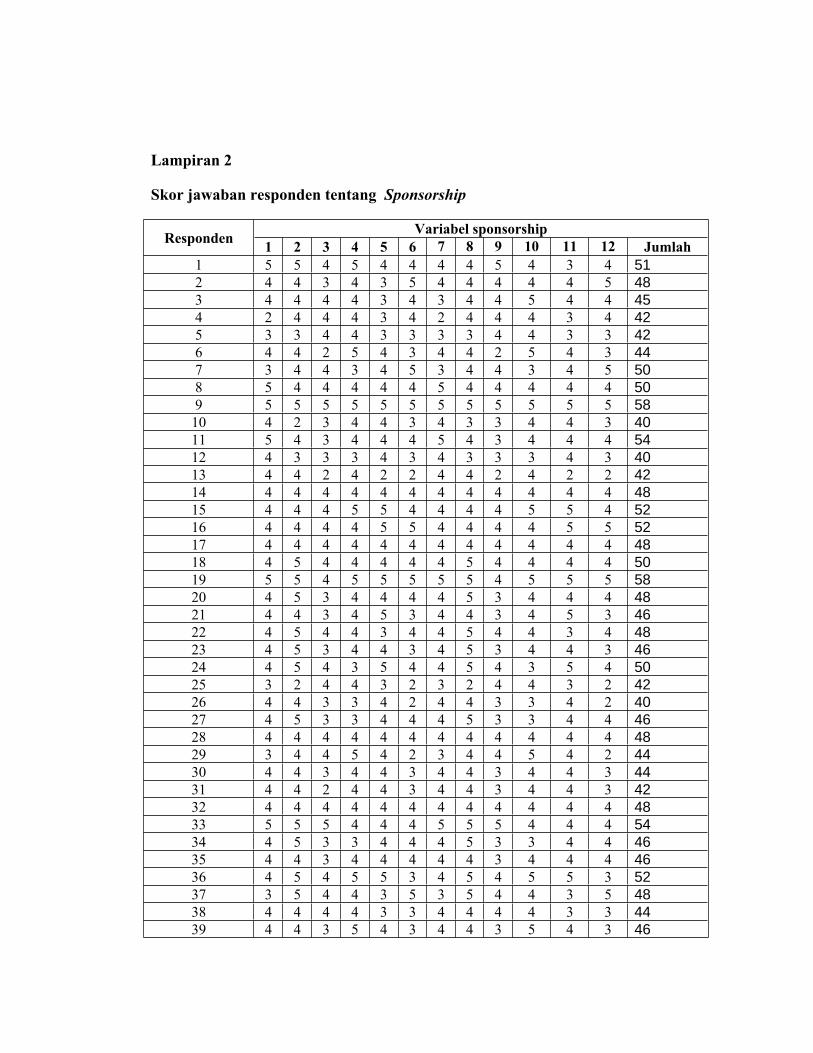
Lampiran 2
Skor jawaban responden tentang Sponsorship
Variabel sponsorshipResponden 1 2 3 4 5 6 7 8 9 10 11 12 Jumlah1 5 5 4 5 4 4 4 4 5 4 3 4 512 4 4 3 4 3 5 4 4 4 4 4 5 483 4 4 4 4 3 4 3 4 4 5 4 4 454 2 4 4 4 3 4 2 4 4 4 3 4 425 3 3 4 4 3 3 3 3 4 4 3 3 426 4 4 2 5 4 3 4 4 2 5 4 3 447 3 4 4 3 4 5 3 4 4 3 4 5 508 5 4 4 4 4 4 5 4 4 4 4 4 509 5 5 5 5 5 5 5 5 5 5 5 5 5810 4 2 3 4 4 3 4 3 3 4 4 3 4011 5 4 3 4 4 4 5 4 3 4 4 4 5412 4 3 3 3 4 3 4 3 3 3 4 3 4013 4 4 2 4 2 2 4 4 2 4 2 2 4214 4 4 4 4 4 4 4 4 4 4 4 4 4815 4 4 4 5 5 4 4 4 4 5 5 4 5216 4 4 4 4 5 5 4 4 4 4 5 5 5217 4 4 4 4 4 4 4 4 4 4 4 4 4818 4 5 4 4 4 4 4 5 4 4 4 4 5019 5 5 4 5 5 5 5 5 4 5 5 5 5820 4 5 3 4 4 4 4 5 3 4 4 4 4821 4 4 3 4 5 3 4 4 3 4 5 3 4622 4 5 4 4 3 4 4 5 4 4 3 4 4823 4 5 3 4 4 3 4 5 3 4 4 3 4624 4 5 4 3 5 4 4 5 4 3 5 4 5025 3 2 4 4 3 2 3 2 4 4 3 2 4226 4 4 3 3 4 2 4 4 3 3 4 2 4027 4 5 3 3 4 4 4 5 3 3 4 4 4628 4 4 4 4 4 4 4 4 4 4 4 4 4829 3 4 4 5 4 2 3 4 4 5 4 2 4430 4 4 3 4 4 3 4 4 3 4 4 3 4431 4 4 2 4 4 3 4 4 3 4 4 3 4232 4 4 4 4 4 4 4 4 4 4 4 4 4833 5 5 5 4 4 4 5 5 5 4 4 4 5434 4 5 3 3 4 4 4 5 3 3 4 4 4635 4 4 3 4 4 4 4 4 3 4 4 4 4636 4 5 4 5 5 3 4 5 4 5 5 3 5237 3 5 4 4 3 5 3 5 4 4 3 5 4838 4 4 4 4 3 3 4 4 4 4 3 3 4439 4 4 3 5 4 3 4 4 3 5 4 3 46
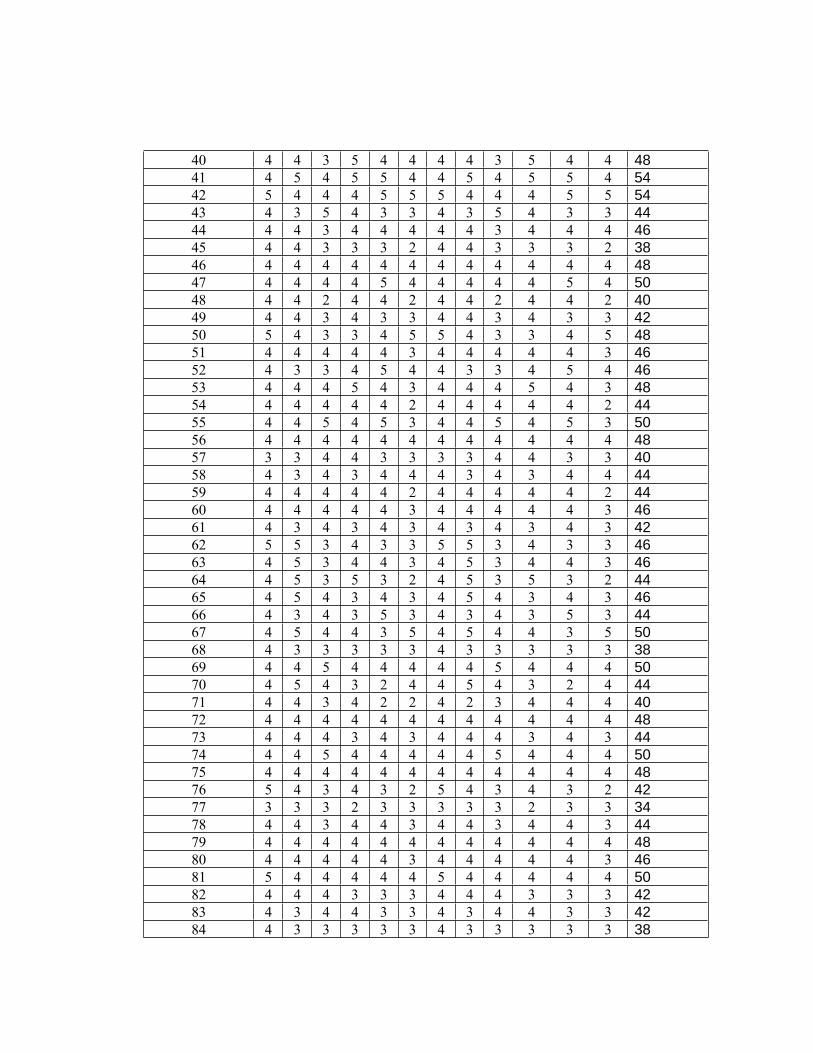
40 4 4 3 5 4 4 4 4 3 5 4 4 4841 4 5 4 5 5 4 4 5 4 5 5 4 5442 5 4 4 4 5 5 5 4 4 4 5 5 5443 4 3 5 4 3 3 4 3 5 4 3 3 4444 4 4 3 4 4 4 4 4 3 4 4 4 4645 4 4 3 3 3 2 4 4 3 3 3 2 3846 4 4 4 4 4 4 4 4 4 4 4 4 4847 4 4 4 4 5 4 4 4 4 4 5 4 5048 4 4 2 4 4 2 4 4 2 4 4 2 4049 4 4 3 4 3 3 4 4 3 4 3 3 4250 5 4 3 3 4 5 5 4 3 3 4 5 4851 4 4 4 4 4 3 4 4 4 4 4 3 4652 4 3 3 4 5 4 4 3 3 4 5 4 4653 4 4 4 5 4 3 4 4 4 5 4 3 4854 4 4 4 4 4 2 4 4 4 4 4 2 4455 4 4 5 4 5 3 4 4 5 4 5 3 5056 4 4 4 4 4 4 4 4 4 4 4 4 4857 3 3 4 4 3 3 3 3 4 4 3 3 4058 4 3 4 3 4 4 4 3 4 3 4 4 4459 4 4 4 4 4 2 4 4 4 4 4 2 4460 4 4 4 4 4 3 4 4 4 4 4 3 4661 4 3 4 3 4 3 4 3 4 3 4 3 4262 5 5 3 4 3 3 5 5 3 4 3 3 4663 4 5 3 4 4 3 4 5 3 4 4 3 4664 4 5 3 5 3 2 4 5 3 5 3 2 4465 4 5 4 3 4 3 4 5 4 3 4 3 4666 4 3 4 3 5 3 4 3 4 3 5 3 4467 4 5 4 4 3 5 4 5 4 4 3 5 5068 4 3 3 3 3 3 4 3 3 3 3 3 3869 4 4 5 4 4 4 4 4 5 4 4 4 5070 4 5 4 3 2 4 4 5 4 3 2 4 4471 4 4 3 4 2 2 4 2 3 4 4 4 4072 4 4 4 4 4 4 4 4 4 4 4 4 4873 4 4 4 3 4 3 4 4 4 3 4 3 4474 4 4 5 4 4 4 4 4 5 4 4 4 5075 4 4 4 4 4 4 4 4 4 4 4 4 4876 5 4 3 4 3 2 5 4 3 4 3 2 4277 3 3 3 2 3 3 3 3 3 2 3 3 3478 4 4 3 4 4 3 4 4 3 4 4 3 4479 4 4 4 4 4 4 4 4 4 4 4 4 4880 4 4 4 4 4 3 4 4 4 4 4 3 4681 5 4 4 4 4 4 5 4 4 4 4 4 5082 4 4 4 3 3 3 4 4 4 3 3 3 4283 4 3 4 4 3 3 4 3 4 4 3 3 4284 4 3 3 3 3 3 4 3 3 3 3 3 38
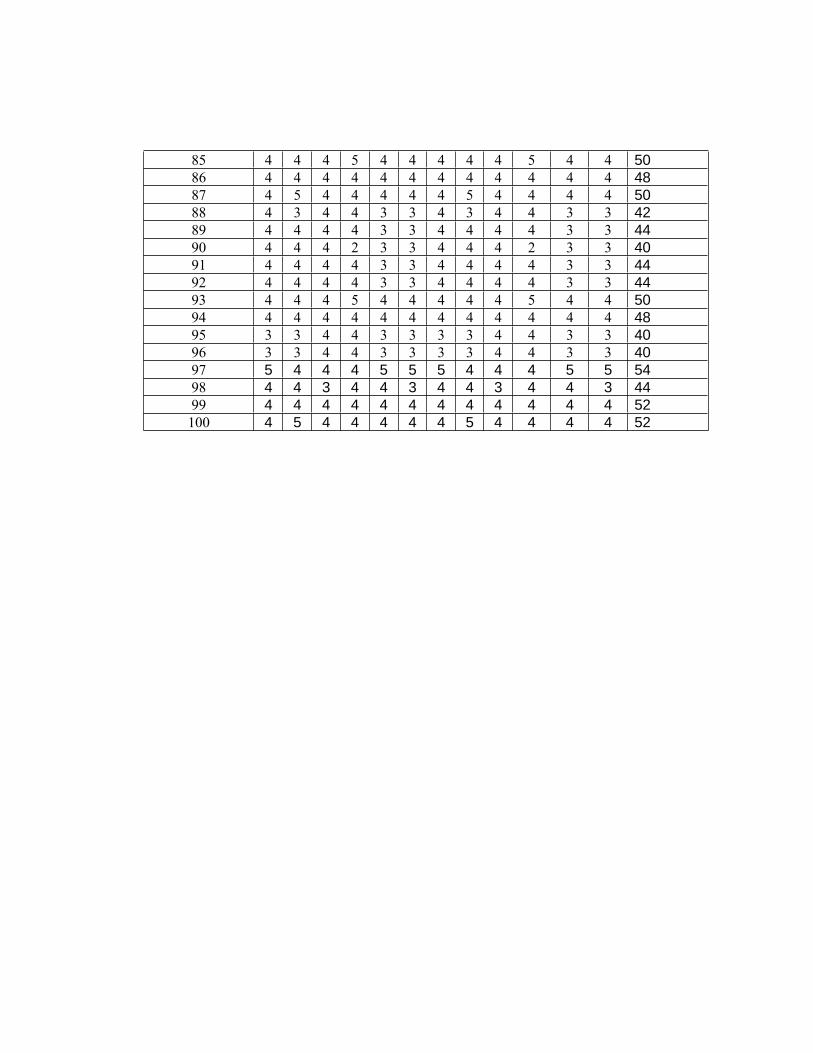
85 4 4 4 5 4 4 4 4 4 5 4 4 5086 4 4 4 4 4 4 4 4 4 4 4 4 4887 4 5 4 4 4 4 4 5 4 4 4 4 5088 4 3 4 4 3 3 4 3 4 4 3 3 4289 4 4 4 4 3 3 4 4 4 4 3 3 4490 4 4 4 2 3 3 4 4 4 2 3 3 4091 4 4 4 4 3 3 4 4 4 4 3 3 4492 4 4 4 4 3 3 4 4 4 4 3 3 4493 4 4 4 5 4 4 4 4 4 5 4 4 5094 4 4 4 4 4 4 4 4 4 4 4 4 4895 3 3 4 4 3 3 3 3 4 4 3 3 4096 3 3 4 4 3 3 3 3 4 4 3 3 4097 5 4 4 4 5 5 5 4 4 4 5 5 5498 4 4 3 4 4 3 4 4 3 4 4 3 4499 4 4 4 4 4 4 4 4 4 4 4 4 52100 4 5 4 4 4 4 4 5 4 4 4 4 52
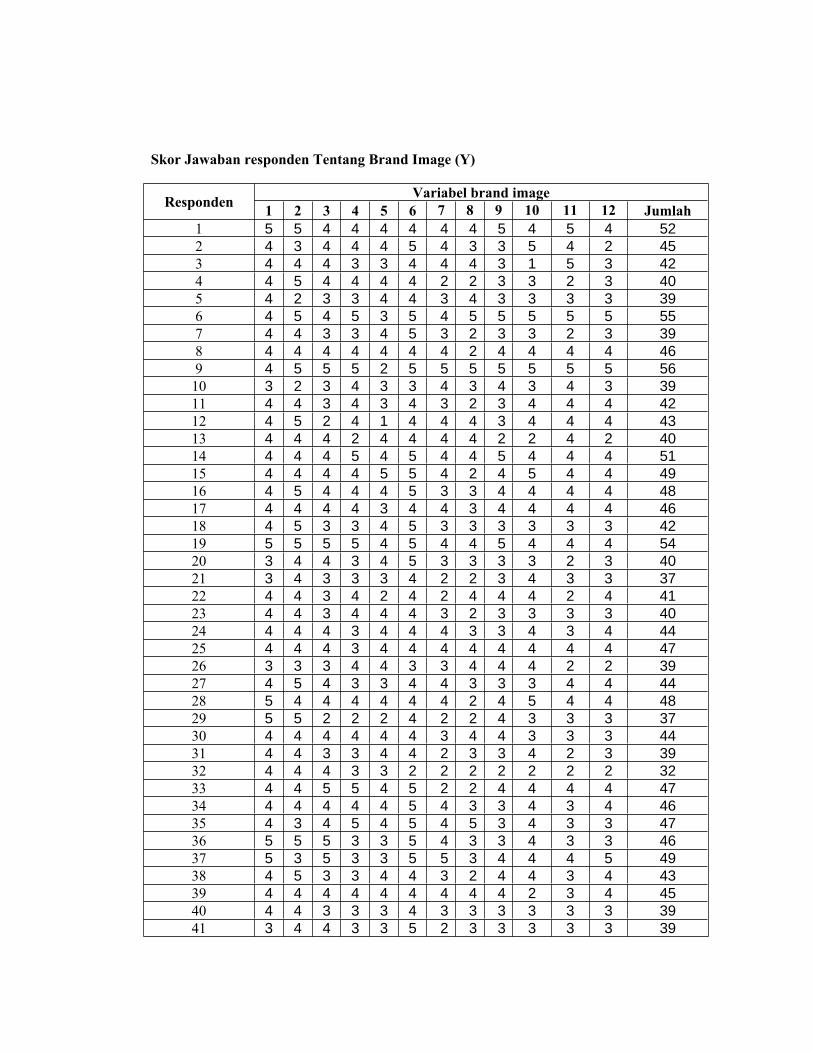
Skor Jawaban responden Tentang Brand Image (Y)
Variabel brand imageResponden 1 2 3 4 5 6 7 8 9 10 11 12 Jumlah1 5 5 4 4 4 4 4 4 5 4 5 4 522 4 3 4 4 4 5 4 3 3 5 4 2 453 4 4 4 3 3 4 4 4 3 1 5 3 424 4 5 4 4 4 4 2 2 3 3 2 3 405 4 2 3 3 4 4 3 4 3 3 3 3 396 4 5 4 5 3 5 4 5 5 5 5 5 557 4 4 3 3 4 5 3 2 3 3 2 3 398 4 4 4 4 4 4 4 2 4 4 4 4 469 4 5 5 5 2 5 5 5 5 5 5 5 5610 3 2 3 4 3 3 4 3 4 3 4 3 3911 4 4 3 4 3 4 3 2 3 4 4 4 4212 4 5 2 4 1 4 4 4 3 4 4 4 4313 4 4 4 2 4 4 4 4 2 2 4 2 4014 4 4 4 5 4 5 4 4 5 4 4 4 5115 4 4 4 4 5 5 4 2 4 5 4 4 4916 4 5 4 4 4 5 3 3 4 4 4 4 4817 4 4 4 4 3 4 4 3 4 4 4 4 4618 4 5 3 3 4 5 3 3 3 3 3 3 4219 5 5 5 5 4 5 4 4 5 4 4 4 5420 3 4 4 3 4 5 3 3 3 3 2 3 4021 3 4 3 3 3 4 2 2 3 4 3 3 3722 4 4 3 4 2 4 2 4 4 4 2 4 4123 4 4 3 4 4 4 3 2 3 3 3 3 4024 4 4 4 3 4 4 4 3 3 4 3 4 4425 4 4 4 3 4 4 4 4 4 4 4 4 4726 3 3 3 4 4 3 3 4 4 4 2 2 3927 4 5 4 3 3 4 4 3 3 3 4 4 4428 5 4 4 4 4 4 4 2 4 5 4 4 4829 5 5 2 2 2 4 2 2 4 3 3 3 3730 4 4 4 4 4 4 3 4 4 3 3 3 4431 4 4 3 3 4 4 2 3 3 4 2 3 3932 4 4 4 3 3 2 2 2 2 2 2 2 3233 4 4 5 5 4 5 2 2 4 4 4 4 4734 4 4 4 4 4 5 4 3 3 4 3 4 4635 4 3 4 5 4 5 4 5 3 4 3 3 4736 5 5 5 3 3 5 4 3 3 4 3 3 4637 5 3 5 3 3 5 5 3 4 4 4 5 4938 4 5 3 3 4 4 3 2 4 4 3 4 4339 4 4 4 4 4 4 4 4 4 2 3 4 4540 4 4 3 3 3 4 3 3 3 3 3 3 3941 3 4 4 3 3 5 2 3 3 3 3 3 39
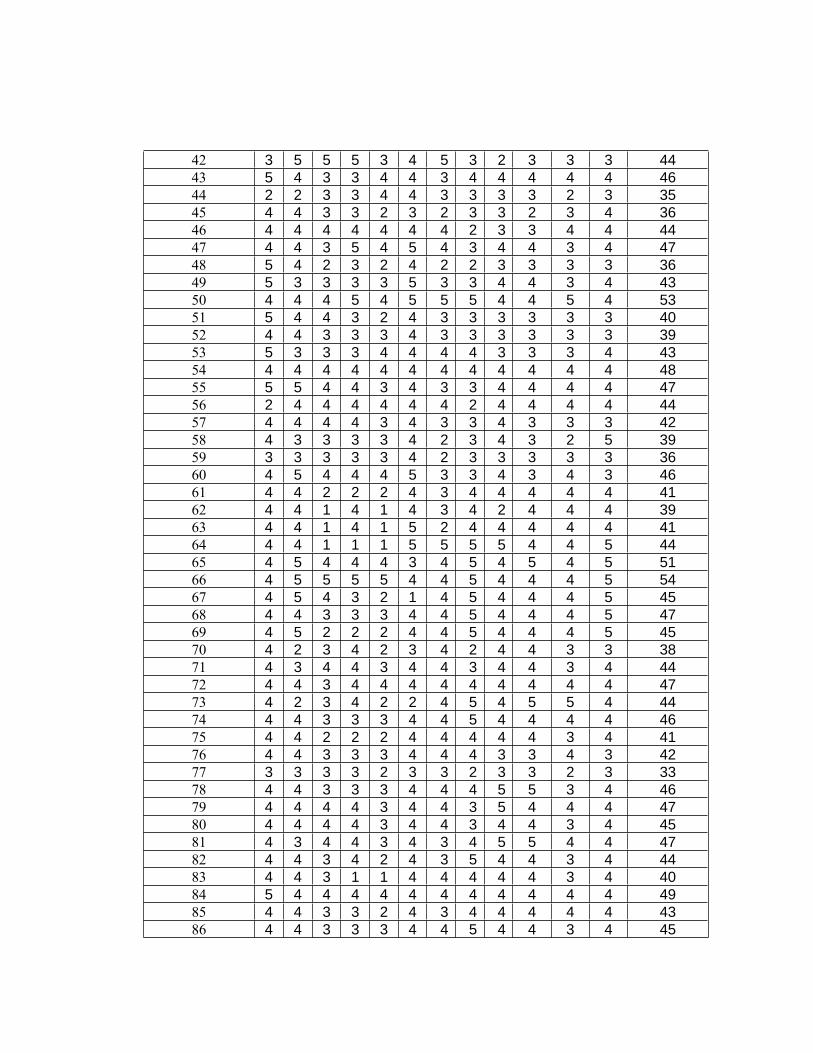
42 3 5 5 5 3 4 5 3 2 3 3 3 4443 5 4 3 3 4 4 3 4 4 4 4 4 4644 2 2 3 3 4 4 3 3 3 3 2 3 3545 4 4 3 3 2 3 2 3 3 2 3 4 3646 4 4 4 4 4 4 4 2 3 3 4 4 4447 4 4 3 5 4 5 4 3 4 4 3 4 4748 5 4 2 3 2 4 2 2 3 3 3 3 3649 5 3 3 3 3 5 3 3 4 4 3 4 4350 4 4 4 5 4 5 5 5 4 4 5 4 5351 5 4 4 3 2 4 3 3 3 3 3 3 4052 4 4 3 3 3 4 3 3 3 3 3 3 3953 5 3 3 3 4 4 4 4 3 3 3 4 4354 4 4 4 4 4 4 4 4 4 4 4 4 4855 5 5 4 4 3 4 3 3 4 4 4 4 4756 2 4 4 4 4 4 4 2 4 4 4 4 4457 4 4 4 4 3 4 3 3 4 3 3 3 4258 4 3 3 3 3 4 2 3 4 3 2 5 3959 3 3 3 3 3 4 2 3 3 3 3 3 3660 4 5 4 4 4 5 3 3 4 3 4 3 4661 4 4 2 2 2 4 3 4 4 4 4 4 4162 4 4 1 4 1 4 3 4 2 4 4 4 3963 4 4 1 4 1 5 2 4 4 4 4 4 4164 4 4 1 1 1 5 5 5 5 4 4 5 4465 4 5 4 4 4 3 4 5 4 5 4 5 5166 4 5 5 5 5 4 4 5 4 4 4 5 5467 4 5 4 3 2 1 4 5 4 4 4 5 4568 4 4 3 3 3 4 4 5 4 4 4 5 4769 4 5 2 2 2 4 4 5 4 4 4 5 4570 4 2 3 4 2 3 4 2 4 4 3 3 3871 4 3 4 4 3 4 4 3 4 4 3 4 4472 4 4 3 4 4 4 4 4 4 4 4 4 4773 4 2 3 4 2 2 4 5 4 5 5 4 4474 4 4 3 3 3 4 4 5 4 4 4 4 4675 4 4 2 2 2 4 4 4 4 4 3 4 4176 4 4 3 3 3 4 4 4 3 3 4 3 4277 3 3 3 3 2 3 3 2 3 3 2 3 3378 4 4 3 3 3 4 4 4 5 5 3 4 4679 4 4 4 4 3 4 4 3 5 4 4 4 4780 4 4 4 4 3 4 4 3 4 4 3 4 4581 4 3 4 4 3 4 3 4 5 5 4 4 4782 4 4 3 4 2 4 3 5 4 4 3 4 4483 4 4 3 1 1 4 4 4 4 4 3 4 4084 5 4 4 4 4 4 4 4 4 4 4 4 4985 4 4 3 3 2 4 3 4 4 4 4 4 4386 4 4 3 3 3 4 4 5 4 4 3 4 45
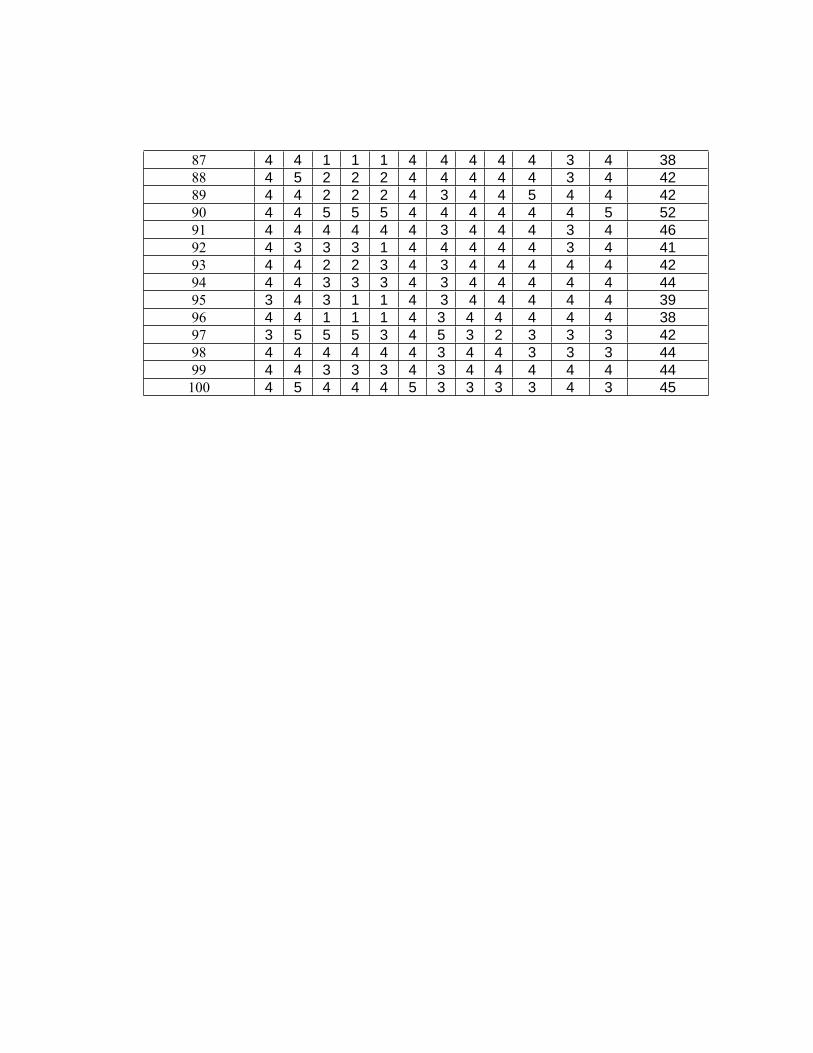
87 4 4 1 1 1 4 4 4 4 4 3 4 3888 4 5 2 2 2 4 4 4 4 4 3 4 4289 4 4 2 2 2 4 3 4 4 5 4 4 4290 4 4 5 5 5 4 4 4 4 4 4 5 5291 4 4 4 4 4 4 3 4 4 4 3 4 4692 4 3 3 3 1 4 4 4 4 4 3 4 4193 4 4 2 2 3 4 3 4 4 4 4 4 4294 4 4 3 3 3 4 3 4 4 4 4 4 4495 3 4 3 1 1 4 3 4 4 4 4 4 3996 4 4 1 1 1 4 3 4 4 4 4 4 3897 3 5 5 5 3 4 5 3 2 3 3 3 4298 4 4 4 4 4 4 3 4 4 3 3 3 4499 4 4 3 3 3 4 3 4 4 4 4 4 44100 4 5 4 4 4 5 3 3 3 3 4 3 45
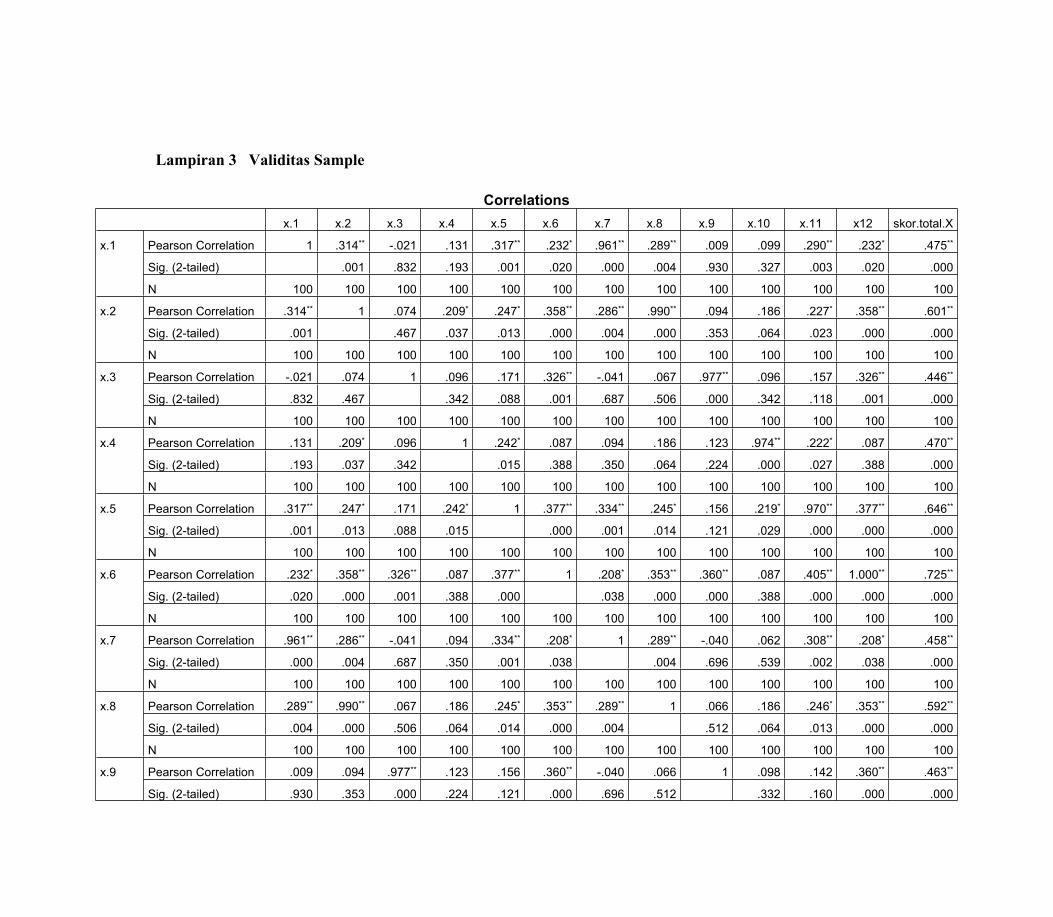
Lampiran 3 Validitas Sample
Correlationsx.1 x.2 x.3 x.4 x.5 x.6 x.7 x.8 x.9 x.10 x.11 x12 skor.total.X
Pearson Correlation 1 .314** -.021 .131 .317** .232* .961** .289** .009 .099 .290** .232* .475**
Sig. (2-tailed) .001 .832 .193 .001 .020 .000 .004 .930 .327 .003 .020 .000
x.1
N 100 100 100 100 100 100 100 100 100 100 100 100 100
Pearson Correlation .314** 1 .074 .209* .247* .358** .286** .990** .094 .186 .227* .358** .601**
Sig. (2-tailed) .001 .467 .037 .013 .000 .004 .000 .353 .064 .023 .000 .000
x.2
N 100 100 100 100 100 100 100 100 100 100 100 100 100
Pearson Correlation -.021 .074 1 .096 .171 .326** -.041 .067 .977** .096 .157 .326** .446**
Sig. (2-tailed) .832 .467 .342 .088 .001 .687 .506 .000 .342 .118 .001 .000
x.3
N 100 100 100 100 100 100 100 100 100 100 100 100 100
Pearson Correlation .131 .209* .096 1 .242* .087 .094 .186 .123 .974** .222* .087 .470**
Sig. (2-tailed) .193 .037 .342 .015 .388 .350 .064 .224 .000 .027 .388 .000
x.4
N 100 100 100 100 100 100 100 100 100 100 100 100 100
Pearson Correlation .317** .247* .171 .242* 1 .377** .334** .245* .156 .219* .970** .377** .646**
Sig. (2-tailed) .001 .013 .088 .015 .000 .001 .014 .121 .029 .000 .000 .000
x.5
N 100 100 100 100 100 100 100 100 100 100 100 100 100
Pearson Correlation .232* .358** .326** .087 .377** 1 .208* .353** .360** .087 .405** 1.000** .725**
Sig. (2-tailed) .020 .000 .001 .388 .000 .038 .000 .000 .388 .000 .000 .000
x.6
N 100 100 100 100 100 100 100 100 100 100 100 100 100
Pearson Correlation .961** .286** -.041 .094 .334** .208* 1 .289** -.040 .062 .308** .208* .458**
Sig. (2-tailed) .000 .004 .687 .350 .001 .038 .004 .696 .539 .002 .038 .000
x.7
N 100 100 100 100 100 100 100 100 100 100 100 100 100
Pearson Correlation .289** .990** .067 .186 .245* .353** .289** 1 .066 .186 .246* .353** .592**
Sig. (2-tailed) .004 .000 .506 .064 .014 .000 .004 .512 .064 .013 .000 .000
x.8
N 100 100 100 100 100 100 100 100 100 100 100 100 100
Pearson Correlation .009 .094 .977** .123 .156 .360** -.040 .066 1 .098 .142 .360** .463**x.9
Sig. (2-tailed) .930 .353 .000 .224 .121 .000 .696 .512 .332 .160 .000 .000
N 100 100 100 100 100 100 100 100 100 100 100 100 100
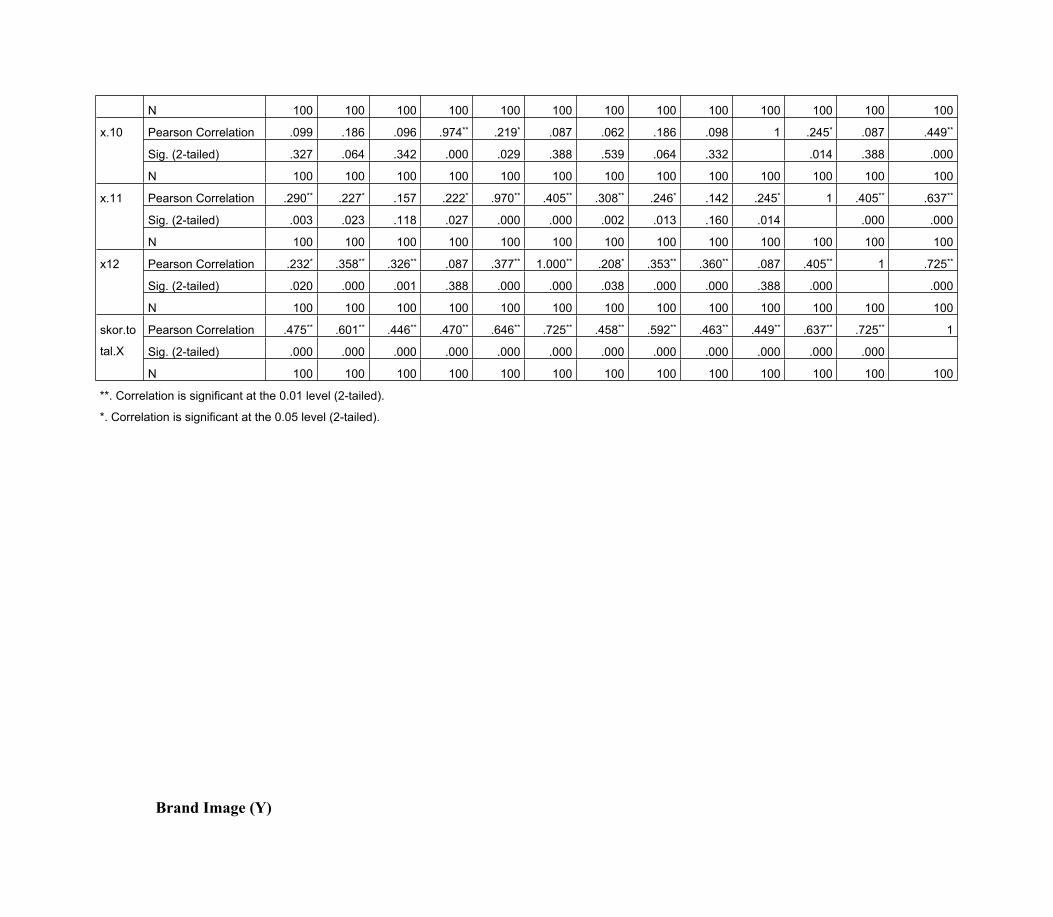
Pearson Correlation .099 .186 .096 .974** .219* .087 .062 .186 .098 1 .245* .087 .449**
Sig. (2-tailed) .327 .064 .342 .000 .029 .388 .539 .064 .332 .014 .388 .000
x.10
N 100 100 100 100 100 100 100 100 100 100 100 100 100
Pearson Correlation .290** .227* .157 .222* .970** .405** .308** .246* .142 .245* 1 .405** .637**
Sig. (2-tailed) .003 .023 .118 .027 .000 .000 .002 .013 .160 .014 .000 .000
x.11
N 100 100 100 100 100 100 100 100 100 100 100 100 100
Pearson Correlation .232* .358** .326** .087 .377** 1.000** .208* .353** .360** .087 .405** 1 .725**
Sig. (2-tailed) .020 .000 .001 .388 .000 .000 .038 .000 .000 .388 .000 .000
x12
N 100 100 100 100 100 100 100 100 100 100 100 100 100
Pearson Correlation .475** .601** .446** .470** .646** .725** .458** .592** .463** .449** .637** .725** 1
Sig. (2-tailed) .000 .000 .000 .000 .000 .000 .000 .000 .000 .000 .000 .000
skor.to
tal.X
N 100 100 100 100 100 100 100 100 100 100 100 100 100
**. Correlation is significant at the 0.01 level (2-tailed).
*. Correlation is significant at the 0.05 level (2-tailed).
Brand Image (Y)
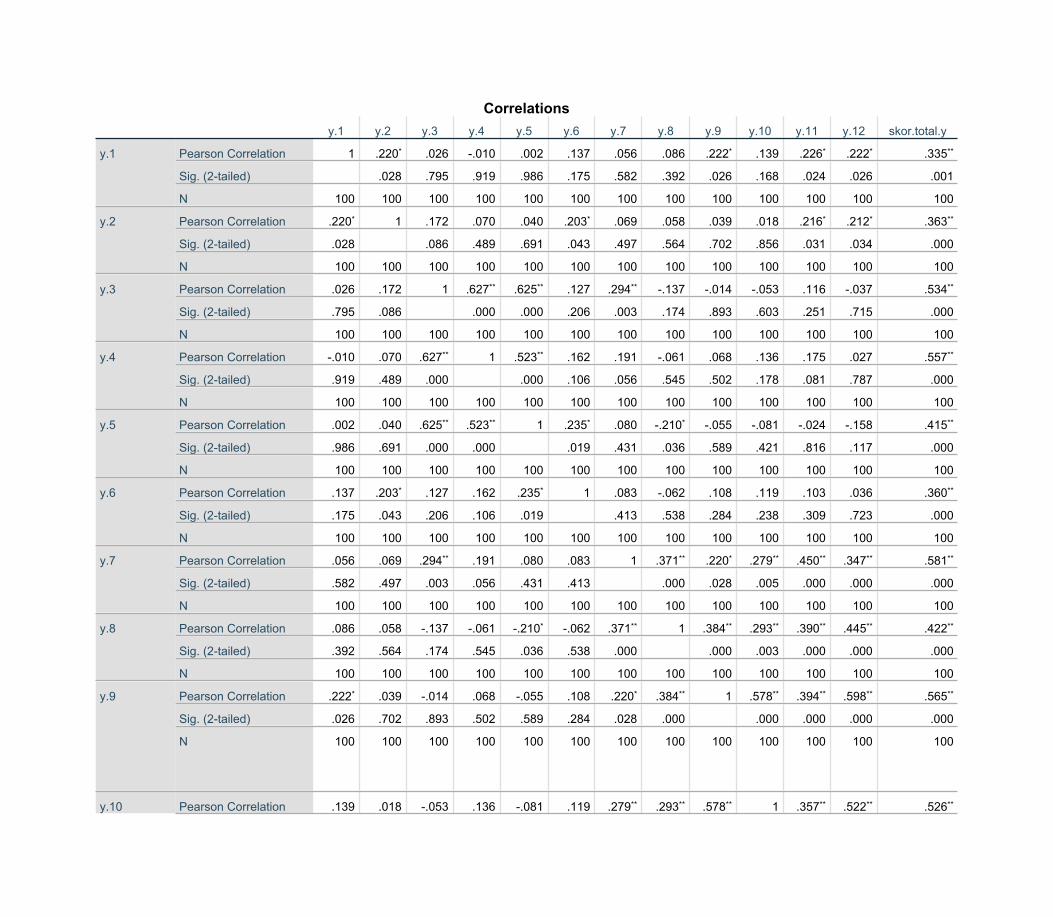
Correlationsy.1 y.2 y.3 y.4 y.5 y.6 y.7 y.8 y.9 y.10 y.11 y.12 skor.total.y
Pearson Correlation 1 .220* .026 -.010 .002 .137 .056 .086 .222* .139 .226* .222* .335**
Sig. (2-tailed) .028 .795 .919 .986 .175 .582 .392 .026 .168 .024 .026 .001
y.1
N 100 100 100 100 100 100 100 100 100 100 100 100 100
Pearson Correlation .220* 1 .172 .070 .040 .203* .069 .058 .039 .018 .216* .212* .363**
Sig. (2-tailed) .028 .086 .489 .691 .043 .497 .564 .702 .856 .031 .034 .000
y.2
N 100 100 100 100 100 100 100 100 100 100 100 100 100
Pearson Correlation .026 .172 1 .627** .625** .127 .294** -.137 -.014 -.053 .116 -.037 .534**
Sig. (2-tailed) .795 .086 .000 .000 .206 .003 .174 .893 .603 .251 .715 .000
y.3
N 100 100 100 100 100 100 100 100 100 100 100 100 100
Pearson Correlation -.010 .070 .627** 1 .523** .162 .191 -.061 .068 .136 .175 .027 .557**
Sig. (2-tailed) .919 .489 .000 .000 .106 .056 .545 .502 .178 .081 .787 .000
y.4
N 100 100 100 100 100 100 100 100 100 100 100 100 100
Pearson Correlation .002 .040 .625** .523** 1 .235* .080 -.210* -.055 -.081 -.024 -.158 .415**
Sig. (2-tailed) .986 .691 .000 .000 .019 .431 .036 .589 .421 .816 .117 .000
y.5
N 100 100 100 100 100 100 100 100 100 100 100 100 100
Pearson Correlation .137 .203* .127 .162 .235* 1 .083 -.062 .108 .119 .103 .036 .360**
Sig. (2-tailed) .175 .043 .206 .106 .019 .413 .538 .284 .238 .309 .723 .000
y.6
N 100 100 100 100 100 100 100 100 100 100 100 100 100
Pearson Correlation .056 .069 .294** .191 .080 .083 1 .371** .220* .279** .450** .347** .581**
Sig. (2-tailed) .582 .497 .003 .056 .431 .413 .000 .028 .005 .000 .000 .000
y.7
N 100 100 100 100 100 100 100 100 100 100 100 100 100
Pearson Correlation .086 .058 -.137 -.061 -.210* -.062 .371** 1 .384** .293** .390** .445** .422**
Sig. (2-tailed) .392 .564 .174 .545 .036 .538 .000 .000 .003 .000 .000 .000
y.8
N 100 100 100 100 100 100 100 100 100 100 100 100 100
Pearson Correlation .222* .039 -.014 .068 -.055 .108 .220* .384** 1 .578** .394** .598** .565**
Sig. (2-tailed) .026 .702 .893 .502 .589 .284 .028 .000 .000 .000 .000 .000
y.9
N 100 100 100 100 100 100 100 100 100 100 100 100 100
y.10 Pearson Correlation .139 .018 -.053 .136 -.081 .119 .279** .293** .578** 1 .357** .522** .526**
Sig. (2-tailed) .168 .856 .603 .178 .421 .238 .005 .003 .000 .000 .000 .000
N 100 100 100 100 100 100 100 100 100 100 100 100 100
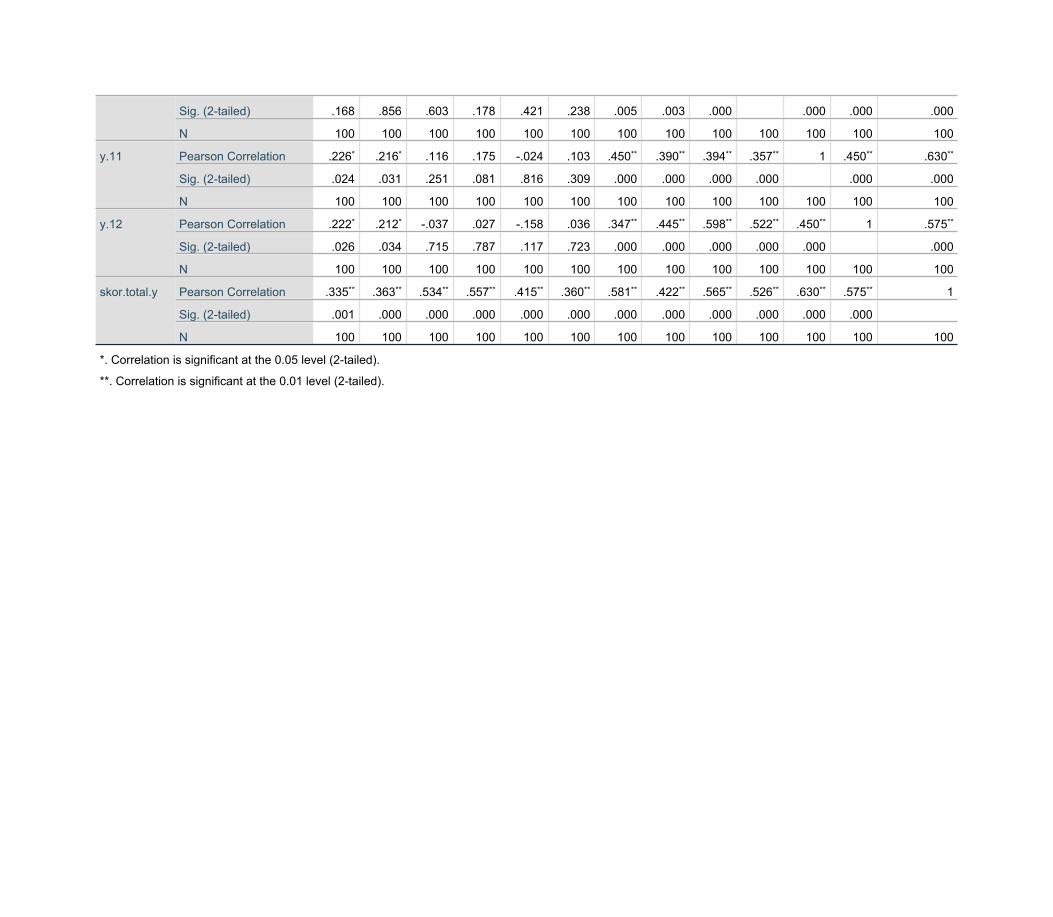
Pearson Correlation .226* .216* .116 .175 -.024 .103 .450** .390** .394** .357** 1 .450** .630**
Sig. (2-tailed) .024 .031 .251 .081 .816 .309 .000 .000 .000 .000 .000 .000
y.11
N 100 100 100 100 100 100 100 100 100 100 100 100 100
Pearson Correlation .222* .212* -.037 .027 -.158 .036 .347** .445** .598** .522** .450** 1 .575**
Sig. (2-tailed) .026 .034 .715 .787 .117 .723 .000 .000 .000 .000 .000 .000
y.12
N 100 100 100 100 100 100 100 100 100 100 100 100 100
Pearson Correlation .335** .363** .534** .557** .415** .360** .581** .422** .565** .526** .630** .575** 1
Sig. (2-tailed) .001 .000 .000 .000 .000 .000 .000 .000 .000 .000 .000 .000
skor.total.y
N 100 100 100 100 100 100 100 100 100 100 100 100 100
*. Correlation is significant at the 0.05 level (2-tailed).
**. Correlation is significant at the 0.01 level (2-tailed).
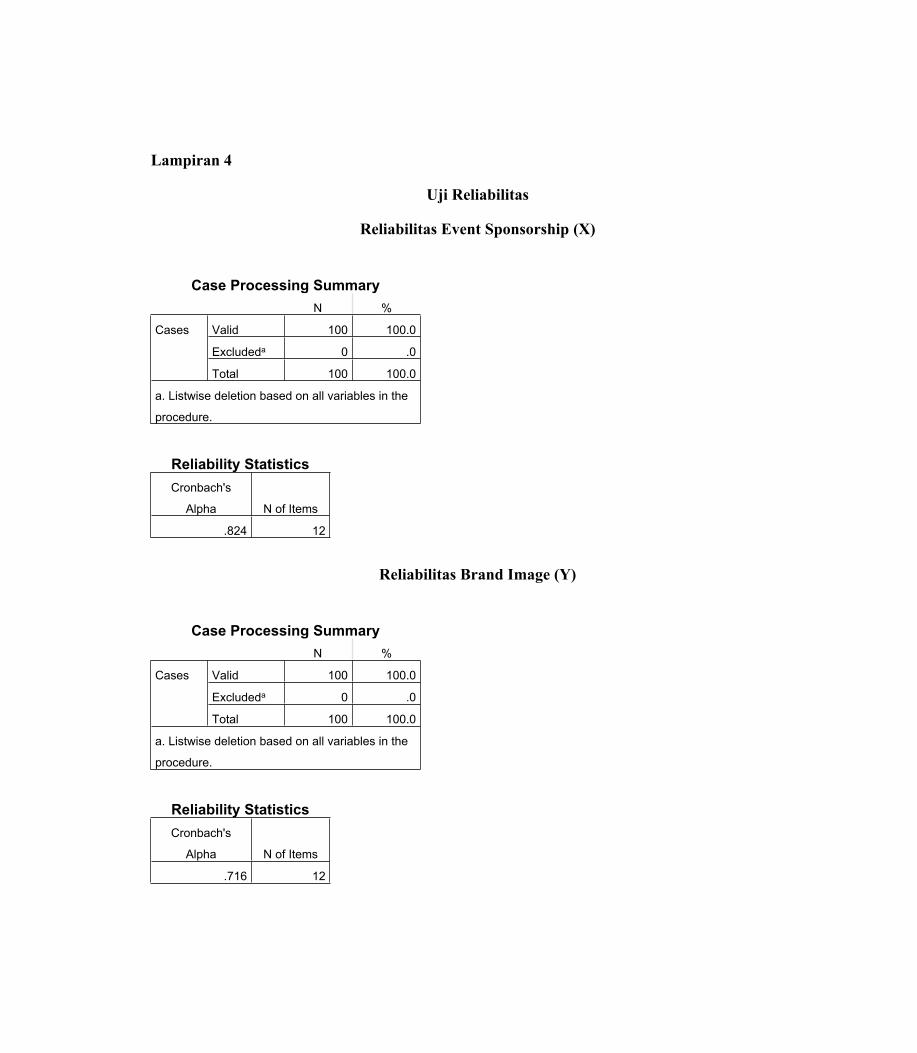
Lampiran 4
Uji Reliabilitas
Reliabilitas Event Sponsorship (X)
Case Processing SummaryN %
Valid 100 100.0
Excludeda 0 .0
Cases
Total 100 100.0
a. Listwise deletion based on all variables in the
procedure.
Reliability StatisticsCronbach's
Alpha N of Items
.824 12
Reliabilitas Brand Image (Y)
Case Processing SummaryN %
Valid 100 100.0
Excludeda 0 .0
Cases
Total 100 100.0
a. Listwise deletion based on all variables in the
procedure.
Reliability StatisticsCronbach's
Alpha N of Items
.716 12
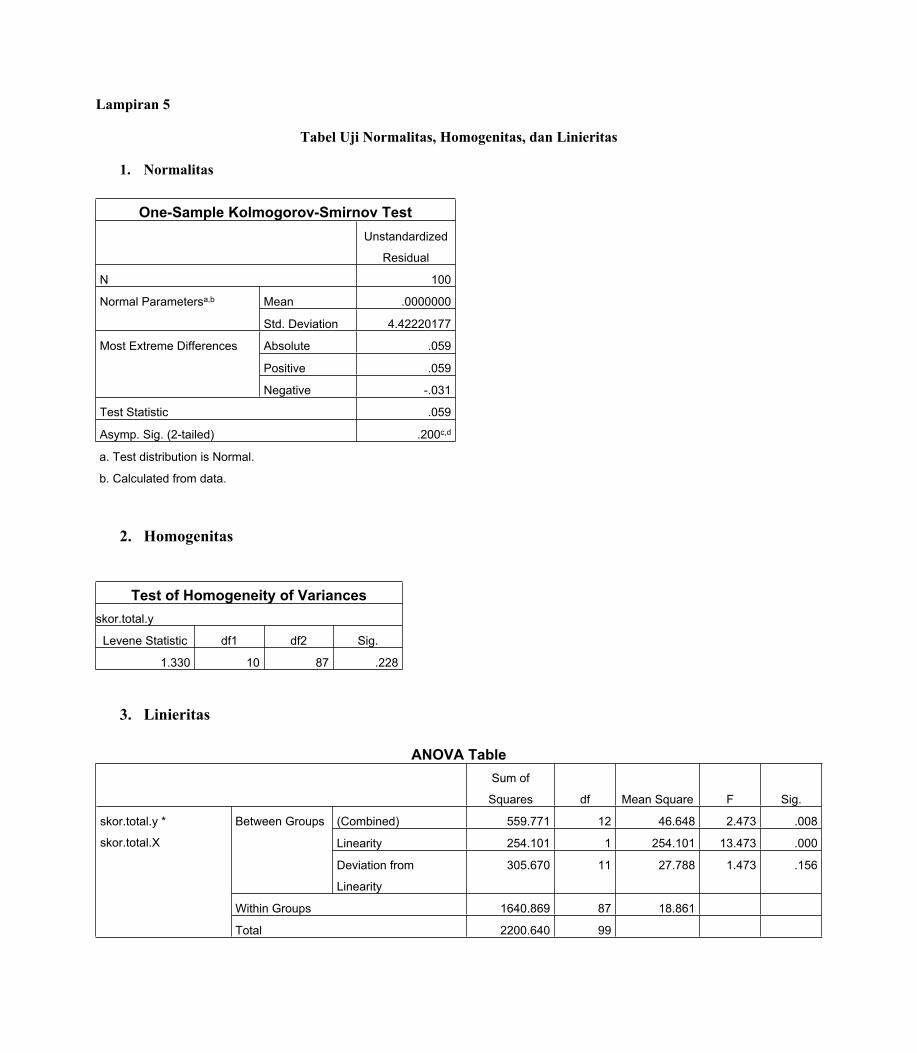
Lampiran 5
Tabel Uji Normalitas, Homogenitas, dan Linieritas
1. Normalitas
One-Sample Kolmogorov-Smirnov TestUnstandardized
Residual
N 100
Mean .0000000Normal Parametersa,b
Std. Deviation 4.42220177
Absolute .059
Positive .059
Most Extreme Differences
Negative -.031
Test Statistic .059
Asymp. Sig. (2-tailed) .200c,d
a. Test distribution is Normal.
b. Calculated from data.
2. Homogenitas
Test of Homogeneity of Variancesskor.total.y
Levene Statistic df1 df2 Sig.
1.330 10 87 .228
3. Linieritas
ANOVA TableSum of
Squares df Mean Square F Sig.
(Combined) 559.771 12 46.648 2.473 .008
Linearity 254.101 1 254.101 13.473 .000
Between Groups
Deviation from
Linearity
305.670 11 27.788 1.473 .156
Within Groups 1640.869 87 18.861
skor.total.y *
skor.total.X
Total 2200.640 99
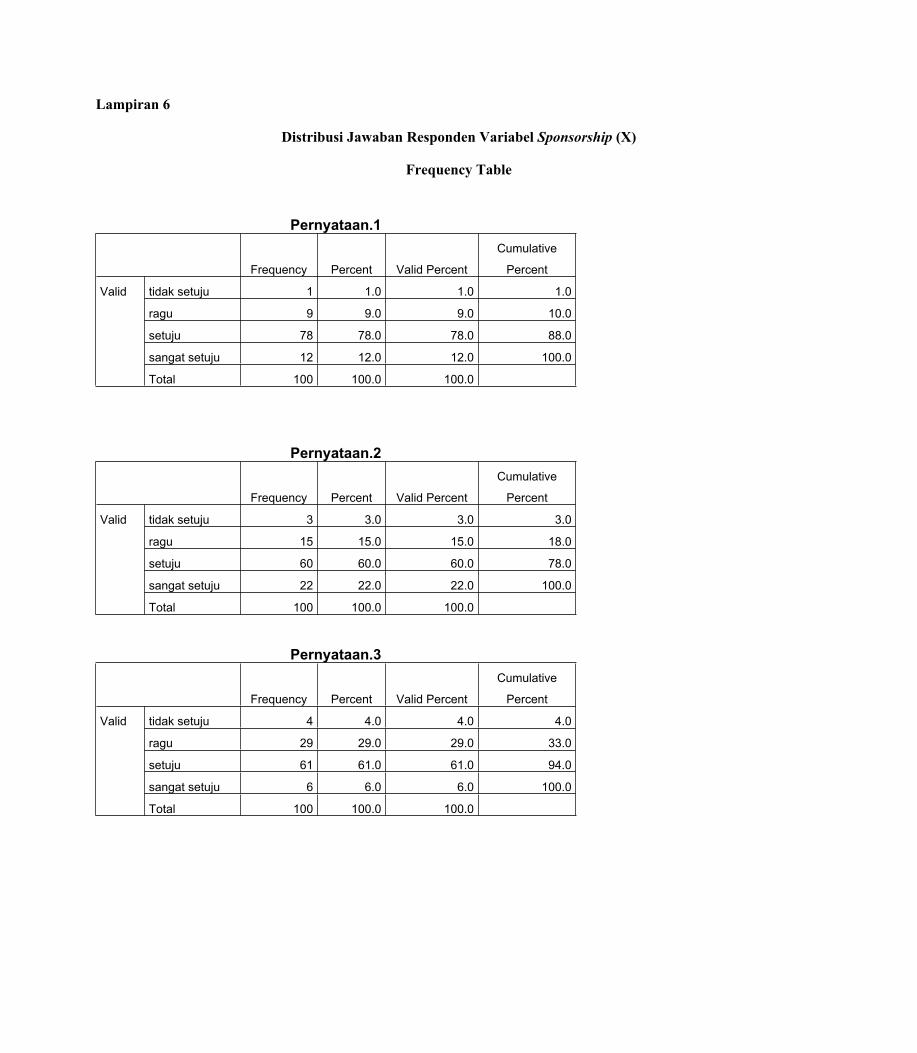
Lampiran 6
Distribusi Jawaban Responden Variabel Sponsorship (X)
Frequency Table
Pernyataan.1
Frequency Percent Valid Percent
Cumulative
Percent
tidak setuju 1 1.0 1.0 1.0
ragu 9 9.0 9.0 10.0
setuju 78 78.0 78.0 88.0
sangat setuju 12 12.0 12.0 100.0
Valid
Total 100 100.0 100.0
Pernyataan.2
Frequency Percent Valid Percent
Cumulative
Percent
tidak setuju 3 3.0 3.0 3.0
ragu 15 15.0 15.0 18.0
setuju 60 60.0 60.0 78.0
sangat setuju 22 22.0 22.0 100.0
Valid
Total 100 100.0 100.0
Pernyataan.3
Frequency Percent Valid Percent
Cumulative
Percent
tidak setuju 4 4.0 4.0 4.0
ragu 29 29.0 29.0 33.0
setuju 61 61.0 61.0 94.0
sangat setuju 6 6.0 6.0 100.0
Valid
Total 100 100.0 100.0
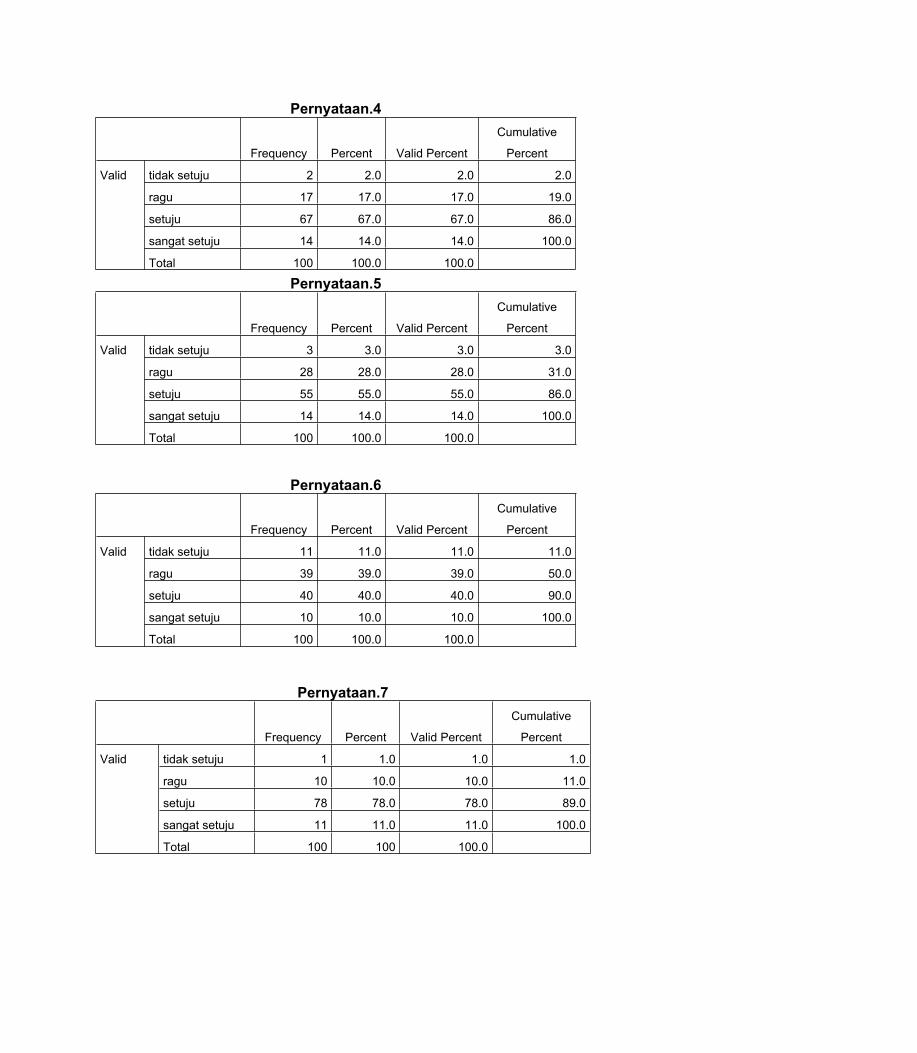
Pernyataan.4
Frequency Percent Valid Percent
Cumulative
Percent
tidak setuju 2 2.0 2.0 2.0
ragu 17 17.0 17.0 19.0
setuju 67 67.0 67.0 86.0
sangat setuju 14 14.0 14.0 100.0
Valid
Total 100 100.0 100.0
Pernyataan.5
Frequency Percent Valid Percent
Cumulative
Percent
tidak setuju 3 3.0 3.0 3.0
ragu 28 28.0 28.0 31.0
setuju 55 55.0 55.0 86.0
sangat setuju 14 14.0 14.0 100.0
Valid
Total 100 100.0 100.0
Pernyataan.6
Frequency Percent Valid Percent
Cumulative
Percent
tidak setuju 11 11.0 11.0 11.0
ragu 39 39.0 39.0 50.0
setuju 40 40.0 40.0 90.0
sangat setuju 10 10.0 10.0 100.0
Valid
Total 100 100.0 100.0
Pernyataan.7
Frequency Percent Valid Percent
Cumulative
Percent
tidak setuju 1 1.0 1.0 1.0
ragu 10 10.0 10.0 11.0
setuju 78 78.0 78.0 89.0
sangat setuju 11 11.0 11.0 100.0
Valid
Total 100 100 100.0
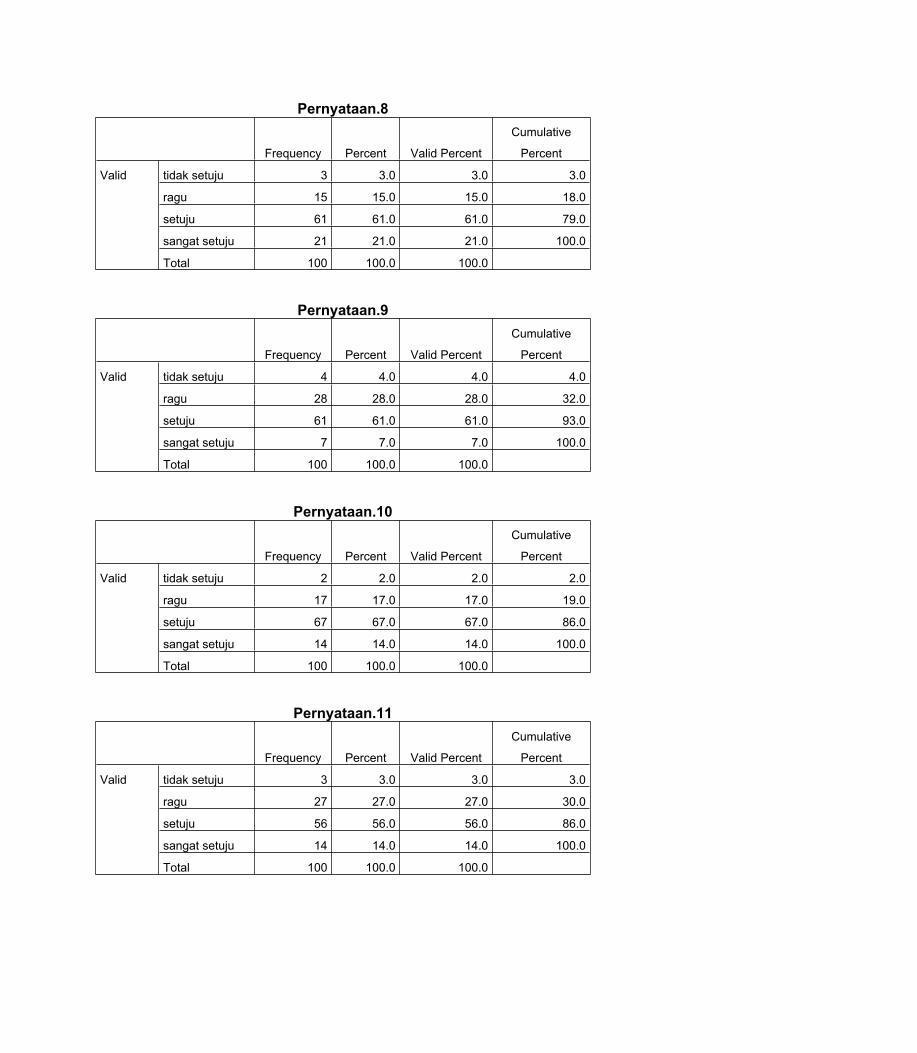
Pernyataan.8
Frequency Percent Valid Percent
Cumulative
Percent
tidak setuju 3 3.0 3.0 3.0
ragu 15 15.0 15.0 18.0
setuju 61 61.0 61.0 79.0
sangat setuju 21 21.0 21.0 100.0
Valid
Total 100 100.0 100.0
Pernyataan.9
Frequency Percent Valid Percent
Cumulative
Percent
tidak setuju 4 4.0 4.0 4.0
ragu 28 28.0 28.0 32.0
setuju 61 61.0 61.0 93.0
sangat setuju 7 7.0 7.0 100.0
Valid
Total 100 100.0 100.0
Pernyataan.10
Frequency Percent Valid Percent
Cumulative
Percent
tidak setuju 2 2.0 2.0 2.0
ragu 17 17.0 17.0 19.0
setuju 67 67.0 67.0 86.0
sangat setuju 14 14.0 14.0 100.0
Valid
Total 100 100.0 100.0
Pernyataan.11
Frequency Percent Valid Percent
Cumulative
Percent
tidak setuju 3 3.0 3.0 3.0
ragu 27 27.0 27.0 30.0
setuju 56 56.0 56.0 86.0
sangat setuju 14 14.0 14.0 100.0
Valid
Total 100 100.0 100.0
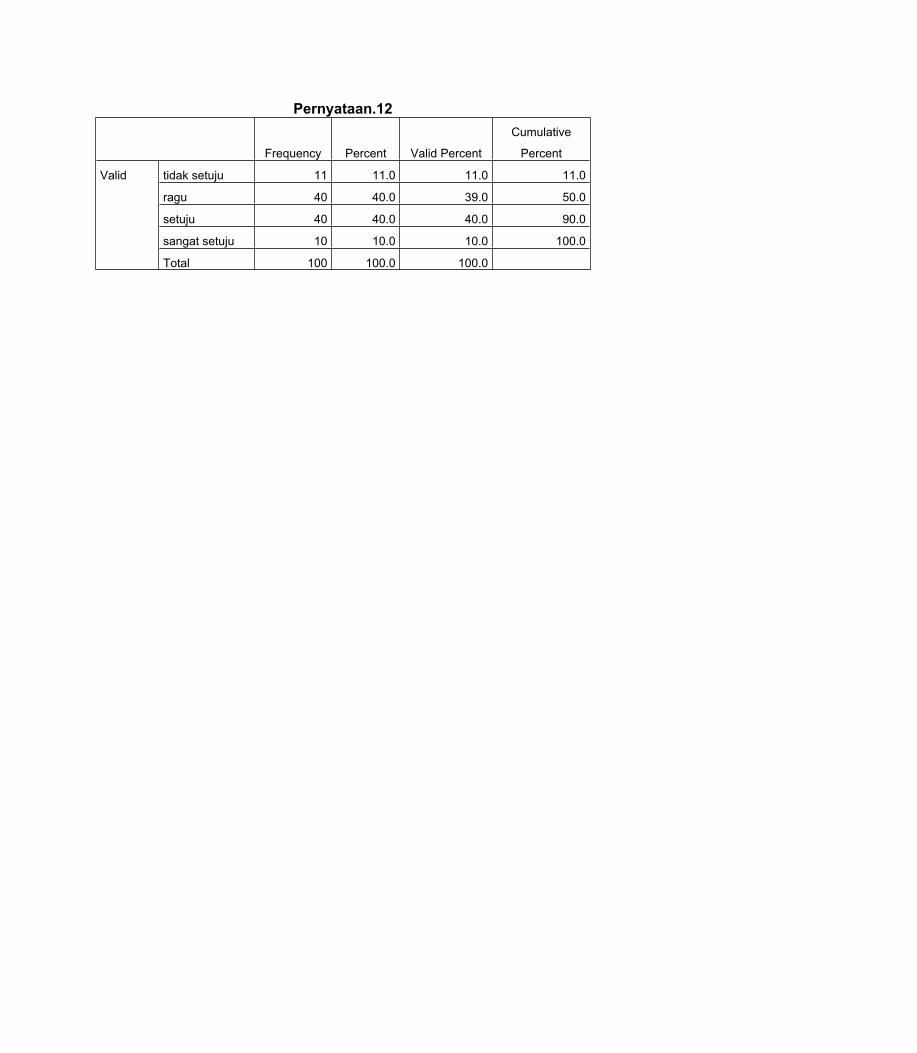
Pernyataan.12
Frequency Percent Valid Percent
Cumulative
Percent
tidak setuju 11 11.0 11.0 11.0
ragu 40 40.0 39.0 50.0
setuju 40 40.0 40.0 90.0
sangat setuju 10 10.0 10.0 100.0
Valid
Total 100 100.0 100.0
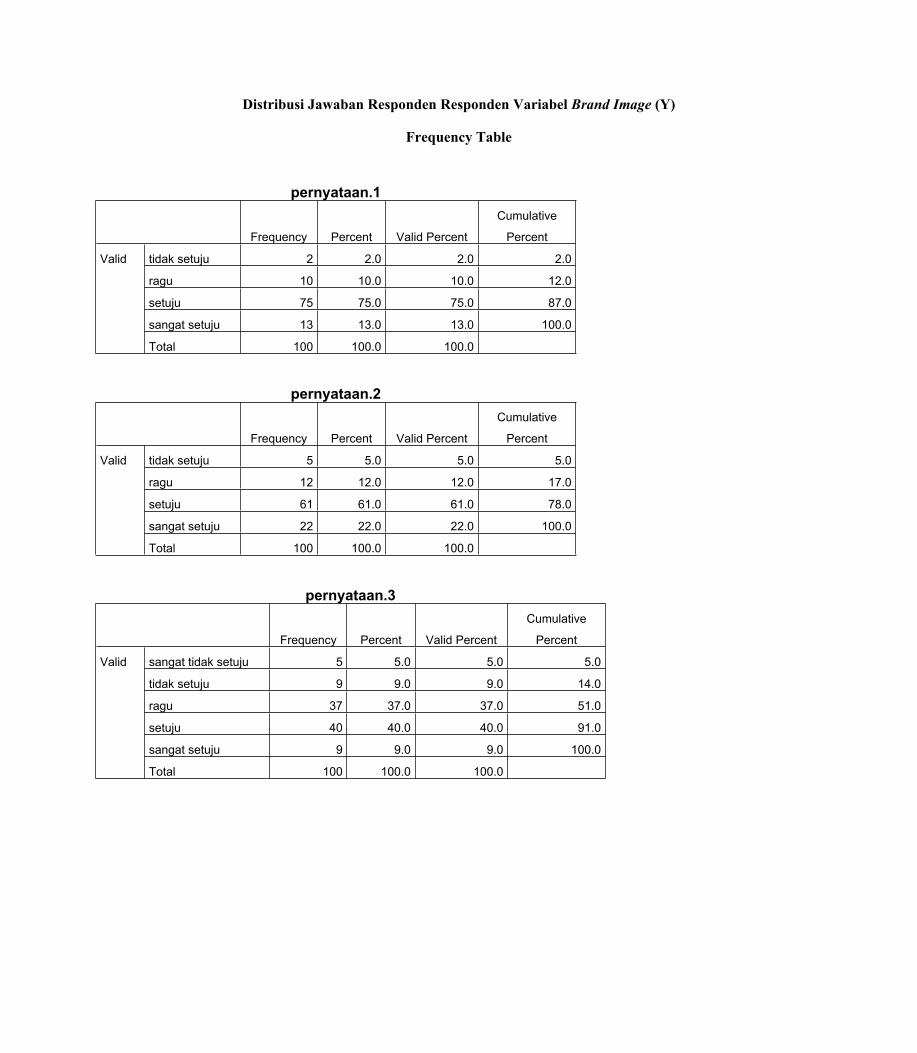
Distribusi Jawaban Responden Responden Variabel Brand Image (Y)
Frequency Table
pernyataan.1
Frequency Percent Valid Percent
Cumulative
Percent
tidak setuju 2 2.0 2.0 2.0
ragu 10 10.0 10.0 12.0
setuju 75 75.0 75.0 87.0
sangat setuju 13 13.0 13.0 100.0
Valid
Total 100 100.0 100.0
pernyataan.2
Frequency Percent Valid Percent
Cumulative
Percent
tidak setuju 5 5.0 5.0 5.0
ragu 12 12.0 12.0 17.0
setuju 61 61.0 61.0 78.0
sangat setuju 22 22.0 22.0 100.0
Valid
Total 100 100.0 100.0
pernyataan.3
Frequency Percent Valid Percent
Cumulative
Percent
sangat tidak setuju 5 5.0 5.0 5.0
tidak setuju 9 9.0 9.0 14.0
ragu 37 37.0 37.0 51.0
setuju 40 40.0 40.0 91.0
sangat setuju 9 9.0 9.0 100.0
Valid
Total 100 100.0 100.0
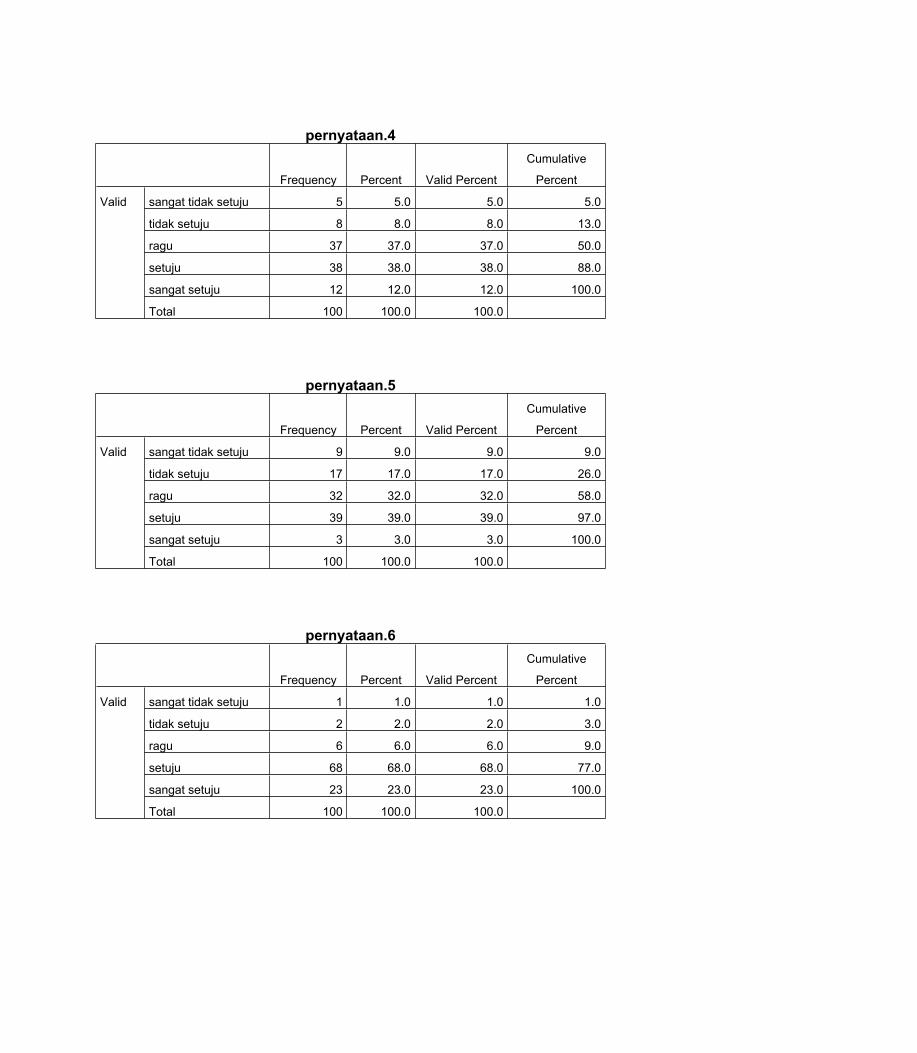
pernyataan.4
Frequency Percent Valid Percent
Cumulative
Percent
sangat tidak setuju 5 5.0 5.0 5.0
tidak setuju 8 8.0 8.0 13.0
ragu 37 37.0 37.0 50.0
setuju 38 38.0 38.0 88.0
sangat setuju 12 12.0 12.0 100.0
Valid
Total 100 100.0 100.0
pernyataan.5
Frequency Percent Valid Percent
Cumulative
Percent
sangat tidak setuju 9 9.0 9.0 9.0
tidak setuju 17 17.0 17.0 26.0
ragu 32 32.0 32.0 58.0
setuju 39 39.0 39.0 97.0
sangat setuju 3 3.0 3.0 100.0
Valid
Total 100 100.0 100.0
pernyataan.6
Frequency Percent Valid Percent
Cumulative
Percent
sangat tidak setuju 1 1.0 1.0 1.0
tidak setuju 2 2.0 2.0 3.0
ragu 6 6.0 6.0 9.0
setuju 68 68.0 68.0 77.0
sangat setuju 23 23.0 23.0 100.0
Valid
Total 100 100.0 100.0
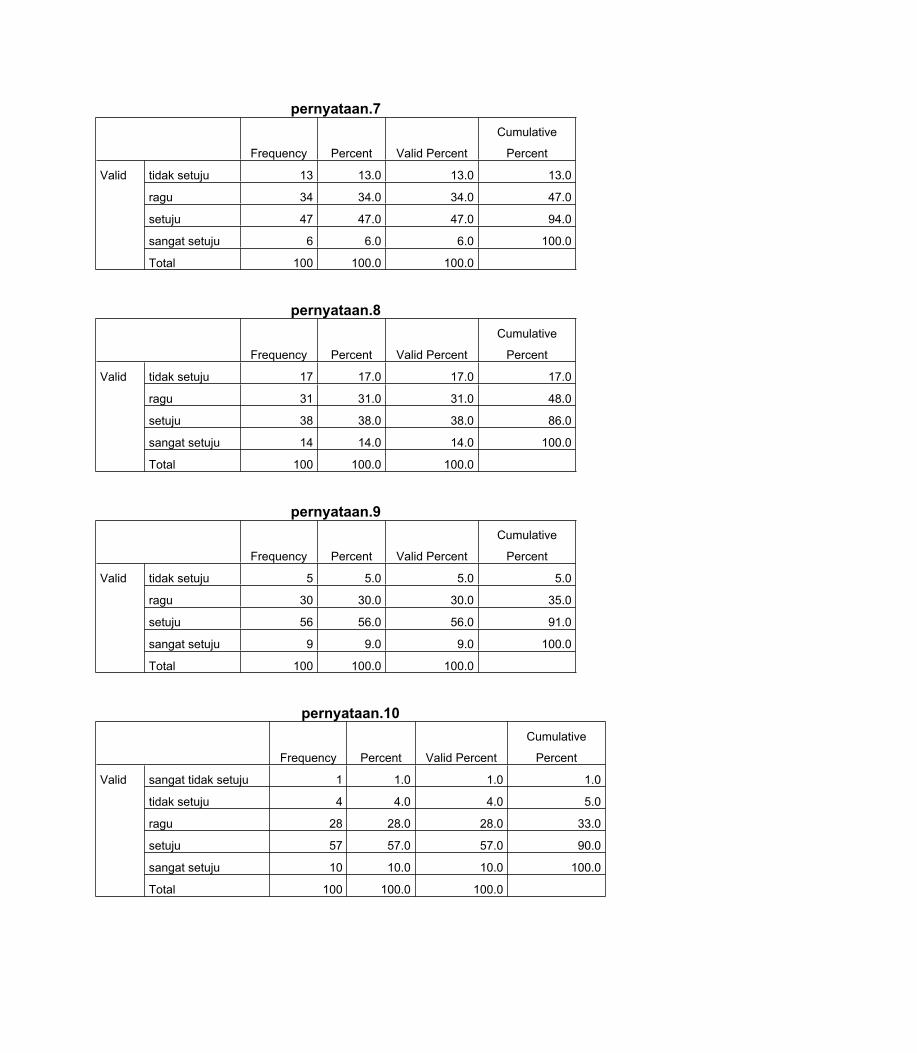
pernyataan.7
Frequency Percent Valid Percent
Cumulative
Percent
tidak setuju 13 13.0 13.0 13.0
ragu 34 34.0 34.0 47.0
setuju 47 47.0 47.0 94.0
sangat setuju 6 6.0 6.0 100.0
Valid
Total 100 100.0 100.0
pernyataan.8
Frequency Percent Valid Percent
Cumulative
Percent
tidak setuju 17 17.0 17.0 17.0
ragu 31 31.0 31.0 48.0
setuju 38 38.0 38.0 86.0
sangat setuju 14 14.0 14.0 100.0
Valid
Total 100 100.0 100.0
pernyataan.9
Frequency Percent Valid Percent
Cumulative
Percent
tidak setuju 5 5.0 5.0 5.0
ragu 30 30.0 30.0 35.0
setuju 56 56.0 56.0 91.0
sangat setuju 9 9.0 9.0 100.0
Valid
Total 100 100.0 100.0
pernyataan.10
Frequency Percent Valid Percent
Cumulative
Percent
sangat tidak setuju 1 1.0 1.0 1.0
tidak setuju 4 4.0 4.0 5.0
ragu 28 28.0 28.0 33.0
setuju 57 57.0 57.0 90.0
sangat setuju 10 10.0 10.0 100.0
Valid
Total 100 100.0 100.0
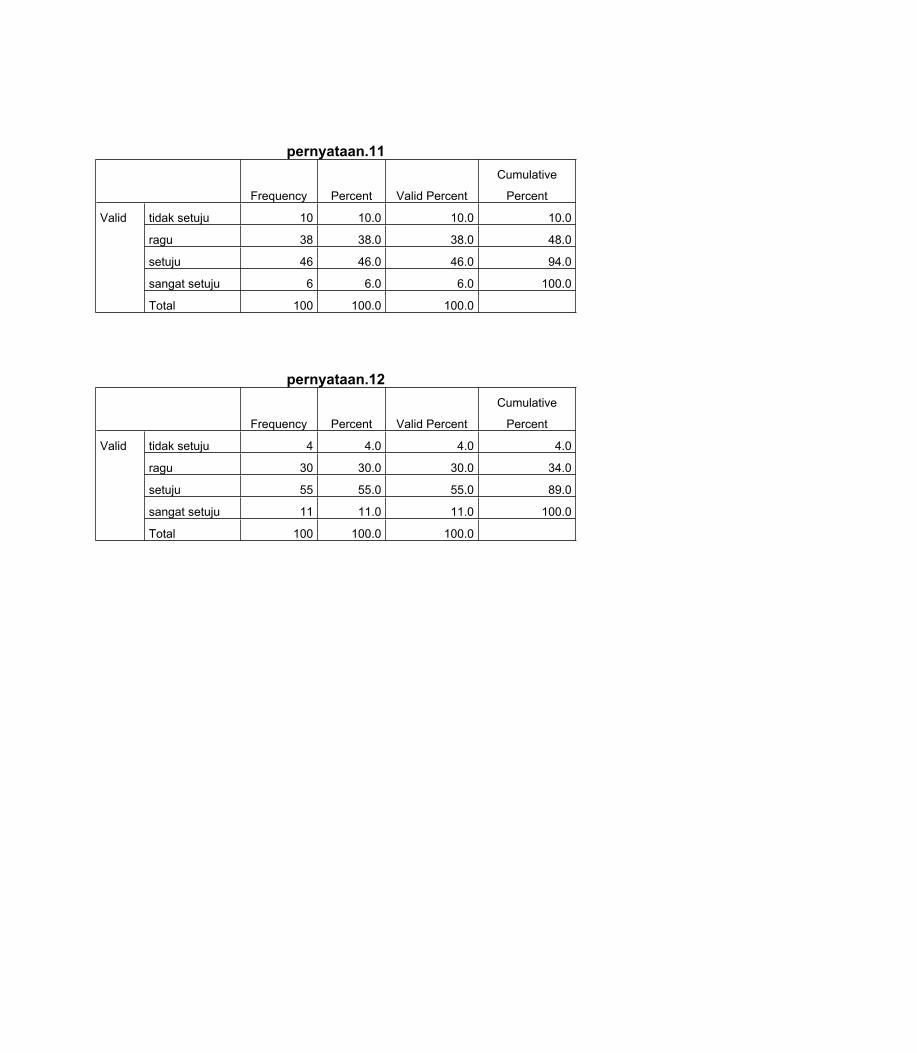
pernyataan.11
Frequency Percent Valid Percent
Cumulative
Percent
tidak setuju 10 10.0 10.0 10.0
ragu 38 38.0 38.0 48.0
setuju 46 46.0 46.0 94.0
sangat setuju 6 6.0 6.0 100.0
Valid
Total 100 100.0 100.0
pernyataan.12
Frequency Percent Valid Percent
Cumulative
Percent
tidak setuju 4 4.0 4.0 4.0
ragu 30 30.0 30.0 34.0
setuju 55 55.0 55.0 89.0
sangat setuju 11 11.0 11.0 100.0
Valid
Total 100 100.0 100.0
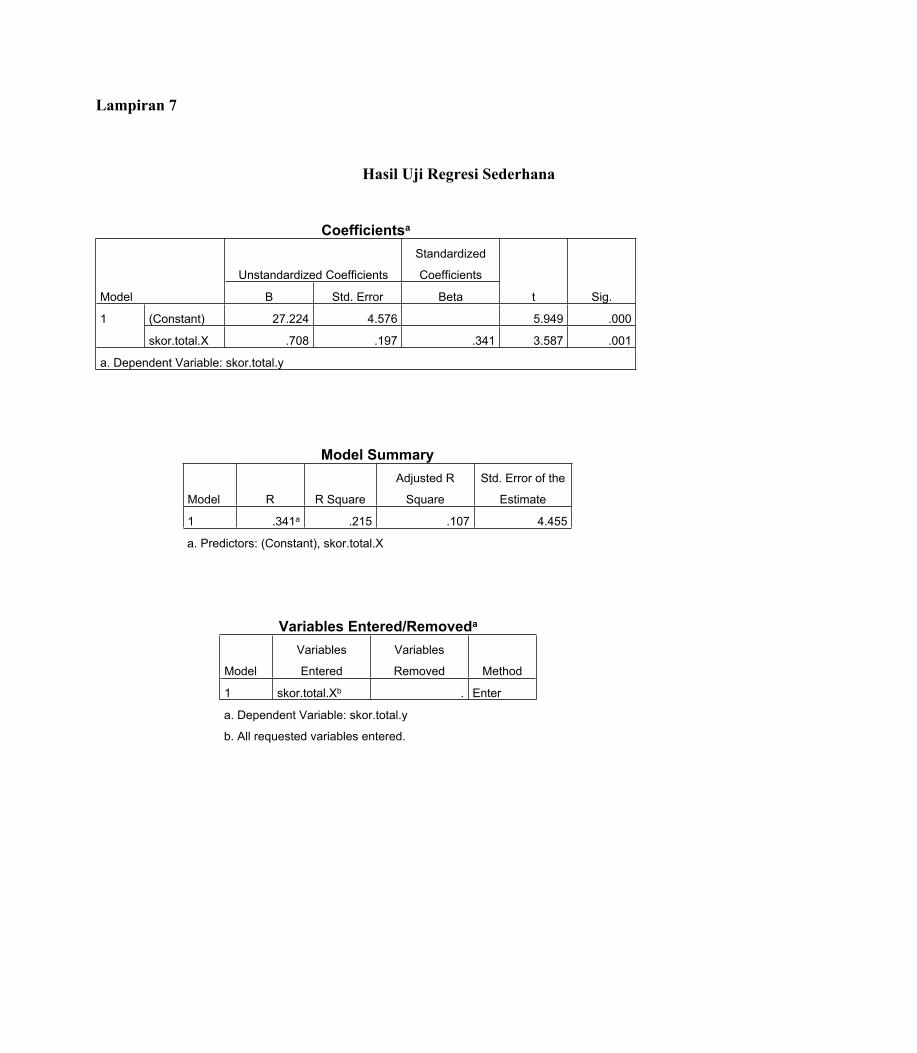
Lampiran 7
Hasil Uji Regresi Sederhana
Coefficientsa
Unstandardized Coefficients
Standardized
Coefficients
Model B Std. Error Beta t Sig.
(Constant) 27.224 4.576 5.949 .0001
skor.total.X .708 .197 .341 3.587 .001
a. Dependent Variable: skor.total.y
Model Summary
Model R R Square
Adjusted R
Square
Std. Error of the
Estimate
1 .341a .215 .107 4.455
a. Predictors: (Constant), skor.total.X
Variables Entered/Removeda
Model
Variables
Entered
Variables
Removed Method
1 skor.total.Xb . Enter
a. Dependent Variable: skor.total.y
b. All requested variables entered.
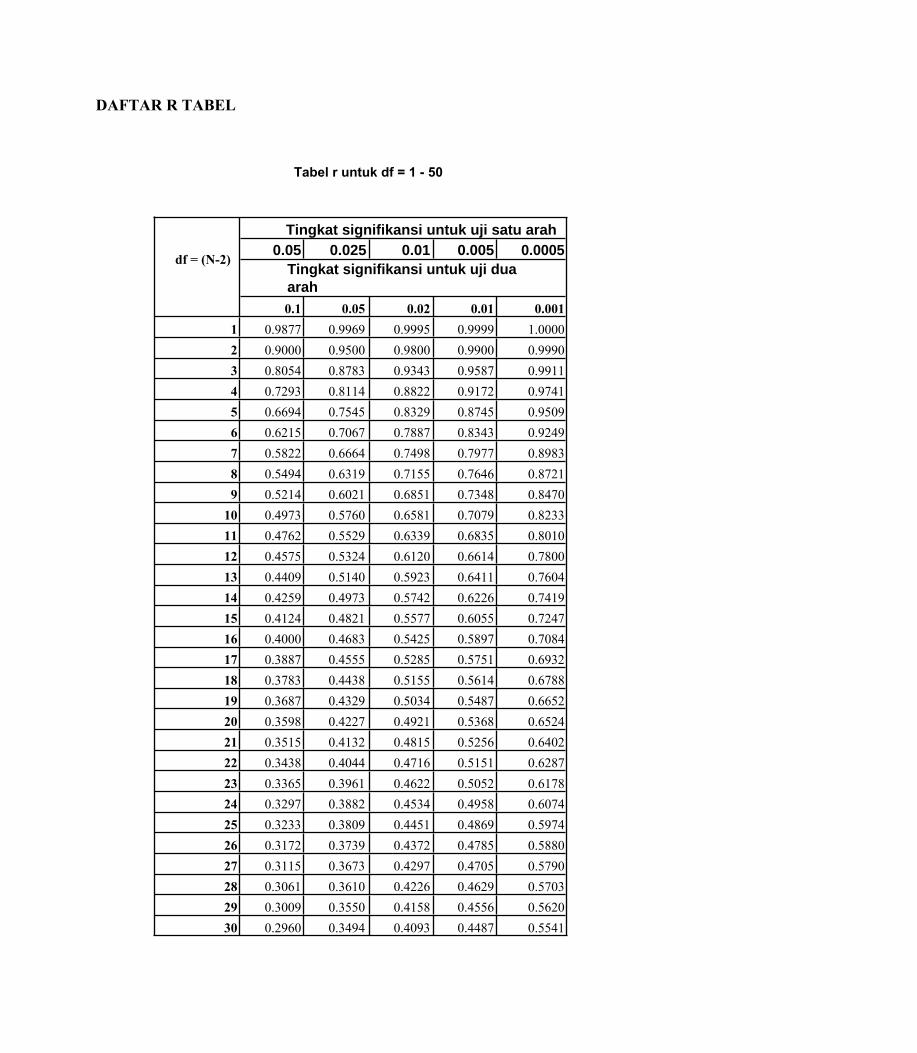
DAFTAR R TABEL
Tabel r untuk df = 1 - 50
Tingkat signifikansi untuk uji satu arah0.05 0.025 0.01 0.005 0.0005df = (N-2)
Tingkat signifikansi untuk uji dua arah0.1 0.05 0.02 0.01 0.001
1 0.9877 0.9969 0.9995 0.9999 1.00002 0.9000 0.9500 0.9800 0.9900 0.99903 0.8054 0.8783 0.9343 0.9587 0.99114 0.7293 0.8114 0.8822 0.9172 0.97415 0.6694 0.7545 0.8329 0.8745 0.95096 0.6215 0.7067 0.7887 0.8343 0.92497 0.5822 0.6664 0.7498 0.7977 0.89838 0.5494 0.6319 0.7155 0.7646 0.87219 0.5214 0.6021 0.6851 0.7348 0.8470
10 0.4973 0.5760 0.6581 0.7079 0.823311 0.4762 0.5529 0.6339 0.6835 0.801012 0.4575 0.5324 0.6120 0.6614 0.780013 0.4409 0.5140 0.5923 0.6411 0.760414 0.4259 0.4973 0.5742 0.6226 0.741915 0.4124 0.4821 0.5577 0.6055 0.724716 0.4000 0.4683 0.5425 0.5897 0.708417 0.3887 0.4555 0.5285 0.5751 0.693218 0.3783 0.4438 0.5155 0.5614 0.678819 0.3687 0.4329 0.5034 0.5487 0.665220 0.3598 0.4227 0.4921 0.5368 0.652421 0.3515 0.4132 0.4815 0.5256 0.640222 0.3438 0.4044 0.4716 0.5151 0.628723 0.3365 0.3961 0.4622 0.5052 0.617824 0.3297 0.3882 0.4534 0.4958 0.607425 0.3233 0.3809 0.4451 0.4869 0.597426 0.3172 0.3739 0.4372 0.4785 0.588027 0.3115 0.3673 0.4297 0.4705 0.579028 0.3061 0.3610 0.4226 0.4629 0.570329 0.3009 0.3550 0.4158 0.4556 0.562030 0.2960 0.3494 0.4093 0.4487 0.5541
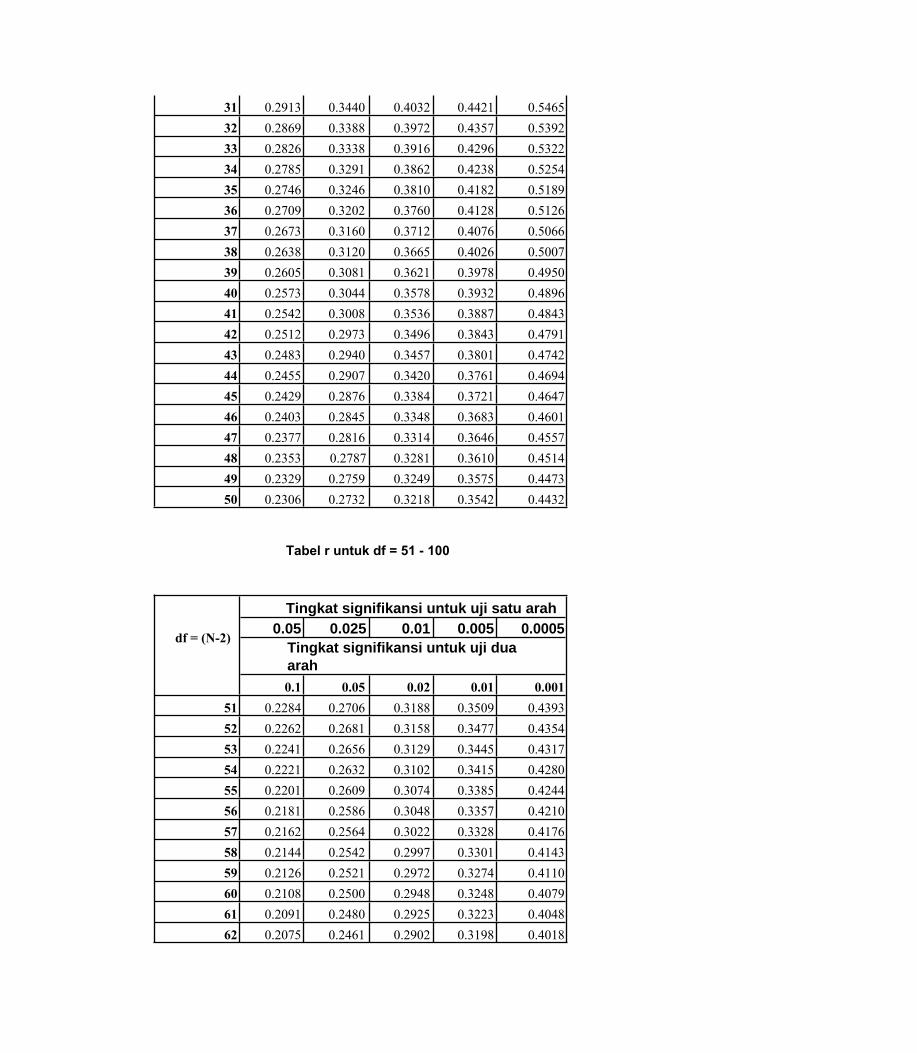
31 0.2913 0.3440 0.4032 0.4421 0.546532 0.2869 0.3388 0.3972 0.4357 0.539233 0.2826 0.3338 0.3916 0.4296 0.532234 0.2785 0.3291 0.3862 0.4238 0.525435 0.2746 0.3246 0.3810 0.4182 0.518936 0.2709 0.3202 0.3760 0.4128 0.512637 0.2673 0.3160 0.3712 0.4076 0.506638 0.2638 0.3120 0.3665 0.4026 0.500739 0.2605 0.3081 0.3621 0.3978 0.495040 0.2573 0.3044 0.3578 0.3932 0.489641 0.2542 0.3008 0.3536 0.3887 0.484342 0.2512 0.2973 0.3496 0.3843 0.479143 0.2483 0.2940 0.3457 0.3801 0.474244 0.2455 0.2907 0.3420 0.3761 0.469445 0.2429 0.2876 0.3384 0.3721 0.464746 0.2403 0.2845 0.3348 0.3683 0.460147 0.2377 0.2816 0.3314 0.3646 0.455748 0.2353 0.2787 0.3281 0.3610 0.451449 0.2329 0.2759 0.3249 0.3575 0.447350 0.2306 0.2732 0.3218 0.3542 0.4432
Tabel r untuk df = 51 - 100
Tingkat signifikansi untuk uji satu arah0.05 0.025 0.01 0.005 0.0005df = (N-2)
Tingkat signifikansi untuk uji dua arah0.1 0.05 0.02 0.01 0.001
51 0.2284 0.2706 0.3188 0.3509 0.439352 0.2262 0.2681 0.3158 0.3477 0.435453 0.2241 0.2656 0.3129 0.3445 0.431754 0.2221 0.2632 0.3102 0.3415 0.428055 0.2201 0.2609 0.3074 0.3385 0.424456 0.2181 0.2586 0.3048 0.3357 0.421057 0.2162 0.2564 0.3022 0.3328 0.417658 0.2144 0.2542 0.2997 0.3301 0.414359 0.2126 0.2521 0.2972 0.3274 0.411060 0.2108 0.2500 0.2948 0.3248 0.407961 0.2091 0.2480 0.2925 0.3223 0.404862 0.2075 0.2461 0.2902 0.3198 0.4018
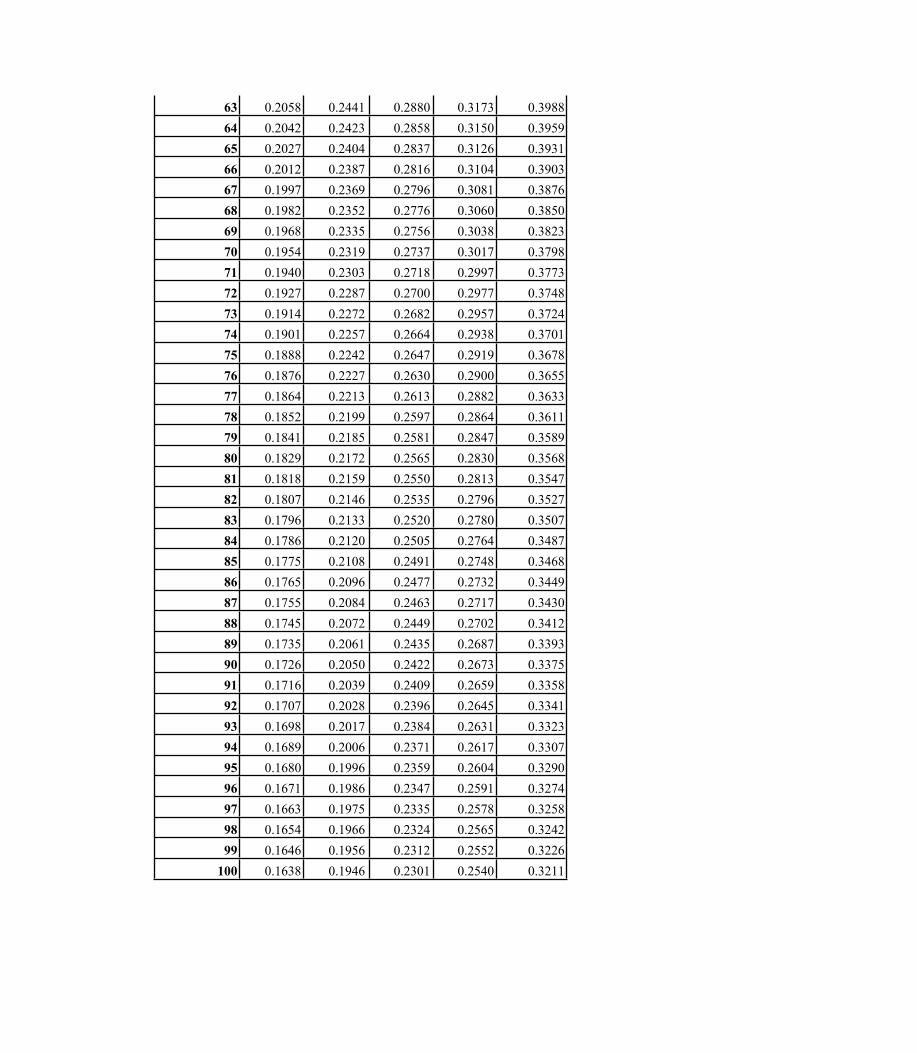
63 0.2058 0.2441 0.2880 0.3173 0.398864 0.2042 0.2423 0.2858 0.3150 0.395965 0.2027 0.2404 0.2837 0.3126 0.393166 0.2012 0.2387 0.2816 0.3104 0.390367 0.1997 0.2369 0.2796 0.3081 0.387668 0.1982 0.2352 0.2776 0.3060 0.385069 0.1968 0.2335 0.2756 0.3038 0.382370 0.1954 0.2319 0.2737 0.3017 0.379871 0.1940 0.2303 0.2718 0.2997 0.377372 0.1927 0.2287 0.2700 0.2977 0.374873 0.1914 0.2272 0.2682 0.2957 0.372474 0.1901 0.2257 0.2664 0.2938 0.370175 0.1888 0.2242 0.2647 0.2919 0.367876 0.1876 0.2227 0.2630 0.2900 0.365577 0.1864 0.2213 0.2613 0.2882 0.363378 0.1852 0.2199 0.2597 0.2864 0.361179 0.1841 0.2185 0.2581 0.2847 0.358980 0.1829 0.2172 0.2565 0.2830 0.356881 0.1818 0.2159 0.2550 0.2813 0.354782 0.1807 0.2146 0.2535 0.2796 0.352783 0.1796 0.2133 0.2520 0.2780 0.350784 0.1786 0.2120 0.2505 0.2764 0.348785 0.1775 0.2108 0.2491 0.2748 0.346886 0.1765 0.2096 0.2477 0.2732 0.344987 0.1755 0.2084 0.2463 0.2717 0.343088 0.1745 0.2072 0.2449 0.2702 0.341289 0.1735 0.2061 0.2435 0.2687 0.339390 0.1726 0.2050 0.2422 0.2673 0.337591 0.1716 0.2039 0.2409 0.2659 0.335892 0.1707 0.2028 0.2396 0.2645 0.334193 0.1698 0.2017 0.2384 0.2631 0.332394 0.1689 0.2006 0.2371 0.2617 0.330795 0.1680 0.1996 0.2359 0.2604 0.329096 0.1671 0.1986 0.2347 0.2591 0.327497 0.1663 0.1975 0.2335 0.2578 0.325898 0.1654 0.1966 0.2324 0.2565 0.324299 0.1646 0.1956 0.2312 0.2552 0.3226
100 0.1638 0.1946 0.2301 0.2540 0.3211
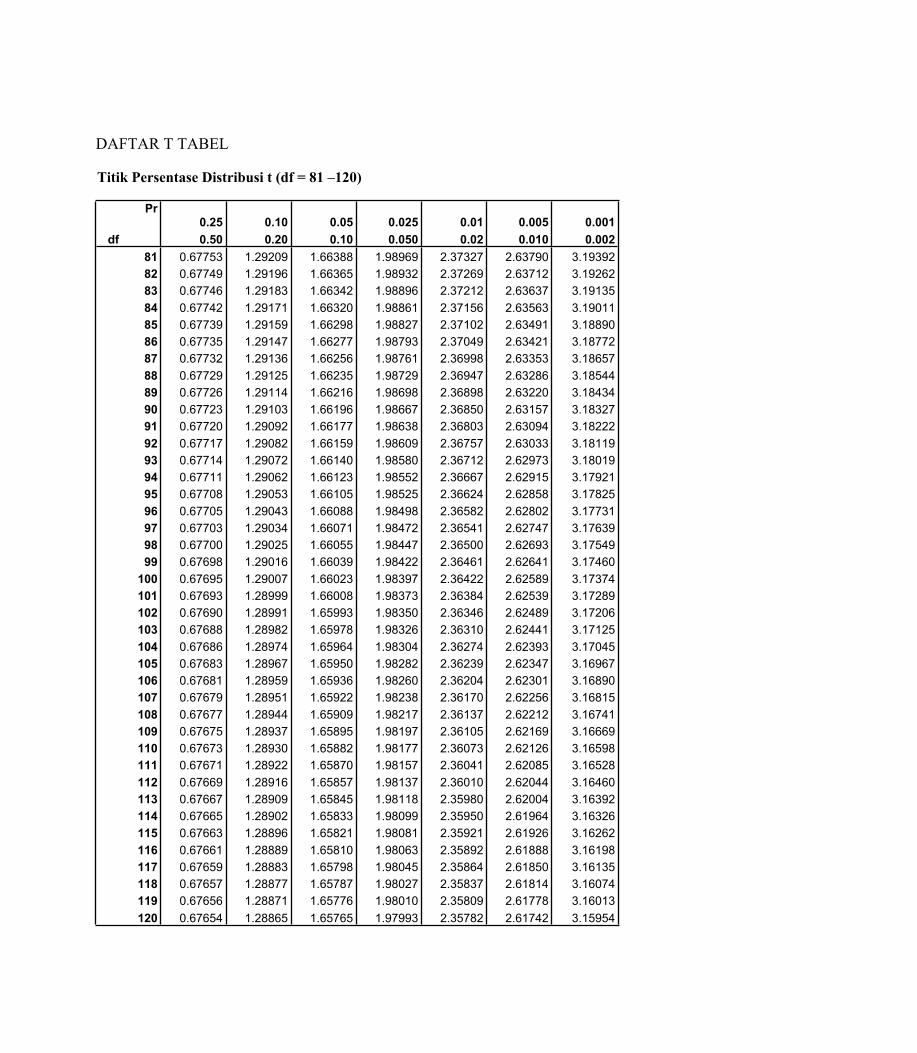
DAFTAR T TABEL
Titik Persentase Distribusi t (df = 81 –120)
Pr0.25 0.10 0.05 0.025 0.01 0.005 0.001
df 0.50 0.20 0.10 0.050 0.02 0.010 0.00281 0.67753 1.29209 1.66388 1.98969 2.37327 2.63790 3.1939282 0.67749 1.29196 1.66365 1.98932 2.37269 2.63712 3.1926283 0.67746 1.29183 1.66342 1.98896 2.37212 2.63637 3.1913584 0.67742 1.29171 1.66320 1.98861 2.37156 2.63563 3.1901185 0.67739 1.29159 1.66298 1.98827 2.37102 2.63491 3.1889086 0.67735 1.29147 1.66277 1.98793 2.37049 2.63421 3.1877287 0.67732 1.29136 1.66256 1.98761 2.36998 2.63353 3.1865788 0.67729 1.29125 1.66235 1.98729 2.36947 2.63286 3.1854489 0.67726 1.29114 1.66216 1.98698 2.36898 2.63220 3.1843490 0.67723 1.29103 1.66196 1.98667 2.36850 2.63157 3.1832791 0.67720 1.29092 1.66177 1.98638 2.36803 2.63094 3.1822292 0.67717 1.29082 1.66159 1.98609 2.36757 2.63033 3.1811993 0.67714 1.29072 1.66140 1.98580 2.36712 2.62973 3.1801994 0.67711 1.29062 1.66123 1.98552 2.36667 2.62915 3.1792195 0.67708 1.29053 1.66105 1.98525 2.36624 2.62858 3.1782596 0.67705 1.29043 1.66088 1.98498 2.36582 2.62802 3.1773197 0.67703 1.29034 1.66071 1.98472 2.36541 2.62747 3.1763998 0.67700 1.29025 1.66055 1.98447 2.36500 2.62693 3.1754999 0.67698 1.29016 1.66039 1.98422 2.36461 2.62641 3.17460
100 0.67695 1.29007 1.66023 1.98397 2.36422 2.62589 3.17374101 0.67693 1.28999 1.66008 1.98373 2.36384 2.62539 3.17289102 0.67690 1.28991 1.65993 1.98350 2.36346 2.62489 3.17206103 0.67688 1.28982 1.65978 1.98326 2.36310 2.62441 3.17125104 0.67686 1.28974 1.65964 1.98304 2.36274 2.62393 3.17045105 0.67683 1.28967 1.65950 1.98282 2.36239 2.62347 3.16967106 0.67681 1.28959 1.65936 1.98260 2.36204 2.62301 3.16890107 0.67679 1.28951 1.65922 1.98238 2.36170 2.62256 3.16815108 0.67677 1.28944 1.65909 1.98217 2.36137 2.62212 3.16741109 0.67675 1.28937 1.65895 1.98197 2.36105 2.62169 3.16669110 0.67673 1.28930 1.65882 1.98177 2.36073 2.62126 3.16598111 0.67671 1.28922 1.65870 1.98157 2.36041 2.62085 3.16528112 0.67669 1.28916 1.65857 1.98137 2.36010 2.62044 3.16460113 0.67667 1.28909 1.65845 1.98118 2.35980 2.62004 3.16392114 0.67665 1.28902 1.65833 1.98099 2.35950 2.61964 3.16326115 0.67663 1.28896 1.65821 1.98081 2.35921 2.61926 3.16262116 0.67661 1.28889 1.65810 1.98063 2.35892 2.61888 3.16198117 0.67659 1.28883 1.65798 1.98045 2.35864 2.61850 3.16135118 0.67657 1.28877 1.65787 1.98027 2.35837 2.61814 3.16074119 0.67656 1.28871 1.65776 1.98010 2.35809 2.61778 3.16013120 0.67654 1.28865 1.65765 1.97993 2.35782 2.61742 3.15954
