lampiran 1. hasil determinasi tanaman pareeprints.unwahas.ac.id/761/7/lampiran.pdf.pdf · lampiran...
TRANSCRIPT
42
Lampiran 1. Hasil Determinasi Tanaman Pare

43
Lanjutan Lampiran 1

44
Lanjutan Lampiran 1
45
Lampiran 2. Surat Keterangan Telah Selesai Melakukan Penelitian

46
Lanjutan Lampiran 2

47
Lampiran 3. Perhitungan Rendemen Ekstrak Etanol Daun Pare
Rumus :
Rendemen =
x 100%
Rendemen =
x 100%
Rendemen = 8,85%

48
Lampiran 4. Perhitungan BJ Sirup Ekstrak Etanol Daun Pare
Density of water 370c
Dari table handbook of chemistry and physics (Robert C. Weast, Ph.D., 1986).
Suhu BJ Air
350c 0,99406 g/ml
360c
370c 0,99335 g/ml
380c 0,99299 g/ml
Cara mencari BJ air suhu 370c
=
=
2( ) =( )
( ) =( )
( ̇ ) =( )
( ) = 3χ
= χ
0,99335 g/ml = χ

49
Mencari BJ sirup ekstrak etanol daun pare
Diketahui : bobot pikno kosong = 30,211g
bobot pikno + air = 40,147g
bobot sirup FI = 41,259g
bobot sirup FII = 41,375g
bobot sirup FIII = 41,401g
bobot sirup FIV = 41,435g
bobot sirup FV = 41,577g
bobot sirup kontrol (+)= 41,442g
bobot sirup kontrol (-)= 41,259g
Bj air suhu 370c = 0,99335 g/ml
Ditanya : Berapa Bj masing-masing sirup tersebut ??
Jawab :
BJ = ( )
( )
- Mencari bobot air = bobot piknometer + air = 40,147g
bobot piknometer kosong = 30,211g
bobot air = 9,936g
- Mencari volume piknometer = ( )
=
=10,00252 ml

50
BJ sirup FI = bobot piknometer + sirup = 41,259g
bobot piknometer kosong = 30,211g
bobot sirup = 11,048g
= ( )
( ) =
= 1,10452 g/ml
BJ sirup FII = bobot piknometer + sirup = 41,375g
bobot piknometer kosong = 30,211g
bobot sirup = 11,164g
= ( )
( ) =
= 1,11612 g/ml
BJ sirup FIII = bobot piknometer + sirup = 41,401g
bobot piknometer kosong = 30,211g
bobot sirup = 11,19g
= ( )
( ) =
= 1,11872 g/ml

51
BJ sirup FIV = bobot piknometer + sirup = 41,435g
bobot piknometer kosong = 30,211g
bobot sirup = 11,224g
= ( )
( ) =
= 1,12212 g/ml
BJ sirup FV = bobot piknometer + sirup = 41,577g
bobot piknometer kosong = 30,211g
bobot sirup = 11,366g
= ( )
( ) =
= 1,13631 g/ml
BJ sirup asetilsistein 0,2% (kontrol positif)
= bobot piknometer + sirup = 41,242g
bobot piknometer kosong = 30,211g
bobot sirup astilsistein = 11,031g
= ( )
( ) =
= 1,10282 g/ml

52
BJ sirup tanpa ekstrak (kontrol negatif)
= bobot piknometer + sirup = 41,259g
bobot piknometer kosong = 30,211g
bobot sirup = 11,048g
= ( )
( ) =
= 1,10452g/ml

53
Lampiran 5. Perhitungan Viskositas Sirup Ekstrak Etanol Daun Pare
Diketahui : BJ sirup FI = 1,10452 g/ml
BJ sirup FII = 1,11612 g/ml
BJ sirup FIII = 1,11872 g/ml
BJ sirup FIV = 1,12212 g/ml
BJ sirup FV = 1,13631 g/ml
BJ sirup asetilsistein 2% = 1,12282 g/ml
BJ sirup tanpa ekstrak = 1,10452 g/ml
BJ air suling = 0,99335 g/ml
T air suling = 8,73 detik
ŋ air suling 370c = 0,6915 cps
Ditanya : viskositas masing-masing sirup ?
Jawab : RUMUS
Viskositas =
x ŋ air suling 37
0c
t sampel sirup sesudah penambahan mukus 20% :
Formula Replikasi I Replikasi II Replikasi III
Formula I 00 : 30,0 detik 00 : 31,1 detik 00 : 32,6 detik
Formula II 00 : 33,3 detik 00 : 33,2 detik 00 : 34,3 detik
Formula III 00 : 34,7 detik 00 : 35,1 detik 00 : 34,8 detik
Formula IV 00 : 37,7 detik 00 : 37,4 detik 00 : 38,5 detik
Formula V 00 : 39,2 detik 00 : 39,5 detik 00 : 39,4 detik
Kontrol Positif 00 : 35,6 detik 00 : 34,8 detik 00 : 34,7 detik
Kontrol Negatif 00 : 39,2 detik 00 : 39,5 detik 00 : 39,4 detik

54
VIskositas FI(a) =
x 0,6915 cps
= 2,6422 cps
Viskositas FI(b) =
x 0,6915 cps
= 2,7391 cps
Viskositas FI(c) =
x 0,6915 cps
= 2,8712 cps
Viskositas FII(a) =
x 0,6915 cps
= 2,9637 cps
Viskositas FII(b) =
x 0,6915 cps
= 2,9548 cps
Viskositas FII(c) =
x 0,6915 cps
= 3,0526 cps
Viskositas FIII(a) =
x 0,6915 cps
= 3,0955 cps
Viskositas FIII(b) =
x 0,6915 cps
= 3,1312 cps
Viskositas FIII(c) =
x 0,6915 cps
= 3,1044 cps

55
Viskositas FIV(a) =
x 0,6915 cps
= 3,3733 cps
Viskositas FIV(b) =
x 0,6915 cps
= 3,3465 cps
Viskositas FIV(c) =
x 0,6915 cps
= 3,4449 cps
Viskositas FV(a) =
x 0,6915 cps
= 3,4419 cps
Viskositas FV(b) =
x 0,6915 cps
= 3,5790 cps
Viskositas FV(c) =
x 0,6915 cps
= 3,5700 cps
Viskositas Kontrol(+) a=
x 0,6915 cps
= 3,1305 cps
Viskositas Kontrol(+) b=
x 0,6915 cps
= 3,0602 cps
Viskositas Kontrol(+)c=
x 0,6915 cps
= 3,0514 cps

56
Viskositas Kontrol(-)a=
x 0,6915 cps
= 3,6375 cps
Viskositas Kontrol(-)b=
x 0,6915 cps
= 3,7079 cps
Viskositas Kontrol(-)c=
x 0,6915 cps
= 3,6551 cps
Viskositas kontrol negatif, kontrol positif, sediaan uji dengan lima varian
konsentrasi
Replikasi
Viskositas (cps)
Kontrol
negatif
Kontrol
positif
Konsentrasi ekstrak dalam sirup (%)b/v
5,0 7,0 9,0 11,0 13,0
I 3,6375 3,1305 2,6422 2,9637 3,0955 3,3733 3,5519
II 3,7079 3,0602 2,7391 2,9548 3,1312 3,3465 3,5790
III 3,6551 3,0514 2,8712 3,0526 3,1044 3,4449 3,5700
Rata-rata 3,6668 3,0807 2,7508 2,9904 3,1104 3,3882 3,5670
SE± 0,021 0,025 0,066 0,031 0,010 0,029 0,007

57
Lampiran 6. Hasil Uji Normalitas
Uji Normalitas
Tests of Normality
formula
Kolmogorov-Smirnova Shapiro-Wilk
Statistic df Sig. Statistic df Sig.
Waktu kontrol positif .349 3 . .832 3 .194
kontrol negatif .292 3 . .923 3 .463
formula I .207 3 . .992 3 .831
formula II .356 3 . .818 3 .157
formula III .293 3 . .923 3 .462
formula IV .282 3 . .935 3 .509
formula V .254 3 . .964 3 .634
a. Lilliefors Significance Correction
Nilai sig > 0,05 sehingga data dikatakan terdistribusi normal

58
Lampiran 7. Hasil Uji Homogenitas Varian
Test of Homogeneity of Variances
Waktu
Levene Statistic df1 df2 Sig.
2.312 6 14 .092
Nilai sig. > 0,05 berarti varian antar kelompok sama, data homogen
Data terdistribusi normal, maka dilanjutkan uji parametrik yaitu one way anova

59
Lampiran 8. Hasil Uji Anova Satu Jalan
ANOVA
Waktu
Sum of Squares df Mean Square F Sig.
Between Groups 1.958 6 .326 101.589 .000
Within Groups .045 14 .003
Total 2.003 20
Nilai sig. < 0,05 maka ada perbedaan antara viskositas dan formula, selanjutnya
dilakukan uji beda dengan metode post hoc LSD terhadap kelompok formula

60
Lampiran 9. Hasil Uji Post Hoc
Multiple Comparisons
Waktu
LSD
(I) formula (J) formula
Mean
Difference (I-
J) Std. Error Sig.
95% Confidence Interval
Lower Bound Upper Bound
kontrol positif kontrol negatif -.5861333* .0462740 .000 -.685381 -.486886
formula I .3298667* .0462740 .000 .230619 .429114
formula II .0903333 .0462740 .071 -.008914 .189581
formula III -.0296667 .0462740 .532 -.128914 .069581
formula IV -.3075333* .0462740 .000 -.406781 -.208286
formula V -.4862667* .0462740 .000 -.585514 -.387019
kontrol
negative
kontrol positif .5861333* .0462740 .000 .486886 .685381
formula I .9160000* .0462740 .000 .816752 1.015248
formula II .6764667* .0462740 .000 .577219 .775714
formula III .5564667* .0462740 .000 .457219 .655714
formula IV .2786000* .0462740 .000 .179352 .377848
formula V .0998667* .0462740 .049 .000619 .199114
formula I kontrol positif -.3298667* .0462740 .000 -.429114 -.230619
kontrol negatif -.9160000* .0462740 .000 -1.015248 -.816752
formula II -.2395333* .0462740 .000 -.338781 -.140286
formula III -.3595333* .0462740 .000 -.458781 -.260286
formula IV -.6374000* .0462740 .000 -.736648 -.538152
formula V -.8161333* .0462740 .000 -.915381 -.716886
formula II kontrol positif -.0903333 .0462740 .071 -.189581 .008914
kontrol negatif -.6764667* .0462740 .000 -.775714 -.577219
formula I .2395333* .0462740 .000 .140286 .338781
formula III -.1200000* .0462740 .021 -.219248 -.020752
formula IV -.3978667* .0462740 .000 -.497114 -.298619
formula V -.5766000* .0462740 .000 -.675848 -.477352
formula III kontrol positif .0296667 .0462740 .532 -.069581 .128914
kontrol negatif -.5564667* .0462740 .000 -.655714 -.457219
formula I .3595333* .0462740 .000 .260286 .458781
formula II .1200000* .0462740 .021 .020752 .219248
formula IV -.2778667* .0462740 .000 -.377114 -.178619
formula V -.4566000* .0462740 .000 -.555848 -.357352
formula IV kontrol positif .3075333* .0462740 .000 .208286 .406781
kontrol negatif -.2786000* .0462740 .000 -.377848 -.179352
formula I .6374000* .0462740 .000 .538152 .736648

61
formula II .3978667* .0462740 .000 .298619 .497114
formula III .2778667* .0462740 .000 .178619 .377114
formula V -.1787333* .0462740 .002 -.277981 -.079486
formula V kontrol positif .4862667* .0462740 .000 .387019 .585514
kontrol negatif -.0998667* .0462740 .049 -.199114 -.000619
formula I .8161333* .0462740 .000 .716886 .915381
formula II .5766000* .0462740 .000 .477352 .675848
formula III .4566000* .0462740 .000 .357352 .555848
formula IV .1787333* .0462740 .002 .079486 .277981

62
Lampiran 10. Tabel Ringkasan Hasil Uji LSD
Perlakuan
Kesimpulan
Kontro
l
negatif
Kontro
l
positif
Konsentrasi ekstrak dalam sirup (%)
5,0 7,0 9,0 11,0 13,0
Kontrol negatif - B B B B B B
Kontrol positif B - B BT BT B B
FI B B - B B B B
FII B BT B - B B B
FIII B BT B B - B B
FIV B B B B B - B
FV B B B B B B -
Keterangan: BT : Berbeda Tidak Bermakna (sama)
B : Berbeda Bermakna (berbeda)

63
Lampiran 11. Data Selisih Nilai Viskositas antara Kontrol Negatif dengan
Kontrol Positif dan Semua Formula
Replikasi
Viskositas (cps)
Kontrol
positif
Konsentrasi ekstrak dalam sirup (%)b/v
5,0 7,0 9,0 11,0 13,0
I 0,5070 0,9953 0,6738 0,5420 0,2642 0,0856
II 0,6477 0,9688 0,7531 0,5767 0,3614 0,1289
III 0,6037 0,7839 0,6025 0,5507 0,2102 0,0851
Rata-rata 0,5861 0,9160 0,6764 0,5564 0,2786 0,0998
SE± 0,041 0,066 0,043 0,010 0,044 0,014

64
Lampiran 12. Uji Normalitas Distribusi
Tests of Normality
formula
Kolmogorov-Smirnova Shapiro-Wilk
Statistic df Sig. Statistic df Sig.
viskositas kontrol positif .263 3 . .955 3 .593
formula I .343 3 . .842 3 .220
formula II .181 3 . .999 3 .941
formula III .292 3 . .923 3 .465
formula IV .241 3 . .974 3 .688
formula V .381 3 . .759 3 .019
a. Lilliefors Significance Correction
Nilai sig. < 0,05 sehingga data dikatakan tidak terdistribusi normal

65
Lampiran 13. Uji Homogenitas Varian
Test of Homogeneity of Variances
viskositas
Levene Statistic df1 df2 Sig.
2.283 5 12 .112
Nilai sig. > 0,05 berati varian antar kelompok sama, data homogen
Data tidak terdistribusi normal dan homogen, maka dilanjutkan dengan uji non-
parametrik yaitu uji kruskall-walls

66
Lampiran 14. Uji Kruskall-Walls
Test Statisticsa,b
viskositas
Chi-Square 15.690
Df 5
Asymp. Sig. .008
a. Kruskal Wallis Test
b. Grouping
Variable:formula
Nilai sig. < 0,05 maka ada perbedaan antara viskositas dan formula, selanjutnya
dilakukan uji beda dengan uji mann-whitney

67
Lampiran 15. Uji Mann-Whitney
1. Kontrol Positif dengan Formula I
Test Statisticsb
Viskositas
Mann-Whitney U .000
Wilcoxon W 6.000
Z -1.964
Asymp. Sig. (2-tailed) .049
Exact Sig. [2*(1-tailed Sig.)] .100a
a. Not corrected for ties.
b. Grouping Variable: formula
Nilai sig.< 0,05 maka ada perbedaan bermakna
2. Kontrol Positif dengan Formula II
Test Statisticsb
Viskositas
Mann-Whitney U 2.000
Wilcoxon W 8.000
Z -1.091
Asymp. Sig. (2-tailed) .275
Exact Sig. [2*(1-tailed Sig.)] .400a
a. Not corrected for ties.
b. Grouping Variable: formula
Nilai sig. > 0,05 maka tidak ada perbedaan bermakna(sama)

68
3. Kontrol Positif dengan Formula III
Test Statisticsb
Viskositas
Mann-Whitney U 3.000
Wilcoxon W 9.000
Z -.655
Asymp. Sig. (2-tailed) .513
Exact Sig. [2*(1-tailed Sig.)] .700a
a. Not corrected for ties.
b. Grouping Variable: formula
Nilai sig. > 0,05 maka tidak ada perbedaan bermakna(sama)
4. Kontrol Positif dengan Formula IV
Test Statisticsb
Viskositas
Mann-Whitney U .000
Wilcoxon W 6.000
Z -1.964
Asymp. Sig. (2-tailed) .049
Exact Sig. [2*(1-tailed Sig.)] .100a
a. Not corrected for ties.
b. Grouping Variable: formula
Nilai sig. < 0,05 maka ada perbedaan bermakna
69
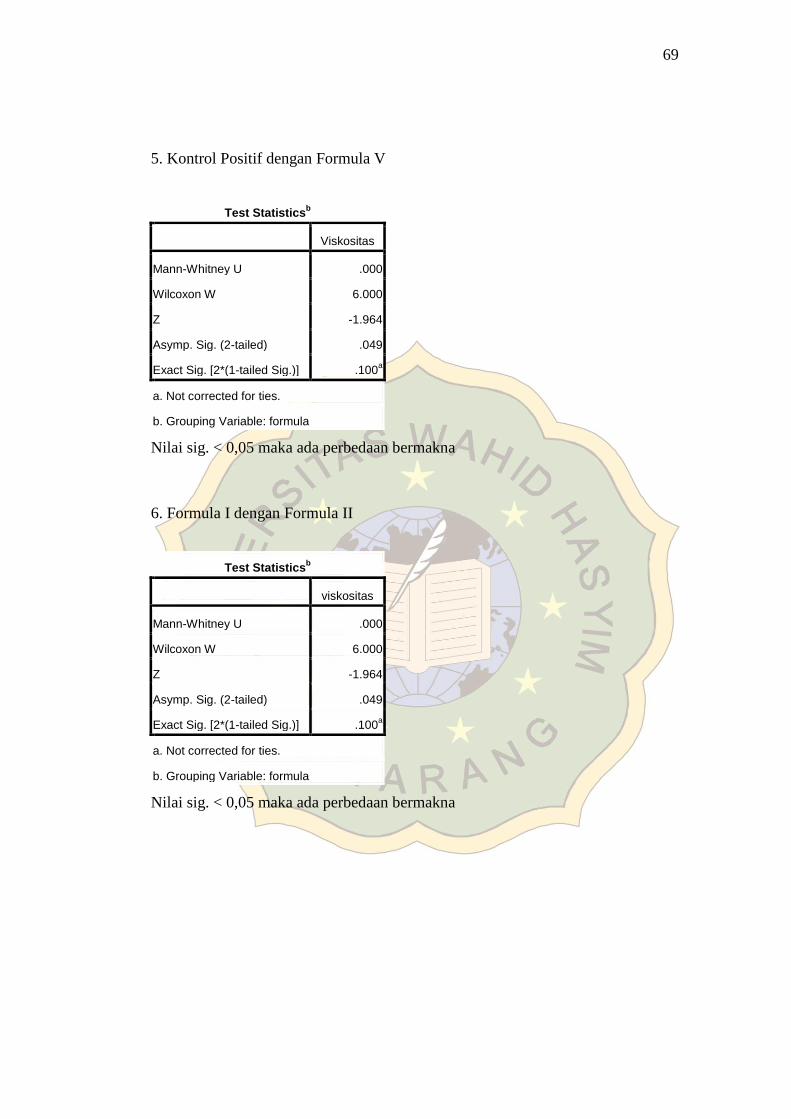
5. Kontrol Positif dengan Formula V
Test Statisticsb
Viskositas
Mann-Whitney U .000
Wilcoxon W 6.000
Z -1.964
Asymp. Sig. (2-tailed) .049
Exact Sig. [2*(1-tailed Sig.)] .100a
a. Not corrected for ties.
b. Grouping Variable: formula
Nilai sig. < 0,05 maka ada perbedaan bermakna
6. Formula I dengan Formula II
Test Statisticsb
viskositas
Mann-Whitney U .000
Wilcoxon W 6.000
Z -1.964
Asymp. Sig. (2-tailed) .049
Exact Sig. [2*(1-tailed Sig.)] .100a
a. Not corrected for ties.
b. Grouping Variable: formula
Nilai sig. < 0,05 maka ada perbedaan bermakna

70
7. Formula I dengan Formula III
Test Statisticsb
viskositas
Mann-Whitney U .000
Wilcoxon W 6.000
Z -1.964
Asymp. Sig. (2-tailed) .049
Exact Sig. [2*(1-tailed Sig.)] .100a
a. Not corrected for ties.
b. Grouping Variable: formula
Nilai sig. < 0,05 maka ada perbedaan bermakna
8. Formula I dengan Formula IV
Test Statisticsb
viskositas
Mann-Whitney U .000
Wilcoxon W 6.000
Z -1.964
Asymp. Sig. (2-tailed) .049
Exact Sig. [2*(1-tailed Sig.)] .100a
a. Not corrected for ties.
b. Grouping Variable: formula
Nilai sig. < 0,05 maka ada perbedaan bermakna

71
9. Formula I dengan Formula V
Test Statisticsb
viskositas
Mann-Whitney U .000
Wilcoxon W 6.000
Z -1.964
Asymp. Sig. (2-tailed) .049
Exact Sig. [2*(1-tailed Sig.)] .100a
a. Not corrected for ties.
b. Grouping Variable: formula
Nilai sig. < 0,05 maka ada perbedaan bermakna
10. Formula II dengan Formula III
Test Statisticsb
viskositas
Mann-Whitney U .000
Wilcoxon W 6.000
Z -1.964
Asymp. Sig. (2-tailed) .049
Exact Sig. [2*(1-tailed Sig.)] .100a
a. Not corrected for ties.
b. Grouping Variable: formula
Nilai sig. < 0,05 maka ada perbedaan bermakna

72
11. Formula II dengan Formula IV
Test Statisticsb
Viskositas
Mann-Whitney U .000
Wilcoxon W 6.000
Z -1.964
Asymp. Sig. (2-tailed) .049
Exact Sig. [2*(1-tailed Sig.)] .100a
a. Not corrected for ties.
b. Grouping Variable: formula
Nilai sig. < 0,05 maka ada perbedaan bermakna
12. Formula II dengan Formula V
Test Statisticsb
viskositas
Mann-Whitney U .000
Wilcoxon W 6.000
Z -1.964
Asymp. Sig. (2-tailed) .049
Exact Sig. [2*(1-tailed Sig.)] .100a
a. Not corrected for ties.
b. Grouping Variable: formula
Nilai sig. < 0,05 maka ada perbedaan bermakna

73
13. Formula III dengan Formula IV
Test Statisticsb
viskositas
Mann-Whitney U .000
Wilcoxon W 6.000
Z -1.964
Asymp. Sig. (2-tailed) .049
Exact Sig. [2*(1-tailed Sig.)] .100a
a. Not corrected for ties.
b. Grouping Variable: formula
Nilai sig. < 0,05 maka ada perbedaan bermakna
14. Formula III dengan Formula V
Test Statisticsb
Viskositas
Mann-Whitney U .000
Wilcoxon W 6.000
Z -1.964
Asymp. Sig. (2-tailed) .049
Exact Sig. [2*(1-tailed Sig.)] .100a
a. Not corrected for ties.
b. Grouping Variable: formula
Nilai sig. < 0,05 maka ada perbedaan bermakna

74
15. Formula IV dengan Formula V
Test Statisticsb
Viskositas
Mann-Whitney U .000
Wilcoxon W 6.000
Z -1.964
Asymp. Sig. (2-tailed) .049
Exact Sig. [2*(1-tailed Sig.)] .100a
a. Not corrected for ties.
b. Grouping Variable: formula
Nilai sig. < 0,05 maka ada perbedaan bermakna

75
Lampiran 16. Dokumentasi Penelitian
Formula sirup ekstrak etanol Alat pH meter untuk uji pH
sirup daun pare
Alat viskositas Oswald Alat piknometer untuk mencari
BJ sirup
Proses inkubasi sirup pada suhu 370C Proses inkubasi sirup untuk
mencari BJ sirup dalam suhu 370C