laboratory theory and methods f sediment · pdf filelaboratory theory and methods f or ......
TRANSCRIPT
Techniques of Water-Resources Investigations
of the United States Geological Survey
Chapter Cl
LABORATORY THEORY
AND METHODS
F Or
SEDIMENT ANALYSIS By Harold P. Guy
Book 5
LABORATORY ANALYSIS
UNITED STATES DEPARTMENT OF THE INTERIOR
CECIL D. ANDRUS, Secretary
GEOLOGICAL SURVEY
V. E. McKelvey, Director
First printing 1969
Second printing 1973
Third printing 1977
UNITED STATES GOVERNMENT PRINTING OFFICE, WASHINGTON : 1969
For sale by the Branch of Distribution, U.S. Geological Survey, 1200 South Eads Street, Arlington, VA 22202
PREFACE
This series of manuals on techniques describes procedures for planning and executing specialized work in water-resources investigations. The material is grouped under major subject headings called books and further subdivided into sections and chapters; Section C of Book 5 is on sediment analysis.
The unit of publication, the chapter, is limited to a narrow-field of subject matter. This format permits flexibility in revision and publication as the need arises.
Provisional drafts of chapters are distributed to field offices of the U.S. Geological Survey for their use. These drafts are subject to revision because of experience in use or because of adva,ncement in knowledge, tech- niques, or equipment. After the technique described in a chapter is suffi- ciently developed, the chapter is published and is sold by the U.S. Geo- logical Survey, 1200 South Eads Street, Arlington, VA 22202 (authorized agent of Superintendent of Documents, Government Printing Office).
III

CONTENTS
Preface_----------------------------------- Abstract----------------------------------- Introduction- _ _ __ _ _-_ _______ ___ -_ ___ __ __ __ _
Acknowledgments ____ _ _ _ - _ _ _ - _ - _ _ _ - _ _ _ _ Functions of a sediment laboratory- _ _ _ _ _ _ Units of measurement and definitions- _ _ _ _ Theory of particles falling in a fluid- _ _ _ _ _ _
The settling medium ________________ Stokes law for small particles _________ Drag-Reynolds number--- _ _ _ _ _ _ _ _ _ _ _
Significant figures for reporting results--- __ Procedure for determining suspended-sediment
concentration- - _ - ________ _______________ _ Evaporation method- _ __ ________________ Filtration method- _ - __ _ __________-_____ Laboratory forms- ______ ________________ Procedure for concentration analysis- _ _ _ _ _
Determination of particle-size distribution of suspended sediments- _ _ _ __ _ _ ____ _ _-_ _ _-_ _ _
Recommended frequency of analyses- _ _ _ _ _ Method of analysis---- _ _ _ _ _ _ _ _ _ _ _ _ _ _ _ _ _ _
Limitations- _ - _ _ __ __ _ __ ___ __ _ __ _ - _ _ Dispersed settling medium- _ __ _ _ _ __ - _ Native water settling medium ________
Sample preparation for native water analysis _____ _ _ - _ _ _ _ __ _ _ _ _ _ _ _ __ _ _ _ _ _ - _
Procedure for the sieve-pipet method of particle- sizeanalysis ____ - ____ -__-___--__- ____ - ____
Equipment _____ _ - _ __ __ ._ _ _ _ _ _ _ __ _ _ _ _ - _ _ Preparation of sample-------------- _____
Recording and decanting- _ _ _ ________ Mechanical dispersion- - _ _ - - _ _ __ _ _ __ _
Sieving ____ -__-___--__-.__--__-________ Separation of sand from fines-__- - - - _ _ Dry method-- _____ -.._--_-- _._______ Wet method__---________-____---__
Analysis of silt-clay fraction--- __--__---- Splitting ____ --__--_..- ______________ Dispersing-------- _______ i _______ -- Pipetting__-__--__-._- ____ -___- ____
Calculation of results ____ _ _ - _ _ _ - _ _ _ _ _ _ _ _ _ Total weight of sediment in sample-. _ Calculations ____ - _ _ _ _ _ _ _ _ _ _ _ _ _ _ _ _ _ _ _
Pege . . . 111
1 I 1 1 3 8 8 9
10 10
11 11 12 13 17
18 18 19 19 19 20
22
23 24 26 26 26 28 28 28 28 29 29 29 29 29 29 30
Procedure for the VA tube-pipet method of particle-size analysis- _ _ _ _ ___ ___ __ _ _ _ ___-_ _
Equipment___-____-__----__---_________ Preparation of sample __________________ _
Separation of sand from fines _________ Splitting and dispersing _____ _ _ __ __ _ _ _
The VA tube analysis- _ _________________ Tube selection ____ _ __ ___ _ _ _ __ _ _ _ _ _ _ _ Procedure_-________-_______________ Chart interpretation- _ _ _ _ _ _ _ __ __ _ _- _
Procedure for the BW tube-VA tube method of particle-size analysis- _ _ _ ___ __ __ __ __ ____ _ __
TheOden theory------ _________ -___-___ Equipment-- _ _ _ _ _ _ _ _ _ _ _ _ _ _ _ _ _ _ _ _ _ _ _ _ _ _ _ Preparation of sample- _ _ _ __ __ __ _-_ __ ___ _ The BW tube analysis--- _ _ _ _ _ _ _ _ _ _ _ _ _ _ _ _
Dispersion-_______--_______________ Withdrawals- __ _ __ _ _ _ _ __ ___ __ _-_ ___ Recording of data ____ __ __ __ _ _ _ __ _-_ _ The Oden curve ____________________
Limitations of BW tube for sand--- __ __ __ _ Determination of particle-size distribution of
deposited sediment and soil samples_- - _ _ _ _ - _ Equipment and method of handling- _ _ _ _ _ _ In situ measurement- _ _ _ _ _ _ __ _ _ _ __ __ _ __ _
Nominal diameter by immersion- _ _ _ _ _ The Zeiss analyzer- _ _ _ _ _ _-_ _ - _ _ __ __ _
Laboratory analysis _____________________ Preparation and procedures- _ __ __ _ __ _ Calculation of results ____ _____ ___ _ _ - _
Mechanical analyses of soil samples _ _ _ _ _ _ _ Other determinations related to sediment anal-
ysis-________-__________________________~ Organic material ____ __ _ __ __ __ _ _ _ _ _ _ _ __ _ _
Relationship to particle-size settling media___--__-_____-_____________
Procedure of removal-.._ _ _ _ _ _ - _ _ __ _ _ _ Aggregate destruction- _ _ __ _ _ _ __ _ _ _ _ _
Dissolved solids- - _ _-_ _ _ __ _ __ _ _ _ _ _ _ _ _ _ _ _ Related water-quality analysis- _ _ - _ _ __ _ _ _ Specific gravity_-____--__-______________ Specific weight.. _ - _ _ _ _ _ __ _ __ _ _ _ __ __ __ _ _ _
Selected references- - __ _ _ __ ___ _ _ _ _ _ __ __ _ _ _ _ _ Index_--___--___________________________--
Page
30 31 32 32 33 33 37 37 38
38 38 39 40 42 42 42 43 45 47
47 47 48 48 48 49 49 51 51
51 51
52 52 52 53 53 54 54 55 56
VI CONTENTS
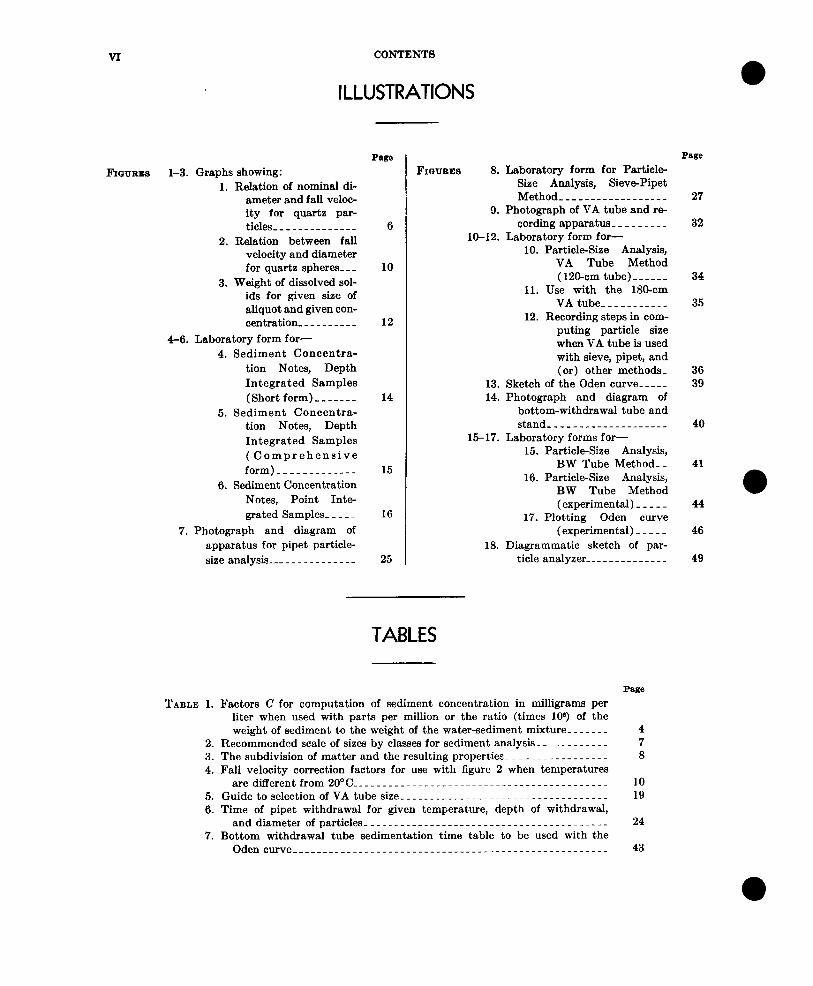
ILLUSTRATIONS
FIoURx.9 l-3. Graphs showing: 1. Relation of nominal di-
ameter and fall veloc- ity for quartz par- ticles- _ _ _ _ _ _ _ _ _ - - - -
2. Relation between fall velocity and diameter for quartz spheres- _ -
3. Weight of dissolved sol- ids for given size of aliquot and given con- centration- - - _ - _ _ _ _ _
4-6. Laboratory form for- 4. Sediment Concentra-
tion Notes, Depth Integrated Samples (Short form) _ _ _ __ __
5. Sediment Concentra- tion Notes, Depth Integrated Samples (Comprehensive form) _ - _ _ _ _ _____--
6. Sediment Concentration Notes, Point Inte- grated Samples..----
7. Photograph and diagram of apparatus for pipet particle- size analysis--- _ _ _ _ _ _ _ _ _ _ _ _
P%Kl
6
10
12
14
15
16
25
FIGWILES 8. Laboratory form for Particle- Size Analysis, Sieve-Pipet Method- _ _ _ _ _ _ _ _ _ _ _ _ _ _ _ _ _
9. Photograph of VA tube and re- cording apparatus- _ _ _ _ ___ _
16-12. Laboratory form for- 10. Particle-Size Analysis,
VA Tube Method (12~cm tube)------
11. Use with the 186-cm VA tube--- ________
12. Recording steps in com- puting particle size when VA tube is used with sieve, pipet, and (or) other methods-
13. Sketch of the Oden curve----- 14. Photograph and diagram of
bottom-withdrawal tube and stand- _ _ _ _ _ _ _ _ _ _ _ _ _ _ _ _ _ _ _
15-17. Laboratory forms for- 15. Particle-Size Analysis,
BW Tube Method-- 16. Particle-Size Analysis,
BW Tube Method (experimental) _ _ _ _ _
17. Plotting Oden curve (experimental) _ - _ _ _
18. Diagrammatic sketch of par- ticle analyzer--- _ _ _ _ _ _ - _ _ _ _
TABLES
TABLE 1. Factors C for computation of sediment concentration in milligrams per liter when used with parts per million or the ratio (times 1CP) of the weight of sediment to the weight of the water-sediment mixture----- __
2. Recommended scale of sizes by classes for sediment analysis- _ - _ _ _ _ _ _ _ _ _ 3. The subdivision of matter and the resulting properties----------------- 4. Fall velocity correction factors for use with figure 2 when temperatures
are different from 2O“C ________________ ------_- __________________- 5. GuidetoselectionofVAtubesize ______________ ----_--- _____________ 6. Time of pipet withdrawal for given temperature, depth of withdrawal,
and diameter of particles- _ _ _ _ _ _ _ _ _ _ _ _ _ _ _ _ _ _ _ - - __ - _ - _ _ _ _ _ _ _ _ _ _ _ _ _ _ 7. Bottom withdrawal tube sedimentation time table to be used with the
Odencurve-----------------------------------------------------
4 7 8
10 19
24
43
Page
27
32
34
35
36 39
40
41
0 44
46
49
LABORATORY THEORY AND METHODS FOR SEDIMENT ANALYSIS
By Harold P. Guy
Abstract
The diverse character of fluvial sediments makes the choice of laboratory analysis somewhat arbitrary and the pressing of sediment samples difficult. This report presents some theories and methods used by the Water Resources Division for analysis of fluvial sediments to determine the concentration of suspended- sediment samples and the particle-size distribution of both suspended-sediment and bed-material samples. Other analyses related to these determinations may include particle shape, mineral content, and specific gravity, the organic matter and dissolved solids of samples, and the specific weight of soils.
The merits and techniques of both the evaporation and filtration methods for concentration analysis are discussed. Methods used for particle-size analysis of suspended-sediment samples may include the sieve pipet, the VA tubepipet, or the BW tube-VA tube de- pending on the equipment available, the concentration and approximate size of sediment in the sample, and the settling medium used. The choice of method for most bed-material samples is usually limited to pro- cedures suitabie for sand or to some type of visual analysis for large sizes.
Several tested forms are presented to help insure a well-ordered system in the laboratory to handle the samples, to help determine the kind of analysis re- quired for each, to conduct the required processes, and to assist in the required computations. Use of the manual should further “standardize” methods of fludal sediment analysis among the many laboratories and thereby help to achieve uniformity and precision of the data.
Introduction
Acknowledgments
The writer has attempted to document the “special” procedures developed and routinely used by many scientists and laboratory techni-
cians for sediment analysis. These procedures are not individually acknowledged because they have usually evolved as a result of the many sediment conditions encountered in the many kinds of streams in the United States and be- cause the scientists and technicians who have developed these highly efficient systems did so in close association with fellow workers. It is regrettable that the writer cannot document all these procedures in great detail ,&cause it is difficult to obtain complete information and be- cause there is need for standardization. Sedi- mentation theories, however, are better ac- knowledged ; but again, many contributions have evolved from individuals or groups and are not fully documented.
Among the many who have contributed to this chapter, as well as the earlier 1960 draft, special appreciation is extended to C. D. Allbert, F. 1C. Ames, B. C. Colby, B. R. Colby, C. R. Collier, R. K. Flint, J. C. Mundorff, G. Porter- field, and R. B. Vice.
Functions of a sediment laboratory A sediment laboratory in the Water Resources
Division of the U.S. Geological Survey has two principal functions: (1) the determination of suspended-sediment concentration of samples collected from streams and (2) the determina- tion of particle-size distribution of suspended sediment, streambed material, and reservoir de- posits. Other kinds of analyses, usually associ- ated with these two functions, may include quan- titative determination and (or) removal of organic matter and dissolved solids, the specific
1
2 TECHNIQUES OF WATER-RESOURCES INVESTIGATIONS
gravity of sediment particles, the specific weight of soils and sediment deposits, particle shape determinations, and mineral analyses.
Data from the concentration and particle- size determinations are used to make computa- tions of suspended-sediment discharge, com- putations of total sediment discharge, and computations of the probable volume and spe- cific weight of exposed and submerged reservoir deposits. These are but a few of the many uses made of concentration and particle-size data of fluvial sediment. The reliability of these computations and the utility of the data are dependent on the accmacy and reliability of the laboratory analyses. This discussion of the functions of a sediment laboratory is given to provide insight into some of the problems en- countered in sediment analyses and to help guide the field technician in the collection of samples that are suitable for the desired analysis.
In the determination of suspended-sediment concentration, the quantity and characteristics of the sediment, and the chemical quality of water from the stream (native water) must be considered in the processing of the sample. Too small a quantity of sediment tends to magnify errors inherent in determining the weight of dry sediment, or in the transfer of material from one container to another. On the other hand, too large a quantity of sediment may cause problems with respect to splitting, drying, and weighing the sample. Samples collected with certain types of mineralized water and (or) containing colloidal clay result in difficult sep- aration of sediment from the native water. A weight correction based on the quantity of dissolved solids is often necessary when the evaporation method is used to determine sue- pended-sediment concentration. These and other aspects of suspended-sediment concentration determinations are discussed later in this chapter.
The determination of the sediment particle- size distribution in a sample of streamflow offers
several challenges in addition to those encoun- tered in determining concentration. As discussed later, the sieve-pipet method or the visual- accumulation tube-p@ method is recom- mended in order to obtain maximum informa- tion regarding fall velocity. Since each kind of analysis requires a rather narrow range of sedi- ment quantity, the much larger range normally found in sediment samples is likely to be a problem. Compositing or grouping of the sedi- ment from several samples into one may be necessary when the stream concentration is low ; or, a sample from a stream having a high con- centration may need to be split so that an opti- mum smaller quantity of sediment may be analyzed. For example, the quantity of sand to be analyzed in the visual-accumulation tube can range from 0.05 to 0.8 g (gram) for the smallest tube to about 5 to 15 g for the largest tube; or in the case of the pipet, the quantity of silt and clay must be just sufficient to yield a concentra- tion between 2,000 and 5,000 ppm (parts per million) in the sedimentation tube. Each kind of analysis has its own range of sediment quantity necessary to obtain optimum results.
In addition to the problem of determining the kind of analysis to use, it is necessary to keep in mind the need to determine the concen- tration of sediment in the samples for which particle-size distribution is determined. Provi- sion should, therefore, be made to obtain the weights of all increments of sediment in the analysis as well as portions not used in the analysis, The sample must be kept wet until the particle-size analysis is complete to prevent the formation of aggregates that resist redis- persion. Division of a combined sample into separate portions for separate concentration and particle-size analysis should be avoided unless the sample can be divided into two samples each representing the streamflow at the given time. Splitting may introduce quantitative and quali- tative errors that will affect the concentration and (or) particle-size results. Procedures for
LABORATORY THEORY AND METHODS FOR SEDIMENT ANALYSIS 3
determining particle-size distribution of fluvial sediment ,by sieve and sedimentation methods are discussed in sections to follow. The fre- quency of sampling for analysis and the need for special analytical procedures for both native and dispersed settling media are also discussed.
The determination of particle-size distribu- tion of bed-material samples is different from the determination of particle-size distribution of suspended-sediment samples because the quantity of material is usually large, the samples are usually sand with a considerably larger median size and most samples will be in a room-dry condition. TJnlike suspended-sedi- ment samples, which often have very limited quantities of material available for analysis, the larger bed-material samples with proper split- ting allow the use of optimum quantities of material for all size ranges.
Sieves are used to determine particle-size dis- tribution of material z2.0 mm (millimeter), whereas the VA tube (visual-accumulation tube) is used most frequently to determine particle-size distribution of material from 0.062 to 2.0 mm. However, the sieve can be, and some- times is, used for the entire range of sand and gravel sizes. Particle size determined by the VA tube is referred to as sedimentation diameter and the relationship-between sieve size and sedi- mentation diameter is well known for quartz spheres. It is usually assumed that the particles have a specific gravity of 2.65 unless the material in the sample appears to contain significant quantities of minerals other than quartz. Both specific gravity and particle shape vary depend-
ing on the geologic and hydrologic character- istics of any given stream and drainage basin. It may be useful to check the specific gravity and shape characteristics of sediment for a specific stream in order to convert the fall diameter of sediment determined by the VA tube to standard fall velocity or actual particle size.
Units of measurement and definitions The methods used for collecting sediment
samples are described in a chapter of this series entitled “Field Methods for Fluvial Sedi- ment Measurement.” Though it is possible to determine many kinds of sediment concentra- tion such as the temporal mean or the average along a line, over an area, and throughout a specified volume, the sampling and compositing procedures are usually designed to give a time- integrated, velocity-weighted, cross-sectional average value of concentration or size distribution.
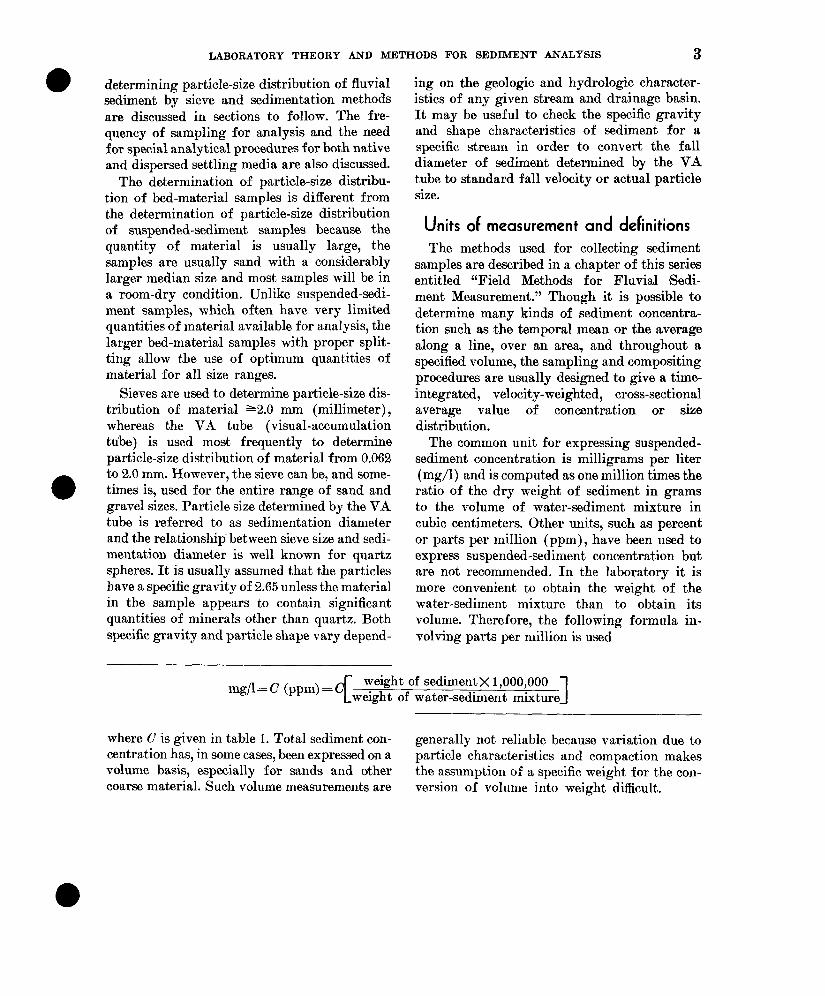
The common unit for expressing suspended- sediment concentration is milligrams per liter (mg/l) and is computed as one million times the ratio of the dry weight of sediment in grams to the volume of water-sediment mixture in cubic centimeters. Other units, such as percent or parts per million ( ppm), have been used to express suspended-sediment concentration but are not recommended. In the laboratory it is more convenient to obtain the weight of the water-sediment mixture than to obtain its volume. Therefore, the following formula in- volving parts per million is used
mgP=C (PPm)=c[ weight of sedimentx l,OOO,OOO
weight of water-sediment 1 mixture
where C is given in table 1. Total sediment con- generally not reliable because variation due to centration has, in some cases, been expressed on a particle characteristics and compaction makes volume basis, especially for sands and other the assumption of a specific weight for the con- coarse material. Such volume measurements are version of volume into weight difficult.
4 TECHNIQUES OF WATER-RESOURCES INVESTIGATIONS
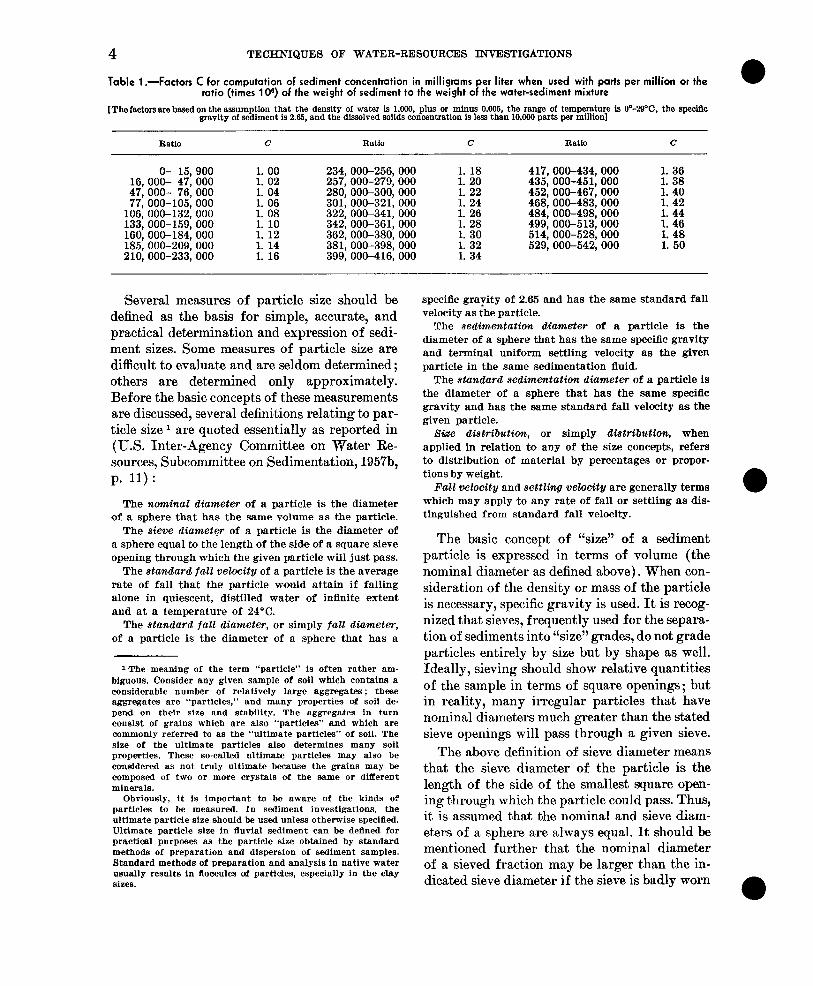
Table 1 .-Factors C for computation of sediment concentration in milligmms per liter when used with parts per million or the mtio (times 10s) of the weight of sediment to the weight of the water-sediment mixture
[The factors are based on the assumption that the density of water is 1.000, plus or minus 0.005, the range of temperature is O=2Q°C, the specillc gravity of sediment is 2.65, and the dissolved solids concentration is less than 10.000 parts per million]
Ratio c Ratio c Ratlo C
o- 15,900 1. 00 234,006-256,000 1. 18 417,000-434,000 1. 36 16,000- 47, 000 1. 02 257,000-279, 000 1. 20 435,000-451,000 1. 38 47,000- 76,000 1. 04 280,000-300,000 1. 22 452.006-467.000 1. 40 77,006-105,000 1. 06 301,00&321,000 1. 24 468; 000-483; 000 1. 42
106,006-132,000 1. 08 322,006-341,000 1. 26 484,000-498,000 1. 44 133,006-159,000 1. 10 342,006-361,000 1. 28 499,006-513,000 1. 46 160,000-184,000 1. 12 362,000-380,000 1. 30 514,000-528,000 1. 48 185,000-209,000 1. 14 381,000-398,000 1. 32 529,000-542,000 1. 50 210,000-233,000 1. 16 399,000-416,000 1. 34
Several measures of particle size should be defined as the basis for simple, accurate, and practical determination and expression of sedi- ment sizes. Some measures of particle size are difficult to evaluate and are seldom determined ; others are determined only approximately. Before the basic concepts of these measurements are discussed, several definitions relating to par- ticle size l are quoted essentially as reported in (U.S. Inter-Agency Committee on Water Re- sources, Subcommittee on Sedimentation, 1957b, p. 11) :
The nom&al diameter of a particle is the diameter of a sphere that has the same volume as the particle.
The sieve diameter of a particle is the diameter of a sphere equal to the length of the side of a square sieve opening through which the given particle will just pass.
The standard fall velocity of a particle is the average rate of fall that the particle would attain if falling alone in quiescent, distilled water of infinite extent and at a temperature of 24°C.
The standard fall diameter, or simply fall diameter, of a particle is the diameter of a sphere that has a
IThe meaning of the term “particle” is often rather am- biguous. Consider any given sample of soil which contains a considerable number of relatively large aggregates; these aggregates are “particles,” and many properties of soil de- pend on their size and stability. The aggregates in turn consist of grains which are also “particles” and which are oommonly referred to as the “ultimate particles” of soil. The size of the ultimate particles also determines many soil properties. These so-called ultimate particles may also be considered as not truly ultimate because the grains may be composed of two or more crystals of the same or different minerals.
Obviously, it is important to be aware of the kin& of particles to be measured. In sediment investigations, the ultimate particle size should be used unless otherwise specified. Ultimate particle size in fluvial sediment can be de5ned for practical purposes as the particle size obtained by standard methods of preparation and dispersion of sediment samples. Stnndard methods of preparation and analysis in native water usually results in floocules of partioles, especially in the clay sizes.
specific grayity of 2.65 and has the same standard fall velocity as the particle.
The sedimentation diameter of a particle is the diameter of a sphere that has the same specific gravity and terminal uniform settling velocity as the given particle in the same sedimentation fluid.
The standard sedimentation diameter of a particle is the diameter of a sphere that has the same specific gravity and has the same standard fall velocity as the given particle.
8&e distribution, or simply distribution, when applied in relation to any of the size concepts, refers to distribution of material by percentages or propor- tions by weight.
Fall velocity and settling velocity are generally terms which may apply to any rate of fall or settling as dis- tinguished from standard fall velocity.
The basic concept of “size” of a sediment particle is expressed in terms of volume (the nominal diameter as defined above). When con- sideration of the density or mass of the particle is necessary, specific gravity is used. It is recog- nized that sieves, frequently used for the separa- tion of sediments into “size” grades, do not grade particles entirely by size but by shape as well. Ideally, sieving should show relative quantities of the sample in terms of square openings; but in reality, many irregular particles that have nominal diameters much greater than the stated sieve openings will pass through a given sieve.
The above definition of sieve diameter means that the sieve diameter of the particle is the length of the side of the smallest square open- ing through which the particle could pass. Thus, it is assumed that the nominal and sieve diam- eters of a sphere are always equal. It should be mentioned further that the nominal diameter of a sieved fraction may be larger than the in- dicated sieve diameter if the sieve is badly worn
LABORATORY THEORY AND METHODS FOR SEDIMENT ANALYSIS 5
or if some openings have been stretched out of their “square” shape.
One of the dynamic properties necessary for sediment transport studies is the velocity of fall of the individual particles in quiet water. Terms, such as “settling velocity,” “fall velocity,” “ve- locity of settling,” or “velocity of fall,” have been applied to this fundamental characteristic. Standard fall velocity allows various investiga- tors to compare their data directly. This fall- velocity concept is simple and logical ; however, a size concept is so thoroughly embedded in the concepts relative to the field of sedimentation that an expression or measure of diameter is needed. Hence, fall diameter is related to fall velocity in that a given particle has only one fall diameter which is independent of the type of material, the concentration of analysis, or the method of analysis.
Studies have shown that a particle settling as one of several surrounding particles generally falls with a velocity different from that for the particle settling alone. The fall-diameter distri- bution of a sample may be described as the dis- tribution determined as though each particle were dropped separately and a summation made of the fall diameters of the particles. This dis- tribution is based on weight and fall diameter and is believed to be the most basic and desirable expression for the sedimentation analysis of a sample.
The definition of sedimentation diameter does not restrict the conditions under which the settling velocity may be determined. The relation of diameter to settling velocity depends only on the specific gravity of the particle. Any of the various settling velocities, depending on the nature of the sample, the concentration, the fluid, and the apparatus, must be used with a determination or estimate of specific gravity to establish sedimentation diameter. It is apparent from the definition previously given that the standard sedimentation diameter of a particle depends only on the volume and shape of the particle, and that the relationship of nominal diameter to standard sedimentation diameter becomes a measure of the effect of shape and roughness on the settling velocity of the particle in water at 24’C.
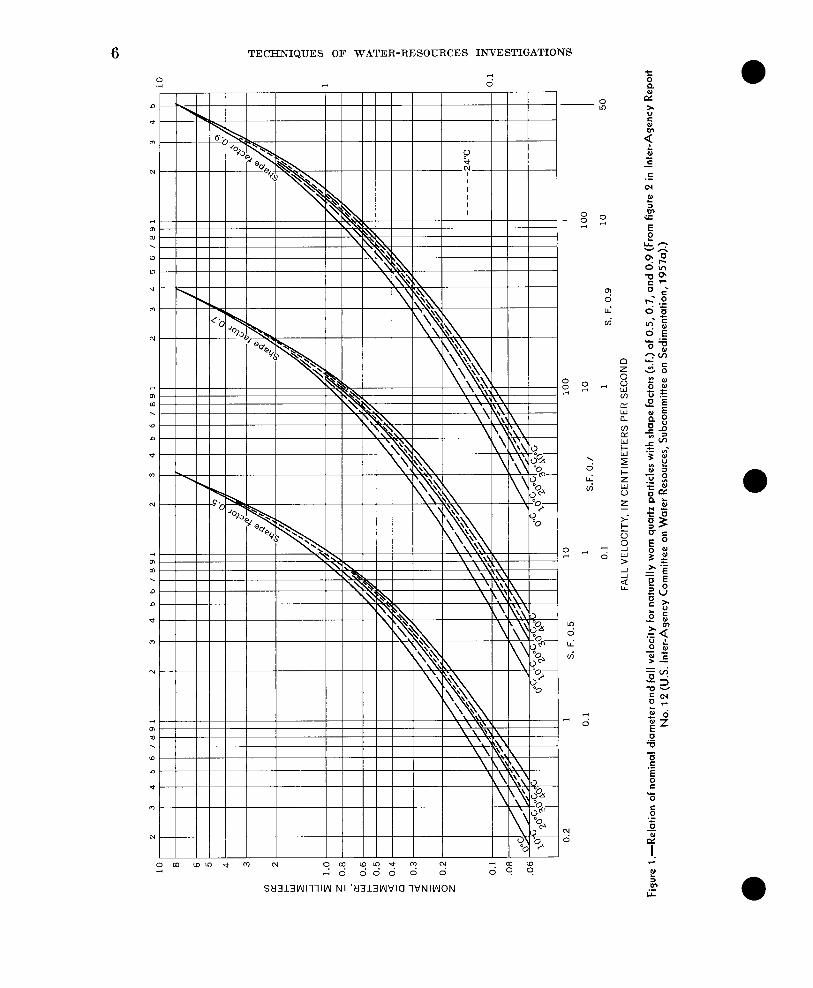
The physical size of particles, especially for gravel and larger particles, may be expressed on the basis of the length of three diameters of the particle (a, b, and c) which are mutually perpendicular (Inter-Agency Report 12, p. 12). The axes are differentiated as a=the longest axis of the particle, b= the intermediate axis of the particle, and c=the shortest axis of the particle. The harmonic mean diameter (Krum- bein and Pettijohn, 1938, p. 128) is defined as dn=3 abc/(ab+bc+ac) and is considered to be closely related to diameters calculated on the basis of Stokes law. In addition to the harmonic mean, the arithmetic mean d,= (a+b+c)/3 and the geometric mean diameters d,=3J& have been used by various investigators to express size. The important value of these physical measurements is in the expression of a particle shape factor.
The sha nominal iameters to fall velocity or fall di- dP
e factor sf =c/@ is useful in relating
ameter. Figure 1 shows the relation of naturally worn quartz particles to their fall velocity for shape factors of 0.5, 0.7, and 0.9 and at tem- peratures of O“, lo:, 20°, 30°, and 40’ C. The shape factor of 0.7 1s about average for natural sediments.
The usefulness of shape factors is limited in routine sedimentation studies, for even if the sieve, nominal, and axis length diameters are known, the fall diameter may be determined more easily and accurately through fall velocity data than by the shape factor. In summary, the factor of shape may be kept in proper perspec- tive by remembering that for smooth quartz spheres all four diameters, nominal, sieve, axis length, and fall are the same ; that the relative effect of shape varies with size; and that the effect of shape is more significant with sieve than with the sedimentation type of analyses, at least for the smaller sizes.
With respect to met’hods of particle-size anal- yses, the following distinction is made between a dispersed system and a stratified system as re- ported in (U.S. Inter-Agency Committee on Water Resources, Subcommittee on Sedimenta- tion, 1957b, p. 13) :
A diapereed system is one in which part&l- begin to settle from an initial uniform dispersion and in which particles of sedimentation sizes settle together. Size distribution may be determined by measuring the
6 TECHNIQUES OF WATER-RESOURCES INVESTIGATIONS
, - , -
) -
, -
v -
) -
4 -
d I I I I
Skl313Wllllv\I NI ‘kl3131”\ltfl~ WNIWON
--=I
LABORATORY THEORY AND METHODS FOR SEDIMENT ANALYSIS
concentration of sediment at given intervals of depth and settling time, as in the pipet method, or the distri- bution may be obtained from the quantity of sediment remaining in the suspension after various settling times, as in the bottom-withdrawal-tube method.
A atratified system is one in which the particles start falling from a common source and become stratified according to settling velocities, as in the visual-accumu- lation-tube method. At any given instant, the particles coming to rest at the bottom of the tube are of one sedimentation size only and are finer than the particles that have previously settled out and are coarser than those remaining in suspension * * *.
The size-gradation scale, or the distribution of the size classes, is a descriptive function which serves to place nomenclature and termi- nology on a uniform basis. A grade scale has been defined by Krumbein and I’ettijohn (1938, P- 76) “* * * as an arbit,rary division of a con- tinuous scale of sizes, such that each scale unit or grade may serve as a convenient class in- terval for conducting the analysis * * *.” In such a scale of sizes, it is recognized that a natural sediment has a continuous size distribu- tion without implication of natural grouping.
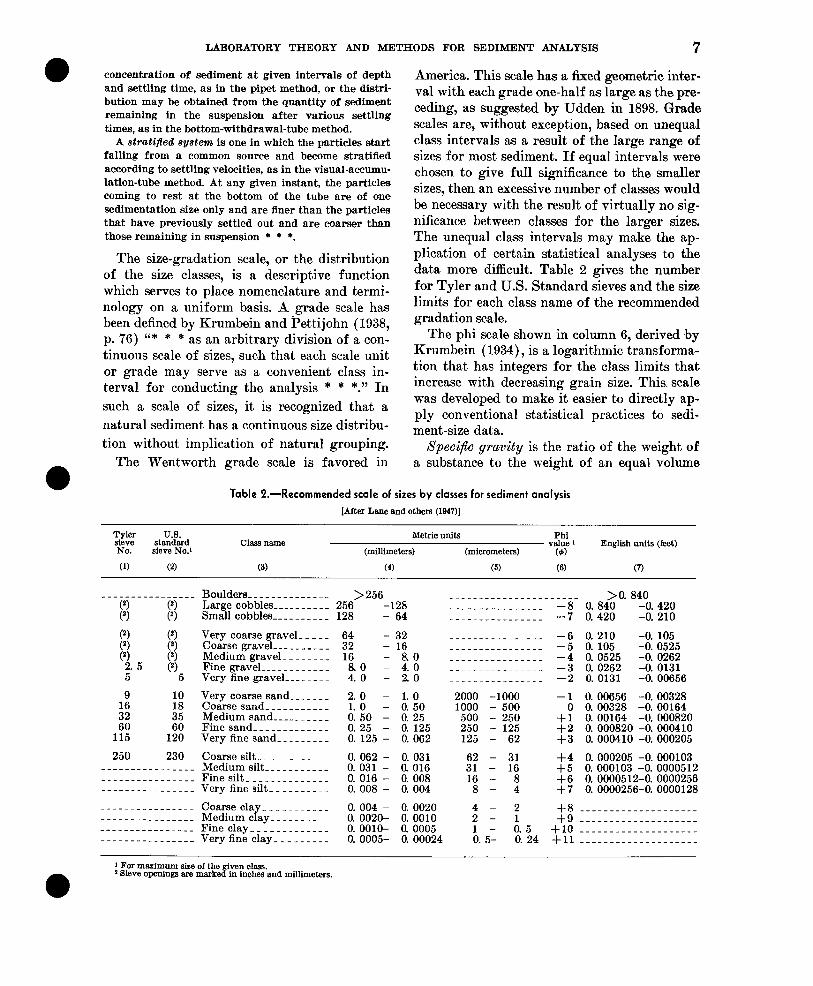
America. This scale has a fixed geometric inter- val with each grade one-half as large as the pre- ceding, as suggested by Udden in 1898. Grade scales are, without exception, based on unequal class intervals as a result of the large range of sizes for most sediment. If equal intervals were chosen to give full significance to the smaller sizes, then an excessive number of classes would be necessary with the result of virtually no sig- nificance between classes for the larger sizes. The unequal class intervals may make the ap- plication of certain statistical analyses to the data more difficult. Table 2 gives the number for Tyler and U.S. Standard sieves and the size limits for each class name of the recommended gradation scale.
The phi scale shown in column 6, derived by Krumbein (1934)) is a logarithmic transforma- tion that has integers for the class limits that increase with decreasing grain size. This. scale was developed to make it easier to directly ap- ply conventional statistical practices to sedi- ment-size data.
Specific gravity is the ratio of the weight of a substance to the weight of an equal volume
0
The Wentworth grade scale is favored in
Table I.-Recommended scale of sizes by classes for sediment analysis
[After Lane and others (1@47)]
zl% U.S. Metric units Phi standsrd Class n8me value ’
NO. sieve No.1 (millimeters) (micrometers) (4) English units (feet)
(0 (2) (3) (4) (5) (6) (7)
Boulders---- _-_ __ __ _ __ Large cobbles ________ __ Small cobbles--- - _ _ _ _ _
Very coarse gravel- - _ _ _ Coarse gravel __________ Medium gravel-------- Fine gravel ______ -_-___ Very fine gravel--------
Very coarse sand-- ____ Coarse sand _______ --__ Medium sand _____ _____ Fine sand---_---_----.. Very fine sand _________
Coarsesilt___-__-___-- Mediumsilt___-___--_- Fine silt- _________ -_-- Very fine silt.. - _ _ ____ - _
Coarse clay- _ _ _ _ _ _ __-_ Medium clay ________ -- Fine clay- _ _ _ _ ____ _ _- _ Very fine clay---------
>256 256 -128 128 - 64
64 - 32 32 - 16 16 - 8.0 8. 0 - 4.0 4. 0 - 2.0
2. 0 - 1.0
; 0:
80 I ; ;; 25 - 0: 125
0. 125 - 0. 062
0. 062 - 0. 031 0. 031 - 0. 016 0. 016 - 0. 008 0. 008 - 0. 004
0. 004 - 0. 0020 0. 0020- 0. 0010 0. OOlO- 0. 0005 0. 0005- 0. 00024
__--__---------_ __--_--___-----_
2000 -1000 1000 - 500 500 - 250 250 - 125 125 - 62
62 - 31 31 - 16 16 - 8 8- 4
; I 2
l- A5 0. 5- 6. 24
._____ >O. 840 -8 0.840 -0.420 -7 0.420 -0. 210
-6 0. 210 -0. 105 -5 0.105 -0. 0525 -4 0. 0525 -0. 0262 -3 0. 0262 -0. 0131 -2 0. 0131 -0. 00656
-1 0. 00656 -0. 00328 0 0. 00328 -0. 00164
+l 0. 00164 -0. 000820 +2 0. 000820 -0. 000410 +3 0. 000410 -0. 000205
+4 0. 000205 -0. 000103 +5 0. 000103 -0. 0000512 +6 0. 0000512-O. 0000256 +7 0. 0000256-O. 0000128
+8 _____ ________---_-__ +9 --------____________
+10 --------____________ +11 --------___________-
1 For marimum size of the iven class.
0
* Sieve openings are marke di in inches and millimeters.
8 TECHNIQUES OF WATER-RESOURCES INVESTIGATIONS
of water at 4°C. The measurement is then dimensionless. It should not be confused with specific weight which is defined as the weight per unit volume ; for example, water has a spe- cific weight of 62.4 pounds per cubic foot and a specific gravity of 1.0.
Theory of particles Falling in a Fluid
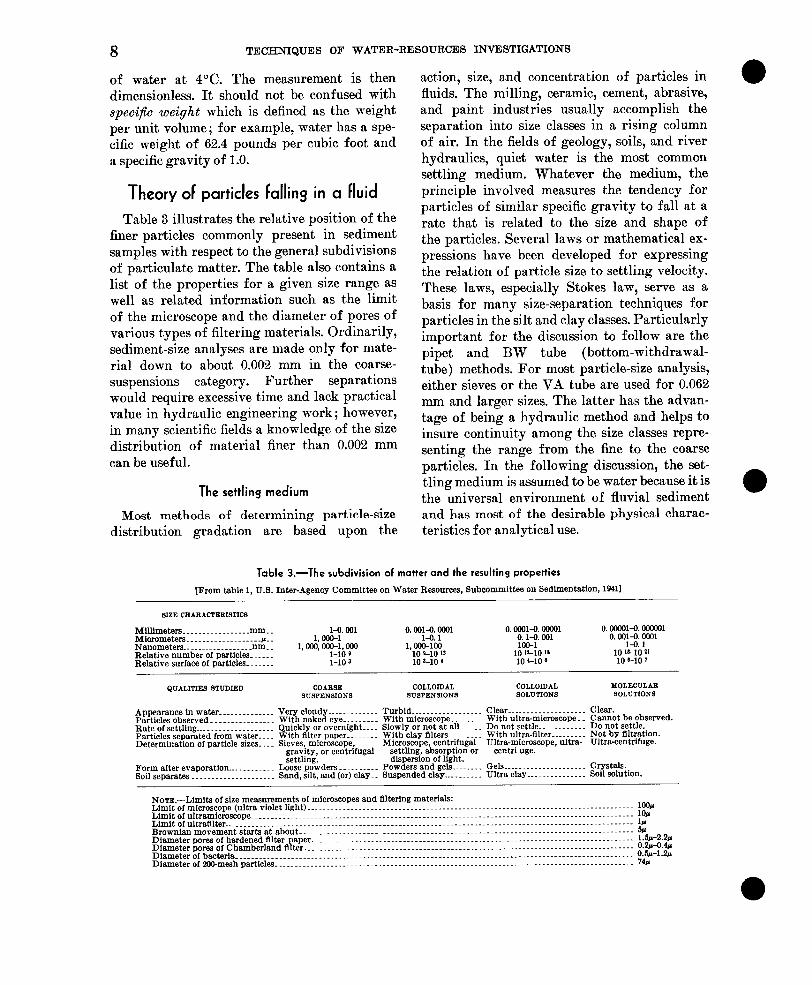
Table 3 illustrates the relative position of the finer particles commonly presem in sediment samples with respect to the general subdivisions of particulate matter. The table also contains a list of the properties for a given size range as well as related information such as the limit of the microscope and the diameter of pores of various types of filtering materials. Ordinarily, sediment-size analyses are made only for mate- rial down to about 0.002 mm in the coarse- suspensions category. Further separations would require excessive time and lack practical value in hydraulic engineering work ; however, in many scientific fields a knowledge of the size distribution of material finer than 0.002 mm can be useful.
The settling medium
Most methods of determining particle-size distribution gradation are based upon the
action, size, and concentration of particles in fluids. The milling, ceramic, cement, abrasive, and paint industries usually accomplish the separation into size classes in a rising column of air. In the fields of geology, soils, and river hydraulics, quiet water is the most common settling medium. Whatever the medium, the principle involved measures the tendency for particles of similar specific gravity to fall at a rate that is related to the size and shape of the particles. Several laws or mathematical ex- pressions have been developed for expressing the relation of particle size to settling velocity. These laws, especially Stokes law, serve as a basis for many size-separation techniques for particles in the silt and clay classes. Particularly important for the discussion to follow are the pipet and BW tube (bottom-withdrawal- tube) methods. For most particle-size analysis, either sieves or the VA tube are used for 0.062 mm and larger sizes. The latter has the advan- tage of being a hydraulic method and helps to insure continuity among the size classes repre- senting the range from the fine to the coarse particles. In the following discussion, the set- tling medium is assumed tobe water because it is the universal environment of fluvial sediment and has most of the desirable physical charac- teristics for analytical use.
Table 3.-The subdivision of matter and the resulting properties
[From table 1, U.S. Inter-Agency Committee on Water Resources, Subcommittee on Sedimentation, 18411
SIZE CB*B*cTERISTICs
Millimeters...............--mm.. Micrometers................s----~-- Nanometers _____...._________ urn.. Relative number of particles-. . _ _ . Relative surface of particles _.__.__
l-o. 001 0. ooGu1-0. OKKHJl 1, ooo-1 O. “E: Y”’ O. ??p:z: E
1, ooo, oKl-1,c0o 1, GOO-100 loo-l O. “Et Y”’
:I:; : 10 e10 ‘* 10 1110 ‘8 10 lb10 2’ 10 s-10 1 10 LlO 8 10 LlO ’
QUALITIES STUDIED COARSE COLLOIDAL COLLOIDAL MOLECULAR s”SPENsIONs S”SPENSION8 SOLUTIONS eOL”TIONs
Appearance in water __... ..____._. Particles observed- _._________... Rate of settllng _.______..__._..__._ Particles separated from water-. _ Determination of particle sizes- _ _ _
Form after evaporation... _ _ _ _ _ _ _. Soil separate.7 .._________.....__.__
Very cloudy ___._________ With naked eye ._____... Quickly or overnight.. _ _ With filter p8per.. .__
Sand, silt, and (or) clay. _
Turbid ___.__ . _ . _ __ __ __ _ Clear _.__________._.___._ With microscope... .__.. With ultra-microscope.. Slowly or not at all...... Do not settle ._..____..._ With clay fllters . . . . . ..__ With ultra-5lter . .._ _.._. Microscope, centrlfugsl Ultra-microscope, ultra-
settling, absorption or dispersion of light.
Powders and gels _..._ ___ Suspended clay ..___.....
centri uge.
Gels _ _ _. _ _ _ _ _ _ _ _ Ultra clay . . .._______..._
NOTE.-Limits of size measurements of microscopes and filtering materials: Limit of microscope (ultra violet light) . . . .._._.___........._..._____...______._....~.~.~~~..~......~..~.~.~.~~~~~.~~.... loOr Limit of ultramicroscope . ..__.____._..._.___.~.~~~....._._____..._._._______....._.~..~....______________..._____...~~~~ 10~ Limitofultraftlter.......------..----.-.-.-.-.-.....-----.-.....-----.-.-...-.--.-.-..-.....---...-.-..-..-----.--.---..- llr Brownian movement starts at about __..___ _ ______.___.. _____.___..._______.....-.-.-.-----.-. .______._._..____.._.---- C Diameter pores of hardened filter paper-. _. .._... _____. _....__________..._.-...------.-.-..-.-.---.......---.-...-.-...- 1.5r-2.2~1 Diameter pores ofCh8mberland fllter......................---.-----------------------..-.----..---.-------.-.---.-.-. O.ZvO.+ Diameterofbacteris.....-......----.-.--------.....-------~-~..--..-----.--------------.~.-.------~--.-----.-.-.~--.--- 0.5r-1.2~ Diameter of 2CGmesh particles __._...___________...-.-------.....-.-.---.-----.-.---.-.-.-...-.-----.-.....-..-.-...---- 74~
LABORATORY THEORY AND METHODS FOR SEDIMENT ANALYSIS 9
Stokes law for small particles
The nature of particle movement in a settling medium depends on a balance of the accelerat- ing and retarding forces which, in turn, depend on the size, shape, and density of the particle and the viscosity and (or) turbulence induced in the fluid. The resistance to motion can be any one of three types of drag (Rouse, 1938; U.S. Inter-Agency Committee on Water Re- sources, Subcommittee on Sedimentation, 1941, p. 24):(l) deformation, (2) surface, or (3) form, depending on the interrelation of the character- istics of the particle and fluid. The deformation drag is the resistance due entirely to the vis- cosity of the fluid as the relative movement of the fluid extends a considerable distance away from the particle. Stokes law expresses the viscous fall of particles under such conditions, usually for- quartz sediment particles finer than 0.062 mm. If the fall velocity of a particle is somewhat faster than that normal for the Stokes law range, then the inertial effects of the fluid reduce the viscous influence to a thin layer around the particle which produces the effect of surface drag. For the larger sizes of particles, the inertial effects of the fluid become in- creasingly important in the flow around a par- ticle, and therefore the form type of resistance dominates. Such flow causes a wake or low pressure area behind the particle, and eddies are formed; the net result is a force opposing motion.
Stokes law, as developed in 1851, states that the viscous resistance to fall of a particle in a fluid is equal to the net downward force of the particles. Remembering t,hat the net downward force is the force of gravity on the spherical particle minus the buoyant force of the liquid, or
413 (r$ Psd -4/3 CT? P/d,
then these forces can be stated as
where r=radius of sphere in centimeters, cc=dynamic viscosity of the fluid in dyne-
seconds per centimeter, v=velocity of fall in centimeters per
second,
g=acceleration due to gravity (980 centi- meters per second,
pJ=density of sphere in grams per centi- meter,
p,=density of fluid in grams per centi- meter.
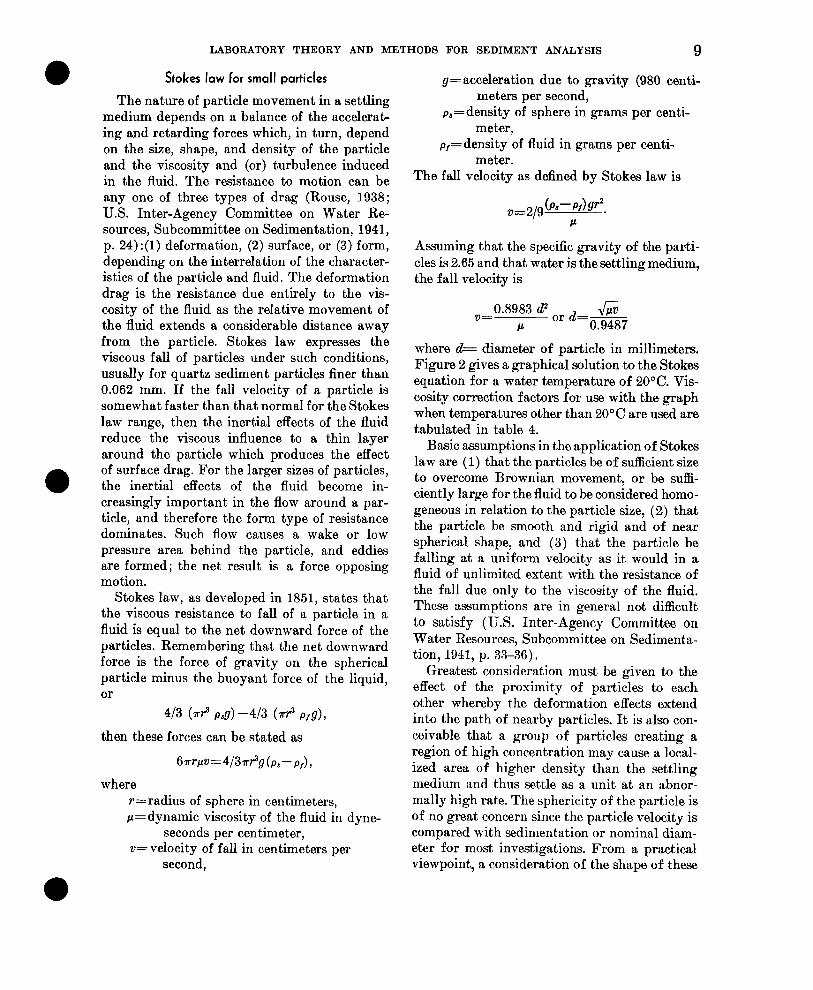
The fall velocity as defined by Stokes law is
Assuming that the specific gravity of the parti- cles is 2.65 and that water is the settling medium, the fall velocity is
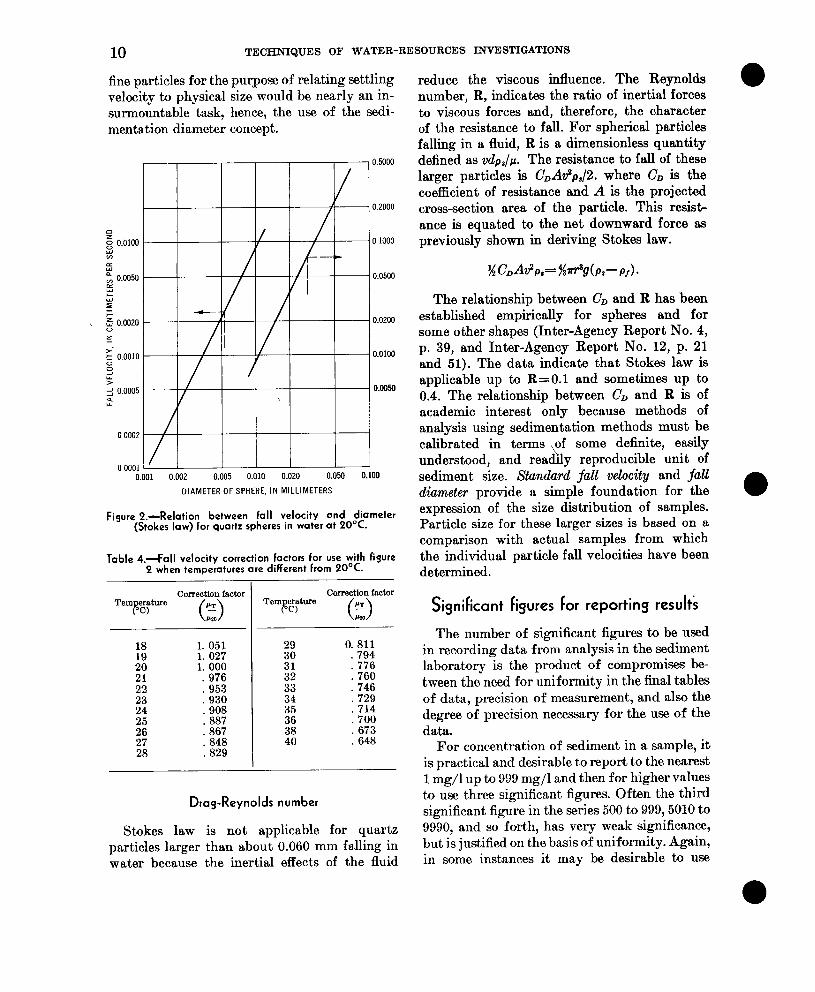
0.8983 d2 v= Jz P Or d=0.9487
where &= diameter of particle in millimeters. Figure 2 gives a graphical solution to the Stokes equation for a water temperature of 20°C. Vis- cosity correction factors for use with the graph when temperatures other than 20% are used are tabulated in table 4.
Basic assumptions in the application of Stokes law are (1) that the particles be of sufficient size to overcome Brownian movement, or be suffi- ciently large for the fluid to be considered homo- geneous in relation to the particle size, (2) that the particle be smooth and rigid and of near spherical shape, and (3) that the particle be falling at a uniform velocity as it would in a fluid of unlimited extent with the resistance of the fall due only to the viscosity of the fluid. These assumptions are in general not difficult to satisfy (U.S. Inter-Agency Committee on Water Resources, Subcommittee on Sedimenta- tion, 1941, p. 33-36).
Greatest consideration must be given to the effect of the proximity of particles to each other whereby the deformation effects extend into the path of nearby particles. It is also con- ceivable that a group of particles creating a region of high concentration may cause a local- ized area of higher density than the settling medium and thus settle as a unit at an abnor- mally high rate. The sphericity of the particle is of no great concern since the particle velocity is compared with sedimentation or nominal diam- eter for most investigations. From a practical viewpoint, a consideration of the shape of these
10 TECHNIQUES OF WATER-RESOURCES INVESTIGATIONS
fine particles for the purpose of relating settling velocity to physical size would be nearly an in- surmountable task, hence, the use of the sedi- mentation diameter concept.
0.5000
0.2000
s 0 0 1000 %i
0.0100
k-5 “, 0.0050 0.0500 z Li 5 + 2 0.0020 0.0200
5 z- 0.0010 0.0100 ” s 9 y 0.0005 0.0050 2
0 0002
0 0001 0.001 0.002 0.005 0.010 0.020 0.050 0.100
DIAMETER OF SPHERE, IN MILLIMETERS
Figure I.-Relation between fall velocity ond diameter (Stokes law) for quartz spheres in water at 20°C.
Table 4.-Fall velocity correction factors for use with figure 2 when temperatures are different from 2O’C.
18 18 1. 1. 051 051 I 29 29 0. 811 0. 811 19 E
1. 027 30 30
. 794
;: 1. 1. 027 000
21 1. . 976 000 . 976 ZB ZB . 794 776 776 . 760 . 760
22 22 . 953 . 953 33 33 . 746 . 746
E: E: . 930 . . 930 908 34 34 . 729
. 908 I 35 . .714 729 .714
f l f l . . 867 887 . . 867 887 36 38 i5 38 . 700 . . 700 673 . 673
27 27 . 848 . 848 40 40 . 648 . 648 28 28 .829 .829
Correction fwtm correction factor Correction factor Correction factor TemFcture TemFcture 0 PT - 0 PT - Temy;ture Temy;ture
cm cm 0 BT - 0 BT -
PlD PlD
Drag-Reynolds number Drag-Reynolds number
Stokes law is not applicable for quartz Stokes law is not applicable for quartz particles larger than about 0.060 mm falling in particles larger than about 0.060 mm falling in water because the inertial effects of the fluid water because the inertial effects of the fluid
reduce the viscous influence. The Reynolds number, R, indicates the ratio of inertial forces to viscous forces and, therefore, the character of the resistance to fall. For spherical particles falling in a fluid, R is a dimensionless quantity defined as vdpJp. The resistance to fall of these larger particles is CDA8p,/2. where CD is the coefficient of resistance and A is the projected cross-section area of the particle. This resist- ance is equated to the net downward force as previously shown in deriving Stokes law.
% Cdtip,= %+dp,- P,).
The relationship between CD and R has been established empirically for spheres and for some other shapes (Inter-Agency Report No. 4, p. 39, and Inter-Agency Report No. 12, p. 21 and 51). The data indicate that Stokes law is applicable up to R=O. 1 and sometimes up to 0.4. The relationship between CD and R is of academic interest only because methods of analysis using sedimentation methods must be calibrated in terms \pf some definite, easily understood, and readily reproducible unit of sediment size. Standard fall velocity and fall diameter provide a simple foundation for the expression of the size distribution of samples. Particle size for these larger sizes is based on a comparison with actual samples from which the individual particle fall velocities have been determined.
Significant Figures For reporting result;
The number of significant figures to be used in recording data from analysis in the sediment laboratory is the product of compromises be- tween the need for uniformity in the final tables of data, precision of measurement, and also the degree of precision necessary for the use of the data.
For concentration of sediment in a sample, it is practical and desirable to report to the nearest 1 mg/l up to 999 mg/l and then for higher values to use three significant figures. Often the third significant figure in the series 500 to 999,501O to 9990, and so forth, has very weak significance, but is justified on the basis of uniformity. Again, in some instances it may be desirable to usz
LABORATORY THEORY AND METHODS FOR SEDIMENT ANALYSIS 11
the nearest 0.1 mg/l up to 9.9 mg/l, especially between 0.1 and 0.9 mg/l. These recommenda- tions are based on the assumption t-hat the net sediment can be weighed to the nearest 0.0001 g and the water-sediment mixture can be weighed to the nearest 1 g.
With respect to size gradation, the goal should be to publish the percentage of material in each fraction to the nearest whole percent. In some analyses, where fractions may contain 2 percent or less, it may be useful to report to the nearest 0.1 percent. Whenever practicable, the net quantity of sediment in a given fraction should be weighed to the nearest three signifi- cant figures. With balances weighing to the near- est 0.0001 g, the significant figures must be re- duced to two when the quantity is less than 0.0100 g.
Procedure for Determining
Suspended-Sediment Concentration
‘The best methods for making determinations of concentrations and particle-size distributions from suspended-sediment samples must be se- lected from numerous possible procedures. The samples may contain only minute quantities of sediment of very small particle size or may con- tain large quantities of sediment with a wide range of particle size. Samples with such ex- tremes usually require the use of special pro- cedures. Samples for particle-size analysis al- ways require special processing and computa- tional procedures to insure the determination of the concentration as well as the particle-size dis- tribution with only one drying of the sediment.
Each of the several methods for determining concentration has advantages and disadvan- tages. The two most commonly used methods are evaporation and filtration. The filtration method may be somewha,t faster than the evap- oration method for samples of low concentra- tion. However, larger quantities of sediment tend to clog the filters and inhibit the use of this method for the higher concentrations. The evap- oration method requires an adjustment for dis- solved solids if the dissolved solids content is high, especially for samples having low sedi-
ment concentration. Thus, the filtration method may best be used on samples ranging up to about 10,000 mgJ1 of sediment that is mostly sand and about 200 mg/l of sediment that is mostly clay. The evaporation method may be best used when the concentration is more than these limits.
Evaporation method
The evaporation method consists of allowing the sediment to settle to the bottom of the sam- ple bottle, decanting the supernatant liquid, washing the sediment into an evaporating dish, and drying it in an oven. The main advantage of the method over the filtration method is the simplicity of equipment and technique. The method works well if the sediment readily set- tles to the bottom of the sample container be- cause of its coarseness or because of the natural flocculation of the suspended clay. Conversely, with suspensions of naturally dispersed clay, the settling time may make the method imprac- tical unless special procedures are used.
NOTE A.-Special procedures to handle unsettled sam- ples involve the use of (1) a filter tube, in which case, it may be just as easy to adopt the complete filtration method, or (2) a flocculating additive to reduce the settling time. In the Erst procedure, the sample is al- lowed to #settle as much as practical and then, by use of a Berkefeld Elter tube (or a similar device) and a vacuum apparatus, most of the native water is removed from each bottle. The sediment in suspension adheres to the outside of the filter tube and the water passes through the walls. The materia1 on the outside of the tube is removed by back flushing with native water from the sample and can be treated in the same man- ner as the dissolved solids content.
A second special procedure is to use a Eocculating agent to reduce the settling time of ‘the naturally dispersed clays. This method will require the use of a correction factor to ,be applied to the weight of dried sediment. Such a factor is likely to ,be more of an esti- mate ‘than an exact value because of the difficulty in determining the amount of flocculant incorporated in the Enal weight and the amount of dissolved ma- terial precipitated. Hence, a flocculant should not be used unless necessary and then only a minimum amount. As the samples decrease in concentration, the opportunity for significant error increases because of the estimated correction. Dilute HCl or C?aC% are the flocculants commonly used. The one most effective will depend on the nature of the sediment and the dissolved minerals in the water. Extreme care is necessary in
12 TECIUXIQUES OF WATER-RESOURCES INVEX3TIGATIONS
using either dilute HCl or CaCL as a flocculant. Carbon- a,t,e minerals are readily decomposed in acid 80htiOUS
and many other minerals are slightly soluble in weak acid solutions; therefore, the use of hydrochloric acid is not recommended. ‘Calcium chloride is highly hy- groscopic; therefore, if the sample has been treated with calcium chloride, the use of closed weighing b&- tles is recommended instead of open evaporating dishes for the determination of concentration.
The supernatant liquid is carefully decanted from the sample so that the sediment in the bottom of the container will not be disturbed nor removed. A small quantity of the super- natant liquid is therefore left with the sedi- ment. A specified amount of such liquid should be left with each sample, usually about 20 to 50-~2 ml (milliliters). This specified amount is especially significant if a correction for dis- solved solids is necessary. Distilled water is used to wash the sediment and remaining liquid into the evaporating dish. The contents of the dish are then dried in an oven at a temperature that is slightly below the boiling point. If the boiling point is reached, then sediment may be lost from the dish. After all visible moisture has evaporated, the temperature should be raised to llO°C for at least 1 hour.
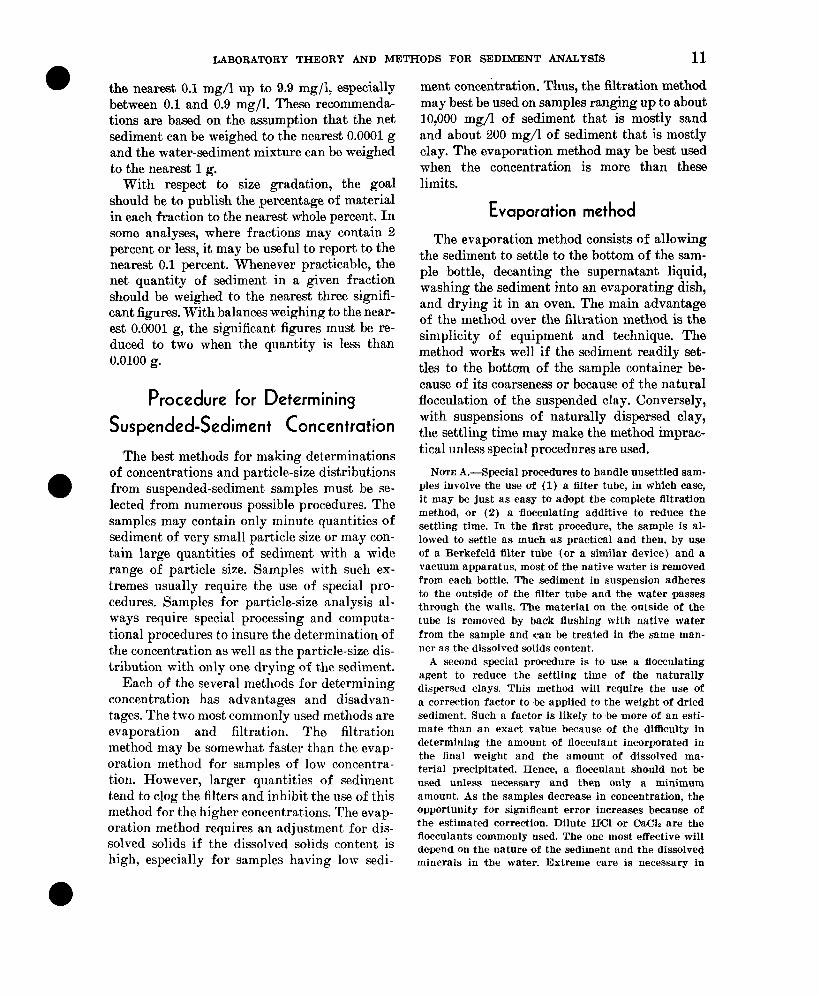
The weight of natural dissolved solids in the supernatant water is included in the weight of dry material obtained by the evaporation method and must be subtracted to determine the weight of sediment. The following may be used as a guide to determine if a correction for the weight of the dissolved solids is necessary. A 5 percent or more improvement in the results of the sediment determination will be realized when the dissolved solids concentration is equal to or greater than the sediment concentration, assuming that an aliquot of 20 ml of native water is used in the evaporation, and that 400 g of water-sediment mixture is contained in the original sample. For example, a dissolved-solids correction should be made when the dissolved solids concentration is 200 mg/l or higher and t,he sediment content is 200 mg/I or less. Similarly, a 2 percent improvement will result if the dissolved solids concentration is 40 per- cent or more of the sediment concentration. The weight of the dissolved-solids correction for dif- ferent aliquots and a range of concentrations can be obtained from figure 3.
0.1000
0.0500
0.0200
O.OloLl
0.0050
0.0020
0.0010
0.0005
O.WO.2 10 20 50 loo 200 5w lwa 2ow 5wo 10,ooo
DISSOLVED SOLIDS CONCENTRATION. IN MILLIGRAMS PER LITER
Figure 3.-Weight of dissolved solids for Qiven size of aliquot and given concentration.
Filtration method
The filtration method for the determination of suspended-sediment concentration has ob- vious advantages over the evaporation method and should be used whenever it is practical to do so. The method usually utilizes a Gooch crucible in conjunction with various types of filter material. The Gooch crucible is a small porcelain cup of approximately 25 ml capacity with a perforated bottom. The crucible is easily adapted to an aspirator system and vacuum filtration ; it is lighter in weight and consumes less oven and desiccator space than the eva- porating dishes; its tare weight is less likely to change during the weighing because less sur- face is exposed to sorption by moisture ; and dissolved material passes through the crucibles and thus eliminates the need for a dissolved- sohds correction.
In most laboratories the Corning # 32960 Pyrex fritted glass crucible and glass-fiber filter disks, # 934-AH or similar specifications, have proven satisfactory for filtration of most types of sediment samples. These filter disks show no weight loss during filtration, save considerable preparation time, result in more uniform filtra- tion, and make cleaning of the crucible easier than do other types of filters. However, the filter disks become clogged rather rapidly when some types of fine sediment are filtered. 1-
0

LABORATORY THEORY AND METHODS FOR SEDIMXNT ANALYSIS 13
Better filtration results have been obtained for these fine-grained sediment samples by using a glass-fiber filter disk in conjunction with an asbestos mat. The crucible with this extra asbestos mat is prepared by placing the glass- fiber filter disk in the crucible while vacuum is applied and then pouring an asbestos slurry on top of the disk also while vacuum is applied. (See the next paragraph ‘concerning the prep- aration of asbestos mats.) During the filtration process, the somewhat coarse asbestos mat re- tains much of the sediment that would ordi- narily clog the glass-fiber disk. The glass-fiber disk prevents loss of asbestos or loss of very fine sediment that would pass through the as- bestos mat. This filter is recommended if inac- curacy or inconvenience results from the use of a single type of filter because little additional time is required for the preparation of the dou- ble glass-fiber asbestos-type filter.
If glass-fiber filters are not available, asbestos is considered satisfactory because of its inert- ness, resistance to heat, and low hygroscopicity. The asbestos filter mats can be prepared in two ways. The simplest and most convenient way is to prepare a slurry of shredded asbestos and distilled water, and pour a small volume of this slurry into the crucible while vacuum is applied. A uniform mat of asbestos is thus formed in the bottom of the crucible. The mat should be rinsed with distilled water while vacuum is still applied ; the crucible is then oven dried, cooled in a desiccator, and the tare weight determined. Another method for prep- aration of the asbestos mat is to place a small portion of loose, uniform asbestos on the bottom of the crucible, and wet the asbestos with dis- tilled water while vacuum is applied.
If the sediment sample contains extremely fine material, an actual loss of fine material through the filter may result in a turbid filtrate. This problem is treated in one of three ways: (1) add a known quantity of an adsorbing agent, such as activated carbon, which adsorbs the colloids as a result of the difference in elec- tric charges, (2) impregnate the filter with sediment and then re-filter the filtrate, or (3) use a flocculating agent of the acid or salt type. In addition to preventing loss through the filter,
the adsorbing agent should reduce the settling time and prevent the rapid clogging of the filter. The main advantage of the adsorbing agent over the use of the flocculating agent is that a precise correction, instead of an estimated correction, can be made for the amount retained on the filter. Acids or salts are not usually recommended because undesirable reactions with the sediment are likely to occur. As already mentioned, the use of a fiber-glass filter disk in conjunction with an asbestos mat will eliminate most filter problems.
Sometimes it is possible to utilize another advantage of the filtration over the evaporation method when the concentration or the amount of sediment is small. Specifically, preparation time can be saved by using the same mat two or more times. When the crucible and mat are re- used, the gross weight of the prior use becomes the tare weight for the new use.
Laboratory forms
Figures 4,5, and 6 show forms used in record- ing data and making computations for deter- mination of suspended-sediment concentration. These forms (SedimRnt Concentration Notes, Depth Integrated Smples [Short form]; Sedi- ment Ctientration Notes, Depth Integrated Samples [ Comp+e?wn&ve f mm] ; Sediment Concentration Notes, Point Integrated Sm- pies) provide an orderly means of recording the sample information, the necessary weights, and the results of computations for the concentra- ,tion of the sample. On the Short form for depth integrated samples (fig. 4)) space is provided for 20 bottles or samples; the other two forms provide for only 10. The forms serve as a record of samples collected for each sampling site. Each bottle should be recorded in the chronological order of sampling at ,the time of sample weigh- ing. Appropriate notes can be made on the form if one or more samples are later with- drawn or particle-size analysis or wmposited for concentration. If more space is needed for remarks, reference by number should be made to the back of the sheet ; or, expanded notes can be retained on the front by using space ordinarily used for other bottles.

TECHNIQUES OF WATER-RESOURCES INVESTIGATIONS
-
1
- : P L1 r II4 -
LL IN3
JO lH313M
IW JO
H31: - 1


16 TECHNIQUES OF WATER-RESOURCES INVESTIGATIONS
c
1 -
-
-
-
-
i
P ;
.y
5 a 3
-
-
-
-
-
-
z 5 0 p :
-
1
-
-
-
k s ti d
-
t i
M .g
fi
I-
d
0
lN3W tax JO
lH913M
3ldWt’ JO
lH913A
LABORATORY THEORY AND METHODS FOR SEDIMENT ANALYSIS
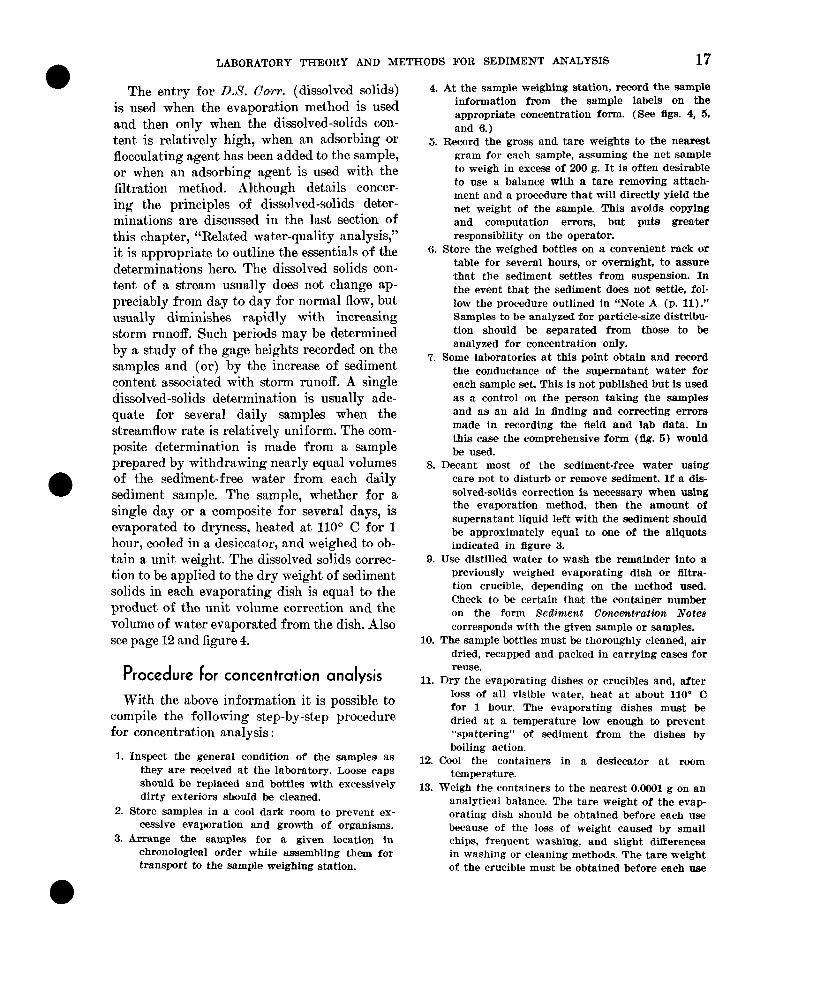
The entrv for D.S. Cow. (dissolved solids) Y
is used when the evaporation method is used and then only when the dissolved-solids con- tent is relatively high, when an adsorbing or flocculating agent has been added to the sample, or when an adsorbing agent is used with the fikration method. Allthough details concer- ing the principles of dissolved-solids deter- minations are discussed in the last section of this chapter, “Related water-quality analysis,” it is appropriate to outline the essentials of the determinations here. The dissolved solids con- tent of a stream usually does not change ap- preciably from day to day for normal flow, but usually diminishes rapidly with increasing storm runoff. Such periods may be determined by a study of the gage heights recorded on the samples and (or) by the increase of sediment content associated with storm runoff. A single dissolved-solids determination is usually ade- quate for several daily samples when the streamflow rate is relatively uniform. The com- posite determination is made from a sample prepared by withdrawing nearly equal volumes ,of the sediment-free water from each daily sediment sample. The sample, whether for a single day or a composite for several days, is evaporated to dryness, heated at 110” C for 1 hour, cooled in a desiccator, and weighed to ob- tain a unit weight. The dissolved solids correc- tion to be applied to the dry weight of sediment solids in each evaporating dish is equal to the product of the unit volume correction and the volume of water evaporated from the dish. Also see page 12 and figure 4.
17
4. At the sample weighing station, record the sample information from the sample labels on the appropriate concentration form. (See figs. 4, 5, and 6.)
Procedure for concentration analysis
With the above information it is possible to compile the following step-by-step procedure for concentration analysis :
1. Inspect the general condition of the samples as they are received at the laboratory. Loose caps should be replaced and bottles with excessively dirty exteriors should be cleaned.
2. Store samples in a cool dark room to prevent ex- cessive evaporation and growth of organisms.
3. Arrange the samples for a given location in chronological order while assembling them for transport to the sample weighing station.
5. Record the gross and tare weights to the nearest gram for each sample, assuming the net sample to weigh in exe- of 200 g. It is often desirable to use a balance with a tare removing attach- ment and a procedure that will directly yield the net weight of the sample. This avoids copying and computation errors, but puts greater responsibility on the operator.
6. Store the weighed bottles on a convenient rack or table for several hours, or overnight, to assure ,that the sediment settles from suspension. In the event that the sediment does not settle, fol- low the procedure outlined in “Note A (p. ll).” Samples to be analyzed for particle-size distribu- tion should be separated from those to be analyzed for concentration only.
7. Some laboratories at this point obtain and record the conductance of the supernatant water for each sample set. This is not published but is used as a control on the person taking the samples and as an aid in finding and correcting errors made in recording the field and lab data. In this case the comprehensive form (ilg. 5) would be used.
8. Decant most of the sediment-free water using care not to disturb or remove sediment. If a dis- solved-solids correction is necessary when using the evaporation method, then the amount of supernatant liquid left with the s&ment should be approximately equal to one of the aliquots indicated in ilgure 3.
9. Use distilled water to wash the remainder into a previously weighed evaporating dish or illtra- tion crucible, depending on the method used. Check to be certain that the container number on the form Sediment Gmmntration Notes corresponds with the giveu sample or samples.
10. The sample bottles must be thoroughly cleaned, air dried, recapped and packed in carrying cases for reuse.
11. Dry the evaporating dishes or crucibles and, after loss of all visible water, heat at about 110” C for 1 hour. The evaporating dishes must be dried at a temperature low enough to prevent “spattering” of sediment from the dishes by boiling action.
12. Cool the containers in a desiccator at room temperature.
13. Weigh the containers to the nearest 0.6661 g on an analytical balance. The tare weight of the evap- orating dish should be obtained before each use because of the loss of weight caused by small chips, frequent washing, and slight differences in washing or cleaning methods. The tare weight of the crucible must be obtained before each use
18 TECHNIQUES OF WATER-RESOURCES INVESTIGATIONS
because of differences in weights of the tlltering mats, especially when the asbestos mats are used. If sediment concentrations are greater than 1,660 mg/l, then it may not be necessary to obtain a new tare weight each time a crucible with a glass-fiber filter mat is used.
14. Compute the net weight of sediment in the container and deduct, if necessary, the dissolved-solid cor- rection.
15. Compute the concentration of the sample in parts per million determined on the basis of one mil- Ron times the ratio of the net weight of sedi- ment to the net weight of the water-sediment mix- ture. The computed parts per million can then be expressed in the common units of milligrams per liter by application of the conversion factor given in table 1. It is convenient to make the conversion from parts per million to milligrams per liter when the data are transferred from the form Sediment Conce~~tration Notes to other uses. Usu- ally concentrations are less than 16,660 parts per million in which case parts per million equals milligrams per liter. However, when the concen- tration does exceed 16,066 ppm the appropriate conversion factor should be penciled plainly below the concentration on the form as a reminder to the data user that milligrams per liter is dlf- ferent from parts per million.
Determination of Particle-Size
Distribution of Suspended Sediments
Complete definition of the variations of par- ticle-size distrilbution for a stream throughout the ranges of discharge and with time is pres- ently not economically feasible. It is feasible, however, to analyze a sufficient number of sam- ples to provide representative data for a range of the many conditions occurring throughout the year.
Particle-size data have many uses. One use is to compute the probable specific weight of sedi- ment as it will deposit in reservoirs. This com- putation requires plotting the median particle size against sediment load in tons per day. In- formation concerning the behavior of sediment particles in different environments may be studied and, therefore, requires analyses for particle-size distribution of fine particles in both native and dispersed settling media. The size distribution of both suspended and bed ma- terial has an important use in the computations of total (measured plus unmeasured) sediment discharge. The frequency and kind of particle-
size analyses should be adequate to descrisbe the pertinent characteristics of sediment particles so that satisfactory comparisons can be made be- tween sediments collected from different places or from the same place at different times.
Recommended Frequency OF analyses
The following recommendations are for the determinations of ultimat,e sizes by use of a dis- tilled-water settling medium and a chemical dis- persant for the silt and clay fractions. The rec- ommended frequency of native-water analysis is discussed in the section “Native water settling medium” in respect to the theories, problems, and methods of such analysis. Each sample should be depth integrated and represent the true size distribution in the cross section at the time of sampling. Thus, for most streams, sam- ples must be collected by the ETR (equal-tran- sit-rate) method or by sampling at an adequate number of the centroids of equal discharge. If the “daily” samples collected at one vertical near midstream are representative of the sediment characteristics in the entire cross section, the selection should normally ‘be adequate to cover a wide range of flow conditions.
Judgment concerning the selection of samples will be enhanced by a study of the conditions for which particle-size samples of past records for the given station were selected, if available; and (or) by a study of the sample information recorded on the form Sediment Con.cen.tratbn Notes (fig. 4) for the current water year. For many streams, information on sediment char- acteristics is usually lacking during the first year of sampling on a given stream ; therefore, some samples, particularly from high-stage flows, should be set aside to be analyzed at a later time either for particle size or concentration at the end of the water year when the facts are known concerning the range and other conditions of the year’s flow. These extra samples should, of course, be tightly sealed, tared and stored in a dark place.
Size analyses of suspended sediment for the so-called daily station should be made on a mini- mum of five or six samples per year if selected to represent various flow conditions and range of concentrations. Additional samples, up to a
LABORATORY THEORY AND METHODS FOR SEDIMENT ANALYSIS 19
maximum of about 30, may be desirable for new stations or to define the size distribution during unusually high runoff periods to represent a range of stream discharge or some of the unusual area1 patterns of runoff. The minimum number of samples may be reduced by necessity because of low runoff due to a prolonged drought or in the event of extremely low sediment concentration.
Particle-size analyses should be made on a minimum of one-fifth of the observations for stations operated on a periodic basis. The num- ber depends on the frequency of sampling, the stream conditions, and the projected use of the data. Whenever possible, a desirable number should be set as a guide at the time of program- ing for the station.
Computations of total sediment load (meas- ured plus unmeasured) require the use of particle-size distribution data of the suspended sediment included in the average concentration at the time of the observation. The above pro- grams for determining particle size must then include consideration of the desired times for the total load computations.
Method of analysis
Limitations
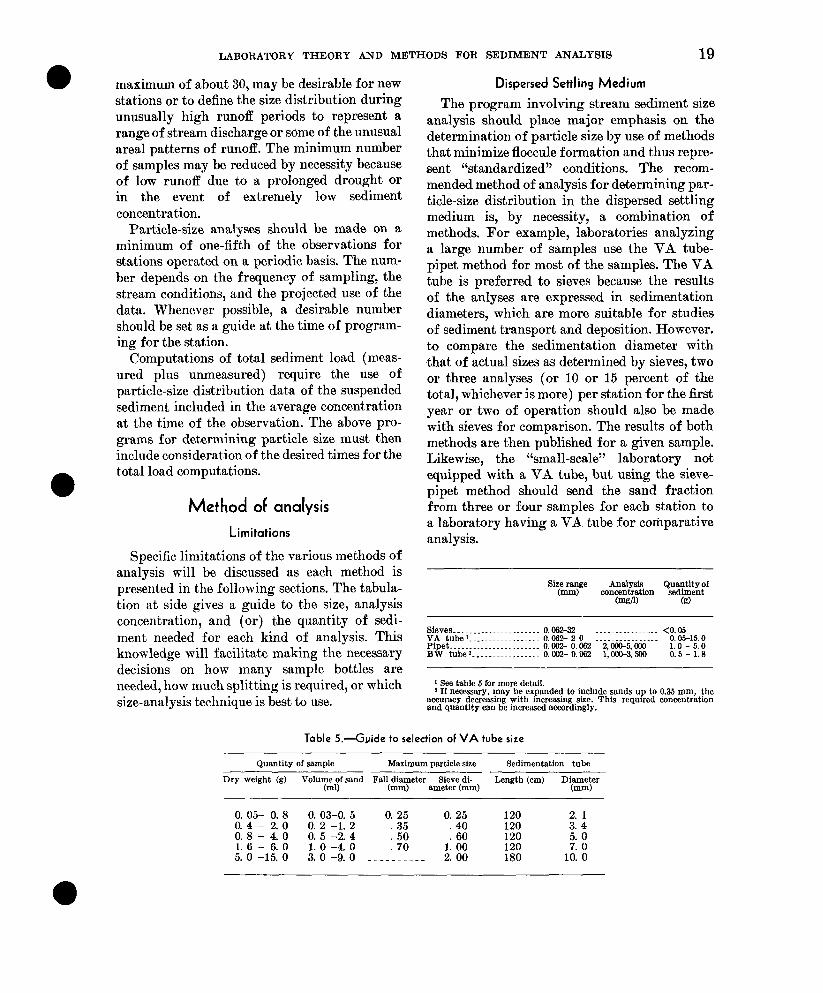
Specific limitations of the various methods of analysis will be discussed as each method is presented in the following sections. The tabula- tion at side gives a guide to the ‘size, analysis concentration, and (or) the quantity of sedi- ment needed for each kind of analysis. This knowledge will facilitate making the necessary decisions on how many sample bottles are needed, how much splitting is required, or which size-analysis technique is best to use.
Dispersed Settling Medium
The program involving stream sediment size analysis should place major emphasis on the determination of particle size by use of methods that minimize floccule formation and thus repre- sent “standardized” conditions. The recom- mended method of analysis for determining par- ticle-size distribution in the dispersed settling medium is, by necessity, a combination of methods. For example, laboratories analyzing a large number of samples use the VA tube- pipet method for most of the samples. The VA tube is preferred to sieves because the results of the anlyses are expressed in sedimentation diameters, which are more suitable for studies of sediment transport and deposition. However. to compare the sedimentation diameter with ,that of actual sizes as determined by sieves, two or three analyses (or 10 or 15 percent of the total, whichever is more) per station for the first year or two of operation should also be made with sieves for comparison. The results of both methods are then published for a given sample. Likewise, the “small-scale” laboratory not equipped with a VA tube, but using the sieve- pipet method should send the sand fraction from three or four samples for each station to a laboratory having a VA tube for comparative analysis.
Sieves ___._________.___.____ 0.062-32 ____._..____._._ <o. 05 VA tube ’ _.__......._._.__. 0.062- 2 0 ..__......_.____ 0.05-15.0
~~t~~~ei::::::::::::::::: 0.002- 0.00% 0.062 0.062 2 l:cm-~xm OW5 Ooo 1.0 0.6 - - 5.0 1.8
1 See table 5 for more detail. 2 If necessary, may be expanded to include sands up to 0.35 mm, the
accuracy decreasing with increasing size. This required concentration and quantity can be increased accordingly.
Table S.-Guide to selection of VA tube size
Quantity of sample Maximum particle size Sedimentation tube
Dry weight (g) Volume of sand Fall diameter Sieve di- m) (mm) ameter (mm)
Length (cm) “:=?
0. 05- 0. 8 0. 03-O. 5 0. 25 0. 25 120 2. 1 0. 4 - 2. 0 0. 2 -1. 2 35 .40 120 3. 4
0. 8 - 4. 0 0. 5 -2.4 . 50 120 1. 6 - 6. 0 1. 0 -4. 0 :Y
1: ti 120 E 5. 0 -15. 0 3.0-9.0 -___ 2. 00 180 10: 0
20 TECHNIQUES OF WATER-RESOURCES INVESTIGATIONS
Many laboratories must retain the use of the more time-consuming, and possibly less ac- curate, BW tube method because of an insuf- ficient quantity of sediment in most of the sampIes. Whenever possible, a sufficient quantity of sediment should be collected to permit analysis by the VA tube-pipet method. The in- creased time to obtain the additional material by accumulating more samples is usually more than compensated by the decreased time re- quired for analyses and computation.
The BW tube can theoretically define the sedimentation diameter for sands up to 0.350 mm, but the analysis is simplified considerably if all sand is removed by wet sieving leaving only the silt and clay sizes for analysis by the BW tube. Particles larger than 0.350 mm and preferably larger than 0.062 should be removed by wet sieving and analyzed by the sieve method if a VA tube is not available. (See section on “Sieving.“)
Other parts of this chapter give detailed procedures for making the analyses by various combinations of sieve and sedimentation meth- ods. For most stations, when the VA tube-pipet or the sieve-pipet methods are used, only the following size divisions need be determined: 0.002, 0.004, 0.016, 0.062, 0.125, 0.250, 0.500,1.00, and 2.00 mm. This is especially true when the median size is in the sand range. If the median size is in the silt range, then the 0.008 and 0.031 sizes should be determined. When samples are split for analyses, all the above sizes, including the 0.008 and 0.031 sizes, should be determined in both native water and a chemically-dispersed settling medium. If the BW tube method is used, additional sizes may be determined from the Oden curve with little additional effort.
Pipet analyses are made using either 500 or 1,000 ml of suspension with a suspension range of 2,000 to 5,000 mg/l. However, if sufficient sediment is not available to obtain a concen- tration of 2yOO0 mg/l for a 500 ml suspension, less than 500 ml can be used for the suspension. Though not recommended for general use, such abbreviated pipet analyses, in which only the 0.002, 0.004, and 0.016 mm determinations are made, can conveniently be performed using as little as 200 ml of suspension. By decreasing the volume of suspension and the number of
sizes determined, and ‘by using withdrawal depths of 5 or 3 cm (centimeters) or less, suf- ficiently accurate pipet analyses can be made using as little as 0.4 g of silt and clay. By reduc- ing the volume of suspension in this manner, pipet analyses can be made on samples contain- ing a small amount of sediment which other- wise would have to be analyzed by the more time-consuming and possibly less accurate BW tube method.
When samples contain some kinds of clay, considerable difficulty is encountered with the sieving, especially the initial separation of the fines from the sands, because it is not possible to obtain complete dispersion and cleaning of the sand particles. Treatment by ultrasonic meth- ods prior to sieving has been found helpful (Kravitz, 1966 ; Moston and Johnson, 1964). A device having a range of power settings, such as the Branson “Sonifier” model S-75 is recom- mended. The procedure using this device would require only that the “Sonifier” horn be sub- mersed in the water and sediment to a depth of 1 cm and operated for 3-5 minutes. The con- tents would then be immediately poured onto a 3-inch (7.5 cm) diameter sieve and the material on the sieve washed with a spray of distilled water. Silt and clay so treated will pass through the sieve without clogging it, and this proce- dure will reduce the amount of time and the quantity of water required for wet sieving. The ultrasonic treatment should not be used on sedi- ment to be analyzed in the nat,ive mater settling medium.
Native water settling medium
Prediction of the fall behavior of sediment particles in different environments is difficult because tihere are many types of fluvial sedi- ments being transported in media having a wide variation in kind and concent,ration of chemical constiuents. The incomplete understanding of the characteristics and behavior of small parti- cles, especially clay minerals, complicates the problem of predicting particle behavior. The problem is most acute in situations where clay and perhaps fine silt tend to form floccules in native water. Generally, if the native water is low in dissolved solids and (or) contains sodium as the dominant cation in solution, the fine parti-
LABORATORY THEORY AND METHODS FOR SEDIMENT ANALYSIS 21
cles will behave as discrete units. Many stream waters either are low in dissolved solids or con- tain considerable sodium, and therefore the problems under discussion have little applica- tion to mechanics of sediment transport within the flowing stream.
Use of settling methods for size analysis is based on the definition that the sedimentation diameter of a discrete particle is the diameter of a sphere having the same specific gravity and the same uniform terminal fall velocity as the given particle. Size analyses in which native water is the settling medium may violate this theory in two ways:
1. The particles in suspension loosely join to form masses in which both size and density are changing with time. Such masses fall faster than the component particles but, be- cause of their loose aggregation, fall slower than a quartz sphere of the same nominal diameter.
2. The floccules may be in the process of accre- tion while settling and therefore would have an increasing and accelerating veloc- ity rather than the constant terminal fall
L velocity.
In connection with item 1, a floccule would have a density between that of water and that of the discrete component particles. These large irregu- lar floccules probably are retarded by form drag in addition to a viscous drag. Thus, the settling velocity and, consequently, the sedimentation diameter for many particles in native water re- sult from complicated and probably indetermin- able factors.
In the absence of the disruptive forces of tur- bulence or shear, the stability of a suspension is mainly controlled by the magnitude of the elec- trokinetic or zeta potential associated with the individual particles. This potential can be de- fined as the potential between the layer of immobile ions adsorbed on the particle surface and the last mobile ion associated with the par- ticle. Most clay particles have a negative charge and migrate to the positive pole if placed be- tween two electrodes of unlike sign. The migra- tion velocity is proportional to ,the negative potential. The zeta potential is an important key to the properties of colloids. When this
potential is sufficiently high, particles will repel each other, but when lowered to a poirrt called the critical potential (by addition of an elec- trolyte or by a change in water characteristics), the electrical double layer associated with the particle collapses and the material flocculates.
In a natural stream, the stability of particles in #a water-sediment mixture is controlled by continuous ,turbulent motion as well as the zeta potential ; whereas, in the laboratory, the stability is controlled only by ,the zeta poten- tial. Information concerning the degree of floc- culation of sediment suspended in natural streamflow is thus lacking because the natural conditions cannot be simulated during size analysis in the laboratory.
Other variables that influence the amount of flocculation occurring with analyses of sedi- ment in native water settling media are (1) water characteristics in terms of the kind and concentration of dissolved constituents, (2) kind of clay mineral, (3) nature of ,the ions as- sociated with the particle before it entered the stream, and (4) concentration of the sediment in the analysis suspension. The complex inter- action and effects of ,these variables makes it obvious that data obtained by size analyses in native water is difficult to interpret and, there- fore, not easily applied to the solution of sedi- ment problems. The results of such analyses for some streams are found to ‘be highly variable depending on stage, season, or other factors; however, for other streams the results are rela- tively uniform, indicating a similar degree of flocculation under varying hydrologic condi- tions. In a like manner, samples from some streams show a marked difference in particle- size distribution determined in native water and dispersed media ; whereas, samples from other streams show little or no difference be- tween the two methods of analysis.
Native water size analyses are not necessary for some streams if it is apparent that floccula- tion is highly improbable throughout the dis- charge range. However, during the first 2 years of determining sediment transport at a site, it is desirable that about one-fifth as many analyses should be made using native water as using dis- tilled water. Thereafter, the number of native water size analyses can be greatly reduced un-
22 TECHNIQUES OF WATER-RESOURCES INVESTIGATIONS
less a significant change in the regimen of theriver is in progress .
Split portions of a sample should be usedwhen analyses are made in both native waterand in a dispersed settling medium . The collec-tion of "duplicate" samples and the analysis ofone sample in native water and the other sam-ple in a dispersed medium is not recommended.If two or more consecutive samples are neces-sary to obtain a sufficient quantity of sediment,they should be combined and then split. for eachtype of analysis. The pipet method is recom-mended for native water size analyses, using thedepths of withdrawal shown in table 6 . The con-centration of material finer than 0.062 mmshould be in the range of 2,000 to 0,000 mg/l .The 0.062 mm size should not be determined
by the pipet method in the native water mediaif this value can be determined either by theVA tube or sieve method . The reason for thisis that residual turbulence, caused by the prepa-ratory mixing prior to the first withdrawal,lasts throughout most of the theoretical settlingtime required for the 0.062 Him withdrawal ;in other words, trite terminal fall velocity isnot achieved because any tendency for naturalflocculation is retarded .Except. for rare instances, it. i s recommended
that the 0.002 mm size be determined in order tomore accurately define correlations with respectto the clay mineral content of the sample . 2 Al-though some primary minerals exist as particlessmaller than 0.002 mm, and some clay mineralsexist as particles larger than 0.002 mm, separa-tion at this point is believed to give an approxi-mation of the clay mineral content of thesample .
If information concerning the chemical qual-ity of the water is essential to It sediment investi-gation, standards and methods currently fol-lowed in chemical quality laboratories (Rain-water and Thatcher, 1959) should he used to
s The hydraulic engineer thinks of "clay" primarily as aparticle size term . However, in some scientific gelds, "clay" isprimarily a mineralogical term with particle size a secondaryconalderatlon . As pointed out by Grim 119581 . "The nonclayminerals usually are not present In particles much smallerthan abrnrt 0.001 to 0.002 mm . A separation at 0.002 mmla fre.mmtly about the optimum size for the best split ofth, rlap-udneral and nonclay-mineral components of naturalnmterinlr.'
make determinations for total dissolved solids,specific conductance, pH, calcium, magnesium,sodium, potassium, bicarbonate, or alkalinity .These analyses of the water can supplementknowledge obtained by other kinds of sedimentexamination.
Particle-size determinations by three differentmethods may be desirable for some streams. Inaddition to the standard methods using nativewater and dispersed medium, a third methodwould utilize a "weighted yearly average water"with respect to dissolved chemical constituentsas the settling medium . Preparation of the "av-erage water" would require past records ofchemical quality data for the stream and wouldrequire that chemical laboratory facilities heavailable. The extra analyses would require theavailability of samples with sufficient sedimentfor a three-way split.
Sample preparation for native water
analysis
The preparation of samples for dispersed con-ditions is discussed in connection with eachmethod of analysis in later sections . The prepa-ration of a sample of which part is to be ana-lyzed in native water needs further considera-tion . All compositing, splitting, wet sieving, orother steps involved in preparation of the por-tion of the sample to be analyzed in native wa-termust be accomplished with native water . Dis-tilled water, dispersing agents, or flocculatingagents should not be added. Organic mattershould not. be removed by use of oxidizing agentsor other methods . Mechanical dispersion of thesample should be avoided, and only a smallamount of agitation should be used to removethe sediment from the sample bottle . Immedi-ately prior to the analysis, the suspension shouldbe stirred by hand for one-half the recommendedtime for dispersed conditions-30 seconds withthe hand stirrer for the pipet method, and 90seconds of tilting for the 1311' tube method .
Either the modified Jones-Otto splitter or theBIV tube sample splitter is recommended forsamples that contain no sand. The qualitativeand quantitative accuracy of the modifiedJones-Otto splitter is greater than that of the
LABORATORY THEORY AND METHODS FOR SEDIMENT ANALYSIS
BW tube splitter if the sample contains sand.Some samples may require several splittings inorder that the desired quantity of sediment canbe obtained to prepare a. suspension having aconcentration between 2,000 and 5,000 mg/1 forthe pipet method and 1,000 and 3,500 mg/1 forthe BW tube method . Skill and experience arenecessary to estimate the number of splittingsnecessary to yield the required concentrations.The alternative is to collect extra samples forconcentration determinations prior to the re-quired splitting for size analysis .
Samples containing suspended material thatsettles extremely slow create an undesirablelaboratory time lag. Usually a "sample" con-sists of 2-12 bottles (about 400 g each) of water-sediment mixture. After the compositing hasbeen accomplished, the sediment in the com-posite must settle before an analysis can bemade in a dispersed medium or before splittingcan be accomplished prior to analyses in bothnative and dispersed media . Therefore, twosettling periods are usually necessary prior toanalysis : one before compositing, the other be-fore splitting . It is recommended that suspendedmaterial be allowed to completely settle priorto each of these steps . In the event that thesample data is needed immediately, the follow-ing procedure is recommended :1 . Allow the samples to settle as much as prac-
tical .2 . By use of a Berkefeld filter tube (or a similar
filter tube) and a vacuum apparatus, re-move as much of the native water fromeach bottle as possible without disturbingthe sediment in the bottom of the container .The fine sediment remaining in suspensionadheres to the outside of the filter tulleand the water passes through tire walls .
3 . Back flush the material oil the outside of thetube with native water and carefully rinseit into the container to be used for conn-positing the sediment .
As ;nn alternative procedure for treatment ofsamples that do not settle, the following nnethcxlhas been used successfully . Allow the samples tosettle for several days and then, using extremecare not to agitate the sample, siphon off the toptwo-thirds to three-fourths of the water and
Procedure for the Sieve-PipetMethod of Particle-Size Analysis
23
fine sediment mixture. Determine the weight ofsediment in an aliquot of the decanted waterand, from this weight, compute the concentra-tion of fine sediment particles removed fromthe sample . Split the sample if necessary toobtain the desired quantity of sediment, trans-fer to the analysis cylinder, fill with filteredsediment-free native water, and make the analy-sis as usual . Each withdrawal must then becorrected for the fine sediment previously de-canted and not included in the analysis cylinder .The correction would be made in a mannersimilar to that for the dissolved solids correctionexcept that the correction would be added to theweight of the withdrawal instead of being sub-tracted. Obviously, the same correction wouldalso have to be applied to each withdrawal forthe analysis made in the dispersed settling mediausing an alternate split of the same sediment .This method has an undesirable aspect becauseall the sediment sizes present in the originalsample are not present in the part of the sampleto be analyzed . Therefore, the analyses will notshow the chemical and (or) physical effect ofthe very fine particles in suspension on thelarger particles present.
The pipet method of detertnining particle-size gradation for sizes finer than 0.062 mm isone of the most. widely accepted techniques util-izing the Oden theory told the dispersed systenof sedimentation . The upper size limit of sedi-ment particles which set-the in water accordingto Stokes law and the lower size limit which canbe determined readily by sieves is about 1/16 mmor 0.062 nnnt . This size is the division betweensand and silt. (table 2) and is an important divi-sion in utility phases of sediment transportphenomena.The fundamental principle of the pipet
method is to determine the concentration of asuspension at to predetermined depth as a func-tion of settling time . Particles having a settlingvelocity greater than that of the size at whichseparation is desired will settle below the pointof withdrawal ;after elapse of a certain time . The
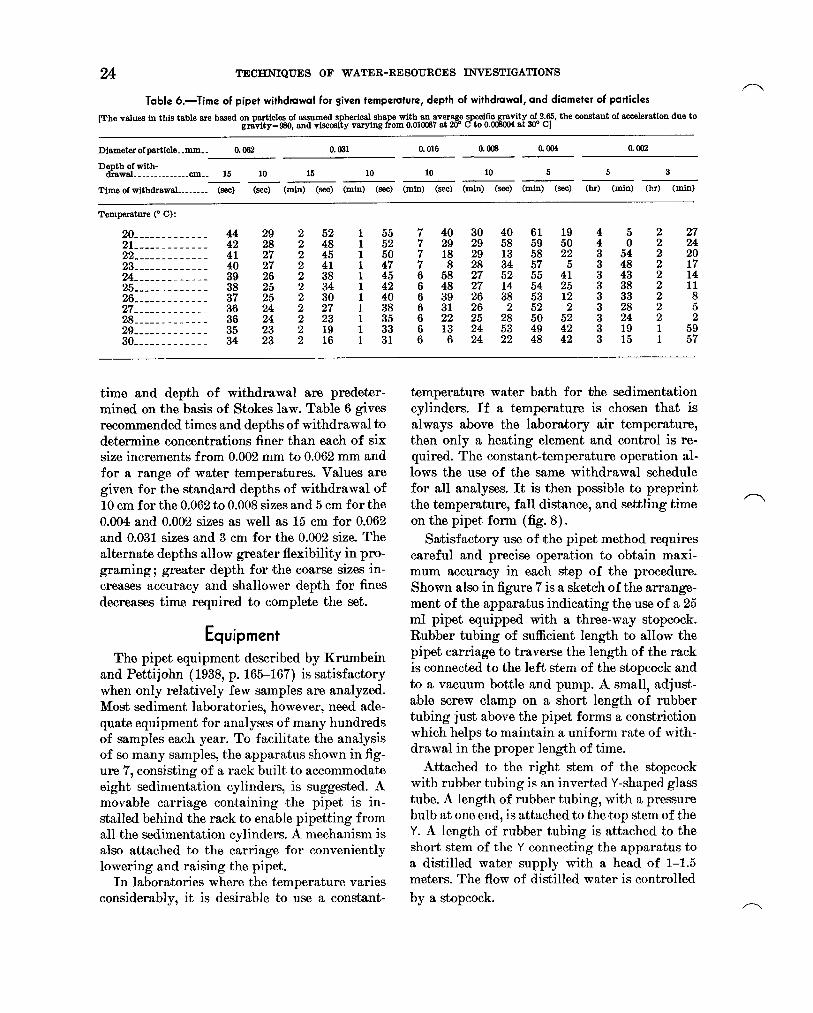
24 TEXJDJIQTJES OF WATER-RESOURCES INVESTIGATIONS T---b
Table 6.-Time of pipet withdrawal for given temperature, depth of withdmwal, and diameter of particles
[The value8 in this table are based on partiolas of assumed spherical shape with an average specidc gravity of 2.65, the constant of acceleration due to gravity=‘BO, and visc@sity varying from 0.010087 at 20’ C to O.OC8OO4 at 30’ Cl
Dkmet~ofpartlcle~~~~~~~ 0.062 0.031 0.016 0.008 0.004 0.002
Depth of with- drawal --____________ cm... 15 10 15 10 10 10 5 6 3
Time of withdrawal ____ ____ - 0 (min) (se@ (ml@ (set) (mtn) (se4 (min) (SW) (min) (W (W (min) W (min) (WC)
Temperature (” C):
20------------- 21-----..------- 22------------.. 23--m---------- 24--------..---- 25~------------ 26--------_-..-- 27---m..--------
40 29 18 8
2: 39
E 13 6
:: 22
5 4i 25 12
27
it 17 14 11
2 2
x; time and depth of withdrawal are predeter- mined on the basis of Stokes law. Table 6 gives recommended times and depths of withdrawal to determine concentrations finer than each of six size increments from 0.002 mm to 0.062 mm and for a range of water temperatures. Values are given for the standard depths of withdrawal of 10 cm for the 0.062 to 0.008 sizes and 5 cm for the 0.004 and 0.002 sizes as well as 15 cm for 0.062 and 0.031 sizes and 3 cm for the 0.002 size. The alternate depths allow greater flexibility in pro- graming; greater depth for the coarse sizes in- creases accuracy and shallower depth for fines decreases time required to com,plete the set.
Equipment The pipet equipment described by Krumbein
and Pettijohn (1938, p. 165-167) is satisfactory when only relatively few samples are analyzed. Most sediment laboratories, however, need ade- quate equipment for analyses of many hundreds of samples each year. To facilitate the analysis of so many samples, the apparatus shown in fig- ure ‘7, consisting of a rack built to accommodate eight sedimentation cylinders, is suggested. A movable carriage containing the pipet is in- stalled behind the rack to enable pipetting from all the sedimentation cylinders. A mechanism is also attached to the carriage for conveniently lowering and raising the pipet.
In laboratories where the temperature varies considerably, it is desirable to use a constant-
temperature water bath for the sedimentation cylinders. If a temperature is chosen that is always above the laboratory air temperature, then only a heating element and control is re- quired. The constant-temperature operation al- lows the use of the same withdrawal schedule for all analyses. It is then possible to preprint the temperature, fall distance, and settling time on the pipet form (fig. 8).
Satisfactory use of the pipet method requires careful and precise operation to obtain maxi- mum accuracy in each step of the procedure. Shown also in figure 7 is a sketch of the arrange- ment of the apparatus indicating the use of a 25 ml pipet equipped with a three-way stopcock. Rubber tubing of sufficient length to allow the pipet carriage to traverse the length of the rack is connected to the left stem of the stopcock and to a vacuum bottle and pump. A small, adjust- able screw clamp on a short length of rubber tubing just above the pipet forms a constrmtion which helps to maintain a uniform rate of with- drawal in the proper length of time.
Attached to the right stem of the stopcock with rubber tubing is an inverted Y-shaped glass tube. A length of rubber tubing, with a pressure bulb at one end, is at,tached to the top stem of the Y. A length of rubber tubing is attached to the short stem of the Y connecting the apparatus to a distilled water supply with a head of l-l.5
meters. The flow of distilled water is controlled by a stopcock.

LABORATORY THEORY AND METHODS FOR SEDIMENT ANALYSIS 25
Screw clamp
To vacuum pump t
: Vacuum bottle
iiF= -D&lled-water head
water valve
Three-way stopcock
-Pressure bulb
Figure ‘I.-Apparatus for pipet particle-size analysis.
26 TECHNIQUES OF WATER-RESOURCES INVESTIGATIONS
After a sample is drawn into the pipet, the three-way stopcock plug is rotated HO”, and the sample is allowed to drain freely into an evapo- rating dish. The drainage can be accelerated by use of the pressure bulb. To insure complete removal of all sediment in the pipet, the dis- tilled-water valve is then opened, and the pipet is washed out from the top. When the rinse is complete, it may be necessary to blow the re- maining one or two drops of water from the tip of the pipet with the pressure bulb. At this time, any small quantity of the mixture that may have collected in the vacuum line near the three- way stopcock (resulting from accidental over- filling of the pipet) should be removed by allow- ing a small quantity of air to be sucked through the line from the open pipet. Removal of this water is essential to clear the constriction con- trolling the vacuum on the pipet and insure a uniform rate of withdrawal of the next sample.
A more simple “constant-vacuum device” is being used for pipet analyses in some labora- tories. This device replaces the constriction (screw clamp) shown in figure 7 and insures a more uniform vacuum during a single with- drawal as well as for all analyses. The arrange- ment consists of three lines instead of two to the vacuum bottle. The third line is connected to a constant-head cylinder that has been sealed with a two-hole stopper and partly filled with water. The cylinder then acts as a “bleeding” device because the vacuum in the bottle cannot be in excess of the head of water around the tube that extends from the outside through the stop- per to the bottom of the cylinder. This head of water can be adjusted to give a desirable rate of filling of the pipet.
Preparation of sample
Recording and decanting
The procedure for analysis of the wet sample requires the net weight of the water-sediment mixture for the entire sample. This weight is usually recorded on the form Sediment Con- centration Notes (fig. 4 or 5) before samples are selected for particle-size analysis. The num- ber of bottles and their composite net weight are recorded in the upper righthand block of t.he Sieve-Pipet form. (See fig. 8.) The name of the
stream, the date, and other pertinent data are also recorded in this block.
After the sediment has settled to the bottom of the bottles, decant as much clear supernatant native water as possible. In the event that the sediment does not settle in a reasonable time and if the particle-size information is needed im- mediately, see “Note A (p. 11)” concerning special procedures for handling unsettled sam- ples. The sediment in the individual sample bottles is then cornposited.
Mechanical dispersion
Sample splitting may be required because of excess silt and clay in the sample, but very rarely because of excess sand. Experience shows that splitting inaccuracies are much more likely to occur in splitting sand fractions than in split- ting silt-clay fractions. Therefore, the follow- ing procedure is recommended whether or not splitting is required. If the sample contains significant organic clatter, the organic matter should be removed using the procedure dis- cussed in the following note.
NOTE B.-In close agreement with accepted methods, the following procedures set forth for removal of most forms of organic material from soil and sediment samples: Add 5 ml of 6 percent solution of hydrogen peroxide for each gram of (dry) sample which is con- tained in 40 ml water. Stir thoroughly and cover. Large fragments of organic material may be skimmed off at this stage if it can be assumed that they are free of sediment particles. If oxidation is slow, or after it has slowed, the mixture is heated to 93” C and stirred occasionally. The pddition of more of the hydrogen peroxide solution may be necessary to complete the oxidation. After the reaction has completely stopped, wash the sediment two or three times with distilled water.
It should be remembered that if a native-water analysis is to be made, then the organic material must not be removed. After completion of the necessary steps in this procedure, the com- posited sediment is placed in the soil dispersion cup and diluted to about 250-300 ml with dis- tilled water. The sample is ,then mixed for 5 minutes with a commercial milk-shake mixer. The stirring paddle should operate not less than three-fourths nor more than 11/2 inches above the bottom of the dispersion cup and turn about 10,000 rpm without load. An automatic timer

LABORATORY THEORY AND METHODS FOR SEDIMENT ANALYSIS
Form 9.265hCREV. 10.62) UNITED STATES DEPARTMENT OF THE INTERIOR Geological Survey-Water Resources Division
PARTICLE SIZE ANALYSIS, SIEVE-PIPET METHOD
27
File no.
ANALYSIS DATA DISSOLVED SOLIDS TOTAL SAMPLE DATA
Date by Volume cc, dispersed
native Stream
PortIon used Location
Disp. agent cc. Dish no. Date Time
Gross gm. ’ Sed.
e: km G.H. -Sta. Tare
Temp.
=:: Vol. gm.
h- ii
- cc. Net m. 0 No. bottles c
COWZen. - rwm WEIGHT OF PORTION 2 Wt. sample km. n c a, $ Gross
NOT ANALYZED E gm.
$j; Portion Dash no. - 6 Wt. sed. gm.
2: e Tare gm. Mean cont. pm
0 n Gross gm. Net m.
Sieve fract. Tare
-gm. gm, Dis. solids rwm
; Sand fract. gm. Net m. Spec. cond. PH $ Plpet fract. gm. % Silt-clay gm. Dis. solids gm. Other them. qual.
Total sed. -gm. Net gm. Remarks
SIEVE
PIPET
Figure 8.-S ample of laboratory form, Particle-Size Analysis, Sieve-Pipet Method.
28 TECHNIQUES OF WATER-RESOURCES INVESTIGATIONS
will help assure a consistent mixing time for each sample ; the wet-sieve separation of sand from silt and clay immediately follows the mixing.
Sieving
Only in exceptionally rare cases is it necessary or desirable to split the suspended-sediment sand fraction prior to sieve analysis. The samples usually contain a very high concentration of fine material and only small amounts of sand. A minimum of about 0.02 g of sand is required for an accurate sieve analysis-more is required if the sample contains particles of 1.0 mm or larger; therefore, the following procedure is recommended in which all of the sand is removed from a sample before the fine material is split.
Separation of sand from fines
After the mechanical dispersion is completed, the sediment should be wet-sieved using distilled water and a 250-mesh (0.062 mm) sieve. The sieve is tilted, rotated, and tapped gently to facilitate the washing procedure. The washing must be continued until there is no sediment passing through the screen. The material passing through the sieve can be temporarily stored in a beaker of suitable size. The material retained on the sieve is then washed into an evaporation dish and oven-dried for 1 hour after all visible water has been evaporated. Drying time can be shortened if practically all the supernatant water in the dish is carefully poured off the sand before placing the dish in the oven.
Dry method
The dried sand is then removed from the oven, cooled in a desiccator, and weighed ; the weight is recorded in the Analysis Data block of lthe Sieve-Pipet form. The dry sand can then be brushed into a nest of 21h- or 3$$-inch diameter certified sieves to obtain separates finer than 4,2, 1, 0.50, 0.25,0.125, and 0.062 mm. The sieves are then shaken for 10 minutes pn a shaker having vertical and lateral movements. The weight of sand remaining for each size fraction is recorded in the Sieve block. The sediment that passes the 0.062 mm sieve (pan material) is added to the
silt-clay material that was obtained during the wet-sieve operation.
Wet method
If the sample contains considerable clay that cannot be completely removed from the sand particles (see p. 20 concerning the “Sonifier”), then a wet-sieve method may be more suitable than the dry sieve. The recommended method uses a technique that keeps the sieve and sand completely submerged. The equipment may con- sist of six or more 10 cm dishes, a set of 3-inch (‘7.6 cm) sieves, and a thin glass tube. All sieves are washed with a wetting solution such as alcojet and then rinsed with distilled water that will leave a membrane of water across all openings. The first or largest sieve is immersed in a dish with distilled water to a depth of about one-fourth inch (one-half centimeter) above the screen. If the surface tension of the water across the openings is sufficient to trap a pocket o”f air beneath the screen, the thin tube is used to blow out a small group of the membranes near one edge of the screen. This will allow the air to escape if the open holes are kept above the water until the rest of the screen is immersed. The sediment is washed onto the wet sieve and agitated somewhat vigorously in several direc- tions un,til it is evident that all of the passable material has had a chance to fall through the sieve. Material retained in the sieve is washed into an evaporating dish to be dried and weighed, and material passing the sieve with its wash water is then poured onto the next smaller size sieve into ‘another dish. This procedure is continued until the 0.062 mm sieve is used, after which the material passing the 0.062 mm sieve is added to the material obtained during the initial separation of the fines from the sands.
A more simple wet-sieve method is often used when the total sand is less than about 20 percent of the total. In this method the sieving is accom- plished with a gentle jet of water that washes the finer particles through the successively smaller sieves. Though not as accurate and consistent as the “immersed screen” method, it is sufficiently accurate when the sand is less than 20 percent of the total.
LABORATORY THEORY AND METHODS FOR SEDIMENT ANALYSIS 29
Analysis OF silt-clay fraction
Splitting
If a sample contains an estimated 5 g or less of silt-clay, and if a single dispersed analysis is desired, splitting of the material is not neces- sary. For example, if an estimated 4.5 g of mate- rial is present, the entire amount of material should be analyzed in a 1,000 ml cylinder; the material should not be split and analyzed in a 500 ml cylinder.
The following procedure is recommended if the sample contains more than 5 g. The silt-clay fraction, composed of the material passing the 0.062 mm “wet-sieve” plus the “pan material” obtained during the sieve analysis of the sand, is split as required to obtain a concentration of 2,000-5,000 mg/l in a 1,000 m.1 sedimentation cylinder. Either the modified Jones-Otto split- ter or the BW tube splitter is satisfactory for the splitting of wet-silt-clay samples. If the dis- solved solids concentration is still high, which is unlikely if the previous recommendations have been followed, it may be necessary to rinse the sediment until the final concentration of dis- solved solids is less than about 200 mg/l.
Dispersing
To insure complete dispersion of the particles, add to the sample 1 ml of dispersing agent (see Kilmer and Alexander, 1949 or Note C below) for each 100 ml of the desired volume of thk suspension.
NOTE C.-The dispersing agent is made by dissolving 35.70 g of sodium hexmetaphosphate and 794 g of sodium carbonate in distilled water and diluting to one liter volume. The sodium carbonate gives a pH bet,ween 9 and S.5 for the mixture and acts as an alkaline buffer to prevent the hydrolysis of the metaphosphate back to orthophosphate. A determination of a dissolved solid’s correction should be made each time a new solu- tion of dispersing agent is prepared.
After the dispersing agent is added, transfer the sample to the cup of the mechanical mixer and mix for 5 minutes. ‘The sample is then trans- ferred to the sedimentation cylinder and diluted to the desired volume.
To obtain the dissolved solids correction fac- tor to compensate for the dispersing agent added, the following procedure is recommended.
Add 5 ml of the dispersing agent solution to each of two 500 ml cylinders, and add distilled water to make up the 500 ml volume. Using the standard 25 ml pipet, make three withdrawals from each cylinder and place each withdrawal in a separate, previously weighed, evaporation dish. Using the same temperature standards as for sediment drying, evaporate the material in each dish and obtain the weight of residue in each dish. Because very slight variations in weight will be found for the six residues, the average weight is obtained and is used as the correction factor.
Pipetting
After the split portion or the unsplit silt-clay fraction has been transferred to the sedimenta- tion cylinder, and before the actual pipetting begins, the temperature of the suspension, the depth of withdrawal (fall distance), the settling time, and the weights of numbered containers for each withdrawal must be recorded in the Pipet block of the form. The suspension is then stirred for 1 minute with a hand stirrer of the plunger type illustrated in Krumbein and Pettijohn (1938, p. 16’7), and the stopwatch is started when the stirrer is removed. The analy- sis should be made at nearly constant tempera- ture to minimize convection currents.
The time and depth of pipetting (table 6) is determined from Stokes law on the basis of tem- perature of suspension and settling diameters for the sizes 0.062, 0.016, 0.004, and 0.002 mm. On some occasions it may be desirable to add withdrawals for the 0.031 and 0.008 mm sizes. The pipet is filled in 8-12 seconds and then emptied into an evaporation dish. One rinse from the pipet is added. The material in each evaporation dish is handled as indicated by steps 11, 12, and 13 (p. 17). The resulting weight is entered in the Piyet block of the form.
Calculation of results
Total weight of sediment in sample
The calculation of results from the sieve- pipet method requires the total weight of sediment in the sample; this weight can be de- termined by one of the following methods:
30 TECHNIQUES OF WATER-RESOURCES INVESTIGATIONS
1. Evaporate the sample to dryness before analysis and determine the oven-dry weight to the nearest milligram. This method is not recommended because sedi- ment when once dried is difficult to dis- perse and requires special treatment, especially a sediment that contains con- siderable quantities of clay minerals.
2. Determine the weight of the silt and clay fractions from the mean concentration and volume of the pipet settling suspen- sion. The average concentration of the suspension is determined by making a “concentration withdrawal” immediately after mixing. The weight of sediment in the suspension cylinder is then added to the weight of the sand which was deter- mined separately.
3. Determine the dry weight of sediment re- maining in the suspension after all pipet- ting has been completed. To this add the dry weigh’t of sediment in each pipet with- drawal and the dry weight of the sand fraction if it was separated.
4. Split the sample in two portions by means of a suitable splitting device. Evaporate one-half to dryness to determine the weight of sediment, and use t,he other half for the sieve-pipet analysis. The accuracy of this method depends on the quantitative and qualitative accuracy of the splitting operation which is subject to considerable error ; therefore, the method is not recommended.
Methods 2 or 3, either singly or together, are recommended. Because of speed and ease of determination, method 2 is suitable for most samples. Occasionally, the weight of material in a suspension should be determined by both methods 2 and 3 as a check on method 2. This is accomplished simply by making the “con- centration withdrawal” as suggested in method 2 and including the weight of material in this lvithdrawal in the method 3 determination.
Calculations
The form illustrated in figure 8 facilitates recording the data and calculating the results for the sieve-pipet method. The tabulation of
the sand fractions into the usual form of per- cent finer than the indicated sizes is accom- plished by using the total dry weight of all sediment in the sample.
The net dry weight of the sediment in each pipet withdrawal when multiplied by the volume factor, which is the ratio of total volume of suspension to volume of pipet, gives the weight of sediment in the suspension finer than the size corresponding to the time and depth of withdrawal. This latter value divided by the dry weight of the total sediment in the sample gives the percent of total sediment finer than the indicated size.
Procedure for the VA Tube-Pipet
Method of Particle-Size Analysis
The visual-accumulation tube method fills a fundamental need in the process of obtaining data related to sediment transport. It is a fast, economical, and accurate means of determining the size distribution in terms of the funda- mental hydraulic properties of the particles and the fall velocity or fall diameter. Not only does “sieve” diameter fail to indicate the desired hydraulic properties of a sediment sam- ple, but the particle-size distribution may bein error because of irregularities in the size and shape of sieve openings, limitations on the time of sieving required to pass all particles, and pos- sible adhesiveness of clay on the larger par- ticles. Therefore, the VA tube-pipet method is recommended for the determination of the par- ticle-size distribution of sediment for most streams. The VA tube method is especially adapted for size analysis of samples composed mainly of sand. Finer material, when its measurement is required, must be removed from samples by either wet sieving or by sedi- mentation methods. Sieving is employed to re- move particles which are too large for measurement by the VA tube method. The im- portance of the objections to sieving is of little significance for particles too large for the VA tube.
The VA t,ube method may not be suitable for some streams that transport large quantities of organic materials such as root fibers, leaf

LABORATORY THEORY AND METHODS FOR SEDIMENT ANALYSIS 31
fragments, and algae. Extra care is also needed when a stream transports large quantities of heavy or light minerals such as taconite or coal. For such streams, the results for both the VA tube and sieve methods should be reported.
The VA tube method employs the stratified system of sedimentation as cofitrasted with the dispersed system of the pipet or the BW tube. In the stratified system, the particles start fall- ing from a common source and become stratified according to settling velocities. At a given in- stant, the particles coming to rest at the bottom of the tulbe are of one “sedimentation size” and are finer than particles that have previously set- tled out and are coarser than those remaining in suspension. Specific details covering the equip- ment and methods of operation are not discussed here because a clear and concise operator’s man- ual (U.S. Inter-Agency Committee on Water Resources, Subcommittee on Sedimentation, 1958) is furnished with each set of the appa- ratus. Likewise, the details of the development and calibration are contained in Inter-Agency Report No. 11 (U.S. Inter-Agency Committee on Water Resources, Subcommittee on Sedimen- tation, 195’7). It has been shown that particles of a sample in the visual tub settle with great,er velocities than the same particles falling indi- vidually, because of the effect of mutual inter- action of the particles. The VA tube method is calibrated to account for the effects of this mu- tual interaction and the final results will be given in terms of the individual particles fall- ing alone in a fluid of sufficient extent to avoid the effect of space limitations. The size-grada- tion analysis, therefore, is based on the standard fall diameter of the particles, which may be de- fmed as the diameter of a sphere having a spe- cific gravity of 2.65 and having the same uni- form terminal settling velocity as the given particle. The relationship between fall velocity and fall diameter depends only on the relation- ship between the velocity of fall and the diam- eter of the sphere of specific gravity 2.65. The fall diameter of a particle is then independent of the type of material or specific gravity, the concentration in which it is found or analyzed, or the method of analysis.
The diameter concept is just as basic as fall velocity, and has the sole advantage of supply-
ing a linear size tag by which the particle may be more readily visualized. For example, when a VA tube analysis shows that 65 percent of the material of a sample is finer than 0.125 mm, it means that if the entire sample were dropped, one particle at a time in a fluid of infinite ex- tent, 65 percent of the particles by weight would have fall velocities less than that of a 0.125 mm diameter sphere with a specific gravity of 2.65 which may be allowed to fall under the same conditions.
The calibration of the recorded was based on the analysis of hundreds of samples having known fall velocities and makes allowance for the increased fall velocities when a sample con- taining hundreds of particles is settled instead of individual particles. This allowance is in the or- der of 10 percent for the coarser particles and about 30 percent for the finer particles. The calibration is for natural sands with the recom- mended size of tube as related to the amount or concentration of sample and particle size. If the VA ttibe method is properly used, the resulting gradation will be quite accurate.3
Equipment
Equipment for the VA tube method of anal- ysis consists primarily of the special settling tube and the recording mechanism in addition to the usual laboratory equipment for sediment investigations. As shown in figure 9, the device consists of (1) a glass funnel about 25 cm long, (2) a rubber tube connecting the funnel and the main sedimentation tube with a special clamp- ing mechanism serving as a “quick acting” valve, (3) glass sedimentation tubes having different sized collectors, (4) a tapping meohanism that strikes against the glass tube and helps keep the accumulation of sediment uniformly packed, (5) a special recorder consisting of a cylinder carrying a chart that rotates at a constant rate and a carriage that can be moved vertically by hand on which is mounted a recording pen and an optical instrument for tracking the accumu- lation, and (6) the recorder chart which is a printed form incorporating the fall-diameter
3For special particle shapes or for samples with specific gravities much different from 2.65, accurate am&is might require a special calibration to relate settling velocity, fall diameter. and linear size.

32 TECHNIQUES OF WATER-RESOURCES INVESTIGATIONS
calibration (fig. 10). Drawings and further de- tails are given in Inter-Agency Report No. 11 (U.S. Inter-Agency Committee on Water Re- sources, Subcommittee on Sedimentation, 1957) and in the operator’s manual furnished with the apparatus.
Preparation OF sample
The VA tube method is suitable for samples whose particles are mainly sand. As mentioned previously, if particles larger than &bout 1.2 mm are present in the sample, they should be re- moved by sieving. If clay or silt is contained in the sample, it is removed before analysis by wet sieving with a fine sieve, by settling the sample through a sedimentation tube, or by other means such as the ultrasonic treatment mentioned on
Figure 9.-VA tube and recording apparatus for analysis of sand-sized materials in terms of fall diameter.
page 20. The more thoroughly the clays and silts are removed from the sand, the simpler and faster will be the VA tube analysis although some coarse silt in the VA tube does not affect the accuracy of the analysis.
Separation of sand from fines
The following method is recommended for the separation of sand from the silt-clay fraction. Separate the sand from the silt-clay fraction by the wet method using a sieve with 0.053 mm openings. If the material contains a large amount of sand, the use of a 0.062 mm or 0.125 mm sieve for an initial separation will help prevent rapid clogging of sieve openings in the 0.053 mm sieve. The material passing the coarser sieve is then wet-sieved through an 0.053 sieve. The amount of sand passing the 0.053 mm sieve will be very minute and the VA tube will give an accurate determination of the percentage finer than 0.062 mm.
An alternate method of separation of sands from the remainder of the sample is by sedimen- tation. This is accomplished by introducing the sample at the top of a sedimentation tube and allowing the material to settle for a time in- terval that will permit, for the given mater temperature and distance of fall, all the parti- cles with sedimentation diameters greater than 0.062 mm to settle to the bottom of the column. The part of the sample that has settled out can be withdrawn at this time and analyzed in the VA tube and the part remaining in suspension can be analyzed by the pipet method. Separa- tion by simple sedimentation as a routine prac- tice may be fraught with difficulty because (1) a sharp separation of sand from silt and clay dur- ing a single sedimentation period is extremely difficult to obtain and (2) the sample may con- tain a large amount of silt and clay which may move rapidly downward as a turbidity cur- rent. The first difficulty can be remedied by multiple sedimentation separations; the second by multiple sedimentation or preferably prelim- inary separation with the 0.053 mm sieve to remove most of the fine material in the sample prior to the final separation by sedimentation.

LABORATORY THEORY AND METHODS FOR SEDIMENT ANALYSIS 33
Before either the sieving or sedimentation methods can be used for separating the sand from the silt and clay, it is necessary that the net weight of the water-sediment mixture be obtained and recorded on Sediment Concentra- tion Notes (fig. 4)) that the supernatant native water be decanted, and that necessary composit- ing be accomplished. Obviously, if the silt-clay fraction is to be analyzed in both native and dispersed media, then the cornpositing, wet sieving, and splitting must be accomplished using only native water. Prior to analysis of samples selected for particle-size determination, all pertinent sample information previously recorded on Sediment Concentration Notes must be transferred to the charts used for the VA tube analysis. (See figs. 10, 11, and 12.)
Splitting and dispersing
A general discussion of methods for sample splitting is presented in a prior section of this chapter ; however, some additional explanation is needed here concerning the reasons why split- ting and (or) chemical dispersion should be ac- complished after the sand is separated from the silt-clay fraction. The purpose of sample split- ting is to obtain a concentration of 2,000-5,000 mg/l of silt and clay for the pipet analysis (l.O- 5.0 g of silt and clay depending on whether 500 or 1,000 ml cylinder is used) and 0.05-15.0 g of sand for the VA tube analysis (depending on the diameter of the accumulation section of the tube). (See table 6.) The silt-clay fraction must be split but the sand need not be split for sam- ples that. contain an estimated 2530 g of silt and clay and 5 g of sand. Quantitative and qual- itative errors are much more apt to occur in the splitting of sand than in the splitting of silt and clay ; fortunately, suspended-sediment samples rarely contain sufficient sand to require s,plitting. The separation of the sand from the silt-clay prior to the splitting of the sample requires lit-
tle extra effort in computing the results of the analysis. The necessary records are maintained on the back of the VA tube form (fig. 12) in the block Sample Fractions.
The chemical dispersing agent should not be added to the silt and clay until the material is ready for the pipet analysis. For example, the dispersing agent in the suspension before sepa- ration by the sediment tube would obviously ;be- come mixed with the distilled water in the sedi- mentation tube, and an unknown quantity of the dispersant migh,t be removed when the sand is removed from the bottom of the tube. The pur- pose of the chemical dispersing agent is not so much to separate the particles but to create a suspension having stability. Because the separa- tion and splitting operations are accomplished rather quickly and do not involve sedimentation procedures, mechanical dispersion alone is an adequate preparatory treatment.
The VA tube analysis
The VA tube-pip& method differs from the sieve-pipet method only by the manner in which the sand is analyzed. The preparation of the sample, separation of sand from the silt-clay fraction, analysis of the silt-clay fraction, and calculation of results was discussed previously in the procedure for the sieve-pipet method. These and other general recommendations noted hereafter apply equally to the pipet analyses made in conjunction with either the sieve or the VA tube analyses.
Sand particles should be in such condition that the grains will fall as individual particles in the sedimentation tube and therefore should be thoroughly wet and free of attached clay particles or air bubbles before analysis. They should be contained in not more than 40 ml of water at a temperature within 2“ or 3°C of the water in the VA tube. Organic matter should be removed before the sample is analyzed if present in sufficient volume to interfere with or decrease the accuracy of the analysis. A small number of root hairs, for example, although volumetrically small may have a considerable effect on the re- sults of the analysis. Therefore, unless a sample is reasonably free of organic material, treat- ment for i,ts removal is recommended. Methods for removal of organic mat&r are discussed on page 52.
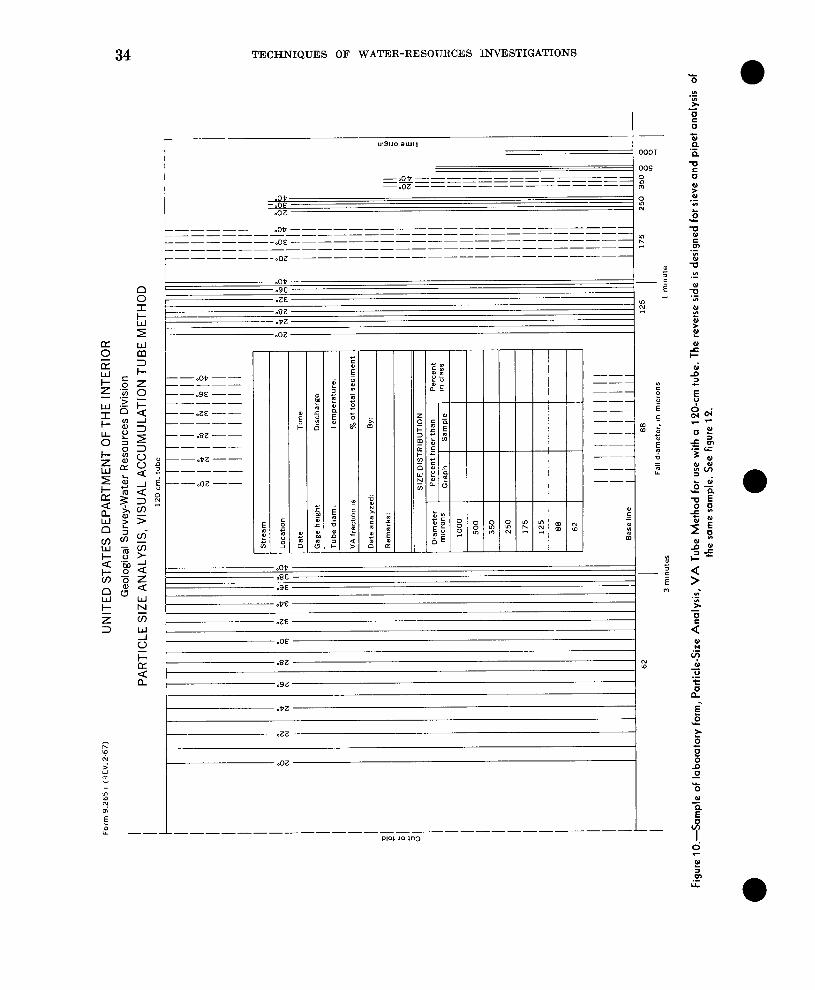
34 TECHNIQUES OF WATER-RESOURCES INVESTIGATIONS
: .tEI z .ZE Y 0 .OE
E ..82 9
.9Z
.tz
.zz
.oz

LABORATORY THEORY AND METHODS FOR SEDIMENT ANALYSIS
F
--~of---------------- ----,
--&- ____ --------------~~
_-------------------___
--~oz----------- ------ ---2
---.OP
---.5x - _---
B --OZE 1.
E
,: i
---.8Z
P ..? --o.tZ
---soz ;
i
L <
-
I-. .8E -
__ ------------------------ .OE -

36 TECHNIQUES OF WATER-RESOURCES INVESTIGATIONS
SIEVE ANALYSIS
size. mm Pan
E, Gross
E
z Tare
3 Net % Of total
% finer than
% I” class
conta,ner no.
Cut or fold
Date Lab No. stream
Samplmg *t&vans
Method of sampllng-
Remarks
Depth
PortIon
SAMPLE FRACTIONS TOM SlWe “A-tube Plpet Rema,nder from splat fractions
sample fraction fraction fraction Total [ Pwet I Other 1
Figure 1 I.- Sample of laboratory form for recording steps in computing particle size when the VA tube is used with sieve, pipet, and (or) other methods of analysis. Reverse side of 120- and 180~cm VA tube charts (figs. 10 and 11).
LABORATORY THEORY AND METHODS FOR SEDIMENT ANALYSIS 37
u Tube selection
Best results from the VA tube analysis are obtained if the total height of accumulation in the bottom of the tube is between 4 and 12 cm. If a sample is predominately coarse or has a very limited size range, the maximum accumulation should be less than 10 cm. The choice of a suit- able tube is not difficult because ,the usable limits of the respective tubes overlap, and even if a satisfactory size is not selected the first time, the samples can be rerun in another size of tube. Table 5 (p. 19) is arranged according to quan- tity and maximum particle size and should prove helpful in selecting the correct tube size. The maximum particle sizes in this table are those that should not be exceeded by a signifi- cant percentage of the sample. This significant percentage may be greater if the sample is small in relation to the capacity of the tube or if the analysis of the coarser portion is not highly important.
Tube selection is made easier in some labo- ratories by use of an “init,ial break tube” that is similar to the VA tube except the fall distance is about 50 cm. Use of this tube makes it possible
L to obtain (1) the size of the largest one or two particles by timing their fall, (2) the amount of sand accumulated or sample size, and (3) a cleaner sand sample by removal of silt and clay particles. The disadvantages of using the “initial break tube”, though not serious, involve the problems of additional handling and chance for loss of sediment, and the fact that the fines are dispersed in another volume of water.
Procedure
The following procedure for making an analysis by the VA tube is reported in Inter- Agency Report No. 11 (U.S. Inter-Agency Committee on Water Resources, Subcommittee on Sedimentation, 195’7, p. 118-120). It should be noted that analysis can be made in less than 10 minutes for samples with particles greater than 0.062 mm. The recommended chronological procedure for VA tube analysis is as follows :
1. The chart is chosen for the length of tube; after notes to identify the sample, operator, and analysis are recorded, the chart is placed on the cylinder. The base line of the chart should
be parallel to the bottom of the cylinder so that the pen trace will be parallel to the base line except when sediment is accumulating. (If the chart is used for two or more samples, a differ- ent base line, somewhat above the original, may be used by drawing it with the recorder pen. The 180 cm and the 120 em tubes require different charts because of the unequal distances through which the sample must settle.)
2. The recorder pen is oriented on the zer@accumula- tion and zero-time lines of the chart. The pen should be started to the right of the zero-time line and brought to the line by the motor-driven rota- tion of the cylinder.
3. The recorder is adjusted to bring the horizontal hair in the eyepiece level with the top of the tube plug where the accumulation of sediment begins.
4. When the apparatus, including the proper sedi- mentation section, is assembled, the tube is filled with distilled water to just above the valve. The temperature of the water in the tube is deter- mined and recorded, and the valve is closed. Normally the water need not be changed after each analysis.
5. The electrical tapping mechanism is started; this operation also closes the electrical circuit to a switch at the valve so that rotation of the cylin- der will start when the valve is opened.
6. The sand sample is washed into the funnel above the closed valve ; the funnel is filled to the refer- ence mark ; then the sample is stirred briskly for 10 seconds with a special stirring rod.
7. The valve is immediately and fully opened. Because opening the valve automatically starts the cylin- der, the chart time and settling of the particles in the tube begin simultaneously.
8. The operator watches through the eyepiece and, as soon as the first particles reach the bottom of the tube, he starts moving the carriage vertically at a rate that keeps the horizontal hair level with the top of the accumulation of sediment. This proce- dure continues until the pen has passed the 0.662 mm size on the chart ; then rotation of the cylin- der automatically stops. If material is stlil fall- ing, the tracking operation is continued, at least intermittently, until the maximum height of ac- cumulation is determined.
9. While the pen stands at the maximum height of accumulation, the cylinder drive clutch is re- leased and the cylinder is rotated by hand to extend a horizontal line of maximum accumula- tion back across the chart to the time of zero accumulation.
10. After the valve is closed (and the tube plug is re- moved), the sample is (extruded from the tube into a beaker by gravity or by squeezing the rub- ber tube between the valve and the VA tube) * * * The valve (may then be) opened slightly to drain out excess water and to wash out the lower end of the tube more completely.

38 TECHNIQUES OF WATER-RESOURCES INVESTIGATIONS
(If the tube contains fine material (<0.002 mm),then it should be drained from the tube andanalyzed with the material which passed the0.053 mm sieve .) The plug is replaced .
11 . The chart is removed from the recorder .
Chart interpretation
The VA tube analysis results in a continuouspen trace on a chart that incorporates the falldiameter calibration of the VA tube methodwith time as the abscissa and height of accumu-lation as the ordinate . The calibrated chartsshow a series of fall diameters from which theanalytical results may be determined in per-centages (by weight) of the sample finer thana given fall diameter . The percentages finer thana given size may be read from the chart by useof a scale that will divide the total accumula-tion into 100 equal parts by placing the 100 endof the scale on the zero-accumulation line andthe 0 end of the scale on the total accumulationline . The scale is moved horizontally to the in-tersection of the curve with the size-temperatureline desired and the percentage finer than theindicated size is read directly on the scale . Ifsome of the material finer than that analyzedin the VA tube was removed prior to theVAtube analysis, for example, 30 percent of theoriginal sample, then the 30 on the scale is heldon the total-accumulation line and direct read-ings are made as above . Similiarly, if coarsematerial has been removed, then the percentageremoved is subtracted from 100 and the differ-ence held on the zero-accumulation line . Theresults of these readings in percent finer thanthe given size are tabulated on the form forthis purpose.The equipment and procedure for making talc
pipet analysis of the fraction, if any-, has beendiscussed ill a preceding section of this chapter .The reverse side of the form used for the VAtube analysis (fig. 11) should be used for re-cording the steps of the pipet analysis in amanner similar to that described in the preced-ing sections. All information for the completeanalysis of the sample, even sieve if that isnecessary, is contained on the single sheet .
Procedure for the BW Tu6e-VA
Tu6e Method of Particle-Size
Analysis
The BZV tube-VAtube method of determiningparticle-size distribution is not as commonlyused as the sieve-pipet method or the VA tube-plpet method but can be used to advantage forcertain types of samples . The B\V tube methodcan conveniently be used if only a fen- analysesare made each year . It is the most accuratemethod if the silt-clay concentration of the sam-ples is very low- . The minimum desirable silt-clay concentration is 1,000 mg/1 for the BITtube method, whereas 2,000 lag/1 is the minimumdesirable concentration for the pipet method .
It should be pointed out that the use of therecommended concentration range for any ana-lytical suspension does not insure accurate de-terminations of all particle sizes present . Forexample, if a concentration of 1,200 fil
l,/] of siltand clay is used for a BIV tube analysis, but90 percent of the material is coarse silt, thenthe fine silt and clay concentration are only"120 mg/l or less . Therefore, it is obvious thatthe accuracy of the particle-size analysis byeither the B4V tube method or pipet methoddepends not only on the original concentrationof suspension but on the particle-size distribu-tion of the material in the sample .
The Oden theory
The Bh tube method makes direct applica-tion of the Oden theory which is, in turn, de-pendent on Stokes law . The following quotationfrom Inter_agency Report No. 7 (F .S . Inter-Agency Committee Oil I'ater Resources, Sub-committee on Sedimentation, 1943, 1) . 5) givesa synopsis
This device is a glass tube equipped with a volu-metric scale and a quick-acting outlet at the lower end .First, the sample is uniformly dispersed in the tube.Then, the tube is placed in an upright position andsamples of known volume are drawn from the bottom atknown time intervals . When the sediment weight in
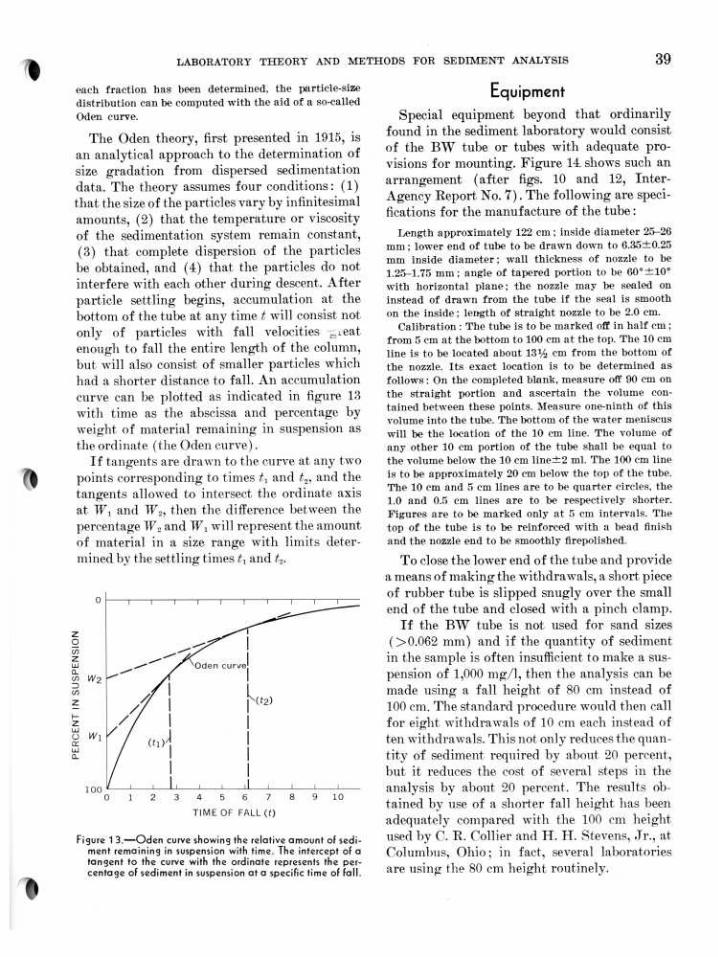
each fraction has been determined, the particle-sizedistribution can be computed with the aid of a so-calledOden curve .
The Oden theory, first presented in 1915, isan analytical approach to the determination ofsize gradation from dispersed sedimentationdata . The theory assumes four conditions : (1)that the size of the particles vary by infinitesimalamounts, (2) that the temperature or viscosityof the sedimentation system remain constant,(3) that complete dispersion of the particlesbe obtained, and (4) that the particles do notinterfere with each other during descent . Afterparticle settling begins, accumulation at thebottom of the tube at any time t will consist notonly of particles with fall velocities -__ .eatenough to fall the entire length of the column,but will also consist of smaller particles whichhad a shorter distance to fall . An accumulationcurve can be plotted as indicated in figure 13with time as the abscissa and percentage byweight of material remaining in suspension asthe ordinate (the Oden curve) .
If tangents are drawn to the curve at any twopoints corresponding to times t, and te , and thetangents allowed to intersect the ordinate axisat W, and W2, then the difference between thepercentage TV, and TV, will represent the amountof material in a size range with limits deter-mined lw the settling tunes t, and t2 .
zC
wNNz
wU
a
wl
100
LABORATORY THEORY AND METHODS FOR SEDIMENT ANALYSIS
I
(t1)
I
II
0 1 2 3 4 5 6 7 8 9 10
TIME OF FALL (t)
Figure 1 3-Oden curve showing the relative amount of sedi-ment remaining in suspension with time . The intercept of atangent to the curve with the ordinate represents the per-centage of sediment in suspension at a specific time of fall .
Equipment
39
Special equipment beyond that ordinarilyfound in the sediment laboratory would consistof the BW tube or tubes with adequate pro-visions for mounting. Figure 14 shows such anarrangement (after figs . 10 and 12, Inter-Agency Report No. 7) . The following are speci-fications for the manufacture of the tube :Length approximately 122 cm ; inside diameter 25-26
mm ; lower end of tube to be drawn down to 6.35?0.25mm inside diameter ; wall thickness of nozzle to be1 .2:-1.75 mm ; angle of tapered portion to be 60°-t10°with horizontal plane ; the nozzle may be sealed oninstead of drawn from the tube if the seal is smoothon the inside : length of straight nozzle to be 2 .0 cm .
Calibration : The tube is to be marked off in half cm ;from 5 cm at the bottom to 100 cm at the top . The 10 cmline is to be located about 13'/2 cm from the bottom ofthe nozzle. Its exact location is to be determined asfollows : On the completed blank, measure off 90 can onthe straight portion and ascertain the volume con-tained between these points . Measure one-ninth of thisvolume into the tube . The bottom of the water meniscuswill be the location of the 10 em line. The volume of
any other 10 cm portion of the tube shall be equal tothe volume below the 10 cm line~2 ml . The 100 cm lineis to be approximately 20 em below the top of the tube.The 10 em and 5 cm lines are to be quarter circles, the1.0 and 0.5 em lines are to be respectively shorter .Figures are to be marked only at 5 em intervals . Thetop of the tube is to be reinforced with a bead finishand the nozzle end to be smoothly firepolished.To close the lower end of the tube and provide
a means of making the withdrawals, a short pieceof rubber tube is slipped snugly over the smallend of the tube and closed with a pinch clamp.
If the BW tube is not used for sand sizes(>0.062 ram) and if the quantity of sedimentin the sample is often insufficient to make a sus-pension of 1,000 mg/l, then the analysis can bemade using a fall height of 80 cm instead of100 cm, The standard procedure would then callfor eight withdrawals of 10 cm each instead often withdrawals . This not only reduces the quan-tity of sediment required by about 20 percent,but it reduces the cost of several steps in theanalysis by about 20 percent. The results ob-tained by rise of a shorter fall height has beenadequately compared with the 100 cm heightused by C. R . Collier and H. H . Stevens, Jr . . atColumbus, Ohio ; in fact, several laboratoriesare using the 80 cm height routinely .

40 TECHNIQUES OF WATER-RESOURCES
Preparation OF sample
The net weight of the water-sediment mixture for the entire sample is recorded on the form Xed%nrent CiYoncentration Notea, (figs. 4 or 5) b’e- fore samples are selected for particle-size analy- sis. Pertinent sample information should be re- corded on the BW Tube form (fig. 15) in the Total SampZe Data block. After the sediment
T
INVESTIGATIONS
+@ )/ // +-25cm+
I I e- 3cm -c
Figure 14. - The bottom-withdrawal tube and stand (left and above).
settles to the bottom of the sample bottles, as
much sediment-free supernatant native water as possible should be decanted. If the sediment is slow in settling, “Note A, p. 11.”
The recommended use of the BW tube method is that it be limited mostly to the analysis of silt and clay. If sand is present, the quantity and size should be small. It is also recommended that the method be used extensively only when suf- ficient material is not present for analysis by the pipet method. The pipet method is preferred be- cause it is less time consuming and possibly more accurate than the BW tube. In the past, the BW tube has been widely used for grading sands,
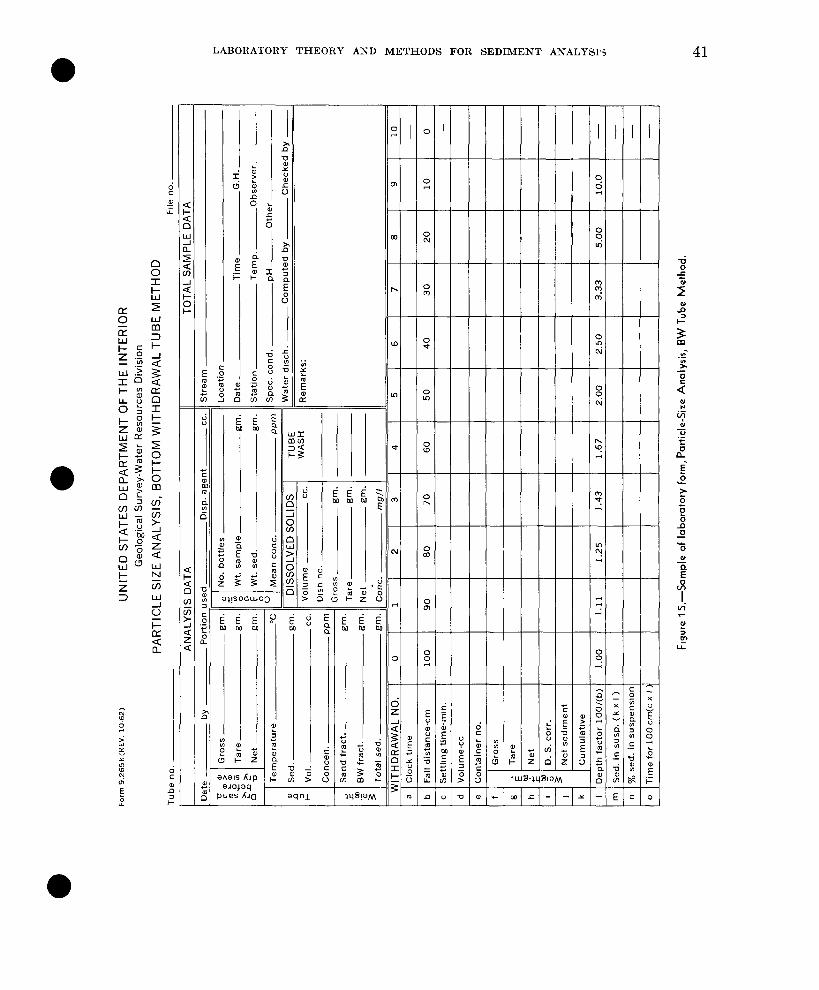
LABORATORY THEORY AND METHODS FOR SEDIMENT ANALYSIS3 41
-
-
-
-
-
-
-
-
-
-
-
-
-
-
2 b .E m E 8 - al -
-
I -
-
-
-
-
-
-
-
-
-
- P x 5 5 5 .5 T 9 r -
, , ! , I
,
I
cw.c---Y-

42 TECHNIQUES OF WATER-RESOURCES INVESTIGATIONS
especially before the advent of the VA tube, but considerable difficulty has been experienced, particularly with sizes of 0.35 mm and larger. The sieve method is nearly as accurate and much quicker than the BW method for grading of sands. For these reasons, analysis of sand in the sample should be by the sieve method and preferably by the VA tube method. Therefore, the BW tube method will usually be limited to the analysis of silt-clay fractions of samples containing less than 1.0 g of silt and clay. Be- cause of these limitations, an explanation of sample splitting procedures for the BW tube analysis will not be presented. If the sand is re- moved before the BW analysis, then the Oden curves for the silt and clay fractions can be defined more accurately by additional with- drawals for these sizes.
If a sample contains less than 1.8 g of silt and clay for the BW tube analysis and contains a sand fraction to be analyzed by the VA tube or sieve methods, the preparations of the sample prior to analysis of the respective sand and silt- clay fractions proceeds as recommended in the previous sections. If the sand fraction is to be analyzed by either the VA tube or sieve methods, preparation of the sample is basically the same whether the pipet method or the BW tube method is used for analysis of the silt-clay fraction.
The BW tube analysis 3
*4 carefully considered and detailed procedure for the BW tube analysis was first reported in Inter-Agency Report No. ‘7 (U.S. Inter-Agency Committee on Water Resources, Subcommittee on Sedimentation, 1943, p. 82-88). This detailed procedure and other more recent experience form the basis of the recommended procedure contained herein. The fine fraction remaining after removal of the coarse fraction is trans- ferred to the BW tube and diluted to the de- sired volume with distilled water (native water if the natural settling medium is needed).
Dispersion
To insure complet,e dispersion of the sedi- ment for the dispersed settling medium, it is necessary to add 1 ml of dispersing agent (see
“Note B, p. 26”) for each 100 ml of suspension in the BW tube. The amount would be 5 ml for the 100 cm tube and 4 ml for the 80 cm tube. The dispersing agent, sediment and suspension media (distilled or deionized water) should be mixed for 5 minutes with a soil dispersion mixer. The dissolved solids correction factor to be applied to the weight of solids in each with- drawal may be obtained by filing a clean tube with a proper mixture of the dispersing agent and distilled water and then withdrawing and evaporating two or more 25 ml aliquots. The Dissolved So&% block (fig. 15) provides recording and computation space.
Before placing the tube in the rack to start the settling operation, further mild mechanical mixing is accomplished by placing a cork in the upper end of the tube and tilting the bottom of the tube up about 10” from the horizontal. Hold in this position and shake to wash the coarse particles from the constriction. An air bubble will travel up the tube and after it reaches t.he constricted end all coarse particles should be distributed as uniformly as possible along the tube by rolling and mild tilting. The tube is then returned t,o an upright position to allow the bubble to travel the full length of the tube (about 5 seconds). Invert t,he tube from end to end in t.his manner for 1 minute (3 min- utes when tube contains sand). At the end of this time, when the bubble is at the constricted end, the tube is turned immediately in an up- right posit,ion and securely fastened to the stand. Time of settling is begun for the settling process when the bubble st,art,s upward from the bottom. The cork should be removed after the bubble has reac,hed the top.
Withdrawals
Equal-volume fractions are usually with- drawn using time intervals chosen in such a way as to best define the Oden curve. Each with- drawal should represent a column height of 10 cm. However, t,he method can be varied con-
siderably whereby fractions of any desired dept,h and volume can be withdrawn as long as the particle size range is covered and enough points are obtained to define t,he Oden curve. If t.he preceding recommenda.tions are followed con-
cerning the use of the BW tube for the analysis
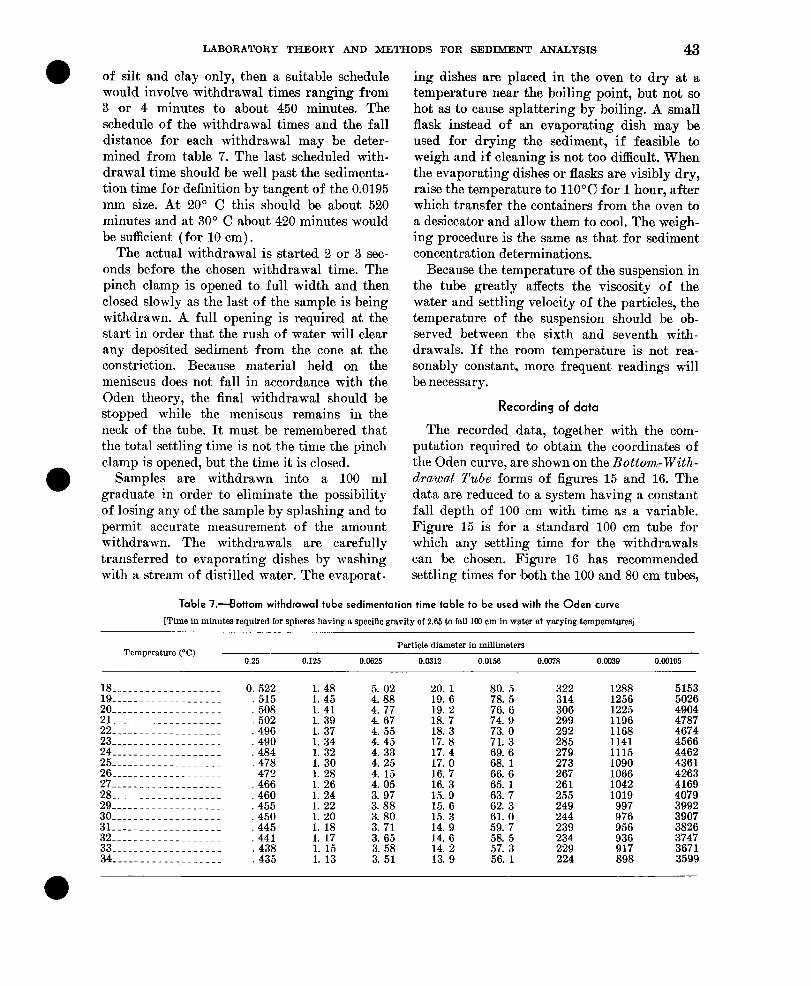
LABORATORY THEORY AND METHODS FOR SEDIMENT ANALYSIS 43
of silt and clay only, then a suitable schedule would involve withdrawal times ranging from 3 or 4 minutes to about 450 minutes. The schedule of the withdrawal times and the fall distance for each withdrawal may be deter- mined from table 7. The last scheduled with- drawal time should be well past the sedimenta- tion time for definition by tangent of the 0.0195 mm size. At 20” C this should be about 520 minutes and at 30” C about 420 minutes would be sufficient (for 10 cm).
The actual withdrawal is started 2 or 3 sec- onds before the chosen withdrawal time. The pinch clamp is opened to full width and then closed slowly as the last of the sample is being withdrawn. A full opening is required at the start in order that the rush of water will clear any deposited sediment from the cone at the constriction. Because material held on the meniscus does not fall in accordance with the Oden theory, the final withdrawal should be stopped while the meniscus remains in the neck of the tube. It must be remembered that the total settling time is not the time the pinch clamp is opened, but the time it is closed.
Samples are withdrawn into a 100 ml graduate in order to eliminate the possibility of losing any of the sample by splashing and to permit accurate measurement of the amount withdrawn. The withdrawals are carefully transferred to evaporating dishes by washing with a stream of distilled water. The evaporat-
ing dishes are placed in the oven to dry at a temperature near the boiling point, but not so hot as to cause splattering by boiling. A small flask instead of an evaporating dish may be used for drying the sediment, if feasible to weigh and if cleaning is not too difhcult. When the evaporating dishes or flasks are visibly dry, raise the temperature to 110% for 1 hour, after which transfer the containers from the oven to a desiccator and allow them to cool. The weigh- ing procedure is the same as that for sediment concentration determinations.
Because the temperature of the suspension in the tube greatly affects the viscosity of the water and settling velocity of the particles, the temperature of the suspension should be ob- served between the sixth and seventh with- drawals. If the room temperature is not rea- sonably constant, more frequent readings will be necessary.
Recording of data
The recorded data, together with the com- putation required to obtain the coordinates of the Oden curve, are shown on the Bottom-With- drawal Tube forms of figures 15 and 16. The data are reduced to a system having a constant fall depth of 100 cm with time as a variable. Figure 15 is for a standard 100 cm tube for which any settling time for the withdrawals can ‘be chosen. Figure 16 has recommended settling times for #both the 100 and 80 cm tubes,
Table ‘I.-Bottom withdrawal tube sedimentation time table to be used with the Oden curve
[Time in minutes required for spheres having a specific gravity of 2.65 to fall 100 cm in water at varying temperatures]
Temperature (“C) ~ 0.25 0.125
Particle diameter in millimeters 0.0625 0.0312 0.0156 O.CKVR 0.0039 0.00195
lS_____----_____----- 0. 522 1. 48 5. 02 20. 1 80. 5 322 1288 5153 19_____--------____-- ,515 1. 45 4. 88 19. 6 78. 5 314 1256 5026 20-_-________--______ 508 1. 41 4. 77 19. 2 76. 6 306 1225 4904 21___-____-__-_______ ,502 1. 39 4. 67 18. 7 74. 9 299 1196 4787 22___-_------__--___- ,496 1. 37 4. 55 18. 3 73. 0 292 1168 4674 23_----______________ ,490 1. 34 4. 45 17. 8 71. 3 285 1141 4566 24_____------___----- .&!ki 1. 32 4. 33 ii. 4 69. 6 279 1115 4462 25-_---.._____-______ ,478 1. 30 4. 25 17. 0 68. 1 273 1090 4361 26_____----_____----- 472 1. 28 4. 15 16. 7 66. 6 267 1066 4263 27-----____------____ ,466 1. 26 4. 05 16. 3 65. 1 261 1042 4169 28_____-----------~~~ .460 1. 24 3. 97 15. 9 63. 7 255 1019 4079 29___-___-----___._-- .455 1. 22 3. 88 15. 6 iii. 3 249 997 3992 30_____------_.------ .450 1. 20 3. 80 15. 3 61. 0 244 976 3907 31__-__--------__---- .445 1. 18 3. 71 14. 9 59. 7 239 956 3826
32_-___------_.______ ,441 1. 17 3. 65 14. 6 58. 5 234 936 33------_____.__----- . 438 1. 15 3. 58 14. 2 57. 3 229 917 33761 34____________.--_____ 435 1. 13 3. 51 13. 9 56. 1 224 898 3599
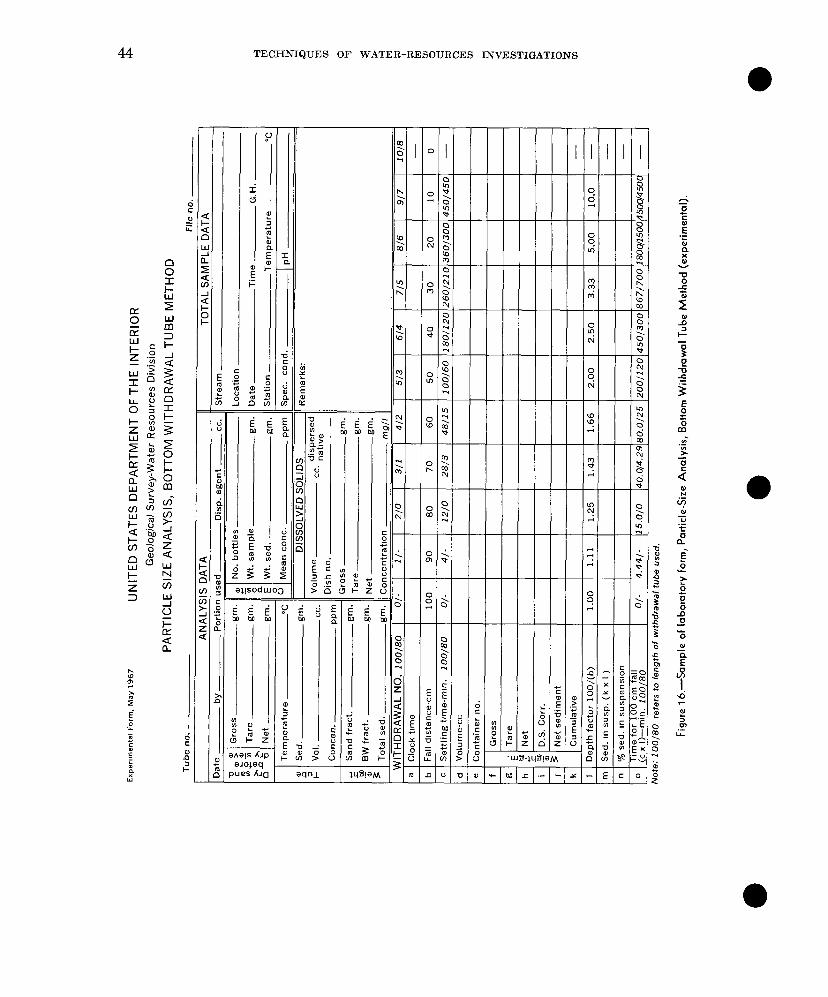
TECHNIQUES OF WATER-RESOURCES INVESTIGATIONS
-
I -
-
-
-
-
-
-
-
-
-
-
g ! E ; -
f 0 +
6 I E b ” s 5 E 5 4
I
;
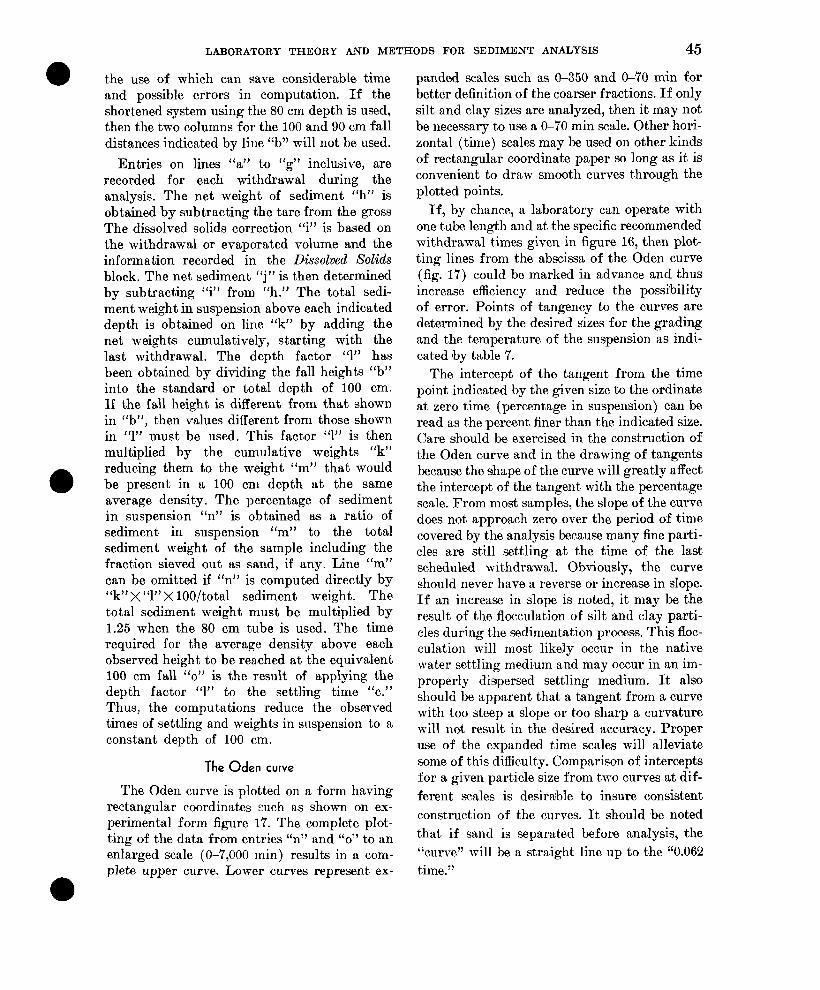
LABORATORY THEORY AND METHODS FOR SEDIMENT ANALYSIS 45
the use of which can save considerable time and possible errors in computation. If the shortened system using the 80 cm depth is used, then the two columns for the 100 and 90 cm fall distances indicated by line “b” will not be used.
Entries on lines “a” to “g” inclusive, are recorded for each withdrawal during the analysis. The net weight of sediment “h” is obtained by subtracting the tare from the gross The dissolved solids correction “i” is based on the withdrawal or evaporated volume and the information recorded in the Dissolved Solids block. The net sediment “j” is then determined by subtracting “i” from “h.” The total sedi- ment weight in suspension above each indicated depth is obtained on line “k” by adding the net weights cumulatively, starting with the last withdrawal. The depth factor “1” has been obtained by dividing the fall heights “b” into the standard or total depth of 100 cm. If the fall height is different from that shown in “b”, then values different from those shown in “1” must be used. This factor “1” is then multiplied by the cumulative weights “k” reducing them to the weight ‘lm” that would be present in a 100 cm depth at the same average density. The percentage of sediment in suspension “n” is obtained as a ratio of sediment. in suspension “m” to the total sediment weight of the sample including the fraction sieved out as sand, if any. Line rrm” can be omitted if “n” is computed directly by “k”X “1”X loo/total sediment weight. The total sediment weight must be multiplied by 1.25 when the 80 cm tube is used. The time required for the average density above each observed height to be reached at the equivalent 100 cm fall “0” is the result of applying the depth factor “1” to the settling time “c.” Thus, the computations reduce the observed times of settling and weights in suspension to a constant depth of 100 cm.
The Oden curve
The Oden curve is plotted on a form having rectangular coordinates such as shown on ex- perimental form figure 17. The complete plot- ting of the data from entries “n’, and “0” to an enlarged scale (O-7,000 min) results in a com- plete upper curve. Lower curves represent ex-
panded scales such as O-350 and O-70 min for better definition of the coarser fractions. If only silt and clay sizes are analyzed, then it may not be necessary to use a O-70 min scale. Other hori- zontal (time) scales may be used on other kinds of rectangular coordinate paper so long as it is convenient to draw smooth curves through the plotted points.
If, by chance, a laboratory can operate with one tube length and at the specific recommended withdrawal times given in figure 16, then plot- ting lines from the abscissa of the Oden curve (fig. 17) could be marked in advance and thus increase efficiency and reduce the possibility of error. Points of tangency to the curves are determined by the desired sizes for the grading and the temperature of the suspension as indi- cated Iby table 7.
The intercept of the tangent from the time point indicated by the given size to the ordinate at zero time (percentage in suspension) can be read as the percent liner than the indicated size. Care should be exercised in the construction of the Oden curve and in the drawing of tangents because the shape of the curve will greatly affect the intercept of the tangent with the percentage scale. From most samples, the slope of the curve does not approach zero over the period of time covered by the analysis because many fine parti- cles are still settling at the time of the last scheduled wit,hdrawal. Obviously, the curve should never have a reverse or increase in slope. If an increase in slope is noted, it may be the result of the flocculation of silt and clay parti- cles during the sedimentation process. This floc- culation will most likely occur in the native water settling medium and may occur in an im- properly dispersed settling medium. It also should be apparent that a tangent from a curve with too steep a slope or too sharp a curvature will not result in the desired accuracy. Proper use of the expanded time scales will alleviate some of this difficulty. Comparison of intercepts for a given particle size from two curves at dif- ferent scales is desirable to insure consistent construction of the curves. It should ,be noted that if sand is separated before analysis, the “curve” will be a straight line up to the “0.062 time.‘,
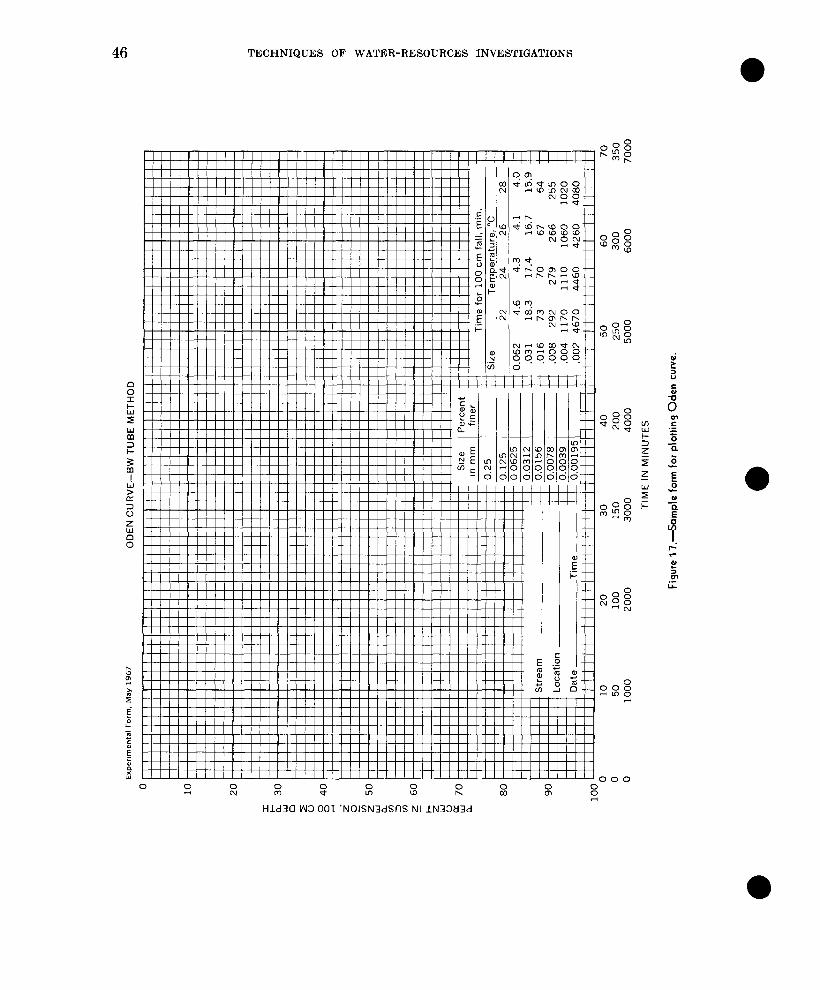
TECHNIQUES OF WATER-RESOURCES INVESTIGATIONS
LABORATORY THEORY AND METHODS FOR SEDIMENT ANALYSIS 47
Limitations of BW tube for sand
In the event that the BW tube is used for sands from 0.062 to 0.35 mm, the following dis- cussion, based on comprehensive studies of the BW tube using glass beads (U.S. Inter-Agency Committee on Water Resources, Subcommittee on Sedimentation, 1953), may be helpful. In consideration of settling concentrations beyond the recommended 3,500 mg/l for silt and clay, it was found that concentrations of these fine sands up to 10,000 mg/l may be safely used. With the nominal size ranging from 0.03 to 0.35 mm, the results become more accurate on the per- centage basis as the concentration of the sample increased ; the average error decreased from + 5.2 percent at a concentration of 1,000 to + 0.5 percent at a concentration of 10,900 mg/l. Much of the error is assumed to be governed by the ac- curacy of laboratory methods such as volume determinations and weighing; hence, the low concentrations are most affected.
It has also been noted that the first withdrawal containing the coarsest sand particles, if any, may be subject to considerable error. If so, a point representing this withdrawal cannot be included on a smooth nonreversing Oden curve from the origin through this point. The errors may result from poor distribution of coarse par- ticles in the settling ‘medium because of particles sliding along the wall and, for the first 5 seconds of settling, because of the action of the bubble as it travels the length of the tube. Sometimes the technique fails to obtain a sedimentation regi- men consistent with the Oden theory of sedimen- tation in a dispersed system. In this case, errors resulting from a specific withdrawal are carried into the remainder of the Oden curve, but grad- ually become decreasingly important in later withdrawals. For a give.n concentration of sus- pension as indicated above, it has been found that with a maximum size of 0.25 mm the results of the first withdrawal often become erratic, and at 0.35 mm and larger the results are usually undependable.
As indicated above, the sum of the errors of the BW tube method may be attributed to the influence of operational techniques plus the limi- tations of the apparatus. In a statistical sense, an analysis may give the correct median grain
size and still be in error at many points, or it may give the correct amounts of many of the size fractions even though the percent finer curve is seriously in error. It is possible that the average results of several analyses may be quite accurate even though the individual analysis may devi- ate considerably from the true sizes.
Determination OF Particle-Size Dis-
trhtion OF Deposited Sediment
and Soil Samples
The particle-size distribution of samples rep- resenting deposited sediment and soils is becom- ing increasingly important in fluvial sediment investigations. Included are samples represent- ing sediment transport conditions in streams and reservoirs, and erosion conditions for the sources of fluvial sediment. Formulae used for the computation of total sediment discharge and bed-load discharge require such data.
Bed-material samples in streams are usually collected by means of a piston-type core sampler, or a BM-54 sampler. Samples from reservoirs are obtained by various types of clamshell and spud samplers. Streams that have a wide range of size grades (fine sands to pebbles or cobbles) can best be sampled when dry, or at a very low stage, by shovel. Soil samples are collected from a predetermined pattern at the surface or from pits or auger holes. At most locations of sedi- ment deposits or soils, any desired quantity of bed material can be collected conveniently and rapidly. Therefore, in contrast to most sus- pended-sediment samples, an abundance of ma- terial is usually available for analysis.
Equipment and method OF handling
The distribution of large bed material par- ticles (cobbles and larger) should be measured in situ. If manual measurement is used, roughly 100 particles are measured for a sample as determined by the location of a grid system. A method is being evaluated that uses only a pic- ture of the bed particles and a Zeiss Particle Size Analyzer. The equipment required for particle-size analysis of the clay, silt, sand, and gravel sizes of streambed and soil materials is

48 TECHNIQUES OF WATER-RESOURCES INVESTIGATIONS
basically the same as required for analysis of suspended sediment. The equipment should be capable of analyzing the larger, more optimum quantities of material than are usually found in suspended-sediment samples. Whereas a nest of 3-inch (8 cm) diameter sieves is satisfactory for analysis of sand from suspended-sediment samples, a nest of &inch (20 cm) diameter sieves and a “Rotap” sieving machine are more convenient for bed material and soil samples. Whereas the 120 cm length VA tube is satis- factory for the analysis of suspended sediment, the 180 cm length VA tube is usually more con- venient and accurate for the analysis of the sand fraction from most bed-material samples.
The size distribution of particles and the quantity of sample will determine the equip- ment and method of handling. A sample having a size range from pebbles or cobbles down to fine sands, for example, will require hand separation of the largest particles before analysis of the fine pebbles and granules by sieving and before splitting and analysis of the finer sands by the VA tube. Samples containing such large particles do not ordinarily contain measurable quantities of silt and clay. If both “fine” and “coarse” samples are obtained at different locations across a channel, as is often the case in many stream systems, the size dis- tribution should be defined for each sample. Across many sand-bed streams, however, the difference in size distribution is small, and therefore only the mean distribution is re- quired. For this kind of stream, the samples can be composited, mixed, and then split down to a convenient size for analysis. The quantity of material in the small pebble a.nd finer sizes necessary to adequately define the distribution at the measuring section is usually such that splitting of the sample is necessary before the analysis can be made ; therefore, both a large and a small Jones type splitter should be nvailalble.
In situ measurement
Large particles must be measured in situ be- cause it is impractical to take an adequate or representative sample to the laboratory. Roughly 100 particles should be measured to represent a sample (more if the size range is
from gravel to boulder and less if the material is quite uniform in size). A grid pattern locat- ing the sampling points can be paced, outlined by surveys, or designated by floating bobbins. The “particle” underlying the toe or the one at the intersection of the grid point is retrieved (Wolman, M. G., 1954) and a measurement made of the long, intermediate, or short diam- eters, or all three.
Nominal diameter by immersion
If the nominal diameter is desired, then the particle should be immersed in a cylinder with a volumetric scale on the side to indicate the volume of water displaced by the particle. For best results with the immersion technique, the diameter of the cylinder should not be more than about two times the nominal diameter of the particle ; therefore, several such cylinders of different sizes would be required. Cylinders 4, 8, 16, and 32 cm in ‘diameter are recom- mended. Solution of the equation d=1.24 V’b is necessary to convert the displaced volumes into nominal diameters. A standard diameter- volume table may also be used. The measure- ments and diameters are tabulated according to size interval from which the percentage of the total for each interval can then ‘be determined.
The Zeiss analyzer
The “pebble” count method entails measure- ment of “randomly” selected particles in the field under oftentimes difficult conditions, and the number counted is not likely to represent the population. Therefore, use of the Zeiss Particle- Size Analyzer should be considered (Ritter and Helley, 1968). For this method, a photograph of the streambed is made, preferably at low flow, with a 35 mm camera supported by a tripod about 2 m above the streambed, the height de- pending on the size of the bed materials. A ref- erence scale, such as a steel tape or a surveyor’s rod must appear in the photograph. The photo- graphs are printed on the thinnest paper ava,il- able. An iris diaphragm, illuminated from one side, is imaged by a lens onto the plane of a plexiglass plate. See figure 18. The photograph is put on this plate. By adjusting the iris dia- phragm the diameter of the sharply defined cir-
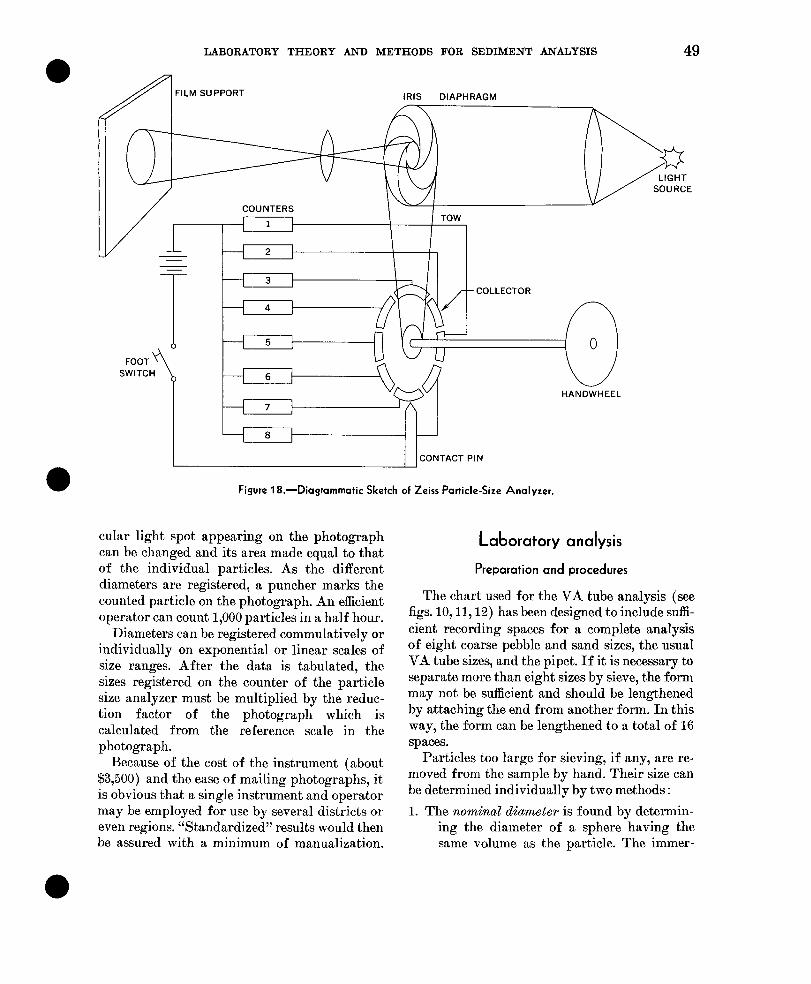
LABORATORY THEORY AND METHODS FOR SEDIMENT ANALYSIS 49
FILM SUPPORT IRIS DIAPHRAGM
COLLECTOR
8 IP
1 1 ICONTACT PIN
Figure 1 &-Diagrammatic Sketch of Zeiss Particle-Size Analyzer.
cular light spot appearing on the photograph can be changed and its area made equal to that of the individual particles. As the different diameters are registered, a puncher marks the counted particle on the photograph. An efficient operator can count 1,000 particles in a half hour.
Diameters can be registered commulatively or individually on exponential or linear scales of size ranges. After the data is tabulated, the sizes registered on the counter of the particle size analyzer must be multiplied by the reduc- tion factor of the photograph which is calculated from the reference scale in the photograph.
Because of the cost of t,he instrument (about $3,500) and the ease of mailing photographs, it is obvious that a single instrument and operator may be employed for use by several districts or even regions. “Standardized” results would then be assured with a minimum of manualization.
Laboratory analysis
Preparation and procedures
The chart used for the VA tube analysis (see figs. 10, l&12) has been designed to include suffi- cient recording spaces for a complete analysis of eight coarse pebble and sand sizes, the usual VA tube sizes, and the pipet. If it is necessary to separate more than eight sizes by sieve, the form may not be sufficient and should be lengthened by attaching the end from another form. In this way, the form can be lengthened to a total of 16 spaces.
Particles too large for sieving, if any, are re- moved from the sample by hand. Their size can be determined individually by two methods :
1. The nominal diamtcr is found by determin- ing the diameter of a sphere having the same volume as the particle. The immer-
50 TECHNIQUES OF WATER-RESOURCES INVESTIGATIONS
sion technique mentioned previously is a rapid and convenient way of obtaining par- ticle volume when the particles are too large or too few for sieving.
2. The nominal diameter, however, disregards the important aspect of particle shape, and therefore additional size characteristics may be obtained by measuring the long, in- termediate, and short diameters and desig- nating each a, b, and c, respectively. These statistics can then be used to compute the nzean dircmeter with the formula
d =a+b+c m -.
3
Additional details regarding method for direct measurement of large particles and statistics derived therefrom are given by Krumbein and Pettijohn (1938, p. 143-146).
Bed-material samples are usually in a dry con- dition when preparation of the sample is started. If the sample is composed of loose, incoherent sand or coarser particles and if the sieve method alone is to be used, the following procedure is recommended. Obtain the net weight of the en- tire sample, and if this weight is greater than 100 g, use the Jones-Otto type splitter to obtain a portion weighing 50-100 g. Enter the weights of the entire sample and the split portion on the appropriate place on the analysis form. Place the split portion of the sample in a nest of S-inch (20 cm) diameter sieves composed of sieves hav- ing square openings 0.062, 0,125, 0.250, 0.50,1.0, 2.0,4.0, and 8.0 mm on a side. Place in the “RO- tap” sieving machine and sieve for 15 minutes. The weight of material in each sieve fraction is then determined and recorded at the appropri- ate place on the analysis form. If a “Rotap” siev- ing machine is not available and a nest of 3-inch (8 cm) diameter sieves are used, the procedure is the same except that a correspondingly smaller split portion must be obtained.
If the sample is composed of loose sand and if the sieve method is to be used for analysis of very coarse sand and other coarse particles and the VA tube method is to be used for analysis of the coarse through very fine sand, the follow- ing procedure is recommended. Record the weight of the entire sample on the analysis
form. If the weight of the sample is 400 g or less and if the percentage of very coarse material appears to be relatively minor, the sample is placed in a nest of S-inch (20 cm) diameter sieves composed of 1.2, 2.0, 4.0, and 8.0 mm sieves. The weight of material in each of the coarse sieve fractions is determined and re- corded. The material passing the 1.2 mm sieve is then split down to a portion not to exceed 15 g and is analyzed by the VA tube method. If the original sample weighs more than 400 g and an appreciable part of the sample is coarse mate- rial, the sample should be split and the sieve analysis made for the split portion.
The 1.2 mm instead of the 1.0 mm sieve is used for the separation of the VA fraction he- cause of the desirability of including in the VA tube analysis all particles having sedimentation diameters of 1.0 mm or less. If the 1.0 sieve were used for the separation, some particles hav- ing specific gravity considerably less than 2.65 or having shapes differing widely from the spheri- cal would probably be retained on the 1.0 mm sieve even t,hough the sedimentation diameter of these particles might abe considerably less than 1.0 mm. The use of the 1.2 mm sieve per- mits the determination of the 1.0 mm sedimenta- tion diameter with some degree of assurance that nearly all particles of this sedimentation diameter or less were included in the analysis.
If the bed-material sample is composed of silt and clay in a dry condition, the material must be thoroughly wetted, mechanically dis- persed, split, and analyzed by the pipet method. The procedure in this case is similar to the pro- cedure used for analysis of suspended-sediment samples.
Some bed-material samples will show such a wide range of particle sizes that a complete par- ticle-size analysis will involve the sieve, the VA tube, and the pipet methods. For such sam- ples, the initial part of the procedure is the same as that just described for analysis ‘by the sieve- VA tube method ; however, an additional sepa- ration then follows the splitting of the fraction passing the 1.2 mm sieve. This additional separa- tion removes the pipet fraction from the VA tube fraction. The splitting procedure is the same whether the sample is of suspended sedi- ment or is of bed material.

LABORATORY THEORY AND METHODS FOR SEDIMENT ANALYSIS 51
Calculation of results
Many of the details in the procedure for the calculation of results of particle-size analyses of deposited sediment and soil samples are iden- tical with those for suspended sediment samples and therefore need not be repeated. Therefore, only a few general statements concerning the procedure will be made.
If the particle sizes are limited to the sand range and all sizes are determined by the VA tube method, neither the total weight of the sam- ple nor the weight of the split portion analyzed in the VA tube need be determined. A 100-divi- sion scale is used to determine the percent finer values ; the “100” is placed on the base line of the VA chart and the “0” is placed on the total accumulation line. The values are then read di- rectly from the scale.
If the sieve and VA tube methods were used for an analysis, only the total weight of the sam- ple and the weight of each sieve fraction need be determined. Again, the weight of the VA tube fraction need not be determined. The sieve anal- ysis of the very coarse fraction will indicate the percentage finer than 1.2 mm. Using a lOO-divi- sion scale, place the percentage finer than 1.2 mm on the base line and place “0” on the total accumulation line. The percentage finer values for 1.0, 0.5, 0.25, 0.125, and 0.0625 mm are then read directly from the scale.
If the direct measurement, the sieve, the VA tube, and the pipet methods are all used for an analysis, then the weight of each large particle, each sieve fraction, the split portion which in- cludes the VA tube and pipet fractions, and all portions not used directly for analysis must be determined for the calculation of results. The weight of the VA tube fraction can be obtained by difference between the weight of the split portion and the weight of the pipet fraction of the split portion.
Mechanical analyses of soil samples
The methods for the determination of par- ticle-size distribution of soil samples are essen- tially the same as for bed material or other de- posited sediment. The purpose of a mechanical analysis of soil determines the best method for its analysis. In soil science, the classification of
sand separates (very fme sand, 6ne sand, me- dium sand, and so forth) is based on sieve di- ameters of the sand particles. Therefore, if the purpose of a mechanical analysis is to determine the soil texture and percentage composition by soil separates, and if the results are to be com- pared with available soils data obtained by other investigators, the sieve method should be used to determine the particle-size distribution of the sand fraction. However, if the purpose of a soil analysis is to determine the hydraulic or transport characteristics of the sand particles, the VA tube method should probably be used for the sand analysis regardless of the method used for analysis of the silt-clay fraction.
Soil samples will commonly contain consid- erable amounts of both microscopic and macro- scopic organic material. The method for removal of organic matter in soil samples is the same as for sediment samples (see “Note B, p. 26”).
Samples collected from some soil horizons and from some streambeds may contain carbonate and (or) other concretions much larger in size than the soil matrix in which the concretions were formed. The desirability of including such concretionary material in the analysis will de- pend on the use to be made of the particle- size data. For these samples, two size analyses should be made on split portions-one analysis on a portion treated with acid to remove all car- bonates and the other analysis on an untreated portion. The percentage loss in weight resulting from the acid treatment should be computed for such samples.
Other Determinations Related to
Sediment Analysis
Organic material
Organic material collected with sediment samples may range from macroscopic fibrous plant material and coal to microscopic colloi- dal humus. Neither the macroscopic nor the microscopic forms have significance in most drainage basins, with respect to the determina- tion of sediment concentration, because concen- tration is defined as the ratio of the weight of dry matter in the sample to the volume of the water-sediment mix,ture. Exceptions to this may
52 TECHNIQUES OF WATER-RESOURCES INVESTIGATIONS
be found where streams are utilized for washing coal. Organic material does, however, affect av- erage specific weight and greatly affects the par- ticle-size analysis if present in sufficient quantities.
Relationship to particle-size settling media
Quantitative determination of organic mate- rial is usually recommended for about one-half of the samples analyzed for particle size and all that are analyzed by use of the native water settling media if the organic material amounts to 5 percent or more of the ‘total sediment mate- rial. It must be emphasized that the portion of the sample actually analyzed for particle size in a native water settling medium should not be treated for removal of organic matter. The de- composition of the organic matter resul,ts not only in the formation of carbon dioxide and water, but also in the release of all ions incor- porated in the organic material. Therefore, it is obvious that oxidation of organic material could markedly affect the quality of the native water and the flocculating characteristics of the sedi- ment particles.
In the process of analyzing sediment for par- ticle size in a dispersed settling medium, it is usually desirable to remove even relatively small quantities of organic material if it is in the form of colloidal humus which acts as a binding agent for aggregates or floccules (Robinson, 1922). Robinson was the first to show that samples containing appreoiable quantities of organic matter cannot be adequately dis- persed unless the organic matter is removed. Fourfold increases in the percentage of clay were obtained for some samples by treatment with hydrogen peroxide. Other investigators (Baver, 1956) have also found that oxidation of organic matter with hydrogen peroxide is essential for the complete dispersion of soil particles.
Procedure of removal
In close agreement with the recommenda- tions of the International Society of Soil Sci- ence, the following procedure is set forth for removal of most forms of organic material: Add 5 ml of 6 percent solution of hydrogen peroxide for each gram of (dry) sample which
is contained in 40 ml of water. Stir thoroughly and cover. Large fragments of organic material may be skimmed off at this stage if it can be assumed that they are free of sediment par- ticles. If oxidation is slow, or after it has slowed, the mixture is heated to 93°C and stirred occasionally. The addition of more of the hydrogen peroxide solution may be neces- sary to complete the oxidation. After the reac- tion has completely stopped, wash the sediment t.wo or three times with distilled water.
For samples containing significant quanti- ties of coal, it is essential that separation and quantitative determination be based on differ- ences in specific gravity. These separations have been accomplished with a mixture of bromoform and acetone adjusted to a specific gravity of 1.95 (White and Lindholm, 1950). The sediment either floats or settles into por- tions lighter or heavier, respectively, than 1.95 specific gravity. In the programing for deter- mination of particle size, attention should be given to the feasibility of analyzing both the mixture of all sediments and the part heavier than a specific gravity of 1.95 for some samples.
Because of the ‘drastic and unknown effects on the sediment (other than organic mater), the combustion process of removing organic matter should not be used. For example, on 83 samples of suspended sediment for the Schuyl- kill River at Berne, Pa., separated by the above liquid separation process with 28 percent lighter and 72 percent heavier than 1.95, it was found that ignition at 800% for a period of 1 hour or until combustion was complete resulted in 25 and 61 percent ash for the light and heavy separates, respectively. The heavier fraction may have contained some heavy organic sub- stances, but most of its 39 percent loss was due to loss of waters in the minerals and probably volatilization of some of the mineral constituents.
Aggregate destruction
If the silt-clay fraction from a given sample is to be analyzed in both a dispersed settling medium and a native water settling medium, complete dispersion of the one portion requires the removal of organic binding agents while the
LABORATORY THEORY AND METHODS FOR SEDIMENT ANALYSIS 53
portion to be analyzed in native water must not be so treated. However, ,these requisites create a serious problem in the interpretation of the resulting particle-size data. Many of the small aggregates or floccules transported by streams, especially at high stages, are soil aggregates whose flocculated condition is due not to the chemical quality of the stream water but to the soil conditions at the point of origin. If these aggregates are destroyed or broken down by treatment with hydrogen peroxide during prep- aration of the sample for analysis in a dis- persed settling medium, then differences be- tween the dispersed and the native size analyses are due not only to the flocculating ability of the native water but also to the destruction of original soil aggregates.
In view of the problem of aggregate destruc- tion, it is recommended that for some samples, particle-size distribution be determined using three different settling media. One portion should be treated with hydrogen peroxide and chemically and mechanically dispersed, a sec- ond portion should be chemically and mechani- cally dispersed but not treated with hydrogen
L peroxide, and a third portion should be analyzed in the native water medium and, of course, not treated with hydrogen peroxide. This three-way treatment will not only indicate the flocculation potential of the native water, but will also indi- cate the effect, if any, of organic matter on the apparent particle-size distribution of the sedi- ment sample.
Dissolved solids
The term dissolved solids refers, theoretically, to the anhydrous residue of the dissolved sub- stances in water not including gases or volatile liquids. In reality, the term is defined in a quan- titative manner lby the method used in its determination. For example, with the residue- on-evaporation method, both the drying temper- ature and the length of time of drying will affect the result. The quantity of material in the evap- orating dish is also a factor (Rainwater and Thatcher, 1959) ; massive residues give up their waters of crystallization more slowly than their residue films, and may become entrapped and pockets of water “sealed over.”
Dissolved solids information is used three ways in sediment investigations: (1) the net sediment concentration determined by the sedi- mentation-decantation-evaporation method may need correcting if the dissolved solids content of the water evaporated is relatively high (p. 12) and if the concentration of sediment is rela- tively low ; (2) the dissolved solids in both the chemically dispersed and native water settling media for particle-size analysis must be known (pp. 29, 42) to determine reliable gradation data ; (3) the dissolved solids concentration should be published with size analyses deter- mined with native water as a settling media for possible correlation with flocculation tendencies.
The dissolved solids determination in sedi- ment laboratories should be made by the residue- on-evaporation method. A volume of sample that will yield less than 200 mg of residue is evaporated slowly just to dryness using a steam bath, if available. The residue is dried at 110°C for 1 hour, cooled in a desiccator, and immedi- ately weighed. An efficient desiccant must be used since many of the salts in the residue are hygroscopic. Alumina with a moisture indicator is recommended. The dried residues should not be allowed to stand for long periods of time before weighing. Only a few dishes of residue should be included in one desiccator because of the effect of contamination with outside air dur- ing the weighing. Under no circumstances should dissolved solids dishes be cooled in a desiccator containing sediment dishes unless it is known that the sediment is mostly sand-sized particles.
The recommended calculation for concentra- tion is
mg/l dissolved solids=grams of residuex l,OOO,OOO. ml of sample
The answer should be reported to the nearest whole number and to only three signicant fig- ures above 1,000 mg/l.
Related water-quality analysis
In connection with obtaining an understand- ing of the effects of environment on fluvial sedi- ment, especially with respect to transportation and deposition, it is desirable to evaluate specific
54 TECHNIQUES OF WATER-RESOURCES INVESTIGATIONS
conductance, pH, the concentration of calcium,bicarbonate, sodium, potassium, and magnesiumfor all samples split for particle size and ana-lyzed in both chemically dispersed and nativewater settling media . These determinations aremost efficiently made in a chemical laboratoryusing standard methods and equipment . A sam-ple of the native water consisting of at least200 nil should be withdrawn just prior to split-ting the sediment and tightly stoppered forstorage until analysis by the chemical labo-ratory . The sample is withdrawn just prior tothe particle-size analysis because it is desirableto include the effects of storage with the sedi-ment, The results of these chemical analyses arethen noted as constituents of the native watersettling media for the size analysis and may ormay not be representative of the stream at thetime the sediment samples were collected. Itshould be emphasized that both the native-watersize analysis and the related water-quality anal-ysis should be performed as soon as possibleafter the samples are collected in order to mini-mize the effects of storage resulting from theinteraction of the ions and the sediment .
Specific gravity
The measurement of specific gravity is ac-complished by direct measurement of weightand volume . Generally the weight can, bedetermined easily and with a fair degree ofaccuracy . The accuracy of the method thendepends on the accuracy of the volume meas-urement . If the sample particles are large(about 20 or 30 mm in diameter), the volumeis determined by noting the displaced volumeof a liquid before and after immersion of thesediment particles . The direct method of volumemeasurement is most suitable for large frag-
ments, but may result in considerable errorbecause of air-filled pore space in or on theobject or sample .For fine sediment where small samples may
be used, measuring by the pycnometer is themost satisfactory . The method involves thewell-known Archimedes principle in which thevolume is determined by weighing the pycnom-eter which contains a definite volume firstwith distilled water and then with the sedimentadded to the distilled water . The water for theinitial weighing should be at 15°C and theweight labeled a. Remove I or 2 ml of thewater and insert 1 .0 g of the sample . Use suctionor boiling to remove air bubbles and fill againwith water of the same temperature . Weighand record this weight as b . Specific gravity=1/(a+l)-b can then be computed . If someother liquid is substituted for water to avoiddifficulty with air bubbles adhering to the sandor crushed material, the computation mustobviously take into account the specific gravityof the liquid .
Specific weight
Specific weight is weight per unit volume . Inthe metric system of grams per cubic centi-meter, specific weight would be equal to specificgravity . The most common English system ofdimensions used in connection with soils andsediment deposits or of water-sediment mixturesis that of pounds per cubic foot . The method ofmeasurement is simple in that the dry weightof a known volume of the undisturbed materialis necessary . The main problem is then one ofsampling to obtain the correct. amount of mate-rial for the given sample volume ; the difficultyis that any sampling technique is likely to dis-turb the sample in some way.

LABORATORY THEORY AND METHODS FOR SEDIMENT ANALYSIS
Baver, L. D., 1956, Soil physics [3d ed .j : New York,
John Wiley and Sons, 398P.
Grim, R. E., 1953, Clay mineralogy : New York, Mc-
Graw-Hill Book Co., 384p.
Kilmer, V. J., and Alexander, L. T., 1949, Methods of
making mechanical analyses of soils : Soil Sci ., v.68, p. 22 .
Kravitz, J. H., 1966, Using an ultrasonic disruptor as
an aid to wet sieving : Jour . Sed. Petrology, v. 36,no. 3, p. 811-812.
Krumbein, W. C., 1934, Size frequency distributionsof sediments : Jour. Sed. Petrology, v. 4, p . 65-77.
Krumbein, W. C, and Pettijobu, F. J., 1938, Manual ofsedimentary Petrography : New York, D. Appleton-Century Co., 549 p.
Lane, E. W., and others, 1947, Report of the subcom-
mittee on sediment terminalogy : Amer . Geophys.
Union Trans., v. 28, no . 6, P. 936-938.
Masten, R. P., and Johnson, A. I, 1964, Ultrasonic dis-
persion of samples of sedimentary deposits, in
Geological Survey research 1964 : U.S . Geol. Survey
Prof . Paper 501-C, p. 159-161.
Rainwater, F. H., and Thatcher, L. L., 1959, Methodsfor collection and analysis of water samples : U.S.Gent . Survey Water-Supply Paper 1454, 301 p.
Ritter, J. R., and Helley, E. J., 1968, An optical methodfor determining particle sizes of coarse sediment :
U.S . Geol . Survey open-file report, 43 P.
Robinson,G. W.,1922, Notes on the mechanical analysisof humus soils : Jour. Agr. Set, v. 12, P. 287-291.
Rouse, H., 1938, Fluid mechanics for hydraulic engi-neers : New York, McGraw-Hill Book Co ., 422 P.
Udder, J. A., 1898, Mechanical composition of winddeposits : Augustana Library Publications, no . 1,P. 6.
Selected References
55
White, W. F., and Lindholm, C. F., 1950, Water re-
sources investigation relating to the SchuylkillRiver Restoration Project : Penn . Dept . Forests and
Waters, p. 18.
Wolman, M. G., 1954, A method of sampling coarseriver-bed material : Amer . Geophys. Union, Trans.,v. 35, no. 6, p. 951-956.
U.S . Inter-Agency Committee on Water Resources, Sub-committee on Sedimentation, 1941, Methods ofAnalyzing Sediment Samples, Report 4 of A Study
of Methods used in Measurement and Analysis of
Sediment Loads in Streams : 204 p.
-1943, A Study of New Methods for Size
Analysis of Suspended Sediment Samples, Report
7 of A Study of Methods used in Measurement and
Analysis of Sediment Loads in Streams : 102 p.
-1953, Accuracy of Sediment Size Analyses made
by the Bottom-withdrawal-tube Method, Report 10of A Study of Methods used in Measurement andAnalysis of Sediment Loads in Streams : 115 p.
-1957a, The Development and Calibration of the
Visual-accumulation Tube, Report 11 of A Study of
Methods used in Measurement and Analysis of
Sediment Loads in Streams : 109 p.
-1957b, Some Fundamentals of Particle-size
Analysis, Report 12 of A Study of Methods Used in
Measurement and Analysis of Sediment Loads in
Streams : 55 p.
-1958, Operators Manual on the Visual-accumula-tion-tube Method for Sedimentation Analysis of
Sands, Report K of A Study of Methods used in
Measurement and Analysis of Sediment Loads in
Streams : 28 p.
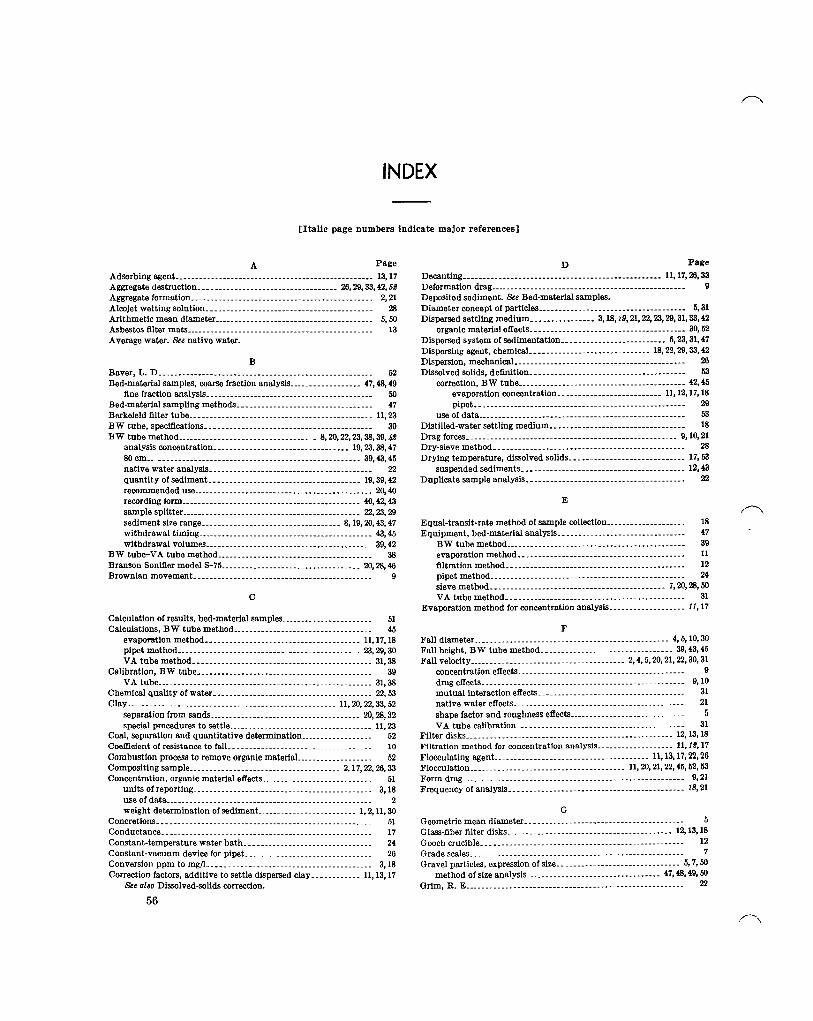
INDEX
[Italic page numbers indicate major references]
A Page Adsorbing agent ________________________________________---------- 13.17 Aggregatedestruction _________________ ____ ______ _ _______ 26,29,33,42,6g Aggregate formation-. ____ __ __ __ __ ____ __ ______ _ _____________ _____ 221 Alcojet wetting solution--- _______ ________ _._____ _______________. 28 Arithmetic mean diameter---. __________ _ _________________________ 5,50 Asbestos Elter mats..-.----.-.-....------------------------------- 13 Average water. Sea native water.
B Baver, L. D ________________________________________-------------- 52 Bed-material samples, coarse fraction analysis ____ -__ __ __ _______ 47,48,49
fine fraction analysis-. _________ ________ ____ __ _ _____________ ___ 59 Bed-material sampling methods---. ______________________________ 47 BerkefeldEltertube ____ _____ ________ ___ ______.__._.______________ 11,23 BW tube,speclflcations __________ ____ _____ _ ______________________ 39 BWtubemethod _______________ _ _._. _ ____________ _ 8,20,22,23,38,39,@
analysis concentration ______________ _ ______ _ ____________ 19,23.38,47 8Ocm.. __________ _ _____________________ _ ____________ _ _____ 39,43,45 nativewateranslysis......-...-.-~-.---~---.----------------- 22 quantity of sediment ___________________________ _ __________ 19,39,42 recommended usB......-...---..----------~-~---------~----~-- 20,40 recordlngform-.-..-........-.----~-~-----------------~---- 40,42,43 ssmplesplitter............ __________ _ _______ _ ______________ 22,23,29 sedimentsirerange _______ _ ______.____.__._.__________ 8,19,20,43,47 wit’hdrawal timing.. ____ ___ _ _______ __ ____________ __ __ ___ ____ __ 43.45 withdrawal volumes __________________________________ __ _____. 39,42
BW tube-VA tubemethod _______ ___ _____________________________ 38 BransonSonliiermodelS-75 ________ _ ___________ _____ ______ ____ 20,!28,46 Brownlsnmovement-.-.-.--..----.--....-......-...-...-..-.-.-. 9
C
Calculation of results, bed-material samples ________ _ ________ __ ___ _ 51 Calculations, BW tube method ____________________-------------.- 45
evaporation method ____________________----------------.- 11,17,18 pipetmethod ______ _ _____________. _ _____ ________________._ 23.29,30 VAtubemethod __________________________________ ___._ ___.__ 31.38
Celibration,BWtube ____ _ ________ ___ _____________ _ _____ __ ____ ___ 39 VA tube ______________________________ ______ _ .__.._.__.______ 31,38
Chemicalqualltyofwater _______________ _____ ___.________________ 22,53 Clay.--- ______._._._________-----.--------------.--.. -_._ 11,20,22,33,52
separationfromsands _____________ _ _______ _ __..____._____ __ 20,28,32 special procedures to settle-... ____________._......-----.-.-.-- 11,23
Coal, separation and quantitative determination ____. _ __ _ _ ____ _ _ __ 52 Coe5cient of resistance to fall ____ .__......______._........-...-. 10 Combustion process to remove organic material ________________ ___ 52 Compositingsample __________ __._ ________ _ .._..__________ 2,17,22,26.33 Concentration, organic material effects __.____._________ _ __________ 51
units ofreporting...........---------------.-------------.--.. 3,18 useofdata.-..............----.------------------------------- 2 weight determination of sediment _.____.__ ._____.._______ 1,2,11,30
Concretions-..-...................------.----.-.-------------.--. 51 Conductance ___._________......_-----.--.----.---.-------.-..---- 17 Constant-temperature water bath ______.___ _ _.____.___.__.._._ ___ 24 Constant-vacuum device for pipet ___._._.________... _ __...____._ _ 26 Conversionppmtomgfl_____..._._. _.._ _..._____________________ 3,18 Correction factors, additive to settle dispersed clay ______._..__ 11,13,17
See also Dissolved-solids correction.
56
D Page Decanting _______ _ _______ __ ____________________ _ ____________ l&17,26,33 Deformation drag ______ _ ________________________________________-- 9 Deposited sediment. See Bed-material samples. Diameter concept of particles ___________._________________________ 5.31 Dispersed settling medium.-- ____ _________ 3,18, iO,21,22,23,29,31,33.42
organic material affects ______________ _ ___________________ _ ____ 30,52 Dispersed system of sedimentation ___________ ____ ___________ 6,23,31,47 Dispersingagent,chemical____ _ ________.___ _____ ._____ __ 18,22,29,33,42 Dispersion,mechanical--.-.--...--~---------------------~-------- 23 Dissolved solids, definition. _ _ _________ _ _______ ___________ _ _______ 53
correction, BW tube ________________________________________-- 42,46 evaporation concentration __________________________ 11,12,17,18 pipet--..--.--.----.~---------.-.-~---~----~------ 29
useofdata...-..-.-----------------------------~-----~-------- 53 Distilled-water settling medium ________________ _ ___._ ___ _________ 18 Dragforces-.-.- __________ _ ____.__________.._ _ _________________ 9,10,21 Dry-sievernetbod..--.~-----------~~------------~--~---~~~-----~- 28 Drying temperature. dissolved solids--- __- __________ ___ ._ _______ _ 17,53
suspended sediments-. _ ___ ____ _______________ _______ __ _ _____ _ 12,43 Duplicate sample analysis ________________________ _ ___.___ _ ______ _ 22
E F-Y
Equal-transit-rate method of sample collection-.. __________ ____ __ _ 18 Equipment, bed-material analysis _____ _ __._____ _ _______________ __ 47
BWtubemethod ________ __ _________._ _ ______ _________________ 39 evaporation method.. __ __________ _ __________________________ _ 11 filtration method.- _____________________________________ ______ 12 pipetmethod _______ ___ __________. ____________________ __ _____ 24 sievemethod _____________ _ __________ _ _________________ __ 7,20,28,59 VA tubemethod ________________ _ _________ _ ______ ___ _________ 31
Evaporation method for concentration analysis ___________________ 11,17
F Falldiameter _________ _ __________ _.._ _________..____ _ _________ 4,5,10,30 Fall height, BW tube method.. .__.________.._____________ ____ 39.43.45 Fallvelocity _____________..._ _ _____..___.______ ____ 2,4,5,20,21,22,30,31
concentrationeffects __________ _ _________ __.__ ________________ _ 9 drageffects ___________.._._____----.-----------.- __.._____.._ 9,lO mutual interaction effects. ._. ____ __. _. __.. _ __ __ __ __ __- ____ _ _ __ 31 nativewatereffects-......-.......-------...-..----------.---- 21 shape factor and roughness effects .___.___._ ._.__ ____.___...__ 5 VA tube calibration.-- _ ___ _.. _ __ _. ._________. _. _ _ __ 31
Filter disks _.______ __ ___.__ _ __________________ _ .____________.__ 12,13,18 Filtration method for concentration analysis. _.___._ __ ._ ._ ___ 11, 12 17 Flocculating agent __._._..___.________--------.------- ___ 11,13,17,22,26 Flocculation __._.._________._____ ____ ______ _ .______ 11,20,21,22,45,62,53 Formdrag .___._._.__.________________ __________.__ _____ ______.__ 9,21 Frequencyofanalysis. _____ _ __________________ _ ____ __ ____________ f&21
G Geometricmeandiameter-......-....---.-.------------.---.---.-- 5 Glass-fiber Elter disks _.______________________ _ _____ _ ___________ 12,13,18 Goochcrucible.--..-.........-.-.-........----------------..----- 12 Grade scales ___....__....__.____-.-..------------. _ ____________-__ 7 Gravel particles, expression of size __.._____._______________ _ ----- 5,7,50
methodofsiseanalysis _______ _______ _________ _ _____ _ ____ 47,48,49,59 Grim. R.E ___________ _ ______ ____ ________ ______-__ _____ ___ __-- _-_- 22

INDEX 57
H Page Harmonicmesndiameter ____________________________ ____ _______ __ 5 Humus, colloidal-. ______________ _ _____ __ __ ___________________ ____ 62 Hydrogen peroxide process to remove organic material... _________ 20
I
Immersed screen method of sieving. _____________ __ __ __ ____ ______ _ 28 Immersion techn!que for measurement of nominal diameter...... 48.50 In situ measurement of bed material ______________________________ 48 Initial break tube for VA tube size selection _____________-________ 37 Inter-Agency report No. 4, 194L-.. ______________________________ 8,9,10 Inter-Agency report No. 7, 1943 ________________________________ 38,39,42 Inter-Agency report No. 10, 1953 ._________________________________ 47 Inter-Agency report No. 11, 1957s..-. _ _________________________ 31,32,37 Inter-Agency report No. 12, 19571, _____ _______ _ ____________ _______ 4,5,10 Inter-Agency report No. K, 1958 _______________ _ __________________ 31 International Society of Soil Science ________ _ _____ _ _______________ 62
J Jones-Otto splitter, modified ____ _ ___________________________ 22,29,48,60
K
Kilmer, V. J., and Alexander, L. T.. _____________________________ 29 Kravits, J. H ________________________________________------------- 20 Krumbein, W. C __________ _ _________ _ ___________________ _ ________ 7 Krumbein, W. C., and Pettijohn, F. J ____._____ _ __________ 5,7,24,29,60
L Laboratory forms, BW tube ____ ____ _ ___________ _ _____ _ ________ 40,42,43
concentrationnotes ________ _ ________________ _ _____ za,i7,i8,26,33,40 sieve-pipet ______________ _ ________. _ __________ _ _______ 24,26,28,29,30 VAtube-pipet.... _______ _ ___________ _ __________________ 31,33,38,49
Lane, E. W.,andothers ___________ __.__ ______ _ ________________ _-- 7 Liquid separation process to remove organic material...-......-.- 52
M
Meandiametersoflergepsrticles-.. _._________ ______ ____ ____ __--- 5,5’ Mechanical dispersion _____._____ _____ _____ __ __ ____ __ _ 22, Q6,28,29,42,53 Milligrams per liter (mgfl) ____________ __ __________________ _ _______ 3,18 Moston, R. P., and Johnson, A. I ________ _ _______________________ 20 Mutual interaction effect of particles in VA tube-- __ __ ________ __ _ 31
N
Native water, sepamtion difllculties.. __________ _____ ___________ 2,11,23 Native water settling medium _____________________ 18,~0,26,33,42,62,54
organicmaterialeffects--.-..--.....~--------.-----------.~--- 22,52 preparation of average water ______ __________________ __________ 22
Nominaldiameter ._________._ _ ____________________________ 4,5,48,49,60
0 Odencurve _____________ _._ _____________ _ ____________..__ 20,39,42,46,47 Odentheory......... __________ _____ _________.___________ ___ 2&S&43,47 Operatingprocedure,BWtube..... _______ _ _________ ___ ____ _ _.___ 42
evaporation method.. ________ ___ ________._. _ ______ ___ __ ._____ 17 plpetmethod .________ _ ______ __ _____________________ __ ________ 23,29 sievemethods--....-....--------........-.....-.------------- 28 VAtubemethod _______ _ _____________________._________ _ _____ 31,57
Organic material, quantitative determination.. ._ _____ _____ ____ __ - 52 removal ________ _ _____ _ _______________._________ ________ Q&33,51,66
Oxidation method to remove organic material ______________.______ 52
P Particleshapefaotor.... ____________ _ ________ _________ ________ ____ 5,50 Particle size, concept-- _ __ _ __ __ ._ __ __ ____ _______ __ __ ___ ______ __ __ _ 4
messuresof.................-...........-......-...-.----~-~.- 6,7 Psrticle-size distribution, affected by aggregate destruction.. _____ 4,53
affectedbyflocculation. _________________________ _ 19,20,21,22,39,45 affected by organic material _______________________________ ___ 20
Particle-size division ..___________._.......--.--.-- 7,8,19.20,28,29,50,51 Particles falling in a fluid, theory-. ._______..___ ._______________ 8 Partspermillion(ppm) _________ _ _________ ________ _______________ 3,18 Pebble count method (Zeiss Particle-Size Analyzer).. __ ____ _ _____ 48 Percentage flner than indicated sises.~~. _________________________ _ 23,30 Phiscale.-.............---~------.~------------------------------ 7
Page Pipetmethod __________________________________ 2,8,22,23,Q9,33,40,50,61
analysis concentration. _______________ _ _____________ _ 19,20,22,23,29 quantityofsediment ________ _ _______ _ ____________________._ 2,19,33 quantity of suspension ________________________________________ 20 recommended for native water silt-clay analyses ______________ 22 sediment size range ___________________________________ 8,19,22,24,29 withdrawal timingv.. ______________________________________ ___ 23,24
Pycnometer method for measuring specffic gravity ________________ E4
R
Rainwater, F. H., and Thatcher, L. L __________ _ ____ __ ___________ 22,53 Recording data, BW tubemethod-. ________ ___ _____ ___ ___________ 43
pipet method ________________________ 1________________________ 20,30 sievemethod---..--.-........--.-.--------------------------- 28,30 suspended-sediment concentration ____________________________ 13,17 VAtubemethod--......-.--......----------------------------- 31
Residue-on-evaporation method, dissolved-solids determination.. _ 63 Reynoldsnumber---..-.-...-..----------------------~----------- 10 Robinson, 0. W. ________________________________________--------- 62 Rotapsieving.---..-..-.----------------------------------------- 48,60 Rouse,H ____________ _ ____ _ _______________________________________ 9
6 Sample duplicates ________________________________________-------- 22 Sample preparation, bed-material anslysis _______________________ _ 49
BW tube method ________________________________________----- 40 concentration anatysis.~ _- _____ _____________ _ _________________ 11,17 nativewsteranalysis ______________ _____ _______ _____ _-________ 22 pipet method _______________________________________ _ _ _____--- 26 VAtubernethod---..-....-.----------------------~---------- 32
Sample selection _____ ______ __ _____ _ __________ ____________ _________ 3,18 Samplesettling. ___________ _ _________ _ _______ __ ____--- _ ---_____ 11,23,26 Sand analysis, mechanical methods--.-. ____ _____ 8,19,20, ‘J&30,42,48,61
sedimentation methods ____ _ _____ 8,19,20,22,23,30,32,33,38,40,47,61 Scaleofsizes _____________________________________ _ ______________ __ 7 Schuylkill River at Berne, Pa ___________ _ _________---___-________ 62 Sediment Concentration Notes __________________.__ __ 1% 17,18, ?.5,33,40 Sediment laboratory functions-.. __________ __ ________-___-_______- 1 Sedimentation diameter ____________________----.-- 3,4,5,10,19,20,21,60 Separation,sandfromfines-...... _______ _ _________ 20,28,30,32,33,42.60 Settlingmediums~..... _____ _ ____ _ ___________________________ 8,19,20,22 Settlingvelocity---.-. ____ _ ______________________ __ -___-_-__ 4,6,8,23,43 Sievediameter ___________________ _ ______ _ _________________ _ _______ 4,30 Sievemethods-. _____________________ _ ______ 3,8,19,20,n,Q8,31,42,M),61
quantityofsediment ____ _ ____ _ _____ _ __________________ _______ 19,28 sedimentsizerange--. _______ _ __________-______-____ 7,8,19,20,28,50 separation of sand from fines _____________ _ ____________________ 28,32 soisamples.....-.--...........---------------~--------------------- 61
Sieve-pipetform ______ __ ______________________ _ __________ 24,!20,28,29,30 Sieve-pip&method _____ _ ________ _ ________ _ _______ _ ____ 2,19,20,1,33,38 Significsnt~gures-..--......-..---------------------------------- 10,63 Silt-clay analysis, BW tubs method- _ _ ______ ____ _ ____ ___ ___ 19,38,40,42
nativewater.-..-....--.-....--..----------------------------- 22, ‘52 pipetmethod ________________________________________ 19,23,QQ,33,50
Size distribution, use of data ______________________________________ IS Size range, BW tube method _____________________________ 8,19,20,43,47
pipetmethod. _____ _ _____ _ __________________ _ ______ f-$19,20,22,24,29 sievemethod _______ _ ______ __ ___________ _ ____ _ ____-- 7,8,19,20,%,50 VAtubemethod ____._______________------------------.-- 3,8,19.60
Soilanalysis __________ _ ______ __ _________ ___ ________ _ ~~---~~~~~~--- 51 Soildispsrsioncup ________ _ ________________ ______ _ _____-_____---- 20 So~er....-.-.....------------------------------------~----~-- 20,28,46 Speci5cgravity ____..__________ ___ _______._ _ ___________--- __ 4,7,8,50,64 Speciflcweight ____________________ _ _____.__ _ _____ _ ____ _ --___--- 2,18,52
definition.-.-......----.---------------.----------------~----- 8.64 Splitting sample .____ __ __ ______ __ _ 2,19,20,22,23, Qd, 28,29,30,35,48,50,51 Standard fall diameter ._________ _ _____.._.__________.------------ 4,5,31 Standard fall velocity _________ _ ____________________________ _--_ 3,4, 5,4li Standard sedimentation diameter ____ ________ __ ____-- -_ -- -- -_ --- . Stokeslaw. ________ _ ___________ ___ ___________._____----- 8,9,10,23,24,29 Stratifled system of sedimentation _________ _ __ ____ _____--___- ---- 6,7,31 Supernstantlfquid _________ __ ____________ _____ ____ 11,12,17,26,28,33,40 surf8cedr8g ___________________ ___ ____-___- _ ____ __---_ ----_------- 9
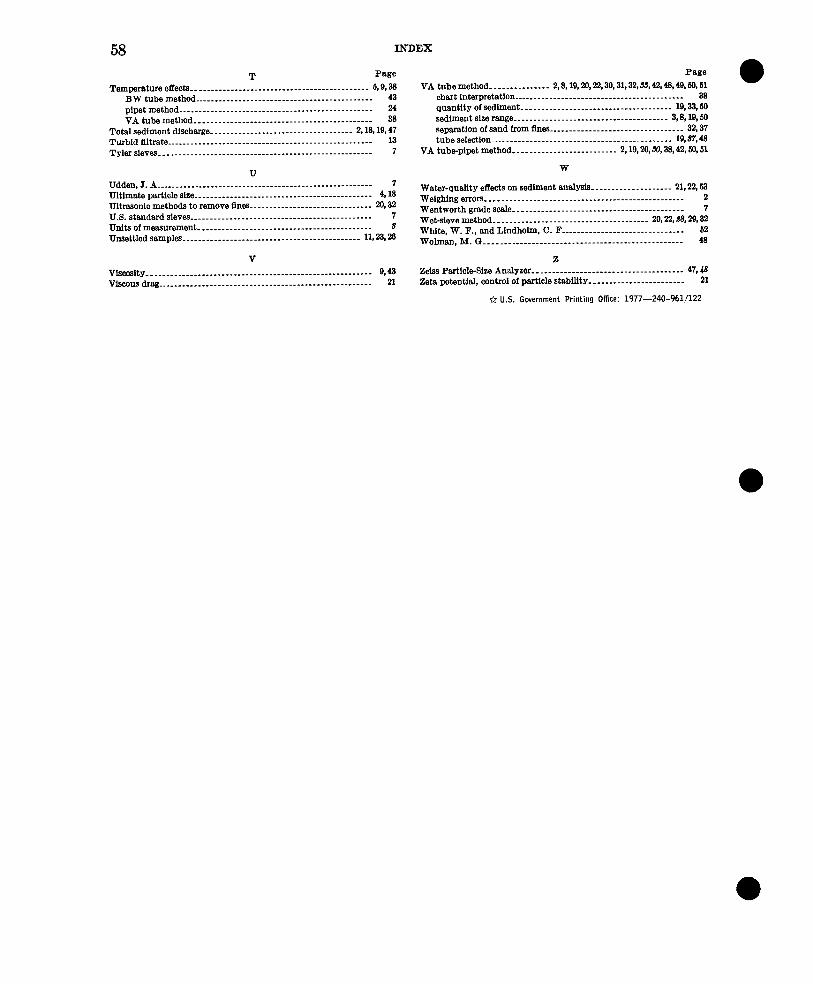
INDEX
T Page Temperature effects ________________________________________----- 6,9,33
BWtubemethod _______________ ____ __________________________ 43 pipetmethod-...--........--------------------~-------------- 24 VA tube method ________________________________________----- 38
Totslsedimentdischarge---... _________ _ ________ _ _____ _ _____ 2,13,19,47 Turbfdffltrate _______________________________ _ ___________ ___ ______ 13 Tylersievas-...---.-......----.......------------------------------ 7
U Udden,J.A ________________________________________-------- _ ______ 7 Ultimate p8rtiole siee ________________________________________----- 4,13 Ultrasonic methods to remove 5es ____ _ __________________________ 20,32 U.S. standard sieves ____________________ _ _________________________ 7 Units ofmeasurement-......-...........-.-----.----------------------- S Unsettled samples _______________ _ _____________________________ 11, 2&26
V vlscusity ____________________------------------------------------- 9,43 viscous drag ________________________________________-------------- 21
Page VAtubemethod _______________ 2,8,19,20,22,30,31,32,33,42,43,49,60,61
chartinterpretation..--..------------------------------------- 33 quantity of sediment _________________________________ _ ____ 19,33,60 sedimentsizerange _______________________________________ 3,8,19,50 sep8r8tionofs8ndfroml%lea ___________ _ _____________ _ ________ 3137 tube selection- ________________________________________----- lq37.48
VAtube-pip&method __________________________ 2,19,20,3&33,42,60,61
W
Water-qu8lity effects on sediment analysis ____________________ 21,22,63 Weighing errors _____________________ _ ____________________________ 2 Wentworth grade sealem. _ _________ _____________ _ _________________ 7 Wet-sievemethod _________________________ _ _______ _ _____ 20,22,88,29,32 White, W. F., and Lindholm, C. F ____________________________ ___ 62 Wolmsn, M. Q ______________________ _ _______________ __ __________ 43
Z Zeiss Psrticle-Size Analyzer ______________________________________ 47,48 Zeta potentisl, COntrOl Of &ticle St8biUtY ________________________ 21
* U.S. Government Printing Office: 1977--240-%1/122

BED-MATERIAL SAMPLE
Weigh ‘i
I Weigh
2 ( fvlediet icles)
(Unused)
I---T-- (Fine particles)
Weigh
Pipet
BW tube
(Unused)
Organic removal
Weigh
Dry sieve
Wet sieve
VA tube
I
I_ Weigh
Flow diagram for particle-size analysis of stream- tives for use of the data. For example, organic material bed-material samples. Blocks divided by horizontal is usually not present in significant quantity to be lines show alternate procedures. Some blocks can be bothersome. Also, there is little need to determine the bypassed depending on the amount, the condition, amount of the unused split porbons if the quality of and the size gradation of the sample and the objec- the splitting operation is assumed to be good.