laboratory and field performance measurements to … · laboratory and field performance...
TRANSCRIPT

Technical Report Documentation Page 1. Report No. FHWA/TX-12/5-5597-01-1
2. Government Accession No.
3. Recipient's Catalog No.
4. Title and Subtitle LABORATORY AND FIELD PERFORMANCE MEASUREMENTS TO SUPPORT THE IMPLEMENTATION OF WARM MIX ASPHALT IN TEXAS
5. Report Date February 2012 Published: July 2012
6. Performing Organization Code
7. Author(s) Cindy Estakhri
8. Performing Organization Report No. Report 5-5597-01-1
9. Performing Organization Name and Address Texas Transportation Institute The Texas A&M University System College Station, Texas 77843-3135
10. Work Unit No. (TRAIS) 11. Contract or Grant No. Project 5-5597-01
12. Sponsoring Agency Name and Address Texas Department of Transportation Research and Technology Implementation Office P. O. Box 5080 Austin, Texas 78763-5080
13. Type of Report and Period Covered Technical Report: September 2009 - August 2011 14. Sponsoring Agency Code
15. Supplementary Notes Project performed in cooperation with the Texas Department of Transportation and the Federal Highway Administration. Project Title: Implementation of Warm Mix Asphalt URL: http://tti.tamu.edu/documents/5-5597-01-1.pdf 16. Abstract An objective of this study was to monitor the performance of more than 10 warm mix asphalt (WMA) projects in the state. Several WMA technologies were included in the study (foaming, Advera, Evotherm, Rediset, Sasobit) and it was determined that performance of the warm mix was comparable to hot mix. In addition, mix from two warm mix projects were subjected to different curing times and temperatures and then evaluated for mixture volumetrics and performance properties. Results from this study lend support to the current procedures TxDOT has adopted.
17. Key Words Asphalt, Pavements, Warm Mix Asphalt, Construction
18. Distribution Statement No restrictions. This document is available to the public through NTIS: National Technical Information Service Alexandria, Virginia 22312 http://www.ntis.gov
19. Security Classif.(of this report) Unclassified
20. Security Classif.(of this page) Unclassified
21. No. of Pages 78
22. Price
Form DOT F 1700.7 (8-72) Reproduction of completed page authorized

LABORATORY AND FIELD PERFORMANCE MEASUREMENTS TO SUPPORT THE IMPLEMENTATION OF WARM MIX ASPHALT IN
TEXAS
by
Cindy Estakhri, P.E. Research Engineer
Texas Transportation Institute
Report 5-5597-01-1 Project 5-5597-01
Project Title: Evaluation of Warm Mix Asphalt
Performed in cooperation with the Texas Department of Transportation
and the Federal Highway Administration
February 2012 Published: July 2012
TEXAS TRANSPORTATION INSTITUTE The Texas A&M University System College Station, Texas 77843-3135


v
DISCLAIMER The contents of this report reflect the views of the authors, who are responsible for the facts and the accuracy of the data presented herein. The contents do not necessarily reflect the official view or policies of the Federal Highway Administration (FHWA) or the Texas Department of Transportation (TxDOT). This report does not constitute a standard, specification, or regulation. The engineer in charge was Cindy Estakhri (Texas, # 77583).
The United States Government and the State of Texas do not endorse products or manufacturers. Trade or manufacturers’ names appear herein solely because they are considered essential to the objectives of this report.

vi
ACKNOWLEDGMENTS
The author would like to acknowledge the TxDOT Project Director, Dale Rand, and all of the field support provided by the TxDOT districts who assisted in data collection and traffic control. Thanks are also given to the contractors (Knife River and Williams Brothers) who provided much assistance to facilitate the research objectives.

vii
TABLE OF CONTENTS
PAGE
List of Figures ............................................................................................................................... viii List of Tables ................................................................................................................................ xi Chapter 1. Introduction and Background ..................................................................................1 Introduction ..........................................................................................................................1 Chapter 2. Effect of Condition Temperature and Time on WMA Mixture Properties .........3 Bryan District SH 21 Foaming Process ...............................................................................4 Discussion of SH 21 Laboratory Curing Results .................................................................8 San Antonio District IH 37 WMA Sasobit and Evotherm Project ....................................15 Discussion of IH 37 Laboratory Curing Results ...............................................................17 Summary ............................................................................................................................23 Chapter 3. Field Evaluation of WMA Projects ........................................................................25 San Antonio Loop 368 .......................................................................................................25 Austin SH 71 ......................................................................................................................30 Lufkin FM 324 ...................................................................................................................34 Fort Worth BU 287 ............................................................................................................40 Beaumont US 190 ..............................................................................................................47 Bryan SH 21 .......................................................................................................................48 San Antonio IH 37 .............................................................................................................51 Wichita Falls SH 251 .........................................................................................................53 Riverside Test Sections Project 0-6992 .............................................................................55 Atlanta-Fine SMA IH 20 ...................................................................................................57 US 96 Jasper ......................................................................................................................60 Chapter 4. Conclusions and Recommendations ........................................................................63 Conclusions ........................................................................................................................63 Recommendations ..............................................................................................................64 References. ....................................................................................................................................65
viii
LIST OF FIGURES
PAGE
Figure 2.1. Effect of Curing Time and Temperature on Lab Mixed Evotherm WMA Hamburg Wheel Tracking Test Results (Estakhri et al. 2010) ...................................................3 Figure 2.2. Effect of Curing Time and Temperature on Hamburg Wheel Tracking Test Results for Different Types of Lab Mixed WMA (Estakhri et al. 2010) ............................3 Figure 2.3. Curing Time and Temperature Selection according to Tex 206-F and Tex 241-F (Figure provided by Gisel Carrasco, TxDOT Construction Division, Feb. 2012) ...................................................................................................................................4 Figure 2.4. Foamed WMA Mixture Placement on SH 21 in Bryan ...............................................6 Figure 2.5. Foamed WMA Mixture Compaction on SH 21 in Bryan.............................................6 Figure 2.6. Sample Fabrication at TTI’s McNew Laboratory ........................................................7 Figure 2.7. SH 21 Lab Molded Density versus Oven Curing Time for HMA and WMA (Texas Gyratory Compactor) ......................................................................................................8 Figure 2.8. SH 21 Percent Asphalt Absorption for HMA and WMA Cured at Different Times and Temperatures .............................................................................................9 Figure 2.9. Number of Superpave Compactor Gyrations to Achieve 93 Percent Density for Molding Hamburg Specimens .................................................................................9 Figure 2.10. SH 21 Hamburg Wheel Tracking Test Results for Hot Mix Cured at 250°F ..........10 Figure 2.11. SH 21 Hamburg Wheel Tracking Test Results for Warm Mix Cured at 250°F.......11 Figure 2.12. SH 21 Hamburg Wheel Tracking Test Results for Warm Mix Cured at 275°F.......11 Figure 2.13. SH 21 Hamburg Wheel Tracking Test Results for HMA and WMA Cured For 2 Hours at Different Temperatures .....................................................................................12 Figure 2.14. SH 21 Hamburg Wheel Tracking Test Results for HMA and WMA Cured For 4 Hours at Different Temperatures .....................................................................................12 Figure 2.15. SH 21 Overlay Test Results for HMA and WMA Cured at Different Times and Temperatures ...........................................................................................................13 Figure 2.16. Placement of WMA on IH 37 in San Antonio .........................................................16 Figure 2.17. Compaction of WMA on IH 37 in San Antonio.......................................................16 Figure 2.18. IH 37 Lab Molded Density for HMA and WMA Cured at Different Times and Temperatures ...........................................................................................17 Figure 2.19. IH 37 Asphalt Absorption for HMA and WMA Cured at Different Times and Temperatures ...........................................................................................18 Figure 2.20. IH 37 Hamburg Wheel Tracking Test Results for Hot Mix Cured at 300°F ...........19 Figure 2.21. IH 37 Hamburg Wheel Tracking Test Results for WMA Evotherm Cured at 230°F ..........................................................................................................................19 Figure 2.22. IH 37 Hamburg Wheel Tracking Test Results for WMA Evotherm Cured at 275°F ..........................................................................................................................20 Figure 2.23. IH 37 Hamburg Wheel Tracking Test Results for WMA Sasobit Cured at 250°F ...........................................................................................................................20

ix
Figure 2.24. IH 37 Hamburg Wheel Tracking Test Results for WMA Sasobit Cured at 275°F ..........................................................................................................................21 Figure 2.25. IH 37 Hamburg Wheel Tracking Test Results for HMA and WMA Cured For 2 Hours at Different Temperatures .....................................................................................21 Figure 2.26. IH 37 Hamburg Wheel Tracking Test Results for HMA and WMA Cured For 4 Hours at Different Temperatures .....................................................................................22 Figure 2.27. IH 37 Overlay Test Results for HMA and WMA Cured at Different Temperatures and Times ...........................................................................................................23 Figure 3.1. San Antonio Loop 368 Evotherm Field Trial Location and Layout ..........................26 Figure 3.2. Hamburg Wheel Tracking Test Results for Lab Molded Warm Mix And Hot Mix Compared to Roadway Cores for Loop 368 .......................................................27 Figure 3.3. Overlay Test Results for Lab Molded Warm Mix and Control Mixes Compared to Roadway Cores for Loop 368 .............................................................................27 Figure 3.4. Indirect Tensile Strength Test Results for Lab Molded Warm Mix and Control Mixes Compared to Roadway Cores for Loop 368 .....................................................28 Figure 3.5. San Antonio Warm Mix Section after 3 Years of Service .........................................29 Figure 3.6. Evidence of Longitudinal Cracking Appearing in Both WMA and HMA Sections .........................................................................................................29 Figure 3.7. Ride Score Measurements for Loop 368 ....................................................................30 Figure 3.8. WMA Project on SH 71 in Austin ..............................................................................31 Figure 3.9 Hamburg Wheel Tracking Test Results for Lab Molded Warm Mix And Hot Mix Compared to Roadway Cores for US 71 ...........................................................32 Figure 3.10. Overlay Test Results for HMA and WMA Roadway Cores for US 71 ...................32 Figure 3.11. Indirect Tensile Strength Results for HMA and WMA Roadway Cores for US 71 ........................................................................................................................33 Figure 3.12. Ride Score Measurements for Loop 368 ..................................................................34 Figure 3.13. Construction of Lufkin WMA Field Trials ..............................................................35 Figure 3.14. Hamburg Wheel Tracking Test Results for Lab Molded Warm Mix and Hot Mix Compared to Roadway Cores for FM 324 .................................................................37 Figure 3.15. Overlay Test Results for Plant Mix-Lab Compacted HMA and WMA And Roadway Cores for FM 324 ..............................................................................................37 Figure 3.16. Indirect Tensile Strength Results for HMA and WMA Roadway Cores for FM 324 ......................................................................................................................38 Figure 3.17. Alligator Cracking at South End of Project ..............................................................40 Figure 3.18. BU 287 Jointed Concrete Pavement Prior to Type D WMA Overlay .....................42 Figure 3.19. BU 287 Type B WMA Base Mix and Type D WMA Overlay ................................42 Figure 3.20. Hamburg Wheel Tracking Test Results for Type B and Type D WMA on BU 287 ......................................................................................................................44 Figure 3.21. Overlay Test Results for Type B and Type D WMA on BU 287 ............................45 Figure 3.22. Indirect Tensile Strength Results for Type B and Type D WMA For BU 287 ...............................................................................................................................45 Figure 3.23. Fort Worth BU 287 WMA Project after One Year of Service .................................46 Figure 3.24. Ride Score Measurements for BU 287 .....................................................................46 Figure 3.25. Hamburg Wheel Tracking Test Results for US 190 .................................................48 Figure 3.26. Ride Score Measurements for US 190 .....................................................................48 Figure 3.27. Hamburg Wheel Tracking Test Results for SH 21 ...................................................49 Figure 3.28. Overlay Test Results for SH 21 ................................................................................50

x
Figure 3.29. Ride Score Measurements for SH 21 WMA ............................................................50 Figure 3.30. Hamburg Wheel Tracking Test Results for IH 37....................................................51 Figure 3.31. Overlay Test Results for IH 37 .................................................................................52 Figure 3.32. Ride Score Data for IH 37. .......................................................................................52 Figure 3.33. Hamburg Wheel Tracking Tests for SH 251 ............................................................53 Figure 3.34. Indirect Tensile Strength Results for SH 251 ...........................................................54 Figure 3.35. Transverse Cracking in both HMA and WMA Sections of SH 251 ........................54 Figure 3.36. Hamburg Wheel Tracking Tests for Riverside Test Sections ..................................55 Figure 3.37. Overlay Test Results for Riverside Test Sections ....................................................56 Figure 3.38. Indirect Tensile Strength Tests for Riverside Test Sections ....................................56 Figure 3.39. Severe Flushing (Atlanta-Fine SMA) .......................................................................58 Figure 3.40. Rutting for 2-miles in Westbound Direction (Atlanta-Fine SMA) ..........................59 Figure 3.41. Flushed and Moisture Damaged Core Specimens (Atlanta-Fine SMA) ..................59 Figure 3.42. Rutting Intersections on US 96.................................................................................61 Figure 3.43. Cores Taken from Rutted Intersection on US 96 .....................................................62

xi
LIST OF TABLES PAGE
Table 2.1. WMA Foaming Project Mixture Design for SH 21 Bryan District ...............................5 Table 2.2. Temperature and Curing conditions for Loose Mix Sampled from SH 21 ...................8 Table 2.3. SH 21 Overlay Test Data for Mixtures Cured at Different Temperatures and Times ...........................................................................................................14 Table 2.4. WMA Project Mixture Design for IH 37 San Antonio District ...................................15 Table 2.5. Temperature and Curing conditions for IH 37 HMA and WMA ................................17 Table 3.1. San Antonio Loop 368 WMA Field Project Details ....................................................25 Table 3.2. Summary of Cracking Distress on Loop 368 WMA and HMA Test Sections ............28 Table 3.3. Austin SH 71 WMA Field Project Details ...................................................................30 Table 3.4. Summary of Distress on US 71 WMA and HMA Test Sections .................................34 Table 3.5. Lufkin WMA Field Trial Project Details .....................................................................35 Table 3.6. Hamburg Wheel Tracking Test Results from Plant Mixed, Lab Compacted Specimens .......................................................................................................36 Table 3.7. Summary of Distress on US 71 WMA and HMA Test Sections .................................39 Table 3.8. Fort Worth BU 287 Type B WMA Project Details .....................................................43 Table 3.9. Fort Worth BU 287 Type D WMA Project Details .....................................................43 Table 3.10. Beaumont US 190 Rediset WMA Project Details .....................................................47 Table 3.11. Bryan SH 21 Foaming WMA Project Details ...........................................................49 Table 3.12. IH 37 Sasobit and Evotherm WMA/HMA Project Details........................................51 Table 3.13. SH 251 Graham WMA/HMA Project Details ...........................................................53 Table 3.14. Riverside Test Section WMA/HMA Project Details .................................................55

xii

1
CHAPTER 1 INTRODUCTION AND BACKGROUND
INTRODUCTION
Project 0-5597, Evaluation of Warm Mix Asphalt (WMA) New Technology, was a three-year research study that ended in 2009 (Butten et al 2007, Estakhri et al 2010). Positive research results from this study which included both laboratory and field evaluation of different types of warm mix processes contributed to the statewide implementation of Special Provision 341—020. This special provision (which was required on all projects with Item 341 beginning with the January 2009 letting) allowed warm mix asphalt to be used at the Contractor’s option and, as such, the use of warm mix has grown at a very rapid pace throughout the state. Because of the rapid and large scale implementation of WMA in the state, it was important in this implementation project to monitor performance within the first ~3 years of service to ensure at least equivalent performance to HMA. WMA pavements (covering the range of WMA processes) were monitored to ensure performance is at least equivalent to HMA. This monitoring included quantitative field and laboratory measurements of performance. Research project 0-5597 also showed that WMA Hamburg Wheel Tracking Test results could be improved by extending the laboratory oven-curing time from 2 hours to 4 hours. This 4 hour curing time is being allowed for samples produced for mechanical testing but needs to be validated on WMA plant mixes. Alternatively, when a 2 hour cure at the recommended compaction temperature is used during the production of plant mix trial batches, the additional compaction (and increased density) achieved due to moisture and/or the additive, may be allowing for a reduction in asphalt content on some projects which could cause some long term durability issues. Additional validation of the curing time and temperature was performed in this implementation study on two field projects.

2

3
CHAPTER 2 EFFECT OF CONDITIONING TEMPERATURE AND TIME ON WMA
MIXTURE PROPERTIES
Research project 0-5597 showed that WMA Hamburg Wheel Tracking Test results are significantly affected by the temperature and amount of time for oven curing the loose mix prior to sample molding as shown in Figures 2.1 and 2.2 (Estakhri et al. 2010). Data generated in study 0-5597, as well as TxDOT in-house evaluation, and field performance characteristics of warm mix, lead to TxDOT adopting a 4-hr curing time at a temperature of 275°F for warm mix. A summary of how curing temperature and time is selected is presented in Figure 2.3.
0
2000
4000
6000
8000
10000
12000
HMA 2 hr cureat 250 F
WMA Evotherm2-hr at 220 F
WMA Evotherm2-hr at 275 F
WMA Evotherm4-hr at 275 F
Num
ber o
f Ham
burg
Pas
ses
to 1
2.5
mm
Rut
Dep
th
4.9% PG 64-22
Figure 2.1. Effect of Curing Time and Temperature on Lab Mixed Evotherm
WMA Hamburg Wheel Tracking Test Results (Estakhri et al. 2010).
0
2000
4000
6000
8000
10000
12000
14000
16000
18000
HMA WMA Advera WMA Sasobit WMA EvothermNu
mb
er o
f Pas
ses
to 1
2.5
mm
Ru
t Dep
th
2 hr cure at Comp Temp 4 hr cure at 275ºF
250275
220
275
220
275
220
275
4.9% PG 64-22
Figure 2.2. Effect of Curing Time and Temperature on Hamburg Wheel Tracking Test
Results for Different Types of Lab Mixed WMA (Estakhri et al. 2010).

4
Figure 2.3. Curing Time and Temperature Selection according to Tex 206-F and Tex 241-F (Figure provided by Gisel Carrasco, TxDOT Construction Division, Feb. 2012).
Effects of curing time and temperature were further evaluated in this implementation study as presented herein to validate TxDOT’s current laboratory curing time and temperature for WMA. Two field projects represented different WMA technologies were selected for investigating the effects of oven time and temperature on the performance properties of the WMA:
• SH 21 Bryan District. • IH 37 San Antonio District.
BRYAN DISTRICT SH 21 WMA FOAMING PROJECT
In August 2009, the Bryan District constructed a ~2 mile section of warm mix on SH 21 within the city limits of Bryan, TX. The mix was a 1 ½ in., Item 341, Type C overlay using a warm mix asphalt foaming technology (Maxam Aqua Black). At the start of the project, the contractor (Knife River) graciously produced several truck loads of hot mix (no foam) for purposes of the research project to serve as a comparison to the warm mix. Table 2.1 shows the mixture design.

5
Table 2.1. WMA Foaming Project Mixture Design for SH 21 Bryan District. Sieve Size Aggregate Source, Cumulative % passing Total
Capital Sandstone C Rock
Hanson Limestone D Rock
Hanson Limestone F Rock
Hanson Limestone Screenings
Lime RAP -1/2-inch fractionated
23.5% 7.5% 15.0% 27.0% 1.0% 20.0% 100.0% 1 in 100.0 100.0 100.0 100.0 100.0 100.0 100.0 ¾ in 98.0 100.0 100.0 100.0 100.0 100.0 99.5 3/8 in 23.5 95.5 100.0 100.0 100.0 87.1 79.1 No. 4 3.6 21.5 48.6 84.5 100.0 77.9 54.9 No. 8 3.2 8.2 2.4 68.0 100.0 54.9 37.0 No. 30 3.0 5.1 2.3 39.6 100.0 28.2 21.8 No. 50 2.8 1.0 0.4 21.9 100.0 19.8 13.0 No. 200 2.4 0.4 0.4 8.2 100.0 3.0 4.9 Asphalt Source and Grade: Jebro PG 64-22 Binder Percent: 4.8 Construction was performed at night (or after 6:00 p.m.) and the mixture was produced at Knife River’s hot mix plant located on SH 21 located less than 2 miles from the project. Figures 2.4 and 2.5 show construction photographs. The warm mix was produced at 270°F, and the hot mix was produced at 330°F.
TTI researchers sampled the mix from the plant and brought it back to TTI’s laboratory located 7 miles from the project (Figure 2.6) and placed the mixes in ovens for curing at different times and temperatures as shown in Table 2.2. The hot mix was sampled and molded on the evening of Day-1 construction. The warm mix samples were sampled and molded on the evening of Day-3 construction. The large amount of oven space required to do this type of experiment necessitated staggering the molding dates for the hot mix versus the warm mix.
Samples were tested for volumetrics, Hamburg Wheel tracking, and Overlay test. Compactability of the mixtures was also measured. Dynamic shear rheometer (DSR) tests were performed on extracted and recovered binder but the results were highly variable and inconclusive, which may be a result of the RAP in the mix and the variability associated with it.

6
Figure 2.4. Foamed WMA Mixture Placement on SH 21 in Bryan.
Figure 2.5. Foamed WMA Mixture Compaction on SH 21 in Bryan.

7
Figure 2.6. Sample Fabrication at TTI’s McNew Laboratory.
A few tests were also done on mixtures that were not cured at all (called “0 hr” herein but was actually the amount of time to drive from the job to the lab and compact the first sample ~ 30 minutes to 1 hr).

8
Table 2.2. Temperature and Curing Conditions for Loose Mix Sampled from SH 21. Curing/Compaction Temperature, °F
Curing Time HMA Foamed WMA 2 hr 250 250 275 4 hr 250 250 275 8 hr 250 250 275 20 hr 250 250 275 32 hr 250 250 275
Cool/Reheat* 250 250 275 *Samples were allowed to cool and remain at room temperature for one week. They were then reheated to the selected compaction temperature and samples molded.
DISCUSSION OF SH 21 LABORATORY CURING RESULTS
Mixture Volumetric Results
Samples were molded in the Texas Gyratory Compactor (TGC) and densities were determined based on standard TxDOT procedures. All of the mixtures that were compacted at the two key curing times (2 hr and 4 hr) showed similar lab molded densities ranging from 97.1 to 98.2 percent. Only after extended curing times of 32 hr did the lab molded densities drop significantly (Figure 2.7).
Figure 2.7. SH 21 Lab Molded Density versus Oven Curing Time for HMA and WMA (Texas Gyratory Compactor).
9
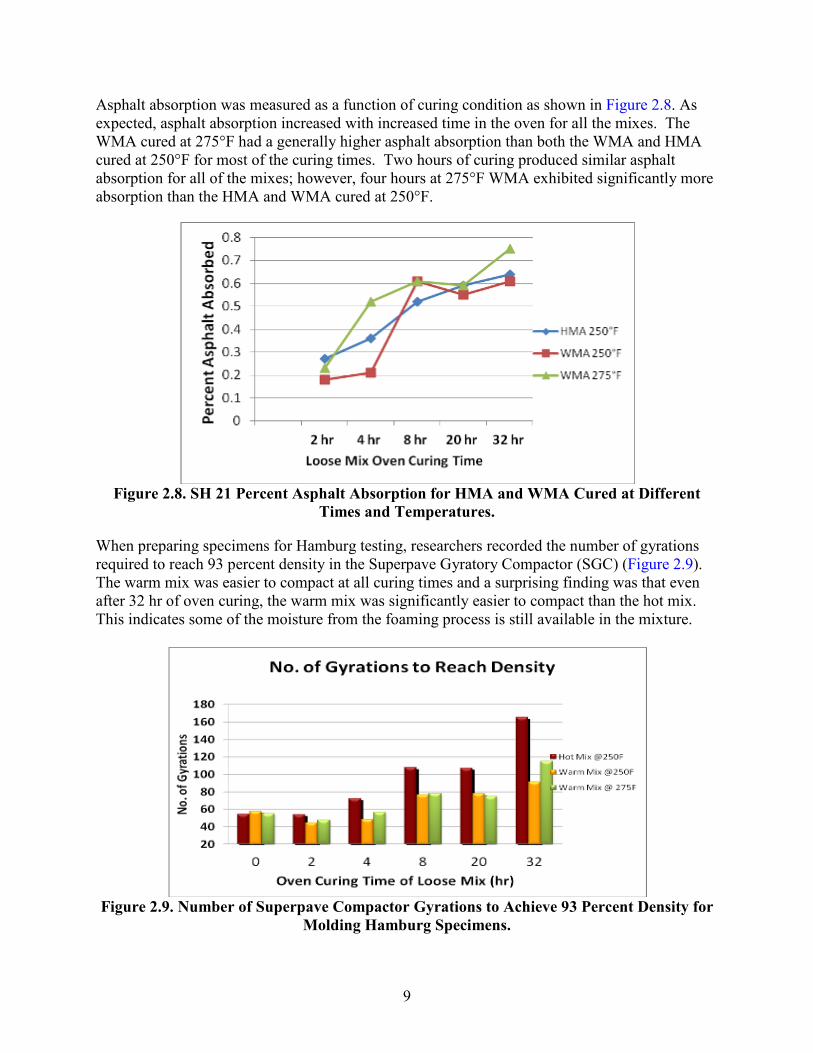
Asphalt absorption was measured as a function of curing condition as shown in Figure 2.8. As expected, asphalt absorption increased with increased time in the oven for all the mixes. The WMA cured at 275°F had a generally higher asphalt absorption than both the WMA and HMA cured at 250°F for most of the curing times. Two hours of curing produced similar asphalt absorption for all of the mixes; however, four hours at 275°F WMA exhibited significantly more absorption than the HMA and WMA cured at 250°F.
Figure 2.8. SH 21 Percent Asphalt Absorption for HMA and WMA Cured at Different
Times and Temperatures.
When preparing specimens for Hamburg testing, researchers recorded the number of gyrations required to reach 93 percent density in the Superpave Gyratory Compactor (SGC) (Figure 2.9). The warm mix was easier to compact at all curing times and a surprising finding was that even after 32 hr of oven curing, the warm mix was significantly easier to compact than the hot mix. This indicates some of the moisture from the foaming process is still available in the mixture.
Figure 2.9. Number of Superpave Compactor Gyrations to Achieve 93 Percent Density for
Molding Hamburg Specimens.
10
Hamburg Wheel Tracking Tests
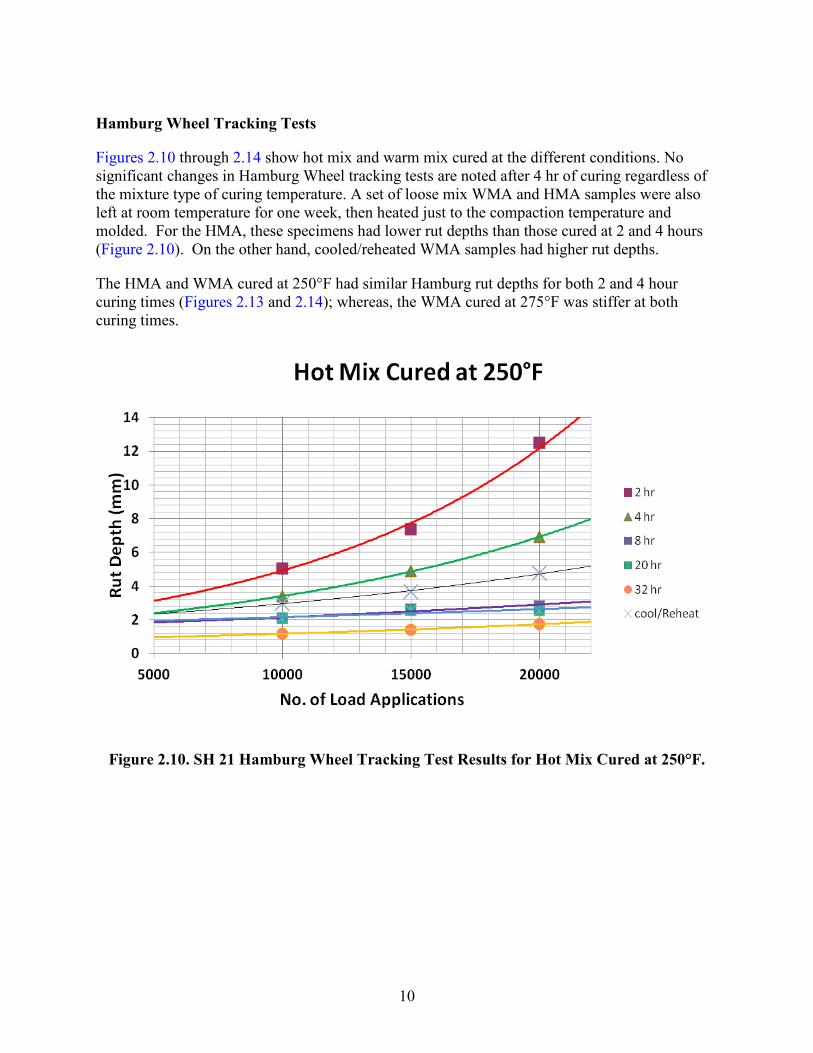
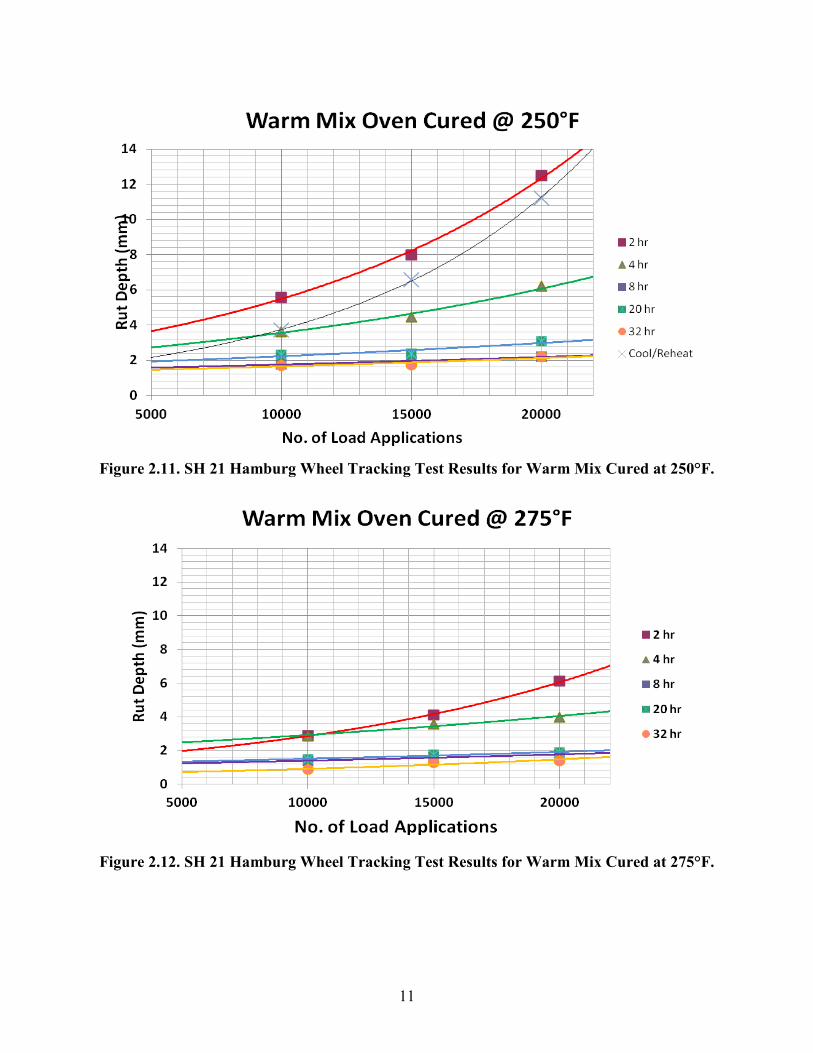
Figures 2.10 through 2.14 show hot mix and warm mix cured at the different conditions. No significant changes in Hamburg Wheel tracking tests are noted after 4 hr of curing regardless of the mixture type of curing temperature. A set of loose mix WMA and HMA samples were also left at room temperature for one week, then heated just to the compaction temperature and molded. For the HMA, these specimens had lower rut depths than those cured at 2 and 4 hours (Figure 2.10). On the other hand, cooled/reheated WMA samples had higher rut depths.
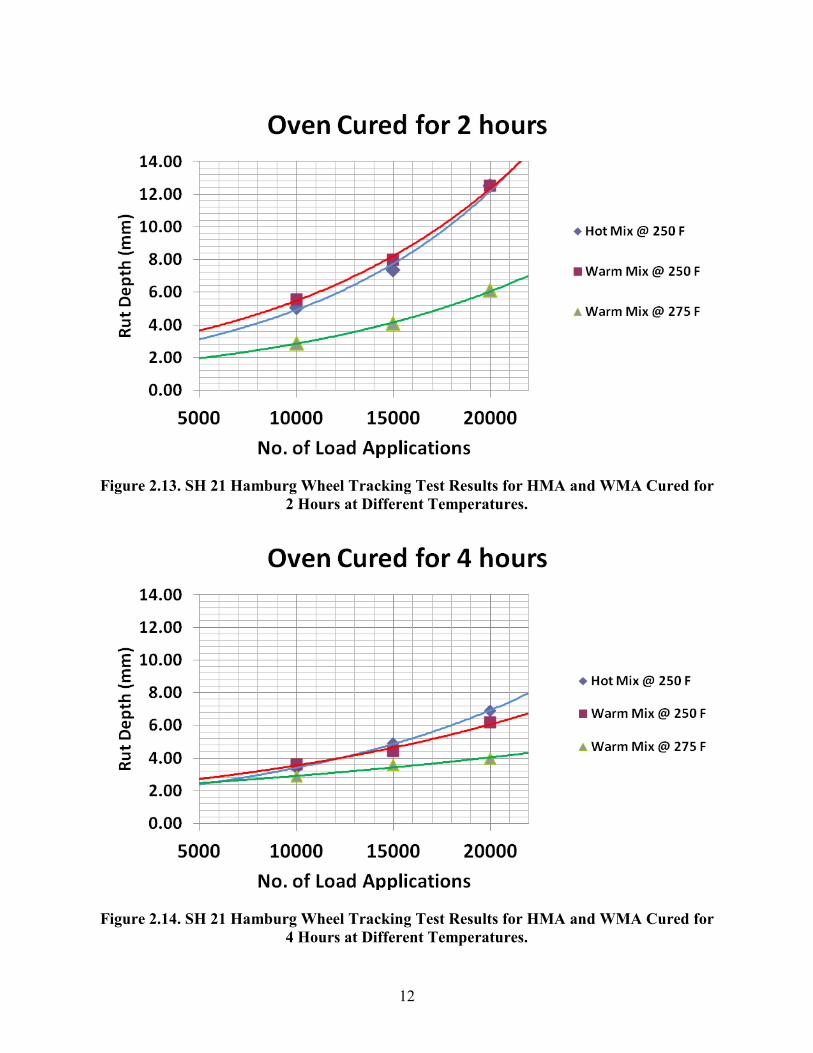
The HMA and WMA cured at 250°F had similar Hamburg rut depths for both 2 and 4 hour curing times (Figures 2.13 and 2.14); whereas, the WMA cured at 275°F was stiffer at both curing times.
Figure 2.10. SH 21 Hamburg Wheel Tracking Test Results for Hot Mix Cured at 250°F.
11
Figure 2.11. SH 21 Hamburg Wheel Tracking Test Results for Warm Mix Cured at 250°F.
Figure 2.12. SH 21 Hamburg Wheel Tracking Test Results for Warm Mix Cured at 275°F.
12
Figure 2.13. SH 21 Hamburg Wheel Tracking Test Results for HMA and WMA Cured for
2 Hours at Different Temperatures.
Figure 2.14. SH 21 Hamburg Wheel Tracking Test Results for HMA and WMA Cured for
4 Hours at Different Temperatures.

13
Overlay Test Results
Overlay test results are presented in Table 2.3. Average results for each curing condition are plotted in Figure 2.15. Results indicate a decrease in cracking resistance as curing time increases. Variability in the data makes it difficult to draw conclusions regarding curing temperature on cracking resistance; however, it is clear that cracking resistance as measured in the overlay tester can be significantly affected by curing time. The WMA mixes seem to initially have better cracking resistance but this better performance disappears with increased curing times.
Figure 2.15. SH 21 Overlay Test Results for HMA and WMA Cured at Different Times and
Temperatures.

14
Table 2.3. SH 21 Overlay Test Data for Mixtures Cured at Different Temperatures and Times.
HMA 250°F WMA 250°F WMA 275°F
Curing Time
Cycles Max Load Lb
Cycles Max Load Lb
Cycles Max Load lb
0 hr 66 596 22* 637 100 592 7* 784 98 558 20* 654 99 642 108 632 103 591
AVG 83 674 103 609 102 612
2 hr 35 783 23 620 65 666 23 954 33 638 84 707 13 963 63 656 105 642
AVG 24 900 40 638 85 672
4 hr 48 671 39 641 9 858 22 837 39 754 25 733 8 858 43 628 14 779
AVG 26 789 40 674 16 790
8 hr
16 855 3 1070 2 1031 5 943 6 980 2 1090 5 982 4 1114 2 1180
AVG 9 927 4 1055 2 1100
16 hr 3 1104 2 1152 2 1045 5 1179 5 1134 2 1162 3 1167 3 1126 2 935
AVG 4 1150 3 1137 2 1047
32 hr 5 723 2 1234 2 1260 3 977 2 1122 2 1325 8 772 2 1106 2 1247
AVG 5 824 2 1154 2 1277
*not included in the average.
15
SAN ANTONIO DISTRICT IH 37 WMA SASOBIT AND EVOTHERM PROJECT
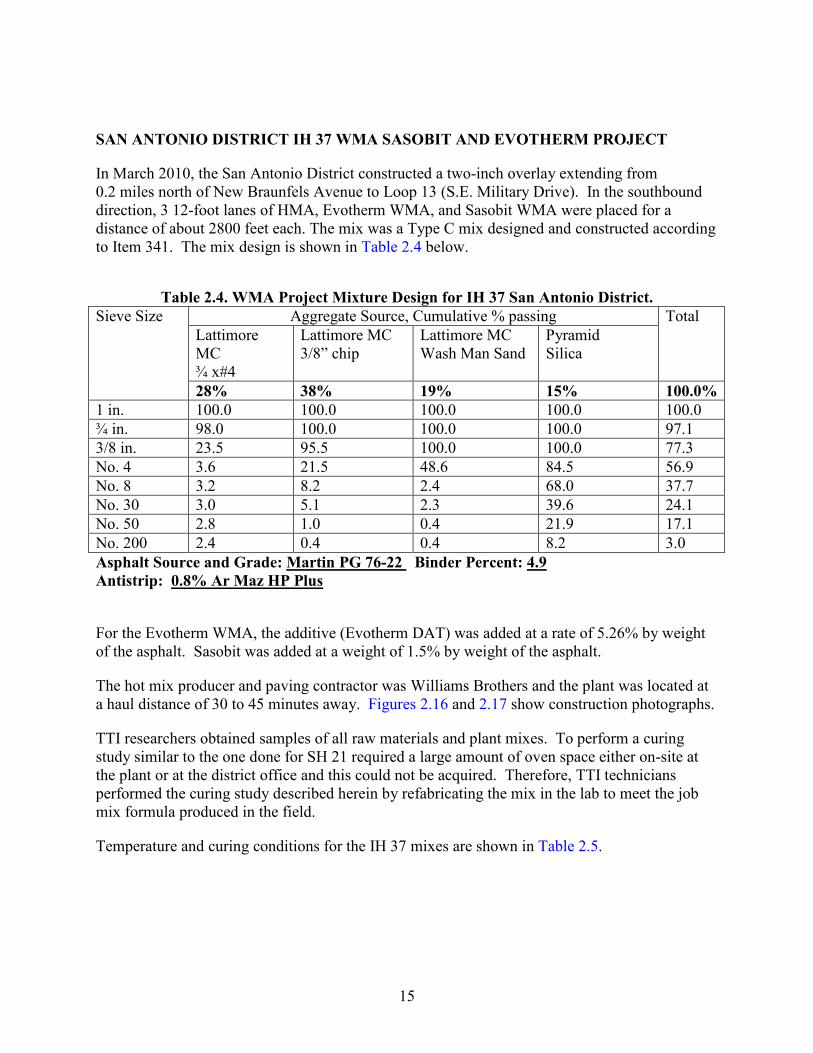
In March 2010, the San Antonio District constructed a two-inch overlay extending from 0.2 miles north of New Braunfels Avenue to Loop 13 (S.E. Military Drive). In the southbound direction, 3 12-foot lanes of HMA, Evotherm WMA, and Sasobit WMA were placed for a distance of about 2800 feet each. The mix was a Type C mix designed and constructed according to Item 341. The mix design is shown in Table 2.4 below.
Table 2.4. WMA Project Mixture Design for IH 37 San Antonio District. Sieve Size Aggregate Source, Cumulative % passing Total
Lattimore MC ¾ x#4
Lattimore MC 3/8” chip
Lattimore MC Wash Man Sand
Pyramid Silica
28% 38% 19% 15% 100.0% 1 in. 100.0 100.0 100.0 100.0 100.0 ¾ in. 98.0 100.0 100.0 100.0 97.1 3/8 in. 23.5 95.5 100.0 100.0 77.3 No. 4 3.6 21.5 48.6 84.5 56.9 No. 8 3.2 8.2 2.4 68.0 37.7 No. 30 3.0 5.1 2.3 39.6 24.1 No. 50 2.8 1.0 0.4 21.9 17.1 No. 200 2.4 0.4 0.4 8.2 3.0 Asphalt Source and Grade: Martin PG 76-22 Binder Percent: 4.9 Antistrip: 0.8% Ar Maz HP Plus
For the Evotherm WMA, the additive (Evotherm DAT) was added at a rate of 5.26% by weight of the asphalt. Sasobit was added at a weight of 1.5% by weight of the asphalt.
The hot mix producer and paving contractor was Williams Brothers and the plant was located at a haul distance of 30 to 45 minutes away. Figures 2.16 and 2.17 show construction photographs.
TTI researchers obtained samples of all raw materials and plant mixes. To perform a curing study similar to the one done for SH 21 required a large amount of oven space either on-site at the plant or at the district office and this could not be acquired. Therefore, TTI technicians performed the curing study described herein by refabricating the mix in the lab to meet the job mix formula produced in the field.
Temperature and curing conditions for the IH 37 mixes are shown in Table 2.5.

16
Figure 2.16. Placement of WMA on IH 37 in San Antonio.
Figure 2.17. Compaction of WMA on IH 37 in San Antonio.

17
Table 2.5. Temperature and Curing Conditions for IH 37 HMA and WMA. Curing/Compaction Temperature, °F
Curing Time
HMA Sasobit WMA Evotherm WMA
0 hr 300 250 275 230 275 2 hr 300 250 275 230 275 4 hr 300 250 275 230 275 8 hr 300 250 275 230 275
DISCUSSION OF IH 37 LABORATORY CURING RESULTS
Mixture Volumetric Results
Samples were molded in the TGC and densities were determined based on standard TxDOT procedures (Figure 2.18). At both the 2 hour and 4 hour curing time, the Evotherm mix compacted at 275°F had higher lab molded densities. The Evotherm mix cured at 230°F which was the target discharge temperature at the plant had a lab molded density comparable to the hot mix. These data support TxDOT’s current criteria (Figure 2.3) that states that the compaction temperature for the mix should be based on the target discharge temperature for determination of lab molded density. Mixtures which were allowed to remain at room temperature for one week and the reheated long enough to reach the compaction temperature had similar lab molded densities to those cured for 2 hours (as opposed to 0 hours). This would indicate that when reheating samples for determining lab molded density, no additional curing is needed
Figure 2.18. IH 37 Lab Molded Density for HMA and WMA Cured at Different Times and
Temperatures.

18
Asphalt absorption increased as a function of curing time as expected. However, the higher curing temperatures did not always produce the higher rates of absorption (Figure 2.19). Absorption varied significantly among all the mixes at 0, 2, and 4 hour curing times, but by 8 hours most of the mixes had about the same absorption.
Figure 2.19. IH 37 Asphalt Absorption for HMA and WMA Cured at Different Times and Temperatures.
Hamburg Wheel Tracking Test Results
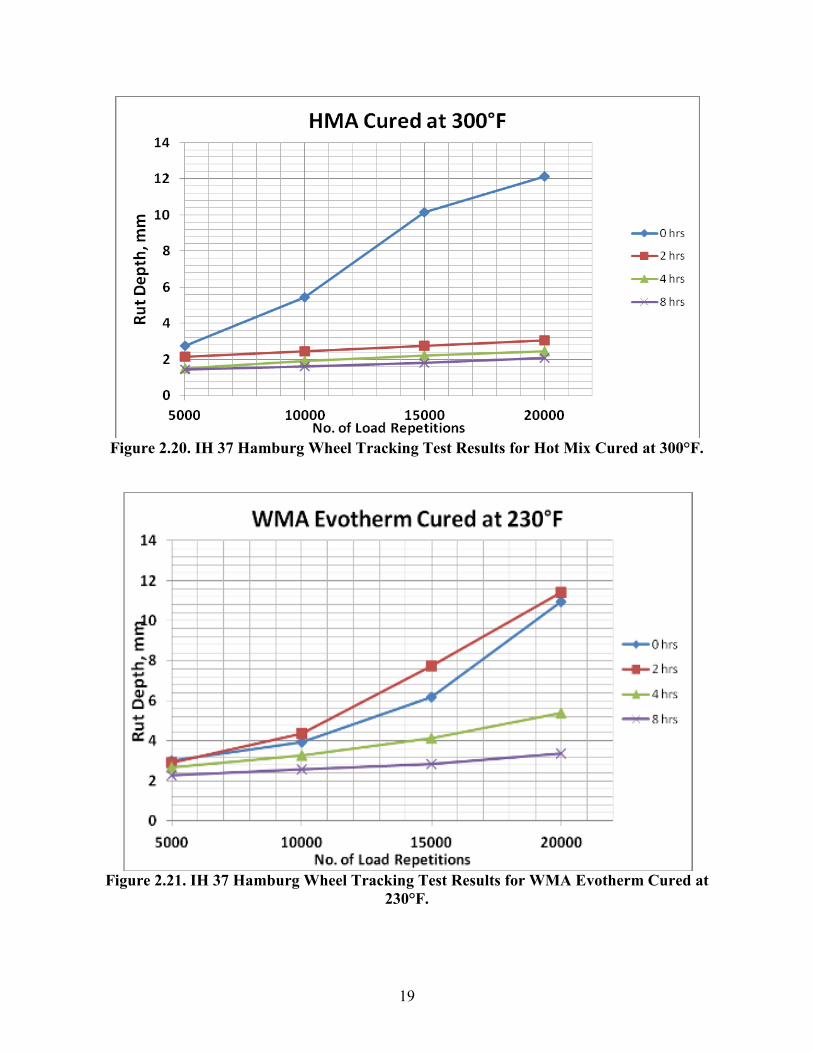
Hamburg Wheel tracking results are presented in Figures 2.20 through 2.26. Figure 2.20 shows the HMA cured at 300°F and the significant effect of oven curing time. With no curing, the mix would almost fail the Hamburg criteria of not more than 12.5 mm rut depth at 20000 cycles and with just 2 hours of oven curing the rut depth is reduced to 3 mm. No significant change occurs in the HMA with increased oven curing time. The Evotherm mix cured at 230°F shows some propensity for rutting at 0 and 2 hours but at 275°F curing time the mix behaves very similarly to the HMA cured at 300°F. The Sasobit mix cured at both 250 and 275°F was very rut resistant at curing times of 2 hours and greater.
Figures 2.25 shows all of the different mixtures for the 2 hour cure and Figure 2.26 shows the mixtures all at the 4 hour cure. With the exception of the Evotherm mix cured at the low temperature of 230°F, a 2 hour cure was sufficient to produce Hamburg results similar to the hot mix.
19
Figure 2.20. IH 37 Hamburg Wheel Tracking Test Results for Hot Mix Cured at 300°F.
Figure 2.21. IH 37 Hamburg Wheel Tracking Test Results for WMA Evotherm Cured at
230°F.

20
Figure 2.22. IH 37 Hamburg Wheel Tracking Test Results for WMA Evotherm Cured at
275°F.
Figure 2.23. IH 37 Hamburg Wheel Tracking Test Results for WMA Sasobit Cured at
250°F.

21
Figure 2.24. IH 37 Hamburg Wheel Tracking Test Results for WMA Sasobit Cured at
275°F.
Figure 2.25. IH 37 Hamburg Wheel Tracking Test Results for HMA and WMA Cured for
2 Hours at Different Temperatures.
22
Figure 2.26. IH 37 Hamburg Wheel Tracking Test Results for HMA and WMA Cured for
4 Hours at Different Temperatures.
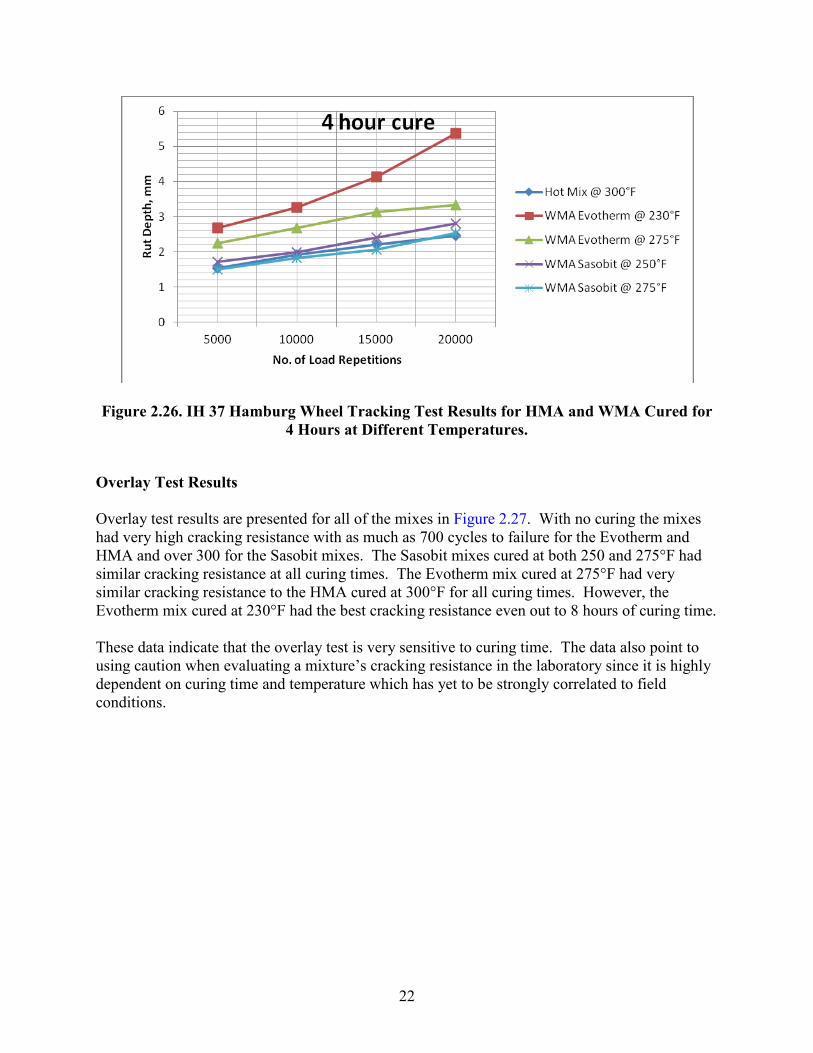
Overlay Test Results Overlay test results are presented for all of the mixes in Figure 2.27. With no curing the mixes had very high cracking resistance with as much as 700 cycles to failure for the Evotherm and HMA and over 300 for the Sasobit mixes. The Sasobit mixes cured at both 250 and 275°F had similar cracking resistance at all curing times. The Evotherm mix cured at 275°F had very similar cracking resistance to the HMA cured at 300°F for all curing times. However, the Evotherm mix cured at 230°F had the best cracking resistance even out to 8 hours of curing time. These data indicate that the overlay test is very sensitive to curing time. The data also point to using caution when evaluating a mixture’s cracking resistance in the laboratory since it is highly dependent on curing time and temperature which has yet to be strongly correlated to field conditions.

23
Figure 2.27. IH 37 Overlay Test Results for HMA and WMA Cured at Different
Temperatures and Times.
SUMMARY
• Lab molded density determined after 2 hours of curing at target discharge temperature (for the WMA) was similar to the lab molded densities for the HMA cured for 2 hours at standard compaction temperatures. These data lend support to the current TxDOT procedures as outlined in Figure 2.3.
• Mixtures (both HMA and WMA) which were allowed to cool for one week and then reheated only long enough to reach the compaction temperature exhibited similar lab molded densities to those which were cured for 2 hours immediately after production. However, the Hamburg specimens for the foamed WMA were slightly more rut susceptible. These data would lend support to requiring no additional curing for mixtures which have cooled and are then reheated but TxDOT needs additional testing to validate how samples should be prepared for volumetrics and performance tests once mix has been allowed to cool.
• Asphalt absorption is greatly affected by the curing time and temperature. It appears that it may also be affected by the type of WMA additive used. For the mixes evaluated in this study, this may have little effect on lab molded densities (in the TGC) but may be contributing to the differences noted in performance properties such as overlay test. Some of the warm mixes cured for 4 hours at 275°F had very different absorption values

24
than their HMA counterparts that were cured for 2 hours as directed by current procedures.
• For all of the mixes evaluated in the study, 4 hours of curing time (at 250°F or greater) produced the maximum rut resistance of the mix.
• For the SH 21 mix which contained RAP and included the foamed WMA process, the HWTT results for the HMA and WMA cured for 2 hours at 250°F (standard HMA compaction temperature) were almost identical. The WMA cured for 2 and 4 hours at 275°F rutted less.
• For the IH 37 mix, both the Evotherm and Sasobit WMA cured at temperatures of 275°F for 2 and 4 hours had similar rutting characteristics to the HMA cured at the standard temperature of 300°F for 2 hours.
• With regard HWTT, the data generated in this study support current TxDOT procedures. However, all of the mixes evaluated were relatively rut-resistant. Differences in Hamburg results with regard to curing time and temperature may be more critical with other more sensitive mixes pointing to the need for additional testing.
• The overlay test is very sensitive to mixture oven curing time and temperature. Some of the mixes showed very dramatic reductions in cracking resistance when oven curing time was increased from 2 to 4 hours (including HMA). Additional testing is needed to establish standardized curing procedures for both HMA and WMA which reflect field performance properties.

25
CHAPTER 3 FIELD EVALUATION OF WMA PROJECTS
Several WMA field projects were evaluated throughout the course of this research study. These projects are described in the following.
SAN ANTONIO LOOP 368
Project Description
This project represents the first warm mix asphalt trial placed by TxDOT. Evotherm, developed by MeadWestvaco Asphalt Innovations, used a technology that is based on a chemical package that included emulsification agents; additives to improve aggregate coating, mixture workability, and compaction; as well as adhesion promoters (anti-stripping agents). Evotherm utilized a high residue emulsion (about 70 percent binder) that improves adhesion of the asphalt to the aggregate. More details about this project and mixture properties can be found in research reports 0-5597-1 and 0-5597-2.
Table 3.1. San Antonio Loop 368 WMA Field Project Details. Project Location Loop 368 (Old Austin Highway) See Figure 3.1 Construction Dates August-September 2006 Warm Mix Tonnage ~ 2000 tons Mix Design Information • Item 341, Type C Dense Graded
• Valero PG 76-22 • Aggregate: 88% Vulcan Helotes LS (SAC B)
12% Field Sand • Anti-strip: 0.75% liquid for HMA, none for
WMA • AC Content: 4.6% (Both HMA and WMA)
Warm Mix Asphalt Technology Evotherm Emulsion Based Technology Mixture Production Temperature at Load Out: HMA 320°F
WMA 220°F Laydown and Compaction Mat Thickness: 2 inches
Average In-Place Density: HMA 94.2% WMA 93.4%

26
Figure 3.1. San Antonio Loop 368 Evotherm Field Trial Location and Layout.
Summary of Mixture Properties
Hamburg wheel tracking test results are presented in Figure 3.2. This chart includes samples which were molded during production at 2 different molding temperatures: 240 and 300°F. Generally, the warm mix samples compacted at 300°F performed better in the Hamburg than those compacted at 240°F. All of the warm mix samples failed the Hamburg test with the exception of the samples compacted at 300°F from the second night of warm mix production. Hamburg test results for the one-month roadway cores are compared to the lab molded plant mix samples in Figure 3.1. As mentioned previously, some improvement is observed in the warm mix samples compacted at 300°F versus those compacted at 240°F. However, the warm mix cores taken at one month did not indicate that the mix improved with time (in terms of rut or moisture susceptibility resistance) compared to the lab molded samples. All of the cores taken at one year and beyond showed equivalent rut resistant of the WMA and HMA with both mixes lasting 20,000 cycles.
The Overlay test results are shown in Figure 3.3 for both the warm mix and the control mix and these data are typical of many current TxDOT dense graded mixes. All of the lab molded warm mix and control HMA specimens performed poorly in the Overlay test. However, there was a significant improvement seen in the some of the cores taken at one month from the warm mix sections. But in the cores taken at one year and afterward, there did not seem to be any improvement in cracking resistance.
Indirect tensile strength tests are shown in Figure 3.4 for both the warm mix and control HMA mix. The tensile strengths of the warm mix cores taken at one month show a significant improvement over the tensile strength of the warm mix during the mix design process (which was 60 psi for the WMA and 170 psi for the HMA). Average tensile strengths showed that the WMA cores taken at one month had a lower strength than the HMA cores at one month. But at one year and beyond the HMA and WMA are comparable to each other in terms of tensile strength.

27
Figure 3.2. Hamburg Wheel Tracking Test Results for Lab Molded Warm Mix and Hot Mix Compared to Roadway Cores for Loop 368.
Figure 3.3. Overlay Test Results for Lab Molded Warm Mix and Control Mixes Compared to Roadway Cores for Loop 368.

28
Figure 3.4. Indirect Tensile Strength Test Results for Lab Molded Warm Mix and Control
Mixes Compared to Roadway Cores for Loop 368.
Field Performance Evaluation Figure 3.5 shows the Loop 368 project after 3 years of service. Some cracking is beginning to appear in both the WMA and HMA sections as shown in Figure 3.6 and as noted in Table 3.2. However, there is no evidence of any rutting in either WMA or HMA sections and both of the sections are performing comparably. Table 3.2. Summary of Cracking Distress on Loop 368 WMA and HMA Test Sections. Location
Length
Mix Type
Transverse Cracking, Lin ft
Longitudinal Cracking, lin ft
Alligator cracking, Linear ft of wheelpath
2009 2010 2011 2009 2010 2011 2009 2010 2011 NB Outside Lane from Rittiman North 2200 ft
2200
WMA
36
36
60
98
160
220
0
0
20
NB Outside Lane from 2200 ft N of Rittiman to 4100 ft N of Rittiman
1900
HMA
41
48
72
135
200
250
45
60
60

29
Figure 3.5. San Antonio Warm Mix Section after 3 Years of Service.
Figure 3.6. Evidence of Longitudinal Cracking Appearing in Both WMA and HMA
Sections.

30
Ride score measurements are shown in Figure 3.7 for both the HMA and WMA sections for 2009 through 2011. Some decrease in ride is observed with time; however, the WMA and HMA sections are performing similarly.
Figure 3.7. Ride Score Measurements for Loop 368.
AUSTIN SH 71
The first WMA project placed by the Austin District was on SH 71 in summer 2008. The project limits are from 0.6 miles west of Riverside Drive to Presidential Boulevard (Figure 3.8). Details regarding the project are shown below in Table 3.5.
Table 3.3. Austin SH 71 WMA Field Project Details. Project Location SH 71 Construction Dates June 2008 Warm Mix Tonnage 8000 tons Mix Design Information • Item 341, Type C Dense Graded
• PG 76-22 • Aggregate: 91% Hanson New Braunfels LS
9% Field Sand • Anti-strip: 0.8% liquid for HMA and WMA • AC Content: 4.8% (Both HMA and WMA)
Warm Mix Asphalt Technology Evotherm DAT Mixture Production Temperature at Load Out: HMA 330°F
WMA 240°F Laydown and Compaction Mat Thickness: 2 inches
In-Place Density: HMA 94.2% WMA 93.4%
Cost HMA: $62/ton WMA: $65.75/ton

31
US 71 Austin DistrictUS 71 Austin DistrictWarm Mix (Eastbound Lanes)• 8000 tons
Hot Mix (Westbound Lanes)• 12000 tons
Figure 3.8. WMA Project on SH 71 in Austin.
Summary of Mixture Properties
Hamburg wheel tracking test results are presented in Figure 3.9. During production there was significant difference in the HWTT rutting resistance between the HMA and WMA. This, however, was before the 4 hour curing time of 275°F had been implemented by the Department. Cores taken at one month showed that the WMA was still somewhat rut susceptible and in fact failed the HWTT. By one year and beyond, however, the WMA rutting resistance was similar to the HMA.
The Overlay test results are shown in Figure 3.10. The WMA cores taken at one month showed better cracking resistance as well as lower indirect tensile strength (Figure 3.11) than the HMA cores at one month. At one year and beyond, the WMA and HMA showed similar tensile properties.

32
Figure 3.9. Hamburg Wheel Tracking Test Results for Lab Molded Warm Mix and Hot Mix Compared to Roadway Cores for US 71.
Figure 3.10. Overlay Test Results for HMA and WMA Roadway Cores for US 71.
33
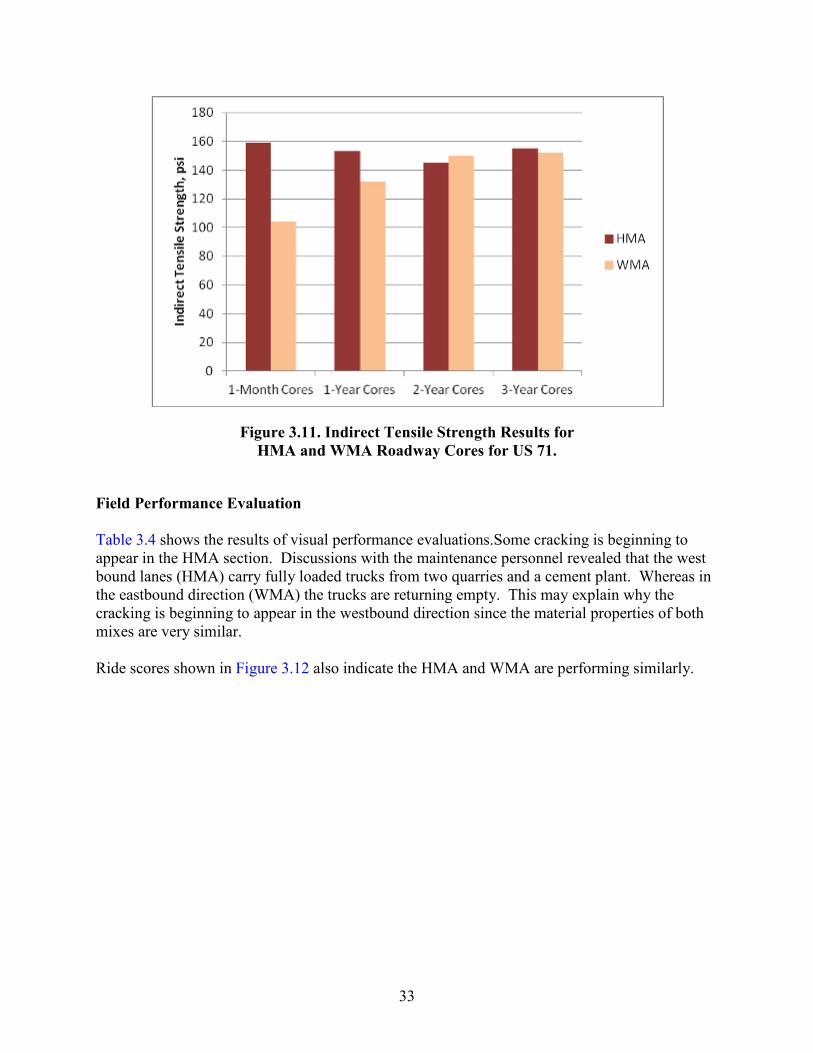
Figure 3.11. Indirect Tensile Strength Results for HMA and WMA Roadway Cores for US 71.
Field Performance Evaluation Table 3.4 shows the results of visual performance evaluations.Some cracking is beginning to appear in the HMA section. Discussions with the maintenance personnel revealed that the west bound lanes (HMA) carry fully loaded trucks from two quarries and a cement plant. Whereas in the eastbound direction (WMA) the trucks are returning empty. This may explain why the cracking is beginning to appear in the westbound direction since the material properties of both mixes are very similar. Ride scores shown in Figure 3.12 also indicate the HMA and WMA are performing similarly.

34
Table 3.4. Summary of Distress on US 71 WMA and HMA Test Sections.
Location
Length
Mix Type
Rutting Transverse Cracking, linear ft
Longitudinal Cracking, linear ft
Alligator Cracking, linear ft of wheelpath
2009
2010
2011
2009
2010
2011
2009
2010
2011
2009
2010
2011
From
US 183
East
1.5 miles
HMA
0
0
0
0
0
0
0
0
520
0
0
20
WMA
0
0
0
0
0
0
0
0
0
0
0
0
Figure 3.12. Ride Score Measurements for Loop 368.
LUFKIN FM 324
In February and March of 2008, the Lufkin District placed four different WMA technology field trials (Figure 3.13). A description of the project details is shown in Table 3.5.

35
Figure 3.13. Construction of Lufkin WMA Field Trials.
Table 3.5. Lufkin WMA Field Trial Project Details. Project Location FM 324, Lufkin Construction Dates February/March 2008 Warm Mix Tonnage ~ 4000 tons (~1000 tons/WMA technology) Mix Design Information • Item 341, Type D Dense Graded
• PG 64-22 • Aggregate: 91% Hanson Chico LS
9% Field Sand • Anti-strip: 1% lime for HMA and all WMA • AC Content: 4.6% (Both HMA and WMA)
Warm Mix Asphalt Technology Sasobit, Evotherm DAT, Akzo Nobel Rediset, Advera
Mixture Production Temperature at Load Out: HMA 270°F WMA 240°F
Laydown and Compaction Mat Thickness: 1.5 in. Summary of Mixture Properties
The mixture was produced by East Texas Asphalt and TTI technicians were onsite to sample and mold samples for later testing. Prior to molding, the plant mixes were cured for 2 hr at 250°F for the HMA and 220°F for all of the WMA technologies. The samples were brought back to TTI’s laboratory for testing.
Results of the Hamburg Wheel tracking test are presented in Table 3.6. For a PG 64-22, the specification limits the rut depth to no more than ½ in. at 10,000 cycles but this district does not

36
enforce a Hamburg requirement since their mixes will often not meet the minimum though they have performed well historically. The Sasobit and HMA mix were the only samples passing the Hamburg criteria with this 2 hr oven curing time.
Results of HWTT on field cores are shown in Figure 3.14. All of the mixtures continued to becme more rut-resistant with age. The different WMA mixtures performed similarly to the HMA.
The Evotherm and Advera WMA showed better cracking resistance in the overlay test (Figure 3.15). With increasing age, the cracking resistance dissipated.
The Sasobit and Rediset mixes seem to be stiffer than the other mixes as indicated by the indirect tensile strength (Figure 3.16).
Table 3.6. Hamburg Wheel Tracking Test Results from Plant Mixed, Lab Compacted Specimens.
Mixture Type Rut Depth (mm) Failure Cycle
HMA 12.75 15,000 HMA 12.72 13,400
Sasobit 12.62 10,900 Sasobit 12.63 11,000
Evotherm 12.70 7,900 Evotherm 12.56 7,700
Asphamin 12.75 6,900 Asphamin 12.80 8,000
Akzo Nobel 12.79 8,900 Akzo Nobel 12.74 8,400

37
Figure 3.14. Hamburg Wheel Tracking Test Results for Lab Molded Warm Mix and Hot Mix Compared to Roadway Cores for FM 324.
Figure 3.15. Overlay Test Results for Plant Mix-Lab Compacted HMA and WMA and Roadway Cores for FM 324.
38
Figure 3.16. Indirect Tensile Strength Results for HMA and WMA Roadway Cores for FM 324.
Field Performance Evaluation
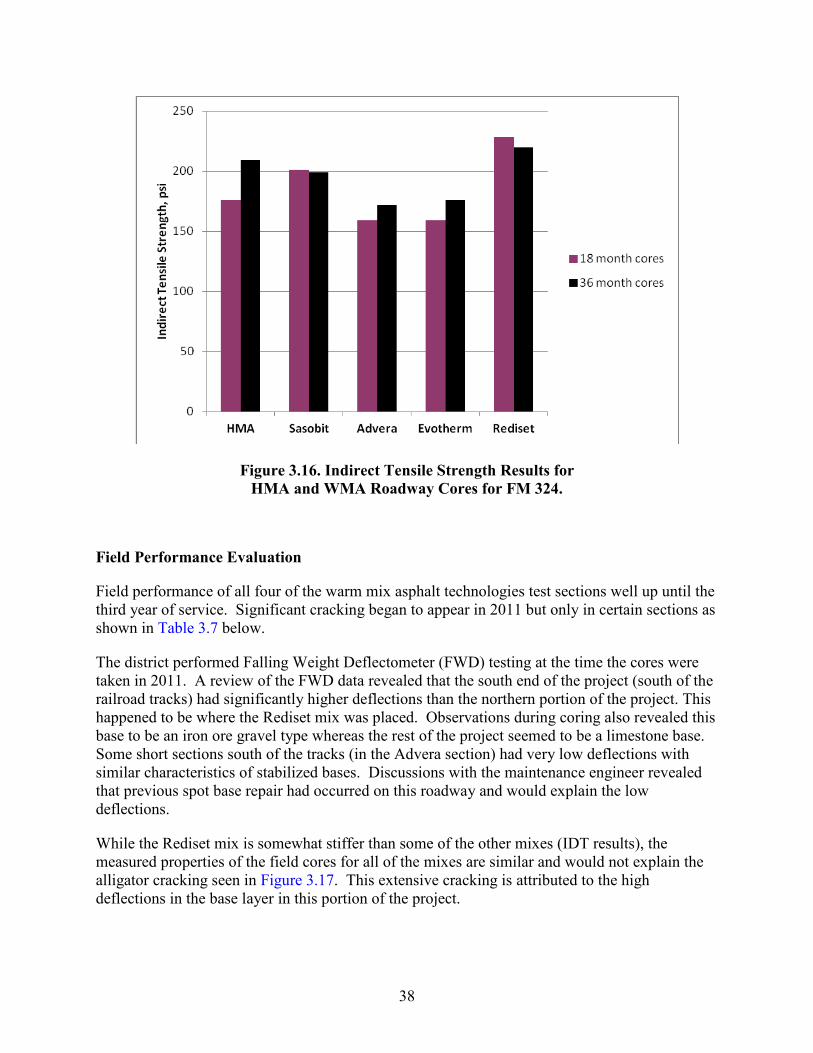
Field performance of all four of the warm mix asphalt technologies test sections well up until the third year of service. Significant cracking began to appear in 2011 but only in certain sections as shown in Table 3.7 below.
The district performed Falling Weight Deflectometer (FWD) testing at the time the cores were taken in 2011. A review of the FWD data revealed that the south end of the project (south of the railroad tracks) had significantly higher deflections than the northern portion of the project. This happened to be where the Rediset mix was placed. Observations during coring also revealed this base to be an iron ore gravel type whereas the rest of the project seemed to be a limestone base. Some short sections south of the tracks (in the Advera section) had very low deflections with similar characteristics of stabilized bases. Discussions with the maintenance engineer revealed that previous spot base repair had occurred on this roadway and would explain the low deflections.
While the Rediset mix is somewhat stiffer than some of the other mixes (IDT results), the measured properties of the field cores for all of the mixes are similar and would not explain the alligator cracking seen in Figure 3.17. This extensive cracking is attributed to the high deflections in the base layer in this portion of the project.

39
Table 3.7. Summary of Distress on FM 324 WMA and HMA Test Sections.
Location
Transverse Cracking, linear ft
Longitudinal Cracking, linear ft
Alligator Cracking, linear ft of wheelpath
2009
2010
2011
2009
2010
2011
2009
2010
2011
SB Lane
HMA
0
0
0
0
0
120
0
0
20
SB Lane
Sasobit
0
0
0
0
0
0
0
0
20
SB Lane
Evotherm
0
0
0
0
0
0
0
0
0
SB Lane
Advera
0
0
0
0
0
0
0
0
0
SB Lane
Rediset
0
0
0
0
0
230
0
0
160
.

40
Figure 3.17. Alligator Cracking at South End of Project.
FORT WORTH BU 287
In summer 2008, the Fort Worth District constructed its first WMA project on BU 287 north of Saginaw. The project limits were from 200 ft south of RR Bridge to 400 ft north of Bailey Boswell Road for a total length of 4.8 miles. Average daily traffic was 24,100 vehicles per day. For the first approximately 3 miles of the project, the roadway is four-lane divided with 10 ft shoulders. The remainder is a two-lane, undivided, with 10 ft shoulders. The pavement structure varies throughout the project. Much of the cross-section consists of several inches asphalt concrete pavement over 8 in. of crushed stone flexible base. A portion of the project is continuously reinforced concrete pavement with an existing 3 ½ in. overlay, which was milled and replaced and another portion consists of jointed concrete pavement (Figure 3.18), which was to be overlaid with 3 ½ in. of Type D warm mix. The overall construction consisted of a shoulder rehabilitation, which included the placement of 10 in. of Item 341 dense-graded Type B warm mix (Figure 3.19), and the entire project was then surfaced with 3.5 in. of Item 341 dense-graded Type D warm mix.

41
The area engineer, Ralph Browne, P.E., required the use of warm mix on this project to address two issues as described below.
1) Past district experience with overlaying jointed concrete pavement had resulted in construction problems at the joints. When the high-temperature hot mix was placed over the joints, expansion of the sealant (or possibly water in the joints) caused a heaving and rupture in the hot mix surface. The lower placement temperature of the warm mix was specified to reduce this occurrence.
2) Due to the construction sequencing, all traffic would need to be diverted onto the shoulders (which would be constructed of 10 in. of Type B base). This would need to occur at the end of the day for the placement of the Type B. Specifications require that the compacted mat be allowed to cool to a temperature of 160°F before allowing traffic. This is difficult to achieve by 5:00 p.m. for a thick asphalt mat constructed in the heat of a Texas summer. The warm mix would be placed at a significantly lower temperature to address this issue.
The district specified the use of warm mix with a temperature requirement for the mix as follows:
Unless otherwise recommended by the warm mix additive supplier and approved by the Engineer, the target discharge temperature for PG 64 shall be 250°F and for PG 76 shall be 260°F. Target temperatures may vary between 215°F–275°F as accepted by the Engineer. Notify the Engineer of the target discharge temperature and produce the mixture within 15°F of the target. Monitor the temperature of the material in the truck before shipping to ensure that it does not exceed the target temperature by more than 15°F. The Department will not pay for or allow placement of any mixture that exceeds the target temperature by more than 15°F unless approved by the Engineer. However, the load will be allowed to cool on site to target temperature +15°F for full payment.

42
Figure 3.18. BU 287 Jointed Concrete Pavement prior to Type D WMA Overlay.
10-inch Type B
WMA Shoulder
Surface Prior to Overlay With 3 ½ inches of Type D WMA
Figure 3.19. BU 287 Type B WMA Base Mix and Type D WMA Overlay.

43
Information regarding the project is listed in Tables 3.8 and 3.9.
Table 3.8. Fort Worth BU 287 Type B WMA Project Details. Project Location BU 287 North of Saginaw Construction Dates Summer 2008 Warm Mix Tonnage 20,000 tons Mix Design Information • Item 341, Type B Dense Graded
• PG 64-22 • Aggregate: 75% Hanson Perch Hill LS
20% RAP 5% Field Sand
• Anti-strip: 1% liquid anti-strip • AC Content: 4.3%
Warm Mix Asphalt Technology Evotherm DAT Mixture Production Temperature at Load Out: 240°F Laydown and Compaction Mat Thickness: 10 in. (shoulder rehab) Cost $52/ ton
Table 3.9. Fort Worth BU 287 Type D WMA Project Details. Project Location BU 287 North of Saginaw Construction Dates Summer 2008 Warm Mix Tonnage 32,000 tons Mix Design Information • Item 341, Type B Dense Graded
• PG 76-22 • Aggregate: 90% Hanson Perch Hill LS
0% RAP 10 % Field Sand
• Anti-strip: 1% liquid anti-strip • AC Content: 5.0%
Warm Mix Asphalt Technology Evotherm DAT Mixture Production Temperature at Load Out: 275 ºF Laydown and Compaction Mat Thickness: 3 1/2 in. Cost $63/ton
For quality control of the mixture production, the Type B mix was molded at 230°F and the Type D mix was molded at 270°F (after 2 hr cure). Target lab density for both the Type B and Type D mixtures was 96.5 percent.

44
Summary of Mixture Properties
Laboratory and field performance properties are shown in Figures 3.20, 3.21, and 3.22. HWTT results showed a somewhat rut susceptible mix in the trial batch; however, this was prior to adopting the 4 hour at 275°F curing conditions. Cores taken soon after construction showed better rutting performance than the trial batch and after one year the mixtures exhibited good rutting resistance. Overlay test results showed very poor cracking resistance for the mixes beginning immediately after construction.
Figure 3.20. Hamburg Wheel Tracking Test Results for Type B and Type D WMA on BU 287.

45
Figure 3.21. Overlay Test Results for Type B and Type D WMA on BU 287.
Figure 3.22. Indirect Tensile Strength Results for Type B and Type D WMA for BU 287.
Field Performance Evaluation
Field performance on the project has been good with no evidence of rutting or cracking distress (Figure 3.23). Ride quality as shown in Figure 3.24 has also remained consistent.

46
Figure 3.23. Fort Worth BU 287 WMA Project after One Year of Service.
Figure 3.24. Ride Score Measurements for BU 287.

47
BEAUMONT US 190 In 2009, the Beaumont district constructed a Type C, 2-inch overlay on US 190 in Tyler County near Jasper. The project begins at the Neches River and extends 15 miles to US 69. US 190 is 2-lane roadway with average daily traffic counts of about 5000 vehicles per day and 13 percent trucks. The contractor on the project was APAC and the entire project was warm mix using the Rediset WMA additive. Hauling time from the plant ranged from 20 to 40 minutes. The Rediset additive was blown into the mixing chamber of the drum plant using a calibrated feeder and was added at a rate of 2 percent by weight of the binder.
Table 3.10. Beaumont US 190 Rediset WMA Project Details. Project Location US 190 from Neches River to US 69 Construction Dates Jan to April 2009 Warm Mix Tonnage 40,000 tons Mix Design Information • Item 341, Type C Dense Graded
• PG 70-22 Aggregate: 88% Vulcan Brownwood LS 125% Field Sand
• Anti-strip: The Rediset additive served as the antistrip
• AC Content: 4.6% Warm Mix Asphalt Technology Rediset WMX Mixture Production Temperature at Load Out: 270°F
Average lab molded density: 96.3% Average Field Density 93.0%
Laydown and Compaction Mat Thickness: 2 in. Summary of Mixture Performance Properties Hamburg wheel tracking tests are presented in Figure 3.25. During production, two of the samples failed the criteria of no more than 12.5 mm rutting at 15000 passes. Field cores after one year showed adequate rutting resistance. Field Performance Evaluation No rutting or cracking distress was observed throughout the monitoring periods. Ride score data are presented in Figure 3.26. A slight decrease in ride score seems to be occurring from 2010 to 2011.

48
Figure 3.25. Hamburg Wheel Tracking Test Results for US 190.
Figure 3.26. Ride Score Measurements for US 190
BRYAN SH 21 The SH 21 project in the Bryan District is described in detail in Chapter 2. A summary of the project is described in Table 3.11.

49
Table 3.11. Bryan SH 21 Foaming WMA Project Details. Project Location SH 21 from FM 2818 East ~ 2 miles Construction Dates August 2009 Mix Design Information • Item 341, Type C Dense Graded
• PG 64-22 Aggregate: 20% RAP 23% Capitol Aggregates Sandstone 57% Hanson Limestone
• Anti-strip: 1% lime • AC Content: 4.6%
Warm Mix Asphalt Technology Maxam Aqua Black Mixture Production Temperature at Load Out: 270°F WMA
330°F HMA
Laydown and Compaction Mat Thickness: 1 1/2 in. Mixture Performance Properties Hamburg and Overlay test results are shown in Figures 3.27 and 3.28, respectively. Field cores taken at one year show comparable results to lab molded samples cured for 4 hours at 275°F.
Figure 3.27. Hamburg Wheel Tracking Test Results for SH 21.

50
Figure 3.28. Overlay Test Results for SH 21.
Field Performance Evaluation Both the WMA and HMA portions of SH 21 are performing well with no cracking or rutting distress. Ride quality data are shown in Figure 3.29.
Figure 3.29. Ride Score Measurement for SH 21 WMA.

51
SAN ANTONIO IH 37 The IH 37 project in the San Antonio District is described in detail in Chapter 2. A summary of the project is described in Table 3.12.
Table 3.12. IH 37 Sasobit and Evotherm WMA/HMA Project Details. Project Location From 0.2 miles North of New Braunfels Avenue to
Loop 13 Construction Dates March 2010 Mix Design Information Item 341, Type C Dense Graded
PG 76-22 Aggregate: 85% Lattimore Limestone 15% Silica Sand 57% Hanson Limestone
Anti-strip: 0.8% Ar Maz HP Plus AC Content: 4.9%
Warm Mix Asphalt Technology Maxam Aqua Black Mixture Production Temperature at Load Out: 250°F Sasobit WMA
230°F Evotherm WMA 300°F HMA
Laydown and Compaction Mat Thickness: 1 1/2 in. Mixture Performance Properties Hamburg and Overlay test results are shown in Figures 3.30 and 3.31, respectively. Field cores taken at one year show comparable results to lab molded samples cured for 4 hours at 275°F.
Figure 3.30 Hamburg Wheel Tracking Test Results for IH 37.
52
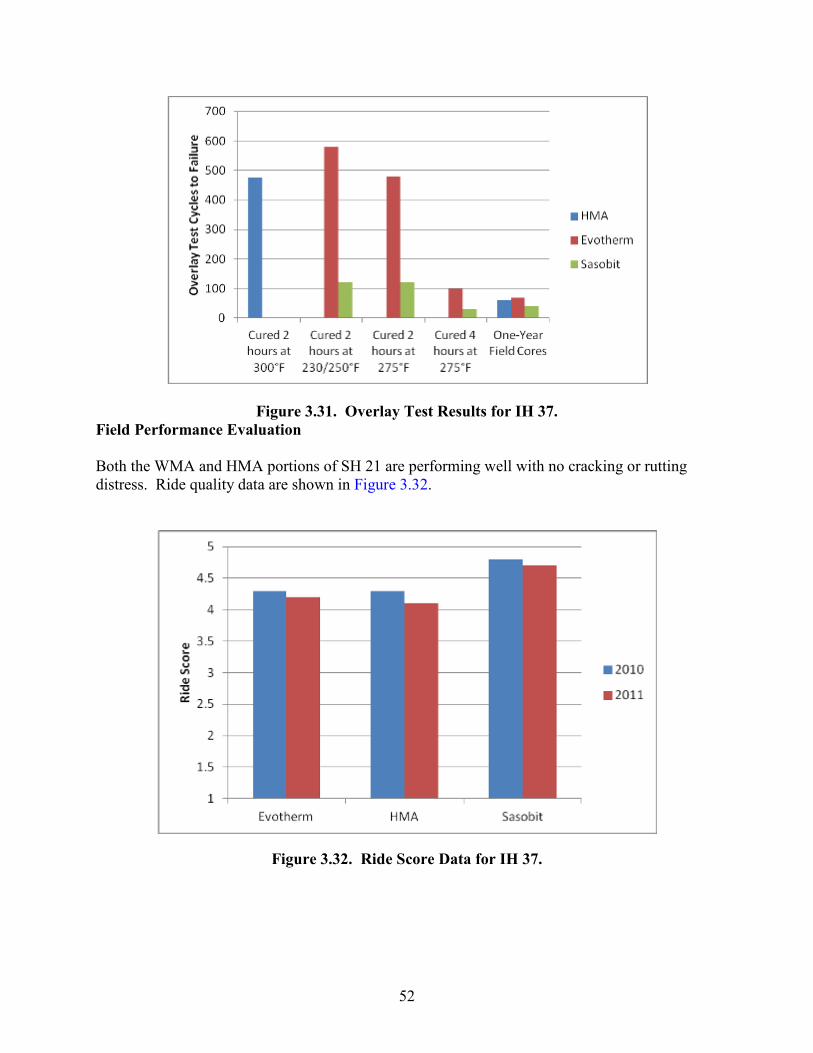
Figure 3.31. Overlay Test Results for IH 37. Field Performance Evaluation Both the WMA and HMA portions of SH 21 are performing well with no cracking or rutting distress. Ride quality data are shown in Figure 3.32.
Figure 3.32. Ride Score Data for IH 37.

53
WICHITA FALLS SH 251 In 2008, the Wichita Falls District constructed almost 70,000 tons of a Type D, 2-inch overlay on US 380 and SH 251 in Young County near Graham. The contractor on the project was RK Hall and the entire project was warm mix (with a small section of HMA) using the Astec Double Barrel Greene foaming process. Details of the project are shown in Table 3.13.
Table 3.13. SH 251 Graham WMA/HMA Project Details. Project Location SH 251 Newcastle north to Olney Construction Dates Summer 2008 Mix Design Information • Item 341, Type D Dense Graded
• PG 70-22 Aggregate: 93% Hanson Chico Limestone 6% Field Sand
• Anti-strip: 1% Akzo Nobel Kling Betta 2550HM • Lime 1% • AC Content: 5.1%
Warm Mix Asphalt Technology Double Barrel Greene Mixture Production Temperature at Load Out: 270°F WMA
310°F HMA Lab Density: 97.1% In Place Density: 93.6%
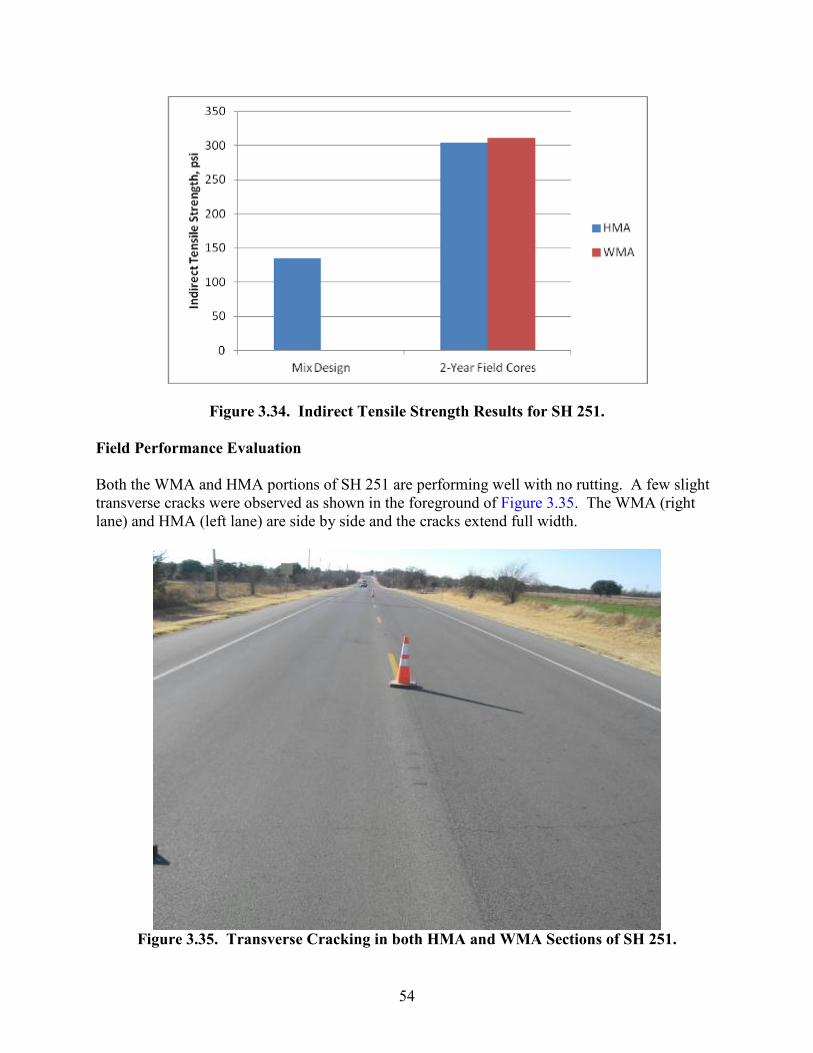
Laydown and Compaction Mat Thickness: 2 in. Mixture Performance Properties Mixture performance tests are shown in Figures test results are shown in Figures 3.33 and 3.34. Field cores taken at two years show that the warm mix got significantly stiffer with time but that the WMA and HMA are comparable.
Figure 3.33. Hamburg Wheel Tracking Tests for SH 251.
54
Figure 3.34. Indirect Tensile Strength Results for SH 251.
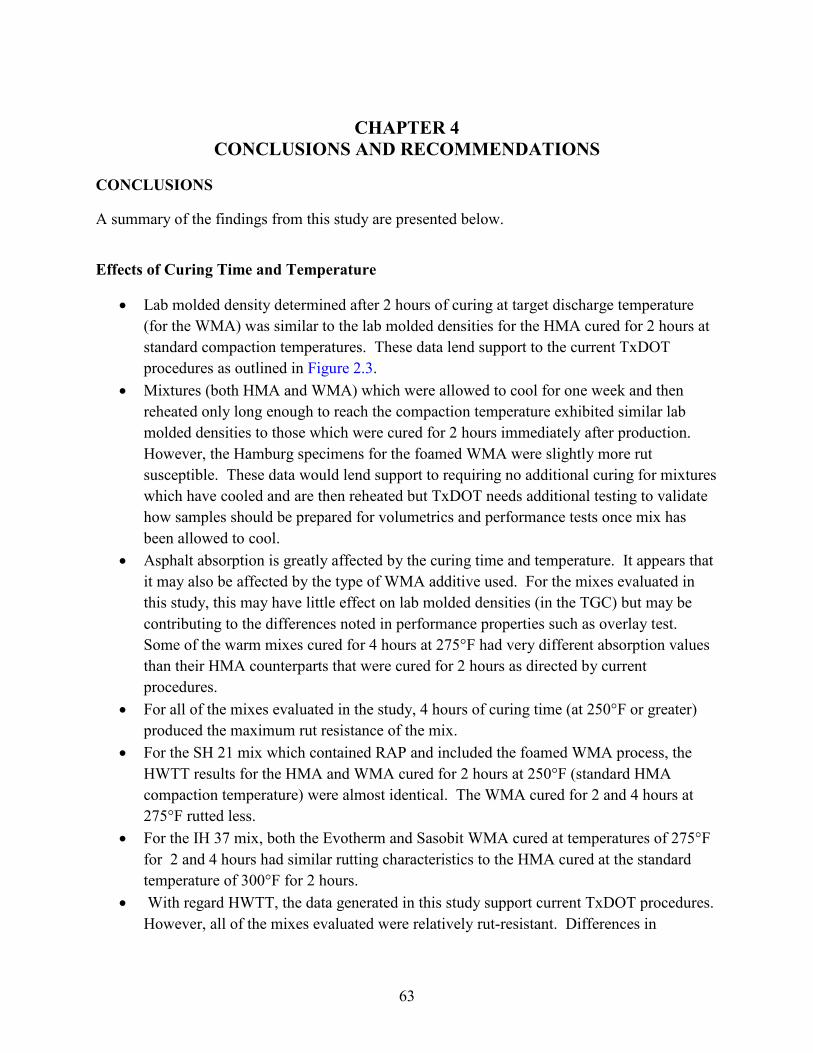
Field Performance Evaluation Both the WMA and HMA portions of SH 251 are performing well with no rutting. A few slight transverse cracks were observed as shown in the foreground of Figure 3.35. The WMA (right lane) and HMA (left lane) are side by side and the cracks extend full width.
Figure 3.35. Transverse Cracking in both HMA and WMA Sections of SH 251.

55
RIVERSIDE TEST SECTIONS PROJECT 0-6992
In cooperation with TxDOT study 0-6992, Practical Field Guidelines for the Compaction of HMA or WMA researchers evaluated both hot and warm mix placed as test sections at Texas A&M’s Riverside Campus. The mix was produced and placed by Knife River in Bryan. The mix design details are shown in Table 3.14.
Table 3.14. Riverside Test Section WMA/HMA Project Details. Project Location Riverside Campus TAMU Construction Dates Summer 2010 Mix Design Information • Item 341, Type D Dense Graded
• PG 64-22 Aggregate: 93% Hanson New Braunfels LS 7% Field Sand 20% RAP Lime 1%
• AC Content: 5.1% Warm Mix Asphalt Technology Aqua Black Mixture Production Temperature at Load Out: 250°F WMA
290°F HMA
Laydown and Compaction Mat Thickness: 2 in. Mixture Performance Properties Laboratory test results for cores taken immediately after construction and then one year later are shown in Figures 3.36 through 3.38.
Figure 3.36. Hamburg Wheel Tracking Tests for Riverside Test Sections.

56
Figure 3.37. Overlay Test Results Tests for Riverside Test Sections.
Figure 3.38. Indirect Tensile Strength Tests for Riverside Test Sections.

57
ATLANTA-FINE SMA IH 20
The Atlanta-Fine SMA project was constructed in 2010. Several complications were encountered including a mix design change, the use of warm-mix construction (without warm-mix design), and record breaking heat. The project suffered from severe flushing issues. This fine SMA project is located on IH 20 running 16.5 miles from Longview to Marshall extending from RM 596.5 to 614. The traffic conditions on this road are high severity. This section of IH 20 is a 4-lane rural interstate with a speed limit of 70 mph, and is a major east-west trucking route. The estimated AADT/lane is 7,750 with 30% truck traffic. The existing pavement structure consisted of about 5 in. of asphalt, on 8 in. of continually reinforced concrete, on stabilized base and subgrade. In several locations, the asphalt-concrete layer interface had moisture damage. The surface had reflected transverse and longitudinal cracking and a generally rough ride. The subgrade is a low-plasticity sandy loam at shallow depths and low- to moderate-plasticity silty and sandy clay loam deeper down. These thicknesses were confirmed with field coring.
Overlay Design and Construction
The Atlanta-Fine SMA mix was designed according to TxDOT Item 346-Type F. The aggregate was primarily a Class A quartzite. The asphalt content was determined volumetrically with PG 70-22 binder at 6.4% and an additional 0.2% fibers were used to stabilize the mix. The design passed the HWTT with 6.9 mm rutting after 20,000 cycles and the overlay test with >1,000 cycles. In construction, the binder was modified with a warm-mix additive while the binder content and compaction effort remained unchanged. The effects of the additive are not captured in the lab tests IH 20 was surfaced with a fine SMA in the spring of 2010 and produced using a foaming WMA technology; however, the temperature was not reduced. Unfortunately, several issues were encountered during construction. Because thin mats tend to cool very fast, the compaction temperature was not reduced and the foaming was intended to aid in compaction. The mix was originally designed with a PG 76-22 binder, but was changed to a less-expensive PG 70-22 after learning the lower-grade mix passed laboratory rutting tests. After most of the construction was complete, severe flushing problems with this binder were observed, so a smaller 2-mile section was consequently constructed with the PG 76-22 and without the foaming additive. According to the quality control records, 25% of the sampled locations had air voids much lower than allowed, and several other locations also had asphalt contents greater than the target content, but still within the tolerance limit. Performance problems were likely a cumulative result of the issues described above.

58
Overlay Performance
Since the time of construction, serious flushing problems were noted. This issue was well documented with photos and field cores in late 2010 and early 2011 in conjunction with emergency repairs after just a few months of service. Shortly after construction, all lanes in all directions were severely flushed as shown in Figure 3.39. This occurred after record-high temperatures with over a week of air temperatures above 110°F and surface temperatures likely at 160°F. A small area constructed with PG 76-22
Figure 3.39. Severe Flushing (Atlanta-Fine SMA).
(rather than PG 70-22) and without the foaming additive was performing much better, but did have some flushing. Some rutting failures were also observed, as shown in Figure 3.40, but only for 2 miles in the outer lane in the westbound direction. The field cores in Figure 3.41 clearly illustrate the flushing problem and moisture damage concerns. The surface of the cores in the wheel path is smooth and completely closed up with asphalt. Some of the cores also show signs of stripping within the overlay and debonding from the existing asphalt.

59
Figure 3.40. Rutting for 2-miles in Westbound Direction (Atlanta-Fine SMA).
Figure 3.41. Flushed and Moisture Damaged Core Specimens (Atlanta-Fine SMA).
The severe flushing on this project is likely a compounded effect. The primary cause was the switch to PG 70-22 binder instead of PG 76-22. This is evidenced by the short PG 76-22 section
Stripping Layer debonding

60
which is performing much better. The very hot weather was clearly significant. The “70” in “PG 70-22” refers to 70°C (158°F) as the upper limit of desirable viscosity properties in the binder. This limit was almost certainly approached. Finally, the use of warm-mix technology without lowering the compaction temperature could also have caused problems, though most of the tested air voids are within acceptable limits. US 96 JASPER In 2010, TTI researchers worked with the Construction Division to investigate a rutting failure on US 96 in Jasper County. The asphalt mix at the intersections experienced a high severity of rutting (Figure 3.42) and the areas outside of the intersections experienced shallow to no rutting. This roadway had recently received a foamed warm mix SMA over a CAM on top of jointed concrete pavement. Hamburg requirements for the CAM were reduced from 20,000 to 15,000 passes and the recovered asphalt binder failed to meet the DSR requirements. The Construction Division found that this in combination with the fine gradation and high asphalt content of the CAM did not provide adequate support for the surface lift of SMA for the existing traffic. TTI took cores from a good section of the roadway and found the following results: Indirect Tensile Strength: 146.7 psi (Density 94.4%) 150.5 psi (Density 94.7%) 160.3 psi (Density 94.6%) Overlay Test Cycles to Failure: 151 (Density 95.2%) 78 (Density 94.1%) 45 (Density 95.3%) Hamburg Wheel Tracking Test: 5.12 mm rut at 20,000 cycles.

61
Figure 3.42. Rutting Intersections on US 96.

62
The Construction Division evaluated the mixture properties of both lifts and in the areas performing poorly as well as in the good-performing areas. They found that the mixture properties in the good areas were not significantly different than those in the areas experiencing rutting, with the exception of in-place air voids for both lifts. The in-place air voids of the cores in the wheelpaths were significantly less and indicated that both lifts of the HMA were rutting, as well as the calculated thicknesses of the cores (See Figure 3.43). The significant difference was in the location of the HMA. The HMA placed at intersections was subjected to much higher shear stresses.
Outside WP
Inside WP
Center lane
Thicknesses
SMA 1.3 to 1.5 in
CAM 1.1 to 1.1 in
SMA 1.8 to 2.0 in
CAM 1.7 to 2.0 in
SMA 0.9 to 1.1 ins
CAM 0.6 to 0.9 ins
Figure 3.43. Cores Taken from Rutted Intersection on US 96.
63
CHAPTER 4
CONCLUSIONS AND RECOMMENDATIONS
CONCLUSIONS
A summary of the findings from this study are presented below.
Effects of Curing Time and Temperature
• Lab molded density determined after 2 hours of curing at target discharge temperature (for the WMA) was similar to the lab molded densities for the HMA cured for 2 hours at standard compaction temperatures. These data lend support to the current TxDOT procedures as outlined in Figure 2.3.
• Mixtures (both HMA and WMA) which were allowed to cool for one week and then reheated only long enough to reach the compaction temperature exhibited similar lab molded densities to those which were cured for 2 hours immediately after production. However, the Hamburg specimens for the foamed WMA were slightly more rut susceptible. These data would lend support to requiring no additional curing for mixtures which have cooled and are then reheated but TxDOT needs additional testing to validate how samples should be prepared for volumetrics and performance tests once mix has been allowed to cool.
• Asphalt absorption is greatly affected by the curing time and temperature. It appears that it may also be affected by the type of WMA additive used. For the mixes evaluated in this study, this may have little effect on lab molded densities (in the TGC) but may be contributing to the differences noted in performance properties such as overlay test. Some of the warm mixes cured for 4 hours at 275°F had very different absorption values than their HMA counterparts that were cured for 2 hours as directed by current procedures.
• For all of the mixes evaluated in the study, 4 hours of curing time (at 250°F or greater) produced the maximum rut resistance of the mix.
• For the SH 21 mix which contained RAP and included the foamed WMA process, the HWTT results for the HMA and WMA cured for 2 hours at 250°F (standard HMA compaction temperature) were almost identical. The WMA cured for 2 and 4 hours at 275°F rutted less.
• For the IH 37 mix, both the Evotherm and Sasobit WMA cured at temperatures of 275°F for 2 and 4 hours had similar rutting characteristics to the HMA cured at the standard temperature of 300°F for 2 hours.
• With regard HWTT, the data generated in this study support current TxDOT procedures. However, all of the mixes evaluated were relatively rut-resistant. Differences in
64
Hamburg results with regard to curing time and temperature may be more critical with other more sensitive mixes pointing to the need for additional testing.
• The overlay test is very sensitive to mixture oven curing time and temperature. Some of the mixes showed very dramatic reductions in cracking resistance when oven curing time was increased from 2 to 4 hours (including HMA). Additional testing is needed to establish standardized curing procedures for both HMA and WMA which reflect field performance properties.
Field Performance
• Field performance of WMA is comparable to HMA regardless of the type of WMA technology.
• Cores from field projects taken one year after construction indicate a significant “stiffening” of the WMA mixes as measured by HWTT, Overlay test, and Indirect Tensile Strength.
• Some of the WMA technologies exhibited significant improvement in Overlay test results. Beyond one year, no improvement in cracking resistance was observed with the WMA.
• Caution should be exercised when using WMA with the high performance mixes (such as SMAs or CAMs). If a mix which is high in asphalt content and low air voids and/or has a tendency towards moisture sensitivity, warm mix additives (including foam) can exacerbate instability or stripping.
RECOMMENDATIONS
The field performance results of this research support the full-scale implementation of warm mix which is well underway in Texas.
The results in this study support the TxDOT’s current curing time and temperature selection procedures; however, the number of mixture types evaluated were limited. Additional testing is needed on many different mixture types incorporating different aggregates and binders to fully validate curing time and temperature guidelines.

65
REFERENCES
Button, J.W., C.K. Estakhri, A. J. Wimsatt, 2007. A Synthesis of Warm Mix Asphalt, Report 5597-1, Texas Transportation Institute, Texas A&M University, College Station. Estakhri, C.K., J.W. Button, A. Alvarez Lugo, 2010. Field and Laboratory Investigation of Warm Mix Asphalt in Texas. Report 5597-2, Texas Transportation Institute, Texas A&M University, College Station, Texas.
