l-3 analyzing aggregate demand - bi.go.id · increased uncertainty about future income higher...
TRANSCRIPT

L-3
Analyzing Aggregate Demand
PresenterNatan Epstein
Deputy Director, STI
This training material is the property of the International Monetary Fund (IMF) and is intended for use in IMF courses. Any reuse requires the permission of the IMF.
IMF − Singapore Regional Training InstituteOT 18.52 Macroeconomic Diagnostics February 26 – March 2, 2018
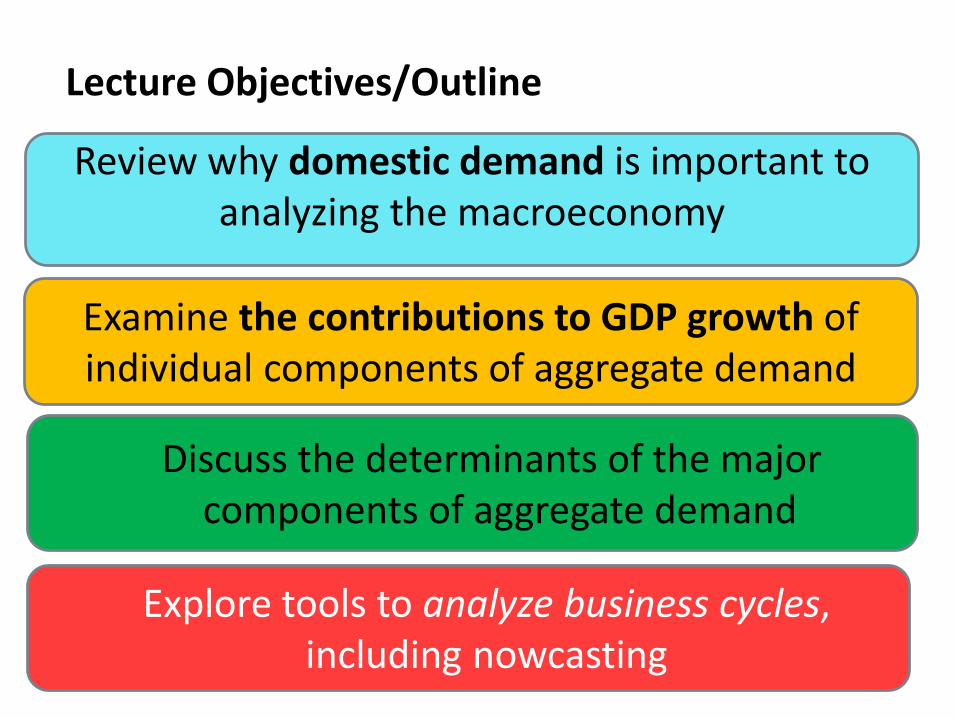
Lecture Objectives/Outline
Review why domestic demand is important to analyzing the macroeconomy
Examine the contributions to GDP growth of individual components of aggregate demand
Discuss the determinants of the major components of aggregate demand
Explore tools to analyze business cycles, including nowcasting
What will we cover in the workshop?
We will:
• Examine the contributions from individual components of aggregate demand to GDP growth
• Analyze fluctuations in GDP and detect business cycles
• Evaluate the usefulness of leading indicators

Why do we analyze domestic demand?
• Fluctuations in domestic demand (DD) play an important role in economic cycles
• DD impacts inflation, fiscal, and monetary policy
And is affected by these factors
• Domestic demand relative to national income determines the external current account and the exchange rate
• Consumption/saving and investment have important implications for current and future economic welfare and macro stability
Investment -> Capital accumulation -> future production capacity

Aggregate Demand and Aggregate Supply
• AD illustrates the relationship between prices and output demanded
• Many factors can cause demand to shift such as increase in money supply, investment, government consumption or decrease in taxes
• When aggregate demand increases there is a movement along the supply curve.
P
Real GDP
AS
AD1
AD2
P2
P1
Y1 Y2

I. Short-term analysis of AD

The expenditure approach to GDP
GDP = Final Consumption (Cp + Cg) + Investment (Ip+ Ig+ DS)
+ exports (X) – imports (M) of goods & services
= Domestic absorption (A) + Net Exports (X-M)
• Note that domestic absorption includes both public and private consumption (Cp and Cg) and investment (Ip and Ig), and the change in inventory investment (DS).
• Understanding the behavior of these key components is important to understanding the behavior of the economy.

What are the sources of growth?
( ( ))
( )
( ) ( )
( )
GDP C I X M
GDP GDP
C I X M
GDP GDP GDP
C C I I X M X M
C GDP I GDP X M GDP
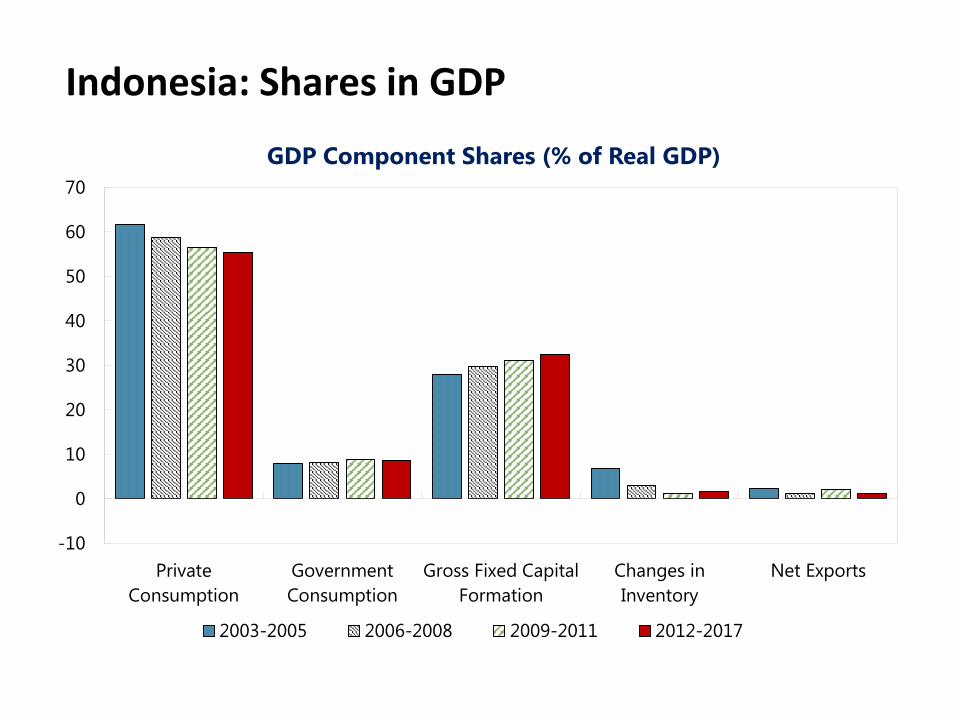
Indonesia: Shares in GDP
-10
0
10
20
30
40
50
60
70
Private
Consumption
Government
Consumption
Gross Fixed Capital
Formation
Changes in
Inventory
Net Exports
GDP Component Shares (% of Real GDP)
2003-2005 2006-2008 2009-2011 2012-2017
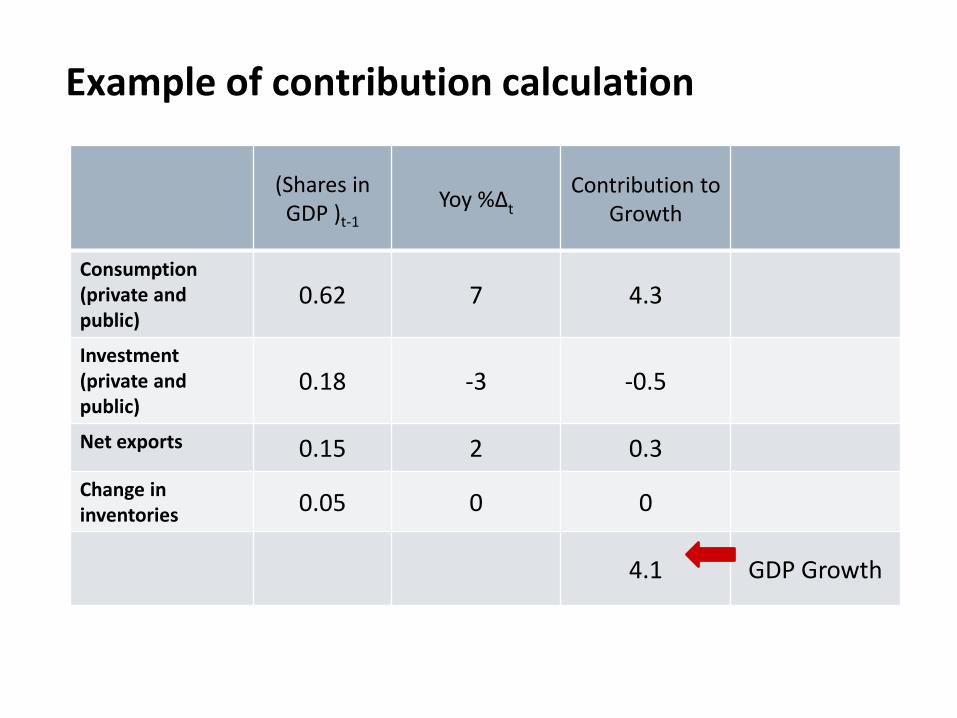
Example of contribution calculation
(Shares in GDP )t-1
Yoy %∆t
Contribution to Growth
Consumption (private and public)
0.62 7 4.3
Investment (private and public)
0.18 -3 -0.5
Net exports 0.15 2 0.3
Change in inventories 0.05 0 0
4.1 GDP Growth

-8
-6
-4
-2
0
2
4
6
8
10
12
14
Q1-2008 Q1-2010 Q1-2012 Q1-2014 Q1-2016
Indonesia: Sources of Growth (Contributions to Real GDP Growth YoY)
Private Consumption Public Consumption Public Investment
Private Investment Change In Inventory Net Exports
Statistical Discrepencies Real GDP Growth %Δ Year-over-Year
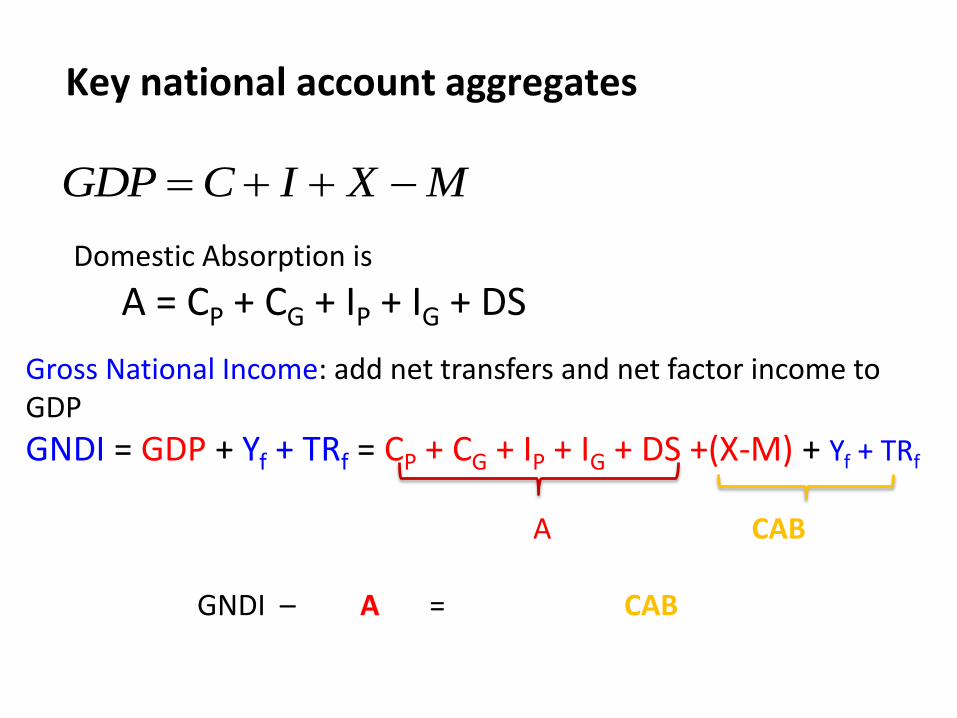
A = CP + CG + IP + IG + DS
Gross National Income: add net transfers and net factor income to GDP
GNDI = GDP + Yf + TRf = CP + CG + IP + IG + DS +(X-M) + Yf + TRf
A CAB
GNDI – A = CAB
Key national account aggregates
GDP C I X M
Domestic Absorption is
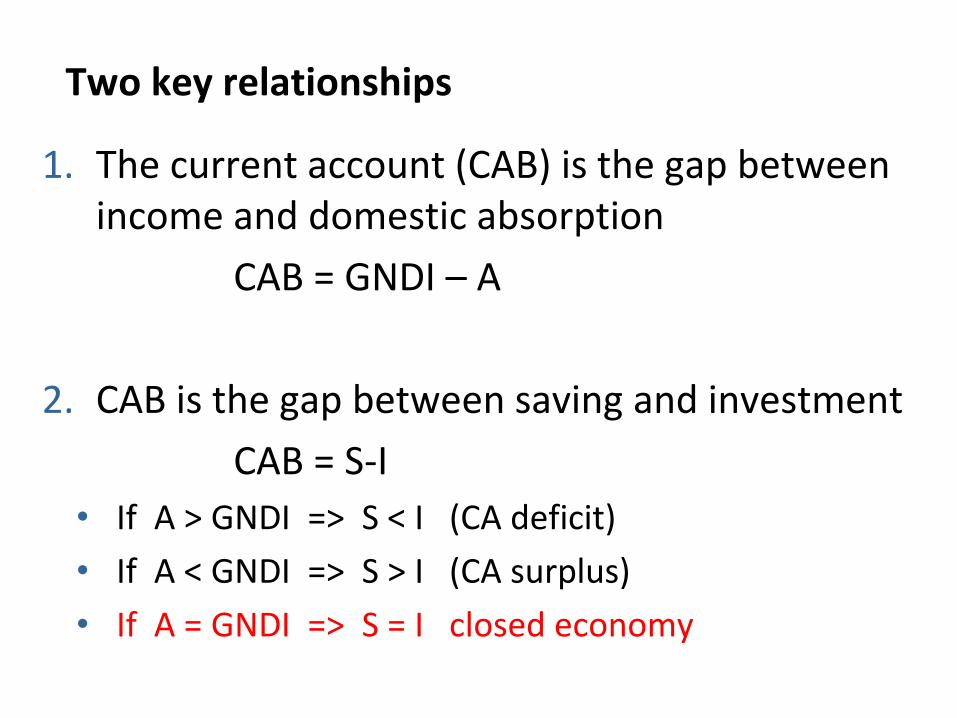
Two key relationships
1. The current account (CAB) is the gap between income and domestic absorption
CAB = GNDI – A
2. CAB is the gap between saving and investment
CAB = S-I
• If A > GNDI => S < I (CA deficit)
• If A < GNDI => S > I (CA surplus)
• If A = GNDI => S = I closed economy
II. Analysis of the key components:
Consumption
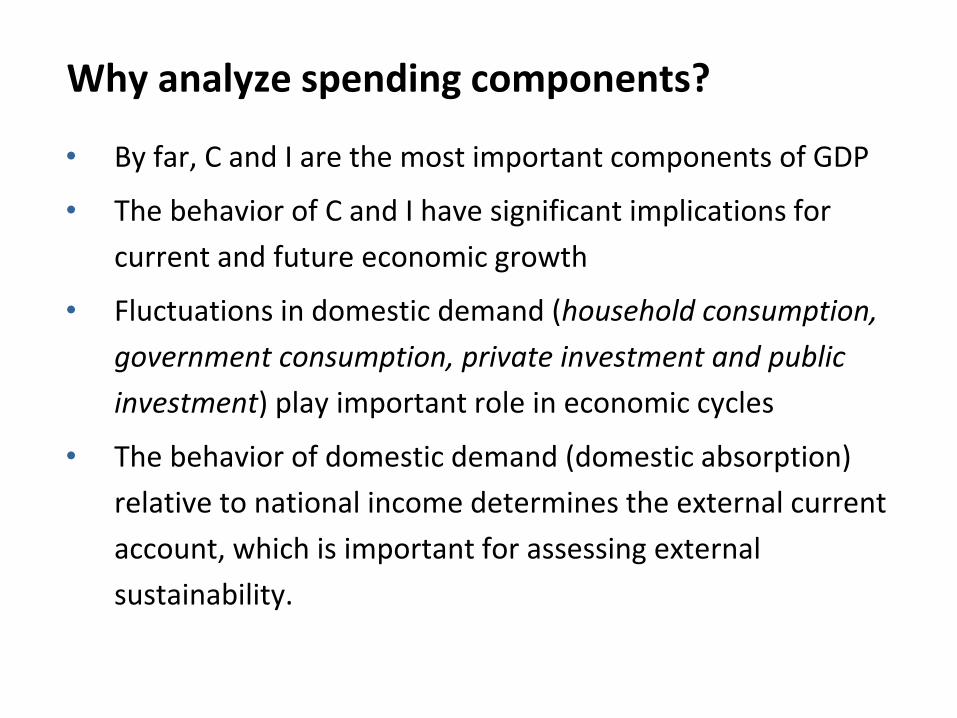
Why analyze spending components?
• By far, C and I are the most important components of GDP
• The behavior of C and I have significant implications for
current and future economic growth
• Fluctuations in domestic demand (household consumption,
government consumption, private investment and public
investment) play important role in economic cycles
• The behavior of domestic demand (domestic absorption)
relative to national income determines the external current
account, which is important for assessing external
sustainability.

Durables• Examples: motor vehicles, furniture and household equipment• Tend to be highly cyclical
Non-durables• Examples: food, clothing and shoes, fuel• Not very cyclical because they are necessities for the most part; these
purchases generally track population growth
Services• Examples: housing services, transportation• May include imputed items• Not very cyclical because they are necessities for the most part; these
purchases generally track population growth• Fast growing countries relatively ask for more services
What are the key components of consumption?
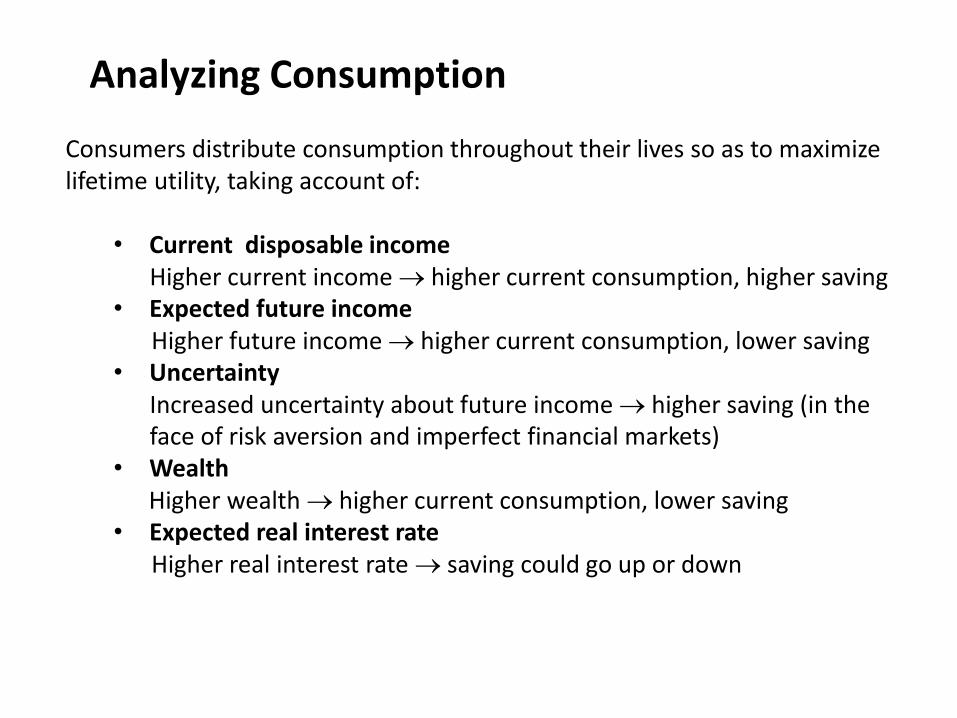
Consumers distribute consumption throughout their lives so as to maximize lifetime utility, taking account of:
• Current disposable incomeHigher current income higher current consumption, higher saving
• Expected future incomeHigher future income higher current consumption, lower saving
• UncertaintyIncreased uncertainty about future income higher saving (in the face of risk aversion and imperfect financial markets)
• WealthHigher wealth higher current consumption, lower saving
• Expected real interest rateHigher real interest rate saving could go up or down
Analyzing Consumption
Other determinants of consumption
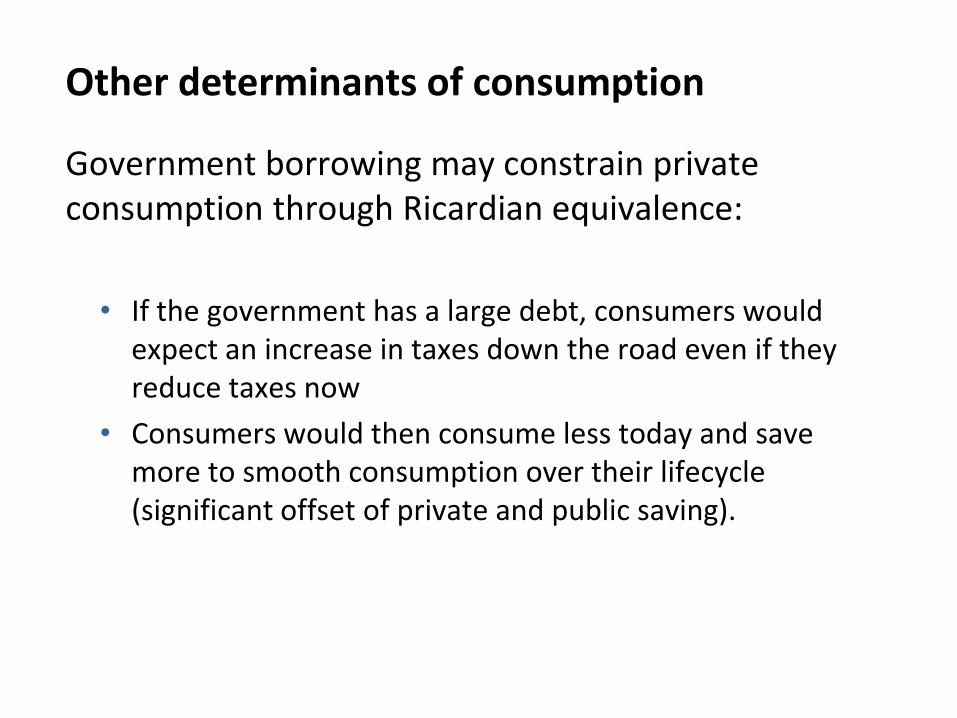
Government borrowing may constrain private consumption through Ricardian equivalence:
• If the government has a large debt, consumers would expect an increase in taxes down the road even if they reduce taxes now
• Consumers would then consume less today and save more to smooth consumption over their lifecycle (significant offset of private and public saving).
III. Analysis of the key components:
Investment

What are the key components of investment?
Private fixed investment
• Nonresidential structures, e.g., commercial buildings, industrial plants, farm buildings
• Producers’ durable equipment, e.g., ICT equipment, transportation equipment
• Residential structures, i.e., housing
Inventory investment
• Change in inventories from the previous period
• Not level of inventories
Government investment

Private investment (IP) includes spending by businesses and households on fixed assets.
IP is much more volatile than consumption
• substantially contributes to fluctuations in GDP.
Driving factors:
• Rate of return
• Expected future income
• Cost of finance
• Access to financing
• Uncertainty
Analyzing Private Investment
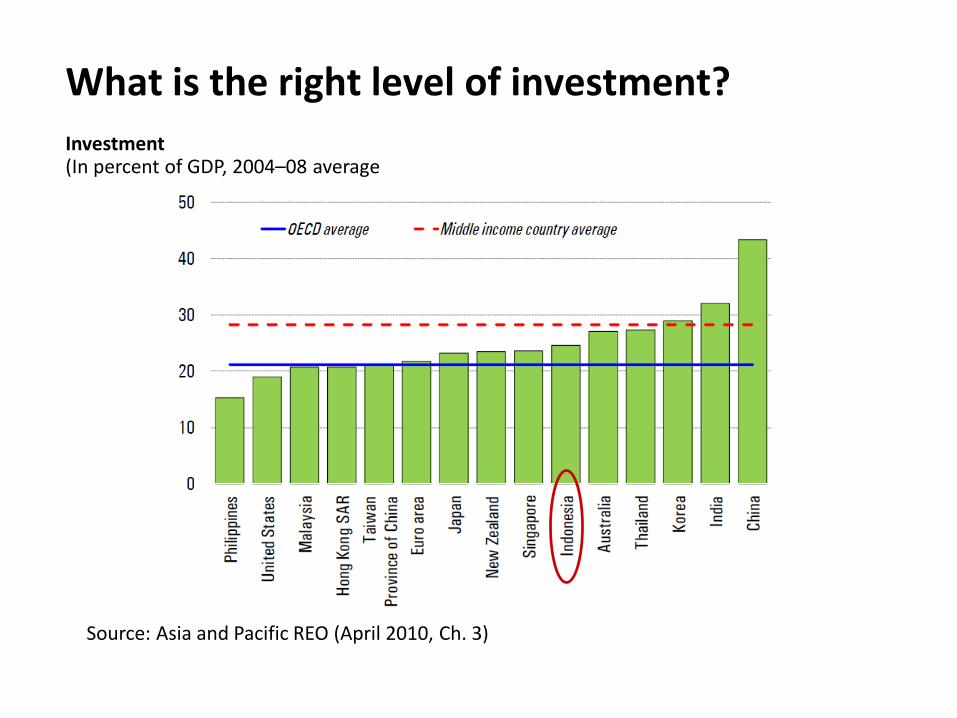
What is the right level of investment?
Investment(In percent of GDP, 2004–08 average
Source: Asia and Pacific REO (April 2010, Ch. 3)
III. Business cycles, indicators, and nowcasting
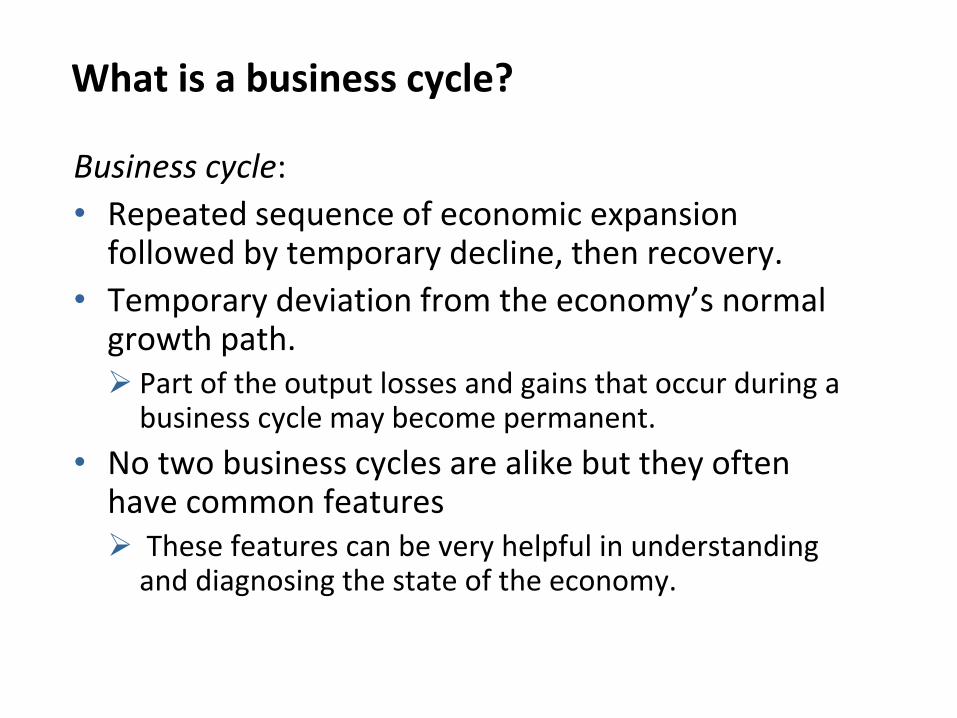
What is a business cycle?
Business cycle:
• Repeated sequence of economic expansion followed by temporary decline, then recovery.
• Temporary deviation from the economy’s normal growth path. Part of the output losses and gains that occur during a
business cycle may become permanent.
• No two business cycles are alike but they often have common features These features can be very helpful in understanding
and diagnosing the state of the economy.
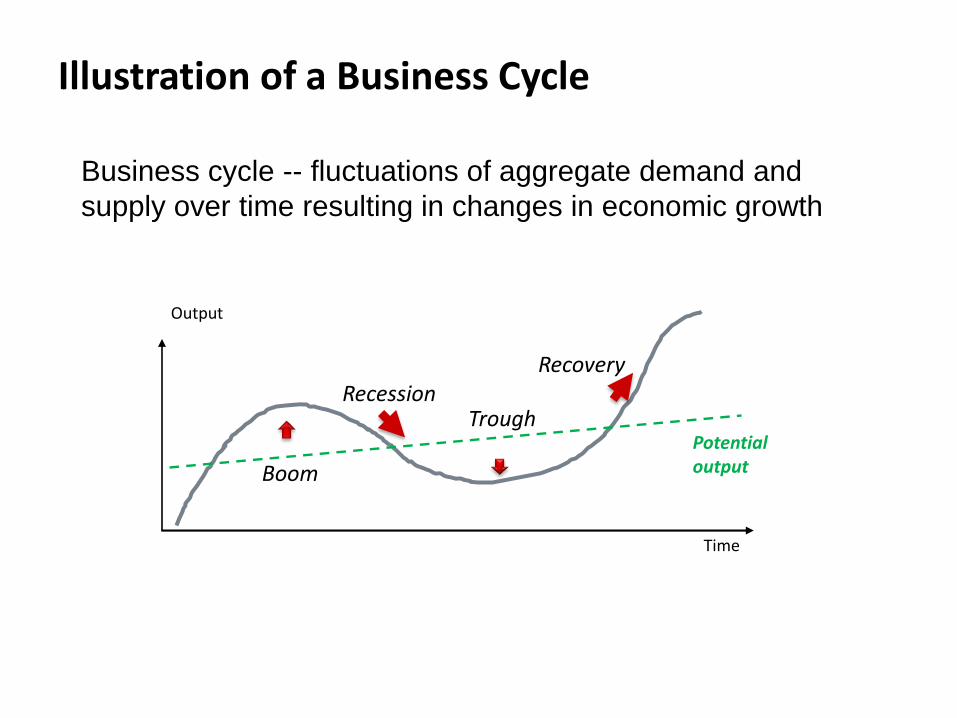
Business cycle -- fluctuations of aggregate demand and
supply over time resulting in changes in economic growth
Illustration of a Business Cycle
Output
Time
Boom
TroughRecession
Recovery
Potential output
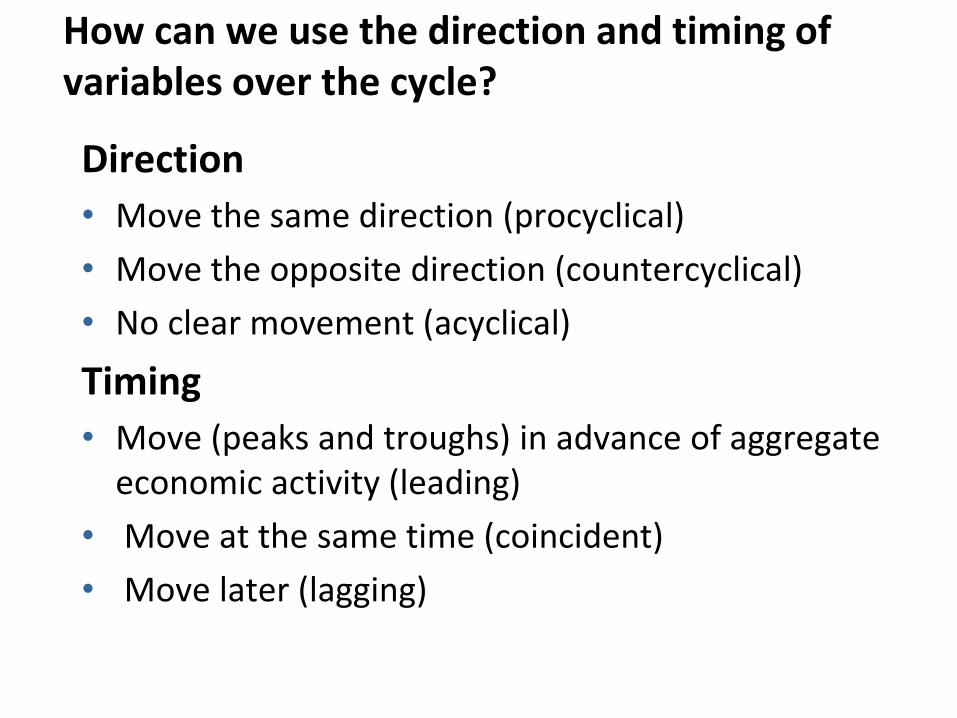
How can we use the direction and timing of variables over the cycle?
Direction
• Move the same direction (procyclical)
• Move the opposite direction (countercyclical)
• No clear movement (acyclical)
Timing
• Move (peaks and troughs) in advance of aggregate economic activity (leading)
• Move at the same time (coincident)
• Move later (lagging)
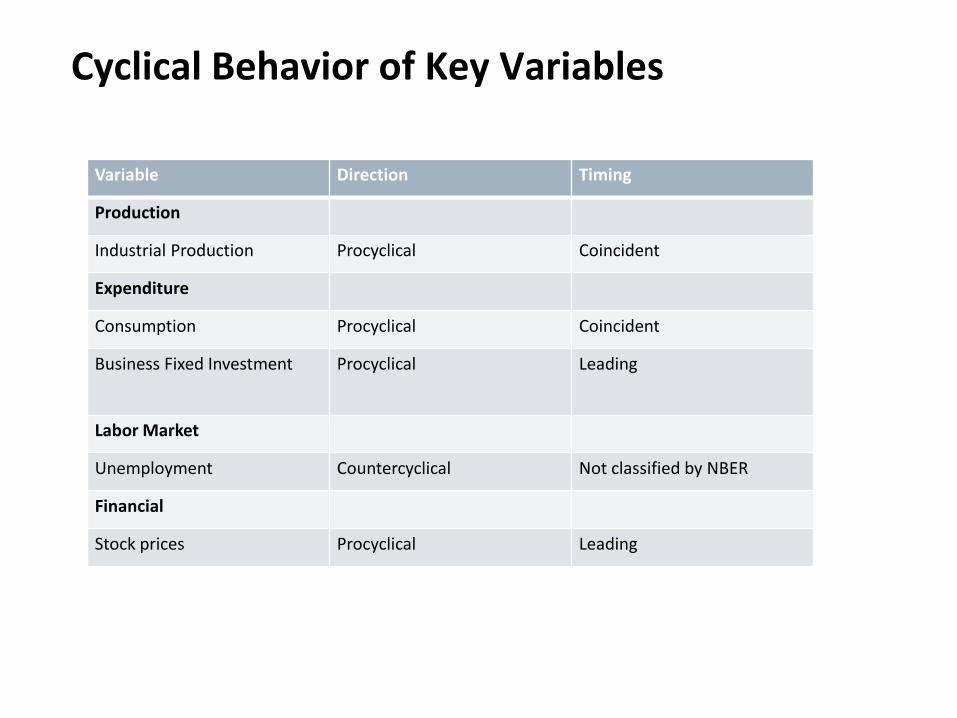
Cyclical Behavior of Key Variables
Variable Direction Timing
Production
Industrial Production Procyclical Coincident
Expenditure
Consumption Procyclical Coincident
Business Fixed Investment Procyclical Leading
Labor Market
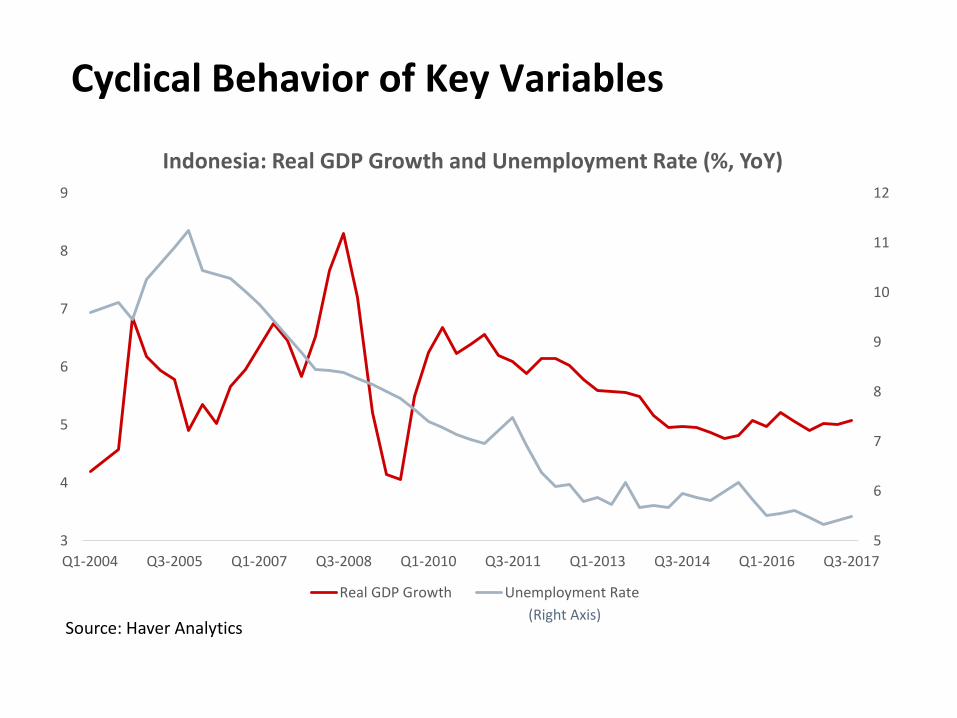
Unemployment Countercyclical Not classified by NBER
Financial
Stock prices Procyclical Leading
Cyclical Behavior of Key Variables
5
6
7
8
9
10
11
12
3
4
5
6
7
8
9
Q1-2004 Q3-2005 Q1-2007 Q3-2008 Q1-2010 Q3-2011 Q1-2013 Q3-2014 Q1-2016 Q3-2017
Indonesia: Real GDP Growth and Unemployment Rate (%, YoY)
Real GDP Growth Unemployment Rate
Source: Haver Analytics(Right Axis)
Cyclical Behavior of Key Variables
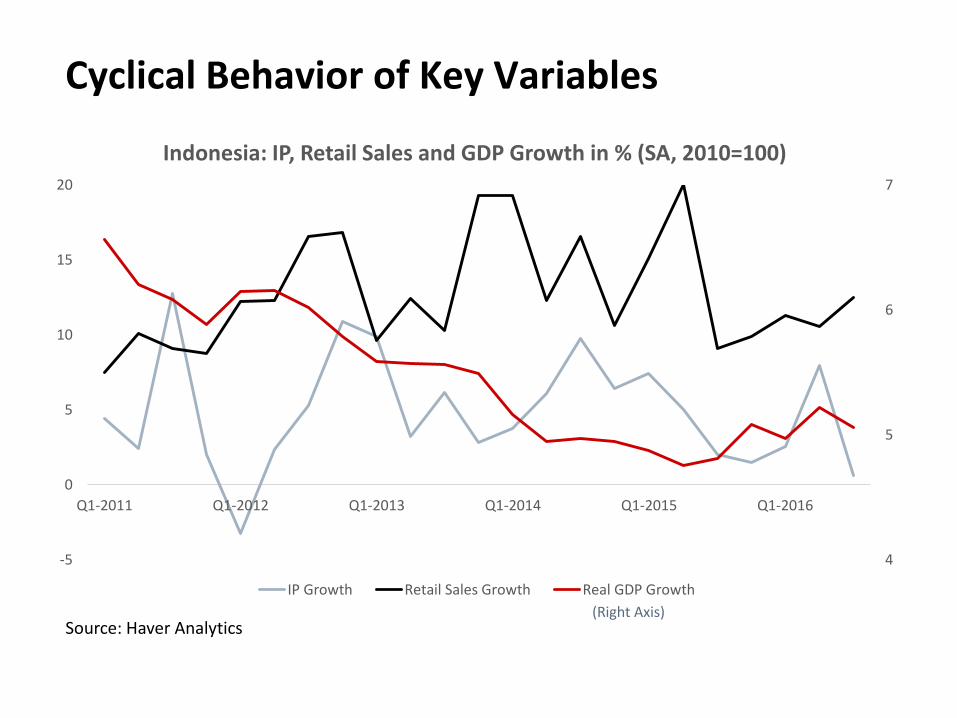
Source: Haver Analytics
4
5
6
7
-5
0
5
10
15
20
Q1-2011 Q1-2012 Q1-2013 Q1-2014 Q1-2015 Q1-2016
Indonesia: IP, Retail Sales and GDP Growth in % (SA, 2010=100)
IP Growth Retail Sales Growth Real GDP Growth
(Right Axis)
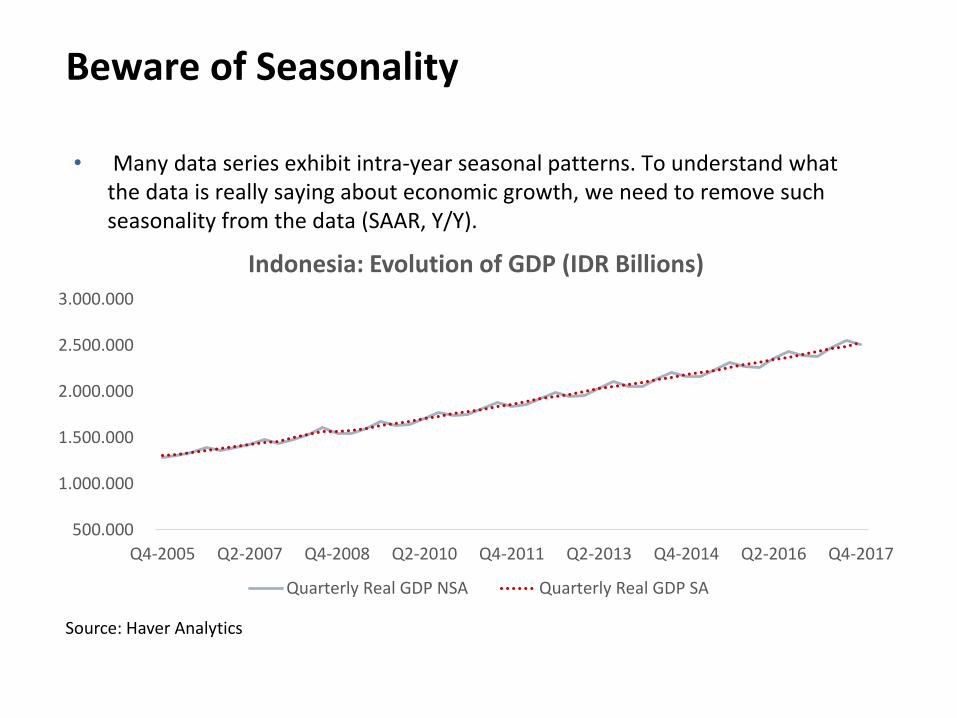
Beware of Seasonality
• Many data series exhibit intra-year seasonal patterns. To understand what the data is really saying about economic growth, we need to remove such seasonality from the data (SAAR, Y/Y).
Source: Haver Analytics
500.000
1.000.000
1.500.000
2.000.000
2.500.000
3.000.000
Q4-2005 Q2-2007 Q4-2008 Q2-2010 Q4-2011 Q2-2013 Q4-2014 Q2-2016 Q4-2017
Indonesia: Evolution of GDP (IDR Billions)
Quarterly Real GDP NSA Quarterly Real GDP SA
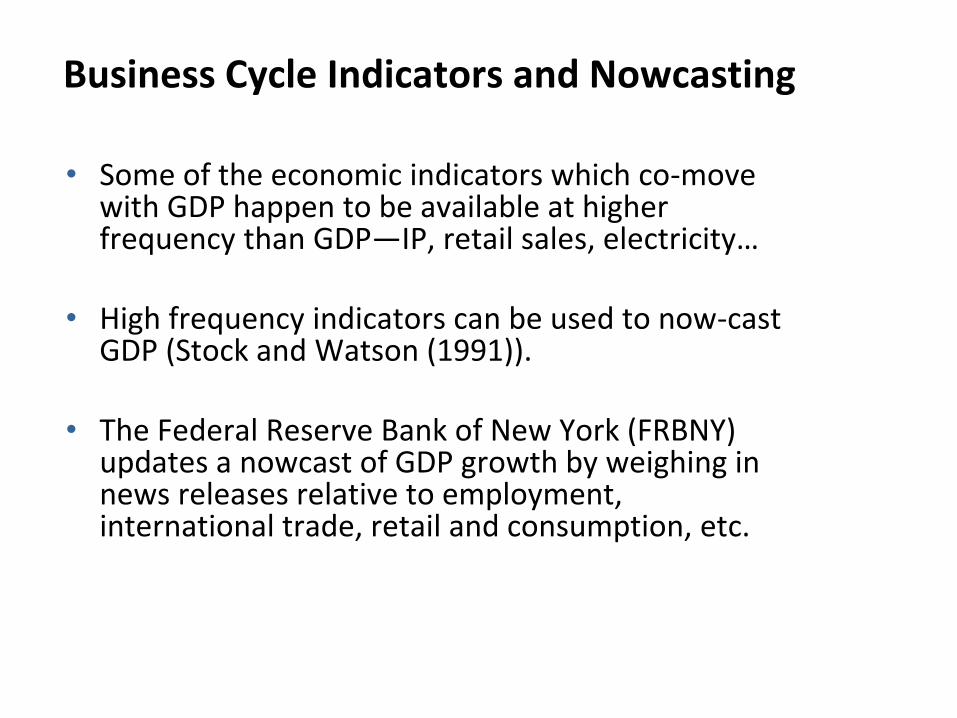
Business Cycle Indicators and Nowcasting
• Some of the economic indicators which co-move with GDP happen to be available at higher frequency than GDP—IP, retail sales, electricity…
• High frequency indicators can be used to now-cast GDP (Stock and Watson (1991)).
• The Federal Reserve Bank of New York (FRBNY) updates a nowcast of GDP growth by weighing in news releases relative to employment, international trade, retail and consumption, etc.

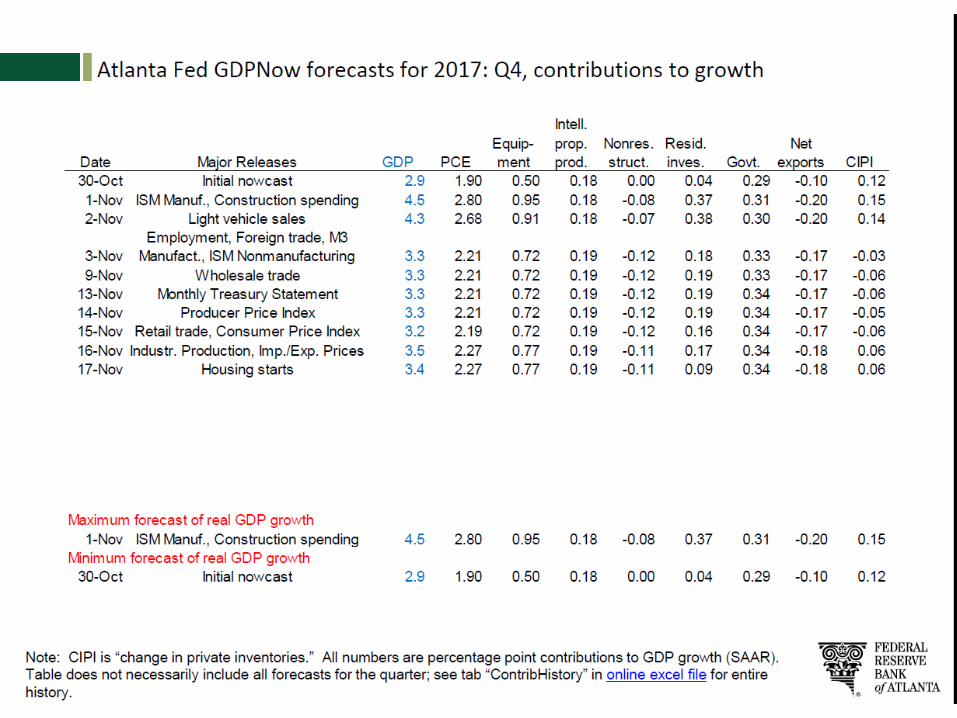
Nowcasting: An Example from the FRBNY
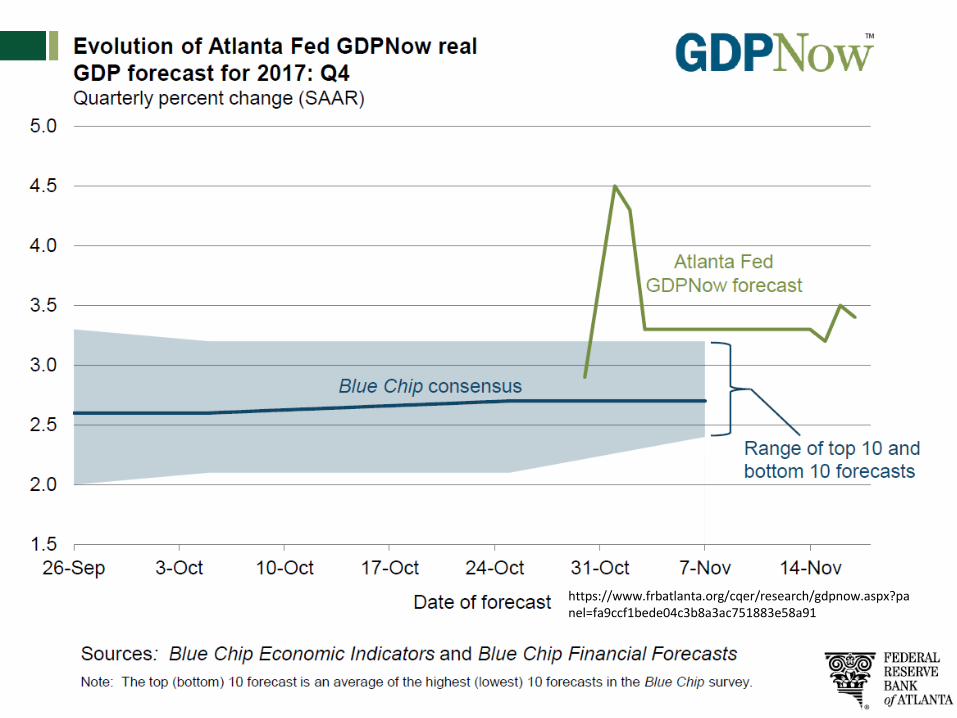
https://www.frbatlanta.org/cqer/research/gdpnow.aspx?panel=fa9ccf1bede04c3b8a3ac751883e58a91
Business cycle analysis
• Familiarity with cyclical patterns of key macro variables can help detect when the economy may be off track
• Very helpful in pinning down the causes
• Provide insights into what is going on during the current quarter / year
• Standard measures to assess the current state of the economy are often available with lags and revisions
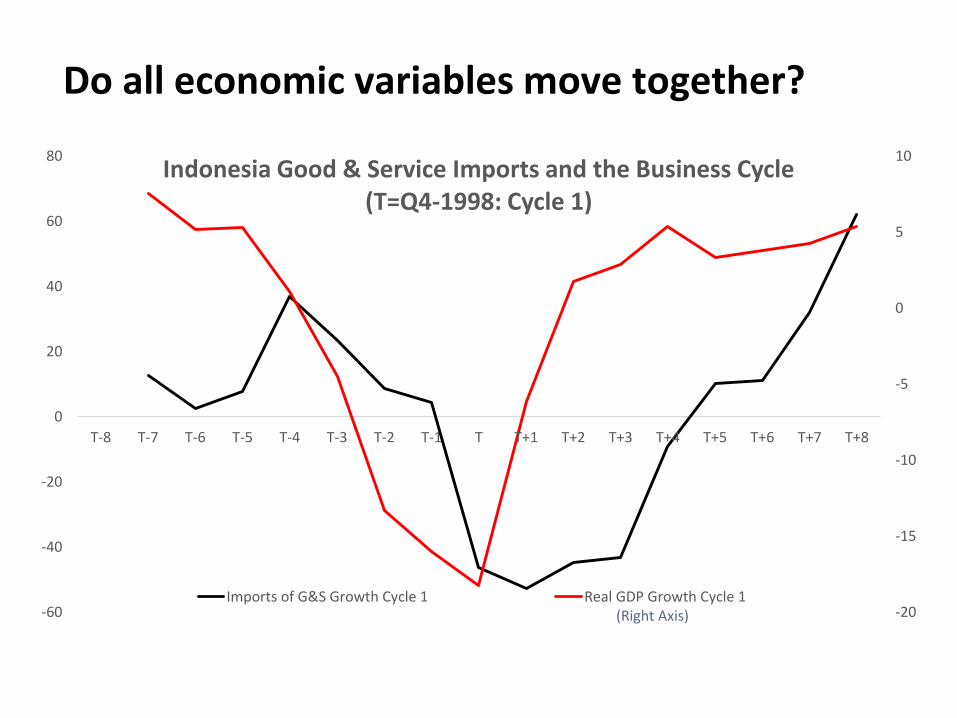
Do all economic variables move together?
-20
-15
-10
-5
0
5
10
-60
-40
-20
0
20
40
60
80
T-8 T-7 T-6 T-5 T-4 T-3 T-2 T-1 T T+1 T+2 T+3 T+4 T+5 T+6 T+7 T+8
Indonesia Good & Service Imports and the Business Cycle (T=Q4-1998: Cycle 1)
Imports of G&S Growth Cycle 1 Real GDP Growth Cycle 1(Right Axis)
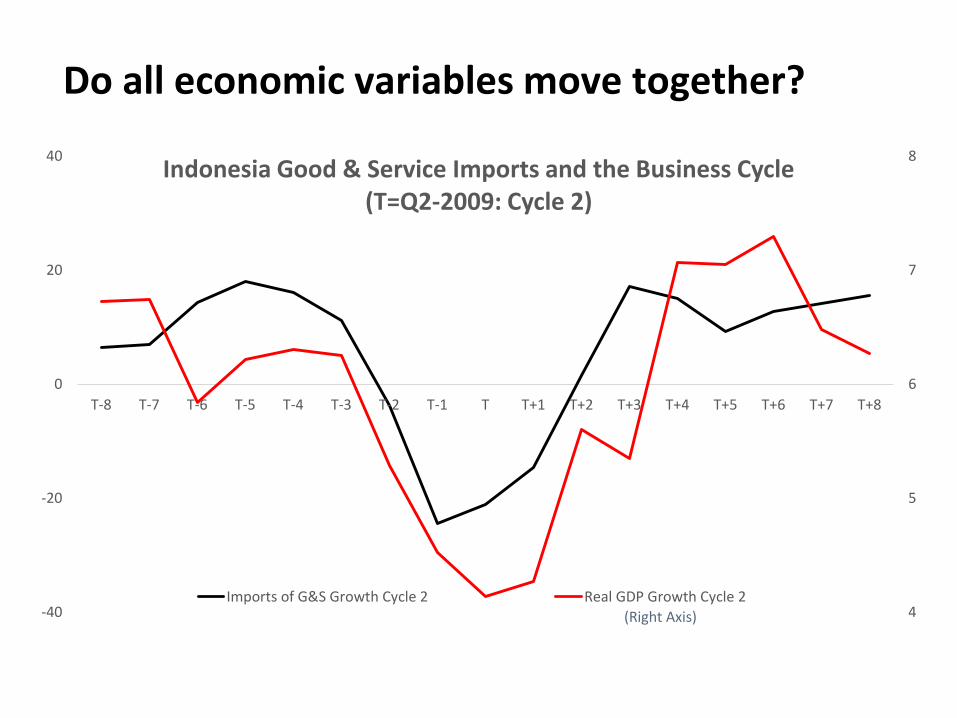
Do all economic variables move together?
(Right Axis) 4
5
6
7
8
-40
-20
0
20
40
T-8 T-7 T-6 T-5 T-4 T-3 T-2 T-1 T T+1 T+2 T+3 T+4 T+5 T+6 T+7 T+8
Indonesia Good & Service Imports and the Business Cycle (T=Q2-2009: Cycle 2)
Imports of G&S Growth Cycle 2 Real GDP Growth Cycle 2

What does IP say about GDP growth?
2
3
4
5
6
7
8
-6
-4
-2
0
2
4
6
8
10
12
14
T-8 T-7 T-6 T-5 T-4 T-3 T-2 T-1 T T+1 T+2 T+3 T+4 T+5 T+6 T+7 T+8
Indonesia IP and the Business Cycle (T=Q2-2009: Cycle 2)
IP Growth Real GDP Growth
(Right Axis)

Key takeaways
• Potential output estimation tools include time series filters and theory based-methods (production function approach), all have limits and should be used complementarily
• Analysis of domestic demand requires high quality data on GDP and its components, especially consumption and investment
• Understanding the underlying drivers of consumption and investment is key to diagnosing the state of the economy
• Business cycle provides information on the current state of the economy and the short run direction it might be moving in

Thank You

Appendix
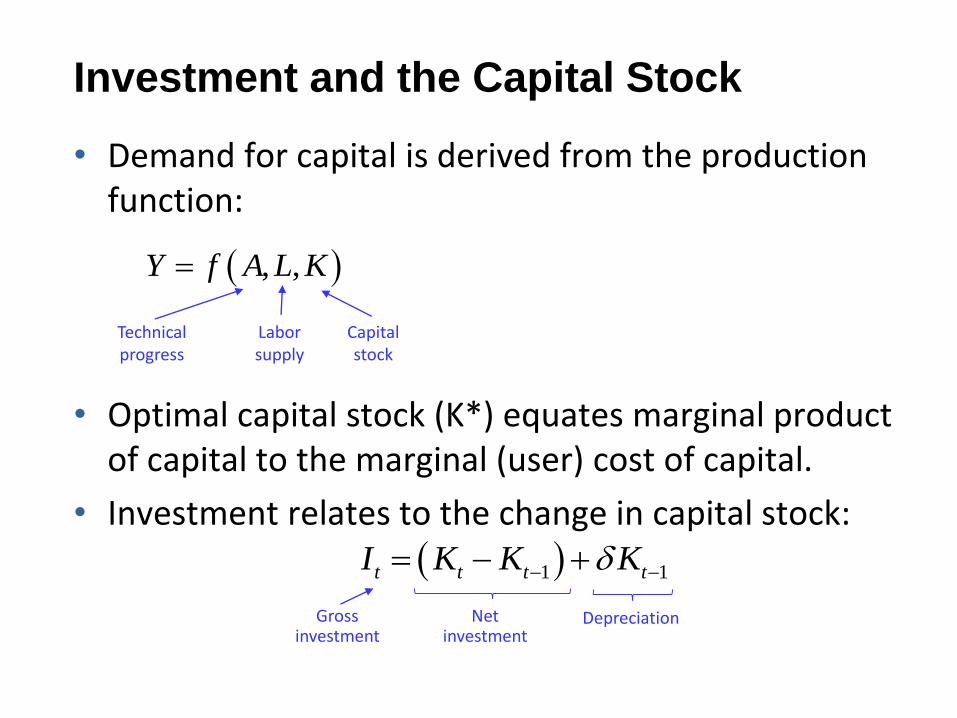
Investment and the Capital Stock
• Demand for capital is derived from the production function:
• Optimal capital stock (K*) equates marginal product of capital to the marginal (user) cost of capital.
• Investment relates to the change in capital stock:
, ,Y f A L K
1 1t t t tI K K K
Gross investment
Net investment
Depreciation
Technical progress
Capital stock
Labor supply