kundli cold storage - sameeekshasameeeksha.org/pdf/clusterprofile/kundli_cold_storage.pdf · energy...
TRANSCRIPT

Energy Profile: Kundli Cold Storage Cluster
I
KUNDLICOLD STORAGECLUSTER
ENERGY PROFILE


ENERGY PROFILE
KUNDLICOLD STORAGECLUSTER

Certificate of originality
Original work of TERI done under the project ‘Profiling of Energy-Intensive Small and Medium Enterprise (SME) Clusters’.
This document may be reproduced in whole or in part and in any form for educational and non-profit purposes without special permission, provided acknowledgement of the source is made. SSEF and TERI would appreciate receiving a copy of any publication that uses this document as a source.
Suggested format for citation
TERI. 2016Energy Profile: Kundli Cold Storage Cluster, Kundli (Haryana) New Delhi: The Energy and Resources Institute, 24 pp.[Project Report No. 2015IE18]
Disclaimer
This document is an output of a research exercise undertaken by TERI supported by the Shakti Sustainable Energy Foundation (SSEF) for the benefit of MSME sector. While every effort has been made to avoid any mistakes or omissions, TERI and SSEF would not be in any way liable to any persons/organizations by reason of any mistake/omission in the publication.
Published by
TERI PressThe Energy and Resources InstituteDarbari Seth BlockIHC Complex, Lodhi RoadNew Delhi-110 003India
For more information
Project Monitoring CellT E R I Tel. 2468 2100 or 2468 2111Darbari Seth Block E-mail [email protected] Complex, Lodhi Road Fax 2468 2144 or 2468 2145New Delhi – 110 003 Web www.teriin.orgIndia India +91 • Delhi (0)11
ContentsAcknowledgements
Kundli Cold Storage Cluster
Overview of cluster .................................................................................................................1
Product, market, and production capacities ........................................................................1
Cold storage process................................................................................................................2
Technologies employed ...........................................................................................................6
Energy scenario in the cluster ................................................................................................7
Energy consumption ...............................................................................................................8
Potential energy efficient technologies .................................................................................9
Major cluster actors and cluster development activities ...................................................11
Abbreviations

AcknowledgementsTERI places on record its sincere thanks to the Shakti Sustainable Energy Foundation (SSEF) for supporting the project on profiling of energy intensive micro, small, and medium enterprises (MSME) clusters in India.
TERI team is indebted to MSME-Development Institute (DI), Karnal (Haryana) and Kundli Cold Storage and Ware Housing Association (KCSWHA) for providing data and information related to cold storage units in Kundli cluster. TERI extends its sincere thanks to Mr Trilok Singh, Assistant Director, MSME DI, Karnal, for organizing field visits and interactions with unit members during the study for the preparation of this energy profile report. TERI also places on record the support provided by Mr Mange Rem (Joint Secretary, KCSWHA) and Mr Amit Aggarwal (General Secretary, KCSWHA) during the study.
Last but not least, our sincere thanks to MSME entrepreneurs and other key stakeholders in the cluster for providing valuable data and inputs that helped in cluster analysis.


Energy Profile: Kundli Cold Storage Cluster
1
Kundli Cold Storage Cluster
Overview of cluster
Th e Kundli cold storage cluster is situated in Sonipat district, which is one of the 21 districts of the state of Haryana in northern India and is a part of National Capital Region (NCR). Th e cold storage industries were set up in Sonipat primarily due to the strategic location of the place, which is near to farms (located in Haryana and Punjab) as well as consumer market. Another major factor for existence of cluster is the capital investment subsidy (35% of project costs) scheme of national horticulture board for construction/expansion/modernization of cold storage and storage for horticulture products. Th e purpose of cold storage is to strengthen post-harvest storage and marketing infrastructure.
Most of the cold storage facilities were established in the cluster under government schemes for development of cold storage and warehouse facilities. Leading cold storage facilities in the cluster include Kumar Ice & Cold Storage, Ambe Agro & Cold Storage (P) Ltd, R J Cold Storage (P) Ltd, Sabharwal Food Industries (P) Ltd, etc.
Product, market, and production capacities
Cold storage facility is a temperature controlled supply chain network, with storage and distribution activities carried out in a manner such that the temperature of diff erent products are maintained within a specifi ed range to keep them fresh and edible for a longer time period. Post-harvesting products, such as fruits (apple), pulses (legume, chhole, and rajma), spices, vegetables (potato), etc., are directly sent to cold storage through farmers or through intermediate dealers. Kundli cold storages are the main storing facilities for products being sold out in Delhi/NCT market. Some of the intermediate dealers/merchants also procure products from Gujarat, Madhya Pradesh, Punjab, and Himachal Pradesh during farming season, which are stored in cold storages and sold during off season or when there is demand for a particular product.
Th ere are about 90 cold storage facilities in Sonipat district, of which about 53 facilities are located in Kundli area. Th e capacity of the cold storage facilities in Kundli varies from 665–8,600 MT. About 50% of cold storage facilities are below 2,500 MT capacity, which are below the average capacity of 2,833 MT per cold storage in the cluster.
Locational Map of Sonipat, Kundli and Delhi(Source: Google Map)

Energy Profile: Kundli Cold Storage Cluster
2
Average capacity of the Capacity 1 (below 2,500 MT) cold storage facilities is estimated to be 1,676 MT, Capacity 2 (2,500 to 5,000 MT) is 3,710 MT, and for Capacity 3 (over 5,000 MT) is 6,505 MT. Th e storage capacity-wise distribution of cold storage facilities in Kundli is given in the following table and pie chart.
Capacity-wise distribution of cold storage facilities
Category Capacity (MT) Number of unitsCapacity 1 Up to 2,500 27 Capacity 2 2,500–5,000 23 Capacity 3 Above 5,000 3
Capacity-wise distribution ofKundli cold storage facilities
Linkage of units in home furnishing
Th e estimated annual turnover of the cluster is valued to be `290 crore, which is mainly the rent/fee taken towards storage of diff erent products. Th e linkage between farms, cold storage facility, and market is shown in the fi gure below.
Cold storage process
Th e process adopted by a cold storage facility is defi ned from the construction stage. Primarily, cold storage, which required pre-cooling process before storing the material in constant atmosphere, is designed to cater to fruits and vegetables. Th ese facilities are meant for storing fresh fruits, vegetables, and other horticulture products that require pre-cooling/rapid cooling to ‘seven-eighth cooling’ in a short duration of 4–24 hours depending on requirements in order to preserve freshness, quality, and life.

Energy Profile: Kundli Cold Storage Cluster
3
For storage chamber, product storage conditions must be defi ned in terms of critical storage conditions of temperature, relative humidity (RH), CO2 levels, air circulation, light, etc. As research level data to design as per Indian conditions are not available, most of the designing is referred from Commodity Storage Manual of World Food Logistics Organization (WFLO). Th e Committee formed to prepare technical standards and protocol for the cold chain in India has followed the recommendations made by the US Department of Agriculture (Tropical Products Transport Handbook, McGregor, BM 1989).
Th e general process adopted by cold storage facilities in Kundli cluster has been discussed below.
Pre-cooling (limited to fruits and vegetables)
Pre-cooling process plays an important role to prolong the shelf life of fruits and vegetables by removing heat and reducing metabolic activities. Pre-cooling is the fi rst step in temperature management of fruits and vegetables aft er harvesting. It is an essential process in any cold chain management of horticultural produce. For fresh horticulture commodities, a delay by one hour at the fi eld temperature of 35oC between harvest and pre-cooling may reduce quality almost equal to 20 hours in storage. Delay in pre-cooling results in loss of moisture and weight from produce. Th ese losses combined with active micro-biological organisms can result in deterioration of quality.
Th ere are multiple methods for rapid removal of heat from produce and are largely dependent on perishability and refrigeration equipment of the produce and its adaptability to a specifi c method and availability of facilities. Th e basic processes for pre-cooling of fruits and vegetables include the following: » Hydro-cooling » Forced air cooling » Evaporative room cooling » Package ice cooling
Fruits and vegetables require pre-cooling at origin of produce (fi eld or farm), if transportation time to reach cold storage is relatively longer. Fresh produce, such as grapes, berries, cherries, leeches, melons, sapotas, okra, tomatoes, capsicum, chilli peppers, cucumbers, green beans, peas, and spinach should be cooled as soon as possible.
Storage
A multipurpose cold storage is a building structure in the form of palletized storage, suitable for long-term storage of fruit, vegetables, and other commodities under the critical ambient conditions, such as temperature, humidity, CO2, and air circulation rate.
Pre-cooling of applesSource: www.coldchainexperts.com

Energy Profile: Kundli Cold Storage Cluster
4
Th e typical range of the parameters for multi-commodities cold store chamber is given as follows.
Temperature: Th e variation in temperature should not be more than ±1oC of recommended temperature for a particular product. Apple, orange, pears, cherries, mushrooms, etc., should be kept in the range of 0–2oC.
Humidity: Relative humidity (RH) should be in the range of 95%–98% for the fruits and vegetables. In some of the range of vegetables, such as onion and garlic, it should be in the range of 65%–75%. Th e RH for apple, orange, pears, cherries, mushrooms, etc., should be in the range of 90%–95%.
CO2 level: CO2 level of cold store chamber should not be more than 4,000 ppm during the loading and 2,000 ppm during the holding. To maintain the CO2 level less than 4,000 ppm, 2–6 air changes per day is recommended.
Air circulation: Th e recommended design for multi-commodities cold storage facility is 170 m3/hr/MT of product holding. Th e air fl ow rate can be maintained in the range of 34–68 m3/hr aft er the produce reaches the chamber or desired temperature. Th e variable air fl ow rate can be maintained by installation of ‘variable frequency drive’ (VFD) with feedback from chamber temperature. Th e general temperature requirements for common commodities handled in Kundli cold storage facilities is given in the following table.
Temperature requirements for common commodities
Product Temperature RH (%)°C °F
Apples –1–4 30–40 90–95Apricots –0.5–0 31–32 90–95Bananas, green 13–14 56–58 90–95Beans, dry 4–10 40–50 40–50Beans, green or snap 4–7 4045 95Beans, lima, in pods 5–6 4143 95Blackberries –0.5–0 31–32 90–95Cabbage, early 0 32 98–100Cabbage, late 0 32 98–100Cashew apple 0–2 32–36 85–90Cherries, sour 0 32 90–95
Typical Layouts of Multi-Commodity Cold Store FacilitiesSource: National Horticulture Board
Energy Profile: Kundli Cold Storage Cluster
5
Product Temperature RH (%)°C °F
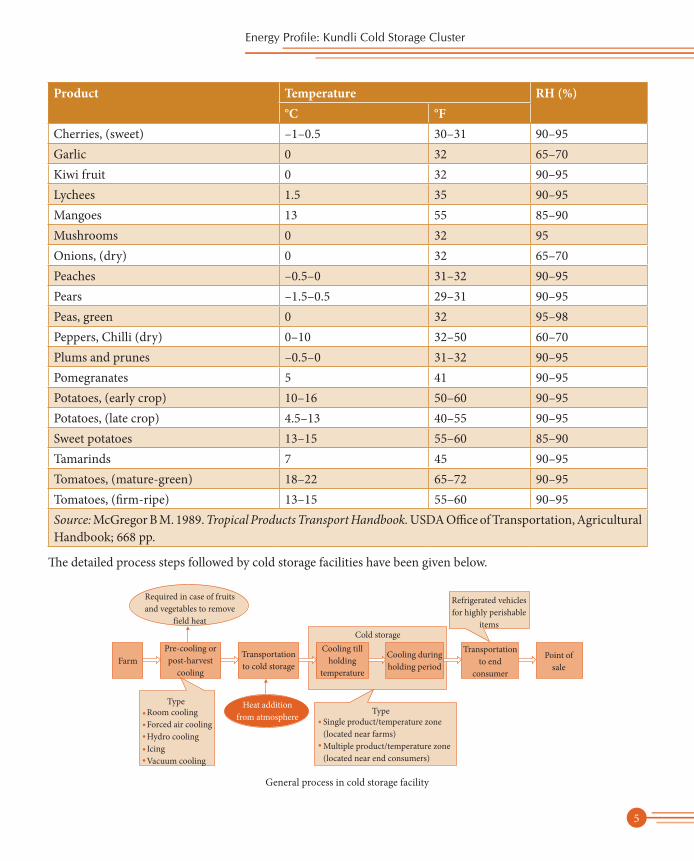
Cherries, (sweet) –1–0.5 30–31 90–95Garlic 0 32 65–70Kiwi fruit 0 32 90–95Lychees 1.5 35 90–95Mangoes 13 55 85–90Mushrooms 0 32 95Onions, (dry) 0 32 65–70Peaches –0.5–0 31–32 90–95Pears –1.5–0.5 29–31 90–95Peas, green 0 32 95–98Peppers, Chilli (dry) 0–10 32–50 60–70Plums and prunes –0.5–0 31–32 90–95Pomegranates 5 41 90–95Potatoes, (early crop) 10–16 50–60 90–95Potatoes, (late crop) 4.5–13 40–55 90–95Sweet potatoes 13–15 55–60 85–90Tamarinds 7 45 90–95Tomatoes, (mature-green) 18–22 65–72 90–95Tomatoes, (fi rm-ripe) 13–15 55–60 90–95Source: McGregor B M. 1989. Tropical Products Transport Handbook. USDA Offi ce of Transportation, Agricultural Handbook; 668 pp.
Th e detailed process steps followed by cold storage facilities have been given below.
General process in cold storage facility

Energy Profile: Kundli Cold Storage Cluster
6
Product-specifi c process (potato)
Technologies employedMulti-commodity cold storage facilities have multiple chambers of capacity ranging 30–1,250 MT, anterooms, docking/grading/sorting area, crates/palletized storage, machine room, toilets and changing room, electrical room, etc. Some of the major areas/equipment used in cold storage facility in cluster have been described below.
Refrigeration system
Most of the refrigeration units installed in the cluster use ammonia as refrigerant, reciprocating type, multi-cylinder, with accessories, such as oil separators, capacity control, and unloaded start. Th ough ammonia-based system is better for cold storage applications, it is toxic and precautions should while handling it. In case there is a restriction of using ammonia at certain locations, the refrigeration system can be designed to work on R134a, R404A, etc. (as per guidelines provided in Technical Standards and protocol for the cold chain in India, National Horticulture Board).
Th e general assembly of ammonia-based refrigeration system consist of a reciprocating compressor, ammonia pump, atmospheric/evaporative condensers, and fan coil units, which are installed in cold chamber area. In almost all units, all systems were operated at maximum load conditions and controlling of system is done manually. Electric motors associated with compressor (including new installations) are of standard effi ciency class and rewound. Only a few units (about three cold storage facilities) use screw compressors.
Mild steel piping is used to handle refrigerant (interconnecting compressor, condenser, and cooling units). A large number of un-insulated areas/locations were observed in the facilities. Most of valves and fl ange were found un-insulated in both old and new facilities.
Product-specifi c process (potato)
Refrigeration unit in Kundli cold storage

Energy Profile: Kundli Cold Storage Cluster
7
Cold chamber
Cold chamber for long-/medium-term storage has a capacity of 250–1,250 MT and for short-term or transit storage, the capacity ranges from 30 to 150 MT. All new cold storage facilities follow technical standards and protocols of cold storage as prescribed by the National Horticulture Board for construction of cold chambers. Th e walls of cold storage are 230 mm thick and made from brick or solid concrete blocks with sand and cement plaster. Th e roof is made of ‘reinforced cement concrete’ (RCC) or truss roof with GI/pre-coated GI sheet cover. Th e fl oor comprises base concrete.
Cold chambers are provided with appropriate insulation on walls, ceilings/roofs, and fl oors. Cold storage units use bin, crates, pallets, and racks for storing and vertically stacking the produce in the cold chamber. To prevent air infi ltration in cold chamber strip curtains are used. However, in most facilities, curtains were either not available or not in proper conditions.
Apart from cold chamber, cold storage units also have anterooms and product grading and sorting area. Anterooms are mainly used to avoid direct infi ltration of warm ambient air into the cold rooms and it also serves as warm-up chambers for produce stored so they do not get wet due to condensation on unloading for dispatch. Product grading and sorting area is generally used for processing the arrived product through systematic classifi cation process before moving it to the cold chamber. In dry weather conditions, product processing area is generally maintained at a comfortable level using evaporative cooling; however for high humidity conditions, air-conditioning system with humidifi er are used to maintain the temperature range of 20–24°C.
Lighting/illumination system
Th e lighting provided in the cold chamber is mainly compact fl uorescent lamps (CFL) and fl uorescent tube lights (T-8/T-12) in machine room and other areas. Some of the facilities still have incandescent lamps in cold chambers and mercury vapour lamps in shed and common areas.
Energy scenario in the cluster
Th e applicable electricity tariff for Kundli cold storage facilities has been shown in the table below.
Prices of major energy sources
Source Remarks PriceElectricity HT industry (above 50 kW) Demand charges: `170 per kVA
Energy charges: @11 kV—`6.15 per kVAh@33 kV—`6.05 per kVAh@66/132 kV—5.95 per kVAh
LT industry (up to 50 kW) Demand charges: `185 per kWEnergy charges: @up to 10 kW—`5.95 per kVAh@10–20 kW—`6.25 per kVAh@20–50 kW—`6.00 per kVAh
Source: Uttar Haryana Bijli Vitran Nigam Limited
Energy Profile: Kundli Cold Storage Cluster
8
Energy consumption
Unit level consumption
Electricity is the only energy form used in cold storage facilities. Few facilities also use diesel generator (DG) sets for backup power during power cuts, which use HSD. Th ere is no signifi cant eff ect on the cooling of the room temperature during short periods of power cuts. Th e major energy consuming area is the refrigeration unit, which accounts for about 89–95% of total energy input to the facility. Electricity consumption of diff erent capacities of cold storage facilities have been given in the table below.
Energy consumption of diff erent categories of cold storage facilities
Production category Electricity Diesel Total energy Total CO2 emissions Annual energy bill (million INR)(kWh/year) (lit/year) (toe/year) (tonne/year)
Capacity 1 (below 2,500 MT)
220,542 0 19.0 216 1.9
Capacity 2 (2,500–5,000 MT)
488,085 0 42.0 478 4.2
Capacity 3 (over 5,000 MT)
855,710 0 73.6 838 7.3
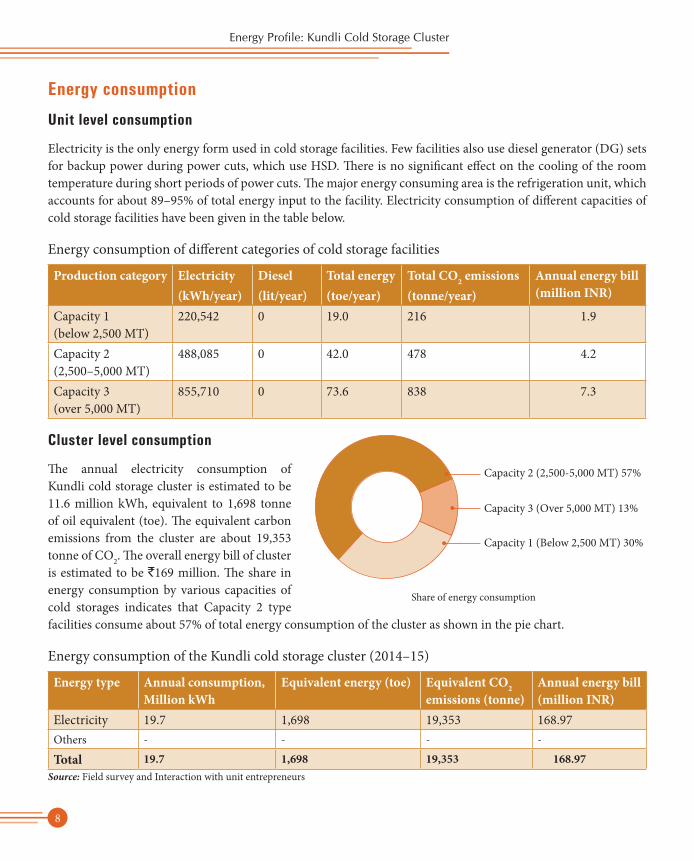
Cluster level consumption
Th e annual electricity consumption of Kundli cold storage cluster is estimated to be11.6 million kWh, equivalent to 1,698 tonne of oil equivalent (toe). Th e equivalent carbon emissions from the cluster are about 19,353 tonne of CO2. Th e overall energy bill of cluster is estimated to be `169 million. Th e share in energy consumption by various capacities of cold storages indicates that Capacity 2 type facilities consume about 57% of total energy consumption of the cluster as shown in the pie chart.
Energy consumption of the Kundli cold storage cluster (2014–15)
Energy type Annual consumption, Million kWh
Equivalent energy (toe) Equivalent CO2 emissions (tonne)
Annual energy bill (million INR)
Electricity 19.7 1,698 19,353 168.97 Others - - - -
Total 19.7 1,698 19,353 168.97 Source: Field survey and Interaction with unit entrepreneurs
Share of energy consumption
Energy Profile: Kundli Cold Storage Cluster
9
Potential energy efficient technologies
Some of the major energy effi cient technologies for Kundli cold storage facilities in the cluster have beendiscussed below.
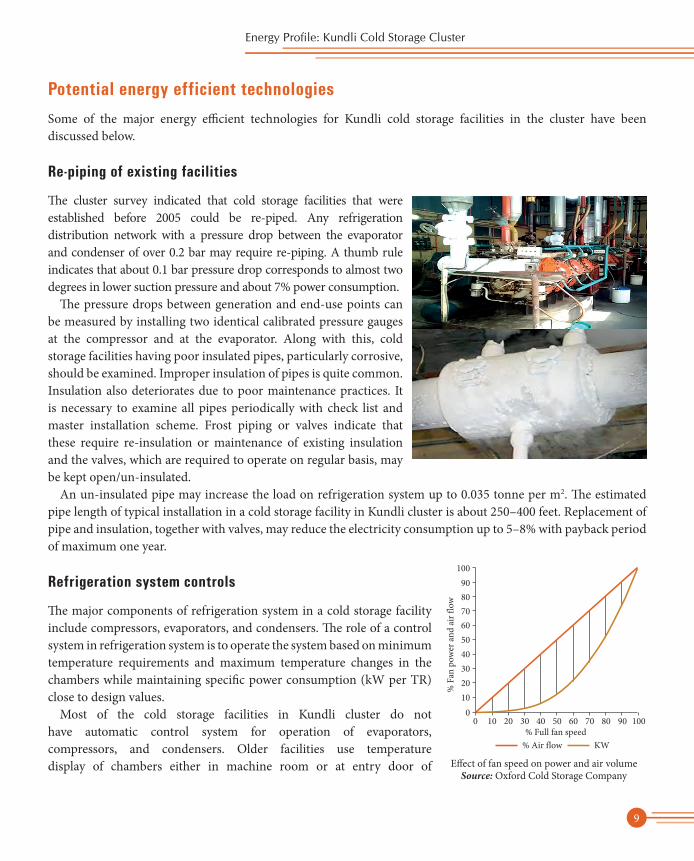
Re-piping of existing facilities
Th e cluster survey indicated that cold storage facilities that were established before 2005 could be re-piped. Any refrigeration distribution network with a pressure drop between the evaporator and condenser of over 0.2 bar may require re-piping. A thumb rule indicates that about 0.1 bar pressure drop corresponds to almost two degrees in lower suction pressure and about 7% power consumption.
Th e pressure drops between generation and end-use points can be measured by installing two identical calibrated pressure gauges at the compressor and at the evaporator. Along with this, cold storage facilities having poor insulated pipes, particularly corrosive, should be examined. Improper insulation of pipes is quite common. Insulation also deteriorates due to poor maintenance practices. It is necessary to examine all pipes periodically with check list and master installation scheme. Frost piping or valves indicate that these require re-insulation or maintenance of existing insulation and the valves, which are required to operate on regular basis, may be kept open/un-insulated.
An un-insulated pipe may increase the load on refrigeration system up to 0.035 tonne per m2. Th e estimated pipe length of typical installation in a cold storage facility in Kundli cluster is about 250–400 feet. Replacement of pipe and insulation, together with valves, may reduce the electricity consumption up to 5–8% with payback period of maximum one year.
Refrigeration system controls
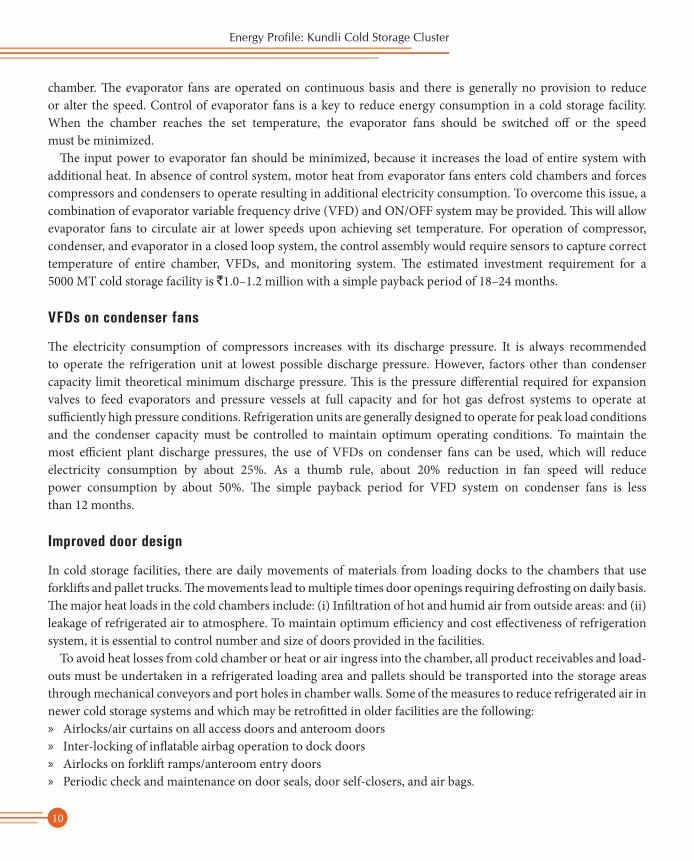
Th e major components of refrigeration system in a cold storage facility include compressors, evaporators, and condensers. Th e role of a control system in refrigeration system is to operate the system based on minimum temperature requirements and maximum temperature changes in the chambers while maintaining specifi c power consumption (kW per TR) close to design values.
Most of the cold storage facilities in Kundli cluster do not have automatic control system for operation of evaporators, compressors, and condensers. Older facilities use temperature display of chambers either in machine room or at entry door of Eff ect of fan speed on power and air volume
Source: Oxford Cold Storage Company
Energy Profile: Kundli Cold Storage Cluster
10
chamber. Th e evaporator fans are operated on continuous basis and there is generally no provision to reduce or alter the speed. Control of evaporator fans is a key to reduce energy consumption in a cold storage facility. When the chamber reaches the set temperature, the evaporator fans should be switched off or the speedmust be minimized.
Th e input power to evaporator fan should be minimized, because it increases the load of entire system with additional heat. In absence of control system, motor heat from evaporator fans enters cold chambers and forces compressors and condensers to operate resulting in additional electricity consumption. To overcome this issue, a combination of evaporator variable frequency drive (VFD) and ON/OFF system may be provided. Th is will allow evaporator fans to circulate air at lower speeds upon achieving set temperature. For operation of compressor, condenser, and evaporator in a closed loop system, the control assembly would require sensors to capture correct temperature of entire chamber, VFDs, and monitoring system. Th e estimated investment requirement for a5000 MT cold storage facility is `1.0–1.2 million with a simple payback period of 18–24 months.
VFDs on condenser fans
Th e electricity consumption of compressors increases with its discharge pressure. It is always recommended to operate the refrigeration unit at lowest possible discharge pressure. However, factors other than condenser capacity limit theoretical minimum discharge pressure. Th is is the pressure diff erential required for expansion valves to feed evaporators and pressure vessels at full capacity and for hot gas defrost systems to operate at suffi ciently high pressure conditions. Refrigeration units are generally designed to operate for peak load conditions and the condenser capacity must be controlled to maintain optimum operating conditions. To maintain themost effi cient plant discharge pressures, the use of VFDs on condenser fans can be used, which will reduce electricity consumption by about 25%. As a thumb rule, about 20% reduction in fan speed will reducepower consumption by about 50%. Th e simple payback period for VFD system on condenser fans is lessthan 12 months.
Improved door design
In cold storage facilities, there are daily movements of materials from loading docks to the chambers that use forklift s and pallet trucks. Th e movements lead to multiple times door openings requiring defrosting on daily basis. Th e major heat loads in the cold chambers include: (i) Infi ltration of hot and humid air from outside areas: and (ii) leakage of refrigerated air to atmosphere. To maintain optimum effi ciency and cost eff ectiveness of refrigeration system, it is essential to control number and size of doors provided in the facilities.
To avoid heat losses from cold chamber or heat or air ingress into the chamber, all product receivables and load-outs must be undertaken in a refrigerated loading area and pallets should be transported into the storage areas through mechanical conveyors and port holes in chamber walls. Some of the measures to reduce refrigerated air in newer cold storage systems and which may be retrofi tted in older facilities are the following: » Airlocks/air curtains on all access doors and anteroom doors » Inter-locking of infl atable airbag operation to dock doors » Airlocks on forklift ramps/anteroom entry doors » Periodic check and maintenance on door seals, door self-closers, and air bags.

Energy Profile: Kundli Cold Storage Cluster
11
Create buffer area (anterooms)
A signifi cant amount heat is added to cold storage rooms during loading and unloading processes of materials, which may be attributed to improper use of anteroom/buff er area. Th e main reason for such large ingression of heat is signifi cant temperature diff erence between cold storage room and the ambient. To avoid such air ingress, ante rooms need to be created that would act as buff er area between cold storage room and ambient. About 3–5% energy savings over baseline has been estimated with creation of anterooms. Th e implementation cost is negligible since anterooms have already been constructed in all new cold storage facilities as per guidelines of National Horticulture Board. However, at present a majority of cold storage facilities do not take benefi ts of buff er areas during loading and unloading.
Installation of high efficiency motors
A majority of electric motors used in air compressors, pumps, and fans of cold storage units are of standard effi ciency type motors. In a number of units, re-wind motors are commonly used. Th ese standard/rewound motors may be replaced with high-effi ciency IE-3 motors, for example, motors used in air compressors. Energy savings with high effi ciency motors is estimated to be 5–7% over the standard motors. Th e simple payback period estimated based on the average operating house is 18–24 months.
Use of high-efficiency/low-heat illumination system
Th e electricity share of illumination system in a typical cold storage is about 4–5%. Use of ineffi cient lighting/lamps leads to heat generation, which needs to be removed by refrigeration system. To avoid additional load due to illumination system, energy-effi cient lighting sources, which produce low level of heat and equal lumen level should be installed. LED light is one of the best options that produces quite small quantity of heat but delivers equal lux level with comparatively very less power. LED lights are claimed to produce minimum 80% of original light output with a life of about 50,000 hours. Use of LED lighting will help in reducing electricity bills required for illumination system up to 55% with a simple payback period of 24 months.
Major cluster actors and cluster development activities
Kundli Cold Storage and Ware Housing Association was formed in 1999. Th e association conducts annual general meeting to prepare development agenda for the upcoming year as well as need-based meetings/seminars on issues and market scenario. It also shares/disseminates information among members through various means for energy saving and technology upgradation.

Abbreviations
Abbreviation Full FormKCSWHA Kundli Cold Storage and Ware Housing AssociationkWh kilowatt-hourMSME Micro Small and Medium EnterprisesMSME-DI MSME-Development Institute NCR National Capital RegionRCC Reinforced Cement ConcreteRH Relative HumiditySPC Specific Power Consumptiontoe tonne of oil equivalentVFD Variable Frequency DriveWFLO World Food Logistics Organization

Notes

Notes

About TERI
A dynamic and flexible not-for-profit organization with a global vision and a local focus, TERI (The Energy and Resources Institute) is deeply committed to every aspect of sustainable development. From providing environment-friendly solutions to rural energy problems to tackling issues of global climate change across many continents and advancing solutions to growing urban transport and air pollution problems, TERI’s activities range from formulating local and national level strategies to suggesting global solutions to critical energy and environmental issues.
The Industrial Energy Efficiency Division of TERI works closely with both large industries and energy intensive Micro Small and Medium Enterprises (MSMEs) to improve their energy and environmental performance.
About SSEF
Shakti Sustainable Energy Foundation (SSEF), established in 2009, is a section-25 not-for-profit company, which aids design and implementation of clean energy policies that support promotion of air quality, energy efficiency, energy access, renewable energy and sustainable transportation solutions. The energy choices that India makes in the coming years will be of profound importance. Meaningful policy action on India’s energy challenges will strengthen national security, stimulate economic and social development, and keep the environment clean.
Apart from this, SSEF actively partners with industry and key industry associations on sub-sector specific interventions towards energy conservation and improvements in industrial energy efficiency.
About SAMEEEKSHA
SAMEEEKSHA (Small and Medium Enterprises: Energy Efficiency Knowledge Sharing) is a collaborative platform set up with the aim of pooling knowledge and synergizing the efforts of various organizations and institutions – Indian and international, public and private – that are working towards the development of the MSME sector in India through the promotion and adoption of clean, energy-efficient technologies and practices. The key partners of SAMEEEKSHA platform are: (i) Swiss Agency for Development and Cooperation: (ii) Bureau of Energy Efficiency: (iii) Ministry of MSME, Government of India and: (iv) The Energy and Resources Institute.
As part of its activities, SAMEEEKSHA collates energy consumption and related information from various energy intensive MSME sub-sectors in India. For further details about SAMEEEKSHA, visit http://www.sameeeksha.org