krs private equity portfolio review 2015 asset program reviews...asia private equity fundraising...
TRANSCRIPT
2015 PRIVATE EQUITY PROGRAM REVIEWKentucky Retirement Systems
October 2015
Kentucky Retirement Systems • 2015 Private Equity Program Review 2
Section Tab
Private Equity Market Overview 1
Pension Program Review 2
Insurance Program Review 3
Appendix Items Appendix
Partnership Overviews A
Program Projections B
Agenda Items
Kentucky Retirement Systems • 2015 Private Equity Program Review 3
Section 1: Private Equity Market Overview
Kentucky Retirement Systems • 2015 Private Equity Program Review 4
Private Equity Market OverviewIndustry Trends
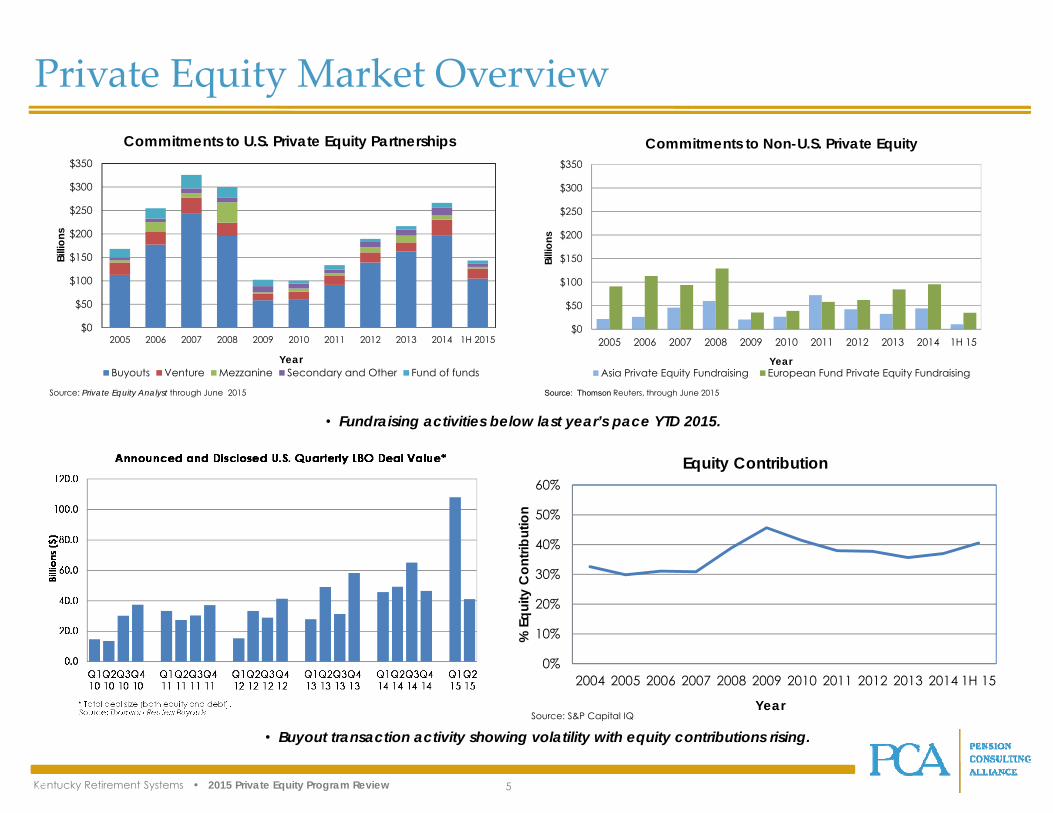
• Fundraising activity increased in the first half of 2015. After $266 billion of commitments were raised domestically in the 2014calendar year, $143.3 billion was raised in the first half of 2015 and is on pace to continue year-over-year increases since2010. It continues to be an environment of the “haves” and the “have nots” as the most sought after managers are quicklyachieving established hard caps. Buyouts continue to represent the largest proportion of commitments at approximately73%.
• Announced U.S. buyout deal volume in 1H 2015 exhibited volatility. Total announced U.S. buyout deal volume was $108.0billion in Q1 2015, up from $46.6 billion in the fourth quarter of 2014, but then declined to $14.1 billion in Q2 2015. At $207billion in 2014, activity last year was the highest annual level over the past seven years.
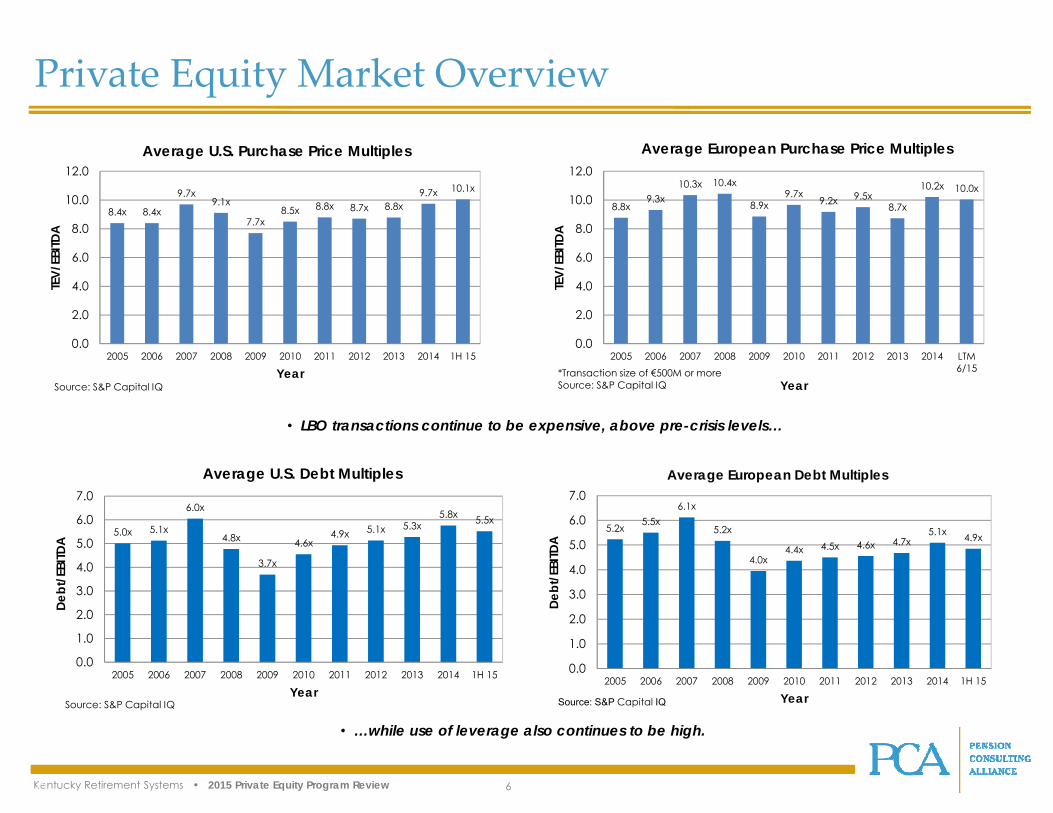
• Risk metrics in the leveraged buyout market remain high as both purchase price multiples and debt multiples are abovetheir ten-year averages. The average purchase price multiple in 1H 2015, at 10.1x, increased from 9.7x in 2014 and was wellabove the ten-year average of 8.8x. Debt multiples in 1H 2015 were at 5.5x, below the 5.8x level for the 2014 calendar yearbut still above the ten-year average of 5.0x.
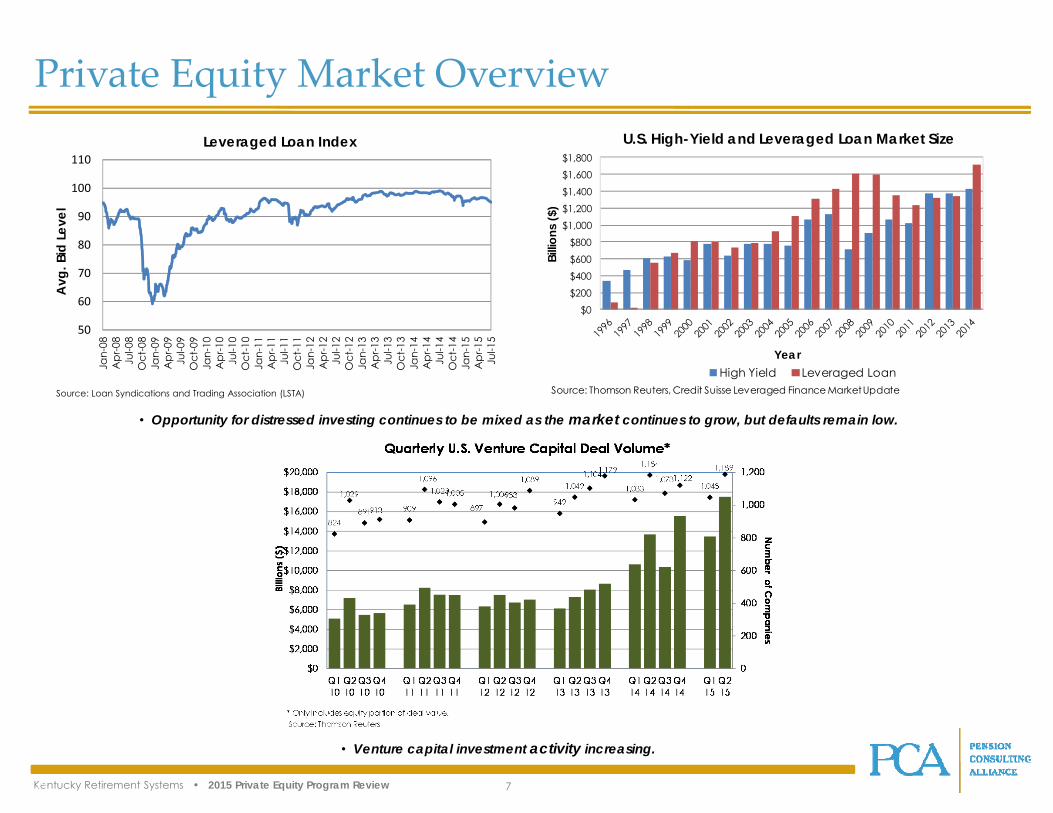
• Venture capital investment activity remains strong and increasing. Approximately $31.0 billion was invested across 2,237companies in 1H 2015, on pace to exceed the $49.7 billion invested across 4,399 companies in 2014 calendar year.
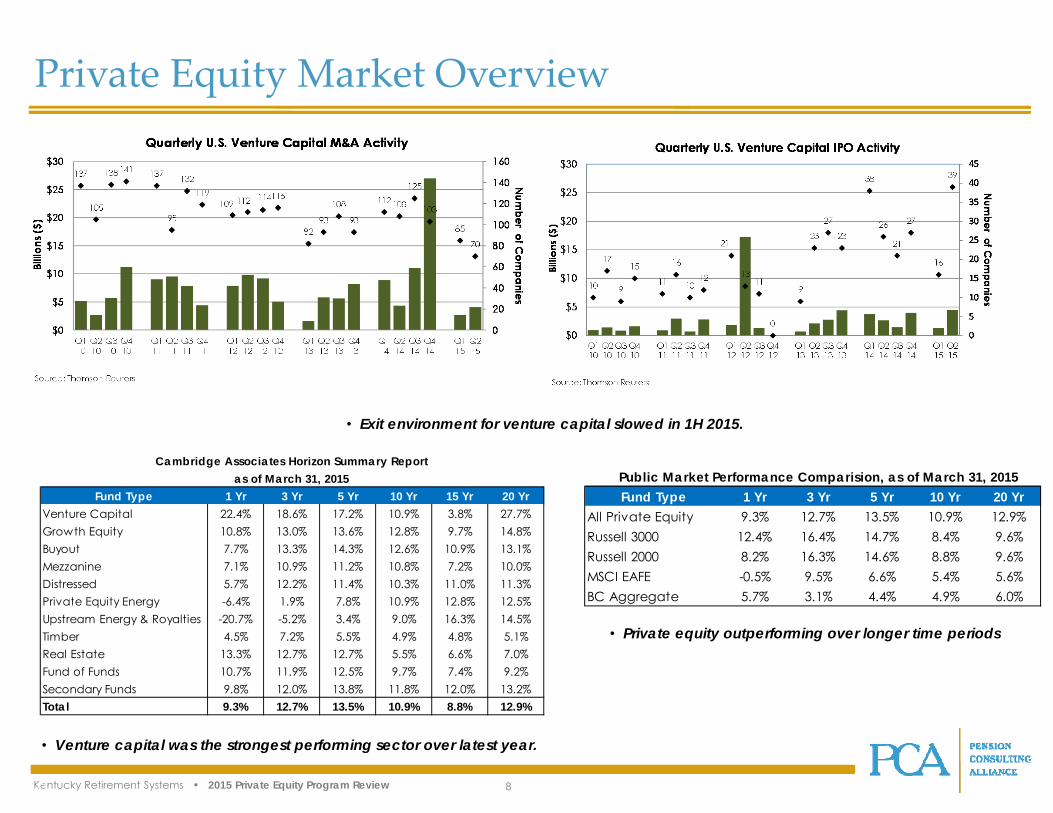
• Exit activity for venture capital investments slowed in the first half of 2015. The value of merger and acquisition (M&A)transactions decreased in the first half of 2015 after the 2014 calendar year activity more than doubled 2013 levels. Theinitial public offering (IPO) market also exhibited a slight decrease in the first half of 2015 and is on pace to slightly lag 2014levels.
• The outlook for distressed debt investment strategies continues to be mixed. Debt pricing has dipped slightly but remainsnear par (according to the Leveraged Loan Index produced by the Loan Syndications and Trading Association), minimizingthe near-term opportunity set for trading strategies. However, volatility has increased over recent periods. The high yieldand leveraged loan markets are large, but default rates have remained low dampening the opportunity set for distressed-for-control opportunities.
Kentucky Retirement Systems • 2015 Private Equity Program Review 5
Private Equity Market Overview
• Buyout transaction activity showing volatility with equity contributions rising.
• Fundraising activities below last year’s pace YTD 2015.
$0
$50
$100
$150
$200
$250
$300
$350
2005 2006 2007 2008 2009 2010 2011 2012 2013 2014 1H 15
Billi
ons
Year
Commitments to Non-U.S. Private Equity
Asia Private Equity Fundraising European Fund Private Equity Fundraising
Source: Thomson Reuters, through June 2015
$0
$50
$100
$150
$200
$250
$300
$350
2005 2006 2007 2008 2009 2010 2011 2012 2013 2014 1H 2015
Billi
ons
Year
Commitments to U.S. Private Equity Partnerships
Buyouts Venture Mezzanine Secondary and Other Fund of funds
Source: Private Equity Analyst through June 2015
0%
10%
20%
30%
40%
50%
60%
2004 2005 2006 2007 2008 2009 2010 2011 2012 2013 2014 1H 15
% E
quity
Con
tribu
tion
Year
Equity Contribution
Source: S&P Capital IQ
Kentucky Retirement Systems • 2015 Private Equity Program Review 6
Private Equity Market Overview
• LBO transactions continue to be expensive, above pre-crisis levels…
• …while use of leverage also continues to be high.
8.4x 8.4x
9.7x9.1x
7.7x8.5x 8.8x 8.7x 8.8x
9.7x 10.1x
0.0
2.0
4.0
6.0
8.0
10.0
12.0
2005 2006 2007 2008 2009 2010 2011 2012 2013 2014 1H 15
TEV/
EBITD
A
Year
Average U.S. Purchase Price Multiples
Source: S&P Capital IQ
8.8x9.3x
10.3x 10.4x
8.9x9.7x
9.2x 9.5x8.7x
10.2x 10.0x
0.0
2.0
4.0
6.0
8.0
10.0
12.0
2005 2006 2007 2008 2009 2010 2011 2012 2013 2014 LTM6/15
TEV/
EBITD
A
Year
Average European Purchase Price Multiples
*Transaction size of €500M or moreSource: S&P Capital IQ
5.0x 5.1x
6.0x
4.8x
3.7x
4.6x4.9x 5.1x 5.3x
5.8x 5.5x
0.0
1.0
2.0
3.0
4.0
5.0
6.0
7.0
2005 2006 2007 2008 2009 2010 2011 2012 2013 2014 1H 15
Debt
/EBI
TDA
Year
Average U.S. Debt Multiples
Source: S&P Capital IQ
5.2x 5.5x6.1x
5.2x
4.0x4.4x 4.5x 4.6x 4.7x
5.1x 4.9x
0.0
1.0
2.0
3.0
4.0
5.0
6.0
7.0
2005 2006 2007 2008 2009 2010 2011 2012 2013 2014 1H 15
Debt
/EBI
TDA
Year
Average European Debt Multiples
Source: S&P Capital IQ
Kentucky Retirement Systems • 2015 Private Equity Program Review 7
Private Equity Market Overview
• Opportunity for distressed investing continues to be mixed as the market continues to grow, but defaults remain low.
• Venture capital investment activity increasing.
$0$200$400$600$800
$1,000$1,200$1,400$1,600$1,800
Billio
ns ($
)
Year
U.S. High-Yield and Leveraged Loan Market Size
High Yield Leveraged LoanSource: Thomson Reuters, Credit Suisse Leveraged Finance Market Update
50
60
70
80
90
100
110
Jan-
08A
pr-0
8Ju
l-08
Oct
-08
Jan-
09A
pr-0
9Ju
l-09
Oct
-09
Jan-
10A
pr-1
0Ju
l-10
Oct
-10
Jan-
11A
pr-1
1Ju
l-11
Oct
-11
Jan-
12A
pr-1
2Ju
l-12
Oct
-12
Jan-
13A
pr-1
3Ju
l-13
Oct
-13
Jan-
14A
pr-1
4Ju
l-14
Oct
-14
Jan-
15A
pr-1
5Ju
l-15
Avg
. Bid
Lev
el
Leveraged Loan Index
Source: Loan Syndications and Trading Association (LSTA)
Kentucky Retirement Systems • 2015 Private Equity Program Review 8
Private Equity Market Overview
• Exit environment for venture capital slowed in 1H 2015.
• Venture capital was the strongest performing sector over latest year.
• Private equity outperforming over longer time periods
Cambridge Associates Horizon Summary Reportas of March 31, 2015
Fund Type 1 Yr 3 Yr 5 Yr 10 Yr 15 Yr 20 YrVenture Capital 22.4% 18.6% 17.2% 10.9% 3.8% 27.7%Growth Equity 10.8% 13.0% 13.6% 12.8% 9.7% 14.8%Buyout 7.7% 13.3% 14.3% 12.6% 10.9% 13.1%Mezzanine 7.1% 10.9% 11.2% 10.8% 7.2% 10.0%Distressed 5.7% 12.2% 11.4% 10.3% 11.0% 11.3%Private Equity Energy -6.4% 1.9% 7.8% 10.9% 12.8% 12.5%Upstream Energy & Royalties -20.7% -5.2% 3.4% 9.0% 16.3% 14.5%Timber 4.5% 7.2% 5.5% 4.9% 4.8% 5.1%Real Estate 13.3% 12.7% 12.7% 5.5% 6.6% 7.0%Fund of Funds 10.7% 11.9% 12.5% 9.7% 7.4% 9.2%Secondary Funds 9.8% 12.0% 13.8% 11.8% 12.0% 13.2%Total 9.3% 12.7% 13.5% 10.9% 8.8% 12.9%
Public Market Performance Comparision, as of March 31, 2015Fund Type 1 Yr 3 Yr 5 Yr 10 Yr 20 Yr
All Private Equity 9.3% 12.7% 13.5% 10.9% 12.9%Russell 3000 12.4% 16.4% 14.7% 8.4% 9.6%Russell 2000 8.2% 16.3% 14.6% 8.8% 9.6%MSCI EAFE -0.5% 9.5% 6.6% 5.4% 5.6%BC Aggregate 5.7% 3.1% 4.4% 4.9% 6.0%
Kentucky Retirement Systems • 2015 Private Equity Program Review 9
Section 2: Pension Program Review
Kentucky Retirement Systems • 2015 Private Equity Program Review 10
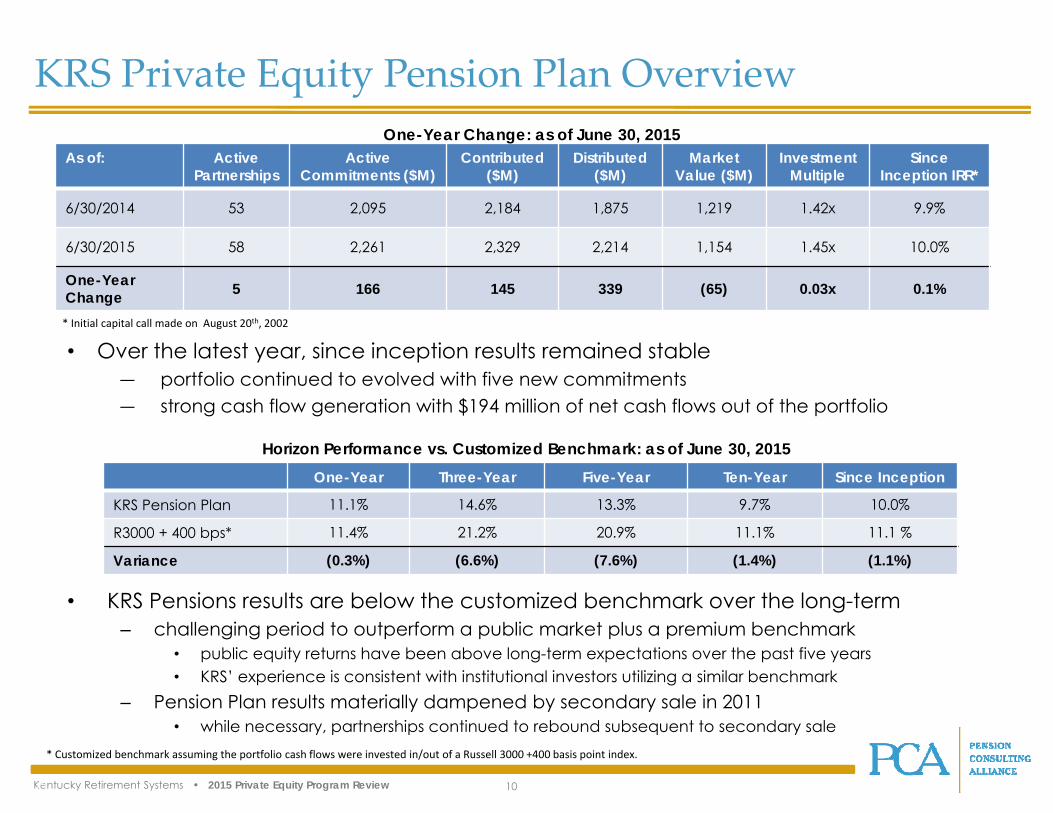
• KRS Pensions results are below the customized benchmark over the long-term– challenging period to outperform a public market plus a premium benchmark
• public equity returns have been above long-term expectations over the past five years• KRS’ experience is consistent with institutional investors utilizing a similar benchmark
– Pension Plan results materially dampened by secondary sale in 2011• while necessary, partnerships continued to rebound subsequent to secondary sale
KRS Private Equity Pension Plan Overview
As of: Active Partnerships
Active Commitments ($M)
Contributed ($M)
Distributed ($M)
Market Value ($M)
InvestmentMultiple
Since Inception IRR*
6/30/2014 53 2,095 2,184 1,875 1,219 1.42x 9.9%
6/30/2015 58 2,261 2,329 2,214 1,154 1.45x 10.0%
One-Year Change 5 166 145 339 (65) 0.03x 0.1%
One-Year Three-Year Five-Year Ten-Year Since Inception
KRS Pension Plan 11.1% 14.6% 13.3% 9.7% 10.0%
R3000 + 400 bps* 11.4% 21.2% 20.9% 11.1% 11.1 %
Variance (0.3%) (6.6%) (7.6%) (1.4%) (1.1%)
One-Year Change: as of June 30, 2015
Horizon Performance vs. Customized Benchmark: as of June 30, 2015
• Over the latest year, since inception results remained stable ― portfolio continued to evolved with five new commitments― strong cash flow generation with $194 million of net cash flows out of the portfolio
* Customized benchmark assuming the portfolio cash flows were invested in/out of a Russell 3000 +400 basis point index.
* Initial capital call made on August 20th, 2002
Kentucky Retirement Systems • 2015 Private Equity Program Review 11
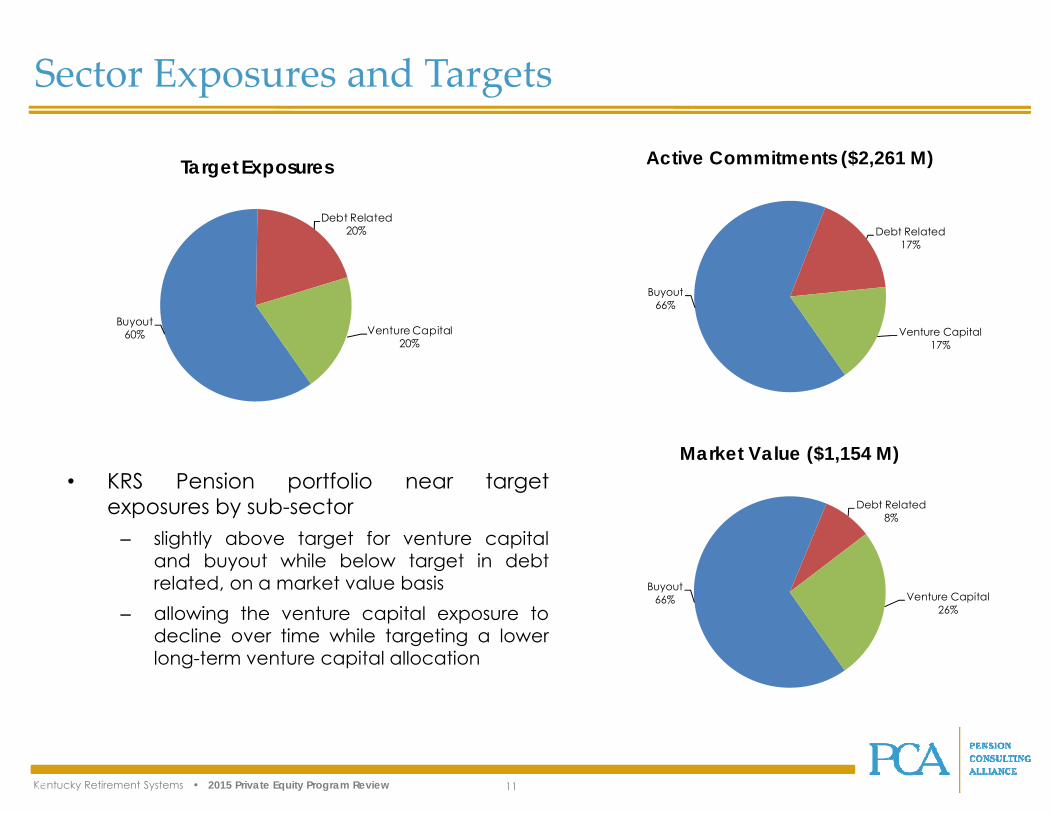
• KRS Pension portfolio near targetexposures by sub-sector
– slightly above target for venture capitaland buyout while below target in debtrelated, on a market value basis
– allowing the venture capital exposure todecline over time while targeting a lowerlong-term venture capital allocation
Sector Exposures and Targets
Buyout60%
Debt Related20%
Venture Capital20%
Target Exposures
Buyout66%
Debt Related17%
Venture Capital17%
Active Commitments ($2,261 M)
Buyout66%
Debt Related8%
Venture Capital26%
Market Value ($1,154 M)
Kentucky Retirement Systems • 2015 Private Equity Program Review 12
Geographic and Industry Exposure
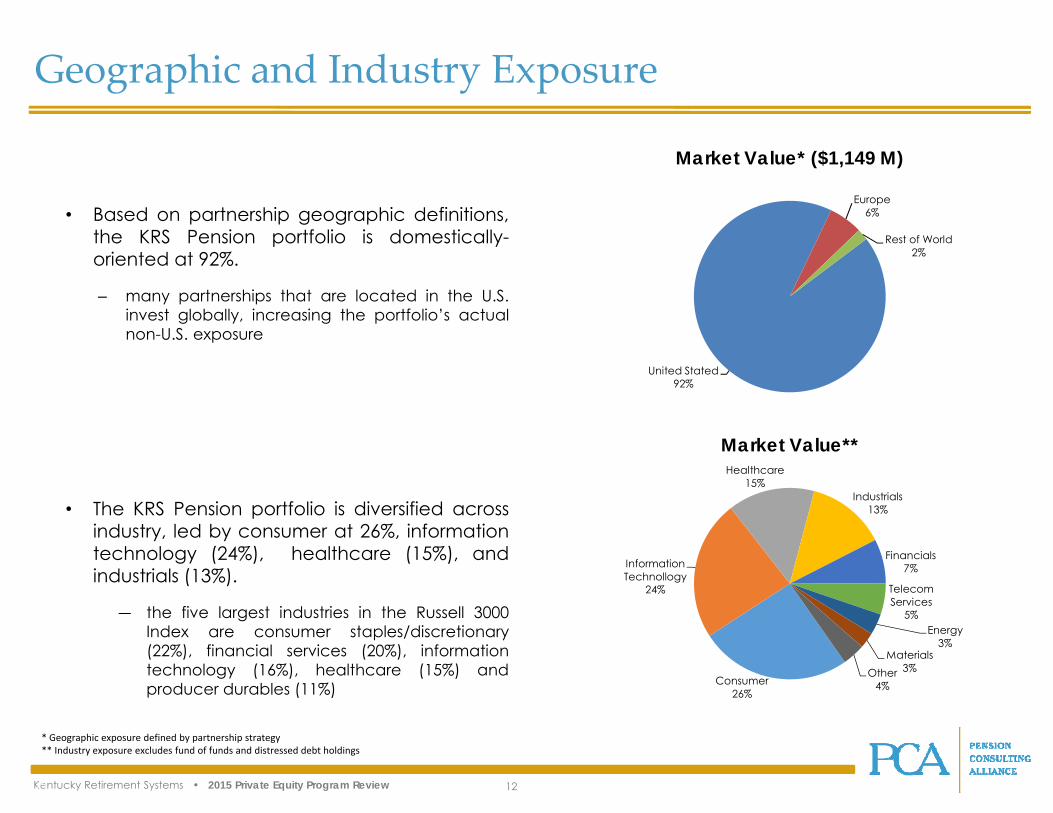
• Based on partnership geographic definitions,the KRS Pension portfolio is domestically-oriented at 92%.
– many partnerships that are located in the U.S.invest globally, increasing the portfolio’s actualnon-U.S. exposure
• The KRS Pension portfolio is diversified acrossindustry, led by consumer at 26%, informationtechnology (24%), healthcare (15%), andindustrials (13%).
― the five largest industries in the Russell 3000Index are consumer staples/discretionary(22%), financial services (20%), informationtechnology (16%), healthcare (15%) andproducer durables (11%)
* Geographic exposure defined by partnership strategy** Industry exposure excludes fund of funds and distressed debt holdings
United Stated92%
Europe6%
Rest of World2%
Market Value* ($1,149 M)
Consumer 26%
Information Technollogy
24%
Healthcare15%
Industrials13%
Financials7%
Telecom Services
5%Energy
3%Materials
3%Other 4%
Market Value**
Kentucky Retirement Systems • 2015 Private Equity Program Review 13
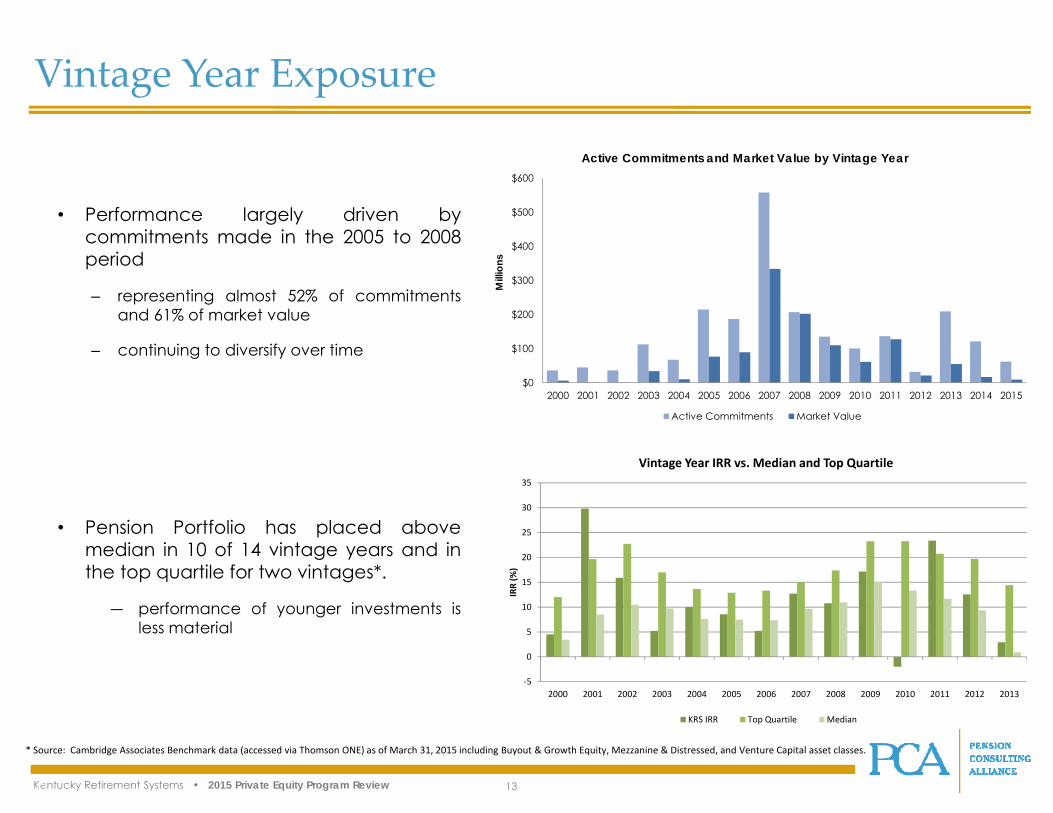
Vintage Year Exposure
• Performance largely driven bycommitments made in the 2005 to 2008period
– representing almost 52% of commitmentsand 61% of market value
– continuing to diversify over time
• Pension Portfolio has placed abovemedian in 10 of 14 vintage years and inthe top quartile for two vintages*.
― performance of younger investments isless material
* Source: Cambridge Associates Benchmark data (accessed via Thomson ONE) as of March 31, 2015 including Buyout & Growth Equity, Mezzanine & Distressed, and Venture Capital asset classes.
‐5
0
5
10
15
20
25
30
35
2000 2001 2002 2003 2004 2005 2006 2007 2008 2009 2010 2011 2012 2013
IRR (%
)
Vintage Year IRR vs. Median and Top Quartile
KRS IRR Top Quartile Median
$0
$100
$200
$300
$400
$500
$600
2000 2001 2002 2003 2004 2005 2006 2007 2008 2009 2010 2011 2012 2013 2014 2015
Mill
ions
Active Commitments and Market Value by Vintage Year
Active Commitments Market Value
Kentucky Retirement Systems • 2015 Private Equity Program Review 14
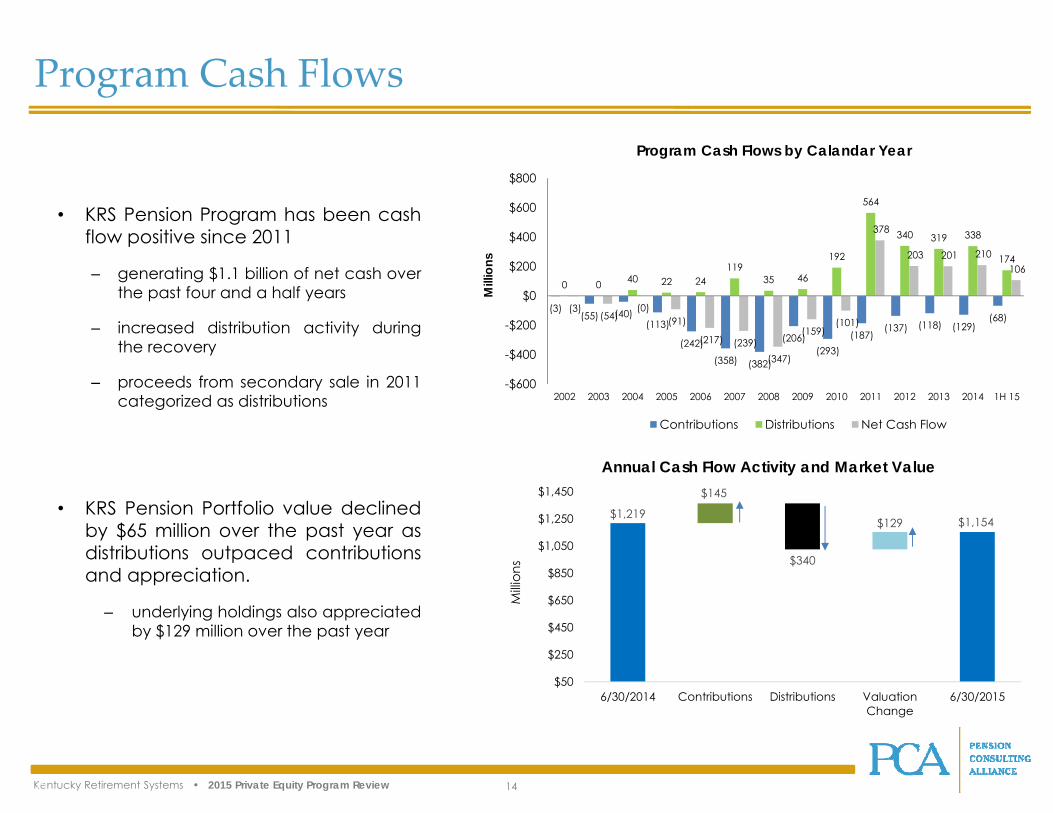
• KRS Pension Program has been cashflow positive since 2011
– generating $1.1 billion of net cash overthe past four and a half years
– increased distribution activity duringthe recovery
– proceeds from secondary sale in 2011categorized as distributions
• KRS Pension Portfolio value declinedby $65 million over the past year asdistributions outpaced contributionsand appreciation.
– underlying holdings also appreciatedby $129 million over the past year
Program Cash Flows
(3)(55) (40)
(113)
(242)
(358) (382)
(206)(293)
(187)(137) (118) (129)
(68)
0 0 40 22 24119
35 46
192
564
340 319 338
174
(3)(54)
(0)(91)
(217) (239)(347)
(159)(101)
378
203 201 210 106
-$600
-$400
-$200
$0
$200
$400
$600
$800
2002 2003 2004 2005 2006 2007 2008 2009 2010 2011 2012 2013 2014 1H 15
Mill
ions
Program Cash Flows by Calandar Year
Contributions Distributions Net Cash Flow
$1,219
$145
$129 $1,154
$340
$50
$250
$450
$650
$850
$1,050
$1,250
$1,450
6/30/2014 Contributions Distributions ValuationChange
6/30/2015
Milli
ons
Annual Cash Flow Activity and Market Value
Kentucky Retirement Systems • 2015 Private Equity Program Review 15
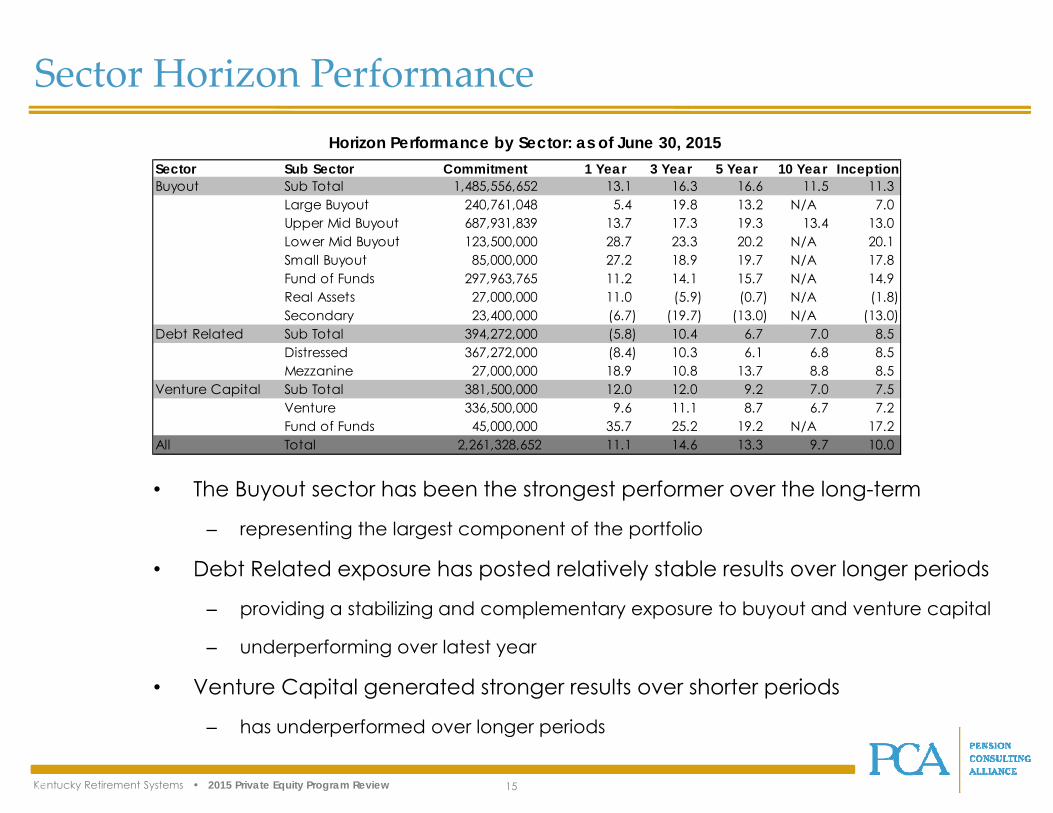
• The Buyout sector has been the strongest performer over the long-term
– representing the largest component of the portfolio
• Debt Related exposure has posted relatively stable results over longer periods
– providing a stabilizing and complementary exposure to buyout and venture capital
– underperforming over latest year
• Venture Capital generated stronger results over shorter periods
– has underperformed over longer periods
Sector Horizon PerformanceHorizon Performance by Sector: as of June 30, 2015
Sector Sub Sector Commitment 1 Year 3 Year 5 Year 10 Year InceptionBuyout Sub Total 1,485,556,652 13.1 16.3 16.6 11.5 11.3
Large Buyout 240,761,048 5.4 19.8 13.2 N/A 7.0 Upper Mid Buyout 687,931,839 13.7 17.3 19.3 13.4 13.0 Lower Mid Buyout 123,500,000 28.7 23.3 20.2 N/A 20.1 Small Buyout 85,000,000 27.2 18.9 19.7 N/A 17.8 Fund of Funds 297,963,765 11.2 14.1 15.7 N/A 14.9 Real Assets 27,000,000 11.0 (5.9) (0.7) N/A (1.8) Secondary 23,400,000 (6.7) (19.7) (13.0) N/A (13.0)
Debt Related Sub Total 394,272,000 (5.8) 10.4 6.7 7.0 8.5 Distressed 367,272,000 (8.4) 10.3 6.1 6.8 8.5 Mezzanine 27,000,000 18.9 10.8 13.7 8.8 8.5
Venture Capital Sub Total 381,500,000 12.0 12.0 9.2 7.0 7.5 Venture 336,500,000 9.6 11.1 8.7 6.7 7.2 Fund of Funds 45,000,000 35.7 25.2 19.2 N/A 17.2
All Total 2,261,328,652 11.1 14.6 13.3 9.7 10.0
Kentucky Retirement Systems • 2015 Private Equity Program Review 16
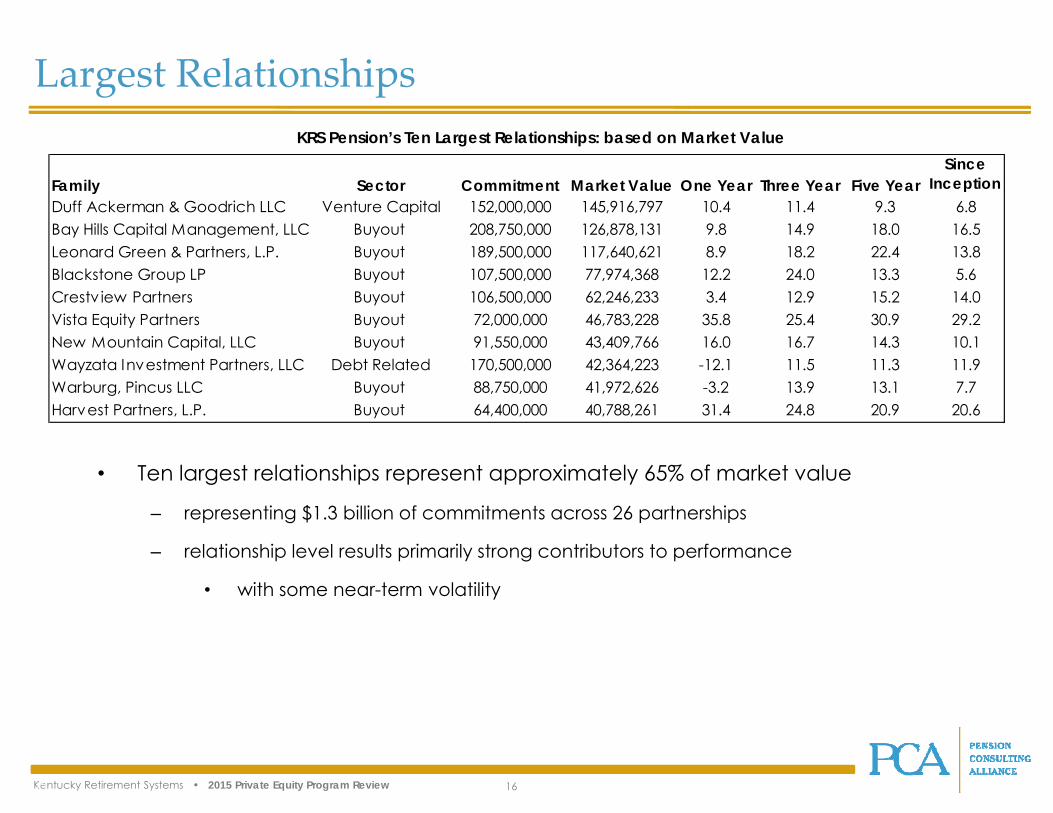
Largest RelationshipsKRS Pension’s Ten Largest Relationships: based on Market Value
• Ten largest relationships represent approximately 65% of market value
– representing $1.3 billion of commitments across 26 partnerships
– relationship level results primarily strong contributors to performance
• with some near-term volatility
Family Sector Commitment Market Value One Year Three Year Five YearSince
InceptionDuff Ackerman & Goodrich LLC Venture Capital 152,000,000 145,916,797 10.4 11.4 9.3 6.8Bay Hills Capital Management, LLC Buyout 208,750,000 126,878,131 9.8 14.9 18.0 16.5Leonard Green & Partners, L.P. Buyout 189,500,000 117,640,621 8.9 18.2 22.4 13.8Blackstone Group LP Buyout 107,500,000 77,974,368 12.2 24.0 13.3 5.6Crestv iew Partners Buyout 106,500,000 62,246,233 3.4 12.9 15.2 14.0Vista Equity Partners Buyout 72,000,000 46,783,228 35.8 25.4 30.9 29.2New Mountain Capital, LLC Buyout 91,550,000 43,409,766 16.0 16.7 14.3 10.1Wayzata Investment Partners, LLC Debt Related 170,500,000 42,364,223 -12.1 11.5 11.3 11.9Warburg, Pincus LLC Buyout 88,750,000 41,972,626 -3.2 13.9 13.1 7.7Harvest Partners, L.P. Buyout 64,400,000 40,788,261 31.4 24.8 20.9 20.6
Kentucky Retirement Systems • 2015 Private Equity Program Review 17
Commitment Pacing/Future Activities
• Target annual commitment pacing of approximately $220 million in 2016 and 2017
– ranging from $175 million to $265 million per year
• targeting four to five commitments annually
– allocations approximately 70% to the Pension Plan and 30% to the Insurance Plan
• Areas of further portfolio development should include:
– continue disciplined investment pacing and commitment sizing
– revisit KRS’ approach to venture capital exposure
• allow the venture capital exposure to decline over time
• consider utilization of fund of funds for ongoing strategic exposure to the segment
– Strive for higher returning strategies within the debt related segment
– explore cost-effective approaches to deploying capital, such as co-investing
– consider additional global exposure
• committing to direct partnerships where appropriate and fund of funds as warranted
Kentucky Retirement Systems • 2015 Private Equity Program Review 18
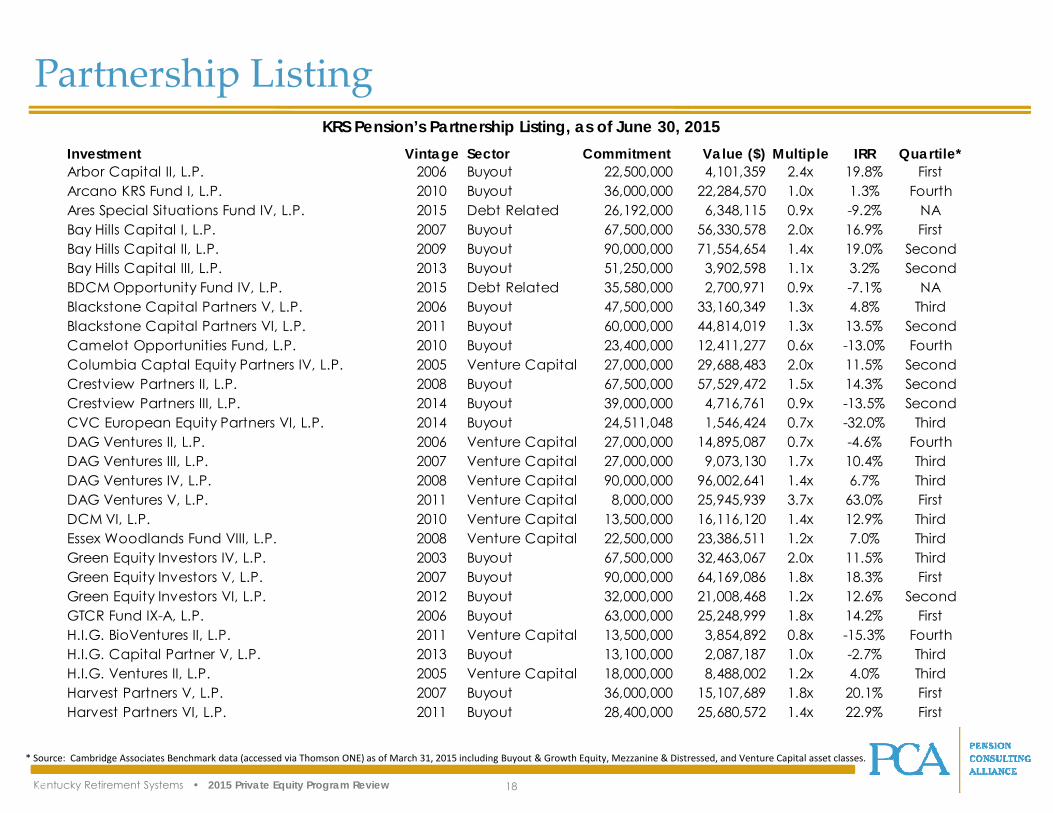
Partnership ListingKRS Pension’s Partnership Listing, as of June 30, 2015
* Source: Cambridge Associates Benchmark data (accessed via Thomson ONE) as of March 31, 2015 including Buyout & Growth Equity, Mezzanine & Distressed, and Venture Capital asset classes.
Investment Vintage Sector Commitment Value ($) Multiple IRR Quartile*Arbor Capital II, L.P. 2006 Buyout 22,500,000 4,101,359 2.4x 19.8% FirstArcano KRS Fund I, L.P. 2010 Buyout 36,000,000 22,284,570 1.0x 1.3% FourthAres Special Situations Fund IV, L.P. 2015 Debt Related 26,192,000 6,348,115 0.9x -9.2% NABay Hills Capital I, L.P. 2007 Buyout 67,500,000 56,330,578 2.0x 16.9% FirstBay Hills Capital II, L.P. 2009 Buyout 90,000,000 71,554,654 1.4x 19.0% SecondBay Hills Capital III, L.P. 2013 Buyout 51,250,000 3,902,598 1.1x 3.2% SecondBDCM Opportunity Fund IV, L.P. 2015 Debt Related 35,580,000 2,700,971 0.9x -7.1% NABlackstone Capital Partners V, L.P. 2006 Buyout 47,500,000 33,160,349 1.3x 4.8% ThirdBlackstone Capital Partners VI, L.P. 2011 Buyout 60,000,000 44,814,019 1.3x 13.5% SecondCamelot Opportunities Fund, L.P. 2010 Buyout 23,400,000 12,411,277 0.6x -13.0% FourthColumbia Captal Equity Partners IV, L.P. 2005 Venture Capital 27,000,000 29,688,483 2.0x 11.5% SecondCrestview Partners II, L.P. 2008 Buyout 67,500,000 57,529,472 1.5x 14.3% SecondCrestview Partners III, L.P. 2014 Buyout 39,000,000 4,716,761 0.9x -13.5% SecondCVC European Equity Partners VI, L.P. 2014 Buyout 24,511,048 1,546,424 0.7x -32.0% ThirdDAG Ventures II, L.P. 2006 Venture Capital 27,000,000 14,895,087 0.7x -4.6% FourthDAG Ventures III, L.P. 2007 Venture Capital 27,000,000 9,073,130 1.7x 10.4% ThirdDAG Ventures IV, L.P. 2008 Venture Capital 90,000,000 96,002,641 1.4x 6.7% ThirdDAG Ventures V, L.P. 2011 Venture Capital 8,000,000 25,945,939 3.7x 63.0% FirstDCM VI, L.P. 2010 Venture Capital 13,500,000 16,116,120 1.4x 12.9% ThirdEssex Woodlands Fund VIII, L.P. 2008 Venture Capital 22,500,000 23,386,511 1.2x 7.0% ThirdGreen Equity Investors IV, L.P. 2003 Buyout 67,500,000 32,463,067 2.0x 11.5% ThirdGreen Equity Investors V, L.P. 2007 Buyout 90,000,000 64,169,086 1.8x 18.3% FirstGreen Equity Investors VI, L.P. 2012 Buyout 32,000,000 21,008,468 1.2x 12.6% SecondGTCR Fund IX-A, L.P. 2006 Buyout 63,000,000 25,248,999 1.8x 14.2% FirstH.I.G. BioVentures II, L.P. 2011 Venture Capital 13,500,000 3,854,892 0.8x -15.3% FourthH.I.G. Capital Partner V, L.P. 2013 Buyout 13,100,000 2,087,187 1.0x -2.7% ThirdH.I.G. Ventures II, L.P. 2005 Venture Capital 18,000,000 8,488,002 1.2x 4.0% ThirdHarvest Partners V, L.P. 2007 Buyout 36,000,000 15,107,689 1.8x 20.1% FirstHarvest Partners VI, L.P. 2011 Buyout 28,400,000 25,680,572 1.4x 22.9% First
Kentucky Retirement Systems • 2015 Private Equity Program Review 19
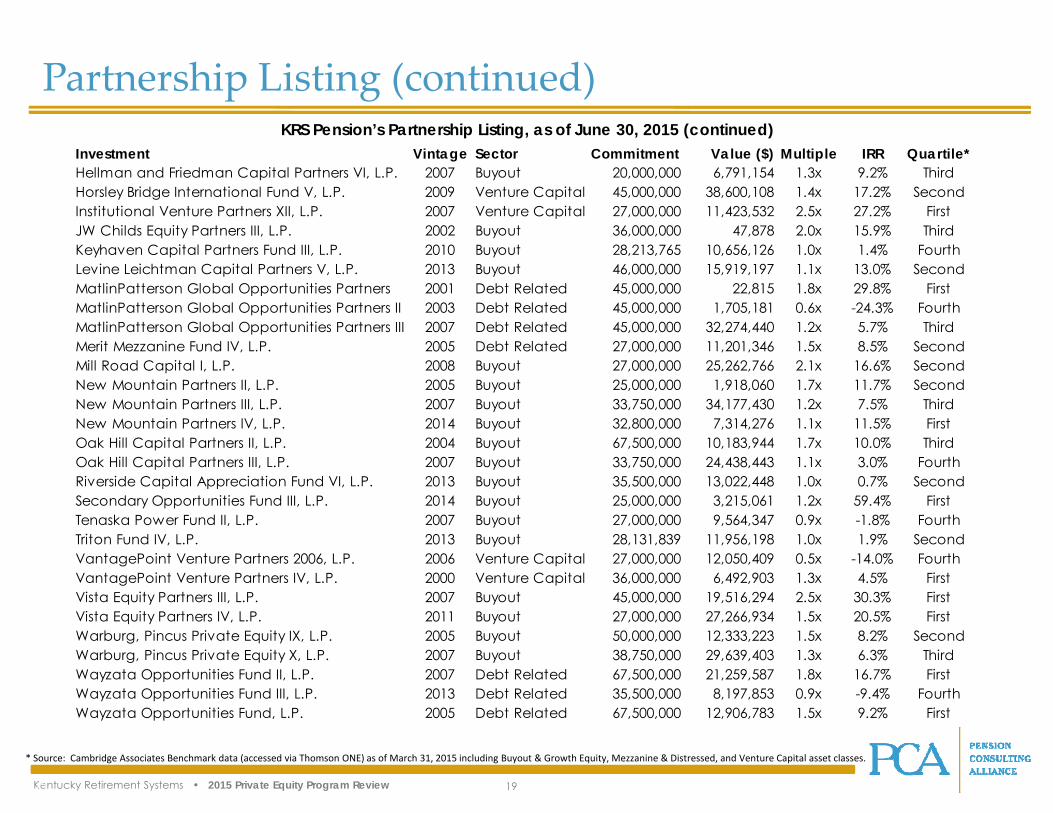
Partnership Listing (continued)KRS Pension’s Partnership Listing, as of June 30, 2015 (continued)
* Source: Cambridge Associates Benchmark data (accessed via Thomson ONE) as of March 31, 2015 including Buyout & Growth Equity, Mezzanine & Distressed, and Venture Capital asset classes.
Investment Vintage Sector Commitment Value ($) Multiple IRR Quartile*Hellman and Friedman Capital Partners VI, L.P. 2007 Buyout 20,000,000 6,791,154 1.3x 9.2% ThirdHorsley Bridge International Fund V, L.P. 2009 Venture Capital 45,000,000 38,600,108 1.4x 17.2% SecondInstitutional Venture Partners XII, L.P. 2007 Venture Capital 27,000,000 11,423,532 2.5x 27.2% FirstJW Childs Equity Partners III, L.P. 2002 Buyout 36,000,000 47,878 2.0x 15.9% ThirdKeyhaven Capital Partners Fund III, L.P. 2010 Buyout 28,213,765 10,656,126 1.0x 1.4% FourthLevine Leichtman Capital Partners V, L.P. 2013 Buyout 46,000,000 15,919,197 1.1x 13.0% SecondMatlinPatterson Global Opportunities Partners 2001 Debt Related 45,000,000 22,815 1.8x 29.8% FirstMatlinPatterson Global Opportunities Partners II 2003 Debt Related 45,000,000 1,705,181 0.6x -24.3% FourthMatlinPatterson Global Opportunities Partners III 2007 Debt Related 45,000,000 32,274,440 1.2x 5.7% ThirdMerit Mezzanine Fund IV, L.P. 2005 Debt Related 27,000,000 11,201,346 1.5x 8.5% SecondMill Road Capital I, L.P. 2008 Buyout 27,000,000 25,262,766 2.1x 16.6% SecondNew Mountain Partners II, L.P. 2005 Buyout 25,000,000 1,918,060 1.7x 11.7% SecondNew Mountain Partners III, L.P. 2007 Buyout 33,750,000 34,177,430 1.2x 7.5% ThirdNew Mountain Partners IV, L.P. 2014 Buyout 32,800,000 7,314,276 1.1x 11.5% FirstOak Hill Capital Partners II, L.P. 2004 Buyout 67,500,000 10,183,944 1.7x 10.0% ThirdOak Hill Capital Partners III, L.P. 2007 Buyout 33,750,000 24,438,443 1.1x 3.0% FourthRiverside Capital Appreciation Fund VI, L.P. 2013 Buyout 35,500,000 13,022,448 1.0x 0.7% SecondSecondary Opportunities Fund III, L.P. 2014 Buyout 25,000,000 3,215,061 1.2x 59.4% FirstTenaska Power Fund II, L.P. 2007 Buyout 27,000,000 9,564,347 0.9x -1.8% FourthTriton Fund IV, L.P. 2013 Buyout 28,131,839 11,956,198 1.0x 1.9% SecondVantagePoint Venture Partners 2006, L.P. 2006 Venture Capital 27,000,000 12,050,409 0.5x -14.0% FourthVantagePoint Venture Partners IV, L.P. 2000 Venture Capital 36,000,000 6,492,903 1.3x 4.5% FirstVista Equity Partners III, L.P. 2007 Buyout 45,000,000 19,516,294 2.5x 30.3% FirstVista Equity Partners IV, L.P. 2011 Buyout 27,000,000 27,266,934 1.5x 20.5% FirstWarburg, Pincus Private Equity IX, L.P. 2005 Buyout 50,000,000 12,333,223 1.5x 8.2% SecondWarburg, Pincus Private Equity X, L.P. 2007 Buyout 38,750,000 29,639,403 1.3x 6.3% ThirdWayzata Opportunities Fund II, L.P. 2007 Debt Related 67,500,000 21,259,587 1.8x 16.7% FirstWayzata Opportunities Fund III, L.P. 2013 Debt Related 35,500,000 8,197,853 0.9x -9.4% FourthWayzata Opportunities Fund, L.P. 2005 Debt Related 67,500,000 12,906,783 1.5x 9.2% First
Kentucky Retirement Systems • 2015 Private Equity Program Review 20
Section 3: Insurance Program Review
Kentucky Retirement Systems • 2015 Private Equity Program Review 21
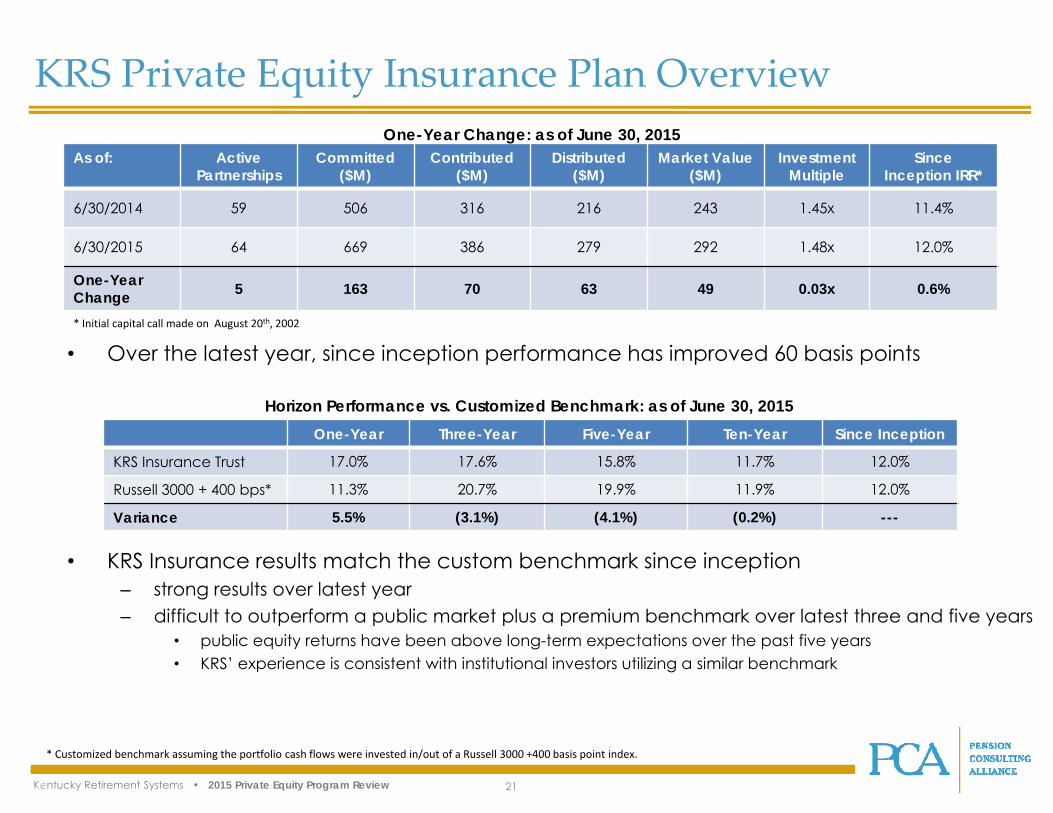
• KRS Insurance results match the custom benchmark since inception– strong results over latest year– difficult to outperform a public market plus a premium benchmark over latest three and five years
• public equity returns have been above long-term expectations over the past five years• KRS’ experience is consistent with institutional investors utilizing a similar benchmark
KRS Private Equity Insurance Plan Overview
As of: Active Partnerships
Committed ($M)
Contributed ($M)
Distributed ($M)
Market Value ($M)
InvestmentMultiple
Since Inception IRR*
6/30/2014 59 506 316 216 243 1.45x 11.4%
6/30/2015 64 669 386 279 292 1.48x 12.0%
One-Year Change 5 163 70 63 49 0.03x 0.6%
One-Year Three-Year Five-Year Ten-Year Since Inception
KRS Insurance Trust 17.0% 17.6% 15.8% 11.7% 12.0%
Russell 3000 + 400 bps* 11.3% 20.7% 19.9% 11.9% 12.0%
Variance 5.5% (3.1%) (4.1%) (0.2%) ---
One-Year Change: as of June 30, 2015
Horizon Performance vs. Customized Benchmark: as of June 30, 2015
• Over the latest year, since inception performance has improved 60 basis points* Initial capital call made on August 20th, 2002
* Customized benchmark assuming the portfolio cash flows were invested in/out of a Russell 3000 +400 basis point index.
Kentucky Retirement Systems • 2015 Private Equity Program Review 22
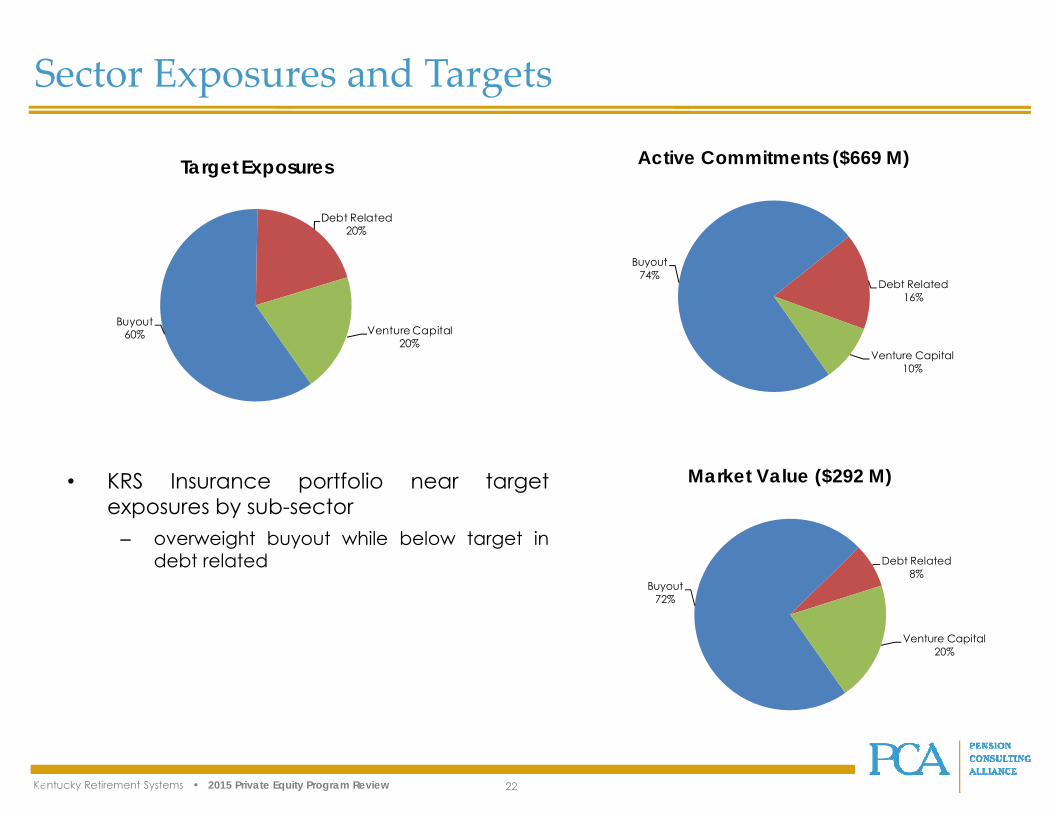
• KRS Insurance portfolio near targetexposures by sub-sector
– overweight buyout while below target indebt related
Sector Exposures and Targets
Buyout60%
Debt Related20%
Venture Capital20%
Target Exposures
Buyout74%
Debt Related16%
Venture Capital10%
Active Commitments ($669 M)
Buyout72%
Debt Related8%
Venture Capital20%
Market Value ($292 M)
Kentucky Retirement Systems • 2015 Private Equity Program Review 23
Information Technollogy
27%
Consumer 21%
Industrials14% Healthcare
13%
Financials8%
Energy5%
Materials4%
Telecom Services
3%Other
2%
Business Services2%Utilities
1%
Market Value**
Geographic and Industry Exposure
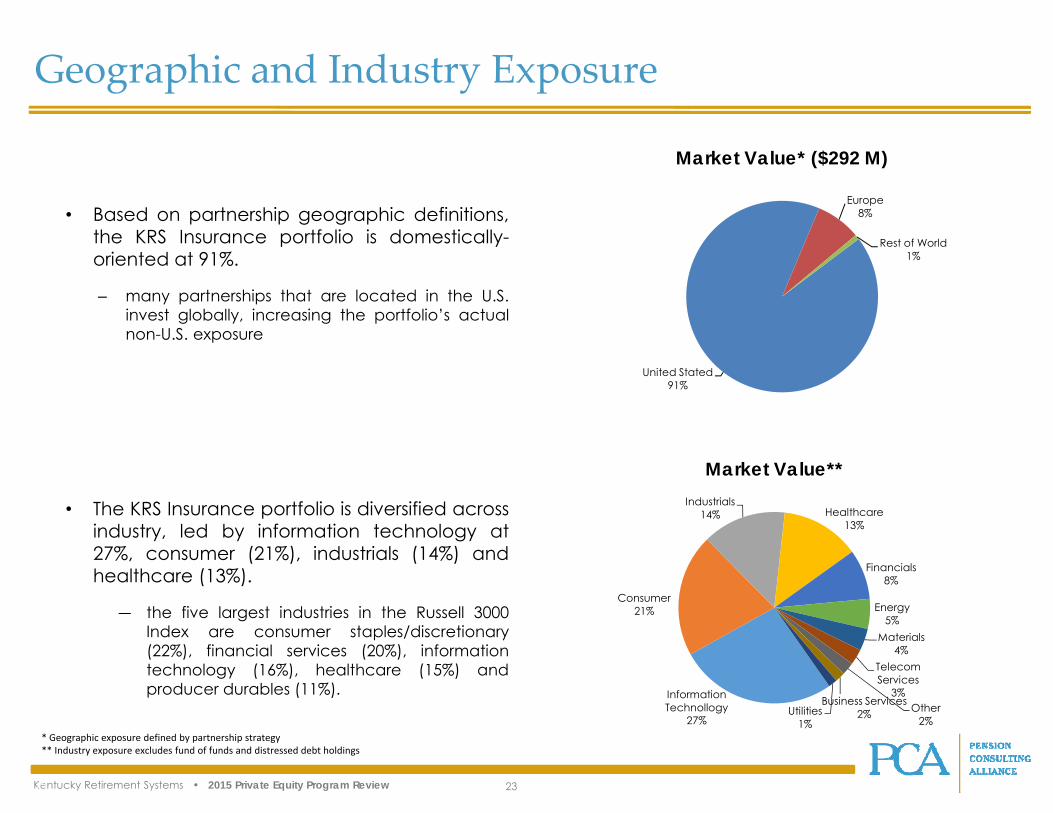
• Based on partnership geographic definitions,the KRS Insurance portfolio is domestically-oriented at 91%.
– many partnerships that are located in the U.S.invest globally, increasing the portfolio’s actualnon-U.S. exposure
• The KRS Insurance portfolio is diversified acrossindustry, led by information technology at27%, consumer (21%), industrials (14%) andhealthcare (13%).
― the five largest industries in the Russell 3000Index are consumer staples/discretionary(22%), financial services (20%), informationtechnology (16%), healthcare (15%) andproducer durables (11%).
* Geographic exposure defined by partnership strategy** Industry exposure excludes fund of funds and distressed debt holdings
United Stated91%
Europe8%
Rest of World1%
Market Value* ($292 M)
Kentucky Retirement Systems • 2015 Private Equity Program Review 24
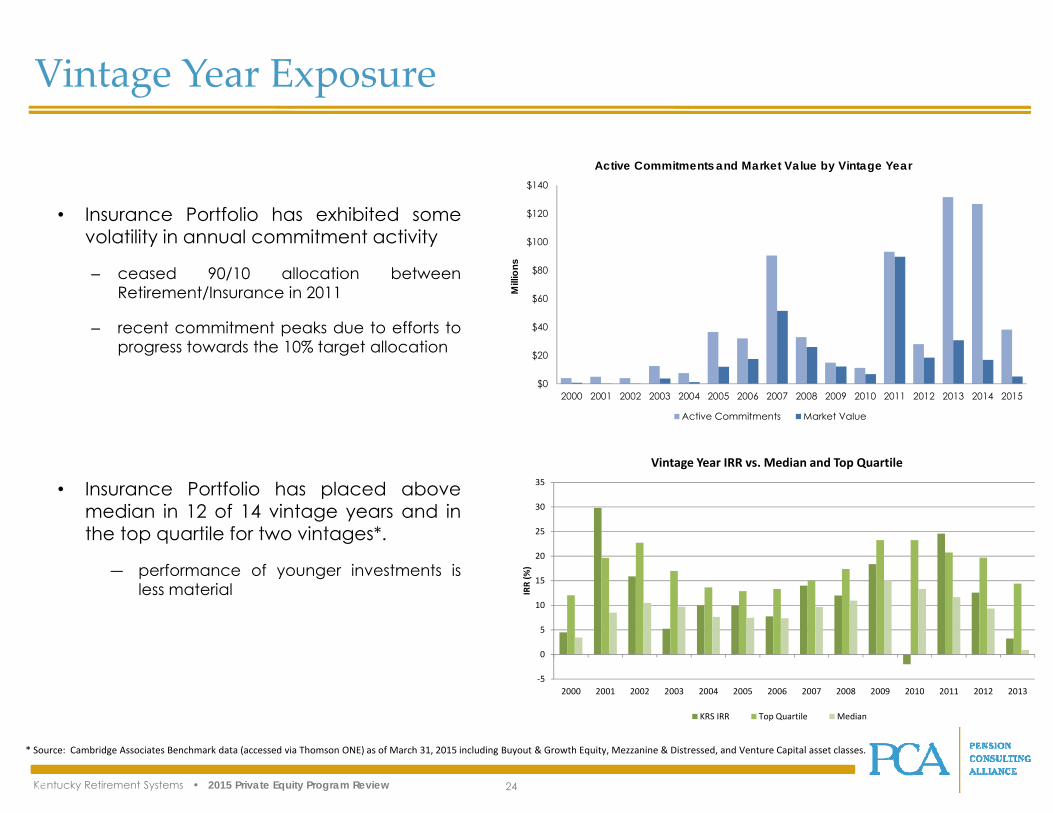
Vintage Year Exposure
• Insurance Portfolio has exhibited somevolatility in annual commitment activity
– ceased 90/10 allocation betweenRetirement/Insurance in 2011
– recent commitment peaks due to efforts toprogress towards the 10% target allocation
• Insurance Portfolio has placed abovemedian in 12 of 14 vintage years and inthe top quartile for two vintages*.
― performance of younger investments isless material
* Source: Cambridge Associates Benchmark data (accessed via Thomson ONE) as of March 31, 2015 including Buyout & Growth Equity, Mezzanine & Distressed, and Venture Capital asset classes.
$0
$20
$40
$60
$80
$100
$120
$140
2000 2001 2002 2003 2004 2005 2006 2007 2008 2009 2010 2011 2012 2013 2014 2015
Mill
ions
Active Commitments and Market Value by Vintage Year
Active Commitments Market Value
‐5
0
5
10
15
20
25
30
35
2000 2001 2002 2003 2004 2005 2006 2007 2008 2009 2010 2011 2012 2013
IRR (%
)
Vintage Year IRR vs. Median and Top Quartile
KRS IRR Top Quartile Median
Kentucky Retirement Systems • 2015 Private Equity Program Review 25
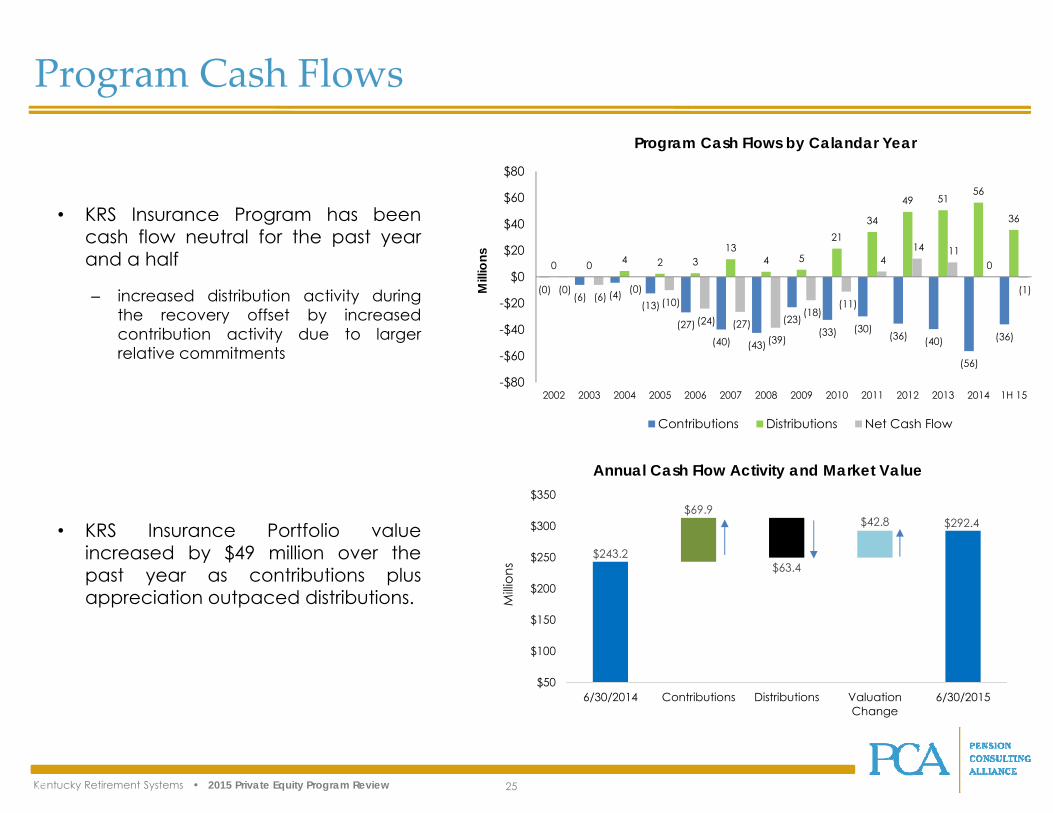
• KRS Insurance Program has beencash flow neutral for the past yearand a half
– increased distribution activity duringthe recovery offset by increasedcontribution activity due to largerrelative commitments
• KRS Insurance Portfolio valueincreased by $49 million over thepast year as contributions plusappreciation outpaced distributions.
Program Cash Flows
(0)(6) (4)
(13)
(27)(40) (43)
(23)(33) (30)
(36) (40)
(56)
(36)
0 0 4 2 313
4 5
2134
49 5156
36
(0)(6)
(0)(10)
(24) (27)(39)
(18)(11)
4 14 11
0
(1)
-$80
-$60
-$40
-$20
$0
$20
$40
$60
$80
2002 2003 2004 2005 2006 2007 2008 2009 2010 2011 2012 2013 2014 1H 15
Mill
ions
Program Cash Flows by Calandar Year
Contributions Distributions Net Cash Flow
$243.2
$69.9$42.8 $292.4
$63.4
$50
$100
$150
$200
$250
$300
$350
6/30/2014 Contributions Distributions ValuationChange
6/30/2015
Milli
ons
Annual Cash Flow Activity and Market Value
Kentucky Retirement Systems • 2015 Private Equity Program Review 26
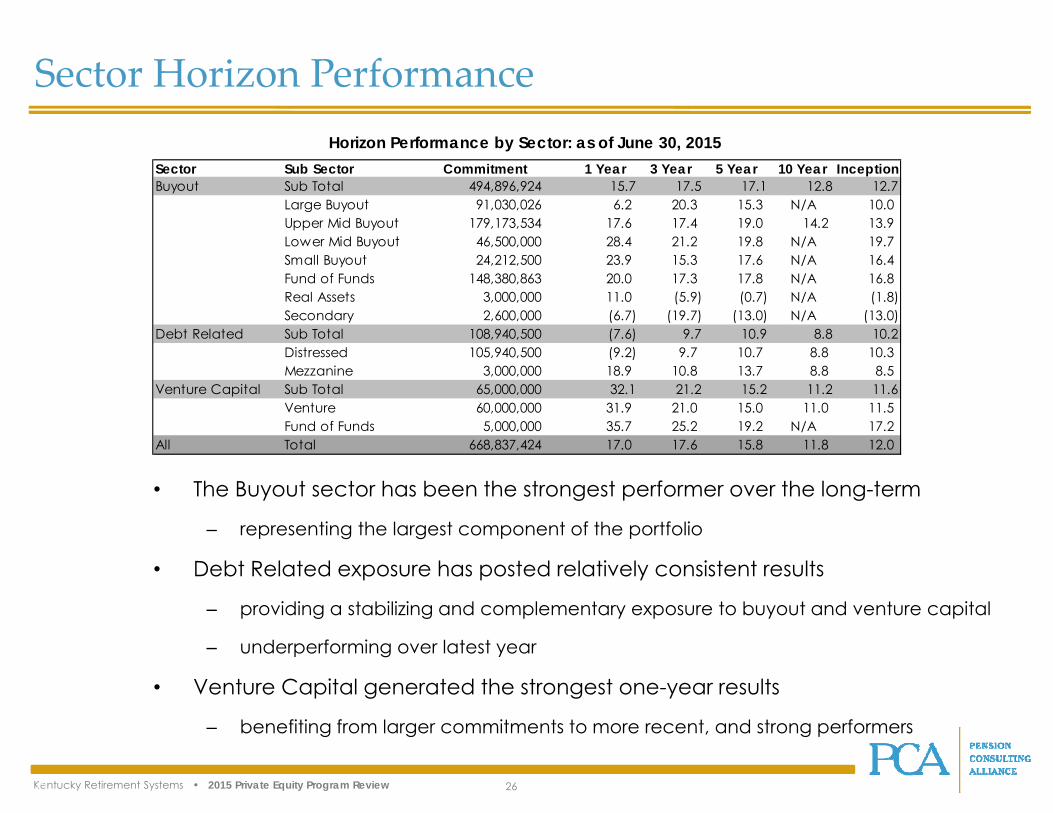
• The Buyout sector has been the strongest performer over the long-term
– representing the largest component of the portfolio
• Debt Related exposure has posted relatively consistent results
– providing a stabilizing and complementary exposure to buyout and venture capital
– underperforming over latest year
• Venture Capital generated the strongest one-year results
– benefiting from larger commitments to more recent, and strong performers
Sector Horizon PerformanceHorizon Performance by Sector: as of June 30, 2015
Sector Sub Sector Commitment 1 Year 3 Year 5 Year 10 Year InceptionBuyout Sub Total 494,896,924 15.7 17.5 17.1 12.8 12.7
Large Buyout 91,030,026 6.2 20.3 15.3 N/A 10.0 Upper Mid Buyout 179,173,534 17.6 17.4 19.0 14.2 13.9 Lower Mid Buyout 46,500,000 28.4 21.2 19.8 N/A 19.7 Small Buyout 24,212,500 23.9 15.3 17.6 N/A 16.4 Fund of Funds 148,380,863 20.0 17.3 17.8 N/A 16.8 Real Assets 3,000,000 11.0 (5.9) (0.7) N/A (1.8) Secondary 2,600,000 (6.7) (19.7) (13.0) N/A (13.0)
Debt Related Sub Total 108,940,500 (7.6) 9.7 10.9 8.8 10.2Distressed 105,940,500 (9.2) 9.7 10.7 8.8 10.3 Mezzanine 3,000,000 18.9 10.8 13.7 8.8 8.5
Venture Capital Sub Total 65,000,000 32.1 21.2 15.2 11.2 11.6Venture 60,000,000 31.9 21.0 15.0 11.0 11.5 Fund of Funds 5,000,000 35.7 25.2 19.2 N/A 17.2
All Total 668,837,424 17.0 17.6 15.8 11.8 12.0
Kentucky Retirement Systems • 2015 Private Equity Program Review 27
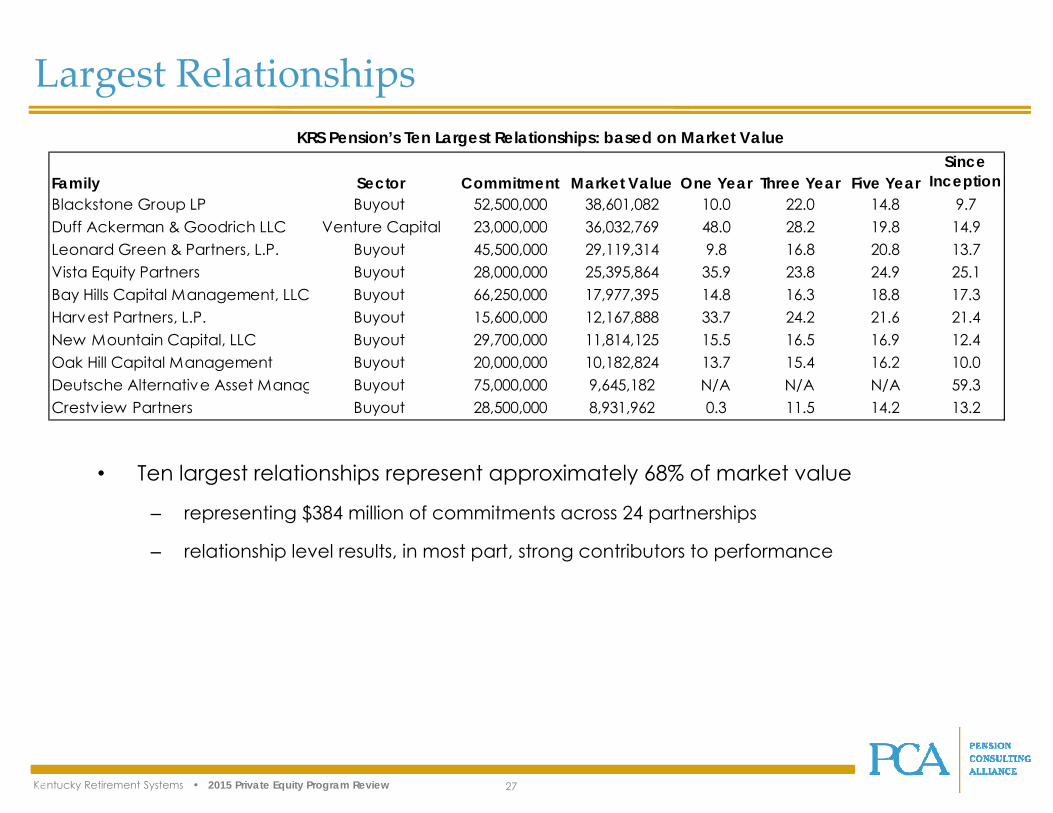
Largest RelationshipsKRS Pension’s Ten Largest Relationships: based on Market Value
• Ten largest relationships represent approximately 68% of market value
– representing $384 million of commitments across 24 partnerships
– relationship level results, in most part, strong contributors to performance
Family Sector Commitment Market Value One Year Three Year Five YearSince
InceptionBlackstone Group LP Buyout 52,500,000 38,601,082 10.0 22.0 14.8 9.7Duff Ackerman & Goodrich LLC Venture Capital 23,000,000 36,032,769 48.0 28.2 19.8 14.9Leonard Green & Partners, L.P. Buyout 45,500,000 29,119,314 9.8 16.8 20.8 13.7Vista Equity Partners Buyout 28,000,000 25,395,864 35.9 23.8 24.9 25.1Bay Hills Capital Management, LLC Buyout 66,250,000 17,977,395 14.8 16.3 18.8 17.3Harvest Partners, L.P. Buyout 15,600,000 12,167,888 33.7 24.2 21.6 21.4New Mountain Capital, LLC Buyout 29,700,000 11,814,125 15.5 16.5 16.9 12.4Oak Hill Capital Management Buyout 20,000,000 10,182,824 13.7 15.4 16.2 10.0Deutsche Alternative Asset Manag Buyout 75,000,000 9,645,182 N/A N/A N/A 59.3Crestv iew Partners Buyout 28,500,000 8,931,962 0.3 11.5 14.2 13.2
Kentucky Retirement Systems • 2015 Private Equity Program Review 28
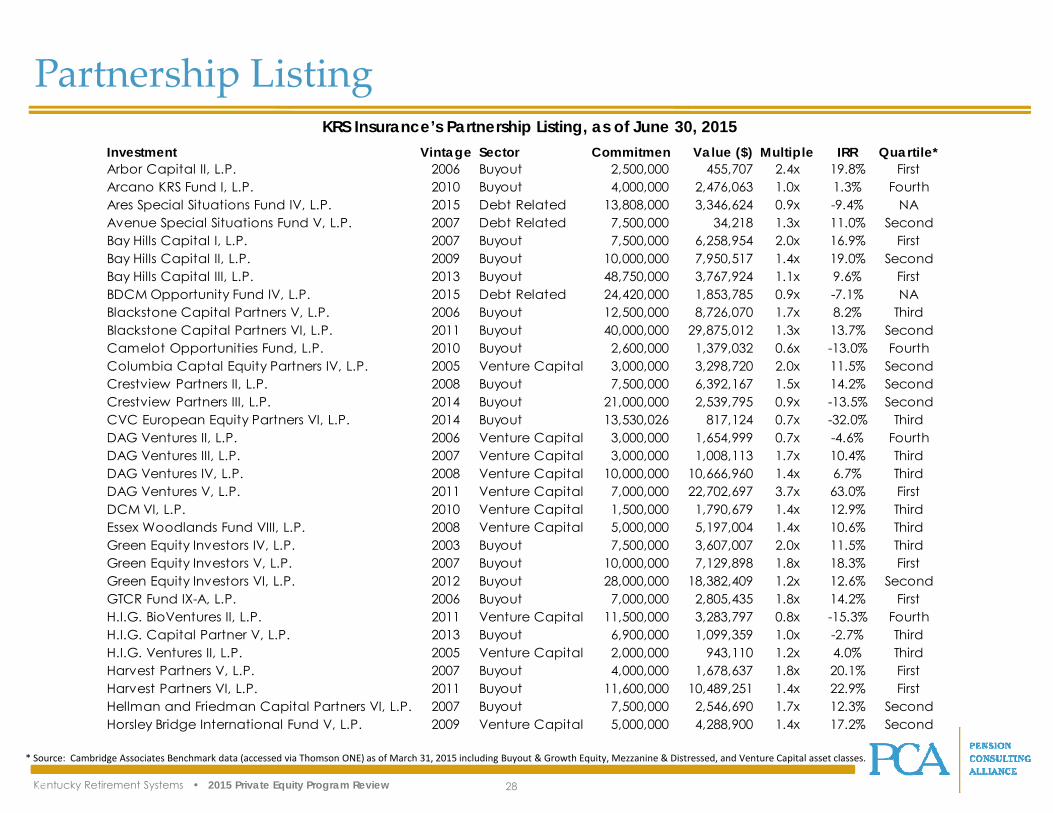
Partnership ListingKRS Insurance’s Partnership Listing, as of June 30, 2015
* Source: Cambridge Associates Benchmark data (accessed via Thomson ONE) as of March 31, 2015 including Buyout & Growth Equity, Mezzanine & Distressed, and Venture Capital asset classes.
Investment Vintage Sector Commitmen Value ($) Multiple IRR Quartile*Arbor Capital II, L.P. 2006 Buyout 2,500,000 455,707 2.4x 19.8% FirstArcano KRS Fund I, L.P. 2010 Buyout 4,000,000 2,476,063 1.0x 1.3% FourthAres Special Situations Fund IV, L.P. 2015 Debt Related 13,808,000 3,346,624 0.9x -9.4% NAAvenue Special Situations Fund V, L.P. 2007 Debt Related 7,500,000 34,218 1.3x 11.0% SecondBay Hills Capital I, L.P. 2007 Buyout 7,500,000 6,258,954 2.0x 16.9% FirstBay Hills Capital II, L.P. 2009 Buyout 10,000,000 7,950,517 1.4x 19.0% SecondBay Hills Capital III, L.P. 2013 Buyout 48,750,000 3,767,924 1.1x 9.6% FirstBDCM Opportunity Fund IV, L.P. 2015 Debt Related 24,420,000 1,853,785 0.9x -7.1% NABlackstone Capital Partners V, L.P. 2006 Buyout 12,500,000 8,726,070 1.7x 8.2% ThirdBlackstone Capital Partners VI, L.P. 2011 Buyout 40,000,000 29,875,012 1.3x 13.7% SecondCamelot Opportunities Fund, L.P. 2010 Buyout 2,600,000 1,379,032 0.6x -13.0% FourthColumbia Captal Equity Partners IV, L.P. 2005 Venture Capital 3,000,000 3,298,720 2.0x 11.5% SecondCrestview Partners II, L.P. 2008 Buyout 7,500,000 6,392,167 1.5x 14.2% SecondCrestview Partners III, L.P. 2014 Buyout 21,000,000 2,539,795 0.9x -13.5% SecondCVC European Equity Partners VI, L.P. 2014 Buyout 13,530,026 817,124 0.7x -32.0% ThirdDAG Ventures II, L.P. 2006 Venture Capital 3,000,000 1,654,999 0.7x -4.6% FourthDAG Ventures III, L.P. 2007 Venture Capital 3,000,000 1,008,113 1.7x 10.4% ThirdDAG Ventures IV, L.P. 2008 Venture Capital 10,000,000 10,666,960 1.4x 6.7% ThirdDAG Ventures V, L.P. 2011 Venture Capital 7,000,000 22,702,697 3.7x 63.0% FirstDCM VI, L.P. 2010 Venture Capital 1,500,000 1,790,679 1.4x 12.9% ThirdEssex Woodlands Fund VIII, L.P. 2008 Venture Capital 5,000,000 5,197,004 1.4x 10.6% ThirdGreen Equity Investors IV, L.P. 2003 Buyout 7,500,000 3,607,007 2.0x 11.5% ThirdGreen Equity Investors V, L.P. 2007 Buyout 10,000,000 7,129,898 1.8x 18.3% FirstGreen Equity Investors VI, L.P. 2012 Buyout 28,000,000 18,382,409 1.2x 12.6% SecondGTCR Fund IX-A, L.P. 2006 Buyout 7,000,000 2,805,435 1.8x 14.2% FirstH.I.G. BioVentures II, L.P. 2011 Venture Capital 11,500,000 3,283,797 0.8x -15.3% FourthH.I.G. Capital Partner V, L.P. 2013 Buyout 6,900,000 1,099,359 1.0x -2.7% ThirdH.I.G. Ventures II, L.P. 2005 Venture Capital 2,000,000 943,110 1.2x 4.0% ThirdHarvest Partners V, L.P. 2007 Buyout 4,000,000 1,678,637 1.8x 20.1% FirstHarvest Partners VI, L.P. 2011 Buyout 11,600,000 10,489,251 1.4x 22.9% FirstHellman and Friedman Capital Partners VI, L.P. 2007 Buyout 7,500,000 2,546,690 1.7x 12.3% SecondHorsley Bridge International Fund V, L.P. 2009 Venture Capital 5,000,000 4,288,900 1.4x 17.2% Second
Kentucky Retirement Systems • 2015 Private Equity Program Review 29
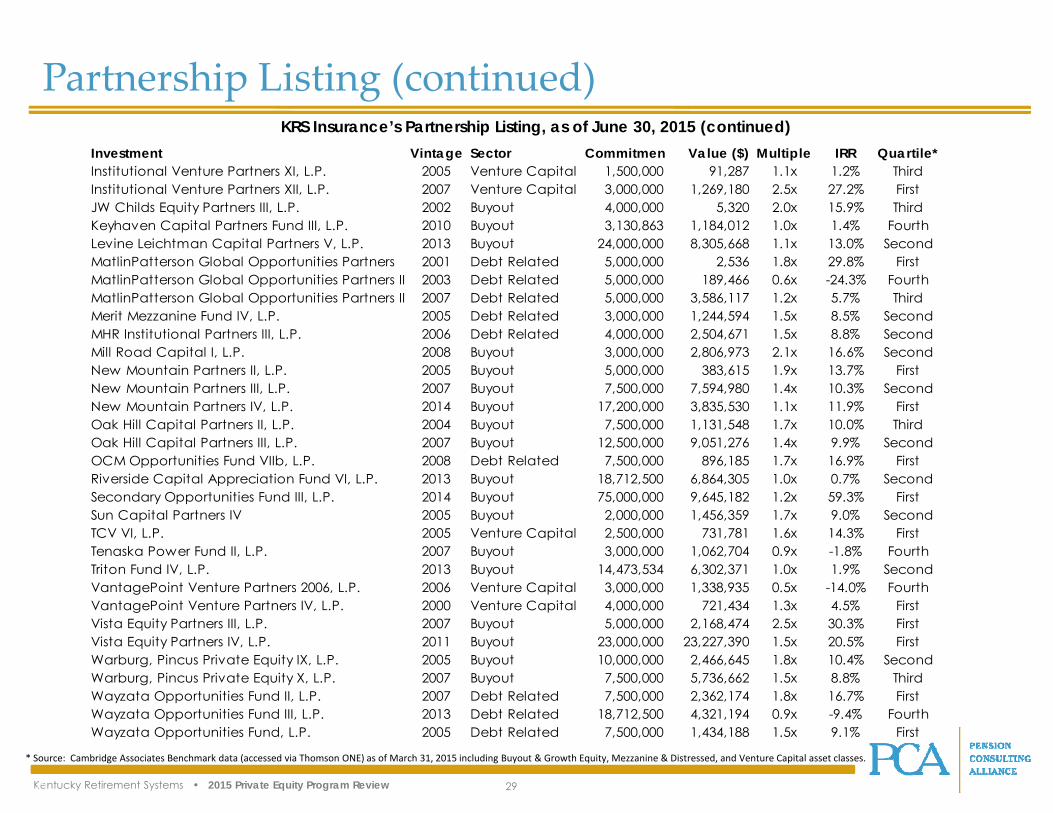
Partnership Listing (continued)KRS Insurance’s Partnership Listing, as of June 30, 2015 (continued)
* Source: Cambridge Associates Benchmark data (accessed via Thomson ONE) as of March 31, 2015 including Buyout & Growth Equity, Mezzanine & Distressed, and Venture Capital asset classes.
Investment Vintage Sector Commitmen Value ($) Multiple IRR Quartile*Institutional Venture Partners XI, L.P. 2005 Venture Capital 1,500,000 91,287 1.1x 1.2% ThirdInstitutional Venture Partners XII, L.P. 2007 Venture Capital 3,000,000 1,269,180 2.5x 27.2% FirstJW Childs Equity Partners III, L.P. 2002 Buyout 4,000,000 5,320 2.0x 15.9% ThirdKeyhaven Capital Partners Fund III, L.P. 2010 Buyout 3,130,863 1,184,012 1.0x 1.4% FourthLevine Leichtman Capital Partners V, L.P. 2013 Buyout 24,000,000 8,305,668 1.1x 13.0% SecondMatlinPatterson Global Opportunities Partners 2001 Debt Related 5,000,000 2,536 1.8x 29.8% FirstMatlinPatterson Global Opportunities Partners II 2003 Debt Related 5,000,000 189,466 0.6x -24.3% FourthMatlinPatterson Global Opportunities Partners II 2007 Debt Related 5,000,000 3,586,117 1.2x 5.7% ThirdMerit Mezzanine Fund IV, L.P. 2005 Debt Related 3,000,000 1,244,594 1.5x 8.5% SecondMHR Institutional Partners III, L.P. 2006 Debt Related 4,000,000 2,504,671 1.5x 8.8% SecondMill Road Capital I, L.P. 2008 Buyout 3,000,000 2,806,973 2.1x 16.6% SecondNew Mountain Partners II, L.P. 2005 Buyout 5,000,000 383,615 1.9x 13.7% FirstNew Mountain Partners III, L.P. 2007 Buyout 7,500,000 7,594,980 1.4x 10.3% SecondNew Mountain Partners IV, L.P. 2014 Buyout 17,200,000 3,835,530 1.1x 11.9% FirstOak Hill Capital Partners II, L.P. 2004 Buyout 7,500,000 1,131,548 1.7x 10.0% ThirdOak Hill Capital Partners III, L.P. 2007 Buyout 12,500,000 9,051,276 1.4x 9.9% SecondOCM Opportunities Fund VIIb, L.P. 2008 Debt Related 7,500,000 896,185 1.7x 16.9% FirstRiverside Capital Appreciation Fund VI, L.P. 2013 Buyout 18,712,500 6,864,305 1.0x 0.7% SecondSecondary Opportunities Fund III, L.P. 2014 Buyout 75,000,000 9,645,182 1.2x 59.3% FirstSun Capital Partners IV 2005 Buyout 2,000,000 1,456,359 1.7x 9.0% SecondTCV VI, L.P. 2005 Venture Capital 2,500,000 731,781 1.6x 14.3% FirstTenaska Power Fund II, L.P. 2007 Buyout 3,000,000 1,062,704 0.9x -1.8% FourthTriton Fund IV, L.P. 2013 Buyout 14,473,534 6,302,371 1.0x 1.9% SecondVantagePoint Venture Partners 2006, L.P. 2006 Venture Capital 3,000,000 1,338,935 0.5x -14.0% FourthVantagePoint Venture Partners IV, L.P. 2000 Venture Capital 4,000,000 721,434 1.3x 4.5% FirstVista Equity Partners III, L.P. 2007 Buyout 5,000,000 2,168,474 2.5x 30.3% FirstVista Equity Partners IV, L.P. 2011 Buyout 23,000,000 23,227,390 1.5x 20.5% FirstWarburg, Pincus Private Equity IX, L.P. 2005 Buyout 10,000,000 2,466,645 1.8x 10.4% SecondWarburg, Pincus Private Equity X, L.P. 2007 Buyout 7,500,000 5,736,662 1.5x 8.8% ThirdWayzata Opportunities Fund II, L.P. 2007 Debt Related 7,500,000 2,362,174 1.8x 16.7% FirstWayzata Opportunities Fund III, L.P. 2013 Debt Related 18,712,500 4,321,194 0.9x -9.4% FourthWayzata Opportunities Fund, L.P. 2005 Debt Related 7,500,000 1,434,188 1.5x 9.1% First
Kentucky Retirement Systems • 2015 Private Equity Program Review 30
DISCLOSURES: This document is provided for informational purposes only. It does not constitute an offer of securities of any of the issuers that may be described herein. Informationcontained herein may have been provided by third parties, including investment firms providing information on returns and assets under management, and may not have beenindependently verified. The past performance information contained in this report is not necessarily indicative of future results and there is no assurance that the investment inquestion will achieve comparable results or that the Firm will be able to implement its investment strategy or achieve its investment objectives. The actual realized value of currentlyunrealized investments (if any) will depend on a variety of factors, including future operating results, the value of the assets and market conditions at the time of disposition, anyrelated transaction costs and the timing and manner of sale, all of which may differ from the assumptions and circumstances on which any current unrealized valuations are based.
Neither PCA nor PCA’s officers, employees or agents, make any representation or warranty, express or implied, in relation to the accuracy or completeness of the informationcontained in this document or any oral information provided in connection herewith, or any data subsequently generated herefrom, and accept no responsibility, obligation orliability (whether direct or indirect, in contract, tort or otherwise) in relation to any of such information. PCA and PCA’s officers, employees and agents expressly disclaim any and allliability that may be based on this document and any errors therein or omissions therefrom. Neither PCA nor any of PCA’s officers, employees or agents, make any representation ofwarranty, express or implied, that any transaction has been or may be effected on the terms or in the manner stated in this document, or as to the achievement or reasonablenessof future projections, management targets, estimates, prospects or returns, if any. Any views or terms contained herein are preliminary only, and are based on financial, economic,market and other conditions prevailing as of the date of this document and are therefore subject to change.
The information contained in this report may include forward-looking statements. Forward-looking statements include a number of risks, uncertainties and other factors beyond thecontrol of the Firm, which may result in material differences in actual results, performance or other expectations. The opinions, estimates and analyses reflect PCA’s current judgment,which may change in the future.
Any tables, graphs or charts relating to past performance included in this report are intended only to illustrate investment performance for the historical periods shown. Such tables,graphs and charts are not intended to predict future performance and should not be used as the basis for an investment decision.
All trademarks or product names mentioned herein are the property of their respective owners. Indices are unmanaged and one cannot invest directly in an index. The index dataprovided is on an “as is” basis. In no event shall the index providers or its affiliates have any liability of any kind in connection with the index data or the portfolio described herein.Copying or redistributing the index data is strictly prohibited.
The Russell indices are either registered trademarks or trade names of Frank Russell Company in the U.S. and/or other countries.
The MSCI indices are trademarks and service marks of MSCI or its subsidiaries.
Standard and Poor’s (S&P) is a division of The McGraw-Hill Companies, Inc. S&P indices, including the S&P 500, are a registered trademark of The McGraw-Hill Companies, Inc.
CBOE, not S&P, calculates and disseminates the BXM Index. The CBOE has a business relationship with Standard & Poor's on the BXM. CBOE and Chicago Board Options Exchangeare registered trademarks of the CBOE, and SPX, and CBOE S&P 500 BuyWrite Index BXM are servicemarks of the CBOE. The methodology of the CBOE S&P 500 BuyWrite Index isowned by CBOE and may be covered by one or more patents or pending patent applications.
The Barclays Capital indices (formerly known as the Lehman indices) are trademarks of Barclays Capital, Inc.
The Citigroup indices are trademarks of Citicorp or its affiliates.
The Merrill Lynch indices are trademarks of Merrill Lynch & Co. or its affiliates.
FTSE is a trademark of the London Stock Exchange Group companies and is used by FTSE under license. All rights in the FTSE indices and/or FTSE ratings vest in FTSE and/or its licensors.No further distribution of FTSE data is permitted with FTSE’s express written consent.