krispy kreme retail and distribution center (ground...
TRANSCRIPT

Ca
pita
l Ma
rke
ts | In
vestm
en
t Pro
pe
rties
:: Offering Memorandum
PCG Detroit Capital Markets Driving Price and Adding Value through Experience and Market Knowledge
Krispy Kreme Retail and Distribution Center (Ground Lease) 15050 Southfield RoadAllen Park, Michigan 48101

Kr ispy Kreme Ground Lease | a f f i l i a t ed Bus ine s s d i s c l o su re and Con f i den t i a l i t y ag reemen t
CBRE, Inc. operates within a global family of companies with many subsidiaries and/or related entities (each an “Affiliate”) engaging in a broad range of commercial real estate businesses including, but not limited to, brokerage services, property and facilities management, valuation, investment fund management and development. At times different Affiliates may represent various clients with competing interests in the same transaction. For example, this Memorandum may be received by our Affiliates, including CBRE Investors, Inc. or Trammell Crow Company. Those, or other, Affiliates may express an interest in the property described in this Memorandum (the “Property”) may submit an offer to purchase the Property and may be the successful bidder for the Property. You hereby acknowledge that possibility and agree that neither CBRE, Inc. nor any involved Affiliate will have any obligation to disclose to you the involvement of any Affiliate in the sale or purchase of the Property. In all instances, however, CBRE, Inc. will act in the best interest of the client(s) it represents in the transaction described in this Memorandum and will not act in concert with or otherwise conduct its business in a way that benefits any Affiliate to the detriment of any other offeror or prospective offeror, but rather will conduct its business in a manner consistent with the law and any fiduciary duties owed to the client(s) it represents in the transaction described in this Memorandum.
This is a confidential Memorandum intended solely for your limited use and benefit in determining whether you desire to express further interest in the acquisition of the Property.
This Memorandum contains selected information pertaining to the Property and does not purport to be a representation of the state of affairs of the Property or the owner of the Property (the “Owner”), to be all-inclusive or to contain all or part of the information which prospective investors may require to evaluate a purchase of real property. All financial projections and information are provided for general reference purposes only and are based on assumptions relating to the general economy, market conditions, competition and other factors beyond the control of the Owner and CBRE, Inc. Therefore, all projections, assumptions and other information provided and made herein are subject to material variation. All references to acreages, square footages, and other measurements are approximations. Additional information and an opportunity to inspect the Property will be made available to interested and qualified prospective purchasers. In this Memorandum, certain documents, including leases and other materials, are described in summary form. These summaries do not purport to be complete nor necessarily accurate descriptions of the full agreements referenced. Interested parties are expected to review all such summaries and other documents of whatever nature independently and not rely on the contents of this Memorandum in any manner.
Neither the Owner or CBRE, Inc, nor any of their respective directors, officers, Affiliates or representatives make any representation or warranty, expressed or implied, as to the accuracy or completeness of this Memorandum or any of its contents, and no legal
commitment or obligation shall arise by reason of your receipt of this Memorandum or use of its contents; and you are to rely solely on your investigations and inspections of the Property in evaluating a possible purchase of the real property.
The Owner expressly reserved the right, at its sole discretion, to reject any or all expressions of interest or offers to purchase the Property, and/or to terminate discussions with any entity at any time with or without notice which may arise as a result of review of this Memorandum. The Owner shall have no legal commitment or obligation to any entity reviewing this Memorandum or making an offer to purchase the Property unless and until written agreement(s) for the purchase of the Property have been fully executed, delivered and approved by the Owner and any conditions to the Owner’s obligations therein have been satisfied or waived.
By receipt of this Memorandum, you agree that this Memorandum and its contents are of a confidential nature, that you will hold and treat it in the strictest confidence and that you will not disclose this Memorandum or any of its contents to any other entity without the prior written authorization of the Owner or CBRE, Inc. You also agree that you will not use this Memorandum or any of its contents in any manner detrimental to the interest of the Owner or CBRE, Inc.
If after reviewing this Memorandum, you have no further interest in purchasing the Property, kindly return this Memorandum to CBRE, Inc.
© 2014 CBRE, Inc. The information contained in this document has been obtained from sources believed reliable. While CBRE, Inc. does not doubt its accuracy, CBRE, Inc. has not verified it and makes no
guarantee, warranty or representation about it. It is your responsibility to independently confirm its accuracy and completeness. Any projections, opinions, assumptions or estimates used are for example only
and do not represent the current or future performance of the property. The value of this transaction to you depends on tax and other factors which should be evaluated by your tax, financial and legal advisors.
You and your advisors should conduct a careful, independent investigation of the property to determine to your satisfaction the suitability of the property for your needs.

Executive Summary Investment Highlights The Offering Investment Summary Building Details Area Maps Aerial Maps Area Overview Location Overview Demographic Report Rent Comparables Rent Comparable Analysis Rent Comparables Sale Comparables Sale Comparable Analysis Sales Comparables Financials Summary of Financial Assumptions Lease Abstract Tenant Overview Year One Cash Flow
01
02 03 04 05
TA B L E O F C O n T E n T S
STNL - Krispy Kreme

ST
NL
- Krisp
y Kre
me
Gro
un
d Le
ase
| E
xecu
tive S
um
ma
ry
01 Executive Summary Investment Highlights The Offering Investment Summary Building Details Area Maps Aerial Maps

Investment Highlights
• Stabilized Asset, Currently 100 Percent Occupied by Krispy Kreme
• Absolute NNN Ground Lease, Zero Landlord Responsibilities
• Drive Thru Location That Serves as a Distribution Facility as Well
• Excellent Location, Close Proximity to Major Highways Including M-39, I-75 and I-94
• Traffic Counts Of 100,000+ VPD Along Southfield Road
• Direct Frontage of 250’ Along Southfield Road
• Lease Equipped with Four, Five Year Renewal Options with 180 Days Notice
• Strong Demographics, Average Household Income of $53,000+ Within One-Mile Radius and a Population of over 278,000 People
The Offering
CBRE, Inc. has been retained by current ownership as the exclusive marketing advisor for the disposition of the Krispy Kreme Retail and Distribution Center Ground Lease located at 15050 Southfield Road in Allen Park, Michigan.
The Summary
Krispy Kreme has been a tenant since 2003 on their 15-year ground lease through October 31, 2018 (4+ years remain). This is a 4,488 square foot free-standing building on a 1.24-acre parcel zoned C-4, General Business. The property is equipped with a drive thru and is a distribution facility as well with additional parking and land.
Krispy Kreme is on a NNN ground lease in which they are responsible for procuring and paying for all operating expenses including common area maintenance, property insurance and real estate taxes. The tenant is also responsible for maintaining, repairing and making replacements to the subject property including the roof and exterior portions. Additionally, the lease is equipped with four, five year renewal options notification period of four months. Each renewal option is equipped with a rental increase based upon CPI. Krispy Kreme is a leading branded retailer and wholesaler of high-quality doughnuts, complementary beverages and treats and packaged sweets. The Company’s principal business, which began in 1937, is owning and franchising Krispy Kreme stores, at which a wide variety of high-quality doughnuts are sold and distributed together with complementary products, and where a broad array of coffees and other beverages are offered. The tenant on the lease is Krispy Kreme Doughnut Corporation (“KKDC”) which is the most significant principal operating subsidiary of Krispy Kreme Doughnuts, Inc. (“KKDI”).
I N V E S T M E N T S U M M A RY
ExecutiveSummary 3STNL - Krispy Kreme

FINANCIAL OVERVIEW
Sales Price $1,208,000
CAP Rate 7.50%
Price Per Square Foot
$269
Financing All Cash Transaction
BuILdINg INFORmATION
Property
Krispy Kreme Retail & Distribution Center15050 Southfield Road Allen Park, MI 48101
Building Square Feet (RBA)
4,488 Square Feet
Property Type STNL Free Standing Retail Building with Drive Thru
Year Built 2004
Land Area 1.24 Acres
Type of Ownership
Fee Simple
Current Occupancy
100%
ExecutiveSummary 4STNL - Krispy Kreme

gENERAL PROPERTy INFORmAT ION
Property Krispy Kreme Ground Lease
Property Address 15050 Southfield Road Allen Park, Michigan 48101
County WayneYear Constructed 2003Parcel Number 30-011-02-1435-002Total Building Size 4,488 SFParcel Size 1.24 AcresZoning C-4, General Business Number of Stories OneParking 44 Spaces
Frontage 250’ Along Southfield RoadBuI Ld INg dETA I LS
Foundation Reinforced ConcreteExterior Walls Concrete Block, Brick VeneerRoof Flat RoofStructure Steel/Concrete BlockFoundation Reinforced ConcreteUtilities All to SiteElectrical Specifications To Code
ExecutiveSummary 5STNL - Krispy Kreme

A R E A M A P S
ExecutiveSummary 6STNL - Krispy Kreme

Subject Property - Allen Park
MEYER
SOUTHFIELD ROAD
LAU
REN
CE
ST.
A E R I A L M A P
ExecutiveSummary 7STNL - Krispy Kreme

SUBJECT PROPERTY
Retail Trade Area - Allen Park
A E R I A L M A P
ExecutiveSummary 8STNL - Krispy Kreme

Kris
py K
rem
e -
Alle
n Pa
rk
SUBJ
ECT
PRO
PERTY
Star
buck
’s
Star
buck
’s
65,2
00 A
DT
ALLEN ROAD
DIX HWY.
FISHER FW
Y.
FORT S
TREET
SOUTHFIE
LD FW
Y.
SOU
THFI
ELD
RO
AD
DIX HWY.
ROOSEVELT AVE.
PARK AVE.DETR
OIT IN
DUSTRIA
L EXPY
.
FISHER FW
Y.
W. O
UTE
R D
RIVE
OAKW
OO
D B
LVD.
72,000 ADT
A E R I A L M A P
ExecutiveSummary 9STNL - Krispy Kreme

ST
NL
- Krisp
y Kre
me
Gro
un
d Le
ase
| A
rea
Ove
rview
02 Area Overview Location Overview

A R E A OV E R V I E W
Location Overview
The subject property is along the north side of Southfield Road, east of Allen Road. The property is surrounded by many national retailers including CVS, McDonald’s, Rite Aid, Sprint and many others. The property is located within the Downriver north retail submarket which consists of 291 properties totaling 1.9 million square feet of retail space.
Allen Park, Michigan
The suburb of Detroit was recognized in Money Magazine’s list of America’s Best Small Cities. Allen Park is part of the collection of communities known as Downriver. Ford Motor Company is an integral part of the community. Many of the company’s offices and facilities lie within the city limits. Since 2002, Allen Park is the practice home of the Detroit Lions and is also the site of the team’s headquarters.
Metro Detroit
Detroit is the largest city in the state of Michigan. It is the major city among the primary cultural, financial, and transportation centers in the Metro Detroit area, a region of 5.2 million people. Detroit serves as a major port on the Detroit River connecting the Great Lakes systems to the Saint Lawrence Seaway.
The Detroit Metro area covers Southeast Michigan centered on the city of Detroit which shares an international border with Windsor, Ontario. As a major metropolitan area, it is known for its automotive heritage, arts, entertainment, and popular music and sports legacies. The area includes a vast variety of natural landscapes, parks, and beaches with a unique recreational coastline linking the Great Lakes, unlike competitive states such as Indiana, Pennsylvania, and other industrial manufacturing oriented states. The Detroit Urban Area, which serves as the core of the Metropolitan Statistical Area, ranks as the 12th most populous of the United States. This urbanized area covers parts of the counties of Wayne, Oakland, and Macomb. These counties are sometimes referred to informally as the Detroit Tri-County Area, and had a population of 3,863,888 as of the 2010 census with an area of 1,967 square miles.
Wayne County
The property is located in Wayne County, which is the 13th most-populous county in the United States. The county seat is Detroit, the largest city in Michigan. Wayne County is located in southeastern Michigan, encompassing approximately 623 square miles. It is made up of 34 cities, including the city of Detroit, nine townships and 41 public school districts and its population consists of approximately two million.
AreaOverview 11STNL - Krispy Kreme

1
CBRE Global Research and Consulting
© 2014, CBRE, Inc.
Detroit RetailMarketView
ASCENDING LEASE RATES, FLIGHT TO QUALITY CONTINUE
Quick Stats
Hot Topics
A new 140,000 sq. ft. retail re -development in Woodhaven, Michigan represented by CBRE is set to break ground in Q2 2014
The American Customer Satisfaction Index (ACSI), which polls Americans’ satisfaction with shopping and consumption experience, reported its highest level (76.8) in 20 years
Wal-Mart reopened a supercenter in Warren, Michigan after closing more than a decade ago; the 185,000 sq. ft. store will create 300 full and part-time jobs
Kroger opened a new 114,000 sq. ft. store and fuel center in Utica, Michigan, which will create 381 jobs
National Tenant’s Charming Charlie , Shoe Carnival and UltaBeauty will make their new home at Westland Shopping Center, and are expected to take occupancy in Q3 2014
U.S. auto sales well exceeded expectations in March as shown by the 5.7% increase to 16.4 million vehicles
Retail market improvesThe Metropolitan Detroit retail marketvacancy rate declined by 110 basis points(bps) to 8.5% in Q1 2014. In correlationto declining vacancy, the average askinglease rate increased by $0.15 to $14.05.With declining vacancies, and lease ratesincreasing, landlords are offering lessconcessions and tenant improvementsshifting the market from tenant towardsowner favorable.
New DevelopmentsFlight to quality continues to trend withretailers competing to occupy thediminishing amount of available space inpremier centers. This trend has spurredsome developers to take advantage of theimproving market conditions. One of themost prominent planned developments isthe 140,000 sq. ft. retail re-developmentcoming to the corner of West and AllenRd. in Woodhaven, Michigan representedby CBRE. They have received 31 letters ofinterest and have already inked a fewdeals pre-construction, showing there's ahigh demand for quality space in theTaylor-Southgate market. Some of theinterested tenants include T-Mobile, Zoyo,Qdoba and World of Beer. Furthermore,there are several smaller retaildevelopments currently under constructionin the 10,000 – 50,000 sq. ft. range in
Southfield, Troy, Macomb, Rochester Hills,Lapeer and Madison Heights submarkets,demonstrating a healthy outlook for 2014.
Retail IndicatorsAlthough retail sales were moderate in themonth of February due to unrelentingweather conditions, the latest MichiganRetail Index showed an increase of 6.5points reporting a performance index of49. Looking ahead to Q2 2014, over 50%of retailers expect sales to increase on aquarter-over-quarter basis.
Capital MarketsIn the past six months, investmentopportunities in the Metropolitan Detroitarea have experienced an increased levelof interest from lenders. For almost allproperty types that are well located,occupied, and are of higher asset class,there has also been an increase in investorappetite, which has resulted in lowercapitalization rates and increased propertyvalues. When looking exclusively at retailtransactions ($2.5 Million+) over the past12 months, Detroit experienced a mediancapitalization rate of 7.9% in comparisonto a 6.9% figure experienced by the U.S.,according to Real Capital Analytics. Forthe remainder of 2014, investor interest instabilized well located retail properties isexpected to continue.
Q1 2014
Q1 2014 Q-o-Q Y-o-Y
Vacancy 9.6%8.5%
Lease Rate $13.90$14.05
Construction 195,800
Figure 1: Direct Vacancy Rate vs. Net Asking Rate
Source: CBRE Research, Q1 2014.
* Indicates an approximation
*The arrows are trend indicators over the specified time period and do not represent a positive or negative value. (e.g., absorption could be negative, but still represent a positive trend over a specified period.
$12.50
$13.00
$13.50
$14.00
$14.50
$15.00
0.0%
2.0%
4.0%
6.0%
8.0%
10.0%
12.0%
Q4 2012 Q1 2013 Q2 2013 Q3 2013 Q4 2013 Q1 2014
Vavcancy Rate - 8.5% Average Asking Lease Rate $/SF/YR - $14.05
U.S. Unemployment Rate6.7% 6.7%
Michigan Unemployment Rate8.8% 7.7%
Metro Detroit Unemployment Rate9.3% 9.0%
MArk E t r E pOr t
AreaOverview 12StNL-InfineonNorthAmerica

2
Q1
20
14
Detro
it Reta
il |M
ark
etV
iew
© 2014, CBRE, Inc.
2
Figure 2: Market Statistics
Submarket Market Size Vacancy Rate % Net Asking Rate
Auburn Hills 2,785,858 0.8% $26.51
Birmingham 378,084 13.1% $25.29
Bloomfield-West Bloomfield 1,615,813 11.5% $17.50
Central Oakland 1,687,987 10.1% $13.49
Central Wayne 1,348,206 1.1% $11.77
Dearborn 1,578,974 5.5% $16.55
Detroit 2,441,413 18.7% $9.08
Eastern Macomb 1,449,889 9.5% $13.43
Farmington Hills 1,203,222 12.8% $13.50
Genesee-Lapeer 3,823,137 8.0% $10.02
Livingston 1,668,611 7.4% $15.77
Livonia 1,658,208 17.1% $13.75
NE Wayne 1,391,939 15.3% $20.50
Northern Macomb 2,066,545 9.8% $12.58
Novi 1,326,599 1.2% $20.00
Out of Area 177,176 3.8% $12.00
Rochester Hills 2,312,047 6.5% $21.99
Saginaw-Bay 1,945,200 16.4% $8.14
SE Oakland 2,693,023 6.1% $18.16
SE Wayne 1,350,752 16.1% $17.59
Shelby Twp 1,253,860 3.5% $13.25
Southern Macomb 1,823,485 2.4% $13.74
Southfield 1,238,238 6.8% $14.44
Sterling Heights-Warren 2,912,066 11.0% $19.08
Taylor-Southgate 1,662,509 4.7% $10.37
Troy 2,058,315 6.6% $14.46
Washtenaw 2,923,020 7.9% $12.18
Western Oakland 1,134,027 5.2% $16.52
Western Wayne 1,722,120 7.0% $16.26
Metro Detroit Total 51,630,323 8.5% $14.05
Source: CBRE Research, Q1 2014.
MArk E t r E pOr t
AreaOverview 13STNL - Krispy Kreme

3
Q1
20
14
Detro
it Reta
il |M
ark
etV
iew
© 2014, CBRE, Inc.
3
Figure 3: Unemployment
Figure 4: Average Asking Lease Rates
Figure 5: Vacancy Rate
Average Asking Lease RatesThe average asking lease rate for retail space in theMetropolitan Detroit area increased by $0.15 in Q12014 to $14.05 NNN. With rent increases andvacancy decline, a few developments are currentlyunder construction in the 10,000 – 50,000 sq. ft.range in Southfield, Macomb, Rochester Hills,Lapeer and Madison Heights submarkets.
The Auburn Hills and Birmingham submarketsreported the highest lease rates in Metro Detroit,averaging $26.51 NNN and $25.29 NNN,respectively. The Saginaw-Bay retail submarketreported the lowest average asking lease rate in Q12014 averaging $8.08 NNN.
The average asking lease rates for Free Standingbuildings remained at $11.67 NNN. Strip/Inlinecenters rates increased by $0.08 to $15.47 NNN,whereas the rates for Community/ Neighborhoodcenters decreased by $0.05 to $12.28NNN.
Vacancy RateThe Metropolitan Detroit retail market posted anoverall vacancy rate of 8.5% in Q4 2013, which is a110 bps decrease quarter-over-quarter. The AuburnHills submarket reported the lowest vacancy rate at0.8%, whereas the Detroit submarket posted thehighest vacancy rate at 18.7%.
The Novi submarket saw the largest decrease in itsvacancy rate due to a 152,000 sq. ft. availabilitybeing absorbed at Fountain Walk. The Detroit,Birmingham, Sterling-Heights Warren and CentralOakland submarkets also performed well in regardsto vacancy decline. The Livingston submarket sawthe largest increase in vacancy reporting a 1.2%figure in Q1 2014.
UnemploymentMichigan’s unemployment rate decreased by 100bps to 7.7% on a quarter-over-quarter basis. TheState can expect to add over 130,000 jobs in thenext two years yielding a 7.3% unemployment rateby 2015, according to University of Michiganeconomists.
The national unemployment rate decreased 60 bpsto 6.7% on a quarter-over-quarter basis.Additionally, non-farm payroll employmentincreased by 192,000 in the month of March.Employment increases were reported in severalsegments: professional and business services, healthcare, and in mining and logging − constructionemployment has risen by 151,000 over the pastyear.
Source: CBRE Research, Q1 2014.
Source: CBRE Research, Q1 2014.
Source: Bureau of Labor Statistics, March 2014.
$0.00
$3.00
$6.00
$9.00
$12.00
$15.00
Q1 2013 Q2 2013 Q3 2013 Q4 2013 Q1 2014
Comm./Neighborhood - $12.33 Strip/Inline - $15.47 Free Standing - $11.67
0%
5%
10%
15%
20%
25%
30%
Q1 2013 Q2 2013 Q3 2013 Q4 2013 Q1 2014
Comm./Neighborhood - 11.9% Strip/Inline - 25.3% Free Standing - 8.1%
9.0%7.7%
6.7%
0.0%
2.0%
4.0%
6.0%
8.0%
10.0%
12.0%
Detroit Michigan U.S.
MArk E t r E pOr t
AreaOverview 14STNL - Krispy Kreme

4
Q1
20
14
Detro
it Reta
il |M
ark
etV
iew
© 2014, CBRE, Inc.
4
CONTACTSFor more information about this Local MarketView, please contact:
Global Research and Consulting
This report was prepared by the CBRE U.S. Research Team which forms part of CBRE Global Research and Consulting – a network of preeminent researchers and consultants who collaborate to provide real estate market research, econometric forecasting and consulting solutions to real estate investors and occupiers around the globe.
Disclaimer
Information contained herein, including projections, has been obtained from sources believed to be reliable. While we do not doubt its accuracy, we have not verified it and make no guarantee, warranty or representation about it. It is your responsibility to confirm independently its accuracy and completeness. This information is presented exclusively for use by CBRE clients and professionals and all rights to the material are reserved and cannot be reproduced without prior written permission of the CBRE Global Chief Economist.
John A. Latessa, Jr.Senior Managing DirectorEastern DivisionCBRE2000 Town Center, Suite 500Southfield, MI 48075t: +1 248 353 5400e: [email protected]
Nick AhernResearch Analyst Detroit ResearchCBRE2000 Town Center, Suite 500Southfield, MI 48075t: +1 248 936 6853e: [email protected]
Detroit ResearchBrandon CarnegieResearch Analyst Detroit ResearchCBRE2000 Town Center, Suite 500Southfield, MI 48075t: +1 248 351 2054e: [email protected]
FOLLOW US
MArk E t r E pOr t
AreaOverview 15STNL - Krispy Kreme

15050 Southfield Rd 1 mile radius
15050 Southfield Rd 3 mile radius
15050 Southfield Rd 5 mile radius
2014 Estimated Population 16,192 130,441 278,8742019 Projected Population 15,747 127,303 272,4562010 Census Population 16,619 133,511 285,2062000 Census Population 17,805 140,817 300,205
Growth 2010-2014 -2.57% -2.30% -2.22%Growth 2014-2019 -2.75% -2.41% -2.30%
2014 Estimated Median Age 39.95 39.40 38.372014 Estimated Average Age 40.05 39.61 39.01
2014 Estimated Households 6,604 53,028 111,6552019 Projected Households 6,474 52,145 109,8632010 Census Households 6,706 53,755 113,1752000 Census Households 7,119 56,874 120,054
Growth 2010-2014 -1.53% -1.35% -1.34%Growth 2014-2019 -1.96% -1.67% -1.61%
2014 Est. Average Household Size 2.45 2.45 2.49
2014 Est. Median Household Income $44,266 $41,286 $39,9822019 Prj. Median Household Income $45,247 $42,546 $41,3852000 Cen. Median Household Income $49,141 $44,437 $43,638
2014 Est. Average Household Income $53,679 $50,995 $50,9832014 Estimated Per Capita Income $21,892 $20,731 $20,413
2014 Estimated Housing Units 7,159 59,070 125,1932014 Estimated Occupied Units 6,604 53,028 111,6552014 Estimated Vacant Units 556 6,042 13,537
2014 Est. Owner Occupied Units 5,520 39,938 79,1652014 Est. Renter Occupied Units 1,084 13,091 32,490
2014 Est. Median Housing Value $86,543 $79,344 $81,1052014 Est. Average Housing Value $98,969 $90,555 $94,175
©2014 - CBRE. This information has been obtained from sources believed reliable. We have not verified it and make no guarantee, warranty or representation about it. Any projections, opinions, assumptions or estimates used are for example only and do not represent the current or future performance of the property. You and your advisors should conduct a careful, independent investigation of the property to determine to your satisfaction the suitability of the property for your needs. Source: Nielsen
Prepared On: 4/28/2014 9:05:23 AM Page 1 of 10
Demographic Report
dEMOgrAph I c p rO f I L E
AreaOverview 16STNL - Krispy Kreme

15050 Southfield Rd 1 mile radius
15050 Southfield Rd 3 mile radius
15050 Southfield Rd 5 mile radius
2014 Estimated Households 6,604 53,028 111,655- Income Less than $15,000 851 (12.9%) 8,667 (16.3%) 18,854 (16.9%)- Income $15,000 - $24,999 991 (15.0%) 7,488 (14.1%) 16,123 (14.4%)- Income $25,000 - $34,999 729 (11.0%) 6,434 (12.1%) 14,445 (12.9%)- Income $35,000 - $49,999 1,150 (17.4%) 8,947 (16.9%) 17,822 (16.0%)- Income $50,000 - $74,999 1,230 (18.6%) 10,122 (19.1%) 20,711 (18.5%)- Income $75,000 - $99,999 939 (14.2%) 6,014 (11.3%) 12,062 (10.8%)- Income $100,000 - $124,999 360 (5.5%) 2,859 (5.4%) 5,903 (5.3%)- Income $125,000 - $149,999 175 (2.6%) 1,157 (2.2%) 2,523 (2.3%)- Income $150,000 - $199,999 148 (2.2%) 899 (1.7%) 2,125 (1.9%)- Income $200,000 - $249,999 17 (.3%) 209 (.4%) 525 (.5%)- Income $250,000 - $499,999 11 (.2%) 210 (.4%) 510 (.5%)- Income Over $500,000 1 (.0%) 19 (.0%) 54 (.0%)
2014 Est. Average Household Income $53,679 $50,995 $50,9832019 Prj. Average Household Income $55,408 $53,152 $53,0392000 Cen. Avg. Household Income $56,145 $52,240 $53,065
2014 Estimated Households 6,604 53,028 111,655- 1 Person Household 2,011 (30.5%) 16,377 (30.9%) 34,990 (31.3%)- 2 Person Household 2,036 (30.8%) 16,181 (30.5%) 33,373 (29.9%)- 3 Person Household 1,063 (16.1%) 8,690 (16.4%) 17,930 (16.1%)- 4 Person Household 885 (13.4%) 6,730 (12.7%) 13,715 (12.3%)- 5 Person Household 394 (6.0%) 3,091 (5.8%) 6,720 (6.0%)- 6 Person Household 137 (2.1%) 1,235 (2.3%) 2,858 (2.6%)- 7 or More Person Household 77 (1.2%) 725 (1.4%) 2,070 (1.9%)
2014 Est. Average Household Size 2.45 2.45 2.49
2014 Estimated Households 6,604 53,028 111,655- Households with No Vehicles 493 (7.5%) 4,881 (9.2%) 10,304 (9.2%)- Households with 1 Vehicle 2,609 (39.5%) 21,805 (41.1%) 47,275 (42.3%)- Households with 2 Vehicles 2,572 (38.9%) 18,770 (35.4%) 38,339 (34.3%)- Households with 3 Vehicles 660 (10.0%) 5,772 (10.9%) 11,823 (10.6%)- Households with 4 Vehicles 217 (3.3%) 1,339 (2.5%) 2,873 (2.6%)- Households with 5+ Vehicles 52 (.8%) 462 (.9%) 1,041 (.9%)
2014 Est. Average Number of Vehicles
1.66 1.60 1.58
©2014 - CBRE. This information has been obtained from sources believed reliable. We have not verified it and make no guarantee, warranty or representation about it. Any projections, opinions, assumptions or estimates used are for example only and do not represent the current or future performance of the property. You and your advisors should conduct a careful, independent investigation of the property to determine to your satisfaction the suitability of the property for your needs. Source: Nielsen
Prepared On: 4/28/2014 9:05:23 AM Page 2 of 10
Demographic ReportdEMOgrAph I c p rO f I L Ed EMOgrAph I c p rO f I L E
AreaOverview 17STNL - Krispy Kreme

15050 Southfield Rd 1 mile radius
15050 Southfield Rd 3 mile radius
15050 Southfield Rd 5 mile radius
2014 Estimated Population by Race and Origin
16,192 130,441 278,874
- White Population 14,588 (90.1%) 102,894 (78.9%) 226,358 (81.2%)- Black Population 353 (2.2%) 16,764 (12.9%) 29,382 (10.5%)- Asian Population 91 (.6%) 1,085 (.8%) 3,249 (1.2%)- Pacific Islander Population 2 (.0%) 46 (.0%) 115 (.0%)- American Indian and Alaska Native 94 (.6%) 719 (.6%) 1,499 (.5%)- Other Race Population 692 (4.3%) 5,042 (3.9%) 9,746 (3.5%)- Two or More Races Population 372 (2.3%) 3,891 (3.0%) 8,524 (3.1%)- Hispanic Population 2,056 (12.7%) 15,509 (11.9%) 29,822 (10.7%)- White Non-Hispanic Population 13,371 (82.6%) 93,962 (72.0%) 209,279 (75.0%)
2014 Estimated Population by Age 16,192 130,441 278,874- Aged 0 to 4 Years 950 (5.9%) 7,998 (6.1%) 17,858 (6.4%)- Aged 5 to 9 Years 952 (5.9%) 7,975 (6.1%) 17,852 (6.4%)- Aged 10 to 14 Years 1,039 (6.4%) 8,320 (6.4%) 18,091 (6.5%)- Aged 15 to 17 Years 668 (4.1%) 5,340 (4.1%) 11,521 (4.1%)- Aged 18 to 20 Years 603 (3.7%) 4,910 (3.8%) 10,650 (3.8%)- Aged 21 to 24 Years 827 (5.1%) 6,863 (5.3%) 14,911 (5.3%)- Aged 25 to 34 Years 1,967 (12.1%) 16,314 (12.5%) 36,352 (13.0%)- Aged 35 to 44 Years 2,248 (13.9%) 17,362 (13.3%) 36,521 (13.1%)- Aged 45 to 54 Years 2,336 (14.4%) 18,575 (14.2%) 38,703 (13.9%)- Aged 55 to 64 Years 2,156 (13.3%) 17,232 (13.2%) 35,666 (12.8%)- Aged 65 to 74 Years 1,168 (7.2%) 9,782 (7.5%) 20,980 (7.5%)- Aged 75 to 84 Years 704 (4.3%) 6,416 (4.9%) 12,993 (4.7%)- Aged 85 Years and Older 574 (3.5%) 3,353 (2.6%) 6,776 (2.4%)
2014 Estimated Median Age 39.95 39.40 38.372014 Estimated Average Age 40.05 39.61 39.01
2014 Estimated Population Over 25 by Educational Attainment
11,153 89,035 187,991
- Less than 9th Grade 559 (5.0%) 4,556 (5.1%) 11,015 (5.9%)- High School - No Diploma 1,194 (10.7%) 10,117 (11.4%) 21,370 (11.4%)- High School Diploma 3,936 (35.3%) 32,820 (36.9%) 66,932 (35.6%)- Some College 2,772 (24.9%) 22,420 (25.2%) 45,845 (24.4%)- Associate Degree 886 (7.9%) 6,335 (7.1%) 13,424 (7.1%)- Bachelor's Degree 1,237 (11.1%) 8,581 (9.6%) 19,397 (10.3%)- Master's Degree 502 (4.5%) 3,276 (3.7%) 7,754 (4.1%)- Professional Degree 51 (.5%) 696 (.8%) 1,622 (.9%)- Doctoral Degree 15 (.1%) 235 (.3%) 633 (.3%)
©2014 - CBRE. This information has been obtained from sources believed reliable. We have not verified it and make no guarantee, warranty or representation about it. Any projections, opinions, assumptions or estimates used are for example only and do not represent the current or future performance of the property. You and your advisors should conduct a careful, independent investigation of the property to determine to your satisfaction the suitability of the property for your needs. Source: Nielsen
Prepared On: 4/28/2014 9:05:23 AM Page 3 of 10
Demographic ReportdEMOgrAph I c p rO f I L Ed EMOgrAph I c p rO f I L E
AreaOverview 18STNL - Krispy Kreme

15050 Southfield Rd 1 mile radius
15050 Southfield Rd 3 mile radius
15050 Southfield Rd 5 mile radius
2014 Estimated Owner Occupied Units by Housing Value
5,520 39,938 79,165
- Valued Less than $20,000 138 (2.5%) 1,434 (3.6%) 3,192 (4.0%)- Valued $20,000 - $39,999 375 (6.8%) 4,331 (10.8%) 8,278 (10.5%)- Valued $40,000 - $59,999 862 (15.6%) 7,202 (18.0%) 13,058 (16.5%)- Valued $60,000 - $79,999 1,024 (18.6%) 7,236 (18.1%) 14,271 (18.0%)- Valued $80,000 - $99,999 1,075 (19.5%) 7,008 (17.5%) 13,406 (16.9%)- Valued $100,000 - $149,999 1,411 (25.6%) 8,953 (22.4%) 17,821 (22.5%)- Valued $150,000 - $199,999 470 (8.5%) 2,685 (6.7%) 6,087 (7.7%)- Valued $200,000 - $299,999 98 (1.8%) 794 (2.0%) 2,098 (2.7%)- Valued $300,000 - $399,999 31 (.6%) 141 (.4%) 567 (.7%)- Valued $400,000 - $499,999 13 (.2%) 47 (.1%) 153 (.2%)- Valued $500,000 - $749,999 8 (.1%) 24 (.1%) 100 (.1%)- Valued $750,000 - $999,999 6 (.1%) 17 (.0%) 27 (.0%)- Valued More than $1,000,000 9 (.2%) 63 (.2%) 106 (.1%)
2014 Est. Median Housing Value $86,543 $79,344 $81,1052014 Est. Average Housing Value $98,969 $90,555 $94,175
2014 Estimated Housing Units by Housing Type
7,159 59,070 125,193
- 1 Unit Detached 6,707 (93.7%) 48,987 (82.9%) 96,481 (77.1%)- 1 Unit Attached 58 (.8%) 1,372 (2.3%) 4,035 (3.2%)- 2 Units 135 (1.9%) 1,412 (2.4%) 4,738 (3.8%)- 3-4 Units 33 (.5%) 1,264 (2.1%) 3,521 (2.8%)- 5-19 Units 68 (.9%) 3,290 (5.6%) 8,730 (7.0%)- 20-49 Units 30 (.4%) 801 (1.4%) 2,382 (1.9%)- 50+ Units 103 (1.4%) 1,439 (2.4%) 4,308 (3.4%)- Mobile Home Units 26 (.4%) 504 (.9%) 997 (.8%)- Other Units 0 0 0
2014 Estimated Housing Units by Year Structure Built
7,159 59,070 125,193
- Structure Built 2005 or Later 20 (.3%) 547 (.9%) 1,831 (1.5%)- Structure Built 2000 to 2004 35 (.5%) 1,334 (2.3%) 3,036 (2.4%)- Structure Built 1990 to 1999 59 (.8%) 1,044 (1.8%) 4,304 (3.4%)- Structure Built 1980 to 1989 46 (.6%) 1,474 (2.5%) 4,136 (3.3%)- Structure Built 1970 to 1979 294 (4.1%) 4,229 (7.2%) 10,627 (8.5%)- Structure Built 1960 to 1969 752 (10.5%) 8,169 (13.8%) 15,805 (12.6%)- Structure Built 1950 to 1959 3,541 (49.5%) 25,164 (42.6%) 43,009 (34.4%)- Structure Built 1940 to 1949 1,723 (24.1%) 11,004 (18.6%) 22,622 (18.1%)- Structure Built 1939 or Earlier 689 (9.6%) 6,105 (10.3%) 19,823 (15.8%)
2014 Est. Median Year Structure Built 1953 1955 1955
©2014 - CBRE. This information has been obtained from sources believed reliable. We have not verified it and make no guarantee, warranty or representation about it. Any projections, opinions, assumptions or estimates used are for example only and do not represent the current or future performance of the property. You and your advisors should conduct a careful, independent investigation of the property to determine to your satisfaction the suitability of the property for your needs. Source: Nielsen
Prepared On: 4/28/2014 9:05:23 AM Page 4 of 10
Demographic Report
dEMOgrAph I c p rO f I L Ed EMOgrAph I c p rO f I L E
AreaOverview 19STNL - Krispy Kreme

15050 Southfield Rd 1 mile radius
15050 Southfield Rd 3 mile radius
15050 Southfield Rd 5 mile radius
2014 Estimated Population by Sex 16,192 130,441 278,874- Male 7,856 (48.5%) 63,080 (48.4%) 135,880 (48.7%)- Female 8,336 (51.5%) 67,361 (51.6%) 142,993 (51.3%)
2014 Estimated Pop. over 15 byMarital Status
13,251 106,148 225,073
- Male: Never Married 2,620 (19.8%) 19,910 (18.8%) 42,562 (18.9%)- Male: Married Spouse Absent 99 (.7%) 1,458 (1.4%) 3,887 (1.7%)- Male: Married Spouse Present 2,640 (19.9%) 21,558 (20.3%) 44,996 (20.0%)- Male: Widowed 281 (2.1%) 1,903 (1.8%) 3,921 (1.7%)- Male: Divorced 744 (5.6%) 6,007 (5.7%) 13,116 (5.8%)- Female: Never Married 1,968 (14.9%) 17,364 (16.4%) 37,363 (16.6%)- Female: Married Spouse Absent 209 (1.6%) 2,415 (2.3%) 4,746 (2.1%)- Female: Married Spouse Present 2,607 (19.7%) 21,280 (20.0%) 44,684 (19.9%)- Female: Widowed 1,036 (7.8%) 6,626 (6.2%) 13,754 (6.1%)- Female: Divorced 1,046 (7.9%) 7,627 (7.2%) 16,046 (7.1%)
2014 Estimated Population in Group Quarters
34 353 1,352
- Institutional Group Quarters 18 (52.9%) 244 (69.1%) 1,054 (78.0%)- Non-Institutional Group Quarters 16 (47.1%) 108 (30.6%) 298 (22.0%)
2014 Estimated Occupied Housing Units by Year Occ. Moved In
6,604 53,028 111,655
- Moved In 2005 or Later 1,906 (28.9%) 18,566 (35.0%) 42,215 (37.8%)- Moved In 2000-2004 1,164 (17.6%) 7,590 (14.3%) 15,982 (14.3%)- Moved In 1990-1999 1,160 (17.6%) 9,615 (18.1%) 20,484 (18.3%)- Moved In 1980-1989 804 (12.2%) 5,153 (9.7%) 10,366 (9.3%)- Moved In 1970-1979 544 (8.2%) 4,258 (8.0%) 8,498 (7.6%)- Moved In 1969 or Earlier 1,025 (15.5%) 7,846 (14.8%) 14,112 (12.6%)
©2014 - CBRE. This information has been obtained from sources believed reliable. We have not verified it and make no guarantee, warranty or representation about it. Any projections, opinions, assumptions or estimates used are for example only and do not represent the current or future performance of the property. You and your advisors should conduct a careful, independent investigation of the property to determine to your satisfaction the suitability of the property for your needs. Source: Nielsen
Prepared On: 4/28/2014 9:05:23 AM Page 5 of 10
Demographic Report
dEMOgrAph I c p rO f I L E
AreaOverview 20STNL - Krispy Kreme

ST
NL
- Krisp
y Kre
me
Gro
un
d Le
ase
| R
en
t Co
mp
ara
ble
s
03 Rent Comparables Rent Comparable Analysis Rent Comparables

$0.00
$5.00
$10.00
$15.00
$20.00
$25.00
1 2 3 4
$18.75
$24.62
$19.34 $19.04
Average Rent Square Foot
Comp Average Rental Rate
$20.44
Subject Rate $20.18
The average rental rate for ground leased fast food restaurants with a drive thru is $20.44 per square foot NNN;
therefore, the subject property, currently operating at $20.18 per square foot is operating in line with the market
average.
R E N T C O M PA R A B L E A N A LY S I S
rentcomparables 22STNL - Krispy Kreme
Building Name Address
Year Built
Building Size (SF)
Annual RentRent per
SFComments
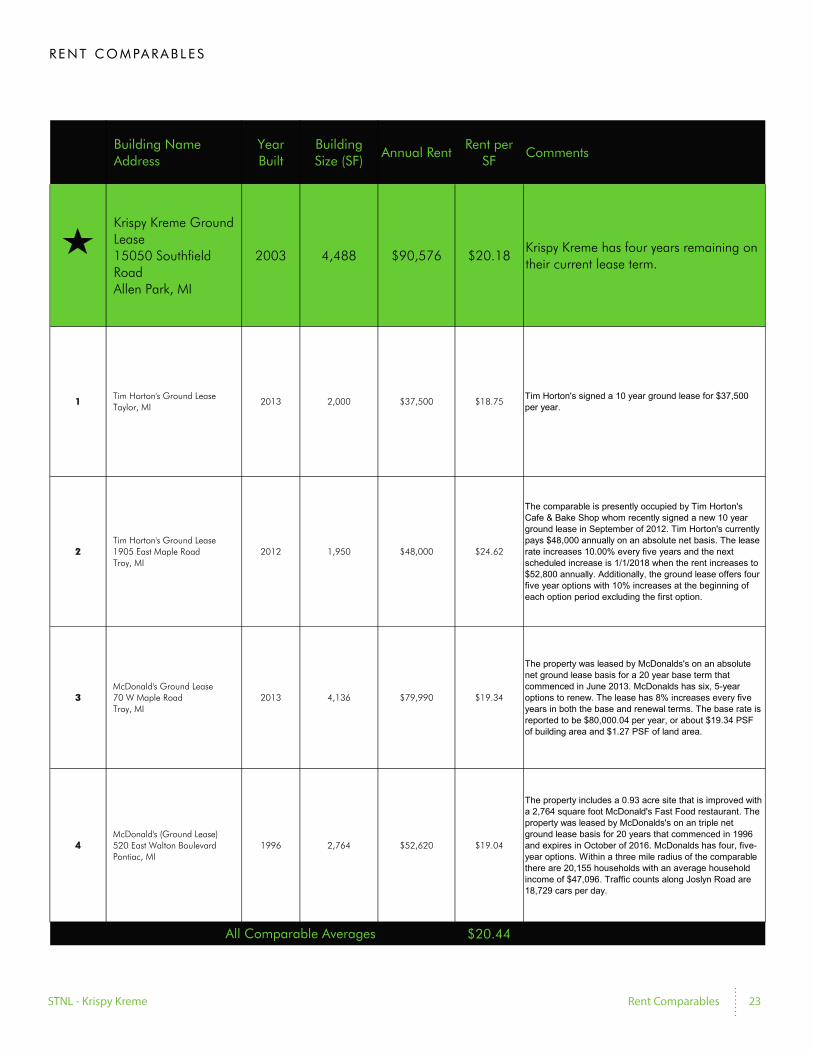
Krispy Kreme Ground Lease 15050 Southfield Road Allen Park, MI
2003 4,488 $90,576 $20.18Krispy Kreme has four years remaining on their current lease term.
1Tim Horton's Ground Lease Taylor, MI
2013 2,000 $37,500 $18.75Tim Horton's signed a 10 year ground lease for $37,500 per year.
2Tim Horton's Ground Lease 1905 East Maple Road Troy, MI
2012 1,950 $48,000 $24.62
The comparable is presently occupied by Tim Horton's Cafe & Bake Shop whom recently signed a new 10 year ground lease in September of 2012. Tim Horton's currently pays $48,000 annually on an absolute net basis. The lease rate increases 10.00% every five years and the next scheduled increase is 1/1/2018 when the rent increases to $52,800 annually. Additionally, the ground lease offers four five year options with 10% increases at the beginning of each option period excluding the first option.
3McDonald's Ground Lease 70 W Maple Road Troy, MI
2013 4,136 $79,990 $19.34
The property was leased by McDonalds's on an absolute net ground lease basis for a 20 year base term that commenced in June 2013. McDonalds has six, 5-year options to renew. The lease has 8% increases every five years in both the base and renewal terms. The base rate is reported to be $80,000.04 per year, or about $19.34 PSF of building area and $1.27 PSF of land area.
4McDonald's (Ground Lease) 520 East Walton Boulevard Pontiac, MI
1996 2,764 $52,620 $19.04
The property includes a 0.93 acre site that is improved with a 2,764 square foot McDonald's Fast Food restaurant. The property was leased by McDonalds's on an triple net ground lease basis for 20 years that commenced in 1996 and expires in October of 2016. McDonalds has four, five-year options. Within a three mile radius of the comparable there are 20,155 households with an average household income of $47,096. Traffic counts along Joslyn Road are 18,729 cars per day.
$20.44All Comparable Averages
R E N T C O M PA R A B L E S
rentcomparables 23STNL - Krispy Kreme

ST
NL
- Krisp
y Kre
me
Gro
un
d Le
ase
| S
ale
Co
mp
ara
ble
s
04 Sale Comparables Sale Comparable Analysis Sales Comparables

0.0%
1.0%
2.0%
3.0%
4.0%
5.0%
6.0%
7.0%
8.0%
9.0%
10.0%
1 2 3 4 5 6
6.00% 6.00% 6.25%
6.61% 6.27%
6.00%
Average Cap Rate
Average Cap Rate 6.19%
Subject Property 7.50%
The Krispy Kreme Ground Lease is currently being offered at a cap rate of 7.50%, compared to the comparables
shown, which are currently at a cap rate average of 6.19%.
S A L E C O M PA R A B L E A N A LY S I S
Salecomparables 25STNL - Krispy Kreme

$0
$100
$200
$300
$400
$500
$600
$700
1 2 3 4 5 6
$657
$563
$394
$312
$232
$317
Average Price per Square Foot
Comp Average Price per SF $413
Subject Price per SF $269
With an average price per square foot of $413 for comparable single tenant net leased restaurant sales, the subject
property, priced at $269 per square foot, is priced below the market average.
S A L E C O M PA R A B L E A N A LY S I S
Salecomparables 26STNL - Krispy Kreme

Building Name Address
Year Built
Building Size (SF)
Sale Date Sales Price Price/SFOccupancy
at SaleCap Rate
Term Remaining
(Years)Comments
Krispy Kreme Ground Lease 15050 Southfield Road Allen Park, MI
2003 4,488 $1,208,000 $269 100% 7.50% 4 Krispy Kreme has four years remaining on their current lease term.
1Dunkin Donuts/Baskin Robbins 898 SE Malabar Road Palm Bay, FL
2005 2,054 On Market $1,350,000 $657 100% 6.00% 2
This is a free standing 2,054 square foot Dunkin Donuts with drive-thru on 0.73 acres built in 2005. This is a corporate guaranteed NN property with limited Landlord Responsibilities. The landlord is responsible for roof and structure. Store Sales average over $1.3 million annually . The base rent is currently $81,000 annually and the initial 10 year lease term expires June, 2016. The next increase is to $91,000.00 annually in June, 2016.
2Dunkin Donuts 290 S Wickham Road Melbourne , FL
N/A 2,400 On Market $1,350,000 $563 100% 6.00% 2
This is a free standing 2,400 square foot Dunkin Donuts with drive-thru on 0.73 acres. This is a corporate guaranteed NN property with limited Landlord Responsibilities. The landlord is responsible for roof and structure. Base rent is currently $81,000.00 annually with the initial 10 year lease term expiring June, 2016. Next increase is to $91,000 annually commencing June, 2016.
3Tim Horton's (Ground Lease) 1905 E. Maple Road Troy, MI
2012 1,950 9/1/2013 $768,000 $394 100% 6.25% 9
The property is 100% occupied by Tim Horton's Cafe & Bake Shop on a new 10 year ground lease commencing in September of 2012. Tim Horton's currently pays $48,000 annually on an absolute net basis. The lease rate increases 10.00% every five years and the next scheduled increase is 1/1/2018 when the rent increases to $52,800 annually. Additionally, the ground lease offers four five year options with 10% increases at the beginning of each option period excluding the first option. The comparable is located on a primary commercial thoroughfare surrounded by Industrial and office properties.
4Tim Hortons (Ground Lease) 2635 Orchard Lake Road Sylvan Lake , MI
2009 2,010 12/1/2012 $628,000 $312 100% 6.61% 7
The land is currently leased to Tim Hortons who developed a 2,010 square foot restaurant on the site in 2009. The site transferred in December 2012 for $628,000. The overall capitalization rate, based on in-place income, was 6.61%. Based on the listing broker’s website and CoStar, the absolute net ground lease commenced in December 2009 for a 10 year term. At the time of sale, there was approximately seven years remaining on the initial lease term.
5Tim Horton's (Ground Lease) 41 West Nine Mile Road Hazel Park, MI
1967 2,200 12/1/2012 $510,000 $232 100% 6.27% 8
The property includes a 0.46 acre site that is improved with a 2,200 square foot Tim Horton's Fast Food restaurant. The property was ground leased by Tim Horton’s on an absolute net term for 10 years that commenced in December of 2010 and expires on November 30, 2020. The tenant has five, five-year options to renew with 10% rental increases in the option periods. Within a three mile radius of the comparable there are 59,489 households with an average household income of $53,312. Traffic counts along Nine Mile Road are 11,180 cars per day.
6McDonald's (Ground Lease) 520 East Walton Boulevard Pontiac, MI
1996 2,764 11/1/2012 $877,000 $317 100% 6.00% 4
The property includes a 0.93 acre site that is improved with a 2,764 square foot McDonald's Fast Food restaurant. The property was leased by McDonalds's on an triple net ground lease basis for 20 years that commenced in 1996 and expires in October of 2016. McDonalds has four, five-year options. Within a three mile radius of the comparable there are 20,155 households with an average household income of $47,096. Traffic counts along Joslyn Road are 18,729 cars per day.
$413 6.19% 5 Average Term RemainingAll Comparable Averages
S A L E C O M PA R A B L E S
Salecomparables 27STNL - Krispy Kreme
ST
NL
- Krisp
y Kre
me
Gro
un
d Le
ase
| F
ina
ncia
ls
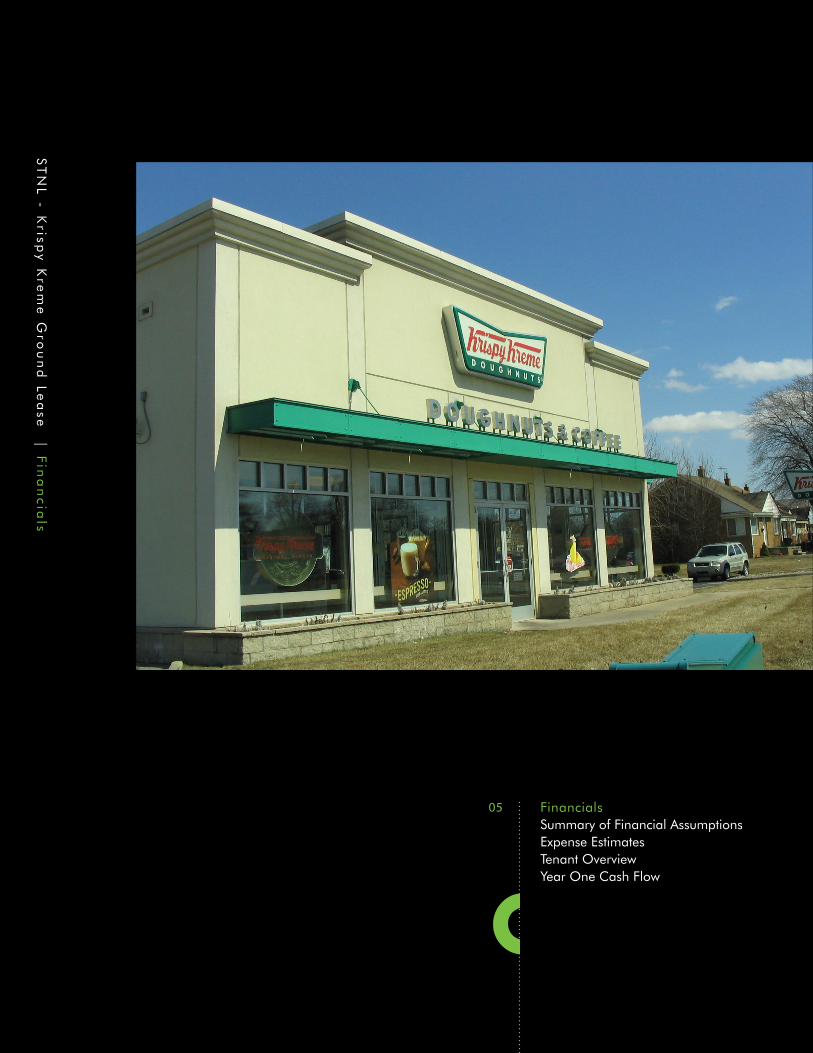
05 Financials Summary of Financial Assumptions Expense Estimates Tenant Overview Year One Cash Flow

F I N A N C I A L OV E R V I E W
FINANCIAL OVERVIEW
Sales Price $1,208,000
Down Payment-Proposed Financing
All Cash
Price Per Square Foot $269.16
CAP Rate 7.50%
FinancingAll Cash Transaction / Offered Free and Clear of Existing Financing
BuILdINg INFORmATION
Address
Krispy Kreme Retail & Distribution Center 15050 Southfield RoadAllen Park, MI 48101
Building Square Feet 4,488 Square Feet
Property TypeSTNL Free Standing Retail Building with Drive Thru
Year Built 2003
Land Area 1.24 Acres
Type of Ownership Fee Simple
Current Occupancy 100%
RENTAL RATE
Annual Rent Rent per SF
Current Thru 10/31/2018
$90,576 $20.18
Renewal Options: The lease is equipped with four, five year renewal options with rental increases based on CPI at each option term. The notification period is four months.
LEASE TERm
Commencement Date
10/27/2003
Expiration Date 10/31/2018
Term Remaining 4+ Years Remain
Lease Type
Absolute NNN Ground Lease. Tenant responsible for procuring and paying direct all real estate taxes, insurance and common area maintenance as well as repairs and replacement of the roof and structure.
financials 29STNL - Krispy Kreme

L E A S E A B S T R AC T
LEASE ABSTRACT
Tenant Name Krispy Kreme Doughnut Corporation
Initial Lease Terms 10/27/2003 - 10/31/2018
Years Remaining on Current Term
4+ years
Rental Escalations None Remaining During Initial Lease Term
Lease Type Absolute NNN Ground Lease
Rent to be Net to Landlord
All costs, expenses and obligations and every kind and nature whatsoever relating to the Demised Premises shall be paid by the Tenant beginning on the Commencement Date.
Real Estate Taxes Tenant shall, during the term of this lease, as additional rent, pay and discharge punctually all taxes as they shall become due and payable.
Improvements, Repairs, Additions and Replacements
Tenant shall, at all times during the term of this lease, and at its own cost and expense, keep and maintain or cause to be kept and maintained in repair and good condition, all buildings and improvements at any time erected on the Demised Premises. Landlord shall not be required to furnish any services or facilities or to make any improvements, repairs or alterations in or to the Demised Premises during the term of this lease.
Insurance
At all times during the term of this Lease, tenant shall at its sole expense the following types of insurance coverage: procure and maintain General Insurance, Casualty Insurance, Liability Insurance, Liability Insurance, Employers Liability/Workers Compensation.
Demised Premises
On the last day of the lease, tenant shall surrender the Demised Premises, and the buildings and permanent improvements. If the landlord elects to require Tenant to demolish and remove all improvements, it shall do so at least 90 days prior to the expiration of the lease term.
Option to renewTenant shall have four, five-year options to extend the lease. The tenant shall provide notice of four months prior to the expiration date. The rental rate shall be subject to an upward adjustment based on CPI per option period.
Right of First Refusal
Tenant is granted a right of first refusal during the term of the lease for purchase of the Premises. In the event landlord receives an offer for the purchase of the Premises, landlord shall give notice to tenant of the terms of such offer and Tenant shall have 15 days to determine if tenant desires to purchase the premises.
financials 30STNL - Krispy Kreme

T E N A N T OV E R V I E W
TENANT INFORmATION
Tenant Name Krispy Kreme Doughnut Corporation
Parent Company Krispy Kreme Doughnuts, Inc.
Tenant Ownership Public
Stock Symbol KKD
Credit Rating Not Rated According to Standard & Poor’s
Head Quarters Winston-Salem, North Carolina
Number of Stores 812 (including franchisee stores)
Number of Employees Approximately 4,300
Website www.krispykreme.com
Company Profile
The tenant on the lease is Krispy Kreme Doughnut Corporation (“KKDC”) which is the most significant principal operating subsidiary of Krispy Kreme Doughnuts, Inc. (“KKDI”).
Krispy Kreme (NYSE: KKD) is an international retailer of premium-quality sweet treats, including its signature Original Glazed doughnut. Headquartered in Winston-Salem, N.C., the Company has offered the highest-quality doughnuts and great-tasting coffee since it was founded in 1937. Krispy Kreme is proud of its fund-raising program, which for decades has helped non-profit organizations raise millions of dollars in needed funds. Today, Krispy Kreme can be found in over 800 locations in more than 20 countries around the world.
As of February 3, 2013, there were 239 Krispy Kreme stores operated domestically in 38 states and in the District of Columbia, and there were 509 shops in 21 other countries around the world. Of the 748 total stores, 295 were factory stores and 453 were satellites. The Company operates in four segments: Company Stores, domestic franchise stores, international franchise stores, and the KK Supply Chain
financials 31STNL - Krispy Kreme

Price $1,208,000Down Payment All Cash Rentable Square Feet 4,488Price per Square Foot $269.16CAP Rate 7.50%
Income 6/2014 - 5/2015 Per Month Per SF
Base Rent
100% 4,488 SF $90,576 $7,548 $20.18Vacant Space 0.0% 0 SF $0 $0 $0.00
Total Base Rent $90,576 $7,548 $20.18
Scheduled Base Rental Revenue $90,576 $7,548 $20.18
Expense Reimbursement Revenue - Tenant To Procure and Pay DirectInsurance $0 $0 $0.00Common Area Maintenance $0 $0 $0.00Real Estate Taxes $0 $0 $0.00Management Fee $0 $0
Total Expense Reimbursement Revenue $0 $0 $0.00
Gross Potential Income $90,576 $7,548 $20.18
Effective Gross Income $90,576 $7,548 $20.18
Operating Expense Estimates Insurance $0 $0 $0.00Common Area Maintenance $0 $0 $0.00Real Estate Taxes $0 $0 $0.00Total Common Area Expenses $0 $0 $0.00
Management Fee 0.0% $0 $0 $0.00
Total Expenses $0 $0 $0.00
Net Operating Income $90,576 $7,548 $20.18
Krispy Kreme Ground Lease
Year One Cash Flow Estimates
Krispy Kreme Ground Lease 10/27/2003 - 10/31/2018 4+ Years Remain
As Is Analysis
Y E A R O N E C A S H F LO W
financials 32STNL - Krispy Kreme financials

: : O F F E R I N G M E M O R A N D U M
Ca
pita
l Ma
rke
ts | In
vestm
en
t Pro
pe
rties
For More Information, Please Contact:
: : Bill O’Connor Senior Vice President
248.351.2045 [email protected]
: : David Hesano Vice President
248.351.2014 [email protected]
© 2014 CB Richard Ellis, Inc. The information contained in this document has been obtained from sources believed reliable. While CB Richard Ellis, Inc. does not doubt its accuracy, CB Richard Ellis, Inc. has not verified it and makes no guarantee, warranty or representation about it. It is your responsibility to independently confirm its accuracy and completeness. Any projections, opinions, assumptions or estimates used are for example only and do not represent the current or future performance of the property. The value of this transaction to you depends on tax and other factors which should be evaluated by your tax, financial and legal advisors. You and your advisors should conduct a careful, independent investigation of the property to determine to your satisfaction the suitability of the property for your needs.