kissing cuisines: exploring worldwide culinary habits on ... · kissing cuisines: exploring...
TRANSCRIPT
Kissing Cuisines:Exploring Worldwide Culinary Habits on the Web
Sina Sajadmanesh†, Sina Jafarzadeh†, Seyed Ali Ossia†, Hamid R. Rabiee†, Hamed Haddadi‡,Yelena Mejova?, Mirco Musolesi], Emiliano De Cristofaro], Gianluca Stringhini]
†Sharif University of Technology ‡Queen Mary University of London ?Qatar Computing Research Institute ]UCL
ABSTRACTAs food becomes an important part of modern life, recipes sharedon the web are a great indicator of civilizations and culinary at-titudes in different countries. Similarly, ingredients, flavors, andnutrition information are strong signals of the taste preferences ofindividuals from various parts of the world. Yet, we do not have athorough understanding of these palate varieties.
In this paper, we present a large-scale study of recipes publishedon the Web and their content, aiming to understand cuisines andculinary habits around the world. Using a database of more than157K recipes from over 200 different cuisines, we analyze ingredi-ents, flavors, and nutritional values which distinguish dishes fromdifferent regions, and use this knowledge to assess the predictabil-ity of recipes from different cuisines. We then use country healthstatistics to understand the relation between these factors and healthindicators of different nations, such as obesity, diabetes, migration,and health expenditure. Our results confirm the strong effects ofgeographical and cultural similarities on recipes, health indicators,and culinary preferences between countries around the world.
1. INTRODUCTIONNowadays, the importance of food and eating goes far beyond a
means to survive. Often regarded as a social construct, food has be-come an essential part of modern day life. New jargon has enteredour vocabulary as expressions like “foodie”, “food porn”, or “foodtourism”, hint at the buzz around the entertainment arising fromour culinary experiences. With the rise of social media, and theproliferation of always-on always-connected devices, this gobblingrevolution is not confined to our kitchens, restaurants, and foodstalls, but naturally breaks out on the social web. Sharing picturesof one’s food has become a growing passion for both tourists andlocals [16], and dedicated food searching and sharing apps, alongwith recipe websites and the ubiquitous social presence of celebritychefs, have all contributed to a thriving culture and passion aroundfood worldwide.
Around the world, different cuisines are naturally intertwinedwith cultures, traditions, passions, and religion of individuals liv-ing in different countries and continents. Sushi, curry, kebab, pasta,tacos – these are just examples of foods conventionally associatedwith specific countries, as are specific cuisines and ingredients.Different dietary habits around the world are also closely relatedto various health statistics, including cancer incidence [3], deathrates [13], cardiovascular complications [18], and obesity [14].
Although there are many common beliefs about cuisines,recipes, and their ingredients, it is still unclear what types of ingre-dients are unique in/about different countries, what factors makecuisines similar to each other (e.g., in terms of ingredients or fla-vors), and how these factors are related to individuals’ health. With
this motivation in mind, in this paper, we set to investigate the wayin which ingredients relate to different cuisines and recipes, as wellas the geographic and health significances thereof. We use a fewdatasets, including 157K recipes from over 200 cuisines crawledfrom Yummly, BBC Food data, and country health statistics.Overview & Contributions. First, we characterize differentcuisines around the world by their ingredients and flavors. Then,we train a Support Vector Machine classifier and use deep learningmodels to predict a cuisine from its ingredients. This also enablesus to discover the similarity across different cuisines based on theiringredients – e.g., Chinese and Japanese – while, intuitively, theymight be considered different. We look at the diversity of ingredi-ents in recipes from different countries and compare them to geo-graphic and human migration statistics. We also measure the rela-tionship between the nutrition value of the recipes vis-à-vis publichealth statistics such as obesity and diabetes.Paper Organization. The rest of the paper is organized as fol-lows. In Section 2, we present the datasets used in our evaluation,then Section 3 presents an analysis of the diversity of the ingredi-ents around the world, looking at geographic diversity patterns ofcuisines and notable ingredients in particular ones. In Section 4,we look at the similarity between the cuisines based on their ingre-dients and flavors, and use these results to train machine-learningclassifiers for ingredient-based cuisine prediction models in Sec-tion 5. In Section 6, we correlate the nutrition values of recipes fordifferent countries with their public health statistics. After review-ing related work in Section 7, the paper concludes in Section 8.
2. DATASETSOur study relies on a number of datasets, namely, a large set
of recipes collected from Yummly, a list of ingredients compiledby BBC Food, and country health statistics. In this section, wedescribe these datasets in detail.
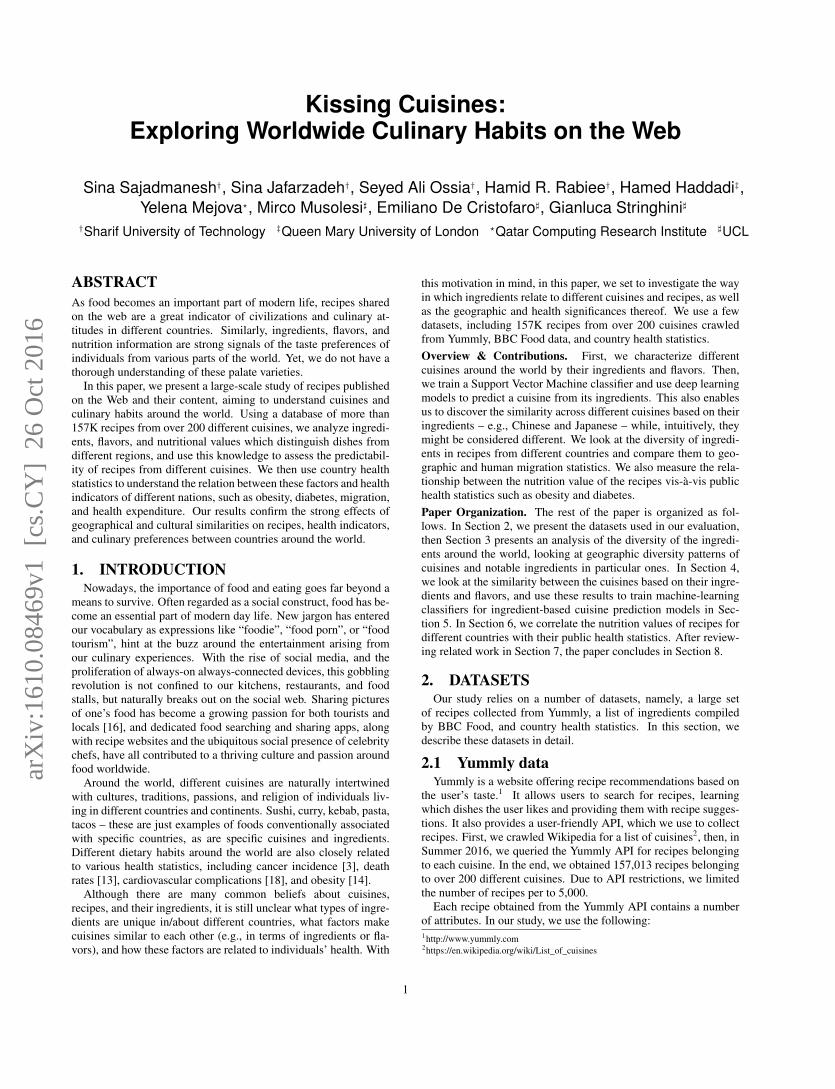
2.1 Yummly dataYummly is a website offering recipe recommendations based on
the user’s taste.1 It allows users to search for recipes, learningwhich dishes the user likes and providing them with recipe sugges-tions. It also provides a user-friendly API, which we use to collectrecipes. First, we crawled Wikipedia for a list of cuisines2, then, inSummer 2016, we queried the Yummly API for recipes belongingto each cuisine. In the end, we obtained 157,013 recipes belongingto over 200 different cuisines. Due to API restrictions, we limitedthe number of recipes per to 5,000.
Each recipe obtained from the Yummly API contains a numberof attributes. In our study, we use the following:1http://www.yummly.com2https://en.wikipedia.org/wiki/List_of_cuisines
1
arX
iv:1
610.
0846
9v1
[cs
.CY
] 2
6 O
ct 2
016
1. Ingredients: Each recipe contains a list of the ingredientsthat are required to prepare it. Since Yummly acts as a recipeaggregator from various cooking sites, the ingredients do notalways appear with the same wording. In fact, it is verycommon to see the same ingredient written with differentspellings or by using a different terminology. We overcomethese issues through a standardization process described inSection 2.2.
2. Flavors: Recipes are identified by six flavors, specifically,saltiness, sourness, sweetness, bitterness, savoriness, andspiciness. These scores are on a range of 0 to 1.
3. Rating: Users are encouraged to provide a rating, from 1 to5, for the recipes that they try. From the Yummly API, weretrieve the average review rating for each recipe.
4. Nutrition: Unfortunately, the Yummly search API does notdirectly provide nutritional information for the recipes. As aconsequence, we designed a simple web crawler to fetch thecorresponding web page for each recipe in our dataset, andextract information on the amount of protein, fat, saturatedfat, sodium, fiber, sugar, and carbohydrate of a recipe (perserving), as well as calories.
Although some ingredients appear in other languages (e.g., Ger-man, French, etc), the recipes presented here are mostly in English;hence it is possible that some more authentic or niche local recipesmight be missing from our dataset. However, considering the num-ber of recipes and a large cut-off threshold introduced later on, weare confident this does not significantly affect our analysis. More-over, authors of the recipes might not represent the entire popula-tion, given the fact that they are likely to be tech-savvy. This mightintroduce a potential bias in the dataset, but at the same time, thispotential issue is compensated by its richness in terms of the vari-ety of dishes from different countries available in it as structuredinformation.
2.2 BBC Food DataBBC Food3 is a part of the BBC website providing information
about recipes, ingredients, chefs, cuisines, and other informationrelated to cooking and dishes from all BBC programs. In Summer2016, we crawled all the ingredients from the BBC Food website,collecting about 1,000 ingredients, which we used to organize andstandardize the ingredients in the Yummly dataset. The standard-ization process is as follows:
(i) We extracted all the 11,000 ingredients from the Yummlydataset and performed a preliminary data cleaning, i.e., remov-ing measurement units (mass, volume, etc), numbers, punctuationmarks, and other symbols.
(ii) Due to the multilingualism of the Yummly data, we used theGoogle Translate API to perform automatic language detection andtranslation of all the Yummly ingredients to English.
(iii) We used the BBC list of ingredients as a reference, andmapped all possible ingredients from the Yummly list to it.
(iv) As not all ingredients from the Yummly list were success-fully mapped, we merged the similar ones into groups, and the in-gredients in each group were manually mapped to the its represen-tative ingredient.
Overall, this process yields about 3,000 standardized ingredients.
2.3 Country health statisticsAs diet is directly related to the health of individuals, we also set
to relate Yummly statistics to real-world health data. To this end,3http://www.bbc.co.uk/food/
we will use the diabetes prevalence estimates from World Devel-opment Indicators by The World Bank4, the health expenditure asa percentage of total GDP from The World Bank5, and the obesityprevalence from the World Health Organization6 in the countriesto which the cuisines are mapped, using the most recent availabledata, which is from 2014.
3. INGREDIENTS AROUND THE WORLDIn this section, we provide a characterization of the ingredients
used in dishes from all over the world. First, we investigate thediversity of ingredients in different countries. Next, we define theconcept of “complexity” of a dish in terms of its ingredients andlook at how complexity changes around the world. Finally, we dis-cuss a series of case studies of most notable and significant ingre-dients in some eminent cuisines.
3.1 Diversity of ingredientsAiming to investigate the diversity of ingredients in dishes of a
cuisine, we set to answer the following questions:
1. How many different unique ingredients are used in total indishes of each country? In other words, what is the numberof unique ingredients the people of a country have ever usedto prepare a culinary dish? The answer to this question iswhat we refer to as the global diversity.
2. How different are the dishes of an individual country relativetogether in terms of their ingredients combination? In otherwords, do different dishes usually share some ingredients ortheir ingredients are almost different? The answer to thisquestion is what we call local diversity.
The local and global diversity of ingredients in a country de-pend on many parameters including the geographical location, cli-matic conditions, agricultural situation, or even the amount of im-migration which directly influences the diversity of culinary cul-tures. The calculation of the global diversity is performed in twosteps. Since the number of recipes per different cuisines are vari-able, we first set a fixed number of 100 recipes per cuisine, dis-carding cuisines containing fewer number of recipes, and samplingfrom cuisines containing more number of recipes uniformly at ran-dom, to have an equal number of recipes in all cuisines. This resultsin a final set of 82 different cuisines each containing 100 recipes.We then map the result obtained for each cuisine to its correspond-ing country. Here, some countries are mapped with more than onecuisine. For such countries, we record the average result over theirassociated cuisines.
To calculate the local diversity, we look at each cuisine as a prob-ability distribution over all standard ingredients. By counting thetotal number of occurrences of each ingredient in all recipes of aparticular cuisine, and then normalizing the values such that theysum to one, we obtain the ingredient distribution for that cuisine.We then calculate the entropy of these distributions as the localdiversity of their corresponding cuisines. The entropy of the in-gredient distribution measures the unpredictability of ingredientsused in the dishes. Therefore, the higher the entropy of the in-gredient distribution of a particular cuisine, the more different theingredients combination of its recipes, and thus the higher the localdiversity. To preserve the smoothness of the ingredient distribu-tions, we again keep the 82 cuisines with more than 100 recipes.After calculating the local diversity for each cuisine, we follow the4http://data.worldbank.org/indicator/SH.STA.DIAB.ZS5http://data.worldbank.org/indicator/SH.XPD.TOTL.ZS6http://apps.who.int/gho/data/view.main.2450A
2

180 195 210 225 240 255 270 285
(a) Global diversity
4.20 4.35 4.50 4.65 4.80 4.95 5.10 5.25
(b) Local diversity
Figure 1: Diversity of ingredients around the world
same procedure as for the global diversity to map the cuisine-basedresults to countries.
Figure 1 shows the local diversity and the global diversity ofingredients for different countries around the world. According tothe figure, we can see that the local and global diversities have ameaningful correlation with each other. The countries with highglobal diversity have also high local diversity, and countries withlow global diversity have low local diversity as well. This happensbecause as the global diversity increases, people will have moreoptions to choose as the ingredients for their foods, so they canprepare relatively different dishes.
Another interesting trend observable in Figure 1 is that coun-tries like the United States and Australia which usually accept ahigh number of immigrants, have a relatively high global diversity.Regarding this, we hypothesized that the number of immigrantscoming to a country must have an influence on the ingredient di-versity of that country. This is mainly due to immigrants bringingtheir native culinary culture with themselves, which in turn makesthe cuisines of their target country richer. To investigate this fact,we collected the net migration data from the World Bank7 whichshows the difference between the total number of immigrants andemigrants during a time period. We correlated the global diversitywith the average net migration from 1960 to 2016. To this end, wefitted a polynomial curve to the data points considering the globaldiversity and the net migration. The result is shown in Figure 2. Aswe expect, the figure indicates that an increase in the net migrationwould result in an increase in the global diversity of ingredients.
3.2 Complexity of dishesAnother interesting concept about the culinary preferences of
different countries is the complexity of dishes. The complexity of adish is simply the number of unique ingredients required to prepareit. Accordingly, a cuisine is more complex than another one if itsdishes are proportionally more complex than another one’s.
Formally speaking, each cuisine is associated with the complex-ity distribution of its dishes. For a sample cuisine, this distribution,namely P (X = i), specifies the probability of a dish from thatcuisine to have exactly i unique ingredients. This way, the cumu-lative complexity distribution (CCD) will give us an insight aboutthe complexity of dishes in a particular cuisine.
Figure 3 shows the cumulative complexity distribution (CCD)for Norwegian, Russian, Spanish, Tunisian, and Lao as an exam-ple. From the figure we can see that the CCD for Norwegian cui-sine grows faster than the others, while for Lao, it is relatively7http://data.worldbank.org/indicator/SM.POP.NETM
160 180 200 220 240 260 280 300
−8.00
−6.00
−4.00
−2.00
0.00
2.00
4.00
·104
Global Diversity
Net
Mig
ratio
n
Figure 2: Relation between the global ingredient diversity and the net mi-gration
0 5 10 15 20 25 300.00
0.20
0.40
0.60
0.80
1.00
# ingredients
Cum
ulat
ive
Prob
abili
ty
Norwegian
Russian
Spanish
Tunisian
Lao
Figure 3: Cumulative complexity distribution for a number of samplecuisines.
slower. This means that Lao dishes are more complex than Nor-wegian ones. Thus for each cuisine, the area under its CCD is in-versely related to its complexity. Hence, we use the reciprocal of
3
0.0146 0.0148 0.0150 0.0152 0.0154 0.0156 0.0158 0.0160
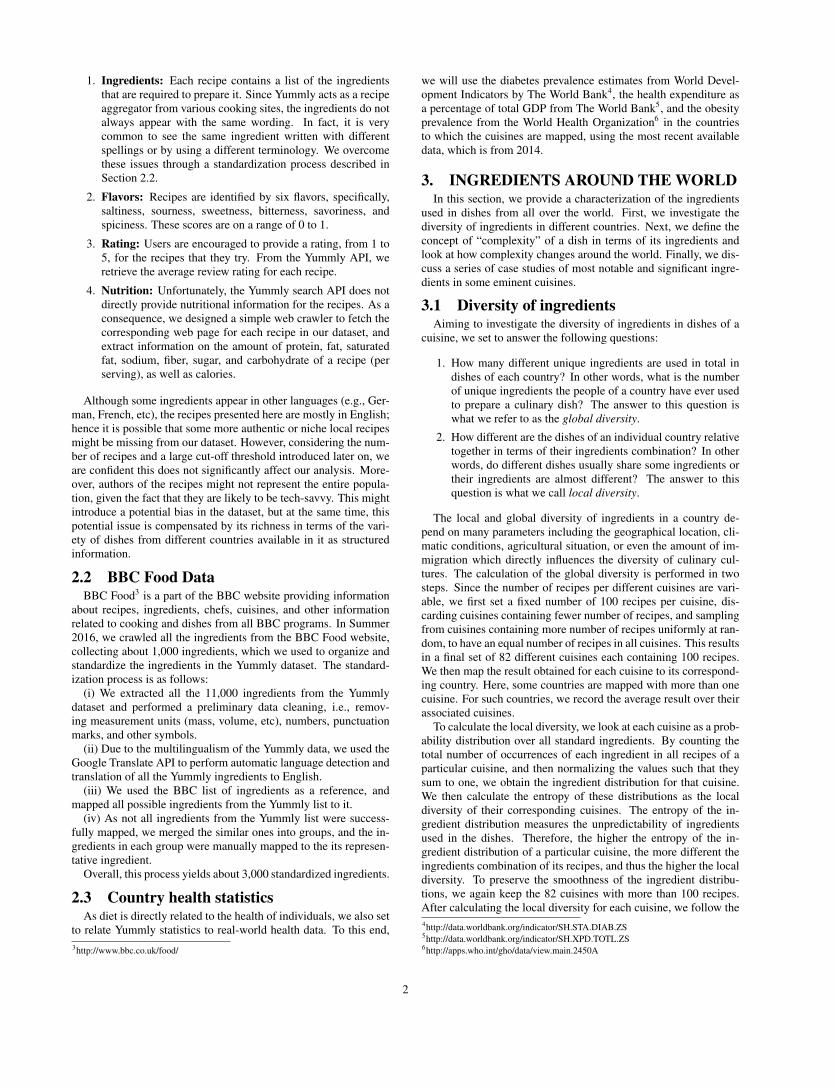
Figure 4: Complexity of dishes around the world
the area under CCD as a measure of complexity for a cuisine.Figure 4 shows the complexity of dishes for different countries
around the world. Here we have used the same approach as inSection 3.1 to map the cuisines to countries. We can see from thefigure that except for some cases, the complexities are consistentwith the diversities. This is due to the fact that as the number ofavailable ingredients increases in a country (which is the result ofglobal diversity,) people can leverage more ingredients and preparemore complex dishes. The exceptions here are China and India, twocountries with the most population in the world. the complexity ofdishes in these countries are relatively high, while their ingredientsdiversity is low. This can be the result of overpopulation or specialculinary culture in these countries. Perhaps, these countries hador have good chefs that could cook more complex foods with theavailable ingredients!
3.3 Notable ingredientsSpecific cuisines are mostly associated with different sets of in-
gredients due to the geographical locality of the ingredients. In thissection, we study the most notable ingredient associated to somewell-known cuisines using our dataset of recipes from Yummly.
We use the Term Frequency - Inverse Document Frequency (TF-IDF) calculation to find notable ingredients in each cuisine. In thisapproach, each ingredient is considered as an atomic word, and thecollection of all the ingredients appeared within a cuisine is con-sidered as a document. A TF-IDF calculation leads us to find theweight of different ingredients in the corpus of documents. Thisway, the importance of each ingredient within each cuisine is spec-ified.
Figure 5 shows the top-50 most notable ingredients for Italian,Indian, and Mexican cuisines as a case study. We also looked atother similar cases, which we do not present here due to space con-straints. According to the figure, the bigger the name of an ingredi-ent, the more distinctive it is in its associated cuisine. We verifiedthe soundness of results using Google Trends8 service. For ex-ample, the term “Mozzarella” has the highest search frequency inItaly. Similarly, “Garam masala” is the most popular food additivein India according to its search volume.
4. CUISINE SIMILARITYHow do we determine the similarities between Korean and
Japanese cuisine? What makes the Middle Eastern dishes seemsimilar to one another? In this section we answer these questionsusing a number of different methods and data.8https://www.google.com/trends
4.1 Ingredient-based similaritiesAt first, we calculate the similarity between different cuisines
based on the ingredients used in their recipes. To this end, weconvert cuisines into vector space, representing each cuisine as avector where each element indicates the frequency of an specificingredient in that cuisine. Thereby, for each cuisine we obtain aningredient-based feature vector which we leverage to calculate thesimilarity between different cuisines using the following metrics:
1. Jensen-Shannon divergence: If we normalize eachingredient-based feature vector such that the elements of avector sum to one, then each vector will represent a probabil-ity distribution over standard ingredients. This way, we canuse the distance measures proposed for probability distribu-tions like Jensen-Shannon divergence. The Jensen-Shannondivergence between two probability distributions P and Q isdefined as:
JS(P,Q) =1
2[KL(P ‖M) +KL(Q ‖M)] (1)
where M = 12(P + Q) and KL(P ‖ M) is the Kullback-
Leibler divergence from M to P . Since the Jensen-Shannondivergence is a distance measure between 0 and 1, we take1−JS(P,Q) as the similarity measure between two cuisineswith their associated ingredient distributions P and Q. Wehave used Jensen-Shannon divergence instead of the simplerKullback-Leibler divergence because KL(P ‖ Q) goes toinfinity when for an ingredient like i, P (i) is non-zero whileQ(i) is. This case almost always happens in our data dueto the geographical locality of ingredients. Therefore, weturned to Jensen-Shannon divergence which does not havethis drawback.
2. TF-IDF similarity: Another measure we use to calculatethe similarity between two cuisines is the well-known TF-IDF. Using this measure, we followed the approach describedin section 3.3 to calculate the weight of ingredients in eachcuisine. This way, each cuisine is represented as a vectorwhere each of its elements indicates the representative powerof the corresponding ingredient for that cuisine. The TF-IDF similarity between two cuisines is then simply the cosinesimilarity between their associated TF-IDF vectors.
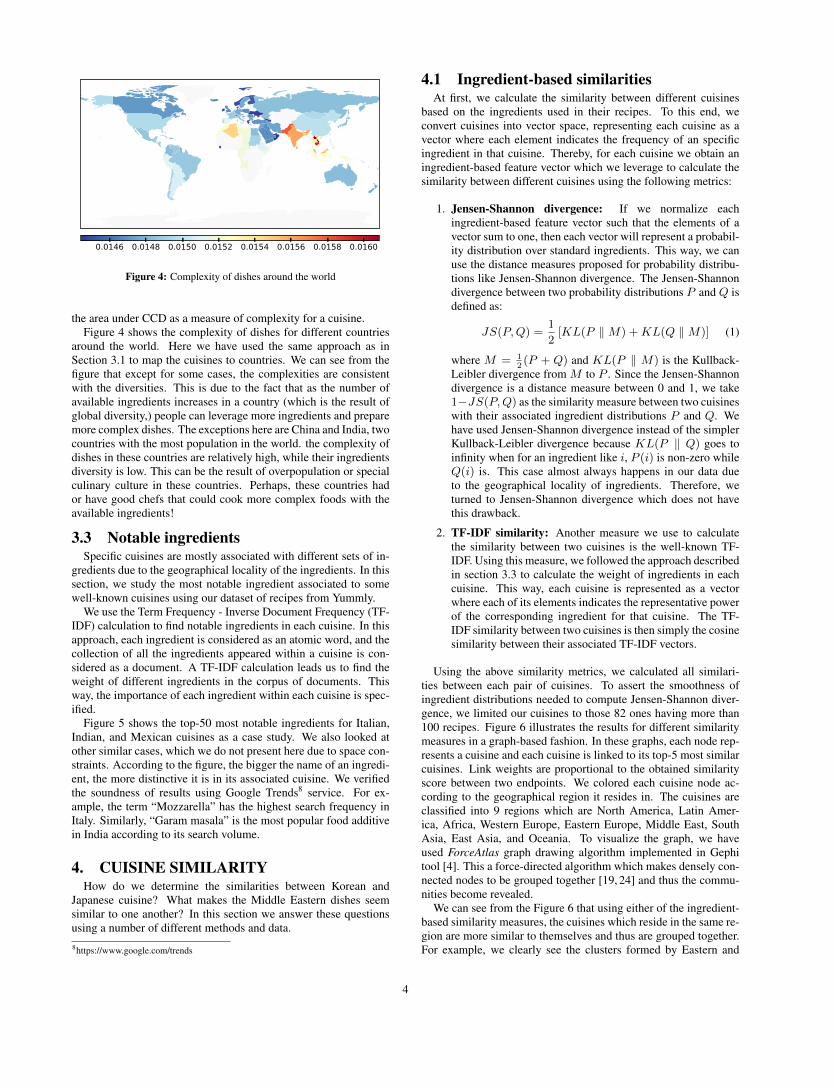
Using the above similarity metrics, we calculated all similari-ties between each pair of cuisines. To assert the smoothness ofingredient distributions needed to compute Jensen-Shannon diver-gence, we limited our cuisines to those 82 ones having more than100 recipes. Figure 6 illustrates the results for different similaritymeasures in a graph-based fashion. In these graphs, each node rep-resents a cuisine and each cuisine is linked to its top-5 most similarcuisines. Link weights are proportional to the obtained similarityscore between two endpoints. We colored each cuisine node ac-cording to the geographical region it resides in. The cuisines areclassified into 9 regions which are North America, Latin Amer-ica, Africa, Western Europe, Eastern Europe, Middle East, SouthAsia, East Asia, and Oceania. To visualize the graph, we haveused ForceAtlas graph drawing algorithm implemented in Gephitool [4]. This a force-directed algorithm which makes densely con-nected nodes to be grouped together [19, 24] and thus the commu-nities become revealed.
We can see from the Figure 6 that using either of the ingredient-based similarity measures, the cuisines which reside in the same re-gion are more similar to themselves and thus are grouped together.For example, we clearly see the clusters formed by Eastern and
4

(a) Italian (b) Indian (c) Mexican
Figure 5: Notable ingredients in three famous cuisines.
Southern Asian, Middle Eastern and African, Latin American, andWestern European cuisines. Furthermore, due to the similarity ofcultures in Europe and North America, and even Oceania, it can beeseen that clusters formed by the cuisines of these regions greatlyoverlap with each other.
4.2 Flavor-based similaritiesIn addition to the ingredient-based similarity, we calculate the
similarity between cuisines in terms of the flavors provided in theirrecipes. This can help us understand how different cuisines arerelated to each other based on the taste of their dishes. As wementioned in section 2.1, each recipe contains the flavor scores forsix different flavors including saltiness, sourness, sweetness, bitter-ness, savoriness, and spiciness. To calculate the similarity betweencuisines based on these flavors, like what we did for ingredient-based similarity, we consider each cuisine as a distribution overdifferent flavors. Regarding the fact that different flavors of a recipeare correlated to each other – for instance, a dish can hardly be bothsweet and spicy simultaneously – and due to the continuity of fla-vor scores, we hypothesize that the flavor scores are sampled froma multivariate Gaussian distribution, where each covariate corre-sponds a particular flavor. Considering this assumption, we fit amultivariate Gaussian distribution to each cuisine so that each cui-sine become associated by a mean vector representing the averageof flavor scores over all of its recipes, and a covariance matrix rep-resenting how flavors change relative to each other within that cui-sine.
After fitting a multivariate Gaussian distribution to each cuisineusing maximum likelihood estimation, we use Kullback-Leiblerdivergence to measure the distance between the distributions as-sociated to each pair of cuisines. Since Kullback-Leibler di-vergence is and asymmetric distance measure, for each pair ofcuisines with P and Q as their corresponding flavor distributions,we use
[12(KL(P ‖ Q) +KL(Q ‖ P ))
]−1 as a symmetric simi-larity measure between them.
Figure 7 shows the result of flavor-based similarity between dif-ferent cuisines in a graph-based manner. We followed exactly thesame steps as in Figure 6 to draw the graph, except that we usedflavor-based similarity between cuisines. We can see from the fig-ure that even though the flavors are not as much discriminant as in-gredients, still we can observe some geographical patterns. For in-stance the clusters formed by Eastern Asian, Middle Eastern, LatinAmerican, and Northern European cuisines are clear in this caseas well. But what is obvious here is the fact that although thereis a sense of taste similarity between the dishes from neighboringcountries, the flavors are naturally shared all over the world.
AfricanAfrican
AmericanAmerican
ArabArabArmenianArmenian
AsianAsian
AustralianAustralian
AustrianAustrian
BasqueBasque
BelgianBelgian
BerberBerber
BrazilianBrazilianBritishBritishBulgarianBulgarian
CajunCajun
CanadianCanadian
CantoneseCantonese
CaribbeanCaribbean
ChileanChilean
ChineseChinese
ColombianColombian
CornishCornish
CroatianCroatian
CubanCuban
DanishDanish
DutchDutchEgyptianEgyptian
EnglishEnglish
EthiopianEthiopian
FinnishFinnish
FrenchFrench
GermanGermanGreekGreek
HongHong
HungarianHungarian
IndianIndian
IndonesianIndonesian
IranianIranian
IrishIrish
IsraeliIsraeliItalianItalian
Italian-AmericanItalian-American
JamaicanJamaican
JapaneseJapanese
KoreanKorean
LaoLao
Latin-AmericanLatin-American
LebaneseLebanese
LouisianaLouisiana
MalaysianMalaysian
MediterraneanMediterranean
MexicanMexicanMongolianMongolian
MoroccanMoroccan
NorwegianNorwegianOceanicOceanic
PeruvianPeruvian
PhilippinePhilippine
PolishPolish
PortuguesePortuguese
RomanianRomanian
RussianRussian
ScottishScottish
SicilianSicilian
SpanishSpanish
SwedishSwedish
SwissSwiss
ThaiThai
TunisianTunisian
TurkishTurkish
UkrainianUkrainian
VietnameseVietnamese
WelshWelsh
Figure 7: Graph of flavor-based similarity between different cuisines. Re-gional colors are the same as in Figure 6.
Acc F1
0.40
0.45
0.50
0.55
0.60
0.65
0.70
0.75
SVM DNN
(a) Cuisine Prediction
Acc F1
0.40
0.45
0.50
0.55
0.60
0.65
0.70
0.75
SVM DNN
(b) Region Prediction
Figure 8: The prediction performance of different methods under differentsettings.
5. CUISINE PREDICTIONIn this section we address the question of “How good we can
predict a recipe’s cuisine, given its ingredients?”. To answer thisquestion, We use two different classifiers, Support Vector Machine
5
North America Latin America Western Europe Eastern Europe Middle EastAfrica South Asia East Asia Oceania
AfricanAfricanAmericanAmerican
ArabArabArmenianArmenian
AsianAsian
AustralianAustralian
AustrianAustrian
AztecAztec
BasqueBasque
BelgianBelgian
BengaliBengali
BerberBerber
BrazilianBrazilian
BritishBritish
BulgarianBulgarianCajunCajun
CambodianCambodian
CanadianCanadian
CantoneseCantonese
CaribbeanCaribbean
ChileanChilean
ChineseChinese
ColombianColombian
CornishCornish
CroatianCroatian
CubanCuban
DanishDanish
DutchDutch
EgyptianEgyptian
EnglishEnglish
EthiopianEthiopian
FinnishFinnish
FrenchFrench
GermanGerman
GreekGreek
HongHong
HungarianHungarian
IcelandicIcelandic IndianIndian
IndonesianIndonesian
IranianIranian
IrishIrish
IsraeliIsraeli
ItalianItalianItalian-AmericanItalian-American
JamaicanJamaican
JapaneseJapanese
KoreanKorean
LaoLao
Latin-AmericanLatin-American
LebaneseLebanese
LouisianaLouisiana
MalaysianMalaysian
MalteseMaltese
MediterraneanMediterranean
MexicanMexican
MongolianMongolian
MoroccanMoroccan
NorwegianNorwegian
OceanicOceanicPeruvianPeruvian
PhilippinePhilippine
PolishPolish PortuguesePortuguese
PunjabiPunjabi
RomanianRomanian
RussianRussian
Saint-LucianSaint-Lucian
ScottishScottish
SicilianSicilian
SpanishSpanish
Sri-LankanSri-Lankan
SwedishSwedish
SwissSwissSyrianSyrian
TaiwaneseTaiwanese ThaiThai
TunisianTunisian
TurkishTurkish
UkrainianUkrainian
VietnameseVietnamese
WelshWelsh
(a) Jensen-Shannon divergence
AfricanAfrican
AmericanAmerican
ArabArab
ArmenianArmenian
AsianAsian
AustralianAustralianAustrianAustrian
AztecAztec
BasqueBasque
BelgianBelgian
BengaliBengali
BerberBerber
BrazilianBrazilian
BritishBritish
BulgarianBulgarian
CajunCajun
CambodianCambodian
CanadianCanadian
CantoneseCantonese
CaribbeanCaribbean
ChileanChilean
ChineseChinese
ColombianColombian
CornishCornishCroatianCroatian
CubanCuban
DanishDanish
DutchDutch
EgyptianEgyptian
EnglishEnglish
EthiopianEthiopian
FinnishFinnish
FrenchFrench
GermanGerman
GreekGreek
HongHong
HungarianHungarian
IcelandicIcelandic
IndianIndian
IndonesianIndonesian
IranianIranian
IrishIrish
IsraeliIsraeli
ItalianItalian
Italian-AmericanItalian-American
JamaicanJamaican
JapaneseJapanese
KoreanKorean
LaoLao
Latin-AmericanLatin-American
LebaneseLebanese
LouisianaLouisiana
MalaysianMalaysian
MalteseMaltese
MediterraneanMediterranean
MexicanMexican
MongolianMongolian
MoroccanMoroccan NorwegianNorwegian
OceanicOceanic
PeruvianPeruvian
PhilippinePhilippine
PolishPolish
PortuguesePortuguese
PunjabiPunjabi
RomanianRomanian
RussianRussian
Saint-LucianSaint-Lucian
ScottishScottish
SicilianSicilian
SpanishSpanish
Sri-LankanSri-Lankan
SwedishSwedish
SwissSwiss
SyrianSyrian
TaiwaneseTaiwanese
ThaiThai
TunisianTunisian
TurkishTurkish
UkrainianUkrainian
VietnameseVietnamese
WelshWelsh
(b) TF-IDF similarity
Figure 6: Graph of ingredient-based similarity between cuisines with different similarity measures.
(SVM), which is previously used in [22] for the same task, andDeep Neural Network (DNN), which is popular nowadays for clas-sification purposes. To extract a feature vector for each recipe, weconvert it into a boolean bag of words vector, considering each in-gredient as an atomic word. Therefore, each recipe is representedas a vector with a length equal to the total number of ingredients,which is 3,286. The labeling of recipes are performed according tothe following settings:
1. Cuisine Prediction: Each recipe is labeled to its cuisine. weconsider 82 different cuisines having more than 100 recipesas different classes, resulting in about 100K recipes.
2. Region Prediction: Each recipe is labeled according to oneof the 9 geographical regions where its cuisine belongs to.The regions are considered the same as in section 4. Thisresults to have about 157K recipes.
For multi-class classification with SVM, we use linear kernelwith one vs. rest coding. The class imbalance problem is resolvedwith adjusting the weight of each cuisine inversely proportionalto its frequency. The implementation is done using Scikit-learnmachine learning library in python [5]. For DNN, we use Kerasdeep learning library [7] and create four dense hidden layers anda softmax output layer. Each of the first two hidden layers con-sists of 1000 neurons, and the two last ones each have 500 neurons.Dropout regularization [21] is used for all of the hidden layers. Weuse Adadelta [26] with default parameters as the optimizer. Forboth methods we take 80% of the data as training set and the re-maining 20% as the test set. The prediction performance of bothmethods are evaluated under accuracy and F-measure.
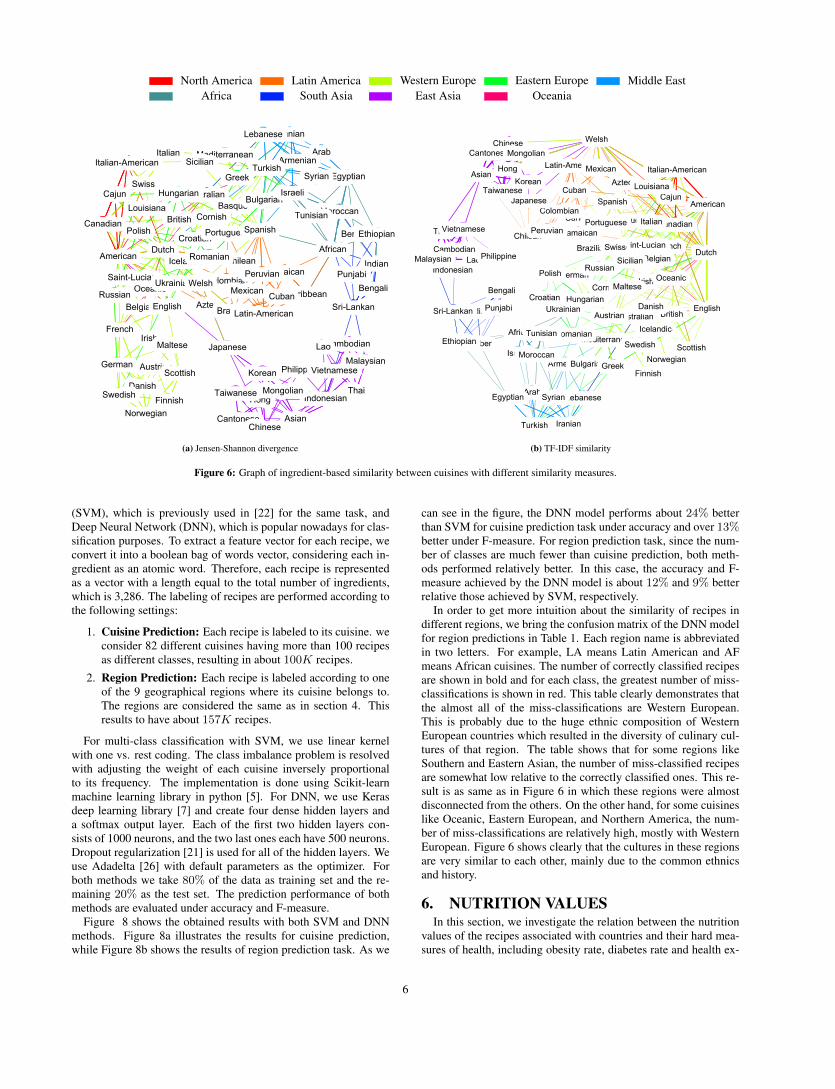
Figure 8 shows the obtained results with both SVM and DNNmethods. Figure 8a illustrates the results for cuisine prediction,while Figure 8b shows the results of region prediction task. As we
can see in the figure, the DNN model performs about 24% betterthan SVM for cuisine prediction task under accuracy and over 13%better under F-measure. For region prediction task, since the num-ber of classes are much fewer than cuisine prediction, both meth-ods performed relatively better. In this case, the accuracy and F-measure achieved by the DNN model is about 12% and 9% betterrelative those achieved by SVM, respectively.
In order to get more intuition about the similarity of recipes indifferent regions, we bring the confusion matrix of the DNN modelfor region predictions in Table 1. Each region name is abbreviatedin two letters. For example, LA means Latin American and AFmeans African cuisines. The number of correctly classified recipesare shown in bold and for each class, the greatest number of miss-classifications is shown in red. This table clearly demonstrates thatthe almost all of the miss-classifications are Western European.This is probably due to the huge ethnic composition of WesternEuropean countries which resulted in the diversity of culinary cul-tures of that region. The table shows that for some regions likeSouthern and Eastern Asian, the number of miss-classified recipesare somewhat low relative to the correctly classified ones. This re-sult is as same as in Figure 6 in which these regions were almostdisconnected from the others. On the other hand, for some cuisineslike Oceanic, Eastern European, and Northern America, the num-ber of miss-classifications are relatively high, mostly with WesternEuropean. Figure 6 shows clearly that the cultures in these regionsare very similar to each other, mainly due to the common ethnicsand history.
6. NUTRITION VALUESIn this section, we investigate the relation between the nutrition
values of the recipes associated with countries and their hard mea-sures of health, including obesity rate, diabetes rate and health ex-
6

0 5 10 15 20 25 30 35 40 45 50 55 60 65
2.00
4.00
6.00
8.00
10.00
12.00
14.00
16.00
18.00
20.00
22.00
24.00
26.00
28.00
30.00
Carbohydrate
Calorie
Fat
Protein
Sugar
(a) Nutritions vs obesity
0 5 10 15 20 25 30 35 40 45 50 55 60 65
5.00
5.50
6.00
6.50
7.00
7.50
8.00
8.50
9.00
9.50
10.00
10.50
Carbohydrate
Calorie
Fat
Protein
Sugar
(b) Nutritions vs diabetes
0 5 10 15 20 25 30 35 402.00
3.00
4.00
5.00
6.00
7.00
8.00
9.00
10.00
Carbohydrate
Calorie
Fat
Protein
Sugar
(c) Nutritions vs health expenditure
Figure 9: Smoothed Average Vector of nutritions and health measures.
Table 1: Confusion Matrix for DNN Region Prediction
Prediction Outcome
LA SA OC EA AF WE ME EE NA
Act
ualC
lass
LA 1888 15 2 84 25 455 13 33 92SA 18 961 1 52 16 40 17 5 3OC 21 2 177 21 3 119 5 6 18EA 49 37 2 5211 13 342 26 24 51AF 31 23 2 28 704 136 57 7 15WE 453 49 21 660 85 9430 165 541 557ME 35 24 9 107 72 366 634 78 17EE 51 30 1 58 29 885 41 1320 94NA 127 7 5 128 22 1045 16 60 1508
penditure. Since the recipes are categorized by their cuisine butthe health measures are reported by countries, we need to map eachcuisine to one or more countries beforehand. To this end, we assigneach cuisine to the countries that include that cuisine geographi-cally or semantically. For example, we mapped the Kurdish cuisineto the countries: Iran, Syria, Iraq and Turkey because the Kurdistanregion is divided between those countries. As another instance, wemapped the Italian-American cuisine to both Italy and USA coun-tries because the cuisine represents both the Italian and Americanfood culture. This way, we consider the recipes of each country asall of the recipes of the cuisines that belong to that country.
For each country, we calculate the average calorie, protein, fat,carbohydrate and sugar values over its recipes. We used the fol-lowing three methods to study the relation between nutritions andhealth statistics:
1. Pearson Correlation: Pearson method calculates the linearcorrelation between the vectors u and v, where each elementof u represents a nutrition value (e.g. sugar value) for a spe-cific country, and each element of v represents a health mea-sure (e.g. obesity rate) of that country.
2. Kendall-Tau Correlation: Kendall-Tau correlation is usedto measure the ordinal correlation between u and v vectors.
3. Smoothed Average Vector: Given two vectors u and v, con-sider the vector u is sorted in ascending order as u′. Thenv′ would be the the reordered version of v to match the u′.Smoothed Average Vector for vectors u and v is a vector s
with the same size where s[i] =∑i
j=1 v′[i]
i. This measure
captures the health trends with regards to the increases inconsumption of nutritions. Moreover, It is also robust againstthe noisy variations of the underlying data.
Table 2 shows the correlation between different nutritions and the
hard measures of health. As the results suggest, nutrition valuesshow a significant correlation with the health related measures ofcountries. The dominant positive correlated nutritions are the sugarand carbohydrate. It is intuitive because those are the main ele-ments of snack meals like cakes, creams, etc which can contributeto the health difficulties and the consequence expenditures eventu-ally. On the other side, protein value shows strong negative correla-tion with the level of obesity and diabetes in societies. Noticeably,the positive impact of high-protein diets on losing weight is fre-quently studied in the literature [11]. Figure 9 exhibits the SAVfor different nutritions and health measures. The trend of the dia-grams endorses that including the countries with high average nu-trition values (except protein) results in an increase in the averagehealth measures (e.g. average obesity). Proteins show completelyopposite patterns as expected. Including the countries with highprotein diets decrease the rate of health difficulties (e.g. obesity ordiabetes). A noticeable trait in both Table 2 and Figure 9 is thatthe correlations and trends are more highlighted in the obesity re-sults rather than the diabetes and health expenditure. The reasonis that the diabetes and health expenditure are more elaborate phe-nomena than the obesity. For example, in addition to consumingfoods, there are a variety of other genetic and environmental fac-tors that may cause the diabetes. Remarkably, the genetic suscepti-bility of different ethnics varies so much [9]. As another example,over intaking of proteins itself can lead to an spectrum of adverseeffects [8]. Therefore the relation of protein intaking and healthexpenditures of the countries is not as clear as the relation betweenobesity and proteins.
7. RELATED WORKRecently, public health has been increasingly analyzed through
the lens of the web and social media. We refer the reader to [6]for an overview of the recent research in this area. Abbar et al. [1]relate food mentions on Twitter conversations to the obesity and di-abetes rates, using caloric values, and find a high correlation (coef-ficient 0.77) between caloric values of tweets and obesity values invarious states in the US. Low-obesity areas of USA have also beenshown to be more socially active on Instagram (posting commentsand likes) than those from high-obesity ones by Mejova et al. [17],who present a large-scale analysis of pictures taken at 164K restau-rants in the US.
Ahn et al. [2] study culture-specific ingredient connections, cre-ating a “flavor network” from a dataset of about 56K recipes andrelating them to the geographical groupings of countries. Simi-lar “flavor-based” food pairing studies are conducted on cuisines
7
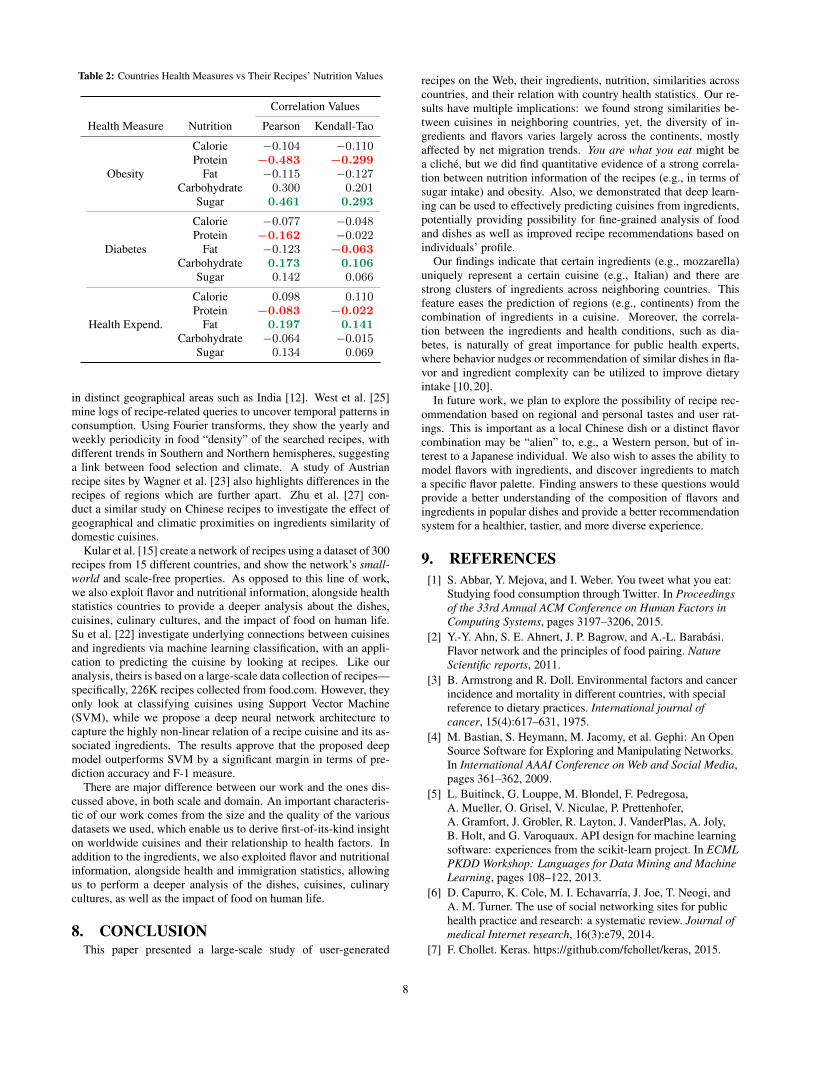
Table 2: Countries Health Measures vs Their Recipes’ Nutrition Values
Correlation Values
Health Measure Nutrition Pearson Kendall-Tao
Obesity
Calorie −0.104 −0.110Protein −0.483 −0.299
Fat −0.115 −0.127Carbohydrate 0.300 0.201
Sugar 0.461 0.293
Diabetes
Calorie −0.077 −0.048Protein −0.162 −0.022
Fat −0.123 −0.063Carbohydrate 0.173 0.106
Sugar 0.142 0.066
Health Expend.
Calorie 0.098 0.110Protein −0.083 −0.022
Fat 0.197 0.141Carbohydrate −0.064 −0.015
Sugar 0.134 0.069
in distinct geographical areas such as India [12]. West et al. [25]mine logs of recipe-related queries to uncover temporal patterns inconsumption. Using Fourier transforms, they show the yearly andweekly periodicity in food “density” of the searched recipes, withdifferent trends in Southern and Northern hemispheres, suggestinga link between food selection and climate. A study of Austrianrecipe sites by Wagner et al. [23] also highlights differences in therecipes of regions which are further apart. Zhu et al. [27] con-duct a similar study on Chinese recipes to investigate the effect ofgeographical and climatic proximities on ingredients similarity ofdomestic cuisines.
Kular et al. [15] create a network of recipes using a dataset of 300recipes from 15 different countries, and show the network’s small-world and scale-free properties. As opposed to this line of work,we also exploit flavor and nutritional information, alongside healthstatistics countries to provide a deeper analysis about the dishes,cuisines, culinary cultures, and the impact of food on human life.Su et al. [22] investigate underlying connections between cuisinesand ingredients via machine learning classification, with an appli-cation to predicting the cuisine by looking at recipes. Like ouranalysis, theirs is based on a large-scale data collection of recipes—specifically, 226K recipes collected from food.com. However, theyonly look at classifying cuisines using Support Vector Machine(SVM), while we propose a deep neural network architecture tocapture the highly non-linear relation of a recipe cuisine and its as-sociated ingredients. The results approve that the proposed deepmodel outperforms SVM by a significant margin in terms of pre-diction accuracy and F-1 measure.
There are major difference between our work and the ones dis-cussed above, in both scale and domain. An important characteris-tic of our work comes from the size and the quality of the variousdatasets we used, which enable us to derive first-of-its-kind insighton worldwide cuisines and their relationship to health factors. Inaddition to the ingredients, we also exploited flavor and nutritionalinformation, alongside health and immigration statistics, allowingus to perform a deeper analysis of the dishes, cuisines, culinarycultures, as well as the impact of food on human life.
8. CONCLUSIONThis paper presented a large-scale study of user-generated
recipes on the Web, their ingredients, nutrition, similarities acrosscountries, and their relation with country health statistics. Our re-sults have multiple implications: we found strong similarities be-tween cuisines in neighboring countries, yet, the diversity of in-gredients and flavors varies largely across the continents, mostlyaffected by net migration trends. You are what you eat might bea cliché, but we did find quantitative evidence of a strong correla-tion between nutrition information of the recipes (e.g., in terms ofsugar intake) and obesity. Also, we demonstrated that deep learn-ing can be used to effectively predicting cuisines from ingredients,potentially providing possibility for fine-grained analysis of foodand dishes as well as improved recipe recommendations based onindividuals’ profile.
Our findings indicate that certain ingredients (e.g., mozzarella)uniquely represent a certain cuisine (e.g., Italian) and there arestrong clusters of ingredients across neighboring countries. Thisfeature eases the prediction of regions (e.g., continents) from thecombination of ingredients in a cuisine. Moreover, the correla-tion between the ingredients and health conditions, such as dia-betes, is naturally of great importance for public health experts,where behavior nudges or recommendation of similar dishes in fla-vor and ingredient complexity can be utilized to improve dietaryintake [10, 20].
In future work, we plan to explore the possibility of recipe rec-ommendation based on regional and personal tastes and user rat-ings. This is important as a local Chinese dish or a distinct flavorcombination may be “alien” to, e.g., a Western person, but of in-terest to a Japanese individual. We also wish to asses the ability tomodel flavors with ingredients, and discover ingredients to matcha specific flavor palette. Finding answers to these questions wouldprovide a better understanding of the composition of flavors andingredients in popular dishes and provide a better recommendationsystem for a healthier, tastier, and more diverse experience.
9. REFERENCES[1] S. Abbar, Y. Mejova, and I. Weber. You tweet what you eat:
Studying food consumption through Twitter. In Proceedingsof the 33rd Annual ACM Conference on Human Factors inComputing Systems, pages 3197–3206, 2015.
[2] Y.-Y. Ahn, S. E. Ahnert, J. P. Bagrow, and A.-L. Barabási.Flavor network and the principles of food pairing. NatureScientific reports, 2011.
[3] B. Armstrong and R. Doll. Environmental factors and cancerincidence and mortality in different countries, with specialreference to dietary practices. International journal ofcancer, 15(4):617–631, 1975.
[4] M. Bastian, S. Heymann, M. Jacomy, et al. Gephi: An OpenSource Software for Exploring and Manipulating Networks.In International AAAI Conference on Web and Social Media,pages 361–362, 2009.
[5] L. Buitinck, G. Louppe, M. Blondel, F. Pedregosa,A. Mueller, O. Grisel, V. Niculae, P. Prettenhofer,A. Gramfort, J. Grobler, R. Layton, J. VanderPlas, A. Joly,B. Holt, and G. Varoquaux. API design for machine learningsoftware: experiences from the scikit-learn project. In ECMLPKDD Workshop: Languages for Data Mining and MachineLearning, pages 108–122, 2013.
[6] D. Capurro, K. Cole, M. I. Echavarría, J. Joe, T. Neogi, andA. M. Turner. The use of social networking sites for publichealth practice and research: a systematic review. Journal ofmedical Internet research, 16(3):e79, 2014.
[7] F. Chollet. Keras. https://github.com/fchollet/keras, 2015.
8

[8] I. Delimaris. Adverse effects associated with protein intakeabove the recommended dietary allowance for adults. ISRNnutrition, 2013, 2013.
[9] S. C. Elbein. Genetics factors contributing to type 2 diabetesacross ethnicities. Journal of diabetes science andtechnology, 3(4):685–689, 2009.
[10] G. D. Foster, A. P. Makris, and B. A. Bailer. Behavioraltreatment of obesity. The American journal of clinicalnutrition, 82(1):230S–235S, 2005.
[11] T. L. Halton and F. B. Hu. The effects of high protein dietson thermogenesis, satiety and weight loss: a critical review.Journal of the American College of Nutrition,23(5):373–385, 2004.
[12] A. Jain, N. Rakhi, and G. Bagler. Analysis of food pairing inregional cuisines of india. PloS one, 10(10):e0139539, 2015.
[13] A. Keys, A. Mienotti, M. J. Karvonen, C. Aravanis,H. Blackburn, R. Buzina, B. Djordjevic, A. Dontas,F. Fidanza, M. H. Keys, et al. The diet and 15-year death ratein the seven countries study. American journal ofepidemiology, 124(6):903–915, 1986.
[14] M. Kratz, T. Baars, and S. Guyenet. The relationshipbetween high-fat dairy consumption and obesity,cardiovascular, and metabolic disease. European journal ofnutrition, 52(1):1–24, 2013.
[15] D. K. Kular, R. Menezes, and E. Ribeiro. Using networkanalysis to understand the relation between cuisine andculture. In Network Science Workshop (NSW), 2011 IEEE,pages 38–45, 2011.
[16] Y. Mejova, S. Abbar, and H. Haddadi. Fetishizing food indigital age:# foodporn around the world. In InternationalAAAI Conference on Web and Social Media (ICWSM 2016),2016.
[17] Y. Mejova, H. Haddadi, A. Noulas, and I. Weber. #FoodPorn:Obesity patterns in culinary interactions. In Proceedings ofthe 5th International Conference on Digital Health 2015,
pages 51–58, 2015.[18] M. Michel de Lorgeril, P. Salen, J.-L. Martin, I. Monjaud,
J. Delaye, and N. Mamelle. Mediterranean diet, traditionalrisk factors, and the rate of cardiovascular complicationsafter myocardial infarction. Heart failure, 11:6, 1999.
[19] A. Noack. Modularity clustering is force-directed layout.Phys. Rev. E, 79:026102, Feb 2009.
[20] N. Regulating. Judging nudging: can nudging improvepopulation health? Bmj, 342:263, 2011.
[21] N. Srivastava, G. E. Hinton, A. Krizhevsky, I. Sutskever, andR. Salakhutdinov. Dropout: a simple way to prevent neuralnetworks from overfitting. Journal of Machine LearningResearch, 15(1):1929–1958, 2014.
[22] H. Su, T.-W. Lin, C.-T. Li, M.-K. Shan, and J. Chang.Automatic recipe cuisine classification by ingredients. InProceedings of the 2014 ACM Joint Conference on Pervasiveand Ubiquitous Computing, pages 565–570, 2014.
[23] C. Wagner, P. Singer, and M. Strohmaier. Spatial andTemporal Patterns of Online Food Preferences. InProceedings of the Companion Publication of the 23rdInternational Conference on World Wide Web Companion,WWW Companion ’14, pages 553–554. International WorldWide Web Conferences Steering Committee, 2014.
[24] L. Waltman, N. J. van Eck, and E. C. Noyons. A unifiedapproach to mapping and clustering of bibliometricnetworks. Journal of Informetrics, 4(4):629–635, 2010.
[25] R. West, R. W. White, and E. Horvitz. From cookies tocooks: insights on dietary patterns via analysis of web usagelogs. In WWW, 2013.
[26] M. D. Zeiler. Adadelta: an adaptive learning rate method.arXiv preprint arXiv:1212.5701, 2012.
[27] Y.-X. Zhu, J. Huang, Z.-K. Zhang, Q.-M. Zhang, T. Zhou,and Y.-Y. Ahn. Geography and similarity of regional cuisinesin china. PloS one, 8(11):e79161, 2013.
9