kinetics of the opal-a to opal-ct phase transition in low - and … · kinetics of the opal-a to...
TRANSCRIPT
Kinetics of the opal-A to opal-CT phase transition in low- and high-TOC siliceous
shale source rocks
Danica Dralus Stanford University, now at BP
Mike Lewan USGS, Denver, CO (retired)
Ken Peters Schlumberger, Stanford University
BPSM Annual Meeting November 12, 2014 Stanford, California
Outline
• Introduce opal-CT/quartz transition in the oil patch
• Recap opal-CT to quartz experiments*
• Describe new opal-A to opal-CT experiments
• Report preliminary opal-A to opal-CT kinetics data
2
*For additional details, see my dissertation (Stanford, Aug 2013): Chemical interactions between silicates and their pore fluids: How they affect rock physics properties from atomic to reservoir scales
BPSM affiliates meeting, Nov 12, 2014
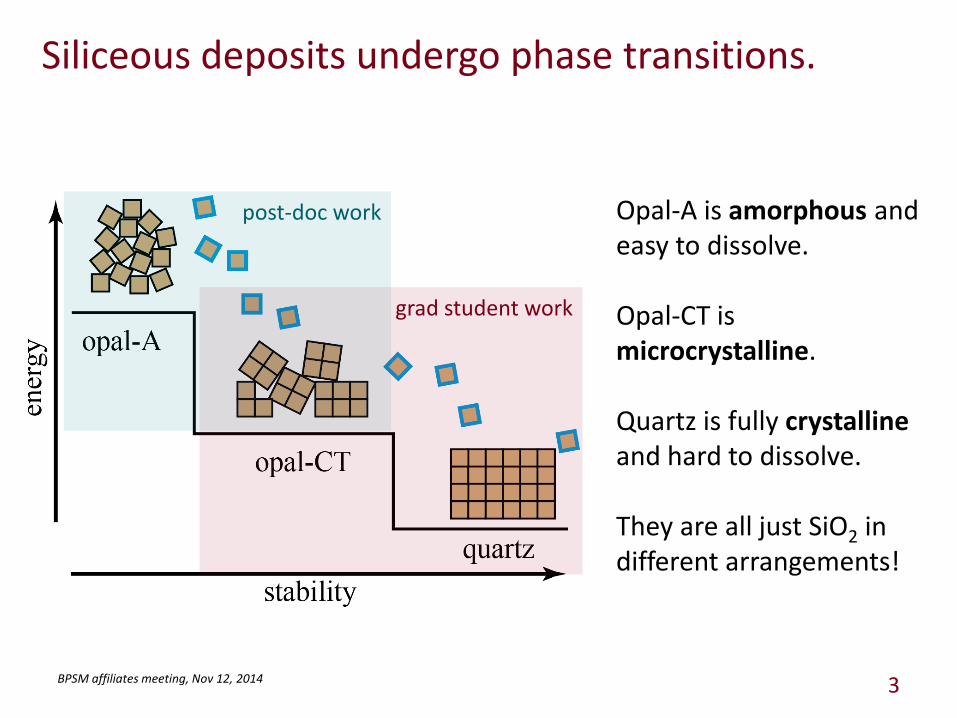
Siliceous deposits undergo phase transitions.
3
Opal-A is amorphous and easy to dissolve. Opal-CT is microcrystalline. Quartz is fully crystalline and hard to dissolve. They are all just SiO2 in different arrangements!
grad student work
post-doc work
BPSM affiliates meeting, Nov 12, 2014
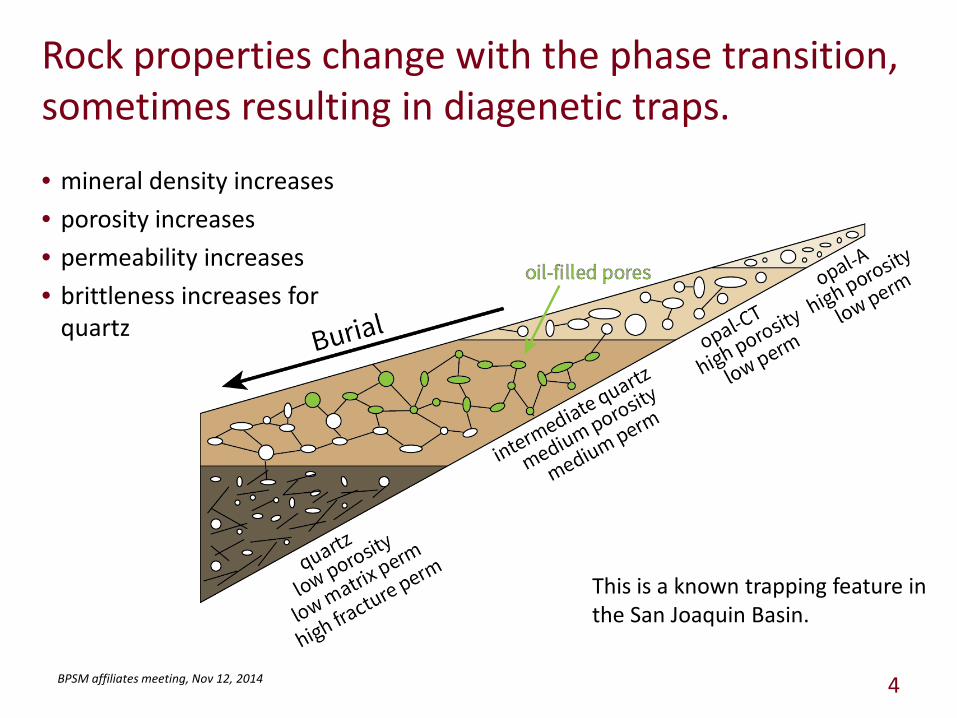
Rock properties change with the phase transition, sometimes resulting in diagenetic traps.
4
This is a known trapping feature in the San Joaquin Basin.
• mineral density increases • porosity increases • permeability increases • brittleness increases for
quartz
BPSM affiliates meeting, Nov 12, 2014
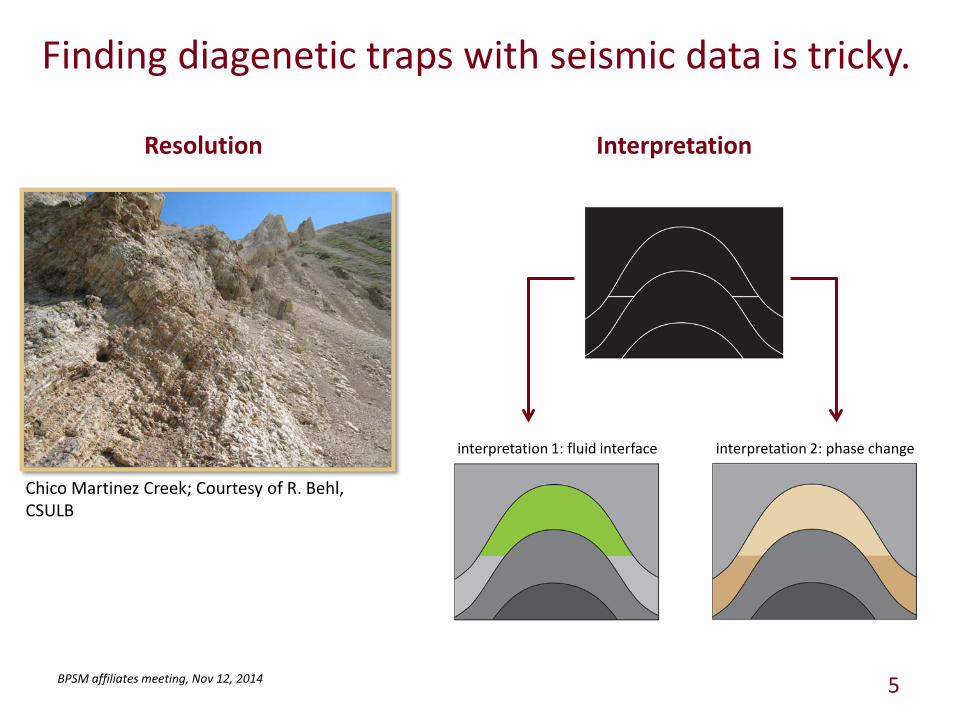
Finding diagenetic traps with seismic data is tricky.
5
Chico Martinez Creek; Courtesy of R. Behl, CSULB
Resolution Interpretation
BPSM affiliates meeting, Nov 12, 2014
interpretation 1: fluid interface interpretation 2: phase change
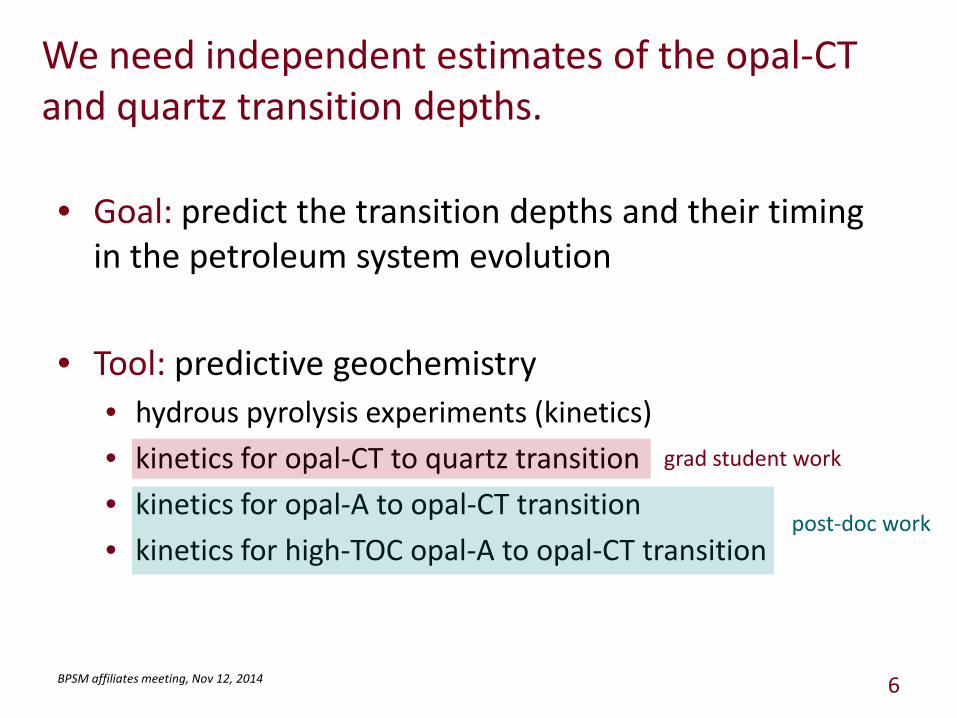
We need independent estimates of the opal-CT and quartz transition depths.
• Goal: predict the transition depths and their timing in the petroleum system evolution
• Tool: predictive geochemistry • hydrous pyrolysis experiments (kinetics) • kinetics for opal-CT to quartz transition • kinetics for opal-A to opal-CT transition • kinetics for high-TOC opal-A to opal-CT transition
6 BPSM affiliates meeting, Nov 12, 2014
grad student work
post-doc work
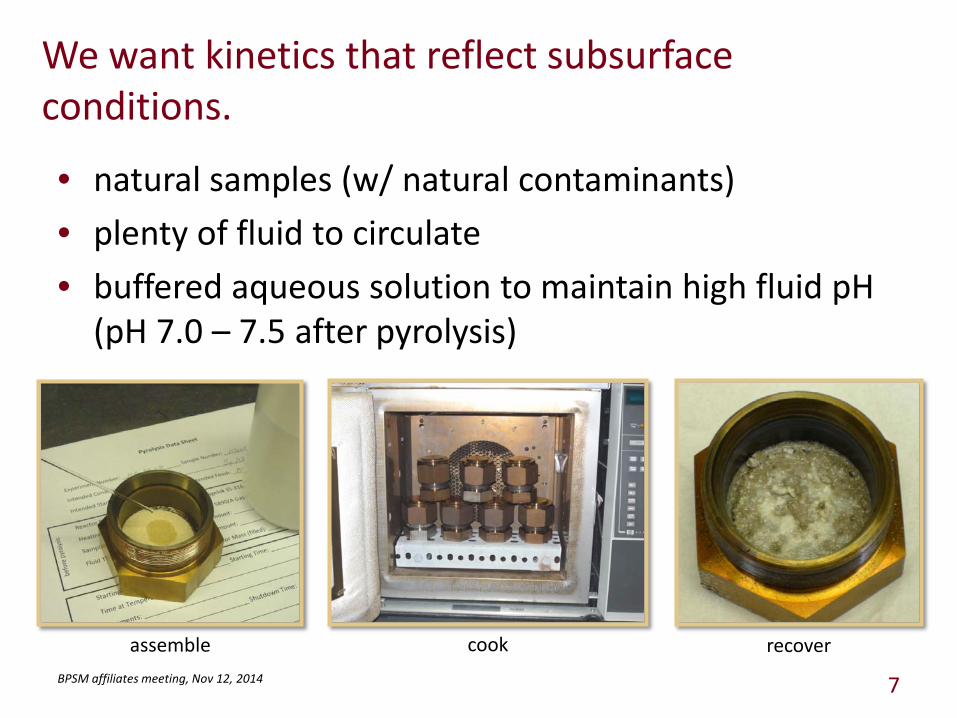
We want kinetics that reflect subsurface conditions.
• natural samples (w/ natural contaminants) • plenty of fluid to circulate • buffered aqueous solution to maintain high fluid pH
(pH 7.0 – 7.5 after pyrolysis)
7 BPSM affiliates meeting, Nov 12, 2014
assemble cook recover
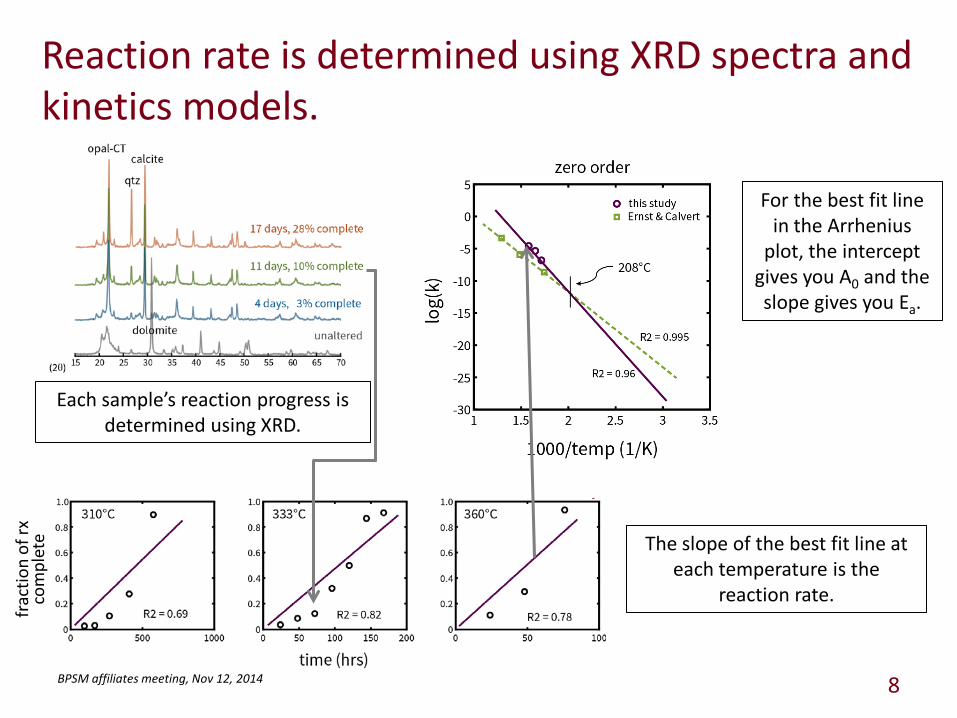
Reaction rate is determined using XRD spectra and kinetics models.
8 BPSM affiliates meeting, Nov 12, 2014
frac
tion
of rx
co
mpl
ete
Each sample’s reaction progress is determined using XRD.
The slope of the best fit line at each temperature is the
reaction rate.
For the best fit line in the Arrhenius
plot, the intercept gives you A0 and the slope gives you Ea.
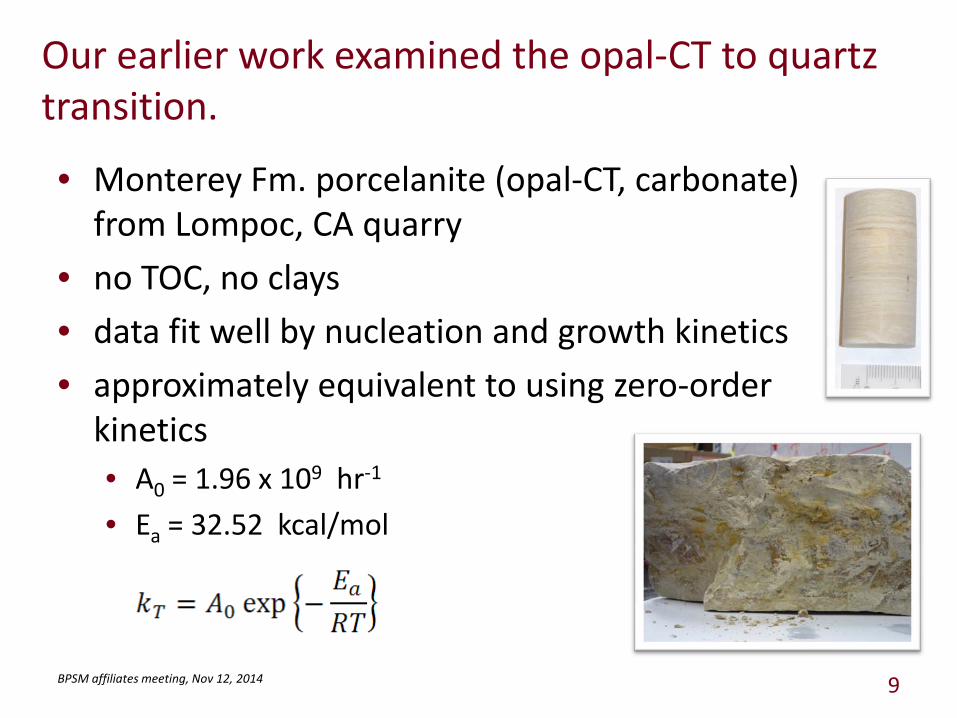
Our earlier work examined the opal-CT to quartz transition.
• Monterey Fm. porcelanite (opal-CT, carbonate) from Lompoc, CA quarry
• no TOC, no clays • data fit well by nucleation and growth kinetics • approximately equivalent to using zero-order
kinetics • A0 = 1.96 x 10⁹ hr-1
• Ea = 32.52 kcal/mol
BPSM affiliates meeting, Nov 12, 2014 9
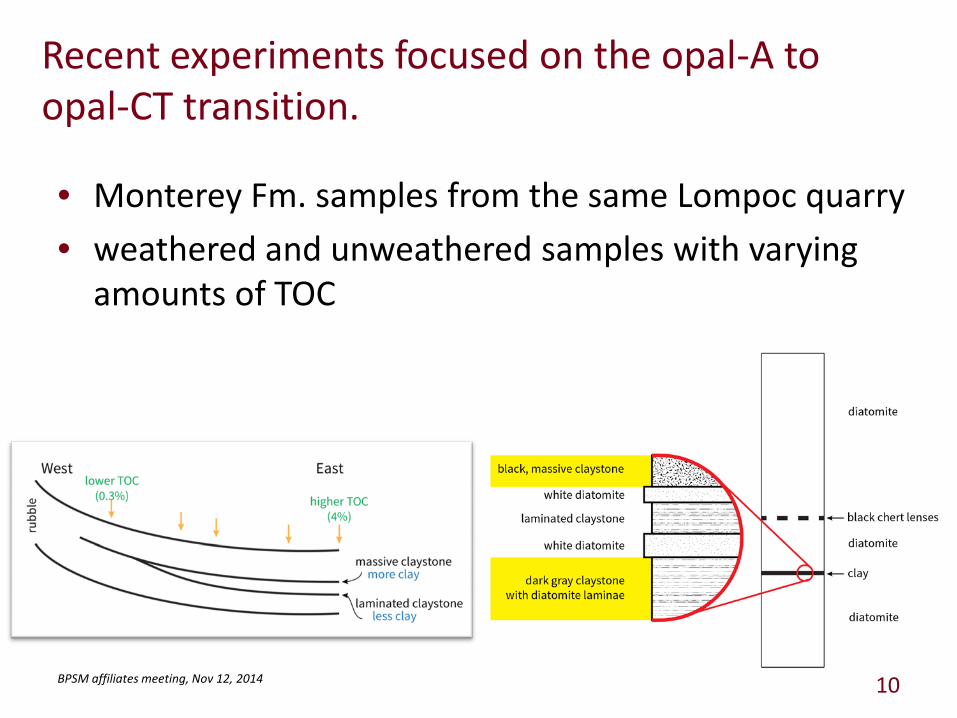
Recent experiments focused on the opal-A to opal-CT transition.
• Monterey Fm. samples from the same Lompoc quarry • weathered and unweathered samples with varying
amounts of TOC
BPSM affiliates meeting, Nov 12, 2014 10
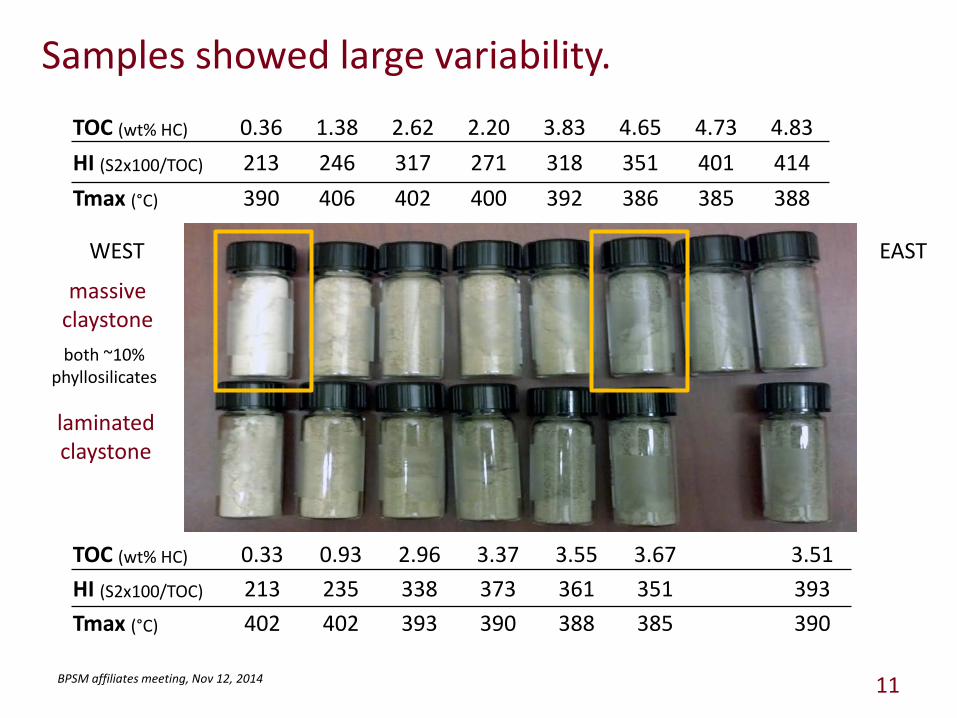
Samples showed large variability.
11
TOC (wt% HC) 0.36 1.38 2.62 2.20 3.83 4.65 4.73 4.83 HI (S2x100/TOC) 213 246 317 271 318 351 401 414 Tmax (°C) 390 406 402 400 392 386 385 388
TOC (wt% HC) 0.33 0.93 2.96 3.37 3.55 3.67 3.51 HI (S2x100/TOC) 213 235 338 373 361 351 393 Tmax (°C) 402 402 393 390 388 385 390
massive claystone
laminated claystone
EAST WEST
BPSM affiliates meeting, Nov 12, 2014
both ~10% phyllosilicates

There are many challenges to conducting these experiments, especially off campus.
• Limited time to conduct experiments (6 weeks) • Nearly 80 individual experiments • No way to know a priori how long to cook samples
BPSM affiliates meeting, Nov 12, 2014 12
• Proper analysis requires detailed XRD which can’t be done on the fly.
• Determination of silica phases takes a skilled analyst.
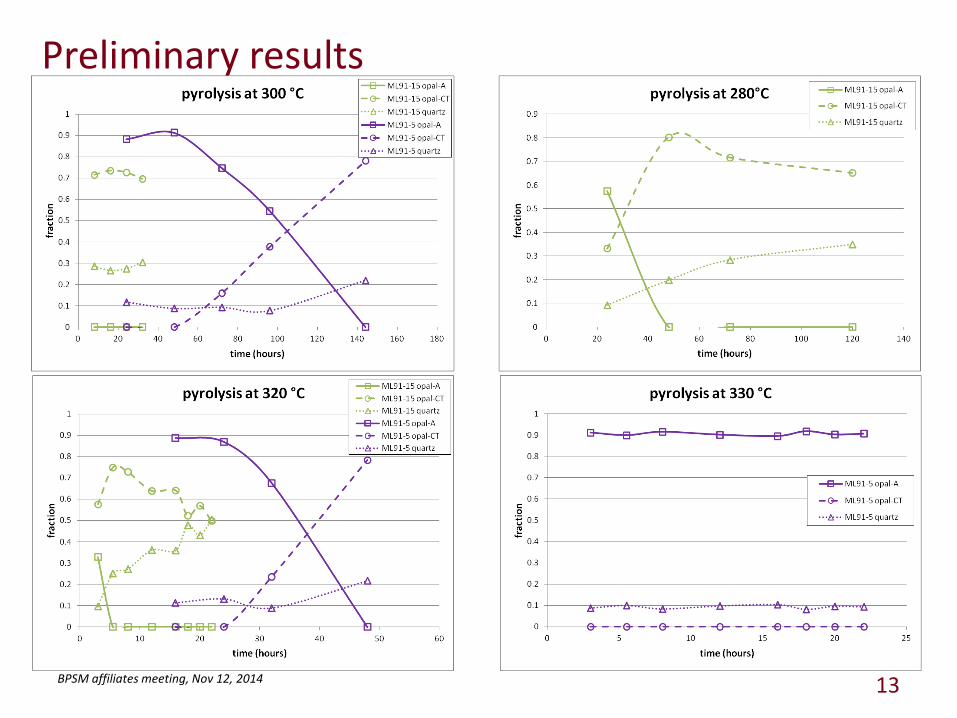
Preliminary results
BPSM affiliates meeting, Nov 12, 2014 13
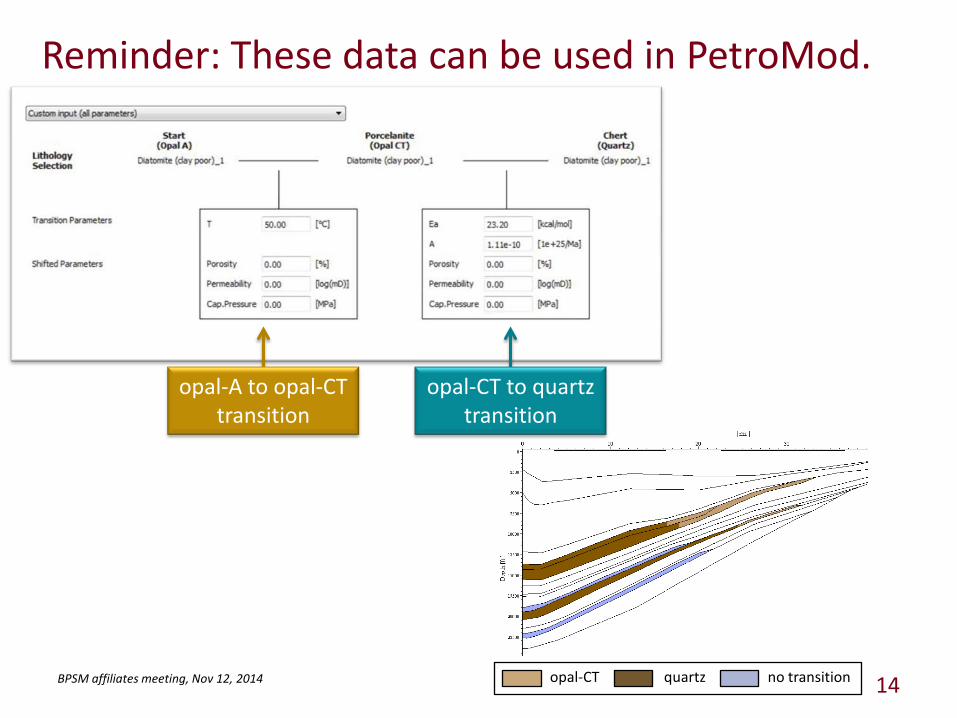
Reminder: These data can be used in PetroMod.
BPSM affiliates meeting, Nov 12, 2014 14 no transition quartz opal-CT
opal-A to opal-CT transition
opal-CT to quartz transition
Summary
• We have opal-A to opal-CT (to quartz) transition data for high- and low-TOC samples. • Low-TOC samples undergo transformation much faster at
experimental temperatures than high-TOC samples. • There may be enough data for determination of kinetics
parameters. • We can at least put bounds on the transition rates.
• Kinetics will be an improvement over the current modeling techniques (nomogram or dissolution rates).
BPSM affiliates meeting, Nov 12, 2014 15
Acknowledgements
16 BPSM affiliates meeting, Nov 12, 2014