kinematic characterization of unsteady two-phase … · kinematic characterization of unsteady...
TRANSCRIPT
1
Kinematic characterization of unsteady two-phase flows in microchannels and microvalves
Nuno Rocha
Mechanical Engineering Department, Instituto Superior Técnico, Universidade Técnica de Lisboa,
Avenida Rovisco Pais, 1049-001 Lisbon, Portugal. _____________________________________________________________________________________________________ Abstract A method to determine the velocity profiles in a horizontal plane of a moving air-liquid interface in unsteady two-phase flows inside microchannels and microvalves is proposed. The method improves the curve matching model presented by Basri and Frenkel (2003), as it includes the physical constraint of mass conservation, and aims at characterizing the kinematic filling process of microcomponents typical of Lab-on-a-Chip and Lab-on-a-CD, particularly the driven stop capillary microvalves. The application of this method requires the existence of visualization images previously acquired that are digitally processed in order to extract the air-liquid interface positions. This visualization and the interface position extraction procedure are also described in this work. The results proved that the method is strongly sensitive to the velocity component perpendicular to the image plane, this sensitivity being made known through the error value of the flow rate. Effects of the horizontal expansion angle in driven stop capillary microvalves revealed that angles close to 90º are more efficient. Visualization of the flow splitting and subsequent junction in the filling process revealed the possibility of a stable air bubble formation to occur.
Key-Words: Driven stop capillary microvalves, digital image processing, curve matching, unsteady two-phase flows. Introduction The size reduction of systems to the microscale, MEMS (Micro-Electro-Mechanical Systems), allowed for the design and manufacture of microfluidic systems, which are characterized by the manipulation and control of small fluid flow volumes (from fL to mL) in microscopic channels (1-1000 µm). This process yielded the emergence of two novel concepts in µTAS (Micro Total Analysis Systems), previously introduced by Manz et al. (1990): the Lab-on-a-Chip and the Lab-on-a-CD. The main advantages associated to these new systems lie on the performance enhancement of heat and mass transfer mechanisms, due to the increase of surface/volume ratio; on the drastic time reduction for chemical reactions and on a much
smaller consumption of potentially expensive reagents and samples (Oh and Ahn, 2006). Even though, Oh and Ahn (2006) reported the need for further research on their components behavior, particularly the microvalves, in order to make the microfluidic systems applications a success in the future. According to Glière and Delattre (2006), these microvalves are particularly important to regulate the flow, allowing or blocking its passage in certain parts of the microfluidic system. The major advantage of such valves is their simplicity, compared to valves with moving parts, such as membranes, making them cheaper and easier to manufacture. On the other hand, as major disadvantage, one can refer the impossibility of their use for applications involving liquid vaporization or very low surface tension values of the liquid. In this work a kinematic characterization of the filling process of microfluidic components, particularly the driven stop capillary microvalves, is performed. For that, a method based on curve matching techniques to calculate the air-liquid interface velocity profiles in a plane was developed and is presented. The curves used are the positions of the air-liquid interface that were extracted by digital processing techniques from the visualization images obtained in the filling process. Since the pioneer work of Washburn (1921), the filling process of microchannels has been studied due to the growing interest in microfluidic applications – see e.g. Kim et al. (2002), Tas et al. (2004), Yang et al. (2004), Salgado et al. (2006), Chen et al. (2006), Swickrath et al. (2008) and Kusumaatmaja et al. (2008). However, all models used to calculate the moving interface velocities in the above-mentioned works are limited to cases where the one-dimensional approach is valid. This severe restriction makes those models unsuitable to simulate the microvalves filling process. Most of the research work on driven stop capillary microvalves has been focused on the characterization of the governing physical principles and some models based on the effects of capillarity have been proposed mainly for horizontal expansions. Man et al. (1998) developed a one-
2
dimensional model to evaluate the burst pressure of microvalves with horizontal expansion for large values of the ratio width/height of the cross-section. Leu and Chang (2004) presented a new tridimensional model, considering the interface as a hemisphere, also for large values of the ratio width/height of the cross-section. Glière and Delattre (2006) developed a tridimensional model valid for all cross-section shapes and for both horizontal and vertical expansions. The model complexity requires the use of numerical methods. More recently, Cho et al. (2007) and Chen et al. (2008) adapted the Leu and Chang’s (2004) model to all height/width ratio values and performed its validation using visualization images. Nonetheless, there is still a lack of research in this area viewing the improvement of the modeling of the microvalves filling process. In fact, analytical models governing the kinematics of microvalves filling are required. Moreover, simple models to represent the behavior of the filling process of microvalves with vertical expansion are also required. The model of Chen et al. (2008) was used herein to analyze the burst processes in microvalves with horizontal expansions. As far as the digital image processing is concerned, it is known for more than 40 years (see the first works of Roberts, 1965, Granlund, 1978, Knutsson, 1982, Koenderink, 1984 and Canny, 1986, cit. in Svensson, 2008). More recently, such technique has been used for medical applications (Weickert, 1998, Styner, 2000) and for assistance to sports referees (Theobalt et al., 2004 and Mao, 2006). Applications of digital image processing to fluid mechanics are found in the use of PIV (Particle Image Velocimetry) or µPIV (Micro Particle Image Velocimetry) techniques, which is documented in the work of Raffel et al. (2002), and in the study of macroscale multi-phase flows (Mishima et al., 1997, Gopal and Jepson, 1997, Bui-Dinh and Choi, 1999 and Zaruba et al., 2005). In the present work these techniques were used to extract the positions of the air-liquid interface. The curve matching technique, also known for more than forty years, was first applied to speech recognition (Rabiner and Huang, 1993 cit.in Efrat et al., 2007). Since then, its applications have been quite diversified, ranging from handwriting recognition (Tappert et al., 1982, Basri and Frenkel, 2003 and Efrat et al., 2007) to artificial vision (Serra and Berthod, 1994 and Munich and Perona, 2003) and to the track of meteorological structures (Cohen and Herlin, 1998). Such technique is characterized by quantifying the dissimilarities between two curves, thought the use of appropriate functions, which can be related to the curvature (Cohen et al., 1992 and
Basri and Frenkel, 2003), for the cases of small curves deformations, or to the geodesic distance maps of the surface defined by the curves (Cohen and Herlin, 1998 and Gharbieh et al., 2003). A new application for curve matching was proposed by Gharbieh et al. (2003). The authors related the position of a turbulent flame front for two different moments to evaluate the instantaneous velocities of the flame front that, together with PIV measurements outside the reaction zone, yielded the data needed to evaluate the turbulence/chemistry interactions. In order to characterize the kinematics of the microcomponents filling process, it is proposed a method to calculate the velocity profiles, based on the curve matching technique similar to that of Gharbieh et al. (2003). However, the method proposed herein is applicable to open curves, typical of the air-liquid moving interfaces.
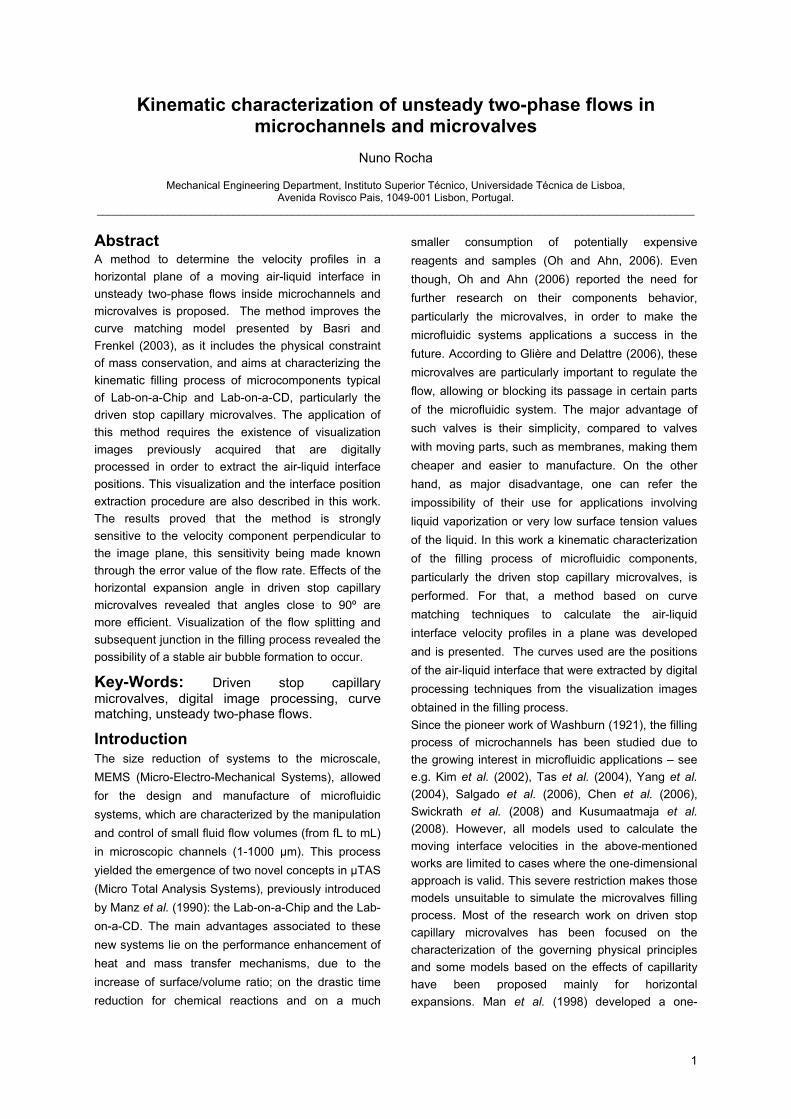
Experimental Apparatus The experimental set up used in the present work is schematically shown in figure 1.
Figure 1 – Schematic representation of the experimental installation.
The illumination system is a tungsten lamp of 55 W. A Phantom v4.2 CCD camera with a 22 µm pixel pitch in both dimensions is used. In the maximum used resolution, 512 pixels x 512 pixels, such camera allows for a maximum 2100 Hz of acquisition frequency. Its 1 Gb memory limits the total acquisition time for defined acquisition frequency and spatial resolution. To ensure the field of view needed for flow visualization, the camera is linked to an inverted Leica® optical microscope, model DM ILM. Three different lenses were used, possessing magnifications of 5× 10× and 20×, corresponding to numerical apertures of 0.12, 0.25 and 0.40, respectively. A New Era Pump Systems® micrompump, model NE-1000, was used. The microfluidic components were manufactured by Biosurfit® in chips that are shown in figure 2. The studied driven stop capillary microvalves

3
with both vertical and horizontal expansions are the T1-(B-E) and Q1-(B-E). The studied microvalves possessing only a horizontal expansion are the T2-(A) and Q2-(A). The studied microchannel splitting with three divisions is the D1-(F). For all this microfluidic components, the working fluid was water.
Figure 2 – Representation of the chips containing the microfluidic elements studied.
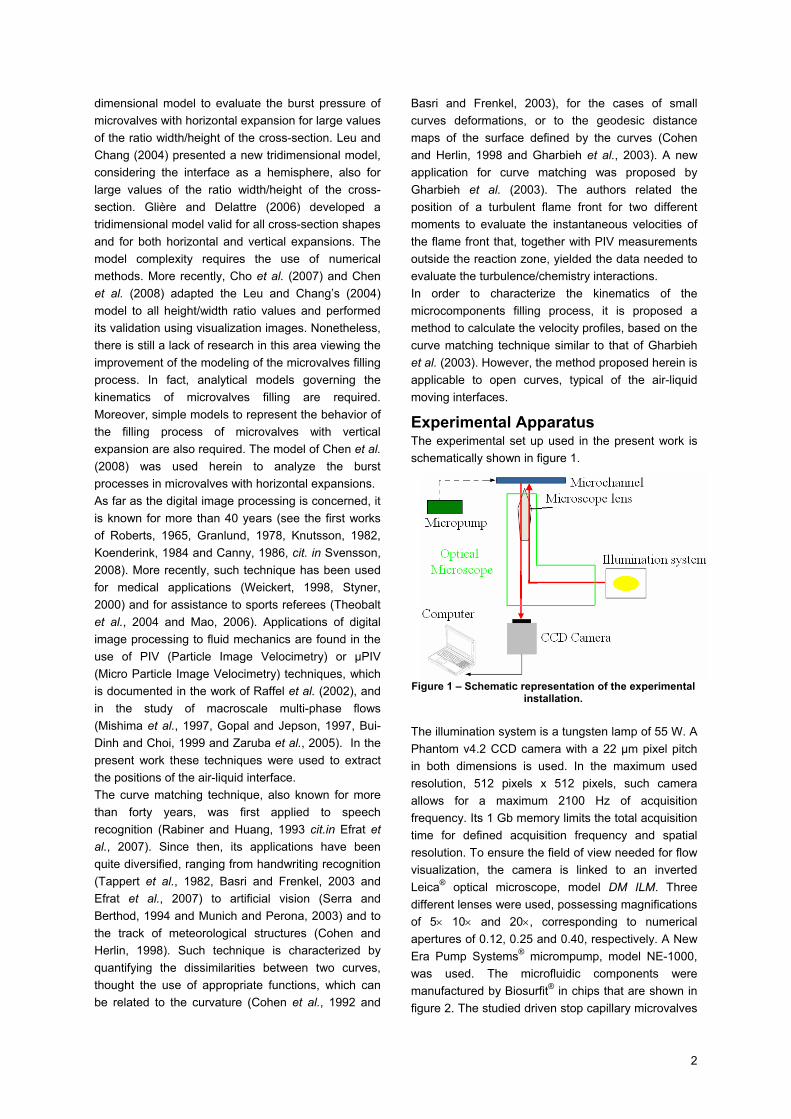
Models The extraction of the position of the moving air-liquid interface from images captured during the filling process visualization, which is required to apply the method to calculate the velocity profiles, was performed with the algorithm displayed in figure 3. The conditions for the microvalve Q1-(E) filling process were ensured by the micropump that yielded a 3 µL/min flow rate. A brief description of the mentioned algorithm, supported on the flow image img_original represented in figure 4(A), is provided. The valve image without flow, also needed for the algorithm, was extracted and is represented in figure 4(B). Function Bakground operates on image 4(B), img_background, in order to establish digitally the external region to the microvalve. For that, the function operates a contrast enhancement to the complement image of img_background. Then, on the image yielded by the previous procedure, a threshold operation converts the resulting image into a binary format and, consequently, the microvalve walls are identified. To separate the left wall from the right one, this last image obtained is split into two images. For each of those two wall images, the region outside the microvalve is binary filled. By adding these binary filled wall images into a single image and multiplying the outcome by a factor of 255, the image represented in figure 4(C) is obtained.
Figure 3 – Schematic representation of the air-liquid interface extracting algorithm.
Function Proc_1a operates on intersection of the liquid and air binary images to pre-locate the interface position. The binary image of the liquid is obtained by a moderated subtraction of the complement images of both img_original and img_background, followed by a contrast enhancement to the outcome of the previous operation. The result is then multiplied by an enhancement factor, followed by a threshold operation for binary conversion yielding the image represented in figure 4(D). As it can be observed, a small region inside the marking red circle is identifiable as liquid by the algorithm, although the liquid has still not yet arrived to that position. This misidentification occurs as a consequence of the oscillation in the illumination system. The air binary image is constructed from the complement of the liquid image, followed by a subtraction of the image img_lateral_background, obtained from the previous function, and from a subsequent threshold operation. Since the air binary image is obtained from the liquid image, a Gaussian filter is applied to the former in order to expand its exterior limits, yielding the image represented in figure 4(E), and the intersection of the resulting filtered image with that of the liquid binary image allows for the determination of a first approximation of the interface location. The small region within the red circle still remains as it can be seen in figure 4(F). The number of identified interfaces is then evaluated and, for each one, a local rectangle with the exterior positions of the interface is determined and oversized. Function Proc_2a evaluates the vector positions of each interface being, therefore, called for each interface identified in the previous function. The interface elements are first validated based on their area, procedure that allows for the elimination of the previously described false liquid interfaces. Then, the
4
outside interface position is calculated and the interface injectivity referring to x is evaluated as a criterion decision for the need of a referential rotation. After, the matrix of the interface position is split into organized vector positions marching from the most left interface position to the right one. The interface position stored in these vectors is partially represented in figure 4(G) for the most right interface position. In this last figure, one can observe the
stepwise shape of the interface position, which is due to the inherent limitations of the smallest unity allowed by the image digital process, the pixel. Then, another criterion decision for the need of a referential rotation is used, particularly for cases where a large interface position gradient in the x direction occurs, to avoid large oscillations in the interface polynomial fitting process described next.
Figure 4 – A) img_original, B) img_background, C) img_lateral_background, D) img_bin_liquid, E) img_air_bin_Gauss , F) img_intersection_bin, G) Final interface position before polynomial fitting (detail of the most right interface
position), H) Final interface position after polynomial fitting (detail of the most right interface position). Function Proc_3a is also called for each identified interface and aims at performing a polynomial curve fitting to the interface position. If the need for a referential rotation is identified, its implementation is accomplished by defining the new x direction as that connecting the interface boundaries. Besides this rotation, another referential conversion normalizing the x values in the interval [-1, 1] is performed by means of Legendre polynomials, which form an orthogonal space of functions as basis in that interval to apply the least square method for the curve fitting. This ensures a better conditioning of the matrix that is
inverted in the least square method (Atkinson and Han, 2003). The fitting process is performed as an iterative procedure yielding the best degree of the fitting polynomial and smoothing the stepwise shape of the interface - see in figure 4(H). The major limitations of the previous algorithm are the interface position dependency on the images contrast and brightness, the need for a considerable number of inputs from the user, and the difficulty in evaluating the interface positions close to the walls. The air-liquid interface velocity profiles are obtained from the previous results with the new algorithm
5
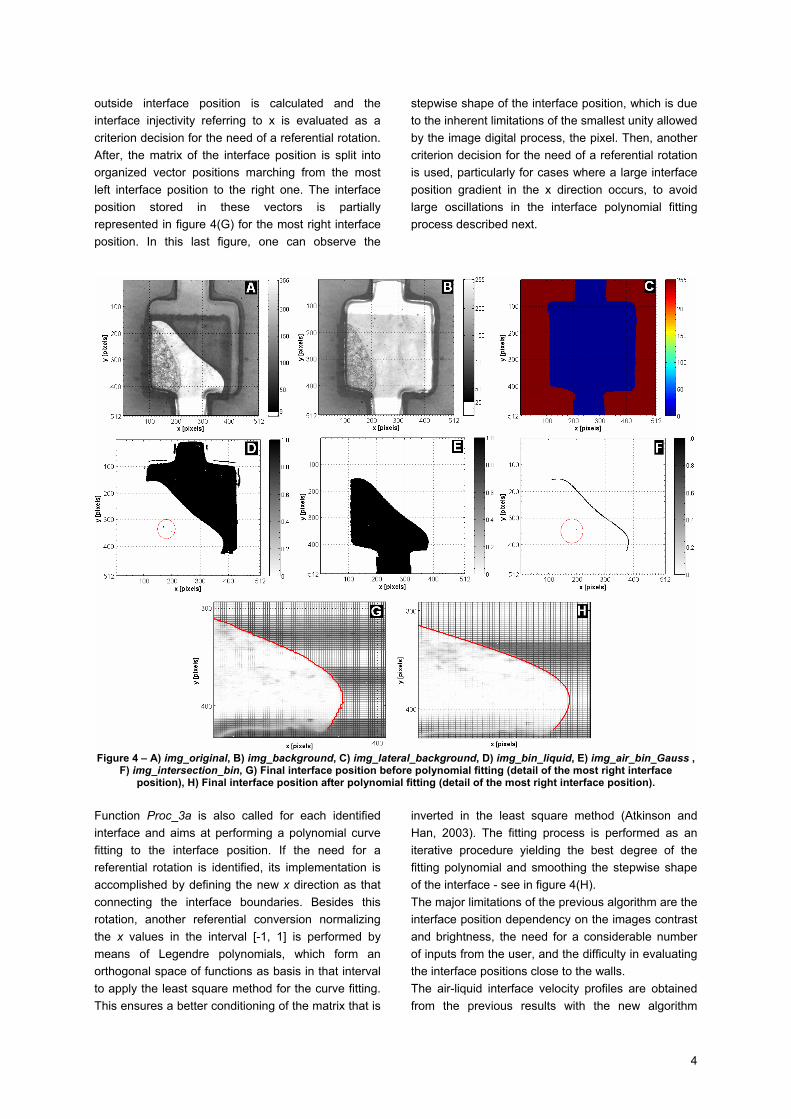
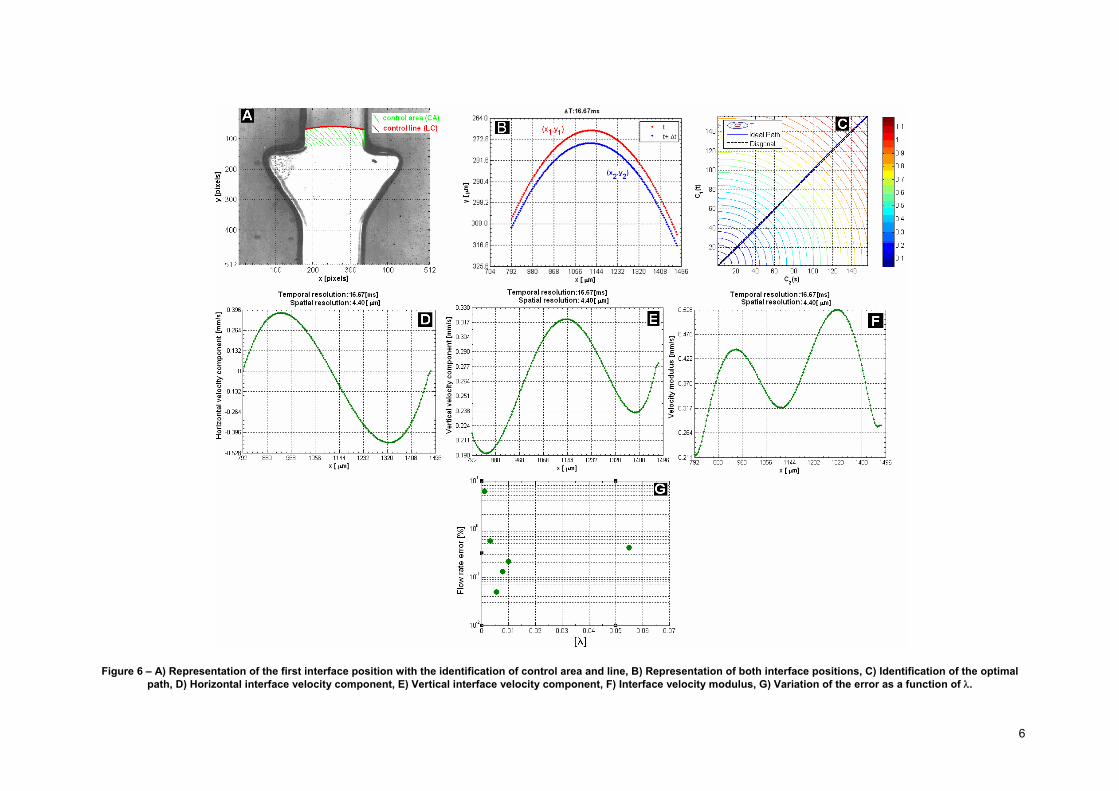
schematically represented in figure 5. This algorithm is based on that of Basri and Frenkel (2003), which matches two curves through their geometric proprieties as an optimization problem. With this method, the optimal path in the domain defined by two curves parameterizations is defined as the one that minimizes the total sum of the local cost function. This cost function is also defined in the curves parameterization domain and relates their geometric proprieties. A brief description of this algorithm is provided below, considering that the first interface position represented in figure 6(A), which was obtained in the filling process visualization of microvalve T1-(E) with a flow rate of 3µL/min. Both interface positions obtained with the application of the previous algorithm are represented in detail in figure 6(B).
Figure 5 - Schematic representation of the algorithm for evaluating the interface velocity profile.
Function Proc_curvature parameterizes both interface positions thought their arc-length, according to equation (1), where m and n stand for the number of points used in the curves discretization. (1) The curvatures of the interface position are calculated according to equation (2). For the extreme positions of the interface the restrictions expressed by equations (3) must be applied to equation (2). The same cost function, F(s,t), proposed in the work of Basri and Frenkel (2003) and expressed by equation (4), was adopted herein. The curvature term in the cost function is then calculated.
(2) (3) (4) Function Proc_λ makes recourse to the other functions represented in figure 5 to evaluate the interface velocity profile, for a given constant term, λ. Function Proc_T applies the fast marching method to solve the Eikonal equation, associated to the determination of the optimal path that matches the two curves. The Eikonal equation is expressed by equation (5) where T is defined as in equation (6), where γ represents the optimal path defined in the curves parameterization domain. (5) (6) Function Proc_path defines the optimal path that matches the two curves, that has to be orthogonal to the iso-T lines. Such optimal path is computed using a bilinear interpolation to determine the gradients of T in the unknown points and is illustrated in figure 6(C), for λ=0.0055. Function Proc_matching introduces the novelty of this work when compared to that of Basri and Frenkel (2003). Starting from the first parameterized position of the interface, the optimal path determines the corresponding matching points of the second parameterized position of the interface, and a linear interpolation is used whenever the path points corresponding to the curves parameterizations are unknown. With such procedure, the velocity profile is determined. Figure 6 (D-F), that refers to λ=0.0055, illustrate the obtained velocity profiles.
( ) ( ) ( )( ) [ ]( ) ( ) ( )( ) [ ]⎪⎩
⎪⎨⎧
+=∈=
+=∈=2
22
2222
21
21111
,,..,2,1,,
,,..,2,1;,
dydxdsnssysxsC
dydxdtmttytxtC
[ ][ ]⎪⎩
⎪⎨⎧
−∈=⇒=
−∈=⇒=
122
121
n,...,sijif
m,...,tijif
( ) ( ) ( ) ( )constCkCktsF st λ+−= 21,
( ) ( ) ( ) ( )( ) ( )( ) ( )( )
( ) ( ) ( )( ) ( )( ) ( )( )
( ) ( ) ( )( )( ) ( ) ( )( )⎪
⎪⎪⎪⎪⎪
⎩
⎪⎪⎪⎪⎪⎪
⎨
⎧
=−−+=∆
−−+=∆
∆+∆
∆−+−+−
−∆+∆
∆−+−+=
2,1,115.0
,115.0
1214
1214
2322
2322
jiyiyiy
ixixix
iyix
iyixixix
iyix
ixiyiyiyCk
jjj
jjj
jj
jjjj
jj
jjjjji
( ) ( )tsFtsT ,, =∇
( ) ( )( )( )
∫=ts
A
drrFtsT,
min, γγ
6
Figure 6 – A) Representation of the first interface position with the identification of control area and line, B) Representation of both interface positions, C) Identification of the optimal
path, D) Horizontal interface velocity component, E) Vertical interface velocity component, F) Interface velocity modulus, G) Variation of the error as a function of λ.
7
Function Proc_mass_balance also brings a novelty to the curve matching algorithm. This function evaluates the error of the velocity profile associated with the adopted λ value, by performing the two-dimensional mass balance expressed by equation (7) and applied to the control area represented in figure 6(A). (7) It can be seen from equation (7) that the first term on the left hand side does not depend on the velocity profile determined, whereas the second term on the left hand side exhibits a clear dependence. Since the change of the λ value yields new interface velocity profiles, an iterative procedure was performed in order to find out the λ value that yields a minimum error. The results show in figure 6(G) correspond to λ=0.0055 and an associated error of 0.05%. The major limitation of this algorithm is the interface velocity profile dependency on the number of points used to define the interface positions. Moreover, and since the input of this algorithm is the output of the previous one, all the limitations of the former influence the accuracy of the results produced by the latter.
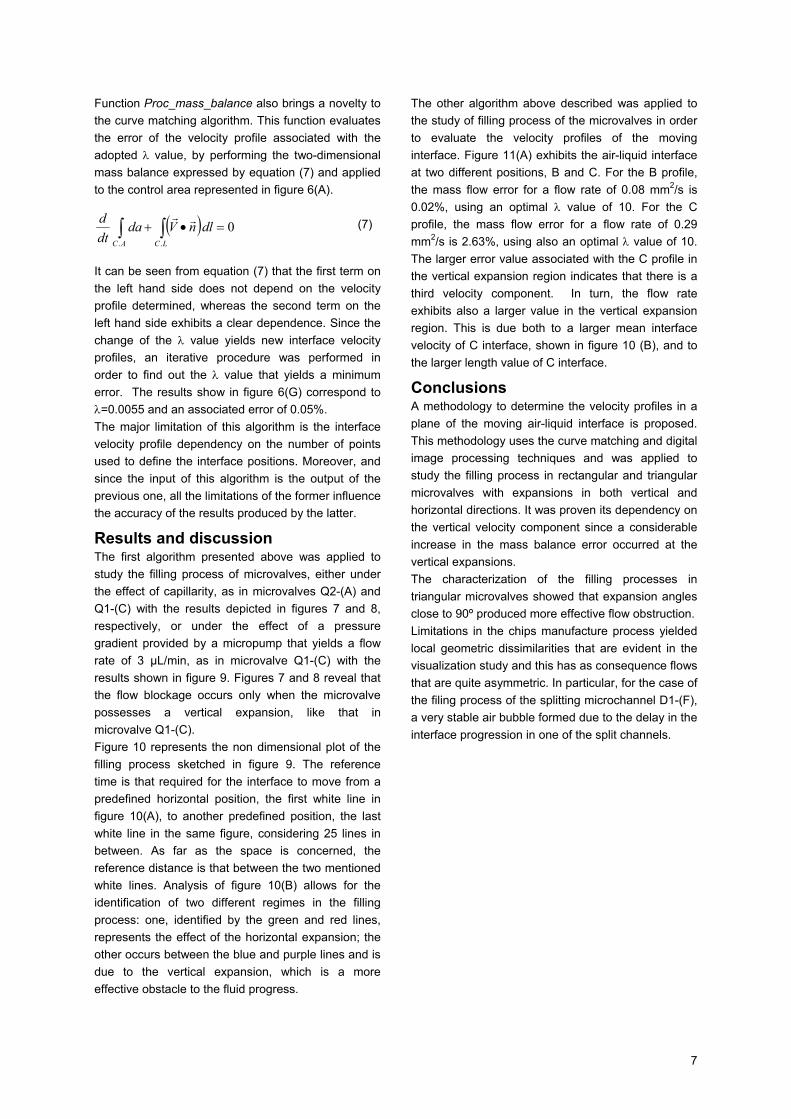
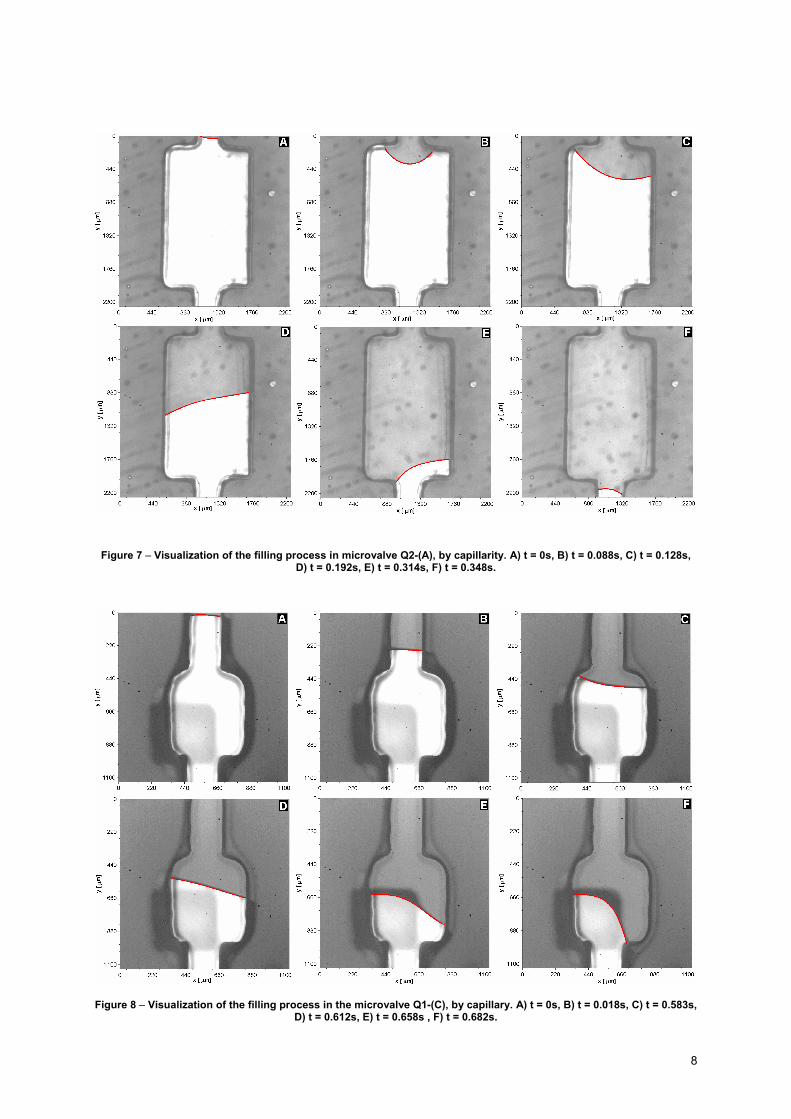
Results and discussion The first algorithm presented above was applied to study the filling process of microvalves, either under the effect of capillarity, as in microvalves Q2-(A) and Q1-(C) with the results depicted in figures 7 and 8, respectively, or under the effect of a pressure gradient provided by a micropump that yields a flow rate of 3 µL/min, as in microvalve Q1-(C) with the results shown in figure 9. Figures 7 and 8 reveal that the flow blockage occurs only when the microvalve possesses a vertical expansion, like that in microvalve Q1-(C). Figure 10 represents the non dimensional plot of the filling process sketched in figure 9. The reference time is that required for the interface to move from a predefined horizontal position, the first white line in figure 10(A), to another predefined position, the last white line in the same figure, considering 25 lines in between. As far as the space is concerned, the reference distance is that between the two mentioned white lines. Analysis of figure 10(B) allows for the identification of two different regimes in the filling process: one, identified by the green and red lines, represents the effect of the horizontal expansion; the other occurs between the blue and purple lines and is due to the vertical expansion, which is a more effective obstacle to the fluid progress.
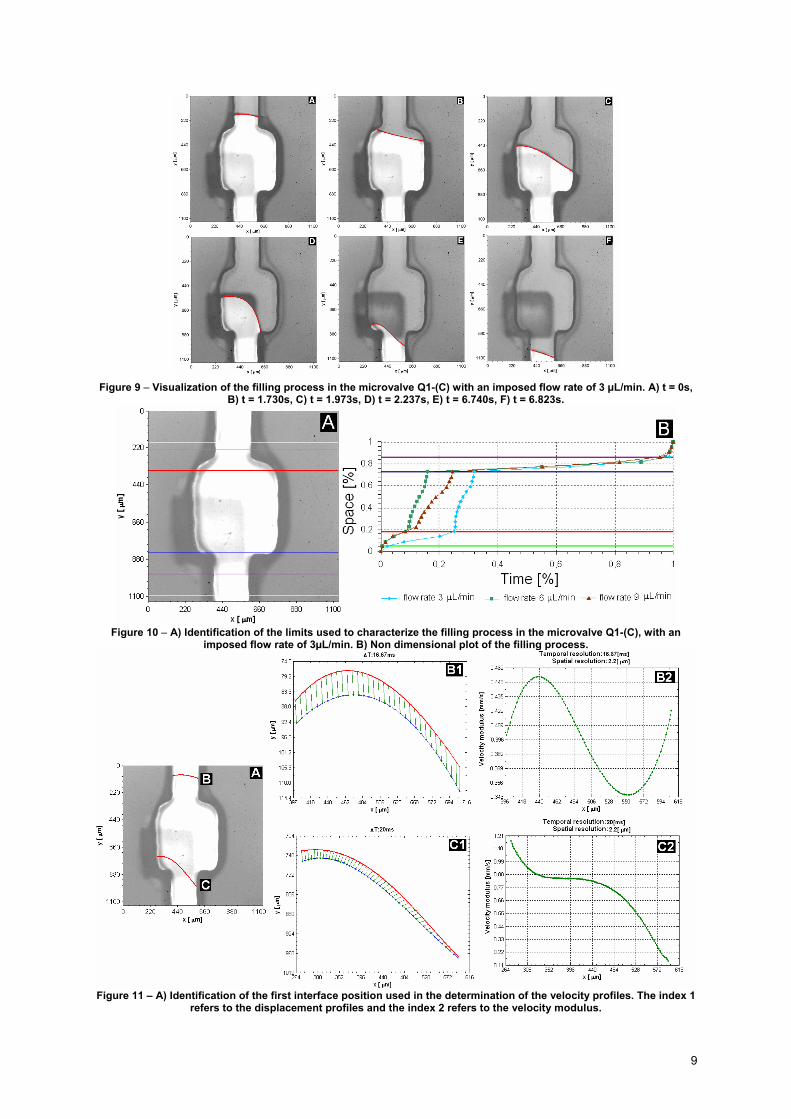
The other algorithm above described was applied to the study of filling process of the microvalves in order to evaluate the velocity profiles of the moving interface. Figure 11(A) exhibits the air-liquid interface at two different positions, B and C. For the B profile, the mass flow error for a flow rate of 0.08 mm2/s is 0.02%, using an optimal λ value of 10. For the C profile, the mass flow error for a flow rate of 0.29 mm2/s is 2.63%, using also an optimal λ value of 10. The larger error value associated with the C profile in the vertical expansion region indicates that there is a third velocity component. In turn, the flow rate exhibits also a larger value in the vertical expansion region. This is due both to a larger mean interface velocity of C interface, shown in figure 10 (B), and to the larger length value of C interface.
Conclusions A methodology to determine the velocity profiles in a plane of the moving air-liquid interface is proposed. This methodology uses the curve matching and digital image processing techniques and was applied to study the filling process in rectangular and triangular microvalves with expansions in both vertical and horizontal directions. It was proven its dependency on the vertical velocity component since a considerable increase in the mass balance error occurred at the vertical expansions. The characterization of the filling processes in triangular microvalves showed that expansion angles close to 90º produced more effective flow obstruction. Limitations in the chips manufacture process yielded local geometric dissimilarities that are evident in the visualization study and this has as consequence flows that are quite asymmetric. In particular, for the case of the filing process of the splitting microchannel D1-(F), a very stable air bubble formed due to the delay in the interface progression in one of the split channels.
( ) 0. .
=•+∫ ∫AC LC
dlnVdadtd rr
8
Figure 7 – Visualization of the filling process in microvalve Q2-(A), by capillarity. A) t = 0s, B) t = 0.088s, C) t = 0.128s, D) t = 0.192s, E) t = 0.314s, F) t = 0.348s.
Figure 8 – Visualization of the filling process in the microvalve Q1-(C), by capillary. A) t = 0s, B) t = 0.018s, C) t = 0.583s, D) t = 0.612s, E) t = 0.658s , F) t = 0.682s.
9
Figure 9 – Visualization of the filling process in the microvalve Q1-(C) with an imposed flow rate of 3 µL/min. A) t = 0s, B) t = 1.730s, C) t = 1.973s, D) t = 2.237s, E) t = 6.740s, F) t = 6.823s.
Figure 10 – A) Identification of the limits used to characterize the filling process in the microvalve Q1-(C), with an
imposed flow rate of 3µL/min. B) Non dimensional plot of the filling process.
Figure 11 – A) Identification of the first interface position used in the determination of the velocity profiles. The index 1
refers to the displacement profiles and the index 2 refers to the velocity modulus.

10
References Atkinson K., Han W., Elementary Numerical Analysis, John Wiley & Sons, 3th edition, 2003. Basri R., Frenkel M., Curve matching using the Fast Marching Method, Lecture Notes in Computer Science, Springer, 2003, (2683). Bui-Dinh T., Choi T. S., Application of image processing techniques in air/water two phase flow, Mechanics Research Communications, 1999; 26: 463-468 Canny J., A computational approach to edge detection, IEEE Transactions on Pattern Analysis and Machine Intelligence, 1986, 8(6): 255-274 Chen C. F., Kung C. F., Chen H. C., Chu C. C., Chang C. C., Tseng F. G., A microfluidic nanoliter mixer with optimized grooved structures driven by capillary pumping, Journal of Micromechanics and Microengineering, 2006; 16: 1358-1365 Chen J. M., Huang P. C., Lin M. G., Analysis and experiment of capillary valves for microfluidics on a rotating disk, Microfluidics and Nanofluidics, 2008, 4: 427-437 Cho H., Kim H. Y., Kang J. Y., Kim T. S., How the capillary burst microvalve works, Journal of Colloid and Interface Science, 2007; 306: 379-385 Cohen I., Ayache N., Sulger P., Tracking points on deformable objects using curvature information, Proceedings of the 2nd European Conference on Computer Vision, Santa Margherita Ligure, Italy, May, 1992 Cohen I., Herlin I., Tracking meteorological structures through curve matching using geodesic paths, IEEE Proceedings of the 6th International Conference on Computer Vision, 1998: 396-401 Efrat A., Fan Q., Venkatasubramanian S., Curve matching, time warping, and light fields: new algorithms for computing similarity between curves, Journal of Mathematical Imaging and Vision, 2007; 27: 203-216 Gharbieh A. R., Hamarneh G., Gustavsson T., Kaminski C., Level set curve matching and Particle Image Velocimetry for resolving chemistry and turbulence interactions in Propagating Flames, Journal of Mathematical Imaging and Vision, 2003;19: 199-218 Glière A., Delattre C., Modeling and fabrication of capillary stop valves for planar microfluidic systems, Sensors and Actuators A, 2006; 130-1: 601-8 Gopal M., Jepson W. P., Development of digital image analysis techniques for the study of velocity and void profiles in slug flow, International Journal of Multiphase Flow, 1997; 23: 945-965 Granlund G. H., In search of a general picture processing operator, Computer Graphics and Image Processing, 1978; 8(2): 155-178 Kim D. S., Lee K. C., Kwon T. H., Lee S. S., Transient filling flow into microchannels considering surface tension, Technical Proceedings of the International Conference on Modeling and Simulation of Microsystems, 2002;1: 108-111 Knutsson H., Filtering and reconstruction in image processing, PhD thesis, Linköping University, Sweden, Diss. No. 88,1982 Koenderink J. J., The structure of images, Biological Cybernetics, 1984; 50(5): 363-370 Kusumaatmaja H., Pooley C. M., Girardo S., Pisignano D., Yeomans J. M., Capillary filling in patterned channels, Physical Review, 2008; E77, 067301 Leu T. S., Chang P. Y., Pressure barrier of capillary stop valves in micro sample separators, Sensors and Actuactors A, 2004, 115: 508-515 Man P. F., Mastrangelo C. H., Burns M. A., Burke D. T., Microfabricated capillary-driven stop valve and sample injector, Proceedings of the IEEE MEMS Conference, Heidelberg, Germany, January 25-29, 1998
Manz A., Graber N., Widmer H. M., Miniaturized total analysis systems: a novel concept for chemical sensing, Sensors and Actuators B, 1990; 1: 244-8 Mao J., Tracking a tennis ball using image processing techniques, MsD thesis, University of Saskatchewan, Canada, 2006 Mishima K., Hibiki T., Nishihara H., Visualization and measurement of two-phase flow by using neutron radiography, Nuclear Engineering and Design, 1997; 175: 25-35 Munich M. E., Perona P., Visual identification by signature tracking, IEEE Transactions Pattern Analysis and Machine intelligence, 2003; 25: 200-217 Oh W. K., Ahn C. H., A review of microvalves, Journal of Micromechanics and Microengineering, 2006; 16: R13-39. Rabiner L. R., Huang B. H., Fundamentals of Speech Recognition, Prentice Hall, 1993 Raffel M., Willert C., Kompenhans J., Particle Image Velocimetry: A Practical Guide, Springer, 2002 Roberts L. G., Optical and Electro-Optical Information Processing, Chapter Machine Perception of three-dimensional Solid, J. T. Tippell editor, MIT Press, 1965; 159-197 Salgado J. D., Horiuchi K., Dutta P., A conductivity-based interface tracking method for microfluidic application, Journal Micromechanics and Microengineering, 2006; 16: 920-928 Serra B., Berthod M., Subpixel contour matching using continuous dynamic programming, IEEE Conference on Computer Vision and Pattern Recognition, 1994: 202-207 Styner M., Parametric estimate of intensity inhomogeneities applied to MRI, IEEE Transactions on Medical Imaging, 2000; 19: 153-65 Svensson B., A multidimensional filtering framework with applications to local structure analysis and image enhancement, PhD thesis, Linköping University, Sweden, Diss. No. 1171, 2008 Swickrath M. J., Shenoy S., Mann J. A., Belcher J., Kovar R., Wnek G. E., The design and fabrication of autonomous polymer-based surface tension-confined microfluidic platforms, Microfluidics and Nanofluidics, 2008; 4: 601-611 Tappert C., Cursive script recognition by elastic matching, IBM Journal of Research Development, 1982; 26: 765-771 Tas N. R., Haneveld J., Jansen H. V., Elwenspoek M., van den Berg A., Capillary filling speed of water in nanochannels, Applied Physics Letters, 2004; 85, 3274 Theobalt C., Albrecht I., Haber J., Magor M., Seidel H., Pitching a baseball: tracking high-speed motion with multi-exposure images, Proceedings of ACM Transactions on Graphics, 2004; 23(3): 540-547 Washburn E. W., The dynamics of capillary flow, Physical Review, 1921; 17: 273-83 Weickert J., Anisotropic diffusion in image processing, ECMI Séries, 1998 Yang L. J., Yao T. J., Tai Y. C., The marching velocity of the capillary meniscus in a microchannel, Journal of Micromechanics and Microengineering, 2004; 14: 220-225 Zaruba A., Krepper E., Prasser H. M., Reddy B. N. V., Experimental study on bubble motion in a rectangular bubble column using high-speed video observations, Flow Measurement and Instrumentation, 2005; 16: 277-287