kieso ifrs1e sm ch11 final - ibeb.svenengels.nlibeb.svenengels.nl/fa/ch11.pdf · questions chapter...
TRANSCRIPT
Copyright © 2011 John Wiley & Sons, Inc. Kieso, IFRS, 1/e, Solutions Manual (For Instructor Use Only) 11-1
CHAPTER 11
Depreciation, Impairments, and Depletion
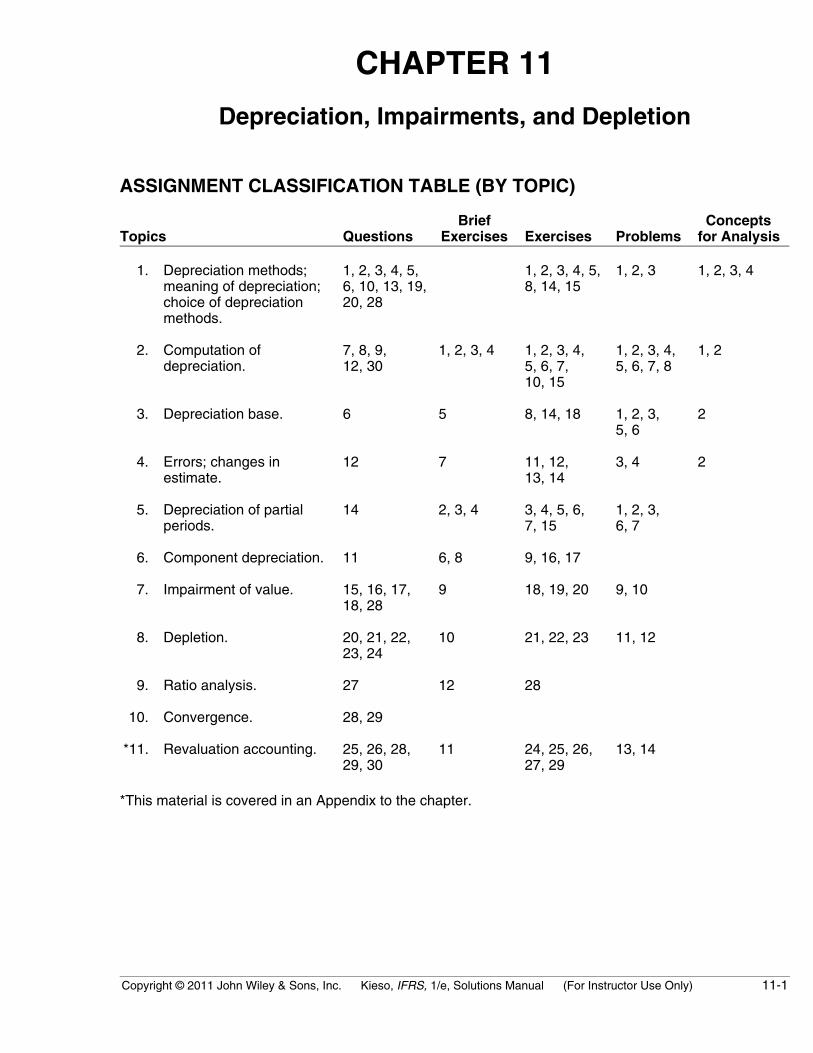
ASSIGNMENT CLASSIFICATION TABLE (BY TOPIC)
Topics QuestionsBrief
Exercises Exercises Problems Conceptsfor Analysis
1. Depreciation methods;meaning of depreciation;choice of depreciationmethods.
1, 2, 3, 4, 5,6, 10, 13, 19,20, 28
1, 2, 3, 4, 5,8, 14, 15
1, 2, 3 1, 2, 3, 4
2. Computation ofdepreciation.
7, 8, 9,12, 30
1, 2, 3, 4 1, 2, 3, 4,5, 6, 7,10, 15
1, 2, 3, 4,5, 6, 7, 8
1, 2
3. Depreciation base. 6 5 8, 14, 18 1, 2, 3,5, 6
2
4. Errors; changes inestimate.
12 7 11, 12,13, 14
3, 4 2
5. Depreciation of partialperiods.
14 2, 3, 4 3, 4, 5, 6,7, 15
1, 2, 3,6, 7
6. Component depreciation. 11 6, 8 9, 16, 17
7. Impairment of value. 15, 16, 17,18, 28
9 18, 19, 20 9, 10
8. Depletion. 20, 21, 22,23, 24
10 21, 22, 23 11, 12
9. Ratio analysis. 27 12 28
10. Convergence. 28, 29
*11. Revaluation accounting. 25, 26, 28,29, 30
11 24, 25, 26,27, 29
13, 14
*This material is covered in an Appendix to the chapter.
11-2 Copyright © 2011 John Wiley & Sons, Inc. Kieso, IFRS, 1/e, Solutions Manual (For Instructor Use Only)
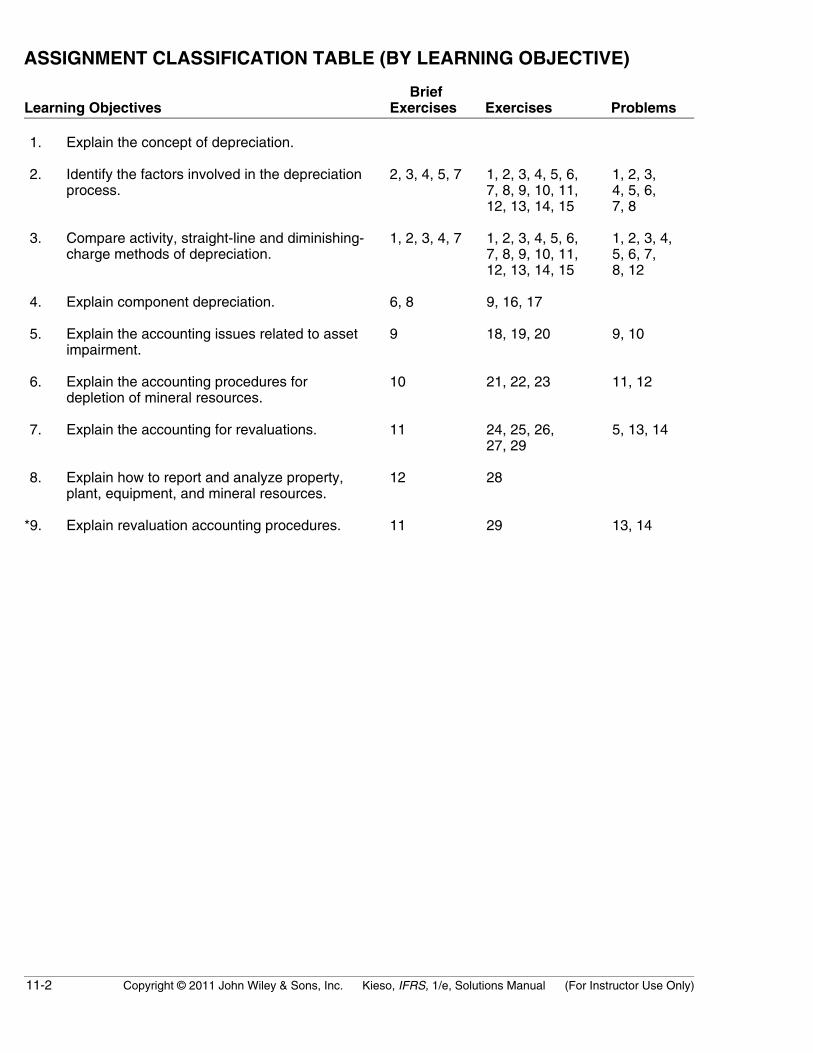
ASSIGNMENT CLASSIFICATION TABLE (BY LEARNING OBJECTIVE)
Learning Objectives BriefExercises Exercises Problems
1. Explain the concept of depreciation.
2. Identify the factors involved in the depreciationprocess.
2, 3, 4, 5, 7 1, 2, 3, 4, 5, 6,7, 8, 9, 10, 11,12, 13, 14, 15
1, 2, 3,4, 5, 6,7, 8
3. Compare activity, straight-line and diminishing-charge methods of depreciation.
1, 2, 3, 4, 7 1, 2, 3, 4, 5, 6,7, 8, 9, 10, 11,12, 13, 14, 15
1, 2, 3, 4,5, 6, 7,8, 12
4. Explain component depreciation. 6, 8 9, 16, 17
5. Explain the accounting issues related to assetimpairment.
9 18, 19, 20 9, 10
6. Explain the accounting procedures fordepletion of mineral resources.
10 21, 22, 23 11, 12
7. Explain the accounting for revaluations. 11 24, 25, 26,27, 29
5, 13, 14
8. Explain how to report and analyze property,plant, equipment, and mineral resources.
12 28
*9. Explain revaluation accounting procedures. 11 29 13, 14
Copyright © 2011 John Wiley & Sons, Inc. Kieso, IFRS, 1/e, Solutions Manual (For Instructor Use Only) 11-3
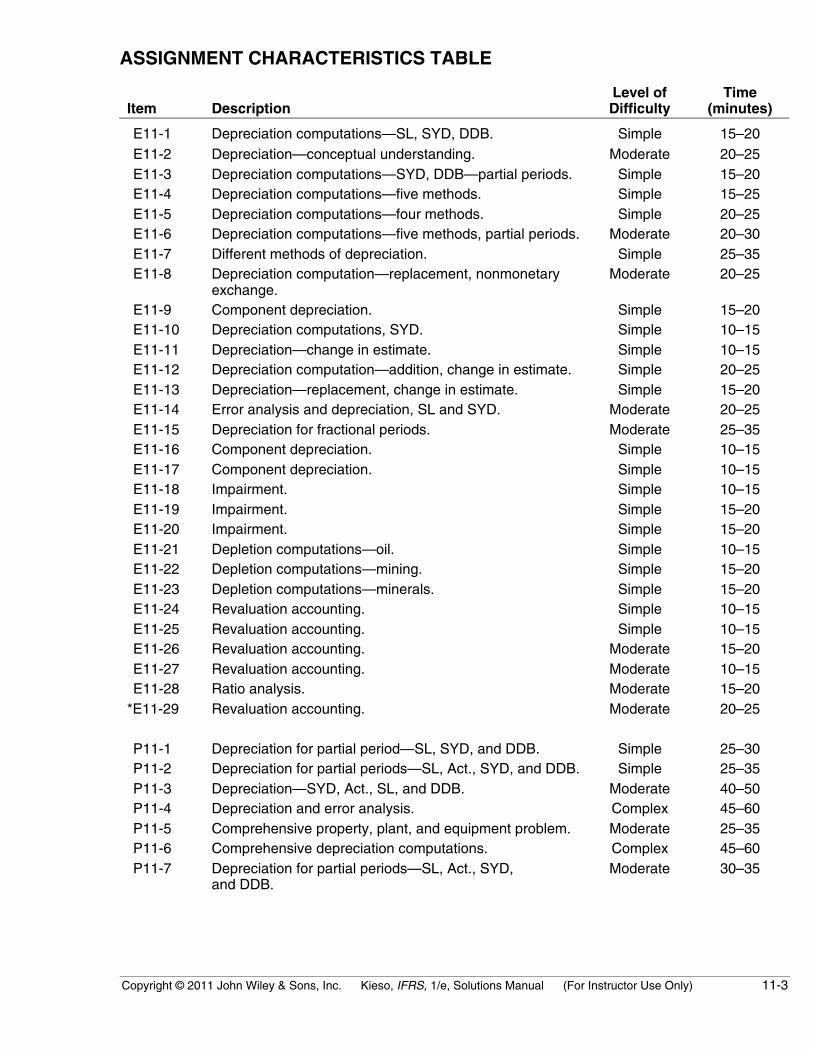
ASSIGNMENT CHARACTERISTICS TABLE
Item DescriptionLevel ofDifficulty
Time(minutes)
E11-1 Depreciation computations—SL, SYD, DDB. Simple 15–20 E11-2 Depreciation—conceptual understanding. Moderate 20–25 E11-3 Depreciation computations—SYD, DDB—partial periods. Simple 15–20 E11-4 Depreciation computations—five methods. Simple 15–25 E11-5 Depreciation computations—four methods. Simple 20–25 E11-6 Depreciation computations—five methods, partial periods. Moderate 20–30 E11-7 Different methods of depreciation. Simple 25–35 E11-8 Depreciation computation—replacement, nonmonetary
exchange.Moderate 20–25
E11-9 Component depreciation. Simple 15–20 E11-10 Depreciation computations, SYD. Simple 10–15 E11-11 Depreciation—change in estimate. Simple 10–15 E11-12 Depreciation computation—addition, change in estimate. Simple 20–25 E11-13 Depreciation—replacement, change in estimate. Simple 15–20 E11-14 Error analysis and depreciation, SL and SYD. Moderate 20–25 E11-15 Depreciation for fractional periods. Moderate 25–35 E11-16 Component depreciation. Simple 10–15 E11-17 Component depreciation. Simple 10–15 E11-18 Impairment. Simple 10–15 E11-19 Impairment. Simple 15–20 E11-20 Impairment. Simple 15–20 E11-21 Depletion computations—oil. Simple 10–15 E11-22 Depletion computations—mining. Simple 15–20 E11-23 Depletion computations—minerals. Simple 15–20 E11-24 Revaluation accounting. Simple 10–15 E11-25 Revaluation accounting. Simple 10–15 E11-26 Revaluation accounting. Moderate 15–20 E11-27 Revaluation accounting. Moderate 10–15 E11-28 Ratio analysis. Moderate 15–20*E11-29 Revaluation accounting. Moderate 20–25
P11-1 Depreciation for partial period—SL, SYD, and DDB. Simple 25–30 P11-2 Depreciation for partial periods—SL, Act., SYD, and DDB. Simple 25–35 P11-3 Depreciation—SYD, Act., SL, and DDB. Moderate 40–50 P11-4 Depreciation and error analysis. Complex 45–60 P11-5 Comprehensive property, plant, and equipment problem. Moderate 25–35 P11-6 Comprehensive depreciation computations. Complex 45–60 P11-7 Depreciation for partial periods—SL, Act., SYD,
and DDB.Moderate 30–35
11-4 Copyright © 2011 John Wiley & Sons, Inc. Kieso, IFRS, 1/e, Solutions Manual (For Instructor Use Only)
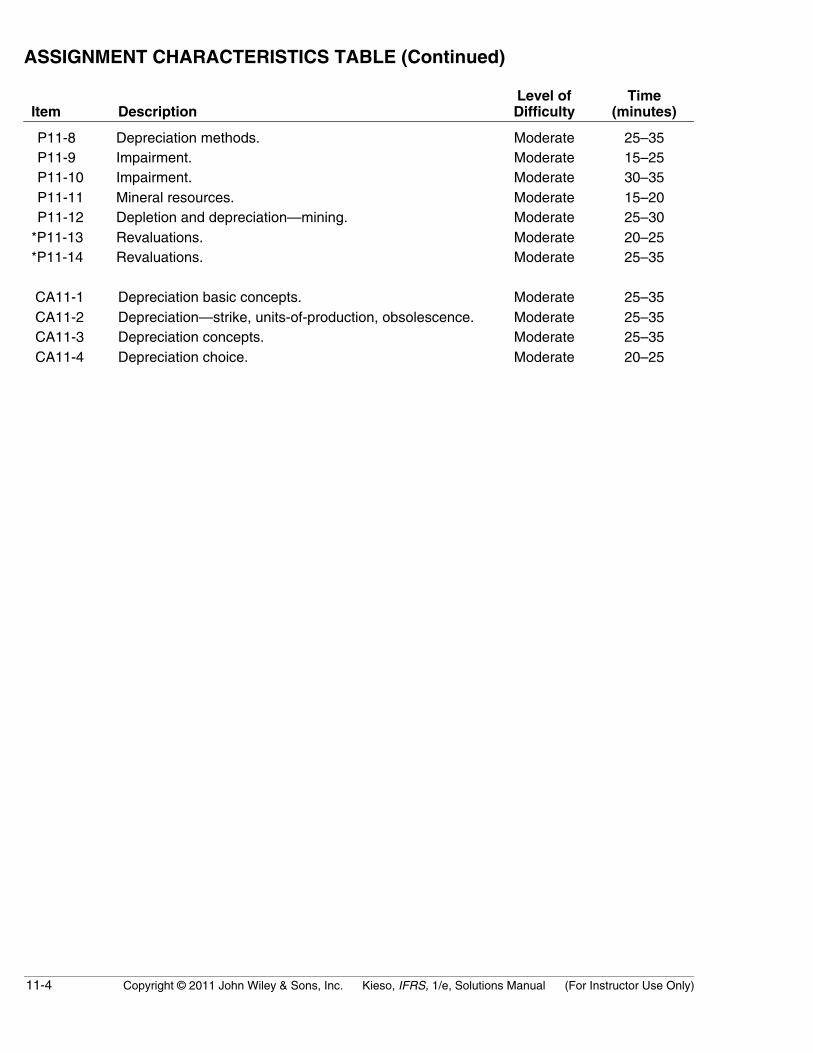
ASSIGNMENT CHARACTERISTICS TABLE (Continued)
Item DescriptionLevel ofDifficulty
Time(minutes)
P11-8 Depreciation methods. Moderate 25–35 P11-9 Impairment. Moderate 15–25 P11-10 Impairment. Moderate 30–35 P11-11 Mineral resources. Moderate 15–20 P11-12 Depletion and depreciation—mining. Moderate 25–30*P11-13 Revaluations. Moderate 20–25*P11-14 Revaluations. Moderate 25–35
CA11-1 Depreciation basic concepts. Moderate 25–35 CA11-2 Depreciation—strike, units-of-production, obsolescence. Moderate 25–35 CA11-3 Depreciation concepts. Moderate 25–35 CA11-4 Depreciation choice. Moderate 20–25

Copyright © 2011 John Wiley & Sons, Inc. Kieso, IFRS, 1/e, Solutions Manual (For Instructor Use Only) 11-5
ANSWERS TO QUESTIONS
1. The differences among the terms depreciation, depletion, and amortization are that they imply acost allocation of different types of assets. Depreciation is employed to indicate that tangible plantassets have decreased in carrying value. Where mineral resources (wasting assets) such as timber,oil, coal, and lead are involved, the term depletion is used. The expiration of intangible assets suchas patents or copyrights is referred to as amortization.
2. The factors relevant in determining the annual depreciation for a depreciable asset are the initialrecorded amount (cost), estimated residual value, estimated useful life, and depreciation method.
Assets are typically recorded at their acquisition cost, which is in most cases objectively determinable.But cost assignment in other cases—“basket purchases” and the selection of an implicit interest rate inasset acquisitions under deferred-payment plans—may be quite subjective, involving considerablejudgment.
The residual value is an estimate of an amount potentially realizable when the asset is retired fromservice. The estimate is based on judgment and is affected by the length of the useful life of the asset.
The useful life is also based on judgment. It involves selecting the “unit” of measure of service lifeand estimating the number of such units embodied in the asset. Such units may be measured interms of time periods or in terms of activity (for example, years or machine hours). When selecting thelife, one should select the lower (shorter) of the physical life or the economic life. Physical life involveswear and tear and casualties; economic life involves such things as technological obsolescenceand inadequacy.
Selecting the depreciation method is generally a judgment decision, but a method may be inherentin the definition adopted for the units of service life, as discussed earlier. For example, if such unitsare machine hours, the method is a function of the number of machine hours used during eachperiod. A method should be selected that will best measure the portion of services expiring eachperiod. Once a method is selected, it may be objectively applied by using a predetermined, objec-tively derived formula.
3. Disagree. Accounting depreciation is defined as an accounting process of allocating the costs oftangible assets to expense in a systematic and rational manner to the periods expected to benefit fromthe use of the asset. Thus, depreciation is not a matter of valuation but a means of cost allocation.
4. The carrying value of property, plant, and equipment is its cost less accumulated depreciation. If thecompany estimates that the asset will have an unrealistically long life, periodic depreciationcharges, and hence accumulated depreciation, will be lower. As a result the carrying value of theasset will be higher.
5. A change in the amount of annual depreciation recorded does not change the facts about the declinein economic usefulness. It merely changes reported figures. Depreciation in accounting consists ofallocating the cost of an asset over its useful life in a systematic and rational manner. Abnormalobsolescence, as suggested by the plant manager, would justify more rapid depreciation, butincreasing the depreciation charge would not necessarily result in funds for replacement. It wouldnot increase revenue but simply make reported income lower than it would have been, thuspreventing overstatement of net income.
Recording depreciation on the books does not set aside any assets for eventual replacement ofthe depreciated assets. Fund segregation can be accomplished but it requires additional managerialaction. Unless an increase in depreciation is accompanied by an increase in sales price of theproduct, or unless it affects management’s decision on dividend policy, it does not affect funds.
11-6 Copyright © 2011 John Wiley & Sons, Inc. Kieso, IFRS, 1/e, Solutions Manual (For Instructor Use Only)
Questions Chapter 11 (Continued)
Ordinarily higher depreciation will not lead to higher sales prices and thus to more rapid “recovery”of the cost of the asset, and the economic factors present would have permitted this higher priceregardless of the excuse given or the particular rationalization used. The price could have beenincreased without a higher depreciation charge.
The funds of a firm operating profitably do increase, but these may be used as working capitalpolicy may dictate. The measure of the increase in these funds from operations is not merely netincome, but that figure plus charges to operations which did not require working capital, lesscredits to operations which did not create working capital. The fact that net income alone does notmeasure the increase in funds from profitable operations leads some non-accountants to theerroneous conclusion that a fund is being created and that the amount of depreciation recordedaffects the fund accumulation.
Acceleration of depreciation for purposes of income tax calculation stands in a slightly differentcategory, since this is not merely a matter of recordkeeping. Increased depreciation will tend topostpone tax payments, and thus temporarily increase funds (although the liability for taxes maybe the same or even greater in the long run than it would have been) and generate gain to the firmto the extent of the value of use of the extra funds.
6. Assets are retired for one of two reasons: physical factors or economic factors—or a combinationof both. Physical factors are the wear and tear, decay, and casualty factors which hinder the assetfrom performing indefinitely. Economic factors can be interpreted to mean any other constraint thatdevelops to hinder the service life of an asset. Some accountants attempt to classify the economicfactors into three groups: inadequacy, supersession, and obsolescence. Inadequacy is definedas a situation where an asset is no longer useful to a given enterprise because the demands of thefirm have increased. Supersession is defined as a situation where the replacement of an assetoccurs because another asset is more efficient and economical. Obsolescence is the catchallterm that encompasses all other situations and is sometimes referred to as the major conceptwhen economic factors are considered.
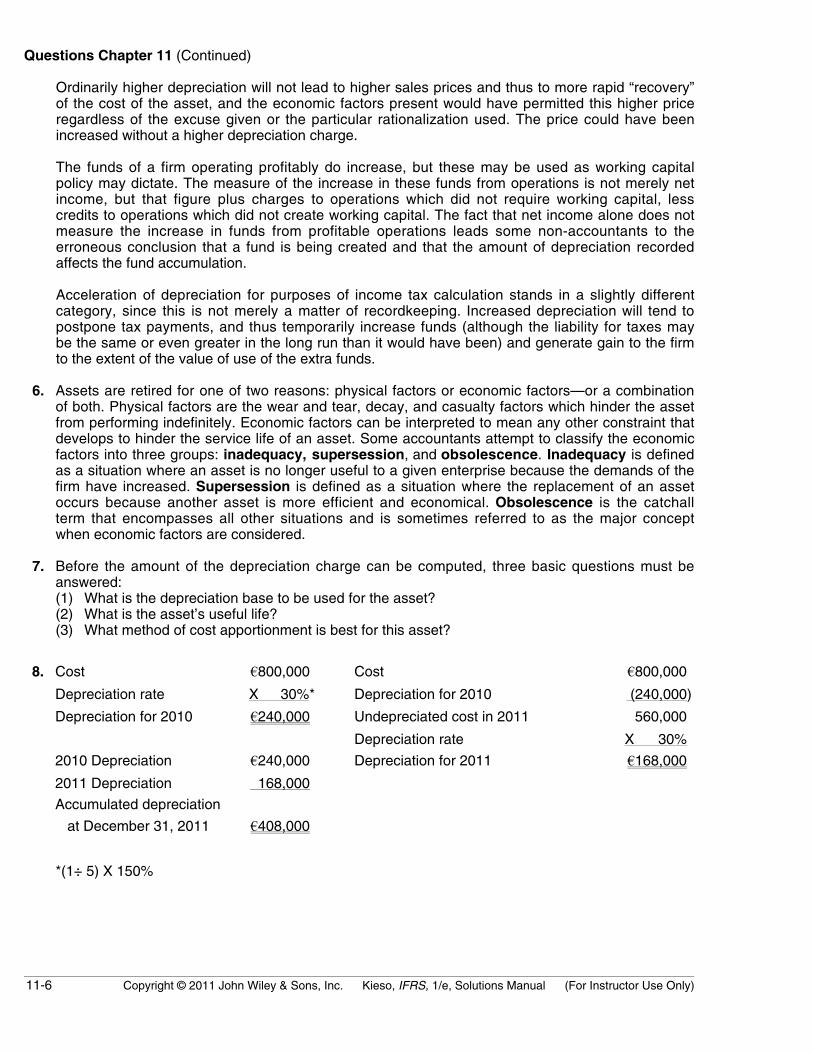
7. Before the amount of the depreciation charge can be computed, three basic questions must beanswered:(1) What is the depreciation base to be used for the asset?(2) What is the asset’s useful life?(3) What method of cost apportionment is best for this asset?
8. Cost €800,000 Cost €800,000
Depreciation rate X 30%* Depreciation for 2010 (240,000)
Depreciation for 2010 €240,000 Undepreciated cost in 2011 560,000
Depreciation rate X 30%
2010 Depreciation €240,000 Depreciation for 2011 €168,000
2011 Depreciation 168,000
Accumulated depreciation
at December 31, 2011 €408,000
*(1÷ 5) X 150%
Copyright © 2011 John Wiley & Sons, Inc. Kieso, IFRS, 1/e, Solutions Manual (For Instructor Use Only) 11-7
Questions Chapter 11 (Continued)
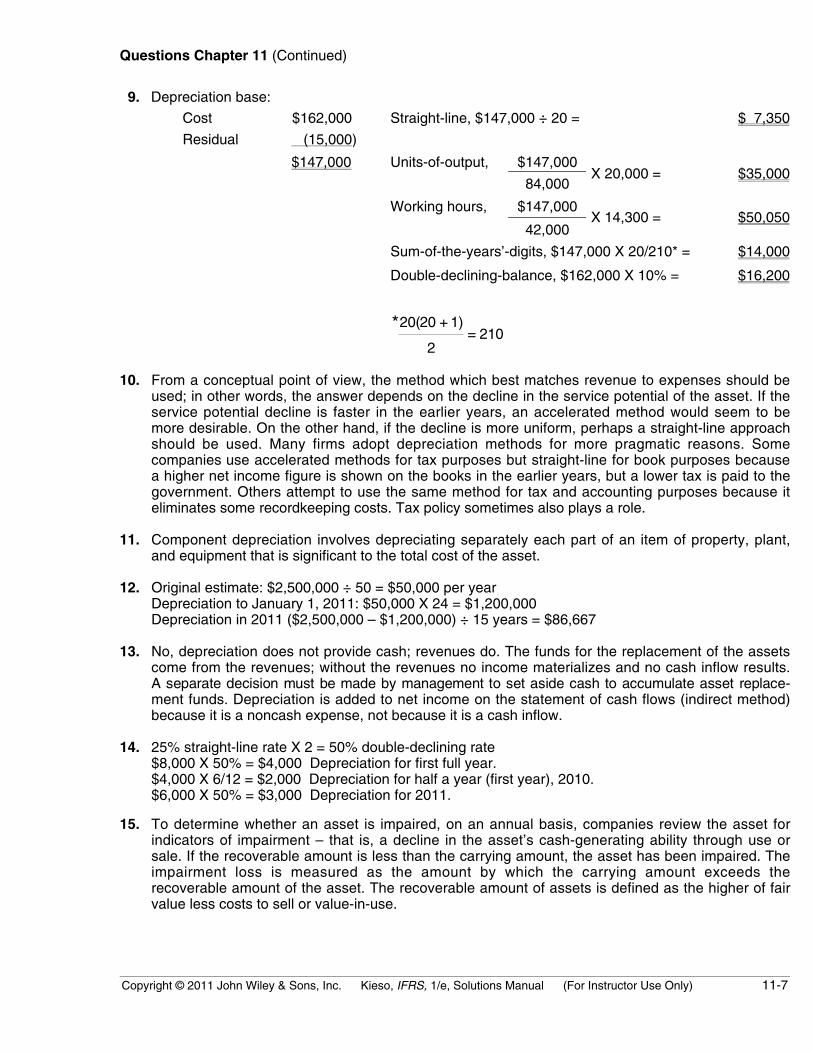
9. Depreciation base:
Cost $162,000 Straight-line, $147,000 ÷ 20 = $ 7,350
Residual (15,000)
$147,000 Units-of-output, $147,000
84,000 X 20,000 = $35,000
Working hours, $147,000
42,000 X 14,300 = $50,050
Sum-of-the-years’-digits, $147,000 X 20/210* = $14,000
Double-declining-balance, $162,000 X 10% = $16,200
*20(20 + 1)
2= 210
10. From a conceptual point of view, the method which best matches revenue to expenses should beused; in other words, the answer depends on the decline in the service potential of the asset. If theservice potential decline is faster in the earlier years, an accelerated method would seem to bemore desirable. On the other hand, if the decline is more uniform, perhaps a straight-line approachshould be used. Many firms adopt depreciation methods for more pragmatic reasons. Somecompanies use accelerated methods for tax purposes but straight-line for book purposes becausea higher net income figure is shown on the books in the earlier years, but a lower tax is paid to thegovernment. Others attempt to use the same method for tax and accounting purposes because iteliminates some recordkeeping costs. Tax policy sometimes also plays a role.
11. Component depreciation involves depreciating separately each part of an item of property, plant,and equipment that is significant to the total cost of the asset.
12. Original estimate: $2,500,000 ÷ 50 = $50,000 per yearDepreciation to January 1, 2011: $50,000 X 24 = $1,200,000Depreciation in 2011 ($2,500,000 – $1,200,000) ÷ 15 years = $86,667
13. No, depreciation does not provide cash; revenues do. The funds for the replacement of the assetscome from the revenues; without the revenues no income materializes and no cash inflow results.A separate decision must be made by management to set aside cash to accumulate asset replace-ment funds. Depreciation is added to net income on the statement of cash flows (indirect method)because it is a noncash expense, not because it is a cash inflow.
14. 25% straight-line rate X 2 = 50% double-declining rate$8,000 X 50% = $4,000 Depreciation for first full year.$4,000 X 6/12 = $2,000 Depreciation for half a year (first year), 2010.$6,000 X 50% = $3,000 Depreciation for 2011.
15. To determine whether an asset is impaired, on an annual basis, companies review the asset forindicators of impairment – that is, a decline in the asset’s cash-generating ability through use orsale. If the recoverable amount is less than the carrying amount, the asset has been impaired. Theimpairment loss is measured as the amount by which the carrying amount exceeds therecoverable amount of the asset. The recoverable amount of assets is defined as the higher of fairvalue less costs to sell or value-in-use.
11-8 Copyright © 2011 John Wiley & Sons, Inc. Kieso, IFRS, 1/e, Solutions Manual (For Instructor Use Only)
Questions Chapter 11 (Continued)
16. Under IFRS, impairment losses on plant assets may be restored as long as the write-up is nevergreater than the carrying amount before impairment.
17. An impairment is deemed to have occurred if, in applying the impairment test, the carrying amountof the asset exceeds the recoverable amount of the asset. In this case, the value-in-use of€705,000 exceeds the carrying amount of the equipment of €700,000 so no impairment isassumed to have occurred; thus no measurement of the loss is made or recognized even thoughthe fair value is €590,000.
18. Impairment losses are reported as part of operating income generally in the “Other income andexpense” section. Impairment losses (and recovery of impairment losses) are similar to other coststhat would flow through operations. Thus, gains (recoveries of losses) on long-lived assets should bereported as part of operating income in the “Other income and expense” section of the incomestatement.
19. In a decision to replace or not to replace an asset, the undepreciated cost of the old asset is not afactor to be considered. Therefore, the decision to replace plant assets should not be affected bythe amount of depreciation that has been recorded. The relative efficiency of new equipment ascompared with that presently in use, the cost of the new facilities, the availability of capital for thenew asset, etc., are the factors entering into the decision. Normally, the fact that the asset hadbeen fully depreciated through the use of some accelerated depreciation method, although theasset was still in use, should not cause management to decide to replace the asset. If the newasset under consideration for replacement was not any more efficient than the old, or if it cost agood deal more in relationship to its efficiency, it is illogical for management to replace it merelybecause all or the major portion of the cost had been charged off for tax and accounting purposes.
If depreciation rates were higher it might be true that a business would be financially more able toreplace assets, since during the earlier years of the asset’s use a larger portion of its cost wouldhave been charged to expense, and hence during this period a smaller amount of income tax paid.By selling the old asset, which might result in a capital gain, and purchasing a new asset, thehigher depreciation charge might be continued for tax purposes. However, if the asset were tradedin, having taken higher depreciation would result in a lower basis for the new asset.
It should be noted that expansion (not merely replacement) might be encouraged by increaseddepreciation rates. Management might be encouraged to expand, believing that in the first fewyears when they are reasonably sure that the expanded facilities will be profitable, they can chargeoff a substantial portion of the cost as depreciation for tax purposes. Similarly, since a replacementinvolves additional capital outlays, the tax treatment may have some influence.
Also, because of the inducement to expand or to start new businesses, there may be a tendencyin the economy as a whole for the accounting and tax treatment of the cost of plant assets toinfluence the retirement of old plant assets.
It should be noted that to the extent that increased depreciation causes management to alter itsdecision about replacement, it is not matching costs and revenues in the closest possible manner.

Copyright © 2011 John Wiley & Sons, Inc. Kieso, IFRS, 1/e, Solutions Manual (For Instructor Use Only) 11-9
Questions Chapter 11 (Continued)
20. (a) Depreciation and cost depletion are similar in the accounting sense in that:1. The cost of the asset is the starting point from which computation of the amount of the
periodic charge to operations is made.2. The estimated life is based on economic or productive life.3. The accumulated total of past charges to operations is deducted from the original cost of
the asset on the balance sheet.4. When output methods of computing depreciation charges are used, the formulas are
essentially the same as those used in computing depletion charges.5. Both represent an apportionment of cost under the process of matching costs with revenue.6. Assets subject to either are reported in the same classification on the balance sheet.7. Appraisal values are sometimes used for depreciation while discovery values are sometimes
used for depletion.8. Residual value is properly recognized in computing the charge to operations.9. They may be included in inventory if the related asset contributed to the production of the
inventory.10. The rates may be changed upon revision of the estimated productive life used in the
original rate computations.
(b) Depreciation and cost depletion are dissimilar in the accounting sense in that:1. Depletion is almost always based on output whereas depreciation is usually based on time.2. Many formulas are used in computing depreciation but only one is used to any extent in
computing depletion.3. Depletion applies to natural resources while depreciation applies to plant and equipment.4. Depletion refers to the physical exhaustion or consumption of the asset while depreciation
refers to the wear, tear, and obsolescence of the asset.5. Under statutes which base the legality of dividends on accumulated earnings, depreciation
is usually a required deduction but depletion is usually not a required deduction.6. The computation of the depletion rate is usually much less precise than the computation of
depreciation rates because of the greater uncertainty in estimating the productive life.7. A difference that is temporary in nature arises from the timing of the recognition of depre-
ciation under conventional accounting and under tax laws, and it results in the recording ofdeferred income taxes. On the other hand, the difference between cost depletion underconventional accounting and its counterpart, percentage depletion, under the tax laws ispermanent and does not require the recording of deferred income taxes.
21. Cost depletion is the procedure by which the capitalized costs, less residual land values, of a naturalresource are systematically charged to operations. The purpose of this procedure is to match thecost of the resource with the revenue it generates. The usual method is to divide the total cost lessresidual value by the estimated number of recoverable units to arrive at a depletion charge foreach unit removed. A change in the estimate of recoverable units will necessitate a revision of theunit charge.
22. Exploration costs include expenditures for topographical and geophysical study exploratory drillingand activities to evaluate the technical feasibility of extracting a mineral resource. Developmentcosts are exploration costs reclassified once technical feasibility and commercial viability ofproduction are demonstrated.
23. The maximum dividend permissible is the amount of accumulated net income (after depletion) plusthe amount of depletion charged. This practice can be justified for companies that expect to extractnatural resources and not purchase additional properties. In effect, such companies are distributinggradually to stockholders their original investments.
11-10 Copyright © 2011 John Wiley & Sons, Inc. Kieso, IFRS, 1/e, Solutions Manual (For Instructor Use Only)
Questions Chapter 11 (Continued)
24. Using full-cost accounting, the cost of unsuccessful ventures as well as those that are successful arecapitalized, because a cost of drilling a dry hole is a cost that is needed to find the commerciallyprofitable wells. Successful efforts accounting capitalizes only those costs related to successfulprojects. They contend that to measure cost and effort accurately for a single property unit, the onlymeasure is in terms of the cost directly related to that unit. In addition, it is argued that full-cost ismisleading because capitalizing all costs will make an unsuccessful company over a short period oftime show no less income than does one that is successful.
25. The land should be reported on the statement of financial position at ¥20,000,000 and anunrealized gain of ¥5,000,000 is reported as other comprehensive income in the statement ofcomprehensive income.
26. A major reason must companies do not use revaluation accounting is the substantial andcontinuing costs associated with appraisals to determine fair value. In addition, losses associatedwith revaluation below historical cost decrease net income. However, revaluation increases resultin higher depreciation expense and lower income.
27. Asset turnover ratio:
$41$140
= .293 times
Rate of return on assets:
$3$140
= 2.1%
28. IFRS adheres to many of the same principles of U.S. GAAP in the accounting for property, plant,and equipment. Key similarities are: (1) Under IFRS, capitalization of interest or borrowing costsincurred during construction of assets can either be expensed or capitalized. Once certain criteriaare met, interest must be capitalized (this accounting has recently converged to U.S. GAAP;(2) IFRS, like U.S. GAAP, capitalizes all direct costs in self-constructed assets. IFRS does notaddress the capitalization of fixed overhead, although in practice, these costs are generally capitalized;(3) The accounting for exchange of non-monetary assets has recently converged between IFRSand U.S. GAAP. U.S GAAP now requires that gains on exchanges of non-monetary assets berecognized if the exchange has commercial substance. This is the framework used in IFRS;(4) IFRS also views depreciation as an allocation of cost over an asset’s life; IFRS permits thesame depreciation methods (straight-line, accelerated, units-of-production) as U.S. GAAP. KeyDifference: IFRS permits asset revaluations (which are not permitted in U.S. GAAP.) Conse-quently, for the companies that use the revaluation framework, revaluation depreciation proceduresmust be followed. According to IAS 16, if revaluation is used, it must be applied to all assets in aclass of assets and assets must be revalued on an annual basis.
29. While there is a single key difference, it is an important one–the issue of revaluations. With respectto revaluations, the IASB and the FASB are working on a joint project to converge their conceptualframeworks. One element of that project will examine the measurement bases used in accounting.It is too early to say whether a converged conceptual framework will recommend fair valuemeasurement (and revaluation accounting) for property, plant, and equipment. However, this islikely to be one of the more contentious issues, given the long-standing use of historical cost as ameasurement basis in U.S. GAAP.

Copyright © 2011 John Wiley & Sons, Inc. Kieso, IFRS, 1/e, Solutions Manual (For Instructor Use Only) 11-11
Questions Chapter 11 (Continued)
30. Mandive makes the following journal entries in year 1, assuming straight-line depreciation.
Depreciation Expense ............................................................................................... 100,000Accumulated Depreciation—Plant Assets................................................ 100,000
To record depreciation expense in year 1
Accumulated Depreciation—Plant Assets............................................................. 100,000Plant Assets.................................................................................................... 40,000Unrealized Gain on Revaluation—Equipment......................................... 60,000
To adjust the plant assets to fair value and record unrealized gain
Thus, there is a 2-step process. First, record depreciation based on the cost of $400,000. As a result,depreciation expense of $100,000 is reported on the income statement. Secondly, the revaluation of$60,000 which is the difference between the fair value of $360,000 and the book value of $300,000is recorded.
Note to Instructor: The unrealized gain is reported in equity as a component of other comprehensiveincome. Mandive now reports the following information at the end of year 1 for its plant assets:
Plant Assets ($400,000 – $40,000) ........................................................................ $360,000Accumulated depreciation—Plant assets .............................................................. –0– Book value ................................................................................................................... $360,000Unrealized gain ........................................................................................................... $ 60,000
As indicated, $360,000 is the new basis of the asset. Depreciation expense of $100,000 is reportedin the income statement and $60,000 is reported in other comprehensive income. The $60,000 ofother comprehensive income then is also reported as an unrealized gain in the statement of financialposition. Assuming no change in the useful life, depreciation in year 2 will be $120,000 ($360,000 ÷ 3).
11-12 Copyright © 2011 John Wiley & Sons, Inc. Kieso, IFRS, 1/e, Solutions Manual (For Instructor Use Only)
SOLUTIONS TO BRIEF EXERCISES
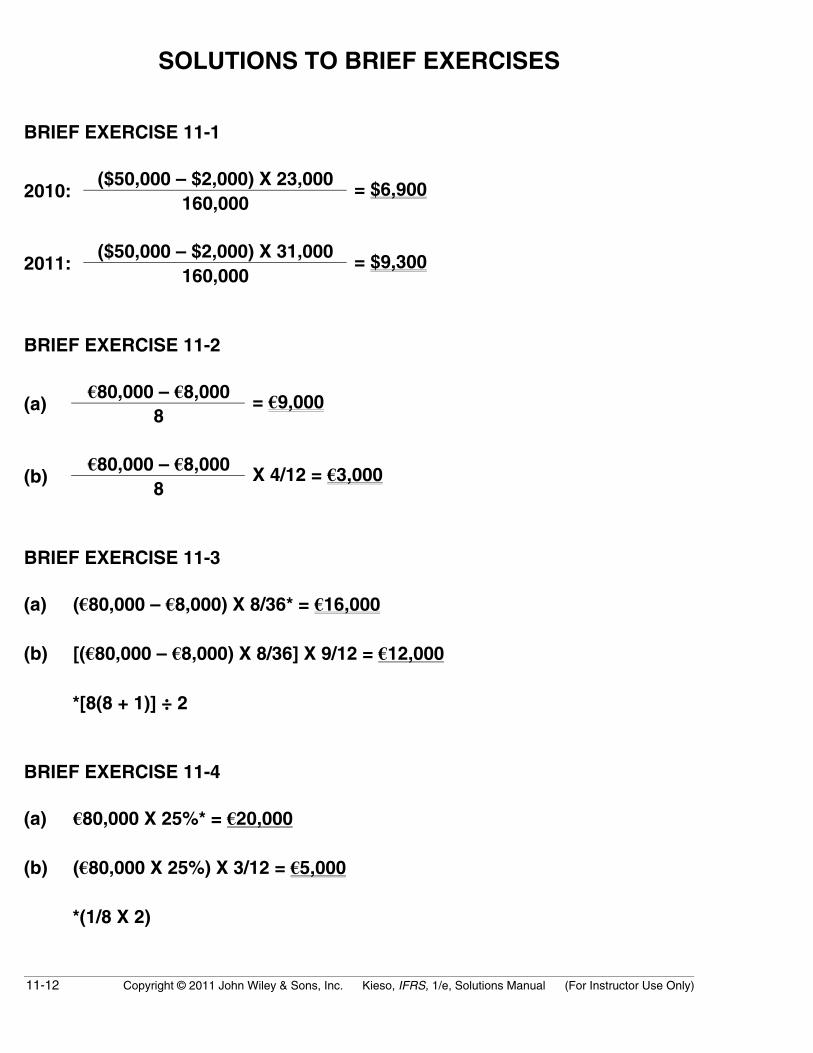
BRIEF EXERCISE 11-1
($50,000 – $2,000) X 23,0002010:
160,000= $6,900
($50,000 – $2,000) X 31,0002011:
160,000= $9,300
BRIEF EXERCISE 11-2
€80,000 – €8,000(a)
8= €9,000
€80,000 – €8,000(b)
8X 4/12 = €3,000
BRIEF EXERCISE 11-3
(a) (€80,000 – €8,000) X 8/36* = €16,000
(b) [(€80,000 – €8,000) X 8/36] X 9/12 = €12,000
*[8(8 + 1)] ÷ 2
BRIEF EXERCISE 11-4
(a) €80,000 X 25%* = €20,000
(b) (€80,000 X 25%) X 3/12 = €5,000
*(1/8 X 2)
Copyright © 2011 John Wiley & Sons, Inc. Kieso, IFRS, 1/e, Solutions Manual (For Instructor Use Only) 11-13
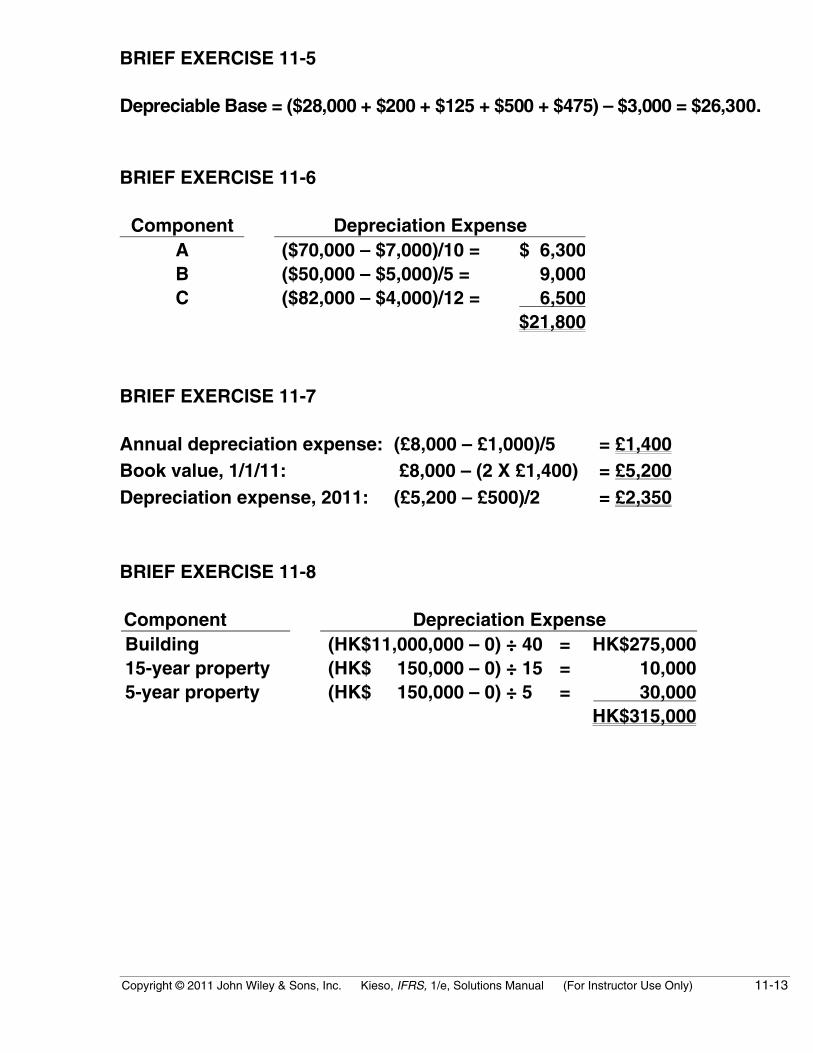
BRIEF EXERCISE 11-5
Depreciable Base = ($28,000 + $200 + $125 + $500 + $475) – $3,000 = $26,300.
BRIEF EXERCISE 11-6
Component Depreciation ExpenseA ($70,000 – $7,000)/10 = $ 6,300B ($50,000 – $5,000)/5 = 9,000C ($82,000 – $4,000)/12 = 6,500
$21,800
BRIEF EXERCISE 11-7
Annual depreciation expense: (£8,000 – £1,000)/5 = £1,400Book value, 1/1/11: £8,000 – (2 X £1,400) = £5,200Depreciation expense, 2011: (£5,200 – £500)/2 = £2,350
BRIEF EXERCISE 11-8
Component Depreciation ExpenseBuilding (HK$11,000,000 – 0) ÷ 40 = HK$275,00015-year property (HK$ 150,000 – 0) ÷ 15 = 10,0005-year property (HK$ 150,000 – 0) ÷ 5 = 30,000
HK$315,000
11-14 Copyright © 2011 John Wiley & Sons, Inc. Kieso, IFRS, 1/e, Solutions Manual (For Instructor Use Only)
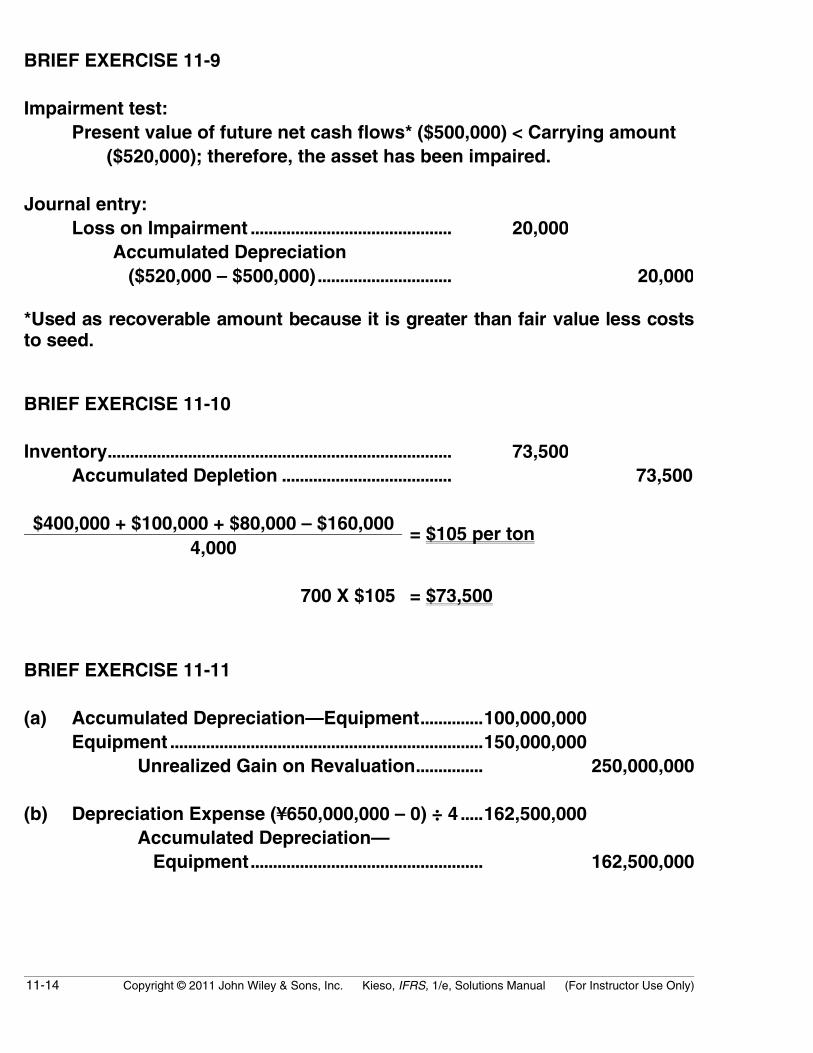
BRIEF EXERCISE 11-9
Impairment test:Present value of future net cash flows* ($500,000) < Carrying amount
($520,000); therefore, the asset has been impaired.
Journal entry:Loss on Impairment ............................................. 20,000 Accumulated Depreciation ($520,000 – $500,000).............................. 20,000
*Used as recoverable amount because it is greater than fair value less coststo seed.
BRIEF EXERCISE 11-10
Inventory............................................................................. 73,500Accumulated Depletion ...................................... 73,500
$400,000 + $100,000 + $80,000 – $160,0004,000
= $105 per ton
700 X $105 = $73,500
BRIEF EXERCISE 11-11
(a) Accumulated Depreciation—Equipment..............100,000,000Equipment ......................................................................150,000,000
Unrealized Gain on Revaluation............... 250,000,000
(b) Depreciation Expense (¥650,000,000 – 0) ÷ 4 .....162,500,000Accumulated Depreciation— Equipment.................................................... 162,500,000
Copyright © 2011 John Wiley & Sons, Inc. Kieso, IFRS, 1/e, Solutions Manual (For Instructor Use Only) 11-15
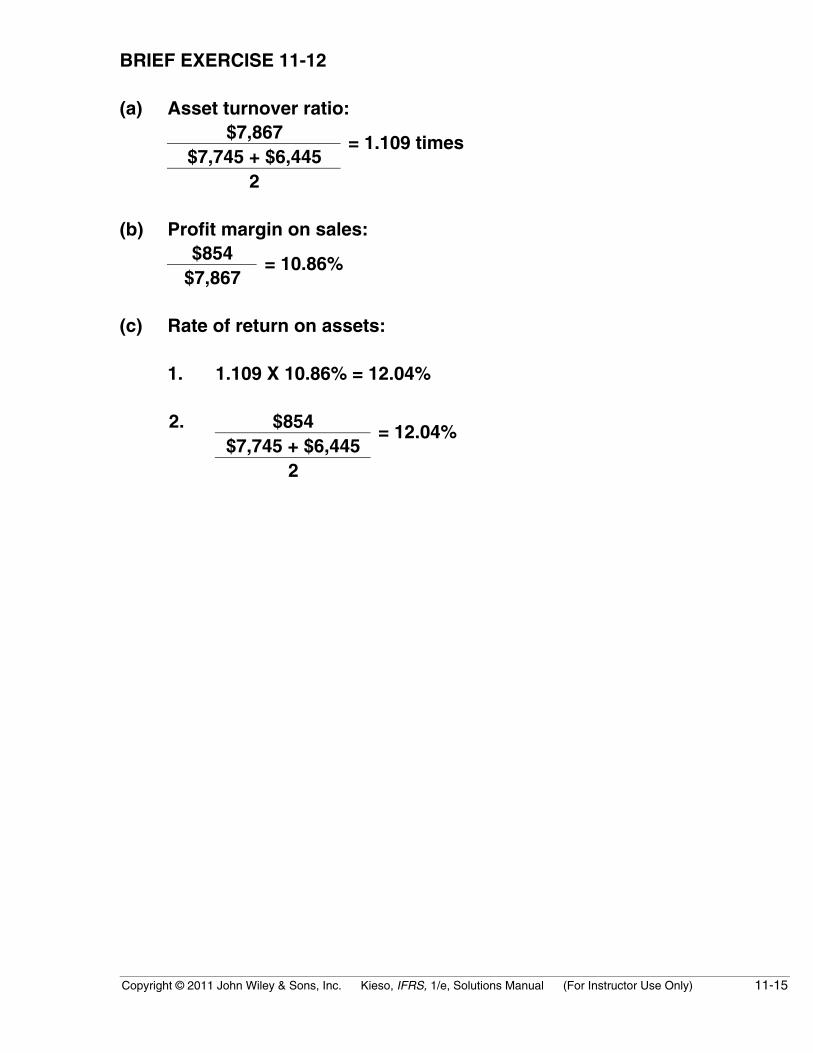
BRIEF EXERCISE 11-12
(a) Asset turnover ratio:$7,867
$7,745 + $6,445= 1.109 times
2
(b) Profit margin on sales:$854
$7,867= 10.86%
(c) Rate of return on assets:
1. 1.109 X 10.86% = 12.04%
2. $854$7,745 + $6,445
= 12.04%
2
11-16 Copyright © 2011 John Wiley & Sons, Inc. Kieso, IFRS, 1/e, Solutions Manual (For Instructor Use Only)
SOLUTIONS TO EXERCISES
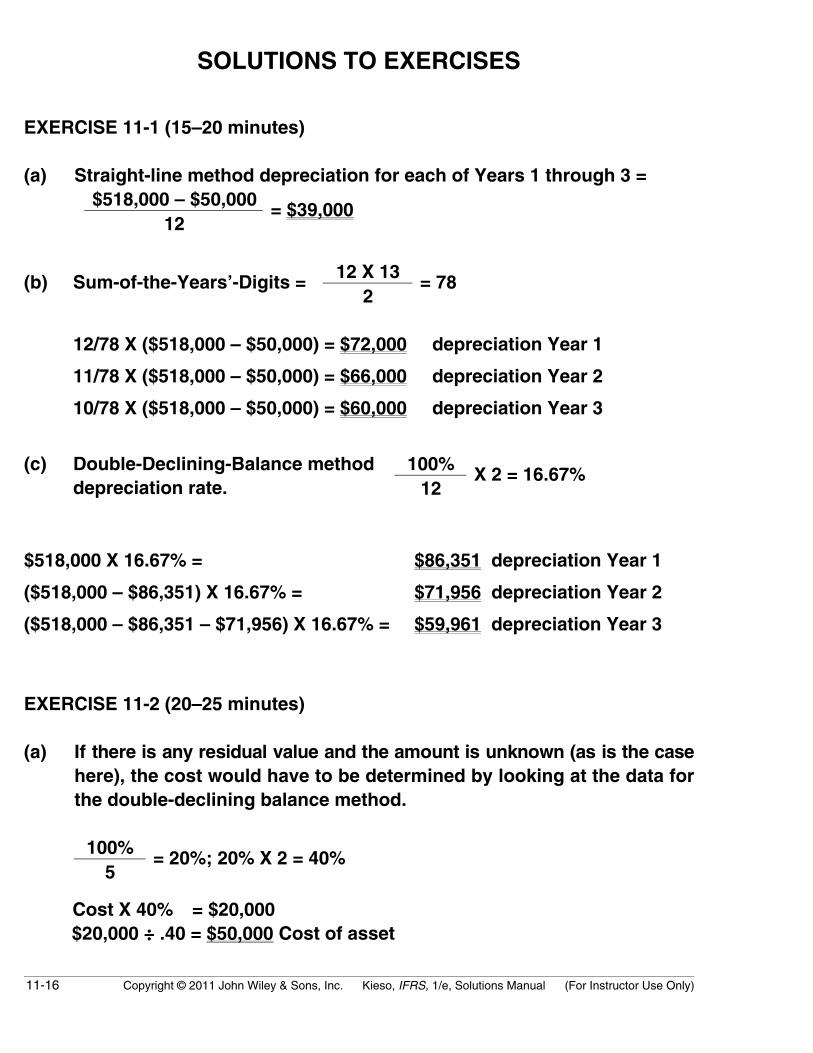
EXERCISE 11-1 (15–20 minutes)
(a) Straight-line method depreciation for each of Years 1 through 3 =$518,000 – $50,000
12= $39,000
12 X 13(b) Sum-of-the-Years’-Digits =2
= 78
12/78 X ($518,000 – $50,000) = $72,000 depreciation Year 1
11/78 X ($518,000 – $50,000) = $66,000 depreciation Year 2
10/78 X ($518,000 – $50,000) = $60,000 depreciation Year 3
100%(c)12
X 2 = 16.67%Double-Declining-Balance methoddepreciation rate.
$518,000 X 16.67% = $86,351 depreciation Year 1
($518,000 – $86,351) X 16.67% = $71,956 depreciation Year 2
($518,000 – $86,351 – $71,956) X 16.67% = $59,961 depreciation Year 3
EXERCISE 11-2 (20–25 minutes)
(a) If there is any residual value and the amount is unknown (as is the casehere), the cost would have to be determined by looking at the data forthe double-declining balance method.
100%5
= 20%; 20% X 2 = 40%
Cost X 40% = $20,000$20,000 ÷ .40 = $50,000 Cost of asset
Copyright © 2011 John Wiley & Sons, Inc. Kieso, IFRS, 1/e, Solutions Manual (For Instructor Use Only) 11-17
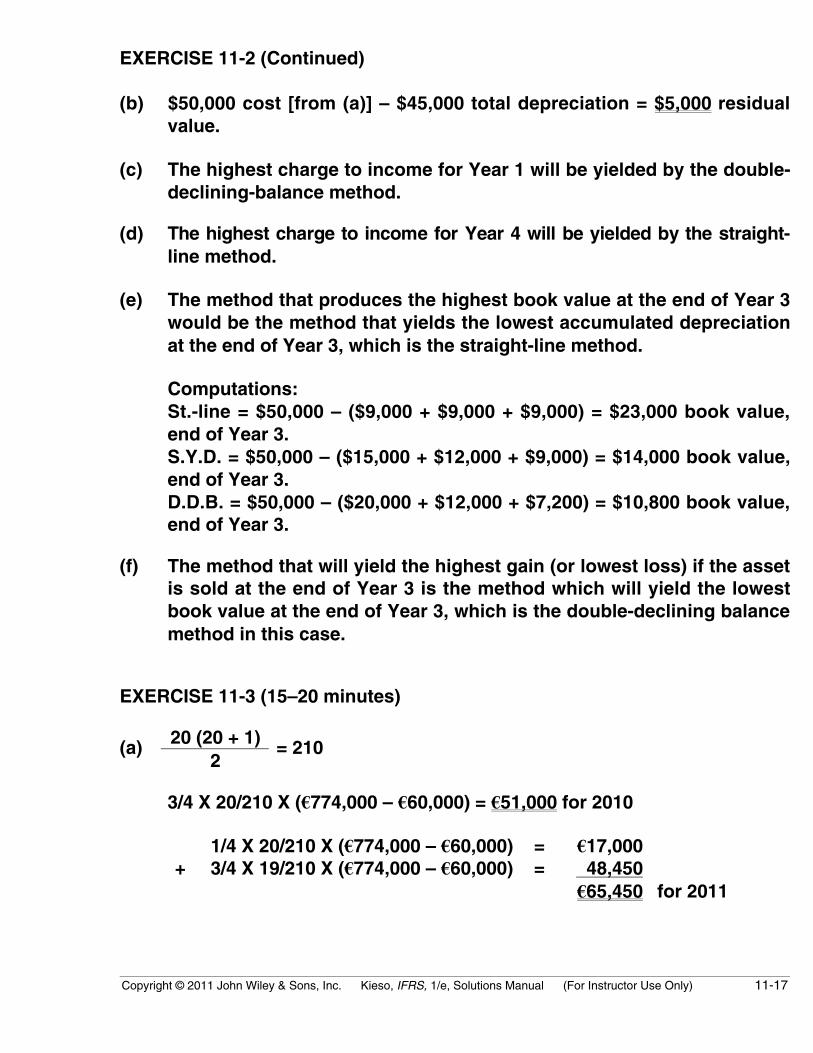
EXERCISE 11-2 (Continued)
(b) $50,000 cost [from (a)] – $45,000 total depreciation = $5,000 residualvalue.
(c) The highest charge to income for Year 1 will be yielded by the double-declining-balance method.
(d) The highest charge to income for Year 4 will be yielded by the straight-line method.
(e) The method that produces the highest book value at the end of Year 3would be the method that yields the lowest accumulated depreciationat the end of Year 3, which is the straight-line method.
Computations:St.-line = $50,000 – ($9,000 + $9,000 + $9,000) = $23,000 book value,end of Year 3.S.Y.D. = $50,000 – ($15,000 + $12,000 + $9,000) = $14,000 book value,end of Year 3.D.D.B. = $50,000 – ($20,000 + $12,000 + $7,200) = $10,800 book value,end of Year 3.
(f) The method that will yield the highest gain (or lowest loss) if the assetis sold at the end of Year 3 is the method which will yield the lowestbook value at the end of Year 3, which is the double-declining balancemethod in this case.
EXERCISE 11-3 (15–20 minutes)
20 (20 + 1)(a)2
= 210
3/4 X 20/210 X (€774,000 – €60,000) = €51,000 for 2010
1/4 X 20/210 X (€774,000 – €60,000) = €17,000+ 3/4 X 19/210 X (€774,000 – €60,000) = 48,450
€65,450 for 2011
11-18 Copyright © 2011 John Wiley & Sons, Inc. Kieso, IFRS, 1/e, Solutions Manual (For Instructor Use Only)
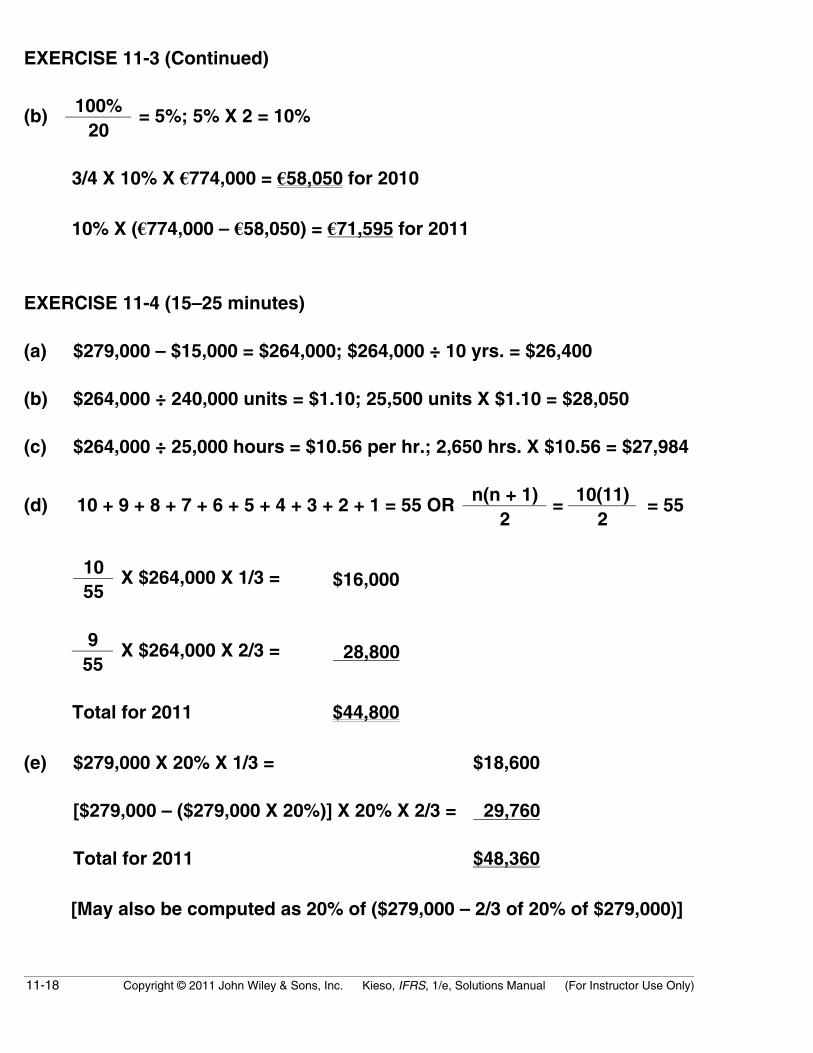
EXERCISE 11-3 (Continued)
100%(b)20
= 5%; 5% X 2 = 10%
3/4 X 10% X €774,000 = €58,050 for 2010
10% X (€774,000 – €58,050) = €71,595 for 2011
EXERCISE 11-4 (15–25 minutes)
(a) $279,000 – $15,000 = $264,000; $264,000 ÷ 10 yrs. = $26,400
(b) $264,000 ÷ 240,000 units = $1.10; 25,500 units X $1.10 = $28,050
(c) $264,000 ÷ 25,000 hours = $10.56 per hr.; 2,650 hrs. X $10.56 = $27,984
n(n + 1) 10(11)(d) 10 + 9 + 8 + 7 + 6 + 5 + 4 + 3 + 2 + 1 = 55 OR2
=2
= 55
1055
X $264,000 X 1/3 = $16,000
955
X $264,000 X 2/3 = 28,800
Total for 2011 $44,800
(e) $279,000 X 20% X 1/3 = $18,600
[$279,000 – ($279,000 X 20%)] X 20% X 2/3 = 29,760
Total for 2011 $48,360
[May also be computed as 20% of ($279,000 – 2/3 of 20% of $279,000)]
Copyright © 2011 John Wiley & Sons, Inc. Kieso, IFRS, 1/e, Solutions Manual (For Instructor Use Only) 11-19
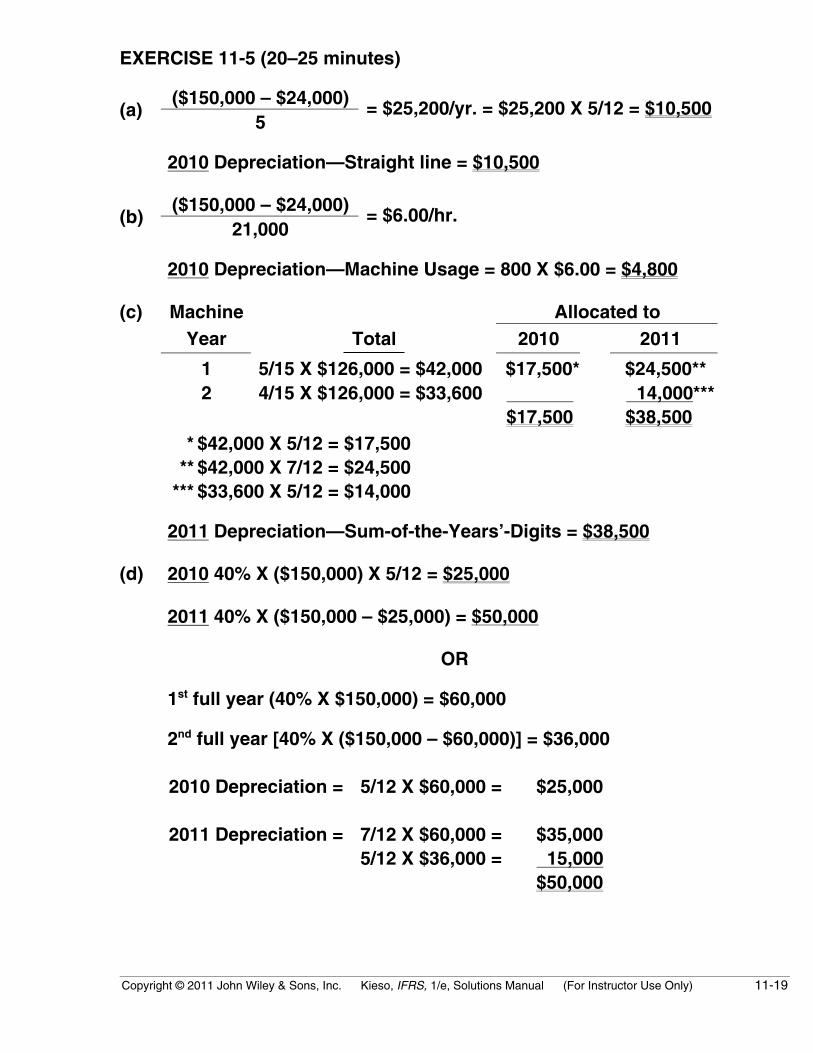
EXERCISE 11-5 (20–25 minutes)
($150,000 – $24,000)(a)
5= $25,200/yr. = $25,200 X 5/12 = $10,500
2010 Depreciation—Straight line = $10,500
($150,000 – $24,000)(b)
21,000= $6.00/hr.
2010 Depreciation—Machine Usage = 800 X $6.00 = $4,800
(c) Machine Allocated toYear Total 2010 2011
1 5/15 X $126,000 = $42,000 $17,500* $24,500**2 4/15 X $126,000 = $33,600 14,000***
$17,500 $38,500* $42,000 X 5/12 = $17,500
** $42,000 X 7/12 = $24,500*** $33,600 X 5/12 = $14,000
2011 Depreciation—Sum-of-the-Years’-Digits = $38,500
(d) 2010 40% X ($150,000) X 5/12 = $25,000
2011 40% X ($150,000 – $25,000) = $50,000
OR
1st full year (40% X $150,000) = $60,000
2nd full year [40% X ($150,000 – $60,000)] = $36,000
2010 Depreciation = 5/12 X $60,000 = $25,000
2011 Depreciation = 7/12 X $60,000 = $35,0005/12 X $36,000 = 15,000
$50,000
11-20 Copyright © 2011 John Wiley & Sons, Inc. Kieso, IFRS, 1/e, Solutions Manual (For Instructor Use Only)
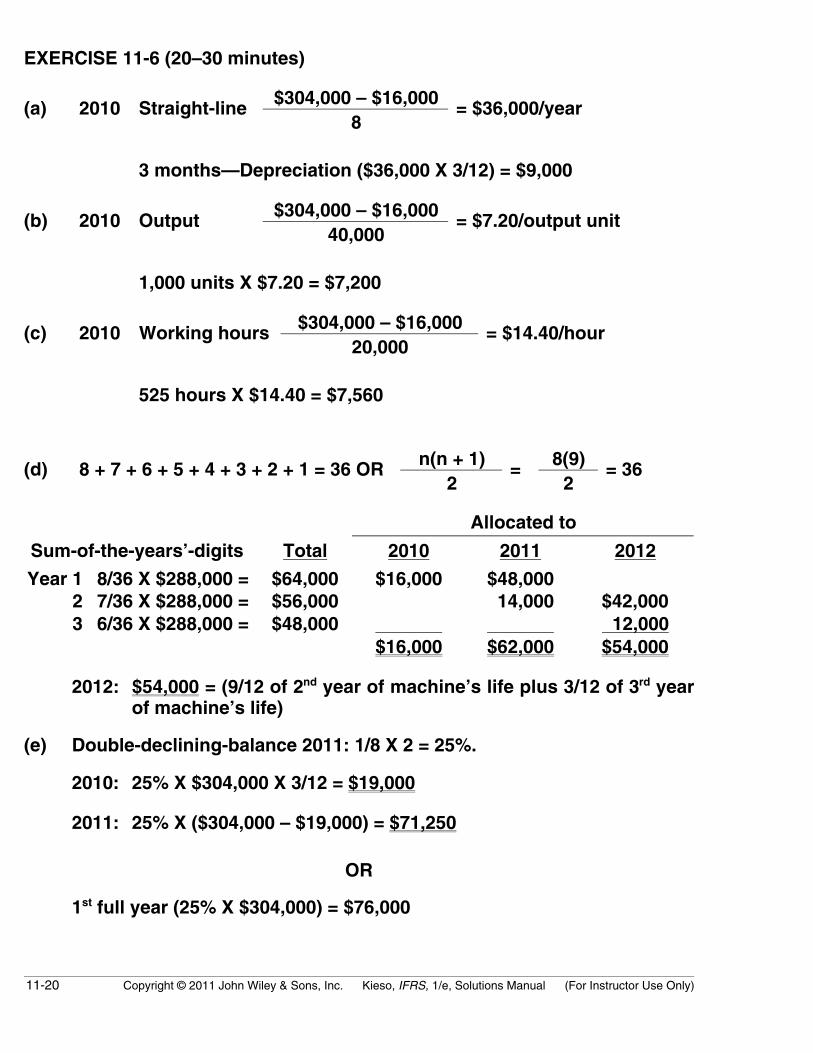
EXERCISE 11-6 (20–30 minutes)
$304,000 – $16,000(a) 2010 Straight-line8
= $36,000/year
3 months—Depreciation ($36,000 X 3/12) = $9,000
$304,000 – $16,000(b) 2010 Output40,000
= $7.20/output unit
1,000 units X $7.20 = $7,200
$304,000 – $16,000(c) 2010 Working hours20,000
= $14.40/hour
525 hours X $14.40 = $7,560
n(n + 1) 8(9)(d) 8 + 7 + 6 + 5 + 4 + 3 + 2 + 1 = 36 OR2
=2
= 36
Allocated to
Sum-of-the-years’-digits Total 2010 2011 2012
Year 1 8/36 X $288,000 = $64,000 $16,000 $48,0002 7/36 X $288,000 = $56,000 14,000 $42,0003 6/36 X $288,000 = $48,000 12,000
$16,000 $62,000 $54,000
2012: $54,000 = (9/12 of 2nd year of machine’s life plus 3/12 of 3rd yearof machine’s life)
(e) Double-declining-balance 2011: 1/8 X 2 = 25%.
2010: 25% X $304,000 X 3/12 = $19,000
2011: 25% X ($304,000 – $19,000) = $71,250
OR
1st full year (25% X $304,000) = $76,000
Copyright © 2011 John Wiley & Sons, Inc. Kieso, IFRS, 1/e, Solutions Manual (For Instructor Use Only) 11-21
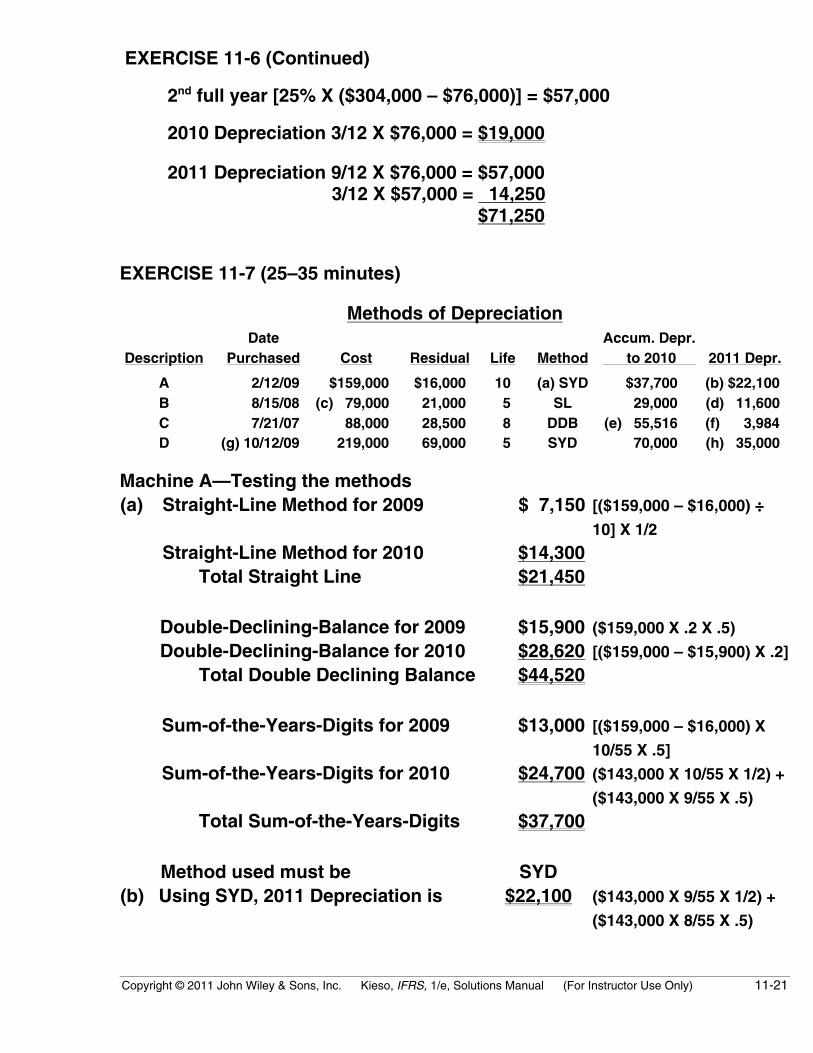
EXERCISE 11-6 (Continued)
2nd full year [25% X ($304,000 – $76,000)] = $57,000
2010 Depreciation 3/12 X $76,000 = $19,000
2011 Depreciation 9/12 X $76,000 = $57,000 3/12 X $57,000 = 14,250
$71,250
EXERCISE 11-7 (25–35 minutes)
Methods of Depreciation
DescriptionDate
Purchased Cost Residual Life MethodAccum. Depr. to 2010 2011 Depr.
A 2/12/09 $159,000 $16,000 10 (a) SYD $37,700 (b) $22,100B 8/15/08 (c) 79,000 21,000 5 SL 29,000 (d) 11,600C 7/21/07 88,000 28,500 8 DDB (e) 55,516 (f) 3,984D (g) 10/12/09 219,000 69,000 5 SYD 70,000 (h) 35,000
Machine A—Testing the methods(a) Straight-Line Method for 2009 $ 7,150 [($159,000 – $16,000) ÷
10] X 1/2
Straight-Line Method for 2010 $14,300Total Straight Line $21,450
Double-Declining-Balance for 2009 $15,900 ($159,000 X .2 X .5)
Double-Declining-Balance for 2010 $28,620 [($159,000 – $15,900) X .2]
Total Double Declining Balance $44,520
Sum-of-the-Years-Digits for 2009 $13,000 [($159,000 – $16,000) X
10/55 X .5]
Sum-of-the-Years-Digits for 2010 $24,700 ($143,000 X 10/55 X 1/2) +
($143,000 X 9/55 X .5)
Total Sum-of-the-Years-Digits $37,700
Method used must be SYD(b) Using SYD, 2011 Depreciation is $22,100 ($143,000 X 9/55 X 1/2) +
($143,000 X 8/55 X .5)
11-22 Copyright © 2011 John Wiley & Sons, Inc. Kieso, IFRS, 1/e, Solutions Manual (For Instructor Use Only)
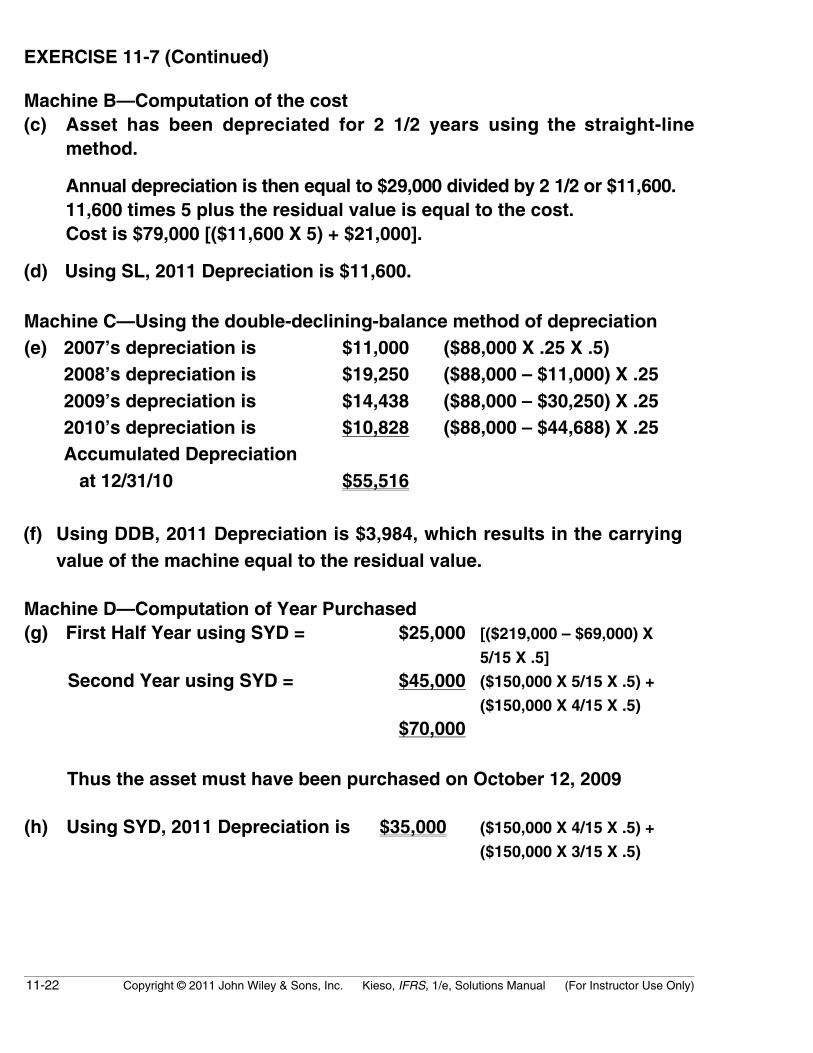
EXERCISE 11-7 (Continued)
Machine B—Computation of the cost(c) Asset has been depreciated for 2 1/2 years using the straight-line
method.
Annual depreciation is then equal to $29,000 divided by 2 1/2 or $11,600.11,600 times 5 plus the residual value is equal to the cost.Cost is $79,000 [($11,600 X 5) + $21,000].
(d) Using SL, 2011 Depreciation is $11,600.
Machine C—Using the double-declining-balance method of depreciation(e) 2007’s depreciation is $11,000 ($88,000 X .25 X .5)
2008’s depreciation is $19,250 ($88,000 – $11,000) X .252009’s depreciation is $14,438 ($88,000 – $30,250) X .252010’s depreciation is $10,828 ($88,000 – $44,688) X .25Accumulated Depreciation at 12/31/10 $55,516
(f) Using DDB, 2011 Depreciation is $3,984, which results in the carryingvalue of the machine equal to the residual value.
Machine D—Computation of Year Purchased(g) First Half Year using SYD = $25,000 [($219,000 – $69,000) X
5/15 X .5]
Second Year using SYD = $45,000 ($150,000 X 5/15 X .5) +
($150,000 X 4/15 X .5)
$70,000
Thus the asset must have been purchased on October 12, 2009
(h) Using SYD, 2011 Depreciation is $35,000 ($150,000 X 4/15 X .5) +
($150,000 X 3/15 X .5)
Copyright © 2011 John Wiley & Sons, Inc. Kieso, IFRS, 1/e, Solutions Manual (For Instructor Use Only) 11-23
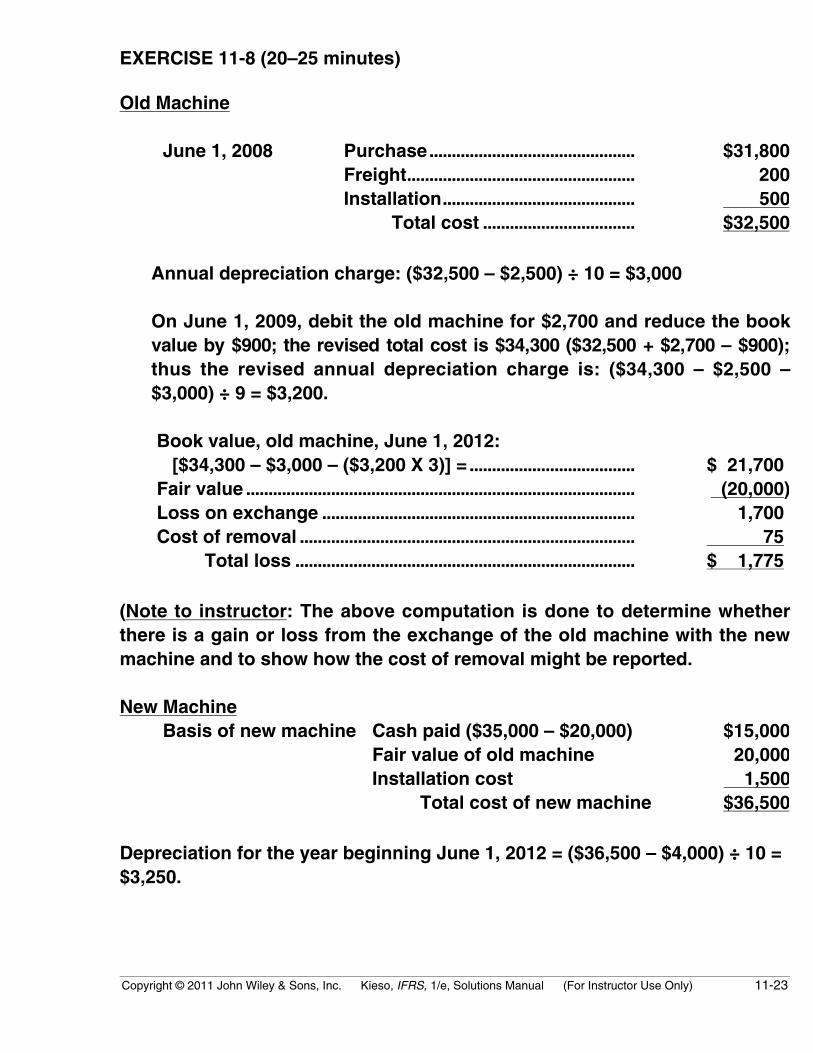
EXERCISE 11-8 (20–25 minutes)
Old Machine
June 1, 2008 Purchase.............................................. $31,800Freight................................................... 200Installation........................................... 500
Total cost .................................. $32,500
Annual depreciation charge: ($32,500 – $2,500) ÷ 10 = $3,000
On June 1, 2009, debit the old machine for $2,700 and reduce the bookvalue by $900; the revised total cost is $34,300 ($32,500 + $2,700 – $900);thus the revised annual depreciation charge is: ($34,300 – $2,500 –$3,000) ÷ 9 = $3,200.
Book value, old machine, June 1, 2012: [$34,300 – $3,000 – ($3,200 X 3)] = ..................................... $ 21,700Fair value ....................................................................................... (20,000)Loss on exchange ...................................................................... 1,700Cost of removal ........................................................................... 75
Total loss ............................................................................ $ 1,775
(Note to instructor: The above computation is done to determine whetherthere is a gain or loss from the exchange of the old machine with the newmachine and to show how the cost of removal might be reported.
New MachineBasis of new machine Cash paid ($35,000 – $20,000) $15,000
Fair value of old machine 20,000Installation cost 1,500
Total cost of new machine $36,500
Depreciation for the year beginning June 1, 2012 = ($36,500 – $4,000) ÷ 10 =$3,250.
11-24 Copyright © 2011 John Wiley & Sons, Inc. Kieso, IFRS, 1/e, Solutions Manual (For Instructor Use Only)
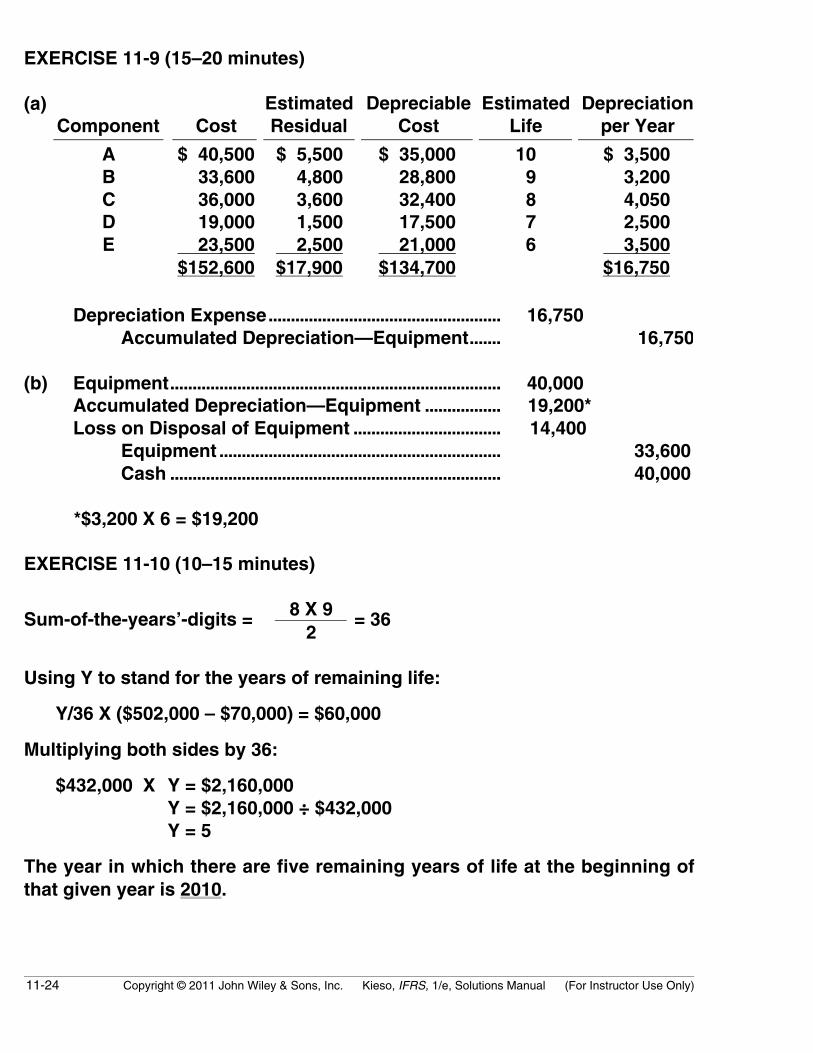
EXERCISE 11-9 (15–20 minutes)
(a)Component Cost
EstimatedResidual
DepreciableCost
EstimatedLife
Depreciationper Year
A $ 40,500 $ 5,500 $ 35,000 10 $ 3,500B 33,600 4,800 28,800 9 3,200C 36,000 3,600 32,400 8 4,050D 19,000 1,500 17,500 7 2,500E 23,500 2,500 21,000 6 3,500
$152,600 $17,900 $134,700 $16,750
Depreciation Expense.................................................... 16,750Accumulated Depreciation—Equipment....... 16,750
(b) Equipment.......................................................................... 40,000Accumulated Depreciation—Equipment ................. 19,200*Loss on Disposal of Equipment ................................. 14,400
Equipment ............................................................... 33,600Cash .......................................................................... 40,000
*$3,200 X 6 = $19,200
EXERCISE 11-10 (10–15 minutes)
8 X 9Sum-of-the-years’-digits =2
= 36
Using Y to stand for the years of remaining life:
Y/36 X ($502,000 – $70,000) = $60,000
Multiplying both sides by 36:
$432,000 X Y = $2,160,000Y = $2,160,000 ÷ $432,000Y = 5
The year in which there are five remaining years of life at the beginning ofthat given year is 2010.
Copyright © 2011 John Wiley & Sons, Inc. Kieso, IFRS, 1/e, Solutions Manual (For Instructor Use Only) 11-25
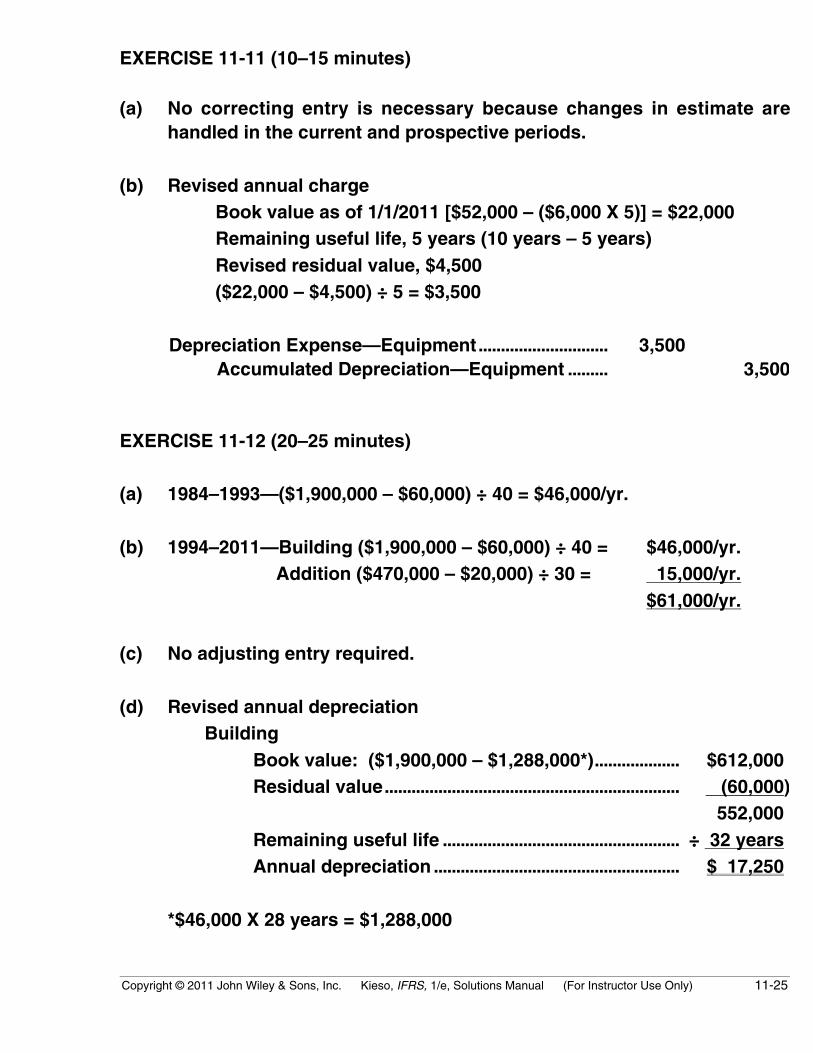
EXERCISE 11-11 (10–15 minutes)
(a) No correcting entry is necessary because changes in estimate arehandled in the current and prospective periods.
(b) Revised annual chargeBook value as of 1/1/2011 [$52,000 – ($6,000 X 5)] = $22,000Remaining useful life, 5 years (10 years – 5 years)Revised residual value, $4,500($22,000 – $4,500) ÷ 5 = $3,500
Depreciation Expense—Equipment............................. 3,500Accumulated Depreciation—Equipment ......... 3,500
EXERCISE 11-12 (20–25 minutes)
(a) 1984–1993—($1,900,000 – $60,000) ÷ 40 = $46,000/yr.
(b) 1994–2011—Building ($1,900,000 – $60,000) ÷ 40 = $46,000/yr. Addition ($470,000 – $20,000) ÷ 30 = 15,000/yr.
$61,000/yr.
(c) No adjusting entry required.
(d) Revised annual depreciationBuilding
Book value: ($1,900,000 – $1,288,000*)................... $612,000Residual value.................................................................. (60,000)
552,000Remaining useful life ..................................................... ÷ 32 yearsAnnual depreciation ....................................................... $ 17,250
*$46,000 X 28 years = $1,288,000
11-26 Copyright © 2011 John Wiley & Sons, Inc. Kieso, IFRS, 1/e, Solutions Manual (For Instructor Use Only)
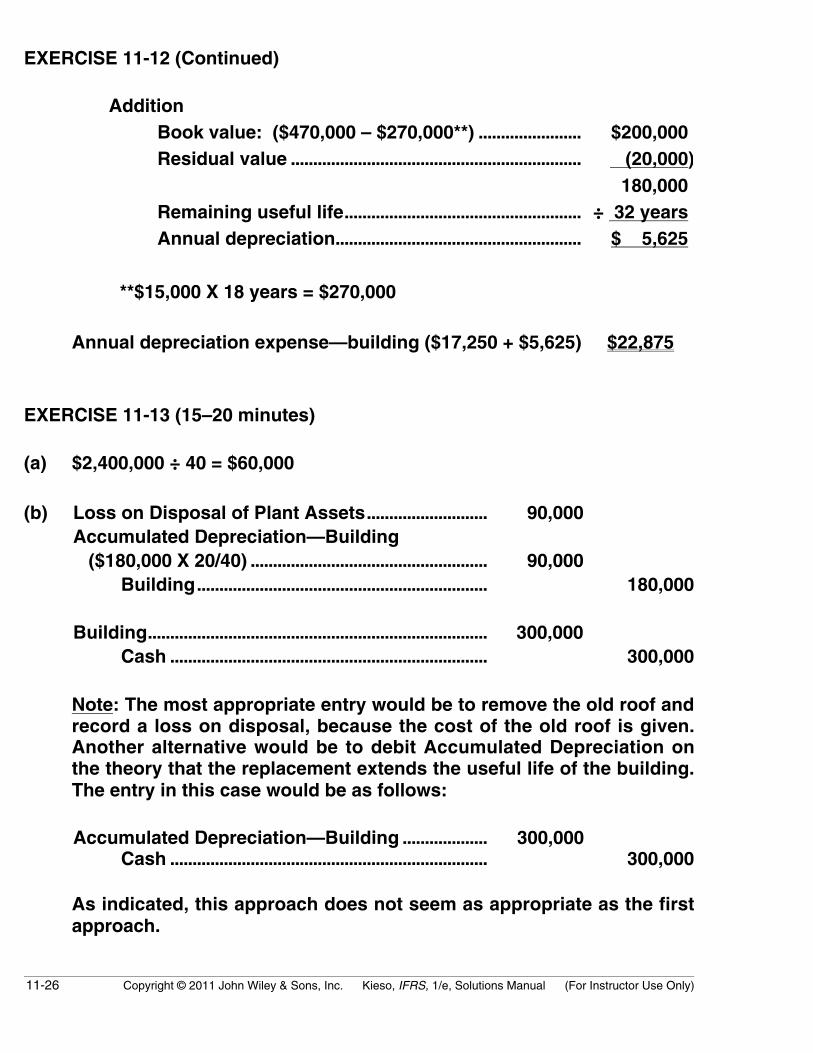
EXERCISE 11-12 (Continued)
AdditionBook value: ($470,000 – $270,000**) ....................... $200,000Residual value ................................................................. (20,000)
180,000Remaining useful life..................................................... ÷ 32 yearsAnnual depreciation....................................................... $ 5,625
**$15,000 X 18 years = $270,000
Annual depreciation expense—building ($17,250 + $5,625) $22,875
EXERCISE 11-13 (15–20 minutes)
(a) $2,400,000 ÷ 40 = $60,000
(b) Loss on Disposal of Plant Assets........................... 90,000Accumulated Depreciation—Building ($180,000 X 20/40) ..................................................... 90,000
Building................................................................. 180,000
Building............................................................................ 300,000Cash ....................................................................... 300,000
Note: The most appropriate entry would be to remove the old roof andrecord a loss on disposal, because the cost of the old roof is given.Another alternative would be to debit Accumulated Depreciation onthe theory that the replacement extends the useful life of the building.The entry in this case would be as follows:
Accumulated Depreciation—Building ................... 300,000Cash ....................................................................... 300,000
As indicated, this approach does not seem as appropriate as the firstapproach.
Copyright © 2011 John Wiley & Sons, Inc. Kieso, IFRS, 1/e, Solutions Manual (For Instructor Use Only) 11-27
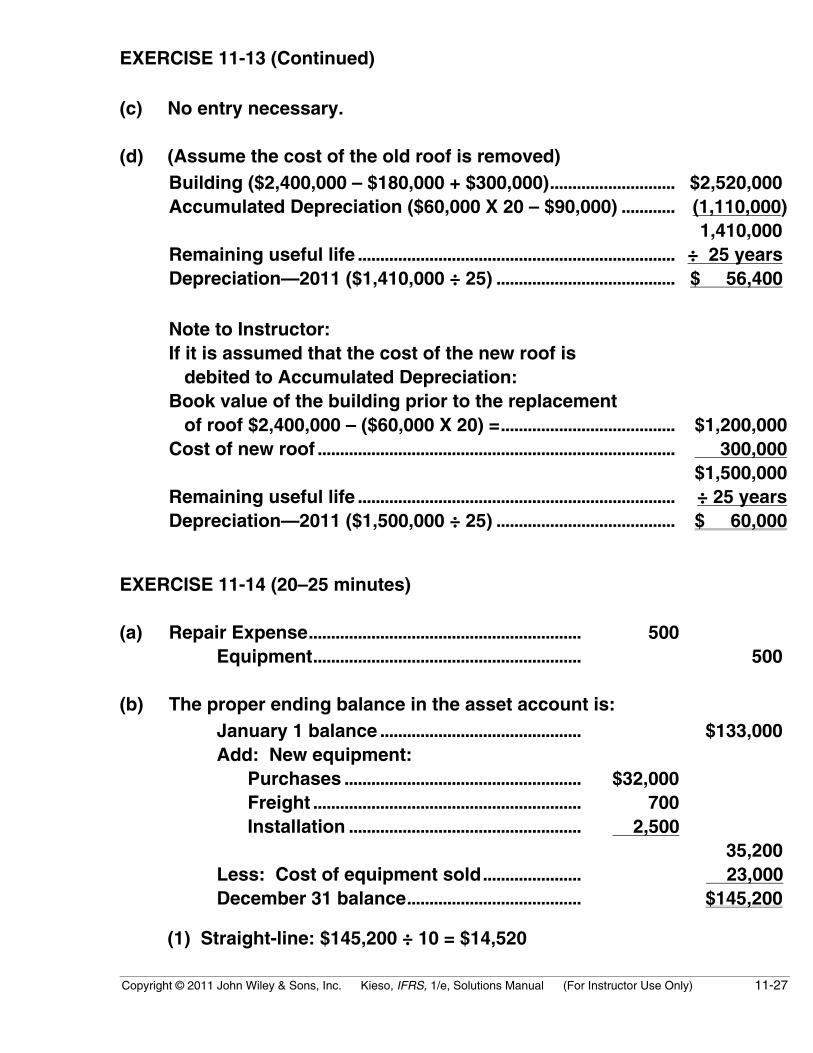
EXERCISE 11-13 (Continued)
(c) No entry necessary.
(d) (Assume the cost of the old roof is removed)Building ($2,400,000 – $180,000 + $300,000)............................ $2,520,000Accumulated Depreciation ($60,000 X 20 – $90,000) ............ (1,110,000)
1,410,000Remaining useful life ....................................................................... ÷ 25 yearsDepreciation—2011 ($1,410,000 ÷ 25) ........................................ $ 56,400
Note to Instructor:If it is assumed that the cost of the new roof is debited to Accumulated Depreciation:Book value of the building prior to the replacement of roof $2,400,000 – ($60,000 X 20) =....................................... $1,200,000Cost of new roof ................................................................................ 300,000
$1,500,000Remaining useful life ....................................................................... ÷ 25 yearsDepreciation—2011 ($1,500,000 ÷ 25) ........................................ $ 60,000
EXERCISE 11-14 (20–25 minutes)
(a) Repair Expense............................................................. 500Equipment............................................................ 500
(b) The proper ending balance in the asset account is:January 1 balance ............................................. $133,000Add: New equipment: Purchases ..................................................... $32,000 Freight ............................................................ 700 Installation .................................................... 2,500
35,200Less: Cost of equipment sold...................... 23,000December 31 balance....................................... $145,200
(1) Straight-line: $145,200 ÷ 10 = $14,520

11-28 Copyright © 2011 John Wiley & Sons, Inc. Kieso, IFRS, 1/e, Solutions Manual (For Instructor Use Only)
EXERCISE 11-14 (Continued)
(2) Sum-of-the-years’-digits: 10 + 9 + 8 + 7 + 6 + 5 + 4 + 3 + 2 + 1 = 55
n(n + 1) 10(11)OR
2=
2= 55
For equipment purchased in 2009: $110,000 ($133,000 – $23,000) ofthe cost of equipment purchased in 2009, is still on hand.
8/55 X $110,000 = .................................................................. $16,000For equipment purchased in 2011: 10/55 X $35,200 =......... 6,400
Total .......................................................................................... $22,400
EXERCISE 11-15 (25–35 minutes)
(a)2005
2006–2011
Incl. 2012 Total
(1) $240,000 – $21,000 = $219,000
$219,000 ÷ 12 = $18,250
per yr. ($50 per day)
133*/365 of $18,250 = $ 6,650
2006–2011 Include. (6 X $18,250) $109,500
68/365 of $18,250 = $ 3,400 $119,550
(2) 0 109,500 18,250 127,750
(3) 18,250 109,500 0 127,750
(4) 9,125 109,500 9,125 127,750
(5) 4/12 of $18,250 6,083
2006–2011 Inc. 109,500
3/12 of $18,250 4,563 120,146
(6) 0 109,500 0 109,500
*(11 + 30 + 31 + 30 + 31)
(b) The most accurate distribution of cost is given by methods 1 and 5 ifit is assumed that straight-line depreciation is satisfactory. Reasonableaccuracy is normally given by 2, 3, or 4. The simplest of the applica-tions are 6, 2, 3, 4, 5, and 1, in about that order. Methods 2, 3, and 4combine reasonable accuracy with simplicity of application.
Copyright © 2011 John Wiley & Sons, Inc. Kieso, IFRS, 1/e, Solutions Manual (For Instructor Use Only) 11-29
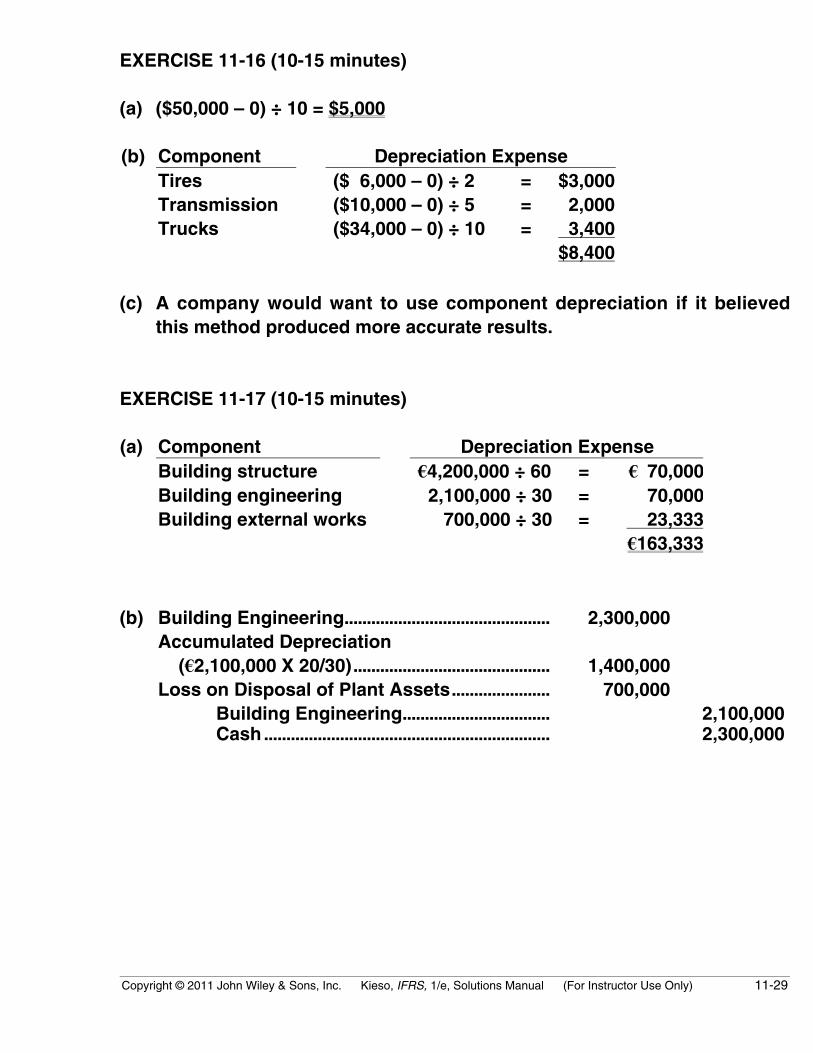
EXERCISE 11-16 (10-15 minutes)
(a) ($50,000 – 0) ÷ 10 = $5,000
(b) Component Depreciation ExpenseTires ($ 6,000 – 0) ÷ 2 = $3,000Transmission ($10,000 – 0) ÷ 5 = 2,000Trucks ($34,000 – 0) ÷ 10 = 3,400
$8,400
(c) A company would want to use component depreciation if it believedthis method produced more accurate results.
EXERCISE 11-17 (10-15 minutes)
(a) Component Depreciation ExpenseBuilding structure €4,200,000 ÷ 60 = € 70,000Building engineering 2,100,000 ÷ 30 = 70,000Building external works 700,000 ÷ 30 = 23,333
€163,333
(b) Building Engineering.............................................. 2,300,000Accumulated Depreciation (€2,100,000 X 20/30)............................................ 1,400,000Loss on Disposal of Plant Assets...................... 700,000
Building Engineering................................. 2,100,000Cash................................................................ 2,300,000
11-30 Copyright © 2011 John Wiley & Sons, Inc. Kieso, IFRS, 1/e, Solutions Manual (For Instructor Use Only)
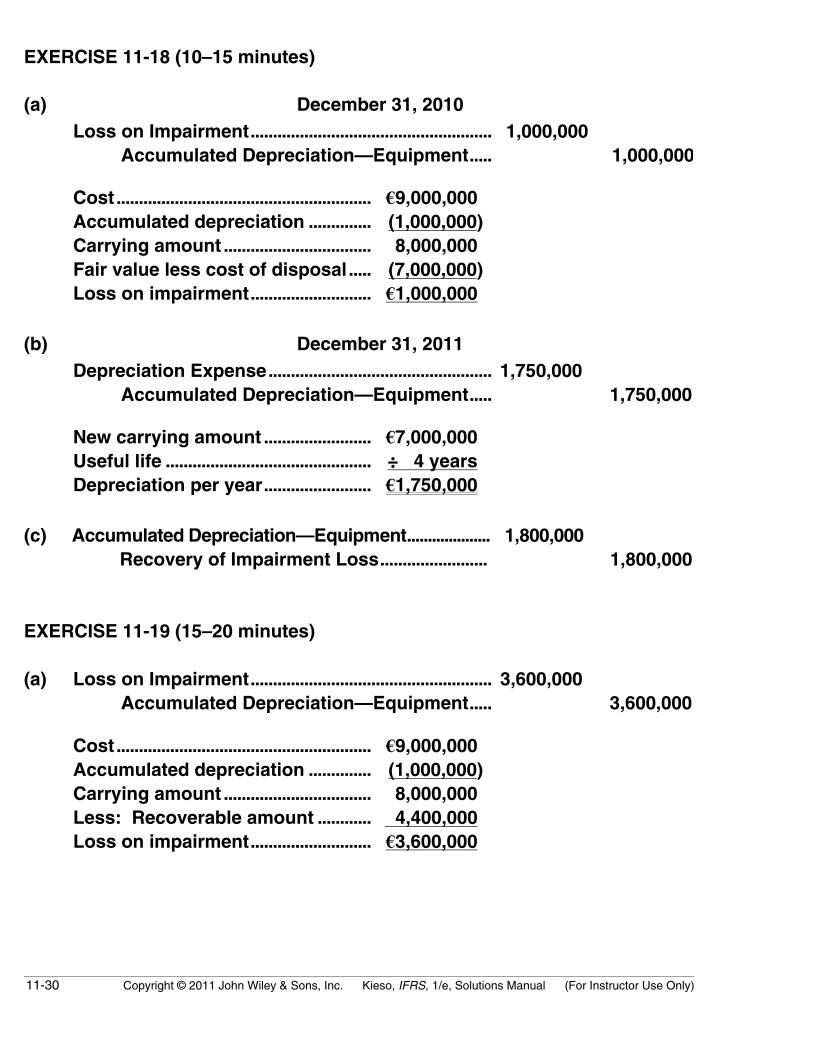
EXERCISE 11-18 (10–15 minutes)
(a) December 31, 2010Loss on Impairment...................................................... 1,000,000
Accumulated Depreciation—Equipment..... 1,000,000
Cost......................................................... €9,000,000Accumulated depreciation .............. (1,000,000)Carrying amount ................................. 8,000,000Fair value less cost of disposal..... (7,000,000)Loss on impairment........................... €1,000,000
(b) December 31, 2011Depreciation Expense.................................................. 1,750,000
Accumulated Depreciation—Equipment..... 1,750,000
New carrying amount ........................ €7,000,000Useful life .............................................. ÷ 4 yearsDepreciation per year........................ €1,750,000
(c) Accumulated Depreciation—Equipment.................... 1,800,000Recovery of Impairment Loss........................ 1,800,000
EXERCISE 11-19 (15–20 minutes)
(a) Loss on Impairment...................................................... 3,600,000Accumulated Depreciation—Equipment..... 3,600,000
Cost......................................................... €9,000,000Accumulated depreciation .............. (1,000,000)Carrying amount ................................. 8,000,000Less: Recoverable amount ............ 4,400,000Loss on impairment........................... €3,600,000

Copyright © 2011 John Wiley & Sons, Inc. Kieso, IFRS, 1/e, Solutions Manual (For Instructor Use Only) 11-31
EXERCISE 11-19 (Continued)
(b) No entry necessary. Depreciation is not taken on assets intended tobe sold.
(c) Accumulated Depreciation—Equipment........ 680,000Recovery of Loss on Impairment........... 680,000
Fair value .................................................................. €5,100,000Less: Cost of disposal ........................................ 20,000 5,080,000Carrying amount..................................................... (4,400,000*)Recovery of impairment loss ............................. € 680,000
*(€9,000,000 – €1,000,000 – €3,600,000)
EXERCISE 11-20 (15–20 minutes)
(a) December 31, 2010Loss on Impairment ..................................................... 200,000
Accumulated Depreciation—Equipment .... 200,000
Cost......................................................... $900,000Accumulated depreciation.............. (400,000)Carrying amount................................. 500,000Recoverable amount ......................... (300,000*)Loss on impairment .......................... $200,000
*Use $300,000 (value-in-use) because it is greater than fair value less cost of disposal.
(b) It should be reported in the other income and expense section in theincome statement.
(c) Accumulated Depreciation—Equipment .................... 45,000Recovery of Impairment Loss [$270,000 – ($300,000 – $75,000)] ........................ 45,000

11-32 Copyright © 2011 John Wiley & Sons, Inc. Kieso, IFRS, 1/e, Solutions Manual (For Instructor Use Only)
EXERCISE 11-20 (Continued)
(d) To determine whether an asset is impaired, on an annual basis,companies review the asset for indicators of impairment—that is, adecline in the asset’s cash-generating ability through use or sale. Ifimpairment indicators are present, then the company compares theasset’s recoverable amount with its carrying amount. If the carryingamount is higher than the recoverable amount, the difference is animpairment loss. Recoverable value is defined as the higher of fairvalue less costs to sell or value-in-use.
EXERCISE 11-21 (10–15 minutes)
Cost per barrel of oil:
$600,000Initial payment =
250,000= $2.40
$31,500Rental =
18,000= 1.75
Premium, 5% of $65 = 3.25
$30,000Reconditioning of land =
250,000= .12
Total cost per barrel $7.52
EXERCISE 11-22 (15–20 minutes)
Depletion base: $1,250,000 + $90,000 – $100,000 + $200,000 = $1,440,000
Depletion rate: $1,440,000 ÷ 60,000 = $24/ton
(a) Per unit mineral cost: $24/ton(b) 12/31/10 inventory: $24 X 6,000 tons = $144,000(c) Cost of goods sold 2010: $24 X 24,000 tons = $576,000
Copyright © 2011 John Wiley & Sons, Inc. Kieso, IFRS, 1/e, Solutions Manual (For Instructor Use Only) 11-33
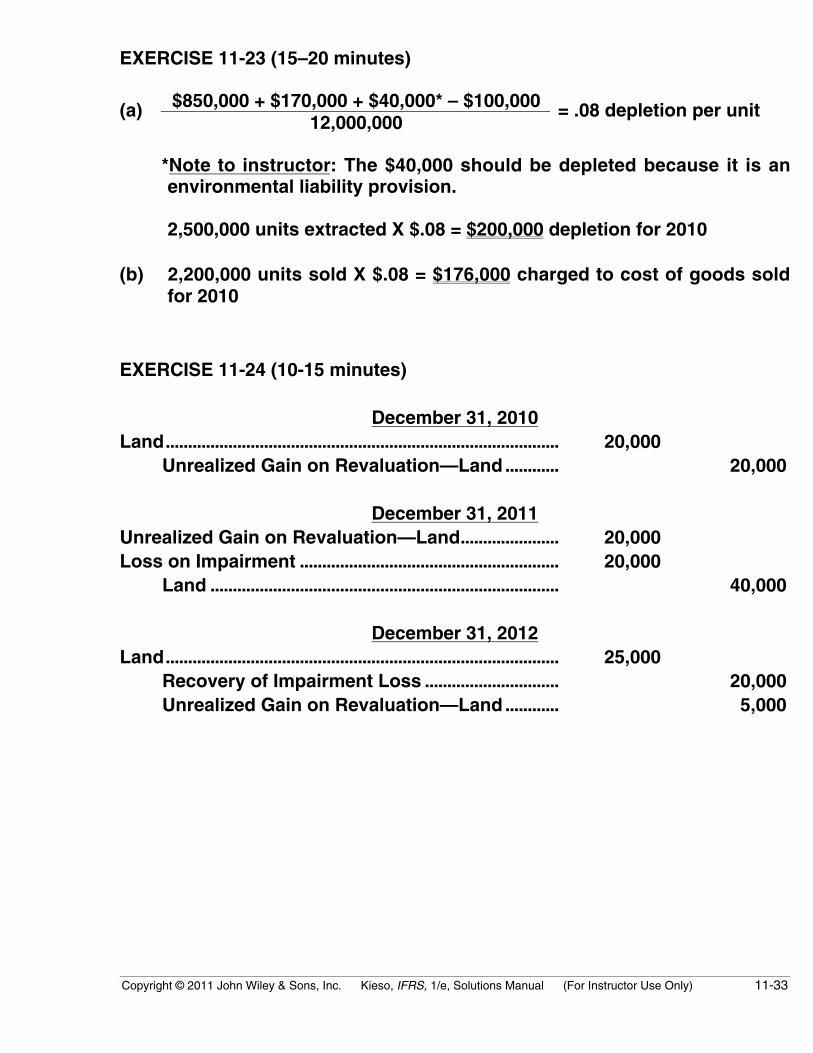
EXERCISE 11-23 (15–20 minutes)
$850,000 + $170,000 + $40,000* – $100,000(a)12,000,000
= .08 depletion per unit
*Note to instructor: The $40,000 should be depleted because it is anenvironmental liability provision.
2,500,000 units extracted X $.08 = $200,000 depletion for 2010
(b) 2,200,000 units sold X $.08 = $176,000 charged to cost of goods soldfor 2010
EXERCISE 11-24 (10-15 minutes)
December 31, 2010Land........................................................................................ 20,000
Unrealized Gain on Revaluation—Land............ 20,000
December 31, 2011Unrealized Gain on Revaluation—Land...................... 20,000Loss on Impairment .......................................................... 20,000
Land .............................................................................. 40,000
December 31, 2012Land........................................................................................ 25,000
Recovery of Impairment Loss .............................. 20,000Unrealized Gain on Revaluation—Land............ 5,000
11-34 Copyright © 2011 John Wiley & Sons, Inc. Kieso, IFRS, 1/e, Solutions Manual (For Instructor Use Only)
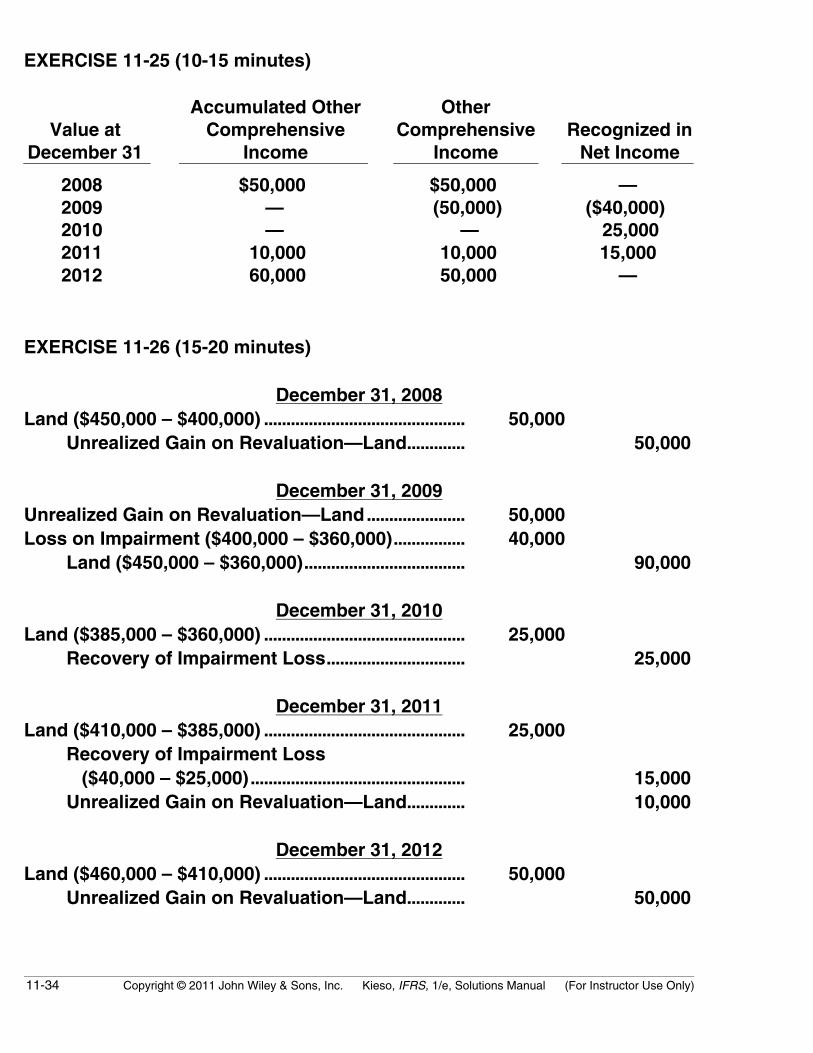
EXERCISE 11-25 (10-15 minutes)
Value atDecember 31
Accumulated OtherComprehensive
Income
OtherComprehensive
IncomeRecognized in
Net Income
2008 $50,000 $50,000 —2009 — (50,000) ($40,000)2010 — — 25,0002011 10,000 10,000 15,0002012 60,000 50,000 —
EXERCISE 11-26 (15-20 minutes)
December 31, 2008Land ($450,000 – $400,000) ............................................. 50,000
Unrealized Gain on Revaluation—Land............. 50,000
December 31, 2009Unrealized Gain on Revaluation—Land...................... 50,000Loss on Impairment ($400,000 – $360,000)................ 40,000
Land ($450,000 – $360,000).................................... 90,000
December 31, 2010Land ($385,000 – $360,000) ............................................. 25,000
Recovery of Impairment Loss............................... 25,000
December 31, 2011Land ($410,000 – $385,000) ............................................. 25,000
Recovery of Impairment Loss ($40,000 – $25,000)................................................ 15,000Unrealized Gain on Revaluation—Land............. 10,000
December 31, 2012Land ($460,000 – $410,000) ............................................. 50,000
Unrealized Gain on Revaluation—Land............. 50,000
Copyright © 2011 John Wiley & Sons, Inc. Kieso, IFRS, 1/e, Solutions Manual (For Instructor Use Only) 11-35
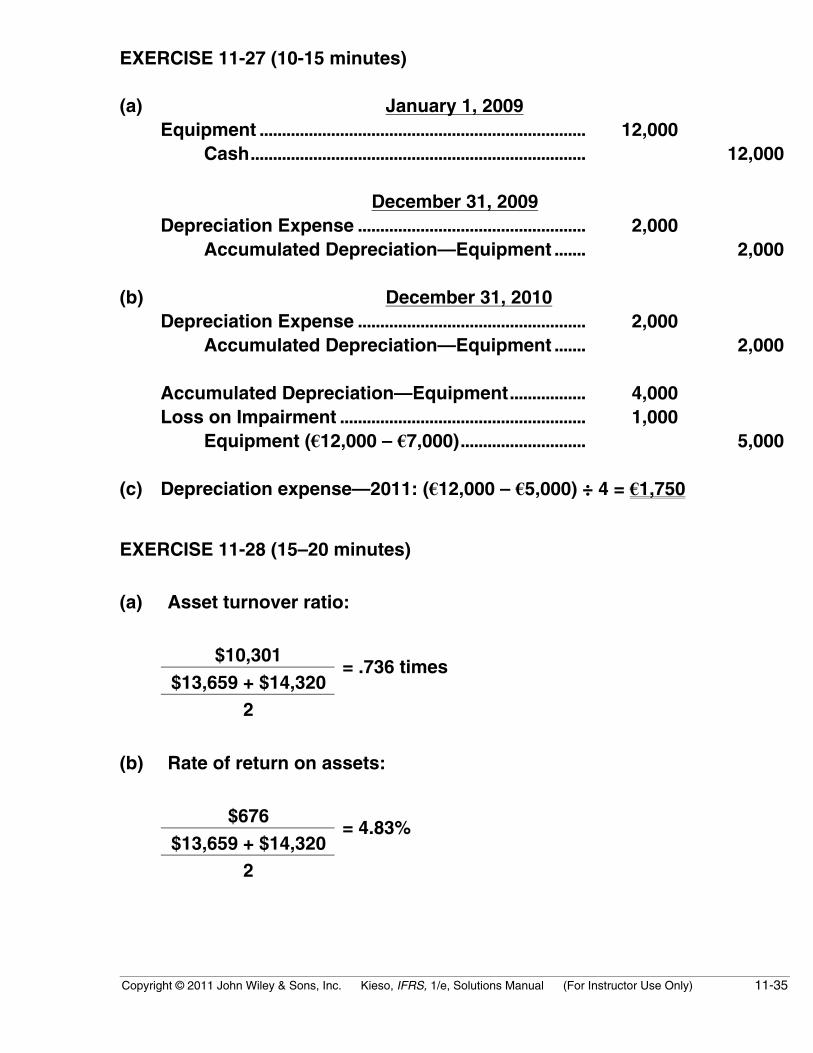
EXERCISE 11-27 (10-15 minutes)
(a) January 1, 2009Equipment ......................................................................... 12,000
Cash........................................................................... 12,000
December 31, 2009Depreciation Expense ................................................... 2,000
Accumulated Depreciation—Equipment ....... 2,000
(b) December 31, 2010Depreciation Expense ................................................... 2,000
Accumulated Depreciation—Equipment ....... 2,000
Accumulated Depreciation—Equipment................. 4,000Loss on Impairment ....................................................... 1,000
Equipment (€12,000 – €7,000)............................ 5,000
(c) Depreciation expense—2011: (€12,000 – €5,000) ÷ 4 = €1,750
EXERCISE 11-28 (15–20 minutes)
(a) Asset turnover ratio:
$10,301$13,659 + $14,320
= .736 times
2
(b) Rate of return on assets:
$676$13,659 + $14,320
= 4.83%
2
11-36 Copyright © 2011 John Wiley & Sons, Inc. Kieso, IFRS, 1/e, Solutions Manual (For Instructor Use Only)
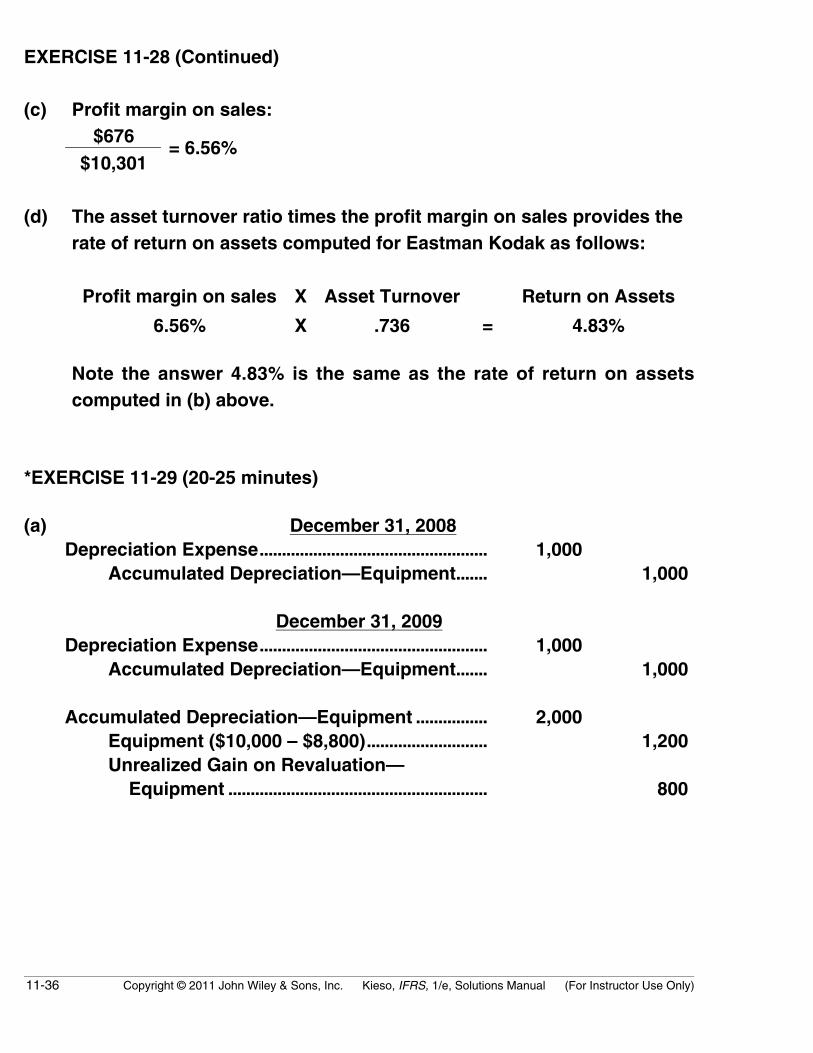
EXERCISE 11-28 (Continued)
(c) Profit margin on sales:$676
$10,301= 6.56%
(d) The asset turnover ratio times the profit margin on sales provides therate of return on assets computed for Eastman Kodak as follows:
Profit margin on sales X Asset Turnover Return on Assets
6.56% X .736 = 4.83%
Note the answer 4.83% is the same as the rate of return on assetscomputed in (b) above.
*EXERCISE 11-29 (20-25 minutes)
(a) December 31, 2008Depreciation Expense................................................... 1,000
Accumulated Depreciation—Equipment....... 1,000
December 31, 2009Depreciation Expense................................................... 1,000
Accumulated Depreciation—Equipment....... 1,000
Accumulated Depreciation—Equipment ................ 2,000Equipment ($10,000 – $8,800)........................... 1,200Unrealized Gain on Revaluation— Equipment .......................................................... 800
Copyright © 2011 John Wiley & Sons, Inc. Kieso, IFRS, 1/e, Solutions Manual (For Instructor Use Only) 11-37
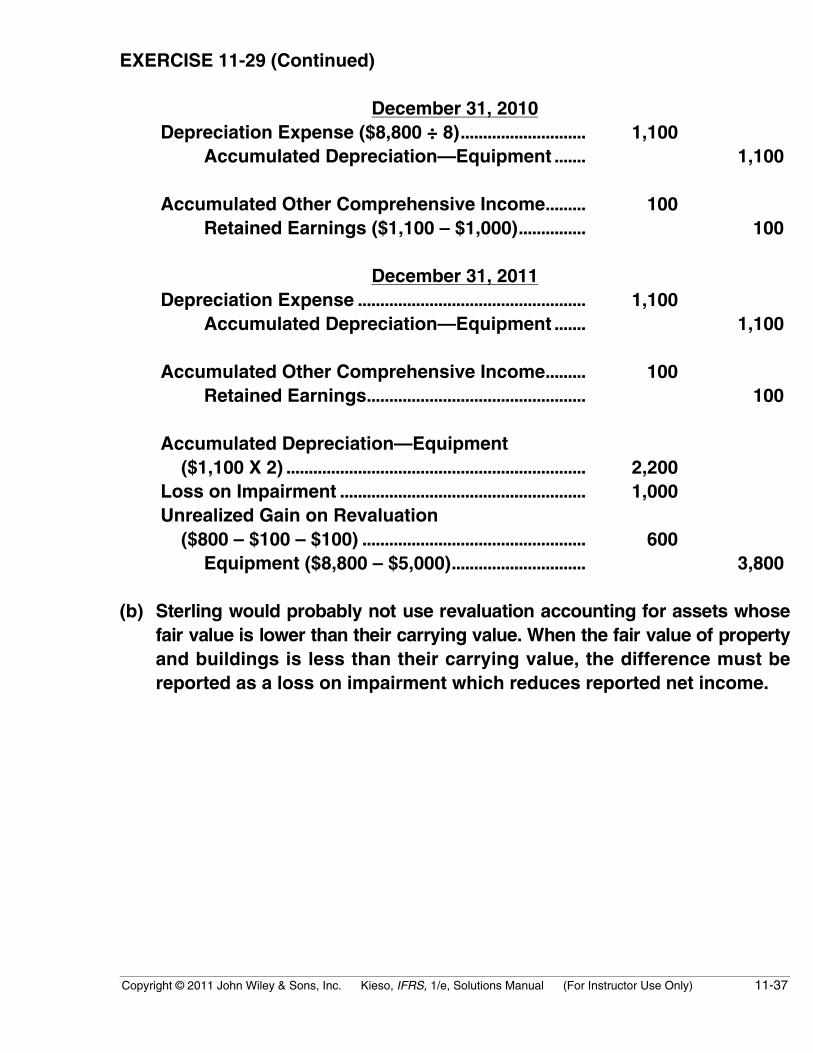
EXERCISE 11-29 (Continued)
December 31, 2010Depreciation Expense ($8,800 ÷ 8)............................ 1,100
Accumulated Depreciation—Equipment ....... 1,100
Accumulated Other Comprehensive Income......... 100Retained Earnings ($1,100 – $1,000)............... 100
December 31, 2011Depreciation Expense ................................................... 1,100
Accumulated Depreciation—Equipment ....... 1,100
Accumulated Other Comprehensive Income......... 100Retained Earnings................................................. 100
Accumulated Depreciation—Equipment ($1,100 X 2) ................................................................... 2,200Loss on Impairment ....................................................... 1,000Unrealized Gain on Revaluation ($800 – $100 – $100) .................................................. 600
Equipment ($8,800 – $5,000).............................. 3,800
(b) Sterling would probably not use revaluation accounting for assets whosefair value is lower than their carrying value. When the fair value of propertyand buildings is less than their carrying value, the difference must bereported as a loss on impairment which reduces reported net income.

11-38 Copyright © 2011 John Wiley & Sons, Inc. Kieso, IFRS, 1/e, Solutions Manual (For Instructor Use Only)
TIME AND PURPOSE OF PROBLEMSProblem 11-1 (Time 25–30 minutes)Purpose—to provide the student with an opportunity to compute depreciation expense using a numberof different depreciation methods. The problem is complicated because the proper cost of the machineto be depreciated must be determined. For example, purchase discounts and freight charges must beconsidered. In addition, the student is asked to select a depreciation method that will allocate lessdepreciation in the early years of the machine’s life than in the later years.
Problem 11-2 (Time 25–35 minutes)Purpose—to provide the student with an opportunity to compute depreciation expense using thefollowing methods: straight-line, units-of-output, working hours, sum-of-the-years’-digits, and decliningbalance. The problem is straightforward and provides an excellent review of the basic computationalissues involving depreciation methods.
Problem 11-3 (Time 40–50 minutes)Purpose—to provide the student with an opportunity to compute depreciation expense using a numberof different depreciation methods. Before the proper depreciation expense can be computed, the accountsmust be corrected for a number of errors made by the company in its accounting for the assets. Anexcellent problem for reviewing the proper accounting for plant assets and related depreciation expense.
Problem 11-4 (Time 45–60 minutes)Purpose—to provide the student with an opportunity to correct the improper accounting for Semitrucksand determine the proper depreciation expense. The student is required to compute separately theerrors arising in determining or entering depreciation or in recording transactions affecting Semitrucks.
Problem 11-5 (Time 25–35 minutes)Purpose—to provide the student with a comprehensive problem related to property, plant, and equipment.The student must determine depreciable bases for assets, including capitalized interest, and preparedepreciation entries using various methods of depreciation.
Problem 11-6 (Time 45–60 minutes)Purpose—to provide the student with an opportunity to solve a complex problem involving a number ofplant assets. A number of depreciation computations must be made, specifically straight-line, 150%declining balance, and sum-of-the-years’-digits. In addition, the cost of assets acquired is difficult todetermine.
Problem 11-7 (Time 30–35 minutes)Purpose—to provide the student with the opportunity to solve a moderate problem involving a machinerypurchase and the depreciation computations using straight-line, activity, sum-of-the-years’-digits, andthe double-declining-balance methods, first for full periods and then for partial periods.
Problem 11-8 (Time 25–35 minutes)Purpose—to provide the student with an opportunity to compute depreciation expense using a numberof different depreciation methods. The purpose of computing the depreciation expense is to determinewhich method will result in the maximization of net income and which will result in the minimization ofnet income over a three-year period. An excellent problem for reviewing the fundamentals of depreciationaccounting.
Problem 11-9 (Time 15–25 minutes)Purpose—to provide the student with an opportunity to analyze impairments for assets to be used andassets to be disposed of.

Copyright © 2011 John Wiley & Sons, Inc. Kieso, IFRS, 1/e, Solutions Manual (For Instructor Use Only) 11-39
Time and Purpose of Problems (Continued)
Problem 11-10 (Time 30–35 minutes)Purpose—to provide the student with an opportunity to compute the amount of an impairment loss. Thestudent is also required to prepare journal entries to record an impairment loss and a reversal of animpairment loss.
Problem 11-11 (Time 15–20 minutes)Purpose—to provide the student with a problem involving depletion and computation of profit or loss.The student is asked to explain how to account for exploration and evaluation costs.
Problem 11-12 (Time 25–30 minutes)Purpose—to provide the student with a problem involving the computation of estimated depletion anddepreciation costs associated with a tract of mineral land. The student must compute depletion and de-preciation on a units-of-production basis (tons mined). A portion of the cost of machinery associatedwith the product must be allocated over different periods. The student may experience some difficultywith this problem.
*Problem 11-13 (Time 20-25 minutes)Purpose—to provide the student with the opportunity to record land revaluation adjustments for 3 years.The student is also required to determine the amount of other comprehensive income, impairment loss,and accumulated other comprehensive income for 2 years.
*Problem 11-14 (Time 25-35 minutes)Purpose—to provide the student with an opportunity to record equipment revaluation adjustments for3 years. The student is also required to determine the amount of other comprehensive income,depreciation expense, impairment loss, and accumulated other comprehensive income for 2 years.

11-40 Copyright © 2011 John Wiley & Sons, Inc. Kieso, IFRS, 1/e, Solutions Manual (For Instructor Use Only)
SOLUTIONS TO PROBLEMS
PROBLEM 11-1
(a) 1. Depreciable Base Computation:Purchase price ..................................... $85,000Less: Purchase discount (2%)........ 1,700Freight-in................................................ 800Installation............................................. 3,800Cost.......................................................... 87,900Less: Salvage value .......................... 1,500Depreciation base ............................... $86,400
2010—Straight line: ($86,400 ÷ 8 years) X 2/3 year = $7,200
2. Sum-of-the-years’-digits for 2011
Machine YearTotal
Depreciation 2010 20111 8/36 X $86,400 = $19,200 $12,800* $ 6,400**2 7/36 X $86,400 = $16,800 11,200***
$17,600
* $19,200 X 2/3 = $12,800** $19,200 X 1/3 = $6,400
*** $16,800 X 2/3 = $11,200
3. Double-declining-balance for 2010 ($87,900 X 25% X 2/3) = $14,650
(b) An activity method.
Copyright © 2011 John Wiley & Sons, Inc. Kieso, IFRS, 1/e, Solutions Manual (For Instructor Use Only) 11-41
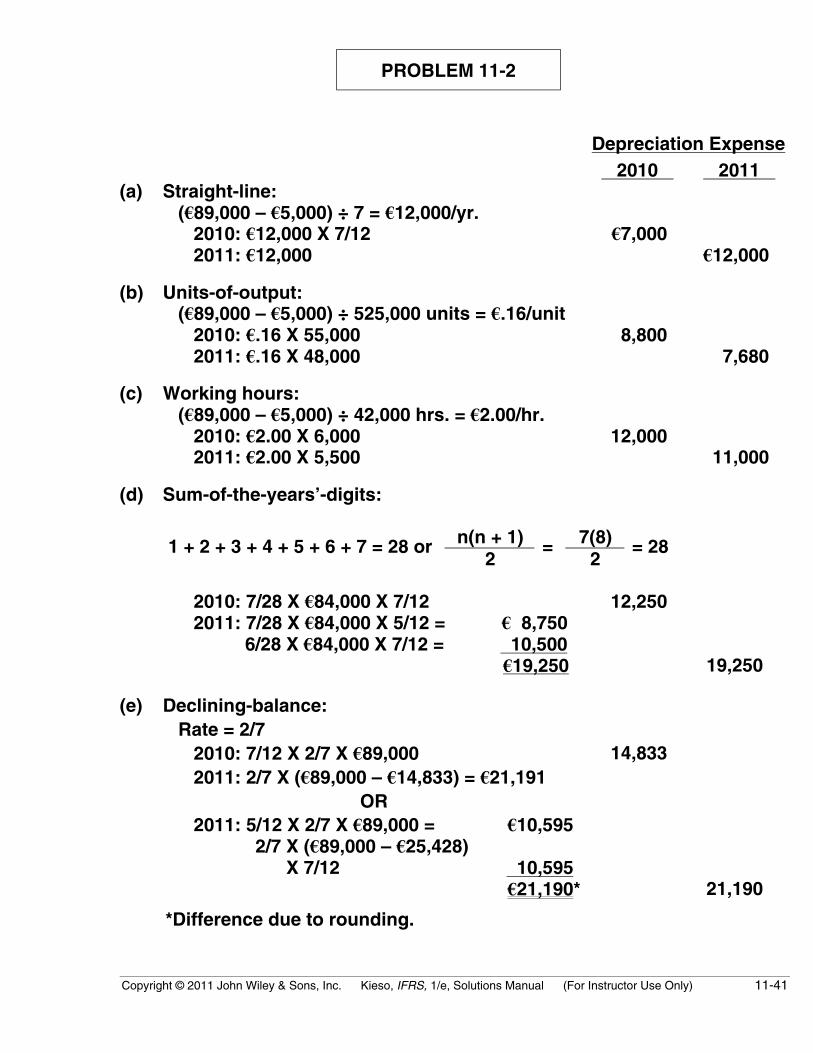
PROBLEM 11-2
Depreciation Expense 2010 2011
(a) Straight-line: (€89,000 – €5,000) ÷ 7 = €12,000/yr. 2010: €12,000 X 7/12 €7,000 2011: €12,000 €12,000
(b) Units-of-output: (€89,000 – €5,000) ÷ 525,000 units = €.16/unit 2010: €.16 X 55,000 8,800 2011: €.16 X 48,000 7,680
(c) Working hours: (€89,000 – €5,000) ÷ 42,000 hrs. = €2.00/hr. 2010: €2.00 X 6,000 12,000 2011: €2.00 X 5,500 11,000
(d) Sum-of-the-years’-digits:
n(n + 1) 7(8)1 + 2 + 3 + 4 + 5 + 6 + 7 = 28 or2
=2
= 28
2010: 7/28 X €84,000 X 7/12 12,250 2011: 7/28 X €84,000 X 5/12 = € 8,750 6/28 X €84,000 X 7/12 = 10,500
€19,250 19,250
(e) Declining-balance: Rate = 2/7 2010: 7/12 X 2/7 X €89,000 14,833 2011: 2/7 X (€89,000 – €14,833) = €21,191
OR 2011: 5/12 X 2/7 X €89,000 = €10,595 2/7 X (€89,000 – €25,428) X 7/12 10,595
€21,190* 21,190
*Difference due to rounding.

11-42 Copyright © 2011 John Wiley & Sons, Inc. Kieso, IFRS, 1/e, Solutions Manual (For Instructor Use Only)
PROBLEM 11-3
(a) Depreciation Expense—Asset A .................................... 3,900Accumulated Depreciation—Asset A (5/55 X [£46,000 – £3,100]) .................................. 3,900
Accumulated Depreciation—Asset A ........................... 35,100Asset A (£46,000 – £13,000)................................... 33,000Gain on Disposal of Plant Assets........................ 2,100
(b) Depreciation Expense—Asset B .................................... 6,720Accumulated Depreciation—Asset B ([£51,000 – £3,000] ÷ 15,000 X 2,100) .............. 6,720
(c) Depreciation Expense—Asset C .................................... 6,000Accumulated Depreciation—Asset C ([£80,000 – £15,000 – £5,000] ÷ 10) .................. 6,000
(d) Asset E.................................................................................... 28,000Retained Earnings .................................................... 28,000
Depreciation Expense—Asset E..................................... 5,600*Accumulated Depreciation—Asset E................. 5,600
*(£28,000 X .20)
Note: No correcting entry is needed for asset D. In 2010, Eshkol records depreciation expense of $80,000 X (10% X 2) = $16,000.

Copyright © 2011 John Wiley & Sons, Inc. Kieso, IFRS, 1/e, Solutions Manual (For Instructor Use Only) 11-43
PROBLEM 11-4
Net
Inco
me
Ove
rsta
ted
(Un
der
stat
ed)
¥
3,0
00
(1,2
00)
1,
800
100
(5,3
00)
(3,4
00)
7,
100
(8
,250
)
(4,
550)
(14
,000
)¥(
18,5
50)
1 2 3 4 5 6 7
Ret
ain
edE
arn
ing
sd
r, (
cr.)
¥ 3
,000
19,
800
22,8
00 100
17,
200
40,1
00
6,40
0
16,
800
63,3
00
16,
400
¥79,
700
Acc
. Dep
.,S
emit
ruck
sd
r, (
cr.)
¥(30
,200
)
9
,000
(19,
800)
(41,
000)
14
,400
(17
,200
)(4
3,80
0)
14
,400
(16,
800)
(46,
200)
(16
,400
)¥(
62,6
00)
¥ 1
8,00
0
21,
000
¥
3,00
0
As
Ad
just
ed
Sem
itru
cks
dr.
(cr
.)
¥94
,000
40
,000
(30,
000)
____
___
104
,000
(18,
000)
____
___
86
,000
42
,000
(24,
000)
____
___
104
,000
____
___
¥104
,000
Ret
ain
edE
arn
ing
sd
r. (
cr.)
$2
1,00
0
21,
000
2
2,50
0
43,
500
(700
)
2
5,05
0
6
7,85
0
3
0,40
0
¥98,
250
Acc
. Dep
.S
emit
ruck
sd
r. (
cr.)
¥(30
,200
)
(
21,0
00)
(51,
200)
(
22,5
00)
(73,
700)
(
25,0
50)
(98,
750)
(
30,4
00)
¥(12
9,15
0)
Per
Co
mp
any
Bo
oks
Sem
itru
cks
dr.
(cr
.)
¥
94,
000
22
,000
____
____
116
,000
(3,5
00)
____
____
112
,500
42
,000
(2,5
00)
____
____
152
,000
____
____
¥152
,000
=
¥ 3
,600
=
4,40
0=
3,
000
=
4,80
0=
4,
000
¥19,
800
Bal
ance
Pu
rch
ase
Tru
ck #
5T
rad
e T
ruck
#3
Dep
reci
atio
nB
alan
ces
Sal
e o
f T
ruck
#1
Dep
reci
atio
nB
alan
ces
Pu
rch
ase
of
Tru
ck #
6
Dis
po
sal o
f T
ruck
#4
Dep
reci
atio
n
Bal
ance
s
Dep
reci
atio
nB
alan
ces
(a)
1/1/
08
7/1/
08
12/3
1/08
12/3
1/08
1/1/
09
12/3
1/09
12/3
1/09
7/1/
10
7/1/
10
12/3
1/10
12/3
1/10
12/3
1/11
12/3
1/11
Inco
me
effe
ct
1 Imp
lied
fai
r m
arke
t va
lue
of
Tru
ck #
3 (¥
40,0
00 –
¥22
,000
) B
oo
k va
lue
of
Tru
ck #
3 [¥
30,0
00 –
(¥3
0,00
0/5
X 1
1 / 2 y
rs.)
] =
¥30,
000
– ¥9
,000
=L
oss
on
Tra
de
2 Tru
ck #
1: $
18,0
00/5
Tru
ck #
2: $
22,0
00/5
Tru
ck #
3: $
30,0
00/5
X 1
/2 T
ruck
#4:
$24,
000/
5 T
ruck
#5:
$40
,000
/5 X
1/2
To
tal
11-44 Copyright © 2011 John Wiley & Sons, Inc. Kieso, IFRS, 1/e, Solutions Manual (For Instructor Use Only)
PROBLEM 11-4 (Continued)
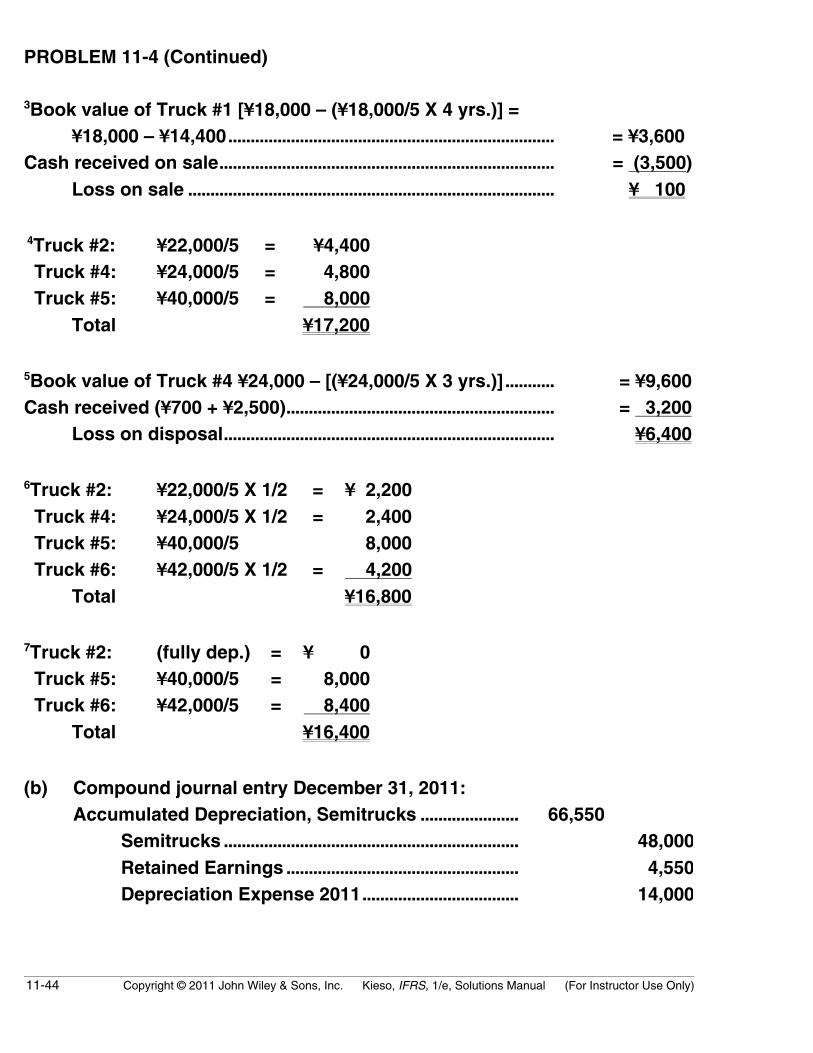
3Book value of Truck #1 [¥18,000 – (¥18,000/5 X 4 yrs.)] =¥18,000 – ¥14,400......................................................................... = ¥3,600
Cash received on sale........................................................................... = (3,500)Loss on sale .................................................................................. ¥ 100
4Truck #2: ¥22,000/5 = ¥4,400 Truck #4: ¥24,000/5 = 4,800 Truck #5: ¥40,000/5 = 8,000
Total ¥17,200
5Book value of Truck #4 ¥24,000 – [(¥24,000/5 X 3 yrs.)] ........... = ¥9,600Cash received (¥700 + ¥2,500)............................................................ = 3,200
Loss on disposal.......................................................................... ¥6,400
6Truck #2: ¥22,000/5 X 1/2 = ¥ 2,200 Truck #4: ¥24,000/5 X 1/2 = 2,400 Truck #5: ¥40,000/5 8,000 Truck #6: ¥42,000/5 X 1/2 = 4,200
Total ¥16,800
7Truck #2: (fully dep.) = ¥ 0 Truck #5: ¥40,000/5 = 8,000 Truck #6: ¥42,000/5 = 8,400
Total ¥16,400
(b) Compound journal entry December 31, 2011:Accumulated Depreciation, Semitrucks ...................... 66,550
Semitrucks .................................................................. 48,000Retained Earnings .................................................... 4,550Depreciation Expense 2011................................... 14,000
Copyright © 2011 John Wiley & Sons, Inc. Kieso, IFRS, 1/e, Solutions Manual (For Instructor Use Only) 11-45
PROBLEM 11-4 (Continued)
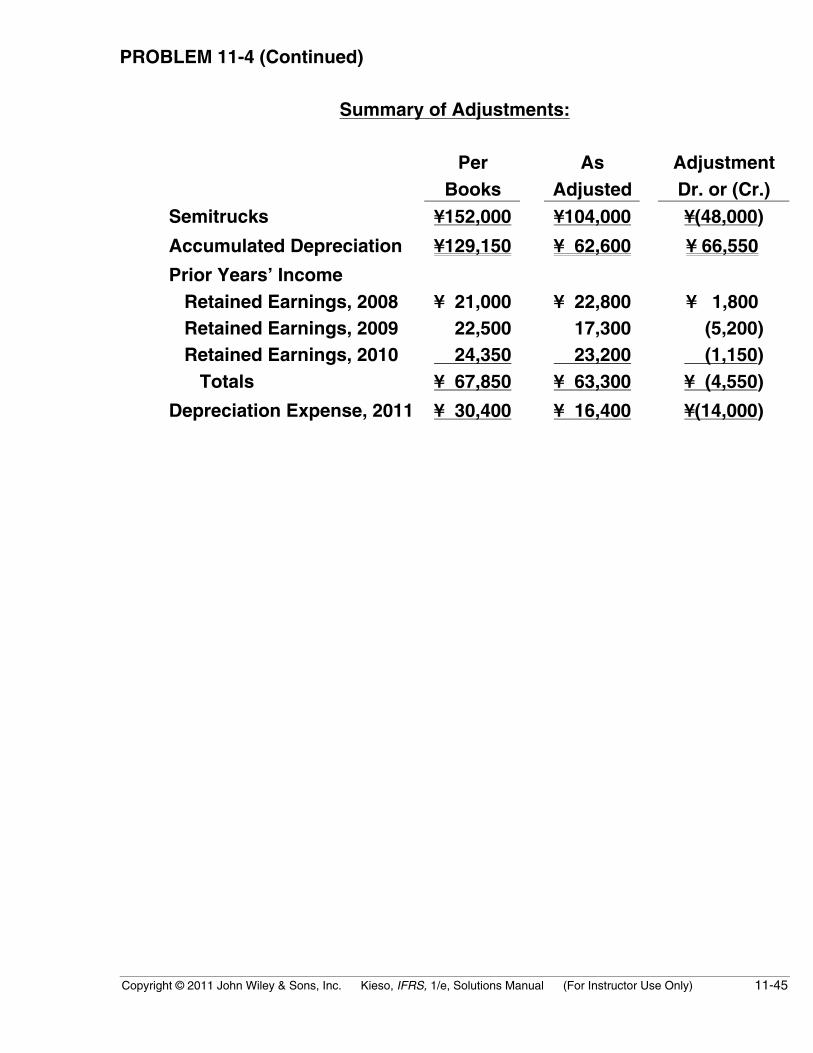
Summary of Adjustments:
PerBooks
AsAdjusted
AdjustmentDr. or (Cr.)
Semitrucks ¥152,000 ¥104,000 ¥(48,000)
Accumulated Depreciation ¥129,150 ¥ 62,600 ¥ 66,550
Prior Years’ Income Retained Earnings, 2008 ¥ 21,000 ¥ 22,800 ¥ 1,800 Retained Earnings, 2009 22,500 17,300 (5,200) Retained Earnings, 2010 24,350 23,200 (1,150) Totals ¥ 67,850 ¥ 63,300 ¥ (4,550)
Depreciation Expense, 2011 ¥ 30,400 ¥ 16,400 ¥(14,000)

11-46 Copyright © 2011 John Wiley & Sons, Inc. Kieso, IFRS, 1/e, Solutions Manual (For Instructor Use Only)
PROBLEM 11-5
(a) The amounts to be recorded on the books of Darby Sporting GoodsInc. as of December 31, 2010, for each of the properties acquired fromQuay Athletic Equipment Company are calculated as follows:
Cost Allocations to Acquired Properties
Appraisal
Value
Remaining
Purchase
Price
Allocations Renovations
Capitalized
Interest Total
(1) Land £290,000 £290,000
(2) Building £ 77,0001 £100,000 £21,0002 198,000
(3) Machinery 33,0001 33,000
Totals £290,000 £110,000 £100,000 £21,000 £521,000
Supporting Calculations
1Balance of purchase price to be allocated.Total purchase price....................................................................... £400,000Less: Land appraisal ..................................................................... 290,000
Balance to be allocated....................................................... £110,000
AppraisalValues Ratios
AllocatedValues
Building £105,000 105/150 = .70 X £110,000 £ 77,000Machinery 45,000 45/150 = .30 X £110,000 33,000
Totals £150,000 1.00 £110,000

Copyright © 2011 John Wiley & Sons, Inc. Kieso, IFRS, 1/e, Solutions Manual (For Instructor Use Only) 11-47
PROBLEM 11-5 (Continued)
2Capitalizable interest.Expenditures
Date AmountCapitalization
PeriodWeighted-Average
Accumulated Expenditures
1/1 £ 50,000 12/12 £ 50,0004/1 120,000 9/12 90,00010/1 140,000 3/12 35,00012/31 190,000 0/12 –0–
£500,000 £175,000
Weighted-Average Interest AvoidableAccumulated Expenditures Rate Interest
£175,000 X 12% = £21,000
Note to instructor: If the interest is allocated between the building and themachinery, £14,700 (£21,000 X 105/150) would be allocated to the buildingand £6,300 (£21,000 X 45/150) would be allocated to the machinery.
(b) Darby Sporting Goods Inc.’s 2011 depreciation expense, for bookpurposes, for each of the properties acquired from Quay AthleticEquipment Company is as follows:
1. Land: No depreciation.
2. Building: Depreciation rate = 1.50 X 1/15 = .102011 depreciation expense = Cost X Rate X 1/2 year
= £198,000 X .10 X 1/2= £9,900
3. Machinery: Depreciation rate = 2.00 X 1/5 = .402011 depreciation expense = Cost X Rate X 1/2
= £33,000 X .40 X 1/2= £6,600

11-48 Copyright © 2011 John Wiley & Sons, Inc. Kieso, IFRS, 1/e, Solutions Manual (For Instructor Use Only)
PROBLEM 11-5 (Continued)
(c) Arguments for the capitalization of interest costs include the following.1. Diversity of practices among companies and industries called for
standardization in practices.2. Total interest costs should be allocated to enterprise assets and
operations, just as material, labor, and overhead costs are allo-cated. That is, under the concept of historical costs, all costsincurred to bring an asset to the condition and location necessaryfor its intended use should be reflected as a cost of that asset.
Arguments against the capitalization of interest include the following:1. Interest capitalized in a period would tend to be offset by amorti-
zation of interest capitalized in prior periods.2. Interest cost is a cost of financing, not of construction.
(d) If Darby decides to use revaluation accounting for this building, thenrevaluation applies to all assets in that class of assets. Darby cannotselectively apply revaluation accounting to certain buildings but keepothers at historical cost.
Darby should use revaluation accounting if they want to increase theirequity base to help them meet covenant requirements or provideadditional assurances to investors and creditors that the company issolvent.
Darby should not use revaluation accounting because of the continuingcosts associated with appraisals to determine fair value. In addition,losses associated with revaluations decrease net income but gainsassociated with revaluations are not reported in net income but insteadgo directly to equity.
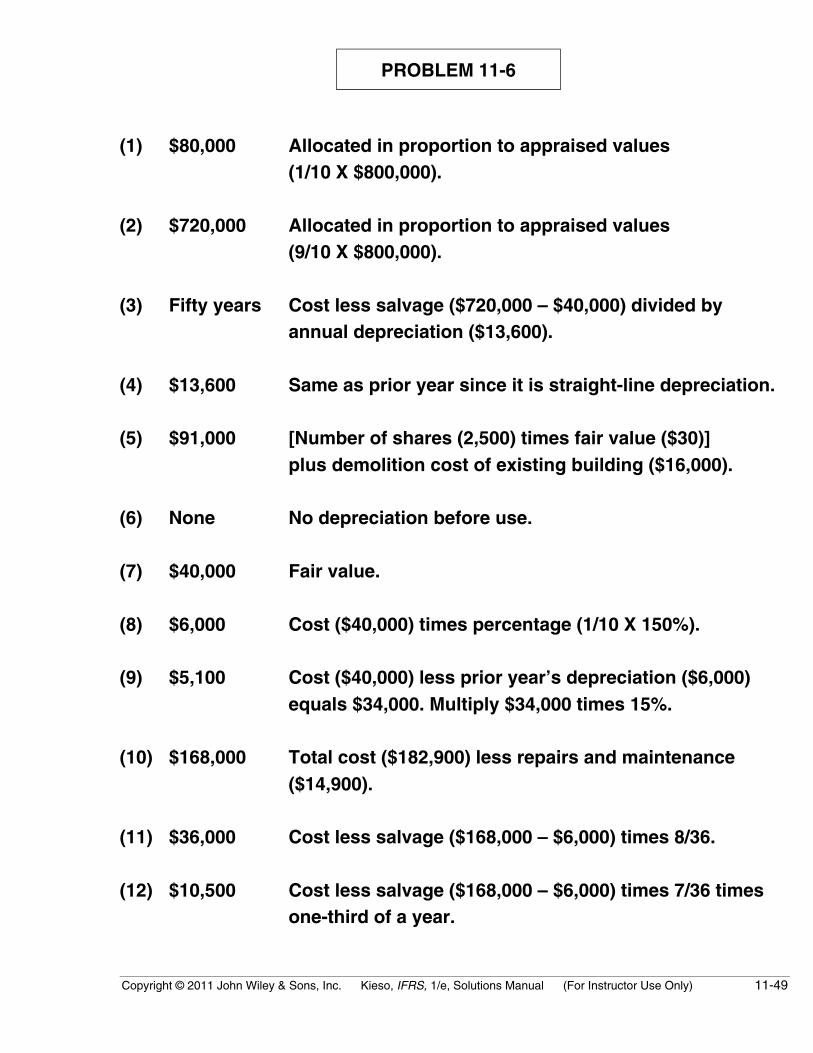
Copyright © 2011 John Wiley & Sons, Inc. Kieso, IFRS, 1/e, Solutions Manual (For Instructor Use Only) 11-49
PROBLEM 11-6
(1) $80,000 Allocated in proportion to appraised values(1/10 X $800,000).
(2) $720,000 Allocated in proportion to appraised values(9/10 X $800,000).
(3) Fifty years Cost less salvage ($720,000 – $40,000) divided byannual depreciation ($13,600).
(4) $13,600 Same as prior year since it is straight-line depreciation.
(5) $91,000 [Number of shares (2,500) times fair value ($30)]plus demolition cost of existing building ($16,000).
(6) None No depreciation before use.
(7) $40,000 Fair value.
(8) $6,000 Cost ($40,000) times percentage (1/10 X 150%).
(9) $5,100 Cost ($40,000) less prior year’s depreciation ($6,000)equals $34,000. Multiply $34,000 times 15%.
(10) $168,000 Total cost ($182,900) less repairs and maintenance($14,900).
(11) $36,000 Cost less salvage ($168,000 – $6,000) times 8/36.
(12) $10,500 Cost less salvage ($168,000 – $6,000) times 7/36 timesone-third of a year.

11-50 Copyright © 2011 John Wiley & Sons, Inc. Kieso, IFRS, 1/e, Solutions Manual (For Instructor Use Only)
PROBLEM 11-6 (Continued)
(13) $52,000 Annual payment ($6,000) times present value of annuitydue at 8% for 11 years (7.710) plus down payment ($5,740).This can be found in an annuity due table since thepayments are at the beginning of each year. Alternatively,to convert from an ordinary annuity to an annuity duefactor, proceed as follows: For eleven payments use thepresent value of an ordinary annuity for 11 years (7.139)times 1.08. Multiply this factor (7.710) times $6,000 annualpayment to obtain $46,260, and then add the $5,740down payment.
(14) $2,600 Cost ($52,000) divided by estimated life (20 years).
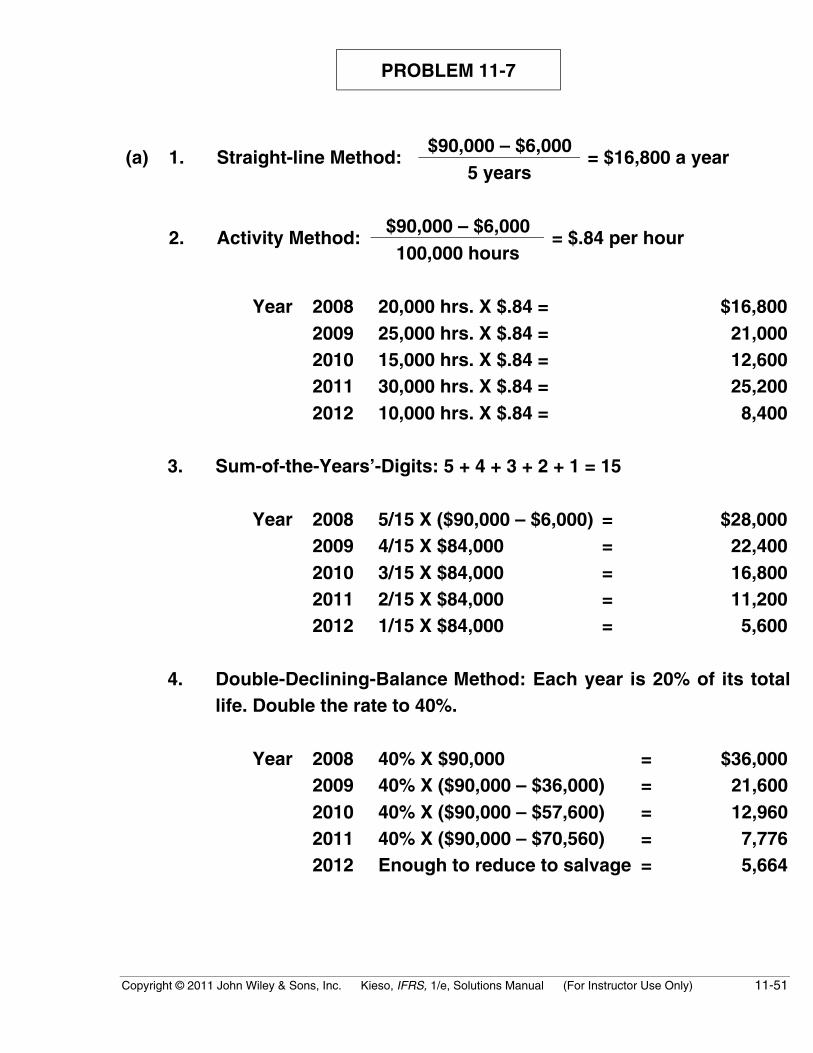
Copyright © 2011 John Wiley & Sons, Inc. Kieso, IFRS, 1/e, Solutions Manual (For Instructor Use Only) 11-51
PROBLEM 11-7
$90,000 – $6,000(a) 1. Straight-line Method:
5 years= $16,800 a year
$90,000 – $6,0002. Activity Method:
100,000 hours= $.84 per hour
Year 2008 20,000 hrs. X $.84 = $16,8002009 25,000 hrs. X $.84 = 21,0002010 15,000 hrs. X $.84 = 12,6002011 30,000 hrs. X $.84 = 25,2002012 10,000 hrs. X $.84 = 8,400
3. Sum-of-the-Years’-Digits: 5 + 4 + 3 + 2 + 1 = 15
Year 2008 5/15 X ($90,000 – $6,000) = $28,0002009 4/15 X $84,000 = 22,4002010 3/15 X $84,000 = 16,8002011 2/15 X $84,000 = 11,2002012 1/15 X $84,000 = 5,600
4. Double-Declining-Balance Method: Each year is 20% of its totallife. Double the rate to 40%.
Year 2008 40% X $90,000 = $36,0002009 40% X ($90,000 – $36,000) = 21,6002010 40% X ($90,000 – $57,600) = 12,9602011 40% X ($90,000 – $70,560) = 7,7762012 Enough to reduce to salvage = 5,664

11-52 Copyright © 2011 John Wiley & Sons, Inc. Kieso, IFRS, 1/e, Solutions Manual (For Instructor Use Only)
PROBLEM 11-7 (Continued)
(b) 1. Straight-line Method:
$90,000 – $6,000Year 2008
5 yearsX 9/12 = $12,600
2009 Full year 16,8002010 Full year 16,8002011 Full year 16,8002012 Full year 16,8002013 Full year X 3/12 year = 4,200
2. Sum-of-the-Years’-Digits:
2008 (5/15 X $84,000) X 9/12 = $21,000
2009 (5/15 X $84,000) X 3/12 = $ 7,000(4/15 X $84,000) X 9/12 = 16,800 23,800
2010 (4/15 X $84,000) X 3/12 = 5,600(3/15 X $84,000) X 9/12 = 12,600 18,200
2011 (3/15 X $84,000) X 3/12 = 4,200(2/15 X $84,000) X 9/12 = 8,400 12,600
2012 (2/15 X $84,000) X 3/12 = 2,800(1/15 X $84,000) X 9/12 = 4,200 7,000
2013 (1/15 X $84,000) X 3/12 = 1,400
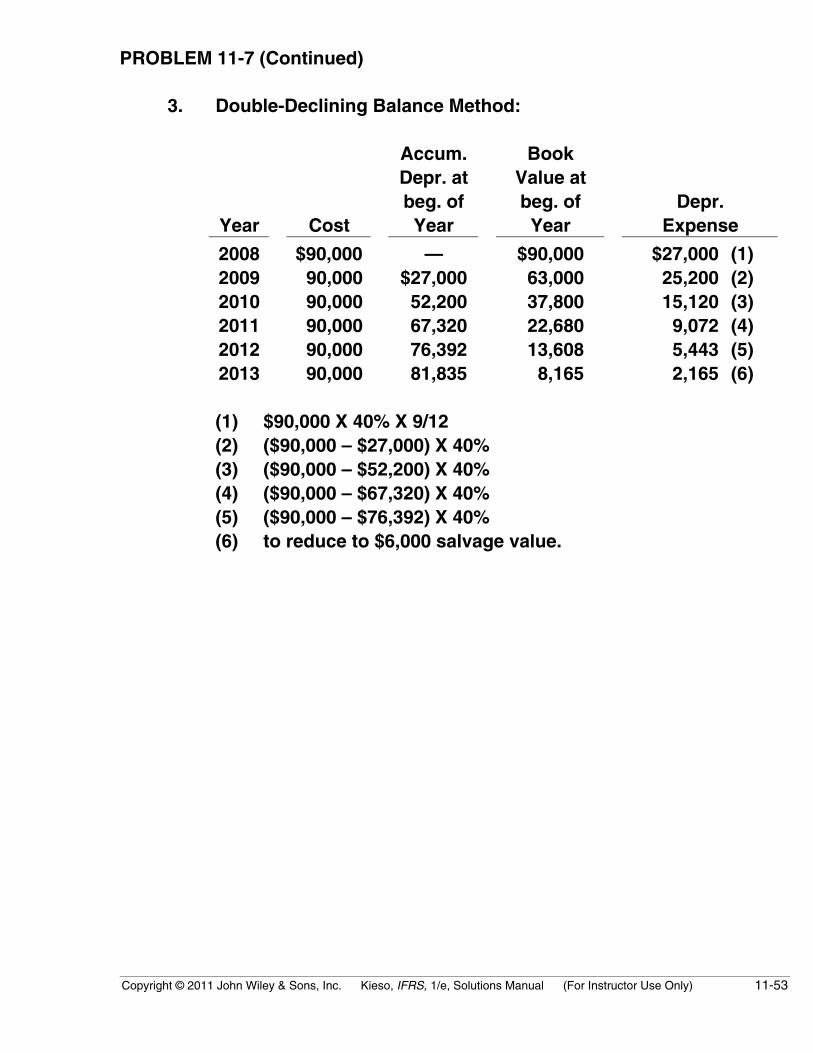
Copyright © 2011 John Wiley & Sons, Inc. Kieso, IFRS, 1/e, Solutions Manual (For Instructor Use Only) 11-53
PROBLEM 11-7 (Continued)
3. Double-Declining Balance Method:
Year Cost
Accum.Depr. atbeg. ofYear
BookValue atbeg. ofYear
Depr.Expense
2008 $90,000 — $90,000 $27,000 (1)2009 90,000 $27,000 63,000 25,200 (2)2010 90,000 52,200 37,800 15,120 (3)2011 90,000 67,320 22,680 9,072 (4)2012 90,000 76,392 13,608 5,443 (5)2013 90,000 81,835 8,165 2,165 (6)
(1) $90,000 X 40% X 9/12(2) ($90,000 – $27,000) X 40%(3) ($90,000 – $52,200) X 40%(4) ($90,000 – $67,320) X 40%(5) ($90,000 – $76,392) X 40%(6) to reduce to $6,000 salvage value.
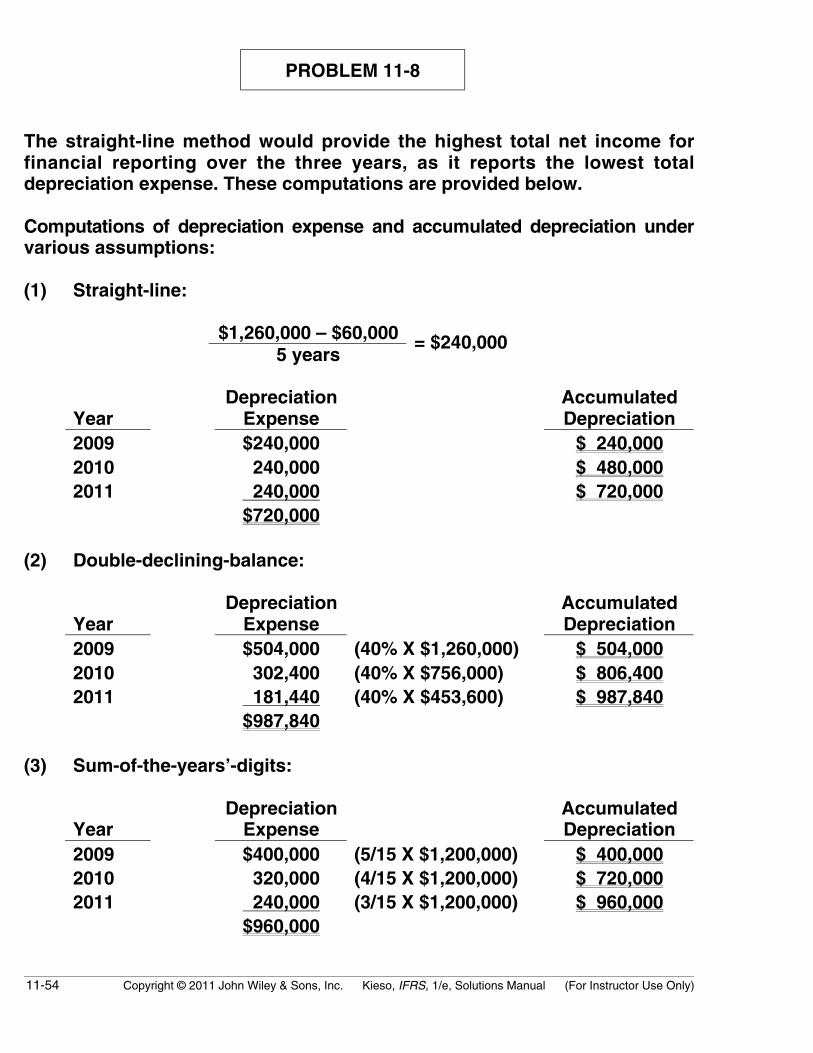
11-54 Copyright © 2011 John Wiley & Sons, Inc. Kieso, IFRS, 1/e, Solutions Manual (For Instructor Use Only)
PROBLEM 11-8
The straight-line method would provide the highest total net income forfinancial reporting over the three years, as it reports the lowest totaldepreciation expense. These computations are provided below.
Computations of depreciation expense and accumulated depreciation undervarious assumptions:
(1) Straight-line:
$1,260,000 – $60,0005 years
= $240,000
YearDepreciation
ExpenseAccumulatedDepreciation
2009 $240,000 $ 240,0002010 240,000 $ 480,0002011 240,000 $ 720,000
$720,000
(2) Double-declining-balance:
YearDepreciation
ExpenseAccumulatedDepreciation
2009 $504,000 (40% X $1,260,000) $ 504,0002010 302,400 (40% X $756,000) $ 806,4002011 181,440 (40% X $453,600) $ 987,840
$987,840
(3) Sum-of-the-years’-digits:
YearDepreciation
ExpenseAccumulatedDepreciation
2009 $400,000 (5/15 X $1,200,000) $ 400,0002010 320,000 (4/15 X $1,200,000) $ 720,0002011 240,000 (3/15 X $1,200,000) $ 960,000
$960,000
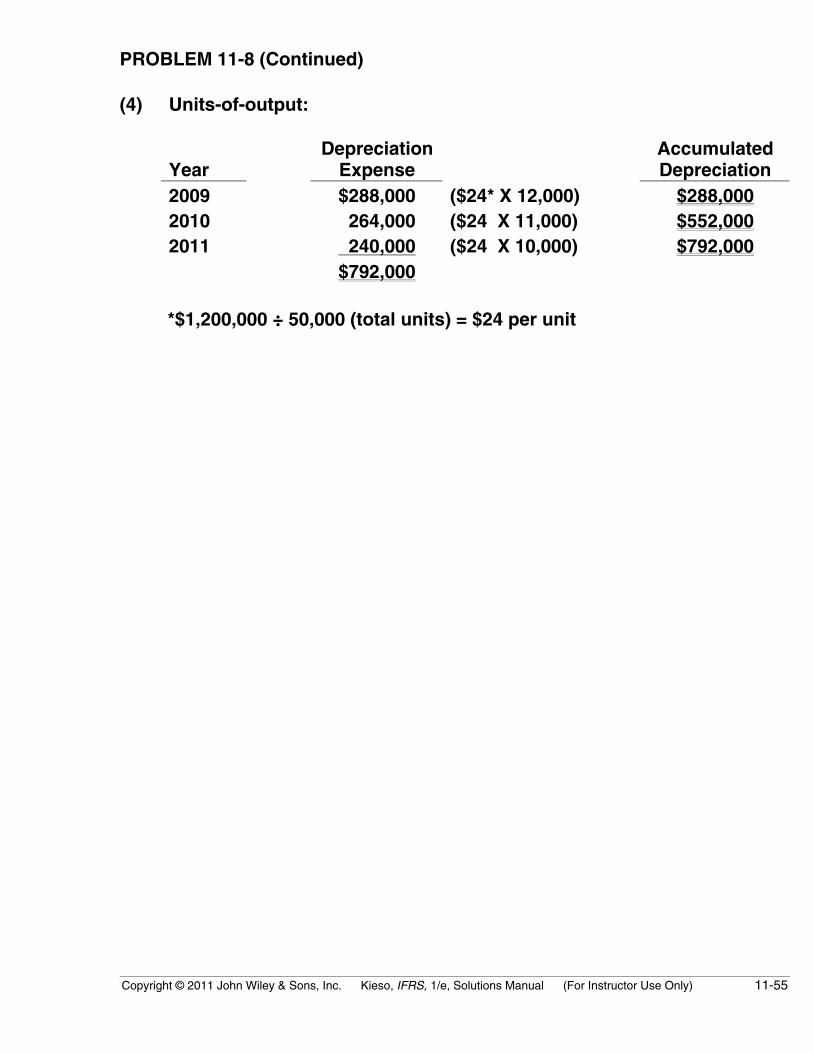
Copyright © 2011 John Wiley & Sons, Inc. Kieso, IFRS, 1/e, Solutions Manual (For Instructor Use Only) 11-55
PROBLEM 11-8 (Continued)
(4) Units-of-output:
YearDepreciation
ExpenseAccumulatedDepreciation
2009 $288,000 ($24* X 12,000) $288,0002010 264,000 ($24 X 11,000) $552,0002011 240,000 ($24 X 10,000) $792,000
$792,000
*$1,200,000 ÷ 50,000 (total units) = $24 per unit
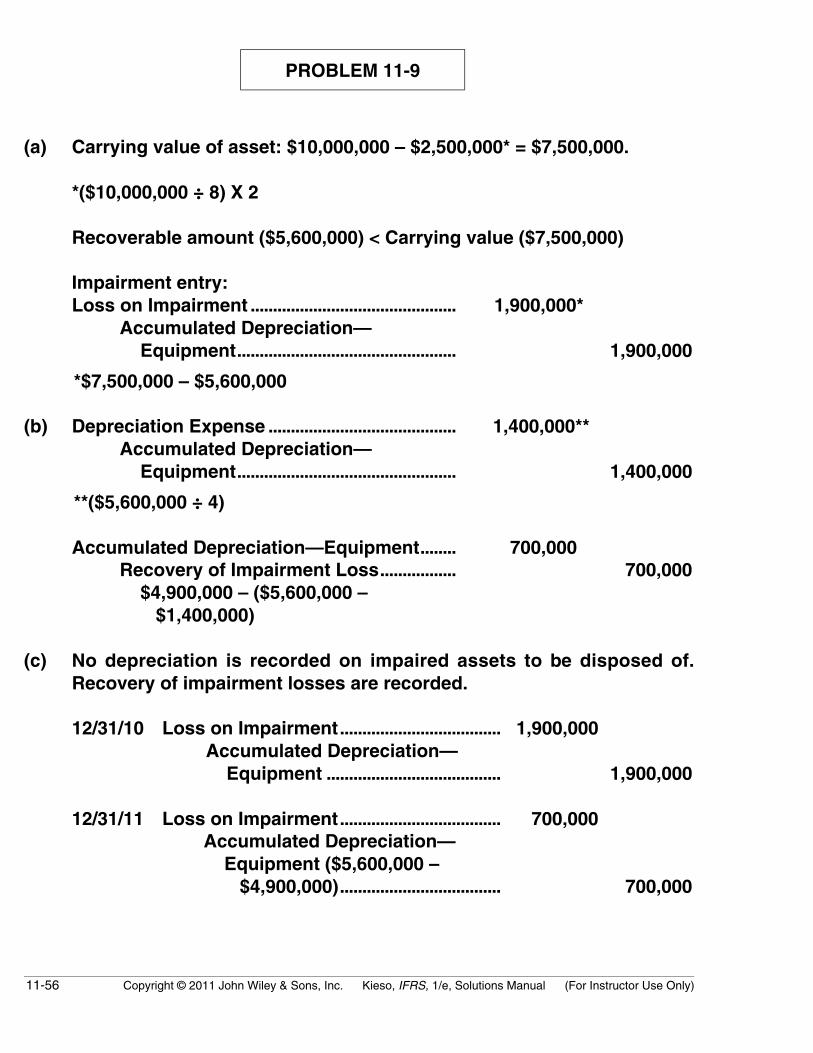
11-56 Copyright © 2011 John Wiley & Sons, Inc. Kieso, IFRS, 1/e, Solutions Manual (For Instructor Use Only)
PROBLEM 11-9
(a) Carrying value of asset: $10,000,000 – $2,500,000* = $7,500,000.
*($10,000,000 ÷ 8) X 2
Recoverable amount ($5,600,000) < Carrying value ($7,500,000)
Impairment entry:Loss on Impairment .............................................. 1,900,000*
Accumulated Depreciation— Equipment................................................. 1,900,000
*$7,500,000 – $5,600,000
(b) Depreciation Expense .......................................... 1,400,000**Accumulated Depreciation— Equipment................................................. 1,400,000
**($5,600,000 ÷ 4)
Accumulated Depreciation—Equipment........ 700,000Recovery of Impairment Loss................. 700,000 $4,900,000 – ($5,600,000 – $1,400,000)
(c) No depreciation is recorded on impaired assets to be disposed of.Recovery of impairment losses are recorded.
12/31/10 Loss on Impairment.................................... 1,900,000Accumulated Depreciation— Equipment ....................................... 1,900,000
12/31/11 Loss on Impairment.................................... 700,000Accumulated Depreciation— Equipment ($5,600,000 – $4,900,000).................................... 700,000
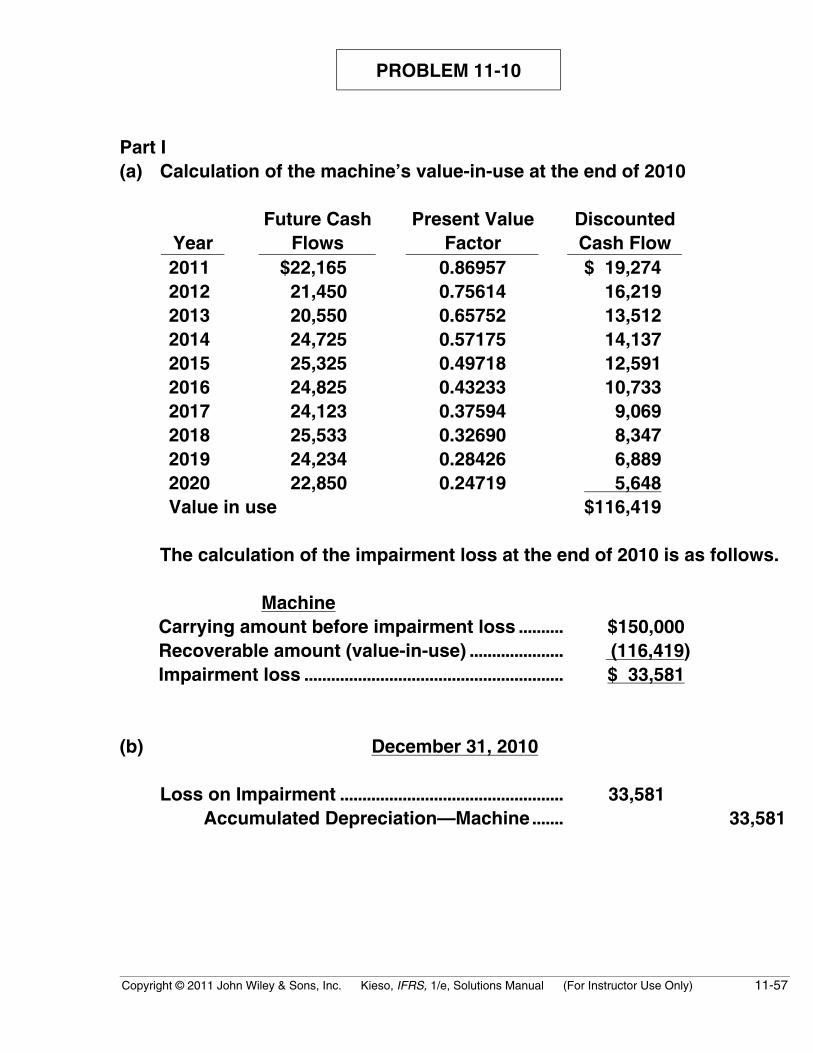
Copyright © 2011 John Wiley & Sons, Inc. Kieso, IFRS, 1/e, Solutions Manual (For Instructor Use Only) 11-57
PROBLEM 11-10
Part I(a) Calculation of the machine’s value-in-use at the end of 2010
YearFuture Cash
FlowsPresent Value
FactorDiscountedCash Flow
2011 $22,165 0.86957 $ 19,2742012 21,450 0.75614 16,2192013 20,550 0.65752 13,5122014 24,725 0.57175 14,1372015 25,325 0.49718 12,5912016 24,825 0.43233 10,7332017 24,123 0.37594 9,0692018 25,533 0.32690 8,3472019 24,234 0.28426 6,8892020 22,850 0.24719 5,648Value in use $116,419
The calculation of the impairment loss at the end of 2010 is as follows.
MachineCarrying amount before impairment loss .......... $150,000Recoverable amount (value-in-use) ..................... (116,419)Impairment loss .......................................................... $ 33,581
(b) December 31, 2010
Loss on Impairment .................................................. 33,581Accumulated Depreciation—Machine....... 33,581
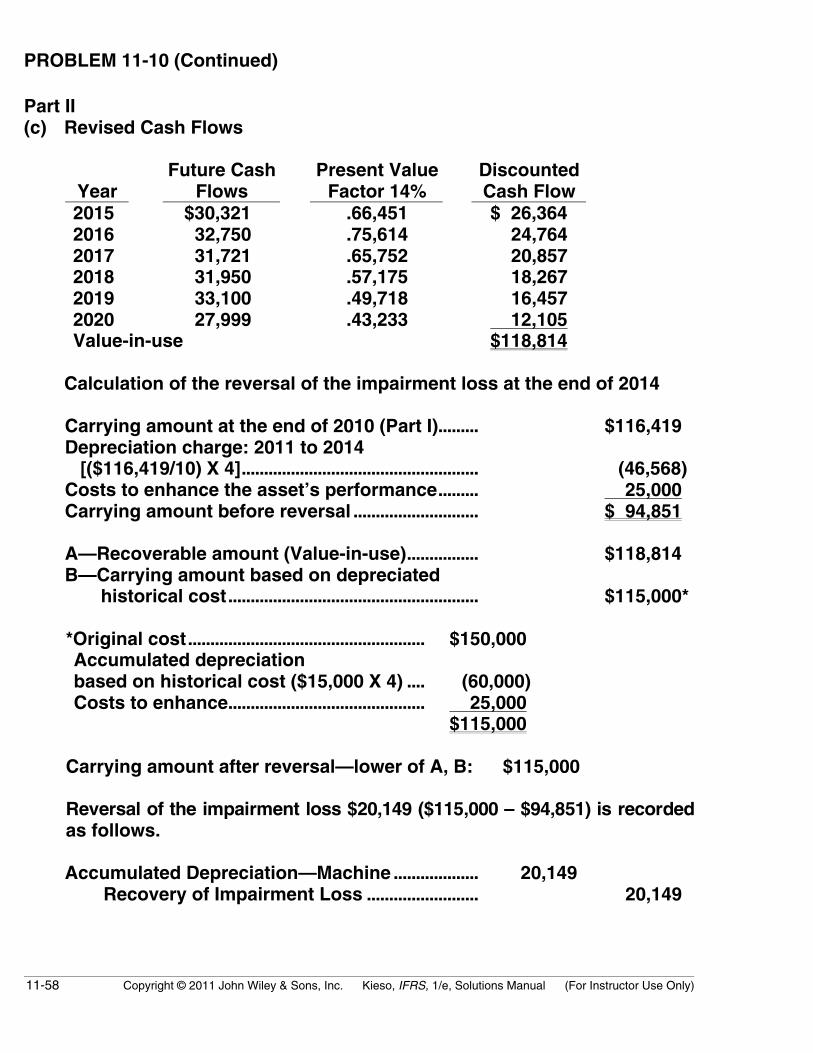
11-58 Copyright © 2011 John Wiley & Sons, Inc. Kieso, IFRS, 1/e, Solutions Manual (For Instructor Use Only)
PROBLEM 11-10 (Continued)
Part II(c) Revised Cash Flows
YearFuture Cash
FlowsPresent Value
Factor 14%DiscountedCash Flow
2015 $30,321 .66,451 $ 26,3642016 32,750 .75,614 24,7642017 31,721 .65,752 20,8572018 31,950 .57,175 18,2672019 33,100 .49,718 16,4572020 27,999 .43,233 12,105Value-in-use $118,814
Calculation of the reversal of the impairment loss at the end of 2014
Carrying amount at the end of 2010 (Part I)......... $116,419Depreciation charge: 2011 to 2014 [($116,419/10) X 4]..................................................... (46,568)Costs to enhance the asset’s performance......... 25,000Carrying amount before reversal ............................ $ 94,851
A—Recoverable amount (Value-in-use)................ $118,814B—Carrying amount based on depreciated historical cost........................................................ $115,000*
*Original cost..................................................... $150,000Accumulated depreciationbased on historical cost ($15,000 X 4) .... (60,000)Costs to enhance............................................ 25,000
$115,000
Carrying amount after reversal—lower of A, B: $115,000
Reversal of the impairment loss $20,149 ($115,000 – $94,851) is recordedas follows.
Accumulated Depreciation—Machine ................... 20,149Recovery of Impairment Loss ......................... 20,149

Copyright © 2011 John Wiley & Sons, Inc. Kieso, IFRS, 1/e, Solutions Manual (For Instructor Use Only) 11-59
PROBLEM 11-11
(a) Cost per barrel: (£1,200,000 + £50,000) ÷ 500,000 = £2.5/barrel
(b) Sales (36,000 X £65)............................................... £2,340,000Expenses:
Depletion (36,000 X £2.5)............................. £90,000Premium Payment (£2,340,000 X .04)...... 93,600Annual rental................................................... 62,000 245,600Current year profit......................................... £2,094,400
(c) Phelps has a choice on how to account for its exploration and evaluationcosts. It can either write off these costs as incurred or capitalize thempending evaluation.
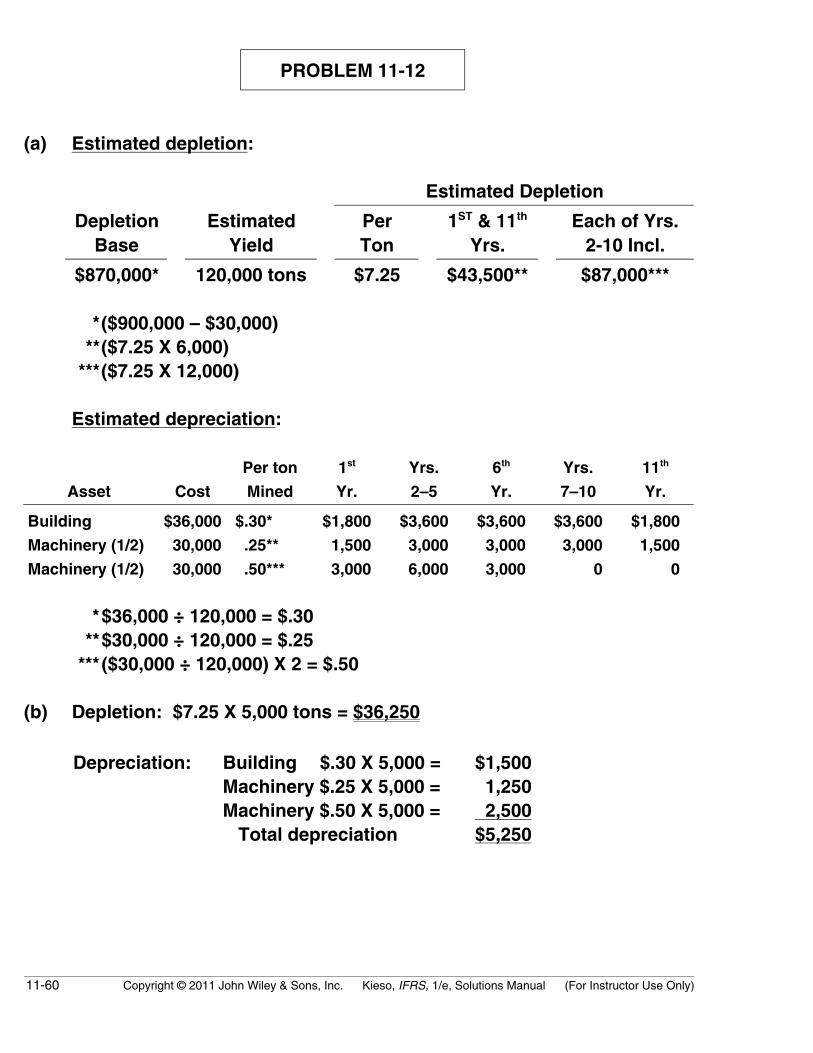
11-60 Copyright © 2011 John Wiley & Sons, Inc. Kieso, IFRS, 1/e, Solutions Manual (For Instructor Use Only)
PROBLEM 11-12
(a) Estimated depletion:
Estimated Depletion
DepletionBase
EstimatedYield
PerTon
1ST & 11th
Yrs.Each of Yrs.
2-10 Incl.
$870,000* 120,000 tons $7.25 $43,500** $87,000***
*($900,000 – $30,000)**($7.25 X 6,000)
***($7.25 X 12,000)
Estimated depreciation:
Asset Cost
Per ton
Mined
1st
Yr.
Yrs.
2–5
6th
Yr.
Yrs.
7–10
11th
Yr.
Building $36,000 $.30* $1,800 $3,600 $3,600 $3,600 $1,800
Machinery (1/2) 30,000 .25** 1,500 3,000 3,000 3,000 1,500
Machinery (1/2) 30,000 .50*** 3,000 6,000 3,000 0 0
*$36,000 ÷ 120,000 = $.30**$30,000 ÷ 120,000 = $.25
***($30,000 ÷ 120,000) X 2 = $.50
(b) Depletion: $7.25 X 5,000 tons = $36,250
Depreciation: Building $.30 X 5,000 = $1,500Machinery $.25 X 5,000 = 1,250Machinery $.50 X 5,000 = 2,500 Total depreciation $5,250
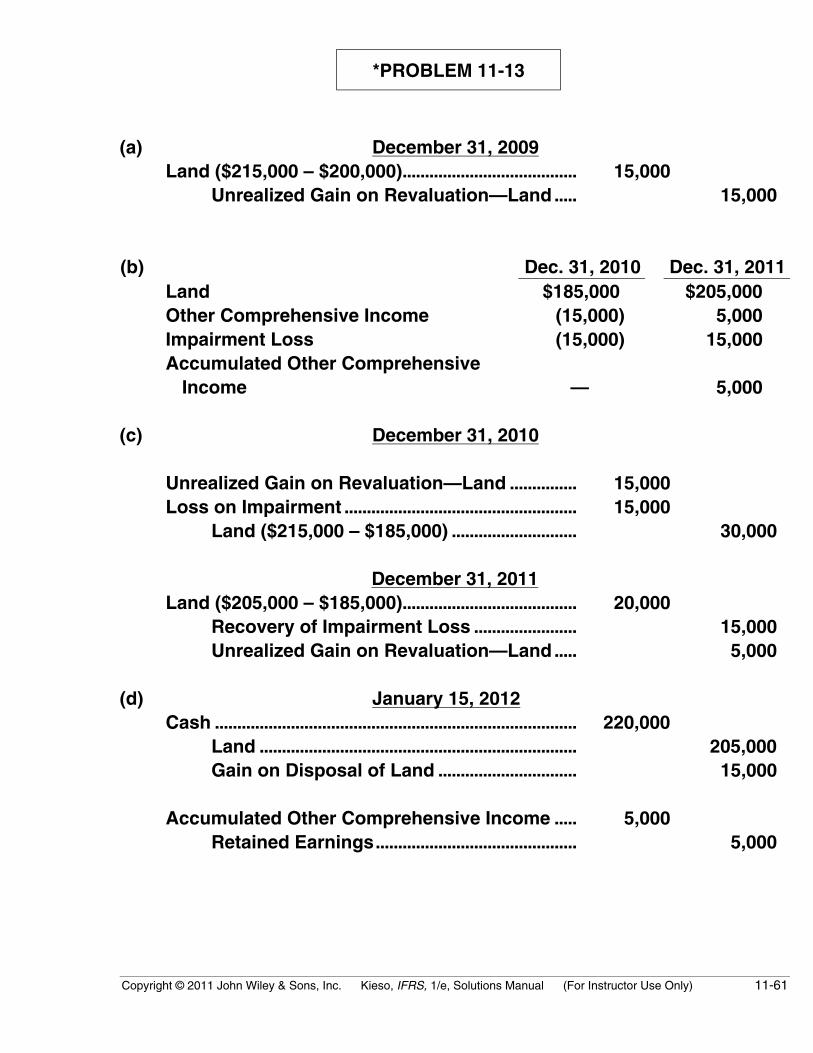
Copyright © 2011 John Wiley & Sons, Inc. Kieso, IFRS, 1/e, Solutions Manual (For Instructor Use Only) 11-61
*PROBLEM 11-13
(a) December 31, 2009Land ($215,000 – $200,000)....................................... 15,000
Unrealized Gain on Revaluation—Land..... 15,000
(b) Dec. 31, 2010 Dec. 31, 2011Land $185,000 $205,000Other Comprehensive Income (15,000) 5,000Impairment Loss (15,000) 15,000Accumulated Other Comprehensive Income — 5,000
(c) December 31, 2010
Unrealized Gain on Revaluation—Land ............... 15,000Loss on Impairment .................................................... 15,000
Land ($215,000 – $185,000) ............................ 30,000
December 31, 2011Land ($205,000 – $185,000)....................................... 20,000
Recovery of Impairment Loss ....................... 15,000Unrealized Gain on Revaluation—Land..... 5,000
(d) January 15, 2012Cash ................................................................................. 220,000
Land ....................................................................... 205,000Gain on Disposal of Land ............................... 15,000
Accumulated Other Comprehensive Income ..... 5,000Retained Earnings............................................. 5,000
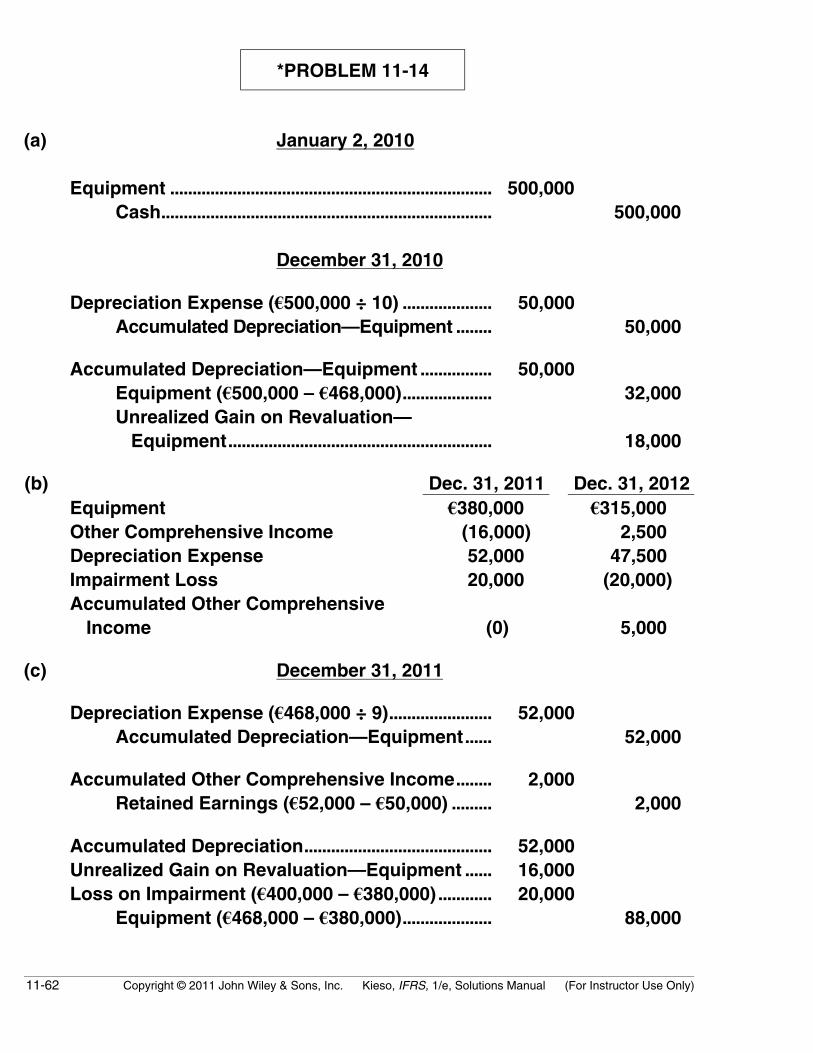
11-62 Copyright © 2011 John Wiley & Sons, Inc. Kieso, IFRS, 1/e, Solutions Manual (For Instructor Use Only)
*PROBLEM 11-14
(a) January 2, 2010
Equipment ........................................................................ 500,000Cash.......................................................................... 500,000
December 31, 2010
Depreciation Expense (€500,000 ÷ 10) .................... 50,000Accumulated Depreciation—Equipment ........ 50,000
Accumulated Depreciation—Equipment ................ 50,000Equipment (€500,000 – €468,000).................... 32,000Unrealized Gain on Revaluation— Equipment........................................................... 18,000
(b) Dec. 31, 2011 Dec. 31, 2012Equipment €380,000 €315,000Other Comprehensive Income (16,000) 2,500Depreciation Expense 52,000 47,500Impairment Loss 20,000 (20,000)Accumulated Other Comprehensive Income (0) 5,000
(c) December 31, 2011
Depreciation Expense (€468,000 ÷ 9)....................... 52,000Accumulated Depreciation—Equipment...... 52,000
Accumulated Other Comprehensive Income........ 2,000Retained Earnings (€52,000 – €50,000) ......... 2,000
Accumulated Depreciation.......................................... 52,000Unrealized Gain on Revaluation—Equipment ...... 16,000Loss on Impairment (€400,000 – €380,000)............ 20,000
Equipment (€468,000 – €380,000).................... 88,000
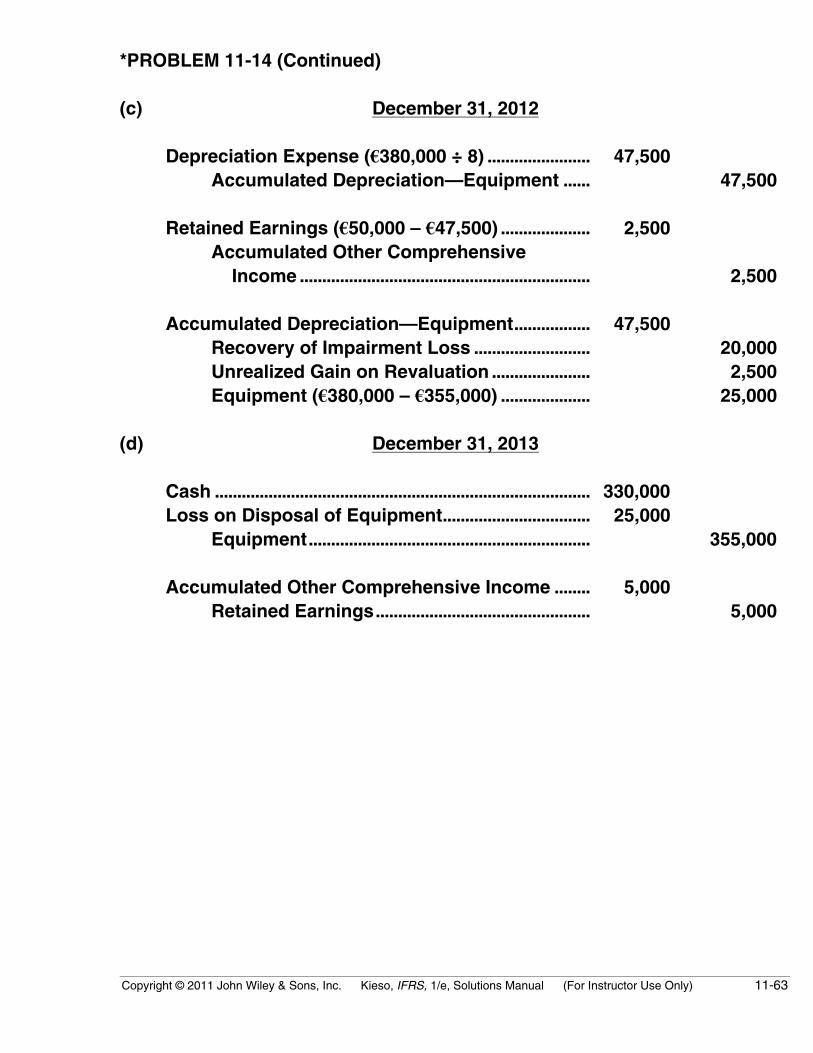
Copyright © 2011 John Wiley & Sons, Inc. Kieso, IFRS, 1/e, Solutions Manual (For Instructor Use Only) 11-63
*PROBLEM 11-14 (Continued)
(c) December 31, 2012
Depreciation Expense (€380,000 ÷ 8) ....................... 47,500Accumulated Depreciation—Equipment ...... 47,500
Retained Earnings (€50,000 – €47,500) .................... 2,500Accumulated Other Comprehensive Income ................................................................. 2,500
Accumulated Depreciation—Equipment................. 47,500Recovery of Impairment Loss .......................... 20,000Unrealized Gain on Revaluation ...................... 2,500Equipment (€380,000 – €355,000) .................... 25,000
(d) December 31, 2013
Cash .................................................................................... 330,000Loss on Disposal of Equipment................................. 25,000
Equipment............................................................... 355,000
Accumulated Other Comprehensive Income ........ 5,000Retained Earnings................................................ 5,000

11-64 Copyright © 2011 John Wiley & Sons, Inc. Kieso, IFRS, 1/e, Solutions Manual (For Instructor Use Only)
TIME AND PURPOSE OF CONCEPTS FOR ANALYSIS
CA 11-1 (Time 25–35 minutes)Purpose—to provide the student with an understanding of the basic objective of depreciation accounting.In addition, the case involves a reverse sum-of-the-years’-digits situation and the student is to commenton the propriety of such an approach. Finally, the classic issue of whether depreciation provides fundsmust be considered. The tax effects of depreciation must be considered when this part of the case isexamined. An excellent case for covering the traditional issues involving depreciation accounting.
CA 11-2 (Time 25–35 minutes)Purpose—to provide the student with an understanding of a number of unstructured situations involvingdepreciation accounting. The first situation considers whether depreciation should be recorded during astrike. The second situation involves the propriety of employing the units-of-production method incertain situations. The third situation involves the step-up of depreciation charges because propertiesare to be replaced due to obsolescence. The case is somewhat ambiguous, so cut-and-dried approachesshould be discouraged.
CA 11-3 (Time 25–35 minutes)Purpose—to provide the student with an understanding of the objectives of depreciation and thetheoretical basis for accelerated depreciation methods.
CA 11-4 (Time 20–25 minutes)Purpose—to provide the student with the opportunity to examine the ethical dimensions of the depre-ciation method choice.
Copyright © 2011 John Wiley & Sons, Inc. Kieso, IFRS, 1/e, Solutions Manual (For Instructor Use Only) 11-65
SOLUTIONS TO CONCEPTS FOR ANALYSIS
CA 11-1
(a) The purpose of depreciation is to distribute the cost (or other book value) of tangible plant assets,less residual value, over their useful lives in a systematic and rational manner. Under IFRS,depreciation accounting is a process of allocation, not of valuation, through which the productiveeffort (cost) is to be matched with productive accomplishment (revenue) for the period. Depreciationaccounting, therefore, is concerned with the timing of the expiration of the cost of tangible plantassets.
(b) The proposed depreciation method is, of course, systematic. Whether it is rational in terms of costallocation depends on the facts of the case. It produces an increasing depreciation charge, whichis usually not justifiable in terms of the benefit from the use of the asset because manufacturerstypically prefer to use their new equipment as much as possible and their old equipment only asneeded to meet production quotas during periods of peak demand. As a general rule, then, thebenefit declines with age. Assuming that the actual operations (including equipment usage) ofeach year are identical, maintenance and repair costs are likely to be higher in the later years ofusage than in the earlier years. Hence the proposed method would couple light depreciation andrepair charges in the early years. Reported net income in the early years would be much higherthan reported net income in the later years of asset life, an unreasonable and undesirable variationduring periods of identical operation.
On the other hand, if the expected level of operations (including equipment usage) in the earlyyears of asset life is expected to be low as compared to that of later years because of slack demandor production policies, the pattern of the depreciation charges of the proposed method approximatelyparallels expected benefits (and revenues) and hence is reasonable. Although the units-of-productiondepreciation method is the usual selection to fit this case, the proposed method also conforms toIFRS in this case provided that proper justification is given.
(c) (1) Depreciation charges neither recover nor create funds. Revenue-producing activities are thesources of funds from operations: if revenues exceed out-of-pocket costs during a fiscal period,funds are available to cover other than out-of-pocket costs; if revenues do not exceed out-of-pocket costs, no funds are made available no matter how much, or little, depreciation is charged.
(2) Depreciation may affect funds in two ways. First, depreciation charges affect reported incomeand hence may affect managerial decisions such as those regarding pricing, product selection,and dividends. For example, the proposed method would result initially in higher reportedincome than would the straight-line method, consequently shareholders might demand higherdividends in the earlier years than they would otherwise expect.
The straight-line method, by causing a lower reported income during the early years of asset lifeand thereby reducing the amount of possible dividends in early years as compared with theproposed method, could encourage earlier reinvestments in other profit-earning assets in order tomeet increasing demand.
11-66 Copyright © 2011 John Wiley & Sons, Inc. Kieso, IFRS, 1/e, Solutions Manual (For Instructor Use Only)
CA 11-1 (Continued)
Second, depreciation charges affect reported taxable income and hence affect directly the amountof income taxes payable in the year of deduction.
Using the proposed method for tax purposes would reduce the total tax bill over the life of theassets (1) if the tax rates were increased in future years or (2) if the business were doing poorlynow but were to do significantly better in the future. The first condition is political and speculativebut the second condition may be applicable to Burnitz Manufacturing Company in view of its recentorigin and its rapid expansion program. Consequently, more funds might be available forreinvestment in plant assets in years of large deductions if one of the above assumptions were true.
If Burnitz is not profitable now, it would not benefit from higher deductions now and shouldconsider an increasing charge method for tax purposes, such as the one proposed. If Burnitz isquite profitable now, the president should reconsider his proposal because it will delay theavailability of the tax shield provided by depreciation. However, this decision should not affect thedecision to use a depreciation method for shareholders’ reporting that is systematic and rational interms of cost allocation under IFRS as presently understood.
CA 11-2
Situation I. This position relates to the omission of a provision for depreciation during a strike. The samequestion could be raised with respect to plant shut-downs for many reasons, such as for a lack of salesor for seasonal business.
The method of depreciation used should be systematic and rational. The annual provision fordepreciation should represent a fair estimate of the loss in value arising from wear and usage and alsofrom obsolescence. Each company should analyze its own facts and establish the best method underthe circumstances. If the company was employing a straight-line depreciation method, for example, it isinappropriate to stop depreciating the plant asset during the strike.
If the company employs a units-of-production method, however, it would be appropriate not to depreciatethe asset during this period. Even in this latter case, however, if the strike were prolonged, it might bedesirable to record some depreciation because of the obsolescence factors related to the passage oftime.
Situation II. (a) Steady demand for the new blenders suggests use of the straight-line method or theunits-of-production method, either of which will allocate cost evenly over the life of the machine.Decreasing demand indicates use of an accelerated method (declining-balance or sum-of-the-years’-digits) or the units-of-production method in order to allocate more of the cost to the earlier years of themachine’s life. Increasing demand indicates the use of the units-of-production method to charge moreof the cost to the later years of the machine’s life.
Copyright © 2011 John Wiley & Sons, Inc. Kieso, IFRS, 1/e, Solutions Manual (For Instructor Use Only) 11-67
CA 11-2 (Continued)
(b) In determining the depreciation method to be used for the machine, the objective should be toallocate the cost of the machine over its useful life in a systematic and rational manner, so thatcosts will be matched with the benefits expected to be obtained. In addition to demand, considera-tion should be given to the items discussed below, their interrelationships, the relative importanceof each, and the degree of certainty with which each can be predicted:
The expected pattern of costs of repairs and maintenance should be considered. Costs whichvary with use of the machine may suggest the use of the units-of-production method. Costswhich are expected to be equal from period to period suggest the use of the straight-linemethod. If costs are expected to increase with the age of the machine, an accelerated methodmay be considered reasonable because it will tend to equalize total expenses from period toperiod.
The operating efficiency of the machine may change with its age. A decrease in operatingefficiency may cause increases in such costs as labor and power; if so, an accelerated methodis indicated. If operating efficiency is not expected to decline, the straight-line method isindicated.
Another consideration is the expiration of the physical life of the machine. If the machine wearsout in relation to the passage of time, the straight-line method is indicated. Within this maximumlife, if the usage per period varies, the units-of-production method may be appropriate.
The machine may become obsolete because of technological innovation; it may someday bemore efficient to replace the machine even though it is far from worn out. If the probability ishigh that such obsolescence will occur in the near future, the shortened economic life shouldbe recognized. Within this shortened life, the depreciation method used would be determinedby evaluating such consideration as the anticipated periodic usage.
An example of the interrelationship of the items discussed above is the effect of the repairs andmaintenance policy on operating efficiency and physical life of the machine. For instance, ifonly minimal repairs and maintenance are undertaken, efficiency may decrease rapidly and lifemay be short.
It is possible that different considerations may indicate different depreciation methods for themachine. If so, a choice must be made based on the relative importance of the considerations.For instance, physical life may be less important than the strong chance of technologicalobsolescence which would result in a shorter economic life.
Situation III. Depreciation rates should be adjusted in order that the operating sawmills which are to bereplaced will be depreciated to their residual value by the time the new facility becomes available. Thestep-up in the depreciation rates should be considered as a change in estimate and prior years’financial statements should not be adjusted.
The idle mill should be written off immediately as it appears to have no future service potential.

11-68 Copyright © 2011 John Wiley & Sons, Inc. Kieso, IFRS, 1/e, Solutions Manual (For Instructor Use Only)
CA 11-3
To: Phil Perriman, Supervisor of Canning Room
From: Your name, Accountant
Date: January 22, 2010
Subject: Annual depreciation charge to the canning department
This memo addresses the questions you asked about the depreciation charge against your department.Admittedly this charge of $625,000 is very high; however, it is not intended to reflect the wear and tearwhich the machinery has undergone over the last year. Rather, it is a portion of the machines’ costwhich has been allocated to this period.
Depreciation is frequently thought to reflect an asset’s loss in value over time. For financial statementpurposes, however, depreciation allocates part of an asset’s cost in a systematic way to each periodduring its useful life. Although there will always be a decline in an asset’s value over time, the deprecia-tion charge is not supposed to measure that decline; instead, it is a periodic “charge” for using purchasedequipment during any given period. When you consider the effect which the alternative would have onyour departmental costs—expensing the total cost for all six machines this year—is more equitable.
You also mentioned that using straight-line depreciation would result in a smaller charge than wouldthe current double-declining-balance method. This is true during the first years of the equipment’s life.Straight-line depreciation expenses even amounts of depreciation for each canning machine’s twelve-year life. Thus the straight-line charge for this and all subsequent years would be $47,500 per machinefor total annual depreciation of $285,000.
During the earlier years of an asset’s life, the double-declining-balance method results in higher deprecia-tion charges because it doubles the charge which would have been made under the straight-linemethod. However, the same percentage depreciation in the first year is applied annually to the asset’sdeclining book value. Therefore, the double-declining-balance charge becomes lower than the straight-line charge during the last several years of the asset’s life. For this year, as mentioned above, thecharge is $625,000, but in subsequent years this expense will become lower. By the end of the twelfthyear, the same amount of depreciation will have been taken regardless of the method used.
The straight-line method would result in fewer charges against your department this year. However,consider this: when the asset is new, additional costs for service and repairs are minimal. Thus agreater part of the asset’s cost should be allocated to this optimal portion of the asset’s life. After a fewyears, your department will have to absorb the additional burden of repair and maintenance costs.During that time, wouldn’t you rather have a lower depreciation charge?
I hope that this explanation helps clarify any questions which you may have had about depreciationcharges to your department.
Copyright © 2011 John Wiley & Sons, Inc. Kieso, IFRS, 1/e, Solutions Manual (For Instructor Use Only) 11-69
CA 11-4
(a) The stakeholders are Beeler’s employees, including Prior, current and potential investors andcreditors, and upper-level management.
(b) The ethical issues are honesty and integrity in financial reporting, job security, and the externalusers’ right to know the financial picture.
(c) Prior should review the estimated useful lives and residual values of the depreciable assets.Since they are estimates, it is possible that some should be changed. Any changes should bebased on sound, objective information without concern for the effect on the financial statements(or anyone’s job).
(Note: This case can be used with Chapter 22, Accounting Changes and Error Analysis.)
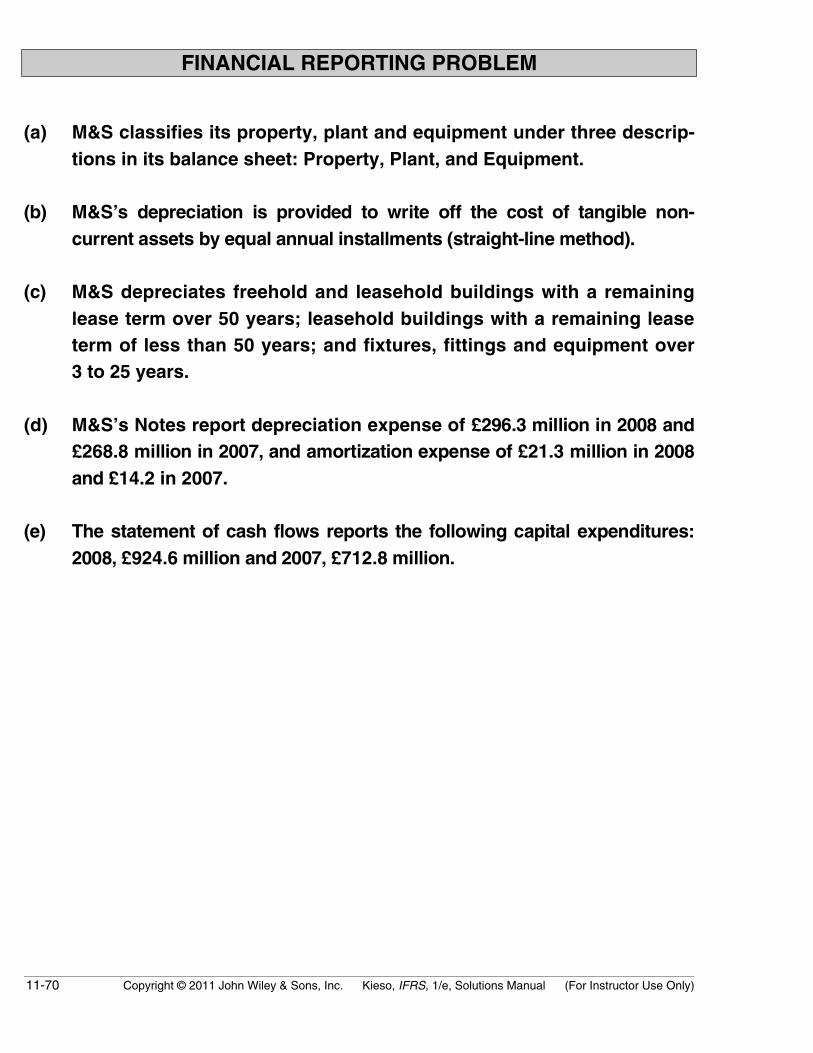
11-70 Copyright © 2011 John Wiley & Sons, Inc. Kieso, IFRS, 1/e, Solutions Manual (For Instructor Use Only)
FINANCIAL REPORTING PROBLEM
(a) M&S classifies its property, plant and equipment under three descrip-tions in its balance sheet: Property, Plant, and Equipment.
(b) M&S’s depreciation is provided to write off the cost of tangible non-current assets by equal annual installments (straight-line method).
(c) M&S depreciates freehold and leasehold buildings with a remaininglease term over 50 years; leasehold buildings with a remaining leaseterm of less than 50 years; and fixtures, fittings and equipment over3 to 25 years.
(d) M&S’s Notes report depreciation expense of £296.3 million in 2008 and£268.8 million in 2007, and amortization expense of £21.3 million in 2008and £14.2 in 2007.
(e) The statement of cash flows reports the following capital expenditures:2008, £924.6 million and 2007, £712.8 million.
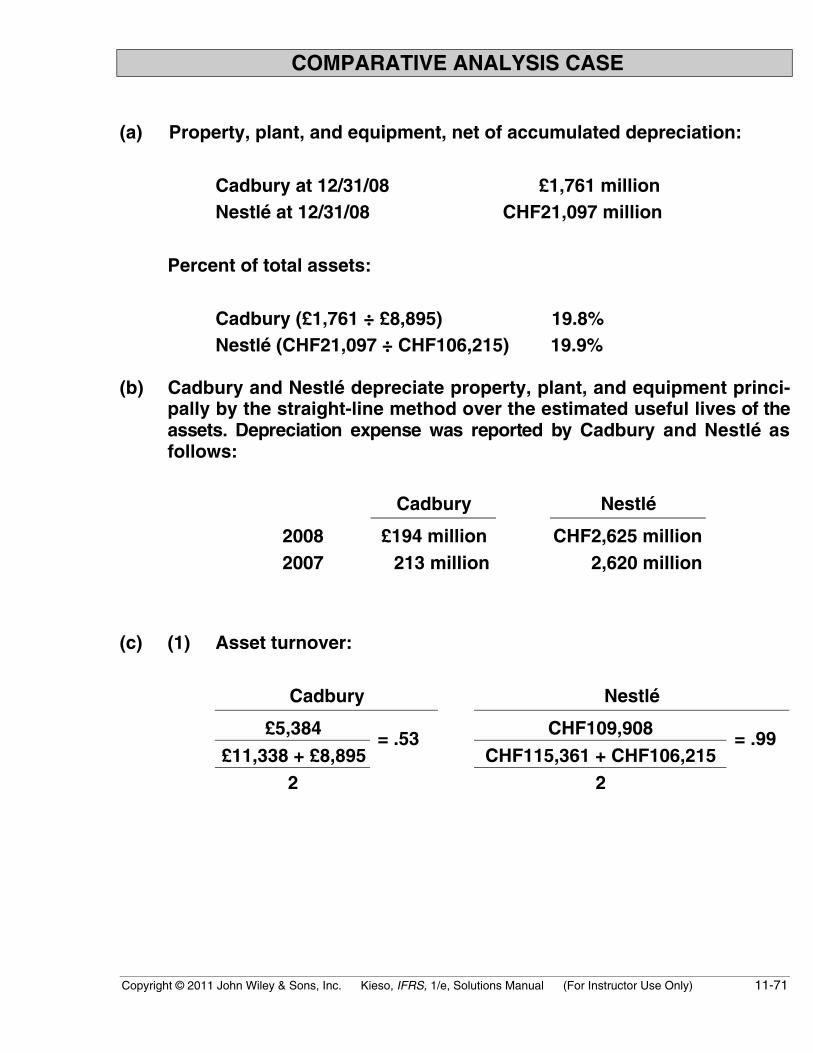
Copyright © 2011 John Wiley & Sons, Inc. Kieso, IFRS, 1/e, Solutions Manual (For Instructor Use Only) 11-71
COMPARATIVE ANALYSIS CASE
(a) Property, plant, and equipment, net of accumulated depreciation:
Cadbury at 12/31/08 £1,761 millionNestlé at 12/31/08 CHF21,097 million
Percent of total assets:
Cadbury (£1,761 ÷ £8,895) 19.8%Nestlé (CHF21,097 ÷ CHF106,215) 19.9%
(b) Cadbury and Nestlé depreciate property, plant, and equipment princi-pally by the straight-line method over the estimated useful lives of theassets. Depreciation expense was reported by Cadbury and Nestlé asfollows:
Cadbury Nestlé
2008 £194 million CHF2,625 million2007 213 million 2,620 million
(c) (1) Asset turnover:
Cadbury Nestlé
£5,384 CHF109,908£11,338 + £8,895
= .53CHF115,361 + CHF106,215
= .99
2 2
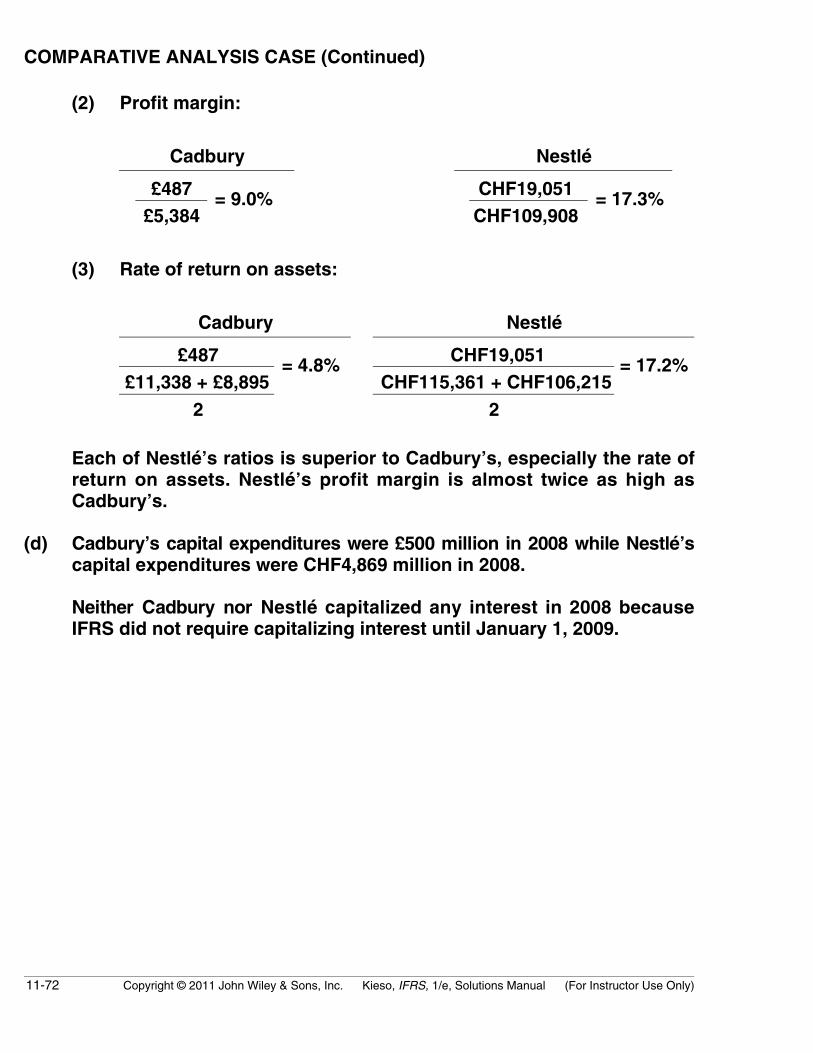
11-72 Copyright © 2011 John Wiley & Sons, Inc. Kieso, IFRS, 1/e, Solutions Manual (For Instructor Use Only)
COMPARATIVE ANALYSIS CASE (Continued)
(2) Profit margin:
Cadbury Nestlé
£487 CHF19,051£5,384
= 9.0%CHF109,908
= 17.3%
(3) Rate of return on assets:
Cadbury Nestlé
£487 CHF19,051£11,338 + £8,895
= 4.8%CHF115,361 + CHF106,215
= 17.2%
2 2
Each of Nestlé’s ratios is superior to Cadbury’s, especially the rate ofreturn on assets. Nestlé’s profit margin is almost twice as high asCadbury’s.
(d) Cadbury’s capital expenditures were £500 million in 2008 while Nestlé’scapital expenditures were CHF4,869 million in 2008.
Neither Cadbury nor Nestlé capitalized any interest in 2008 becauseIFRS did not require capitalizing interest until January 1, 2009.
Copyright © 2011 John Wiley & Sons, Inc. Kieso, IFRS, 1/e, Solutions Manual (For Instructor Use Only) 11-73
FINANCIAL STATEMENT ANALYSIS CASE
(a) Carrefour used the straight-line method for depreciating its tangiblefixed assets.
(b) Depreciation and amortization charges do not increase cash flowfrom operations. In a cash flow statement, these two items are oftenadded back to net income to arrive at cash flow from operations andtherefore some incorrectly conclude these expenses increase cashflow. What affects cash flow from operations are cash revenues andcash expenses. Noncash charges have no effect, except for positivetax savings generated by these charges.
(c) The schedule of cash flow measures indicates that cash provided byoperations is expected to cover capital expenditures over the next fewyears, even as expansion continues to accelerate. It is obvious thatCarrefour’s believes that cash flow measures are meaningful indicatorsof growth and financial strength, when evaluated in the context ofabsolute dollars or percentages.
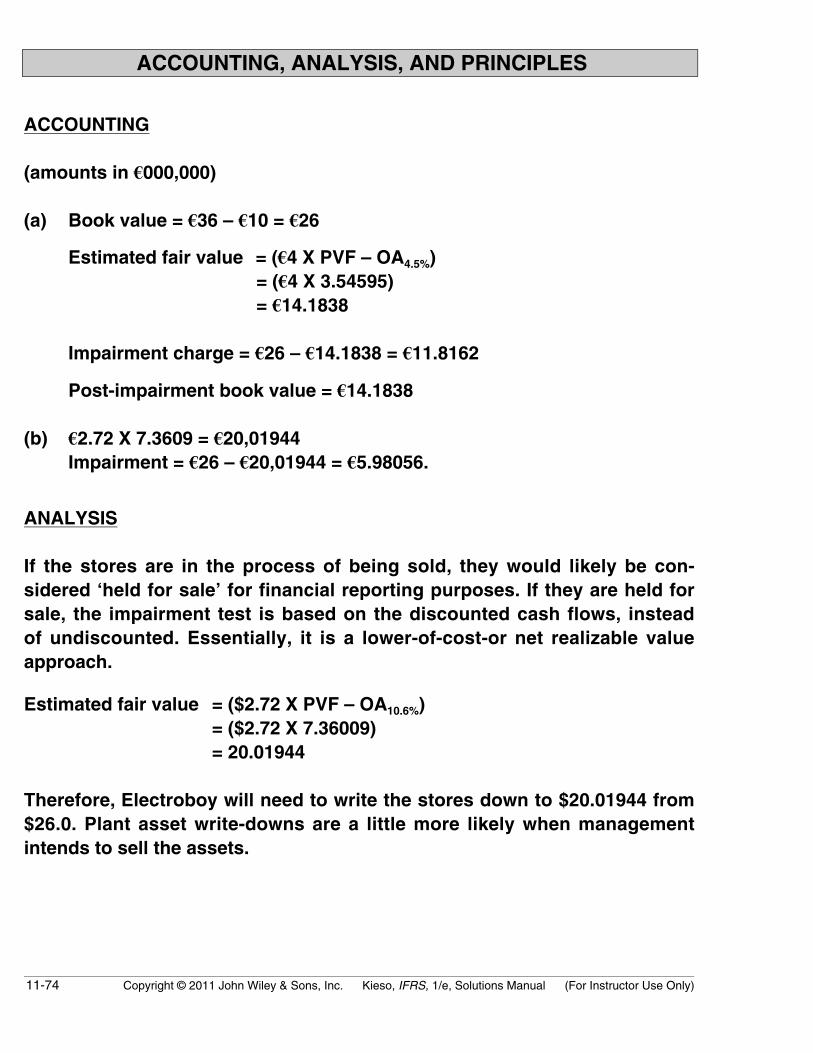
11-74 Copyright © 2011 John Wiley & Sons, Inc. Kieso, IFRS, 1/e, Solutions Manual (For Instructor Use Only)
ACCOUNTING, ANALYSIS, AND PRINCIPLES
ACCOUNTING
(amounts in €000,000)
(a) Book value = €36 – €10 = €26
Estimated fair value = (€4 X PVF – OA4.5%)= (€4 X 3.54595)= €14.1838
Impairment charge = €26 – €14.1838 = €11.8162
Post-impairment book value = €14.1838
(b) €2.72 X 7.3609 = €20,01944Impairment = €26 – €20,01944 = €5.98056.
ANALYSIS
If the stores are in the process of being sold, they would likely be con-sidered ‘held for sale’ for financial reporting purposes. If they are held forsale, the impairment test is based on the discounted cash flows, insteadof undiscounted. Essentially, it is a lower-of-cost-or net realizable valueapproach.
Estimated fair value = ($2.72 X PVF – OA10.6%)= ($2.72 X 7.36009)= 20.01944
Therefore, Electroboy will need to write the stores down to $20.01944 from$26.0. Plant asset write-downs are a little more likely when managementintends to sell the assets.
Copyright © 2011 John Wiley & Sons, Inc. Kieso, IFRS, 1/e, Solutions Manual (For Instructor Use Only) 11-75
ACCOUNTING, ANALYSIS, AND PRINCIPLES (Continued)
PRINCIPLES
(a) Under IFRS, there can be a recovery of impairment loss, as long as therecovery amount is limited to the amount of the original impairment.
*(b) The major differences between U.S. GAAP and IFRS regarding impair-ments are as follows. First, IFRS determines the need for an impairmentcharge by comparing the recoverable amount (the higher of value-in-use and fair value less costs to sell) of the asset to its book valueinstead of comparing undiscounted estimated future cash flows to bookvalue. This potentially makes impairment charges more likely underIFRS than U.S. GAAP. Second, under IFRS, companies may write apreviously impaired asset back up to its original cost. Under U.S.GAAP, the post-impairment book value can not be increased due to anincrease in the fair value of the previously impaired asset. Thus, IFRSmay provide a more faithful presentation but could be less neutral dueto the subjectivity in value-in-use measurements.
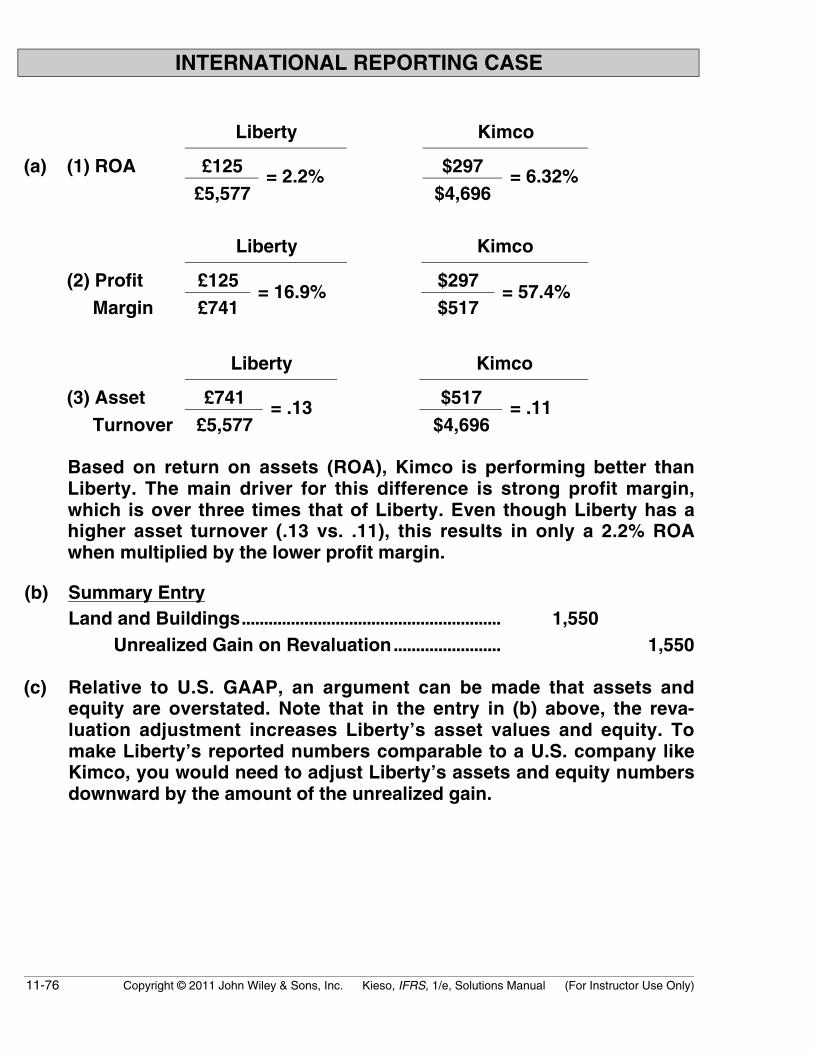
11-76 Copyright © 2011 John Wiley & Sons, Inc. Kieso, IFRS, 1/e, Solutions Manual (For Instructor Use Only)
INTERNATIONAL REPORTING CASE
Liberty Kimco
(a) (1) ROA £125 $297£5,577
= 2.2%$4,696
= 6.32%
Liberty Kimco
(2) Profit £125 $297 Margin £741
= 16.9%$517
= 57.4%
Liberty Kimco
(3) Asset £741 $517 Turnover £5,577
= .13$4,696
= .11
Based on return on assets (ROA), Kimco is performing better thanLiberty. The main driver for this difference is strong profit margin,which is over three times that of Liberty. Even though Liberty has ahigher asset turnover (.13 vs. .11), this results in only a 2.2% ROAwhen multiplied by the lower profit margin.
(b) Summary EntryLand and Buildings.......................................................... 1,550
Unrealized Gain on Revaluation........................ 1,550
(c) Relative to U.S. GAAP, an argument can be made that assets andequity are overstated. Note that in the entry in (b) above, the reva-luation adjustment increases Liberty’s asset values and equity. Tomake Liberty’s reported numbers comparable to a U.S. company likeKimco, you would need to adjust Liberty’s assets and equity numbersdownward by the amount of the unrealized gain.

Copyright © 2011 John Wiley & Sons, Inc. Kieso, IFRS, 1/e, Solutions Manual (For Instructor Use Only) 11-77
INTERNATIONAL REPORTING CASE (Continued)
For example, after adjusting Liberty’s assets downward by the amountof the unrealized gain, Liberty’s ROA increases to:
$125($5,577 – $1,952) = 3.45%.
This is still lower than Kimco’s ROA but the gap is narrower afteradjusting for differences in revaluation.
Note to instructors: An alternative way to make Liberty and Kimco compa-rable is to adjust Kimco’s assets to fair values. This approach could beused to discuss the trade-off between relevance and faithful representation.
11-78 Copyright © 2011 John Wiley & Sons, Inc. Kieso, IFRS, 1/e, Solutions Manual (For Instructor Use Only)
PROFESSIONAL RESEARCH
(a) The authoritative guidance for asset impairments is IAS 36: Impairmentof Assets. This Standard shall be applied in accounting for the impair-ment of all assets, other than:a. inventories;b. assets arising from construction contracts;c. deferred tax assets;d. assets arising from employee benefits;e. financial assets that are within the scope of IAS 39 Financial
Instruments: Recognition and Measurement;f. investment property that is measured at fair value;g. biological assets related to agricultural activity that are measured
at fair value less costs to sell;h. deferred acquisition costs, and intangible assets, arising from an
insurer’s contractual rights under insurance contracts within thescope of IFRS 4 Insurance Contracts; and
i. non-current assets (or disposal groups) classified as held for salein accordance with IFRS 5 Non-current Assets Held for Sale andDiscontinued Operations (para. 2).
This Standard applies to financial assets classified as:a. subsidiaries, as defined in IAS 27 Consolidated and Separate
Financial Statements;b. associates, as defined in IAS 28 Investments in Associates; andc. joint ventures, as defined in IAS 31 Interests in Joint Ventures.
For impairment of other financial assets, refer to IAS 39 (para. 4).
Copyright © 2011 John Wiley & Sons, Inc. Kieso, IFRS, 1/e, Solutions Manual (For Instructor Use Only) 11-79
PROFESSIONAL RESEARCH (Continued)
(b) In assessing whether there is any indication that an asset may beimpaired, an entry shall consider, as a minimum, the following indications.(para. 12):
External sources of informationa. during the period, an asset’s market value has declined signifi-
cantly more than would be expected as a result of the passage oftime or normal use.
b. significant changes with an adverse effect on the entity have takenplace during the period, or will take place in the near future, in thetechnological, market, economic or legal environment in which theentity operates or in the market to which an asset is dedicated.
c. market interest rates or other market rates of return on investmentshave increased during the period, and those increases are likely toaffect the discount rate used in calculating an asset’s value in useand decrease the asset’s recoverable amount materially.
d. the carrying amount of the net assets of the entity is more than itsmarket capitalisation.
Internal sources of informatione. evidence is available of obsolescence or physical damage of an
asset.f. significant changes with an adverse effect on the entity have taken
place during the period, or are expected to take place in the nearfuture, in the extent to which, or manner in which, an asset is usedor is expected to be used. These changes include the asset becomingidle, plans to discontinue or restructure the operation to which anasset belongs, plans to dispose of an asset before the previouslyexpected date, and reassessing the useful life of an asset as finiterather than indefinite.
g. evidence is available from internal reporting that indicates that theeconomic performance of an asset is, or will be, worse thanexpected.
11-80 Copyright © 2011 John Wiley & Sons, Inc. Kieso, IFRS, 1/e, Solutions Manual (For Instructor Use Only)
PROFESSIONAL RESEARCH (Continued)
Dividend from a subsidiary, jointly controlled entity or associateh. for an investment in a subsidiary, jointly controlled entity or
associate, the investor recognizes a dividend from the investmentand evidence is available that:(i) the carrying amount of the investment in the separate financial
statements exceeds the carrying amounts in the consolidatedfinancial statements of the investee’s net assets, includingassociated goodwill; or
(ii) the dividend exceeds the total comprehensive income of thesubsidiary, jointly controlled entity or associate in the periodthe dividend is declared.
The list in paragraph 12 is not exhaustive. An entity may identify otherindications that an asset may be impaired and these would alsorequire the entity to determine the asset’s recoverable amount or, inthe case of goodwill, perform an impairment test in accordance withparagraphs 80–99 (para. 13).
Evidence from internal reporting that indicates that an asset may beimpaired includes the existence of:a. cash flows for acquiring the asset, or subsequent cash needs for
operating or maintaining it, that are significantly higher than thoseoriginally budgeted;
b. actual net cash flows or operating profit or loss flowing from theasset that are significantly worse than those budgeted;
c. a significant decline in budgeted net cash flows or operating profit,or a significant increase in budgeted loss, flowing from the asset; or
d. operating losses or net cash outflows for the asset, when currentperiod amounts are aggregated with budgeted amounts for thefuture. (para. 14)
Yes, it does appear that Klax should perform an impairment testbecause market value of assets are most likely lower than currentcarrying value.
Copyright © 2011 John Wiley & Sons, Inc. Kieso, IFRS, 1/e, Solutions Manual (For Instructor Use Only) 11-81
PROFESSIONAL RESEARCH (Continued)
(c) Different situations may lead to best evidence of fair value (i.e. couldbe market value, revalued asset, etc.).a. if the asset’s fair value is its market value, the only difference between
the asset’s fair value and its fair value less costs to sell is the directincremental costs to dispose of the asset:(i) if the disposal costs are negligible, the recoverable amount of
the revalued asset is necessarily close to, or greater than, itsrevalued amount (i.e., fair value). In this case, after the revaluationrequirements have been applied, it is unlikely that the revaluedasset is impaired and recoverable amount need not be estimated.
(ii) if the disposal costs are not negligible, the fair value less coststo sell of the revalued asset is necessarily less than its fairvalue. Therefore, the revalued asset will be impaired if its valuein use is less than its revalued amount (i.e., fair value). In thiscase, after the revaluation requirements have been applied, anentity applies this Standard to determine whether the assetmay be impaired.
b. if the asset’s fair value is determined on a basis other than itsmarket value, its revalued amount (i.e., fair value) may be greateror lower than its recoverable amount. Hence, after the revaluationrequirements have been applied, an entity applies this Standard todetermine whether the asset may be impaired (para. 5).
11-82 Copyright © 2011 John Wiley & Sons, Inc. Kieso, IFRS, 1/e, Solutions Manual (For Instructor Use Only)
PROFESSIONAL SIMULATION
Explanation
(a) The purpose of depreciation is to allocate the cost (or other bookvalue) of tangible plant assets, less residual value, over their usefullives in a systematic and rational manner. Under IFRS, depreciationaccounting is a process of allocation, not of valuation, through whichthe productive effort (cost) is to be matched with productiveaccomplishment (revenue) for the period. Depreciation accounting,therefore, is concerned with the timing of the expiration of the cost oftangible plant assets.
(b) The factors relevant in determining the annual depreciation for a depre-ciable asset are the initial recorded amount (cost), estimated residualvalue, estimated useful life, and depreciation method.
Assets are typically recorded at their acquisition cost, which is in mostcases objectively determinable. Cost assignments in other cases—“basket purchases” and the selection of an implicit interest rate in anasset acquisitions or under deferred-payment plans—may be quitesubjective, involving considerable judgment.
The residual value is an estimate of an amount potentially realizablewhen the asset is retired from service. The estimate is based onjudgment and is affected by the length of the useful life of the asset.
The useful life is also based on judgment. It involves selecting the“unit” of measure of service life and estimating the number of suchunits embodied in the asset. Such units may be measured in terms oftime periods or in terms of activity (for example, years or machinehours). When selecting the life, one should select the lower (shorter)of the physical life or the economic life. Physical life involves wear andtear and casualties; economic life involves such things as technologicalobsolescence and inadequacy.

Copyright © 2011 John Wiley & Sons, Inc. Kieso, IFRS, 1/e, Solutions Manual (For Instructor Use Only) 11-83
PROFESSIONAL SIMULATION (Continued)
Measurement
(a) Compared to the use of an accelerated method, straight-line deprecia-tion would result in the lowest depreciation expense and the highestincome. For example, under straight-line depreciation, expense ineach year would be:
($100,000 – $10,000)/4 = $22,500
Using the double-declining-balance method, depreciation expense in2010 would be:
$100,000 X (1/4 X 2) = $50,000
Depending on the level of use in the first year, use of the units-of-production method could yield an even lower expense in the first yearcompared to straight-line.
(b) Over the entire four-year period, all methods will produce the sametotal depreciation expense. Use of alternative methods only results indifferences in timing of the depreciation charges.
(c) All methods used for financial reporting purposes results in the samecash flow in 2010—that is, a cash outflow of $100,000 for acquisition ofthe machine. However, use of an accelerated method for tax purposesresults in the higher cash flow in 2010. This is because a larger taxdeduction can be taken for depreciation expense, which reduces taxableincome, resulting in less cash paid for taxes. Note that over the life ofthe asset, cash flows for taxes are the same regardless of the taxdepreciation method used.
Journal Entry
Cash........................................................................... 84,000Accumulated Depreciation................................. 45,000*
Gain on Sale of Equipment...................... 29,000Equipment ..................................................... 100,000
*($100,000 – $10,000)/4 = $22,500 per year X 2 years (2010, 2011)
