kentucky traffic collision facts - 2012...
TRANSCRIPT
TRAFFIC
COLLISION
FACTS
2012
REPORT
K
E
N
T
U
C
K
Y
Commonwealth of Kentucky Office of the Governor
KentuckyUnbridledSpirit.com An Equal Opportunity Employer M/F/D
My Fellow Kentuckians:
This 2012 KENTUCKY TRAFFIC COLLISION FACTS
report provides us with valuable statistics concerning traffic collisions on the roadways of our Commonwealth. These figures should also remind us that motor vehicle travel, although required by most to provide our very livelihood, many times results in injury and even death.
Each year I am saddened to learn the number of
individuals killed and injured in traffic collisions throughout our state. This year, the number of fatalities for 2012 increased by 3 percent, with 25 more fatalities than during 2011. The 746 people who lost their lives in fatal collisions in Kentucky represent far too great a portion of our most valuable asset - our citizens.
Injury and death on our highways can be dramatically reduced if everyone will be
alert, observe speed limits, never drink and drive, and always buckle up. By following these few common sense rules, we can make our roadways safer for all Kentuckians.
Sincerely,
Steven L. Beshear
Steven L. Beshear Governor
700 Capitol Avenue Suite 100
Frankfort, KY 40601 (502) 564-2611
Fax: (502) 564-2517
KENTUCKY STATE POLICE 919 Versailles Road
KentuckyUnbridledSpirit.com An Equal Opportunity Employer M/F/D
Dear Governor Beshear: Kentucky Revised Statutes, Chapter 189.635 mandates that
Kentucky State Police collect and tabulate the traffic collision reports submitted by all law enforcement agencies across the Commonwealth.
In adherence to this statute, the Kentucky State Police proudly
presents the 2012 KENTUCKY TRAFFIC COLLISION FACTS report. This report provides a collection of statistical data, based on comprehensive evaluation and analysis of fatal, injury, and prop-erty damage collisions.
The Kentucky State Police would like to take this opportunity
to thank all law enforcement agencies that contribute data. In addi-tion, gratitude is also extended to the Kentucky Transportation Center, College of Engineering at the University of Kentucky for
We sincerely hope that the information contained herein provides beneficial information to law enforcement agencies, as well as various other national, state and local organizations. Most importantly, we hope this data will inspire all citizens to work with officials to create a more heightened sense of highway safety across our great Commonwealth.
Respectfully submitted,
Rodney Brewer Commissioner
Frankfort, Kentucky 40601
Www.kentuckystatepolice.org
Rodney Brewer Commissioner The Honorable Steve Beshear
Governor of Kentucky The Capitol Frankfort, Kentucky 40601
J. Michael Brown Secretary
Steven L. Beshear Governor
efforts in the successful completion of this report. For nineteen consecutive years, this mutually ben-eficial joint-effort has produced an accurate account of traffic collision data, while also offering a broad-er analytical insight into several special interest areas.
This 2012 Collision Facts Report
would like to
remember
the
SEVEN HUNDRED FORTY-SIX
who were victims of fatal traffic collisions
on public roads
during 2012.
KENTUCKYTRAFFIC COLLISION FACTS
2012
Prepared by:
Kentucky Transportation CenterCollege of EngineeringUniversity of Kentucky
Lexington, Kentucky 40506-0281
In Cooperation with:
Kentucky State PoliceCommonwealth of Kentucky
Please Direct Inquires to:
Statistics SectionRecords Branch
Kentucky State Police1266 Louisville Road
Frankfort, Kentucky 40601(502) 227-8700
TABLE OF CONTENTS Message from the Governor, Commonwealth of Kentucky Transmittal Letter, Commissioner, Kentucky State Police Dedication Introduction........................................................................................................................................ iii 2012 Collision Summary .................................................................................................................... 1 Death and Injury Summary ................................................................................................................ 2 Fatalities by Age and Sex .................................................................................................................. 3 Severity of Injury by Type of Collision .............................................................................................. 4 Occurrence of Collisions by Type ..................................................................................................... 5 Types of Collisions ............................................................................................................................. 6 Pedestrian Collisions ......................................................................................................................... 7 Hit-and-Run Collisions ....................................................................................................................... 8 Land Use ............................................................................................................................................. 9 Collision Locations (Rural vs. Urban) ............................................................................................... 9 Location of Collisions (Type of Roadway) ..................................................................................... 10 Collisions on Interstates and Parkways ......................................................................................... 10 Collisions by Roadway Conditions and Roadway Character ....................................................... 11 Collisions by Light Condition .......................................................................................................... 12 Two-Vehicle Collisions .................................................................................................................... 13 Collisions by Day and Month ........................................................................................................... 14 Holiday Collisions ............................................................................................................................ 15 Type of Vehicles Involved in Collisions ......................................................................................... 16 Truck Collisions ............................................................................................................................... 17 Driver Involvement by Residence and Sex ..................................................................................... 18
i
ii
Age of Driver (All Collisions) ........................................................................................................... 19 Age of Driver (Fatal Collisions) ....................................................................................................... 20 Collisions Involving Teenage Drivers ............................................................................................. 21 Alcohol-Related Collisions .............................................................................................................. 22 Safety Restraints .............................................................................................................................. 23 Intersection Collisions ..................................................................................................................... 24 Contributing Factors - All Collisions .............................................................................................. 27 Contributing Factors - Specific Type of Collision ......................................................................... 29 Collisions by County ........................................................................................................................ 37 Collisions Involving Drinking Drivers by County .......................................................................... 40 Drivers Under Influence of Drugs by County ................................................................................. 43 Collisions by Area Development District ....................................................................................... 44 Alcohol and Drug Collisions by Area Development District ......................................................... 45 Collisions by County (Parking Lot/Private Property) .................................................................... 49 Types of Collisions (Parking Lot/Private Property) ....................................................................... 52 Age of Driver (Parking Lot/Private Property) ................................................................................. 53 Contributing Factors (Parking Lot/Private Property) .................................................................... 54 Fatality Analysis Reporting System ................................................................................................ 59 Drivers Involved in Fatal Collisions - Age and Alcohol Involvement ........................................... 59 Alcohol Involvement by Age and Test Results for Drivers Involved in Fatal Collisions ............ 60 Fatally Injured Pedestrians .............................................................................................................. 60 Safety Restraints and Ejection in Fatal Collisions ........................................................................ 61 Child Restraints in Fatal Collisions ................................................................................................ 62 Cost of Kentucky Traffic Collisions ................................................................................................ 63 Installing Your Safety Seat .............................................................................................................. 64
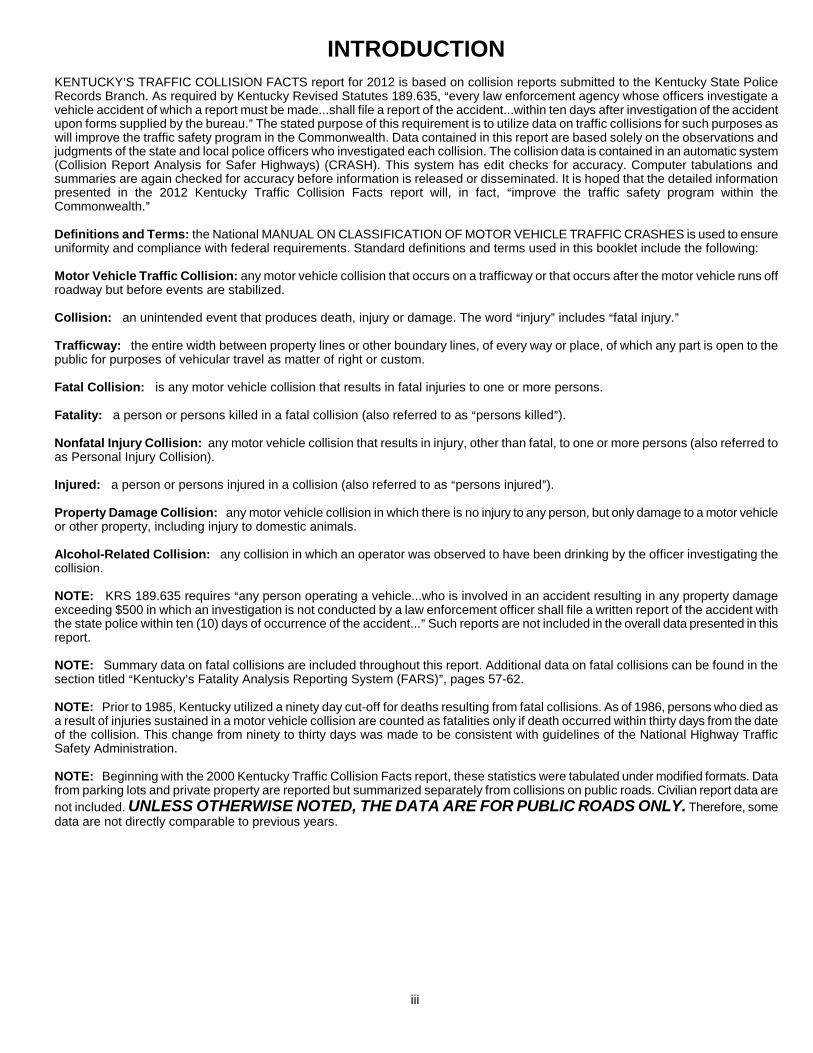
INTRODUCTION KENTUCKY=S TRAFFIC COLLISION FACTS report for 2012 is based on collision reports submitted to the Kentucky State Police Records Branch. As required by Kentucky Revised Statutes 189.635, Aevery law enforcement agency whose officers investigate a vehicle accident of which a report must be made...shall file a report of the accident...within ten days after investigation of the accident upon forms supplied by the bureau.@ The stated purpose of this requirement is to utilize data on traffic collisions for such purposes as will improve the traffic safety program in the Commonwealth. Data contained in this report are based solely on the observations and judgments of the state and local police officers who investigated each collision. The collision data is contained in an automatic system (Collision Report Analysis for Safer Highways) (CRASH). This system has edit checks for accuracy. Computer tabulations and summaries are again checked for accuracy before information is released or disseminated. It is hoped that the detailed information presented in the 2012 Kentucky Traffic Collision Facts report will, in fact, Aimprove the traffic safety program within the Commonwealth.@ Definitions and Terms: the National MANUAL ON CLASSIFICATION OF MOTOR VEHICLE TRAFFIC CRASHES is used to ensure uniformity and compliance with federal requirements. Standard definitions and terms used in this booklet include the following: Motor Vehicle Traffic Collision: any motor vehicle collision that occurs on a trafficway or that occurs after the motor vehicle runs off roadway but before events are stabilized. Collision: an unintended event that produces death, injury or damage. The word Ainjury@ includes Afatal injury.@ Trafficway: the entire width between property lines or other boundary lines, of every way or place, of which any part is open to the public for purposes of vehicular travel as matter of right or custom. Fatal Collision: is any motor vehicle collision that results in fatal injuries to one or more persons. Fatality: a person or persons killed in a fatal collision (also referred to as Apersons killed@). Nonfatal Injury Collision: any motor vehicle collision that results in injury, other than fatal, to one or more persons (also referred to as Personal Injury Collision). Injured: a person or persons injured in a collision (also referred to as Apersons injured@). Property Damage Collision: any motor vehicle collision in which there is no injury to any person, but only damage to a motor vehicle or other property, including injury to domestic animals. Alcohol-Related Collision: any collision in which an operator was observed to have been drinking by the officer investigating the collision. NOTE: KRS 189.635 requires Aany person operating a vehicle...who is involved in an accident resulting in any property damage exceeding $500 in which an investigation is not conducted by a law enforcement officer shall file a written report of the accident with the state police within ten (10) days of occurrence of the accident...@ Such reports are not included in the overall data presented in this report. NOTE: Summary data on fatal collisions are included throughout this report. Additional data on fatal collisions can be found in the section titled AKentucky=s Fatality Analysis Reporting System (FARS)@, pages 57-62. NOTE: Prior to 1985, Kentucky utilized a ninety day cut-off for deaths resulting from fatal collisions. As of 1986, persons who died as a result of injuries sustained in a motor vehicle collision are counted as fatalities only if death occurred within thirty days from the date of the collision. This change from ninety to thirty days was made to be consistent with guidelines of the National Highway Traffic Safety Administration. NOTE: Beginning with the 2000 Kentucky Traffic Collision Facts report, these statistics were tabulated under modified formats. Data from parking lots and private property are reported but summarized separately from collisions on public roads. Civilian report data are not included. UNLESS OTHERWISE NOTED, THE DATA ARE FOR PUBLIC ROADS ONLY. Therefore, some data are not directly comparable to previous years.
iii
COLLISION
SUMMARY

TYPE COLLISION REPORTED 2011 2012PERCENTCHANGE
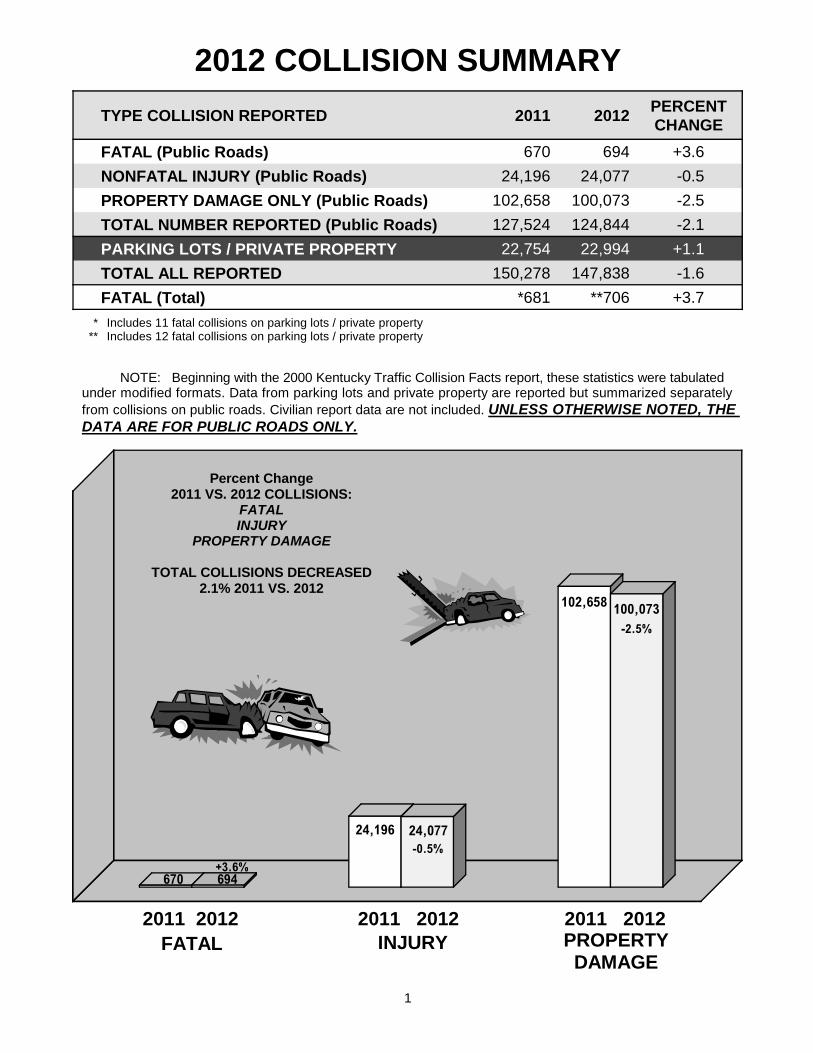
FATAL (Public Roads) 670 694 +3.6
NONFATAL INJURY (Public Roads) 24,196 24,077 -0.5
PROPERTY DAMAGE ONLY (Public Roads) 102,658 100,073 -2.5
TOTAL NUMBER REPORTED (Public Roads) 127,524 124,844 -2.1
22,754 22,994 +1.1PARKING LOTS / PRIVATE PROPERTY TOTAL ALL REPORTED 150,278 147,838 -1.6
FATAL (Total) *681 **706 +3.7
2012 COLLISION SUMMARY
1
2011 2012 2011 2012 2011 2012FATAL INJURY PROPERTY
DAMAGE
Percent Change2011 VS. 2012 COLLISIONS:
FATALINJURY
PROPERTY DAMAGE
TOTAL COLLISIONS DECREASED2.1% 2011 VS. 2012
+3.6%
-0.5%
-2.5%
670 694
24,196 24,077
102,658 100,073
NOTE: Beginning with the 2000 Kentucky Traffic Collision Facts report, these statistics were tabulated under modified formats. Data from parking lots and private property are reported but summarized separately from collisions on public roads. Civilian report data are not included. UNLESS OTHERWISE NOTED, THE DATA ARE FOR PUBLIC ROADS ONLY.
* Includes 11 fatal collisions on parking lots / private property** Includes 12 fatal collisions on parking lots / private property
2011 2012%
CHANGE
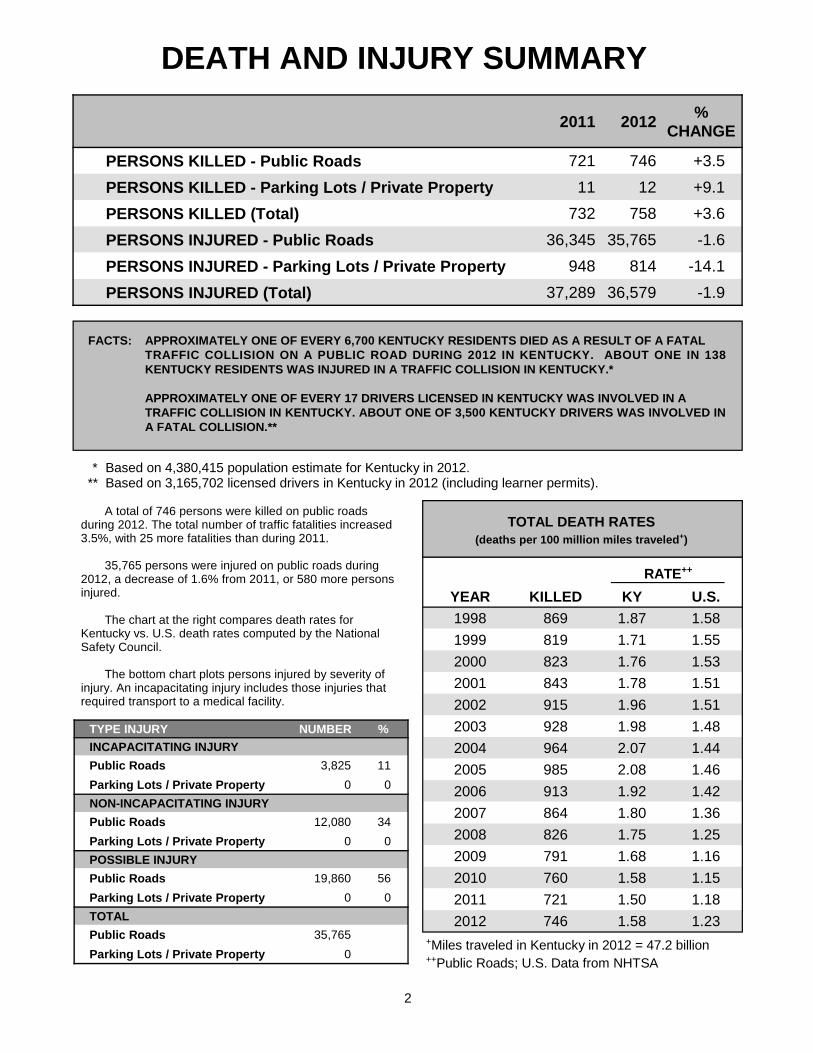
PERSONS KILLED - Public Roads 721 746 +3.5
PERSONS KILLED - Parking Lots / Private Property 11 12 +9.1
PERSONS KILLED (Total) 732 758 +3.6
PERSONS INJURED - Public Roads 36,345 35,765 -1.6
PERSONS INJURED - Parking Lots / Private Property 948 814 -14.1
PERSONS INJURED (Total) 37,289 36,579 -1.9
DEATH AND INJURY SUMMARY
* Based on 4,380,415 population estimate for Kentucky in 2012.** Based on 3,165,702 licensed drivers in Kentucky in 2012 (including learner permits).
YEAR KILLED KY U.S.
1998 869 1.87 1.58
1999 819 1.71 1.55
2000 823 1.76 1.53
2001 843 1.78 1.51
2002 915 1.96 1.51
2003 928 1.98 1.48
2004 964 2.07 1.44
2005 985 2.08 1.46
2006 913 1.92 1.42
2007 864 1.80 1.36
2008 826 1.75 1.25
2009 791 1.68 1.16
2010 760 1.58 1.15
2011 721 1.50 1.18
2012 746 1.58 1.23
RATE++
+Miles traveled in Kentucky in 2012 = 47.2 billion++Public Roads; U.S. Data from NHTSA
A total of 746 persons were killed on public roads during 2012. The total number of traffic fatalities increased 3.5%, with 25 more fatalities than during 2011.
35,765 persons were injured on public roads during 2012, a decrease of 1.6% from 2011, or 580 more persons injured.
The chart at the right compares death rates for Kentucky vs. U.S. death rates computed by the National Safety Council.
The bottom chart plots persons injured by severity of injury. An incapacitating injury includes those injuries that required transport to a medical facility.
FACTS: APPROXIMATELY ONE OF EVERY 6,700 KENTUCKY RESIDENTS DIED AS A RESULT OF A FATAL TRAFFIC COLLISION ON A PUBLIC ROAD DURING 2012 IN KENTUCKY. ABOUT ONE IN 138 KENTUCKY RESIDENTS WAS INJURED IN A TRAFFIC COLLISION IN KENTUCKY.*
APPROXIMATELY ONE OF EVERY 17 DRIVERS LICENSED IN KENTUCKY WAS INVOLVED IN A TRAFFIC COLLISION IN KENTUCKY. ABOUT ONE OF 3,500 KENTUCKY DRIVERS WAS INVOLVED IN A FATAL COLLISION.**
2
TOTAL DEATH RATES(deaths per 100 million miles traveled+)
TYPE INJURY NUMBER %
INCAPACITATING INJURY
Public Roads 3,825 11
Parking Lots / Private Property 0 0
NON-INCAPACITATING INJURY
Public Roads 12,080 34
Parking Lots / Private Property 0 0
POSSIBLE INJURY
Public Roads 19,860 56
Parking Lots / Private Property 0 0
TOTAL
Public Roads 35,765
Parking Lots / Private Property 0
16
9096
87
7163
3933
10
40
50
41
3233
2322
0-14 15-24 25-34 35-44 45-54 55-64 65-74 75and
older
AGE
0
25
50
75
100
125
150
175
200
225
250
275
NU
MB
ER
16%
20%
16%
13%13%
9%9%
7%8%
13%
14%
18%
19%18%
FATALITIESBY AGE AND SEX
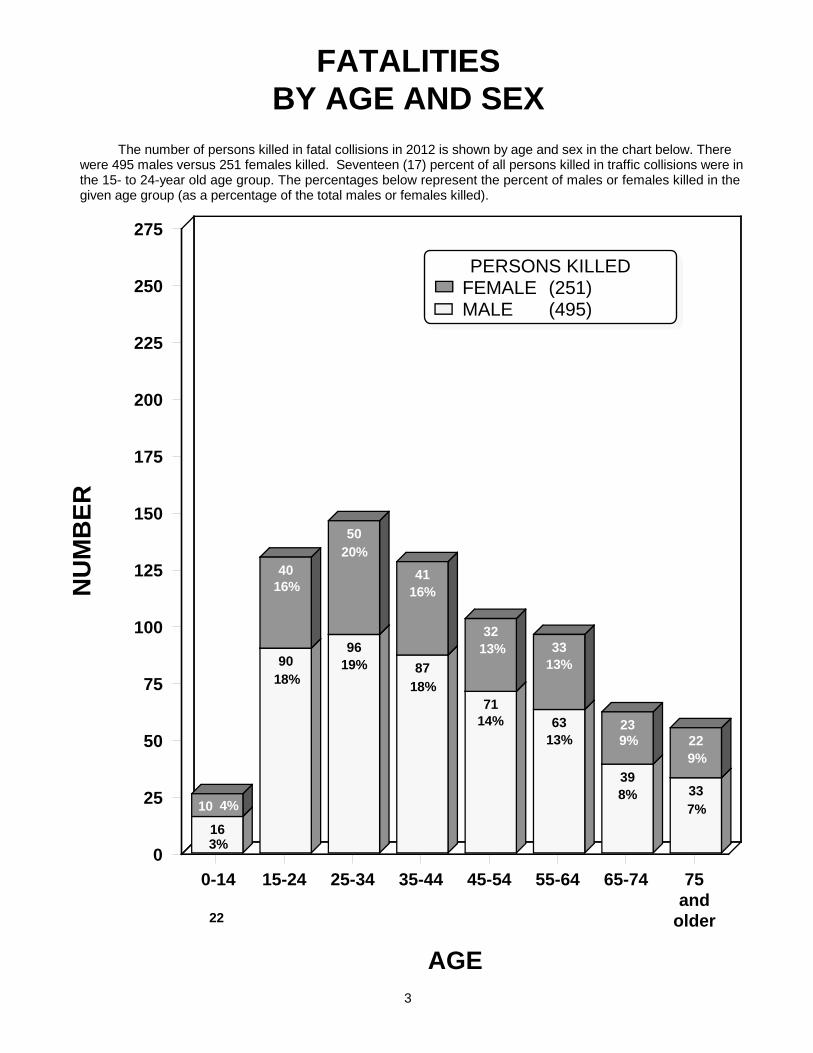
The number of persons killed in fatal collisions in 2012 is shown by age and sex in the chart below. There were 495 males versus 251 females killed. Seventeen (17) percent of all persons killed in traffic collisions were in the 15- to 24-year old age group. The percentages below represent the percent of males or females killed in the given age group (as a percentage of the total males or females killed).
3
PERSONS KILLEDFEMALE (251)MALE (495)
22
3%
4%10
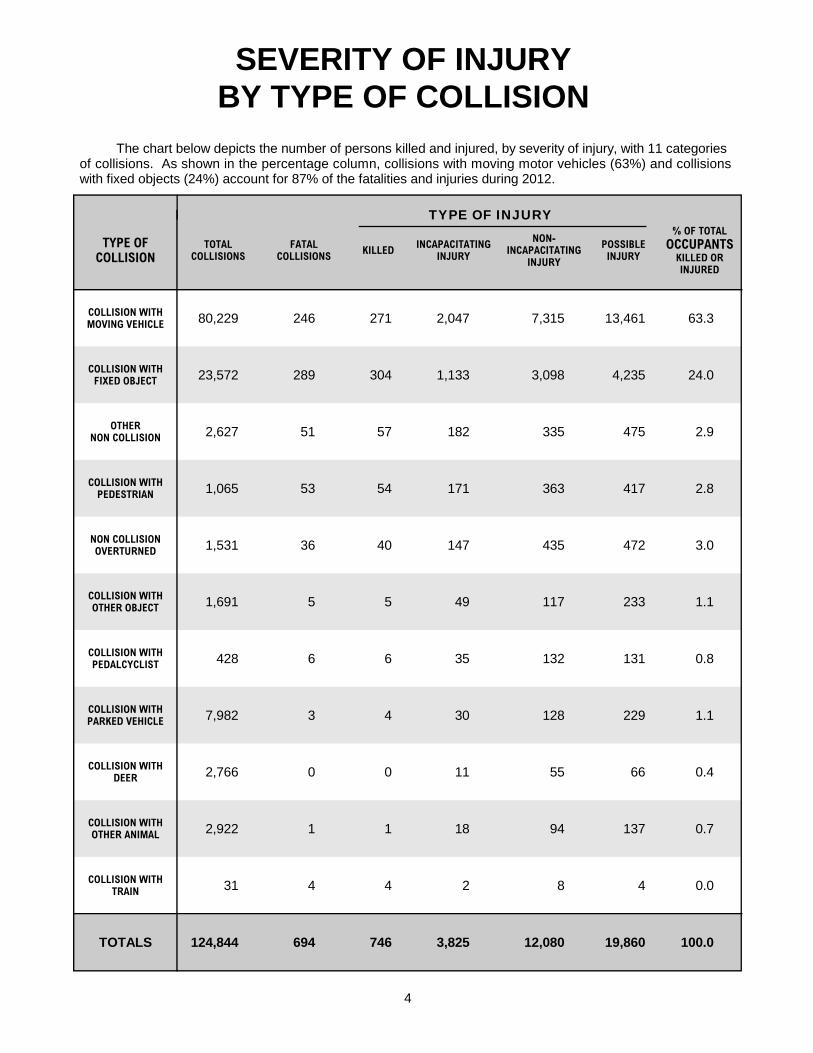
SEVERITY OF INJURYBY TYPE OF COLLISION
The chart below depicts the number of persons killed and injured, by severity of injury, with 11 categories of collisions. As shown in the percentage column, collisions with moving motor vehicles (63%) and collisions with fixed objects (24%) account for 87% of the fatalities and injuries during 2012.
4
TYPE OF COLLISION
TOTAL COLLISIONS
FATALCOLLISIONS
KILLEDINCAPACITATING
INJURY
NON-INCAPACITATING
INJURY
POSSIBLE INJURY
% OF TOTALOCCUPANTS
KILLED ORINJURED
COLLISION WITHMOVING VEHICLE 80,229 246 271 2,047 7,315 13,461 63.3
COLLISION WITHFIXED OBJECT 23,572 289 304 1,133 3,098 4,235 24.0
OTHERNON COLLISION 2,627 51 57 182 335 475 2.9
COLLISION WITHPEDESTRIAN 1,065 53 54 171 363 417 2.8
NON COLLISIONOVERTURNED 1,531 36 40 147 435 472 3.0
COLLISION WITHOTHER OBJECT 1,691 5 5 49 117 233 1.1
COLLISION WITHPEDALCYCLIST 428 6 6 35 132 131 0.8
COLLISION WITHPARKED VEHICLE 7,982 3 4 30 128 229 1.1
COLLISION WITHDEER 2,766 0 0 11 55 66 0.4
COLLISION WITHOTHER ANIMAL 2,922 1 1 18 94 137 0.7
COLLISION WITHTRAIN 31 4 4 2 8 4 0.0
TOTALS 124,844 694 746 3,825 12,080 19,860 100.0
TYPE OF INJURY
COLLISIONWITH FIXED
OBJECT18.9%
ALLOTHER16.8%
COLLISION WITH MOVING VEHICLES
64.3%
ALL COLLISIONS
FATAL COLLISIONS
COLLISION WITH MOVING VEHICLE
35.4%
COLLISION WITHFIXED OBJECT
41.6%
ALL OTHER15.4%
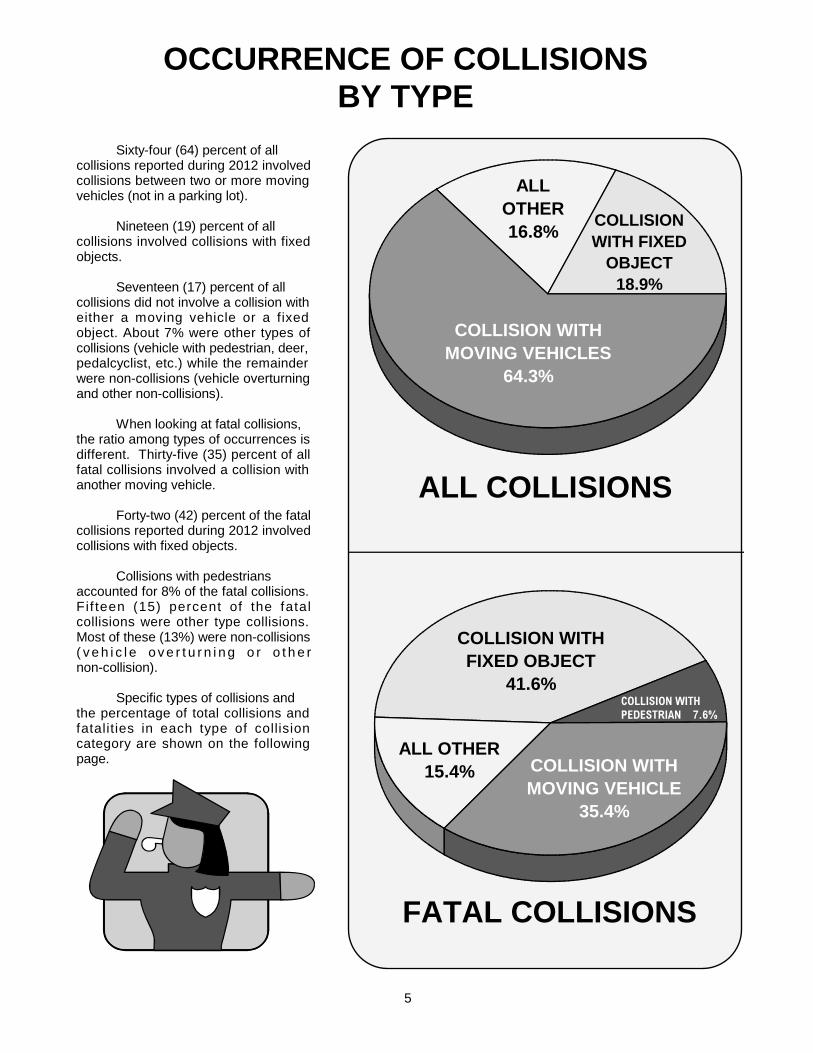
OCCURRENCE OF COLLISIONSBY TYPE
Sixty-four (64) percent of all collisions reported during 2012 involved collisions between two or more moving vehicles (not in a parking lot).
Nineteen (19) percent of all collisions involved collisions with fixed objects.
Seventeen (17) percent of all collisions did not involve a collision with either a moving vehicle or a fixed object. About 7% were other types of collisions (vehicle with pedestrian, deer, pedalcyclist, etc.) while the remainder were non-collisions (vehicle overturning and other non-collisions).
When looking at fatal collisions, the ratio among types of occurrences is different. Thirty-five (35) percent of all fatal collisions involved a collision with another moving vehicle.
Forty-two (42) percent of the fatal collisions reported during 2012 involved collisions with fixed objects.
Collisions with pedestrians accounted for 8% of the fatal collisions. Fif teen (15) percent of the fatal collisions were other type collisions. Most of these (13%) were non-collisions ( v e h i c l e o v e r t u r n i n g o r o t h e r non-collision).
Specific types of collisions and the percentage of total collisions and fatalities in each type of collision category are shown on the following page.
COLLISION WITHPEDESTRIAN 7.6%
5
TYPES OF COLLISIONS
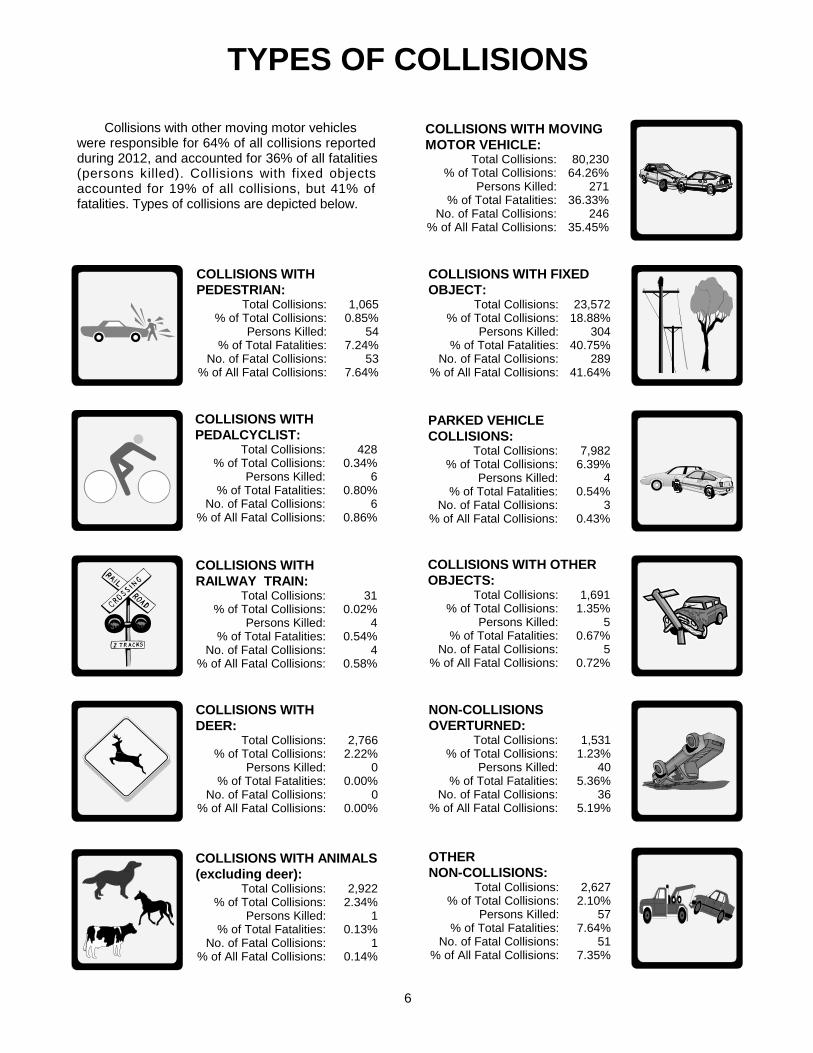
Collisions with other moving motor vehicles were responsible for 64% of all collisions reported during 2012, and accounted for 36% of all fatalities (persons killed). Collisions with fixed objects accounted for 19% of all collisions, but 41% of fatalities. Types of collisions are depicted below.
6
COLLISIONS WITH MOVINGMOTOR VEHICLE:
Total Collisions: 80,230% of Total Collisions: 64.26%
Persons Killed: 271% of Total Fatalities: 36.33%
No. of Fatal Collisions: 246% of All Fatal Collisions: 35.45%
OTHERNON-COLLISIONS:
Total Collisions: 2,627% of Total Collisions: 2.10%
Persons Killed: 57% of Total Fatalities: 7.64%
No. of Fatal Collisions: 51% of All Fatal Collisions: 7.35%
COLLISIONS WITH ANIMALS(excluding deer):
Total Collisions: 2,922% of Total Collisions: 2.34%
Persons Killed: 1% of Total Fatalities: 0.13%
No. of Fatal Collisions: 1% of All Fatal Collisions: 0.14%
NON-COLLISIONSOVERTURNED:
Total Collisions: 1,531% of Total Collisions: 1.23%
Persons Killed: 40% of Total Fatalities: 5.36%
No. of Fatal Collisions: 36% of All Fatal Collisions: 5.19%
COLLISIONS WITHDEER:
Total Collisions: 2,766% of Total Collisions: 2.22%
Persons Killed: 0% of Total Fatalities: 0.00%
No. of Fatal Collisions: 0% of All Fatal Collisions: 0.00%
COLLISIONS WITH OTHEROBJECTS:
Total Collisions: 1,691% of Total Collisions: 1.35%
Persons Killed: 5% of Total Fatalities: 0.67%
No. of Fatal Collisions: 5% of All Fatal Collisions: 0.72%
COLLISIONS WITHRAILWAY TRAIN:
Total Collisions: 31% of Total Collisions: 0.02%
Persons Killed: 4% of Total Fatalities: 0.54%
No. of Fatal Collisions: 4% of All Fatal Collisions: 0.58%
PARKED VEHICLECOLLISIONS:
Total Collisions: 7,982% of Total Collisions: 6.39%
Persons Killed: 4% of Total Fatalities: 0.54%
No. of Fatal Collisions: 3% of All Fatal Collisions: 0.43%
COLLISIONS WITHPEDALCYCLIST:
Total Collisions: 428% of Total Collisions: 0.34%
Persons Killed: 6% of Total Fatalities: 0.80%
No. of Fatal Collisions: 6% of All Fatal Collisions: 0.86%
COLLISIONS WITH FIXEDOBJECT:
Total Collisions: 23,572% of Total Collisions: 18.88%
Persons Killed: 304% of Total Fatalities: 40.75%
No. of Fatal Collisions: 289% of All Fatal Collisions: 41.64%
COLLISIONS WITHPEDESTRIAN:
Total Collisions: 1,065% of Total Collisions: 0.85%
Persons Killed: 54% of Total Fatalities: 7.24%
No. of Fatal Collisions: 53% of All Fatal Collisions: 7.64%
Fatal
ActionsInjury
Actions 0-4 5-9 10-14 15-19 20-24 25-44 45-64 65-UPNot
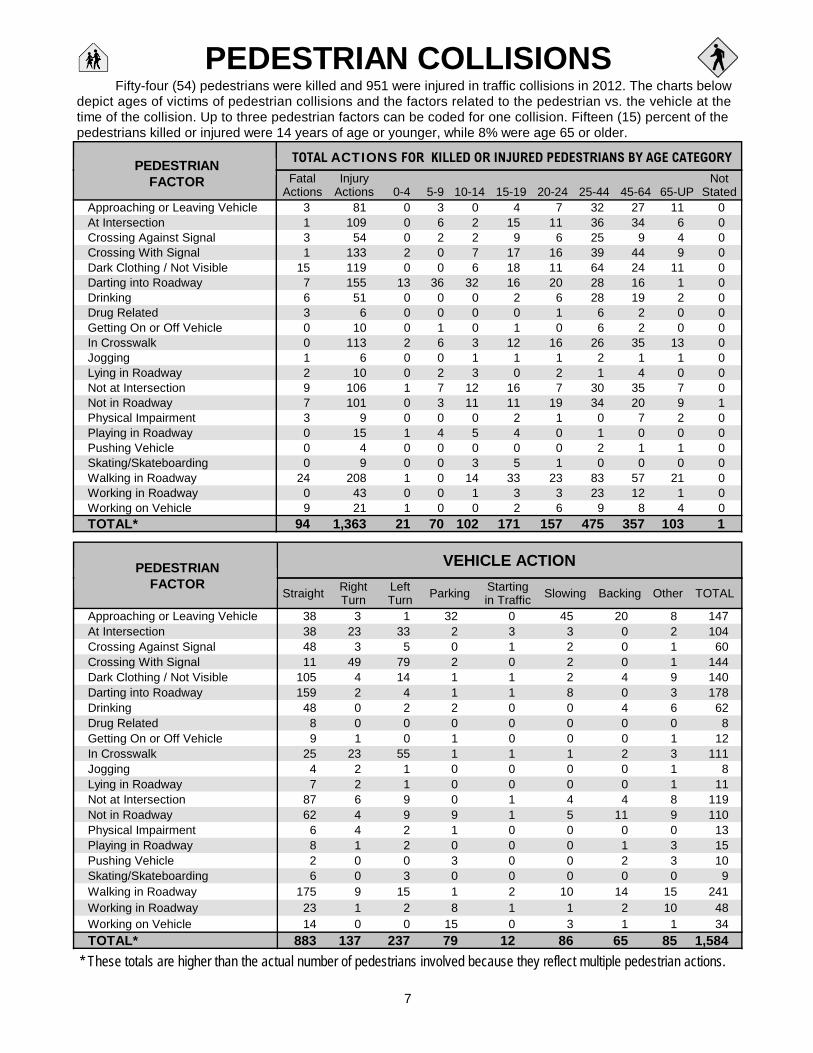
StatedApproaching or Leaving Vehicle 3 81 0 3 0 4 7 32 27 11 0At Intersection 1 109 0 6 2 15 11 36 34 6 0Crossing Against Signal 3 54 0 2 2 9 6 25 9 4 0Crossing With Signal 1 133 2 0 7 17 16 39 44 9 0Dark Clothing / Not Visible 15 119 0 0 6 18 11 64 24 11 0Darting into Roadway 7 155 13 36 32 16 20 28 16 1 0Drinking 6 51 0 0 0 2 6 28 19 2 0Drug Related 3 6 0 0 0 0 1 6 2 0 0Getting On or Off Vehicle 0 10 0 1 0 1 0 6 2 0 0In Crosswalk 0 113 2 6 3 12 16 26 35 13 0Jogging 1 6 0 0 1 1 1 2 1 1 0Lying in Roadway 2 10 0 2 3 0 2 1 4 0 0Not at Intersection 9 106 1 7 12 16 7 30 35 7 0Not in Roadway 7 101 0 3 11 11 19 34 20 9 1Physical Impairment 3 9 0 0 0 2 1 0 7 2 0Playing in Roadway 0 15 1 4 5 4 0 1 0 0 0Pushing Vehicle 0 4 0 0 0 0 0 2 1 1 0Skating/Skateboarding 0 9 0 0 3 5 1 0 0 0 0Walking in Roadway 24 208 1 0 14 33 23 83 57 21 0Working in Roadway 0 43 0 0 1 3 3 23 12 1 0Working on Vehicle 9 21 1 0 0 2 6 9 8 4 0TOTAL* 94 1,363 21 70 102 171 157 475 357 103 1
PEDESTRIAN COLLISIONS
TOTAL ACTIONS FOR KILLED OR INJURED PEDESTRIANS BY AGE CATEGORYPEDESTRIAN
FACTOR
Fifty-four (54) pedestrians were killed and 951 were injured in traffic collisions in 2012. The charts below depict ages of victims of pedestrian collisions and the factors related to the pedestrian vs. the vehicle at the time of the collision. Up to three pedestrian factors can be coded for one collision. Fifteen (15) percent of the pedestrians killed or injured were 14 years of age or younger, while 8% were age 65 or older.
* These totals are higher than the actual number of pedestrians involved because they reflect multiple pedestrian actions.
StraightRightTurn
LeftTurn
ParkingStartingin Traffic
Slowing Backing Other TOTAL
Approaching or Leaving Vehicle 38 3 1 32 0 45 20 8 147At Intersection 38 23 33 2 3 3 0 2 104Crossing Against Signal 48 3 5 0 1 2 0 1 60Crossing With Signal 11 49 79 2 0 2 0 1 144Dark Clothing / Not Visible 105 4 14 1 1 2 4 9 140Darting into Roadway 159 2 4 1 1 8 0 3 178Drinking 48 0 2 2 0 0 4 6 62Drug Related 8 0 0 0 0 0 0 0 8Getting On or Off Vehicle 9 1 0 1 0 0 0 1 12In Crosswalk 25 23 55 1 1 1 2 3 111Jogging 4 2 1 0 0 0 0 1 8Lying in Roadway 7 2 1 0 0 0 0 1 11Not at Intersection 87 6 9 0 1 4 4 8 119Not in Roadway 62 4 9 9 1 5 11 9 110Physical Impairment 6 4 2 1 0 0 0 0 13Playing in Roadway 8 1 2 0 0 0 1 3 15Pushing Vehicle 2 0 0 3 0 0 2 3 10Skating/Skateboarding 6 0 3 0 0 0 0 0 9Walking in Roadway 175 9 15 1 2 10 14 15 241Working in Roadway 23 1 2 8 1 1 2 10 48Working on Vehicle 14 0 0 15 0 3 1 1 34
TOTAL* 883 137 237 79 12 86 65 85 1,584
VEHICLE ACTIONPEDESTRIANFACTOR
7
TOTALFATAL
COLLISIONSINJURY
COLLISIONS
PROPERTYDAMAGE
COLLISIONS
PERSONSKILLED
PERSONSINJURED
10,708 9 961 9,738 9 1,318
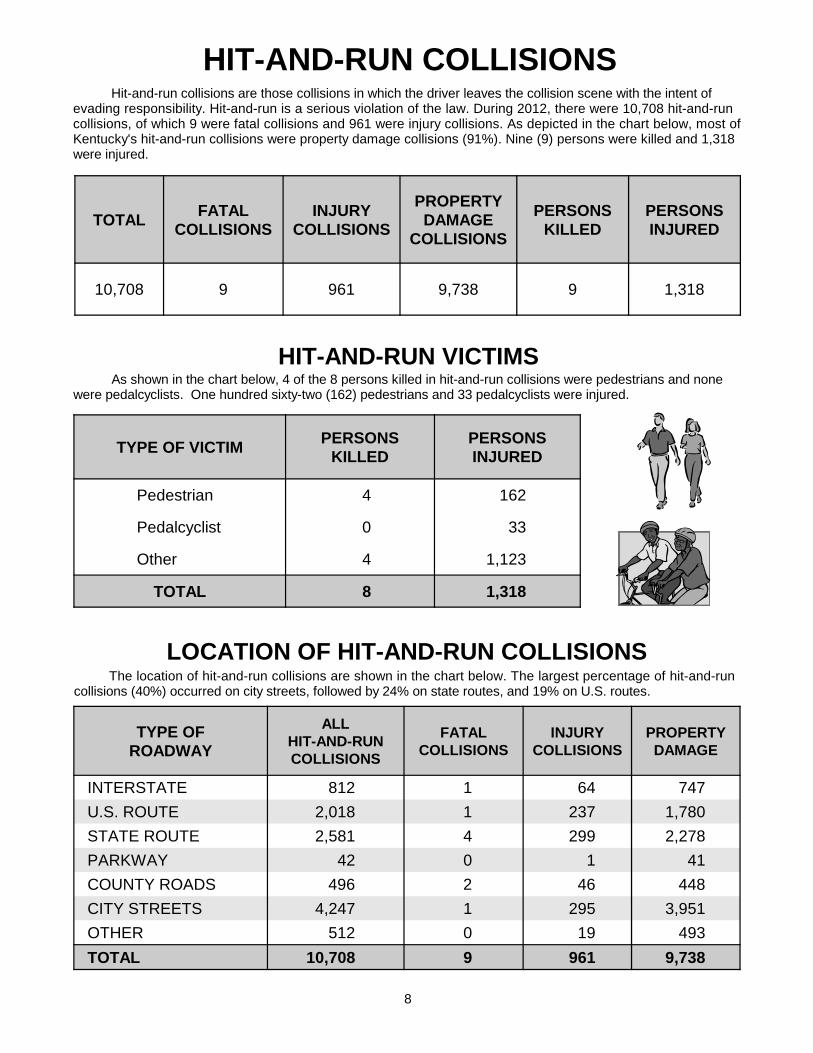
Hit-and-run collisions are those collisions in which the driver leaves the collision scene with the intent of evading responsibility. Hit-and-run is a serious violation of the law. During 2012, there were 10,708 hit-and-run collisions, of which 9 were fatal collisions and 961 were injury collisions. As depicted in the chart below, most of Kentucky's hit-and-run collisions were property damage collisions (91%). Nine (9) persons were killed and 1,318 were injured.
TYPE OF VICTIMPERSONS
KILLEDPERSONSINJURED
Pedestrian 4 162
Pedalcyclist 0 33
Other 4 1,123
TOTAL 8 1,318
HIT-AND-RUN VICTIMSAs shown in the chart below, 4 of the 8 persons killed in hit-and-run collisions were pedestrians and none
were pedalcyclists. One hundred sixty-two (162) pedestrians and 33 pedalcyclists were injured.
TYPE OFROADWAY
ALL HIT-AND-RUNCOLLISIONS
FATALCOLLISIONS
INJURYCOLLISIONS
PROPERTYDAMAGE
INTERSTATE 812 1 64 747
U.S. ROUTE 2,018 1 237 1,780
STATE ROUTE 2,581 4 299 2,278
PARKWAY 42 0 1 41
COUNTY ROADS 496 2 46 448
CITY STREETS 4,247 1 295 3,951
OTHER 512 0 19 493
TOTAL 10,708 9 961 9,738
LOCATION OF HIT-AND-RUN COLLISIONSThe location of hit-and-run collisions are shown in the chart below. The largest percentage of hit-and-run
collisions (40%) occurred on city streets, followed by 24% on state routes, and 19% on U.S. routes.
HIT-AND-RUN COLLISIONS
8
LAND USE
AREANumber
ofCollisions
%Total
Fatal %Total
NonfatalInjury
%Total
PropertyDamage
%Total
Killed %Total
Injured %Total
RURAL 45,223 36 413 60 9,602 40 35,208 35 447 60 14,233 40
URBAN 79,621 64 281 40 14,475 60 64,865 65 299 40 21,532 60
TOTAL 124,844 100 694 100 24,077 100 100,073 100 746 100 35,765 100
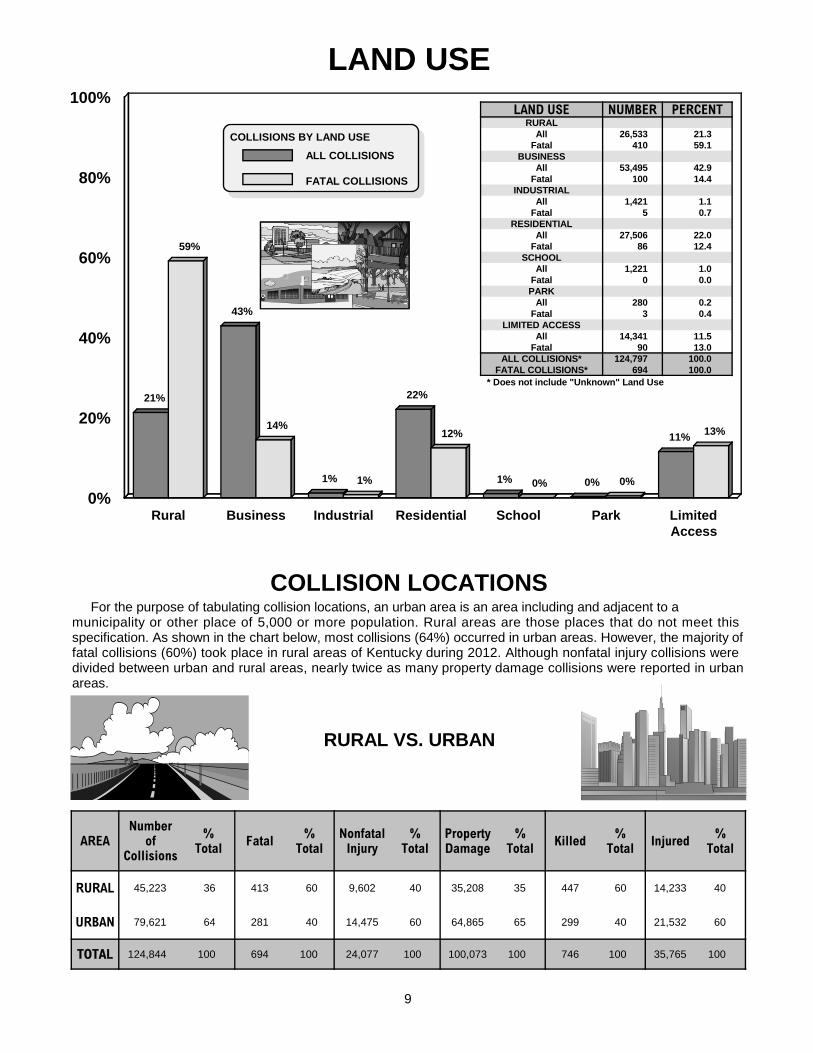
COLLISION LOCATIONSFor the purpose of tabulating collision locations, an urban area is an area including and adjacent to a
municipality or other place of 5,000 or more population. Rural areas are those places that do not meet this specification. As shown in the chart below, most collisions (64%) occurred in urban areas. However, the majority of fatal collisions (60%) took place in rural areas of Kentucky during 2012. Although nonfatal injury collisions were divided between urban and rural areas, nearly twice as many property damage collisions were reported in urban areas.
9
21%
43%
1%
22%
1% 0%
11%
59%
14%
1%
12%
0% 0%
13%
Rural Business Industrial Residential School Park LimitedAccess
0%
20%
40%
60%
80%
100%LAND USE NUMBER PERCENT
RURAL All 26,533 21.3
Fatal 410 59.1BUSINESS
All 53,495 42.9Fatal 100 14.4
INDUSTRIALAll 1,421 1.1
Fatal 5 0.7RESIDENTIAL
All 27,506 22.0Fatal 86 12.4
SCHOOLAll 1,221 1.0
Fatal 0 0.0PARK
All 280 0.2Fatal 3 0.4
LIMITED ACCESSAll 14,341 11.5
Fatal 90 13.0ALL COLLISIONS* 124,797 100.0
FATAL COLLISIONS* 694 100.0
COLLISIONS BY LAND USE
ALL COLLISIONS
FATAL COLLISIONS
* Does not include "Unknown" Land Use
RURAL VS. URBAN
TYPE OFROADWAY
Fatal Collisions
NonfatalInjury
PropertyDamage
%Total
INTERSTATE 63 1,863 9,305 9
U.S. ROUTE 160 6,413 24,461 25
STATE ROUTE
352 9,729 32,868 34
PARKWAY 23 348 1,322 1
COUNTY ROAD
58 1,491 5,374 6
CITY STREET 36 4,078 24,535 23
OTHER 2 155 2,208 2
TOTAL 694 24,077 100,073 100
LOCATION OF COLLISIONS
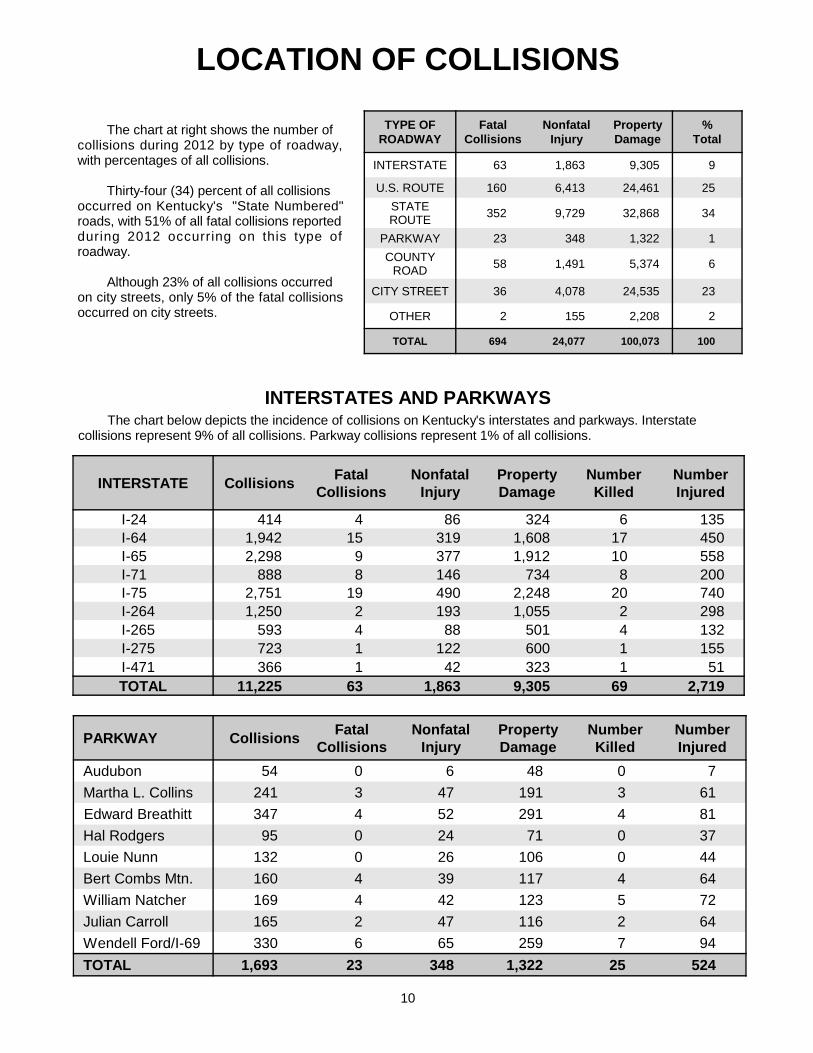
The chart at right shows the number of collisions during 2012 by type of roadway, with percentages of all collisions.
Thirty-four (34) percent of all collisions occurred on Kentucky's "State Numbered" roads, with 51% of all fatal collisions reported during 2012 occurring on this type of roadway.
Although 23% of all collisions occurred on city streets, only 5% of the fatal collisions occurred on city streets.
INTERSTATE CollisionsFatal
CollisionsNonfatal
InjuryPropertyDamage
NumberKilled
NumberInjured
I-24 414 4 86 324 6 135I-64 1,942 15 319 1,608 17 450I-65 2,298 9 377 1,912 10 558I-71 888 8 146 734 8 200I-75 2,751 19 490 2,248 20 740I-264 1,250 2 193 1,055 2 298I-265 593 4 88 501 4 132I-275 723 1 122 600 1 155I-471 366 1 42 323 1 51TOTAL 11,225 63 1,863 9,305 69 2,719
INTERSTATES AND PARKWAYSThe chart below depicts the incidence of collisions on Kentucky's interstates and parkways. Interstate
collisions represent 9% of all collisions. Parkway collisions represent 1% of all collisions.
PARKWAY CollisionsFatal
CollisionsNonfatal
InjuryPropertyDamage
NumberKilled
NumberInjured
Audubon 54 0 6 48 0 7
Martha L. Collins 241 3 47 191 3 61
Edward Breathitt 347 4 52 291 4 81
Hal Rodgers 95 0 24 71 0 37
Louie Nunn 132 0 26 106 0 44
Bert Combs Mtn. 160 4 39 117 4 64
William Natcher 169 4 42 123 5 72
Julian Carroll 165 2 47 116 2 64
Wendell Ford/I-69 330 6 65 259 7 94
TOTAL 1,693 23 348 1,322 25 524
10
COLLISIONSBY ROADWAY CONDITIONS
AND ROADWAY CHARACTER
11
77.3%
20.2%
2.0% 0.1% 0.5%
78.7%
19.6%
0.9% 0.1% 0.7%
DRY WET SNOW/ICE/SLUSH MUD Not Stated0.0%
10.0%
20.0%
30.0%
40.0%
50.0%
60.0%
70.0%
80.0%
90.0%
100.0%Surface Number Percent
DRY All 96,537 77.3
Fatal 546 78.7
WETAll 25,214 20.2
Fatal 136 19.6
SNOW/ICE/SLUSHAll 2,453 2.0
Fatal 6 0.9
MUDAll 75 0.1
Fatal 1 0.1
Not StatedAll 565 0.5
Fatal 5 0.7
ALL COLLISIONS 124,844
FATAL COLLISIONS 694
COLLISIONS BY ROADWAY SURFACE
ALL COLLISIONS
FATAL COLLISIONS
59.4%
16.2%
3.7%
9.4% 9.1%
2.1%0.0%
33.1%
19.2%
4.9%
18.7%22.3%
1.7% 0.0%
Straight& Level
Straight& Grade
Straight& Hillcrest
Curve& Level
Curve& Grade
Curve& Hillcrest
Unknown0.0%
10.0%
20.0%
30.0%
40.0%
50.0%
60.0%
70.0%
80.0%
90.0%
100.0%
COLLISIONS BY ROADWAY CHARACTER
ALL COLLISIONS
FATAL COLLISIONS
Terrain Number PercentStraight & Level
All 74,181 59.4Fatal 230 33.1
Straight & GradeAll 20,221 16.2
Fatal 133 19.2
Straight & HillcrestAll 4,642 3.7
Fatal 34 4.9
Curve & LevelAll 11,756 9.4
Fatal 130 18.7
Curve & GradeAll 11,415 9.1
Fatal 155 22.3
Curve & HillcrestAll 2,590 2.1
Fatal 12 1.7
UnknownAll 39 0.0
Fatal 0 0.0
ALL COLLISIONS 124,844
FATAL COLLISIONS 694
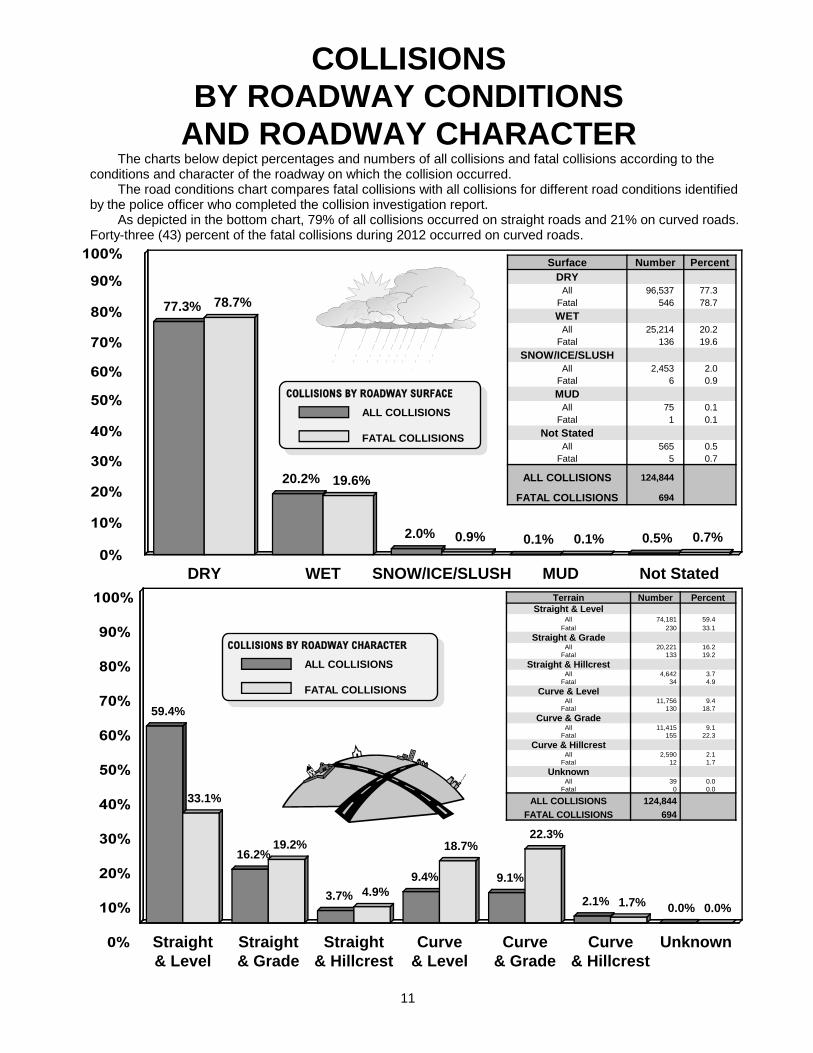
The charts below depict percentages and numbers of all collisions and fatal collisions according to the conditions and character of the roadway on which the collision occurred.
The road conditions chart compares fatal collisions with all collisions for different road conditions identified by the police officer who completed the collision investigation report.
As depicted in the bottom chart, 79% of all collisions occurred on straight roads and 21% on curved roads. Forty-three (43) percent of the fatal collisions during 2012 occurred on curved roads.
DAYLIGHTCOLLISIONS
89,402(72.1%)
COLLISIONSAT DAWN
2,998(2.4%)
COLLISIONSDURINGDARK28,228(22.8%)
DAYLIGHTCOLLISIONS
416(60.3%)
COLLISIONSAT DUSK
14(2.0%)
COLLISIONSDURINGDARK
242(35.1%)
FATAL COLLISIONS(excludes unknown light condition)
ALL COLLISIONS(excludes unknown light condition)
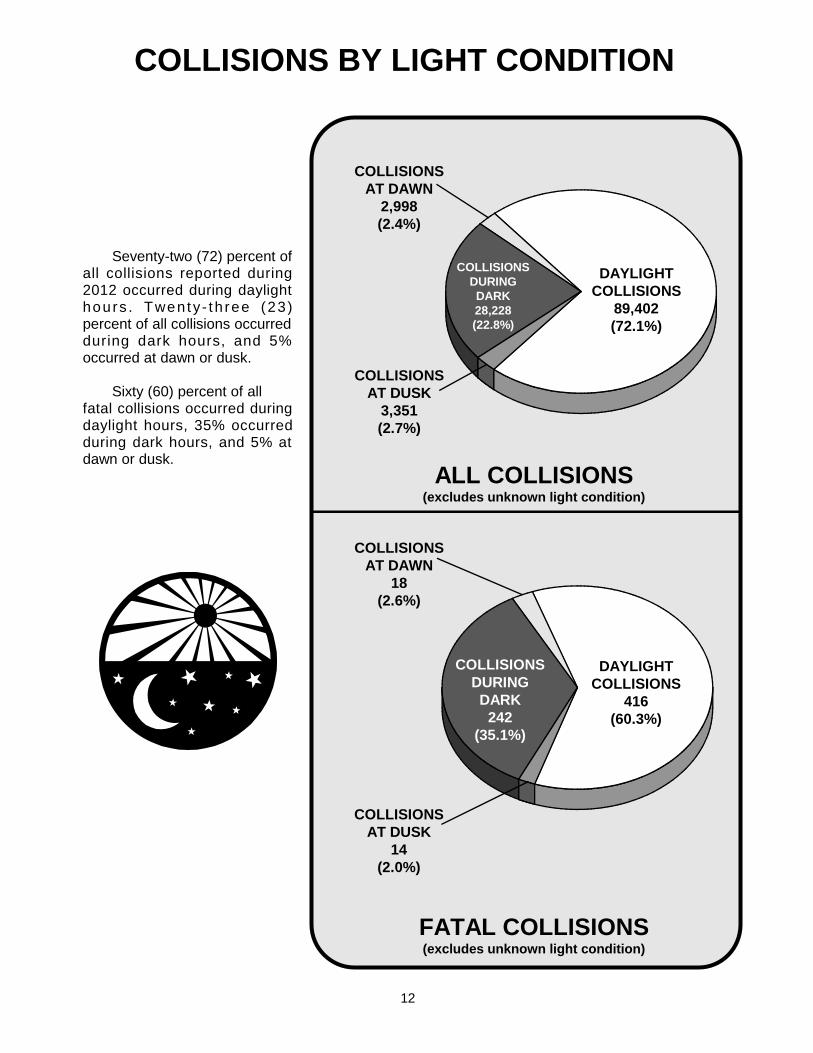
COLLISIONS BY LIGHT CONDITION
Seventy-two (72) percent of all collisions reported during 2012 occurred during daylight hours . Twenty- th ree (23 ) percent of all collisions occurred during dark hours, and 5% occurred at dawn or dusk.
Sixty (60) percent of all fatal collisions occurred during daylight hours, 35% occurred during dark hours, and 5% at dawn or dusk.
12
COLLISIONSAT DUSK
3,351(2.7%)
COLLISIONSAT DAWN
18(2.6%)
13
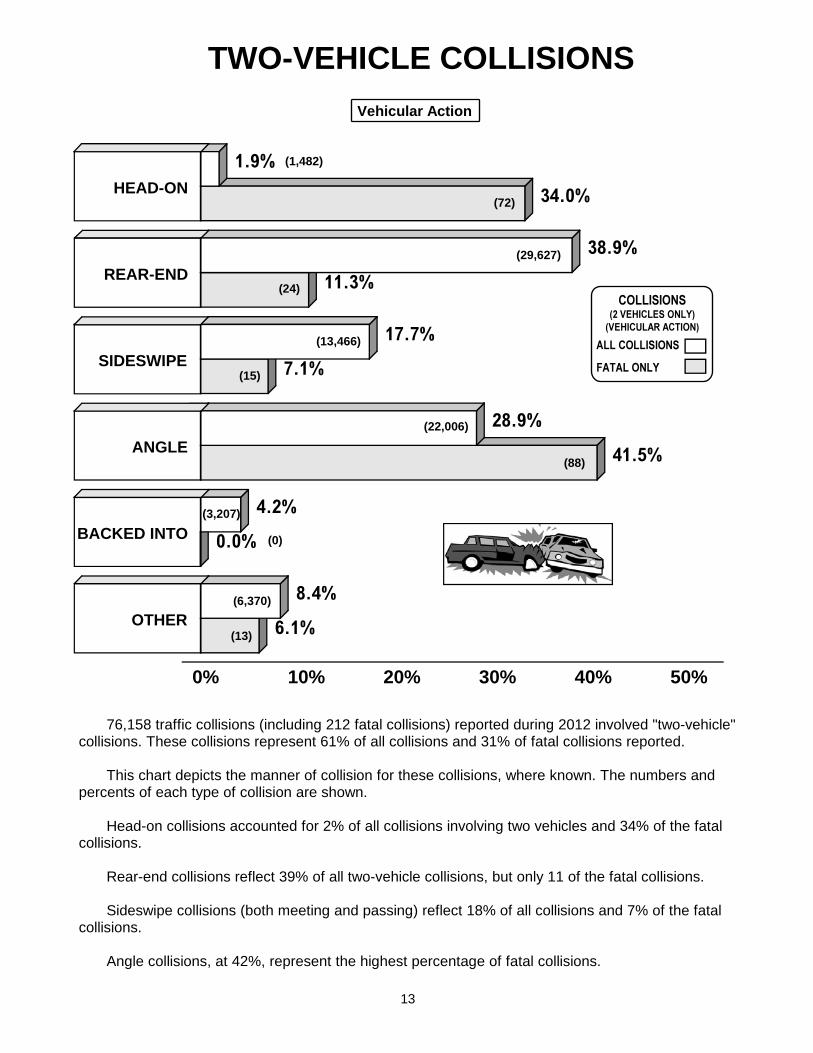
TWO-VEHICLE COLLISIONS
76,158 traffic collisions (including 212 fatal collisions) reported during 2012 involved "two-vehicle" collisions. These collisions represent 61% of all collisions and 31% of fatal collisions reported.
This chart depicts the manner of collision for these collisions, where known. The numbers and percents of each type of collision are shown.
Head-on collisions accounted for 2% of all collisions involving two vehicles and 34% of the fatal collisions.
Rear-end collisions reflect 39% of all two-vehicle collisions, but only 11 of the fatal collisions.
Sideswipe collisions (both meeting and passing) reflect 18% of all collisions and 7% of the fatal collisions.
Angle collisions, at 42%, represent the highest percentage of fatal collisions.
1.9%
38.9%
17.7%
28.9%
4.2%
8.4%
34.0%
11.3%
7.1%
41.5%
0.0%
6.1%
HEAD-ON
REAR-END
SIDESWIPE
ANGLE
BACKED INTO
OTHER
0.0% 10.0% 20.0% 30.0% 40.0% 50.0%
(72)
(29,627)
(15)
(22,006)
(88)
(3,207)
(0)
(6,370)
(13)
(1,482)
(24)
(13,466)
Vehicular Action
0% 10% 20% 30% 40% 50%
117 79 94 93 94 98 119
SUN MON TUE WED THU FRI SAT 0
40
80
120
160
FA
TA
L C
OL
LIS
ION
S
12,42819,123 18,001 18,422 19,002 22,192
15,676
SUN MON TUE WED THU FRI SAT0
10,000
20,000
30,000
AL
L C
OL
LIS
ION
S
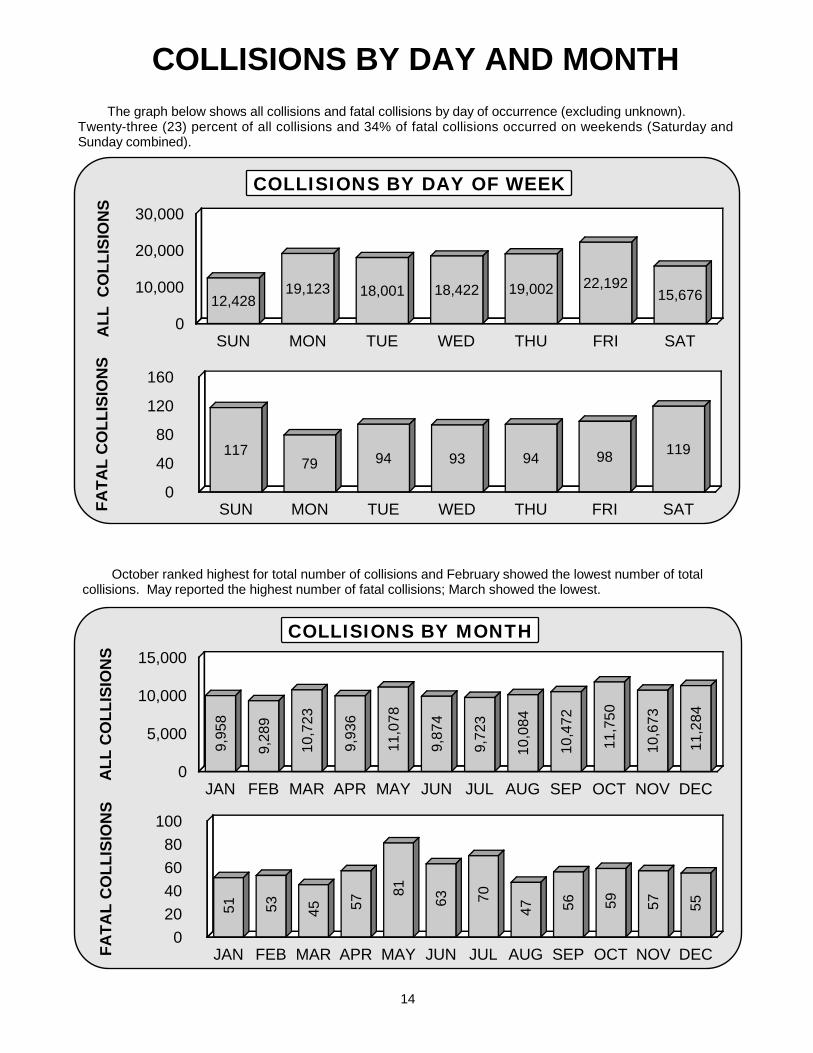
COLLISIONS BY DAY AND MONTH
The graph below shows all collisions and fatal collisions by day of occurrence (excluding unknown). Twenty-three (23) percent of all collisions and 34% of fatal collisions occurred on weekends (Saturday and Sunday combined).
9,95
8
9,28
9
10,7
23
9,93
6
11,0
78
9,87
4
9,72
3
10,0
84
10,4
72
11,7
50
10,6
73
11,2
84
JAN FEB MAR APR MAY JUN JUL AUG SEP OCT NOV DEC0
5,000
10,000
15,000
AL
L C
OL
LIS
ION
S
5
1
5
3
4
5
5
7
8
1
6
3
7
0
4
7
5
6
5
9
5
7
5
5
JAN FEB MAR APR MAY JUN JUL AUG SEP OCT NOV DEC 0
20
40
60
80
100
FA
TA
L C
OL
LIS
ION
S
October ranked highest for total number of collisions and February showed the lowest number of total collisions. May reported the highest number of fatal collisions; March showed the lowest.
14
COLLISIONS BY MONTH
COLLISIONS BY DAY OF WEEK
HOLIDAY PERIODNEW
YEAR'SDAY
MEMORIALDAY
INDEPEN-DENCE
DAY
LABORDAY
THANKS-GIVING
CHRIST-MAS
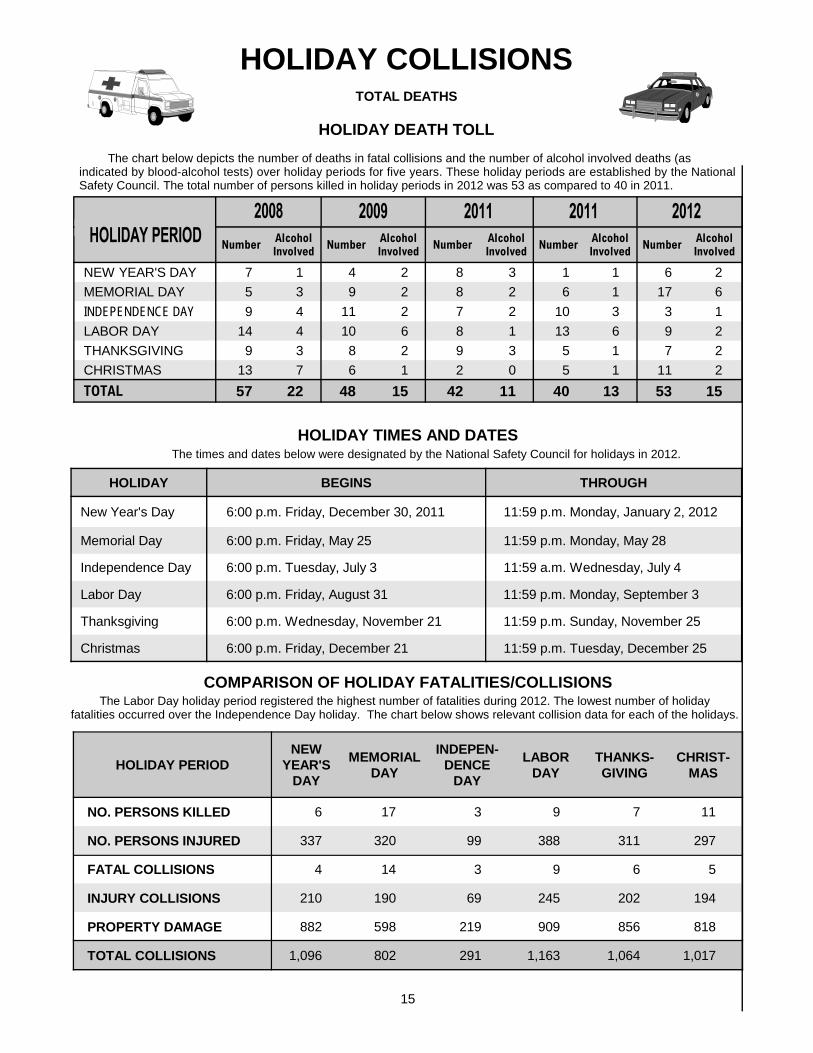
NO. PERSONS KILLED 6 17 3 9 7 11
NO. PERSONS INJURED 337 320 99 388 311 297
FATAL COLLISIONS 4 14 3 9 6 5
INJURY COLLISIONS 210 190 69 245 202 194
PROPERTY DAMAGE 882 598 219 909 856 818
TOTAL COLLISIONS 1,096 802 291 1,163 1,064 1,017
HOLIDAY COLLISIONS
HOLIDAY DEATH TOLL
The chart below depicts the number of deaths in fatal collisions and the number of alcohol involved deaths (as indicated by blood-alcohol tests) over holiday periods for five years. These holiday periods are established by the National Safety Council. The total number of persons killed in holiday periods in 2012 was 53 as compared to 40 in 2011.
COMPARISON OF HOLIDAY FATALITIES/COLLISIONSThe Labor Day holiday period registered the highest number of fatalities during 2012. The lowest number of holiday
fatalities occurred over the Independence Day holiday. The chart below shows relevant collision data for each of the holidays.
TOTAL DEATHS
The times and dates below were designated by the National Safety Council for holidays in 2012.
HOLIDAY BEGINS THROUGH
New Year's Day 6:00 p.m. Friday, December 30, 2011 11:59 p.m. Monday, January 2, 2012
Memorial Day 6:00 p.m. Friday, May 25 11:59 p.m. Monday, May 28
Independence Day 6:00 p.m. Tuesday, July 3 11:59 a.m. Wednesday, July 4
Labor Day 6:00 p.m. Friday, August 31 11:59 p.m. Monday, September 3
Thanksgiving 6:00 p.m. Wednesday, November 21 11:59 p.m. Sunday, November 25
Christmas 6:00 p.m. Friday, December 21 11:59 p.m. Tuesday, December 25
HOLIDAY TIMES AND DATES
NumberAlcoholInvolved
NumberAlcoholInvolved
NumberAlcoholInvolved
NumberAlcoholInvolved
NumberAlcoholInvolved
NEW YEAR'S DAY 7 1 4 2 8 3 1 1 6 2
MEMORIAL DAY 5 3 9 2 8 2 6 1 17 6
INDEPENDENCE DAY 9 4 11 2 7 2 10 3 3 1
LABOR DAY 14 4 10 6 8 1 13 6 9 2
THANKSGIVING 9 3 8 2 9 3 5 1 7 2
CHRISTMAS 13 7 6 1 2 0 5 1 11 2
TOTAL 57 22 48 15 42 11 40 13 53 15
15
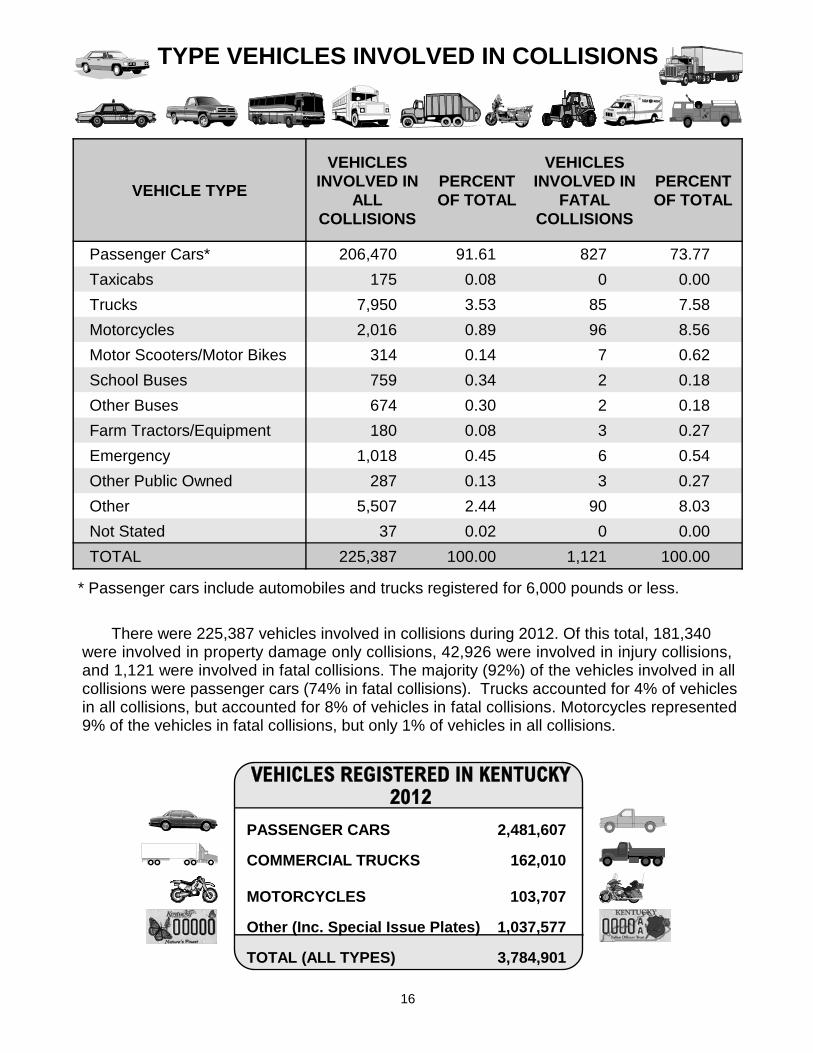
VEHICLE TYPE
VEHICLESINVOLVED IN
ALLCOLLISIONS
PERCENTOF TOTAL
VEHICLES INVOLVED IN
FATAL COLLISIONS
PERCENTOF TOTAL
Passenger Cars* 206,470 91.61 827 73.77
Taxicabs 175 0.08 0 0.00
Trucks 7,950 3.53 85 7.58
Motorcycles 2,016 0.89 96 8.56
Motor Scooters/Motor Bikes 314 0.14 7 0.62
School Buses 759 0.34 2 0.18
Other Buses 674 0.30 2 0.18
Farm Tractors/Equipment 180 0.08 3 0.27
Emergency 1,018 0.45 6 0.54
Other Public Owned 287 0.13 3 0.27
Other 5,507 2.44 90 8.03
Not Stated 37 0.02 0 0.00
TOTAL 225,387 100.00 1,121 100.00
TYPE VEHICLES INVOLVED IN COLLISIONS
* Passenger cars include automobiles and trucks registered for 6,000 pounds or less.
There were 225,387 vehicles involved in collisions during 2012. Of this total, 181,340 were involved in property damage only collisions, 42,926 were involved in injury collisions, and 1,121 were involved in fatal collisions. The majority (92%) of the vehicles involved in all collisions were passenger cars (74% in fatal collisions). Trucks accounted for 4% of vehicles in all collisions, but accounted for 8% of vehicles in fatal collisions. Motorcycles represented 9% of the vehicles in fatal collisions, but only 1% of vehicles in all collisions.
16
VEHICLES REGISTERED IN KENTUCKY2012
PASSENGER CARS 2,481,607
COMMERCIAL TRUCKS 162,010
MOTORCYCLES 103,707
Other (Inc. Special Issue Plates) 1,037,577
TOTAL (ALL TYPES) 3,784,901
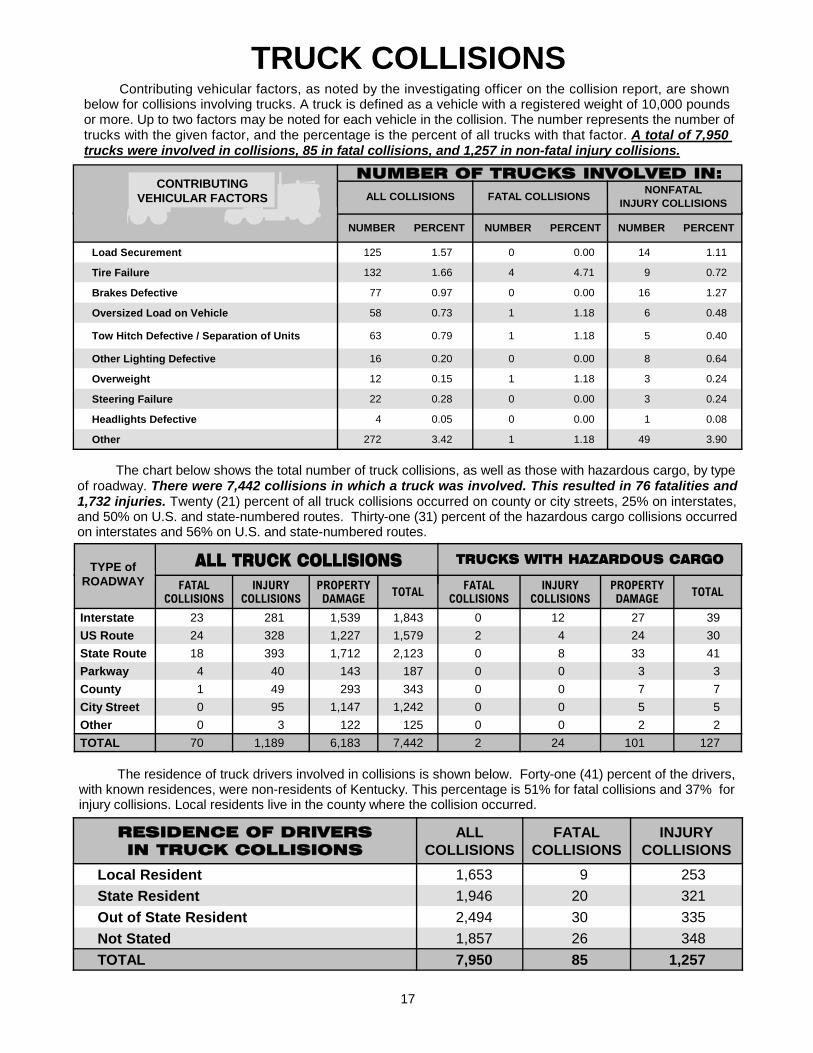
TRUCK COLLISIONSContributing vehicular factors, as noted by the investigating officer on the collision report, are shown
below for collisions involving trucks. A truck is defined as a vehicle with a registered weight of 10,000 pounds or more. Up to two factors may be noted for each vehicle in the collision. The number represents the number of trucks with the given factor, and the percentage is the percent of all trucks with that factor. A total of 7,950 trucks were involved in collisions, 85 in fatal collisions, and 1,257 in non-fatal injury collisions.
RESIDENCE OF DRIVERSIN TRUCK COLLISIONS
ALLCOLLISIONS
FATALCOLLISIONS
INJURYCOLLISIONS
Local Resident 1,653 9 253
State Resident 1,946 20 321
Out of State Resident 2,494 30 335
Not Stated 1,857 26 348
TOTAL 7,950 85 1,257
The residence of truck drivers involved in collisions is shown below. Forty-one (41) percent of the drivers, with known residences, were non-residents of Kentucky. This percentage is 51% for fatal collisions and 37% for injury collisions. Local residents live in the county where the collision occurred.
17
NUMBER PERCENT NUMBER PERCENT NUMBER PERCENT
Load Securement 125 1.57 0 0.00 14 1.11
Tire Failure 132 1.66 4 4.71 9 0.72
Brakes Defective 77 0.97 0 0.00 16 1.27
Oversized Load on Vehicle 58 0.73 1 1.18 6 0.48
Tow Hitch Defective / Separation of Units 63 0.79 1 1.18 5 0.40
Other Lighting Defective 16 0.20 0 0.00 8 0.64
Overweight 12 0.15 1 1.18 3 0.24
Steering Failure 22 0.28 0 0.00 3 0.24
Headlights Defective 4 0.05 0 0.00 1 0.08
Other 272 3.42 1 1.18 49 3.90
ALL COLLISIONS FATAL COLLISIONSNONFATAL
INJURY COLLISIONS
NUMBER OF TRUCKS INVOLVED IN:CONTRIBUTING
VEHICULAR FACTORS
The chart below shows the total number of truck collisions, as well as those with hazardous cargo, by type of roadway. There were 7,442 collisions in which a truck was involved. This resulted in 76 fatalities and 1,732 injuries. Twenty (21) percent of all truck collisions occurred on county or city streets, 25% on interstates, and 50% on U.S. and state-numbered routes. Thirty-one (31) percent of the hazardous cargo collisions occurred on interstates and 56% on U.S. and state-numbered routes.
FATALCOLLISIONS
INJURYCOLLISIONS
PROPERTYDAMAGE
TOTALFATAL
COLLISIONSINJURY
COLLISIONSPROPERTYDAMAGE
TOTAL
Interstate 23 281 1,539 1,843 0 12 27 39
US Route 24 328 1,227 1,579 2 4 24 30
State Route 18 393 1,712 2,123 0 8 33 41
Parkway 4 40 143 187 0 0 3 3
County 1 49 293 343 0 0 7 7
City Street 0 95 1,147 1,242 0 0 5 5
Other 0 3 122 125 0 0 2 2
TOTAL 70 1,189 6,183 7,442 2 24 101 127
TYPE ofROADWAY
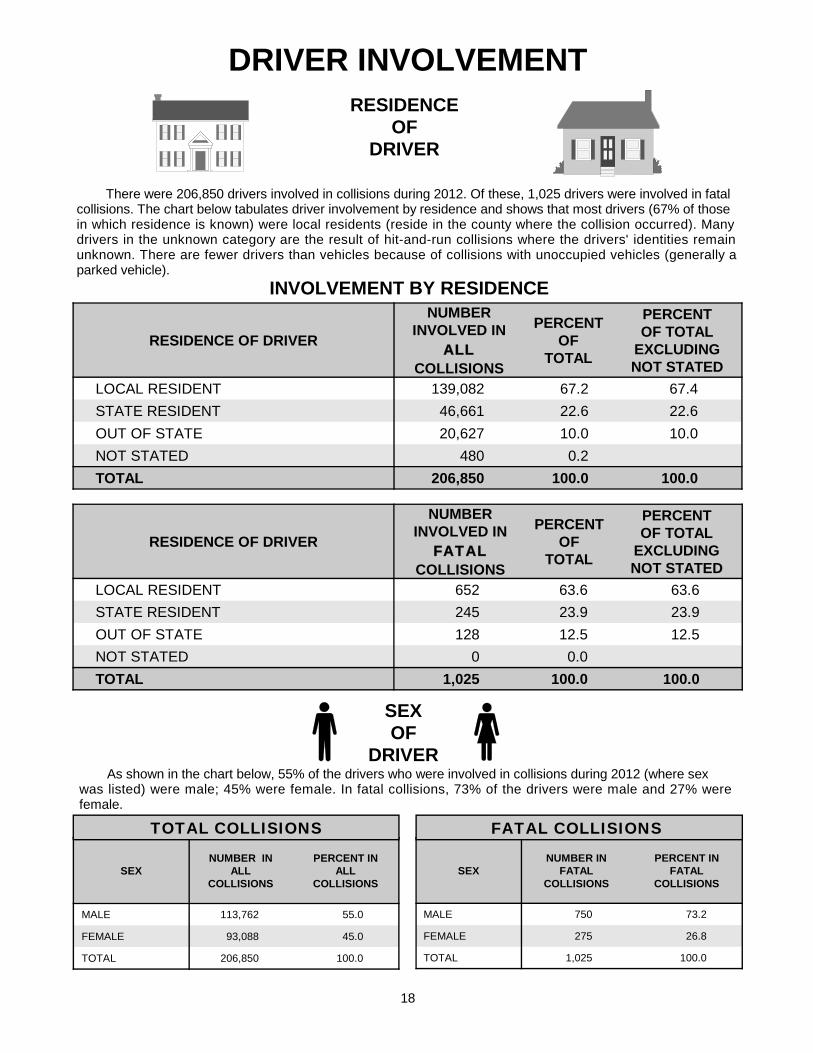
RESIDENCE OF DRIVER
NUMBER INVOLVED IN
ALLCOLLISIONS
PERCENTOF
TOTAL
PERCENTOF TOTAL
EXCLUDINGNOT STATED
LOCAL RESIDENT 139,082 67.2 67.4
STATE RESIDENT 46,661 22.6 22.6
OUT OF STATE 20,627 10.0 10.0
NOT STATED 480 0.2
TOTAL 206,850 100.0 100.0
RESIDENCE OF DRIVER
NUMBER INVOLVED IN
FATAL COLLISIONS
PERCENTOF
TOTAL
PERCENTOF TOTAL
EXCLUDINGNOT STATED
LOCAL RESIDENT 652 63.6 63.6
STATE RESIDENT 245 23.9 23.9
OUT OF STATE 128 12.5 12.5
NOT STATED 0 0.0
TOTAL 1,025 100.0 100.0
SEXNUMBER IN
FATALCOLLISIONS
PERCENT INFATAL
COLLISIONS
MALE 750 73.2
FEMALE 275 26.8
TOTAL 1,025 100.0
SEXNUMBER IN
ALLCOLLISIONS
PERCENT INALL
COLLISIONS
MALE 113,762 55.0
FEMALE 93,088 45.0
TOTAL 206,850 100.0
DRIVER INVOLVEMENT
There were 206,850 drivers involved in collisions during 2012. Of these, 1,025 drivers were involved in fatal collisions. The chart below tabulates driver involvement by residence and shows that most drivers (67% of those in which residence is known) were local residents (reside in the county where the collision occurred). Many drivers in the unknown category are the result of hit-and-run collisions where the drivers' identities remain unknown. There are fewer drivers than vehicles because of collisions with unoccupied vehicles (generally a parked vehicle).
INVOLVEMENT BY RESIDENCE
RESIDENCEOF
DRIVER
As shown in the chart below, 55% of the drivers who were involved in collisions during 2012 (where sex was listed) were male; 45% were female. In fatal collisions, 73% of the drivers were male and 27% were female.
TOTAL COLLISIONS FATAL COLLISIONS
SEXOF
DRIVER
18
0%
10%
14%
21%
17%
16%
12%
6%
3%
0%
7%
8%
16%17%
19%
17%
10%
6%
under16
16to19
20to24
25to34
35to44
45to54
55to64
65to74
75andover
AGE
0%
5%
10%
15%
20%
25%Drivers Involved InAll Collisions
Licensed Drivers
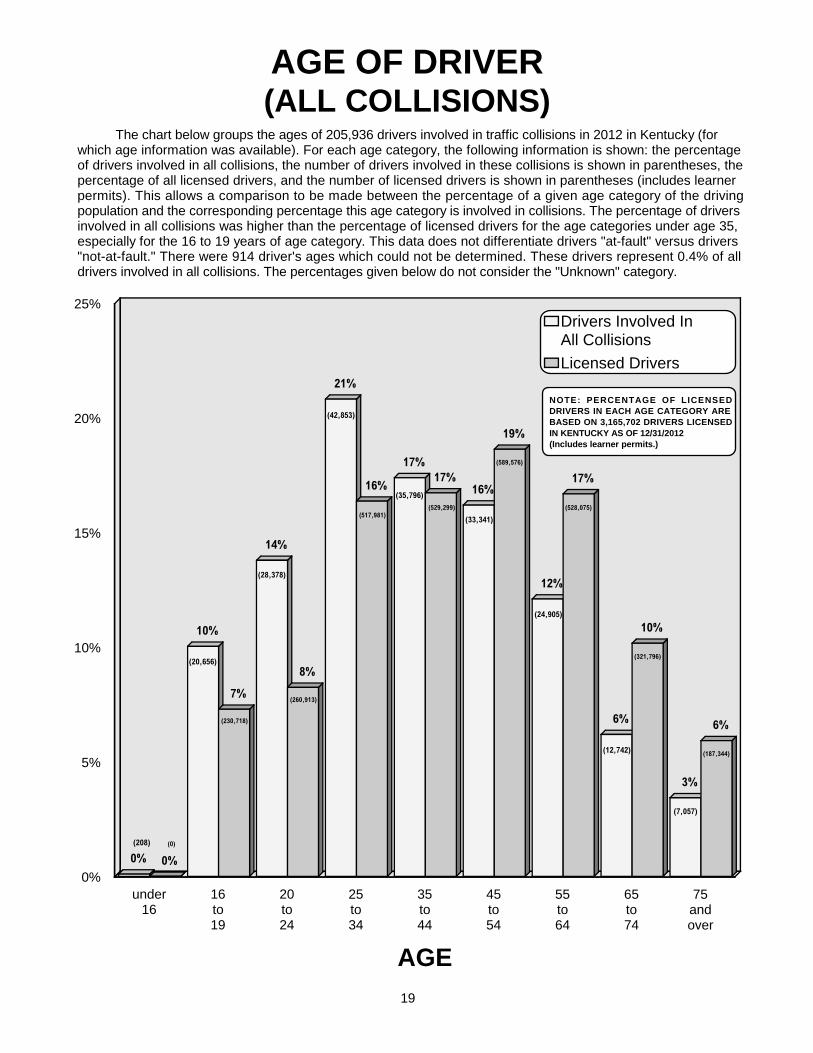
AGE OF DRIVER(ALL COLLISIONS)
The chart below groups the ages of 205,936 drivers involved in traffic collisions in 2012 in Kentucky (for which age information was available). For each age category, the following information is shown: the percentage of drivers involved in all collisions, the number of drivers involved in these collisions is shown in parentheses, the percentage of all licensed drivers, and the number of licensed drivers is shown in parentheses (includes learner permits). This allows a comparison to be made between the percentage of a given age category of the driving population and the corresponding percentage this age category is involved in collisions. The percentage of drivers involved in all collisions was higher than the percentage of licensed drivers for the age categories under age 35, especially for the 16 to 19 years of age category. This data does not differentiate drivers "at-fault" versus drivers "not-at-fault." There were 914 driver's ages which could not be determined. These drivers represent 0.4% of all drivers involved in all collisions. The percentages given below do not consider the "Unknown" category.
(20,656)
(28,378)
(42,853)
(35,796)
(33,341)
(24,905)
(12,742)
(7,057)
(208) (0)
19
NOTE: PERCENTAGE OF LICENSED DRIVERS IN EACH AGE CATEGORY ARE BASED ON 3,165,702 DRIVERS LICENSED IN KENTUCKY AS OF 12/31/2012(Includes learner permits.)
(230,718)
(260,913)
(517,981)(529,299)
(589,576)
(528,075)
(321,796)
(187,344)
0%
7%
9%
21%
19%
17%
13%
8%
5%
0%
7%
8%
16%17%
19%
17%
10%
6%
under16
16to19
20to24
25to34
35to44
45to54
55to64
65to74
75andover
AGE
0%
5%
10%
15%
20%
25%Drivers Involved InFatal Collisions
Licensed Drivers
AGE OF DRIVER(FATAL COLLISIONS)
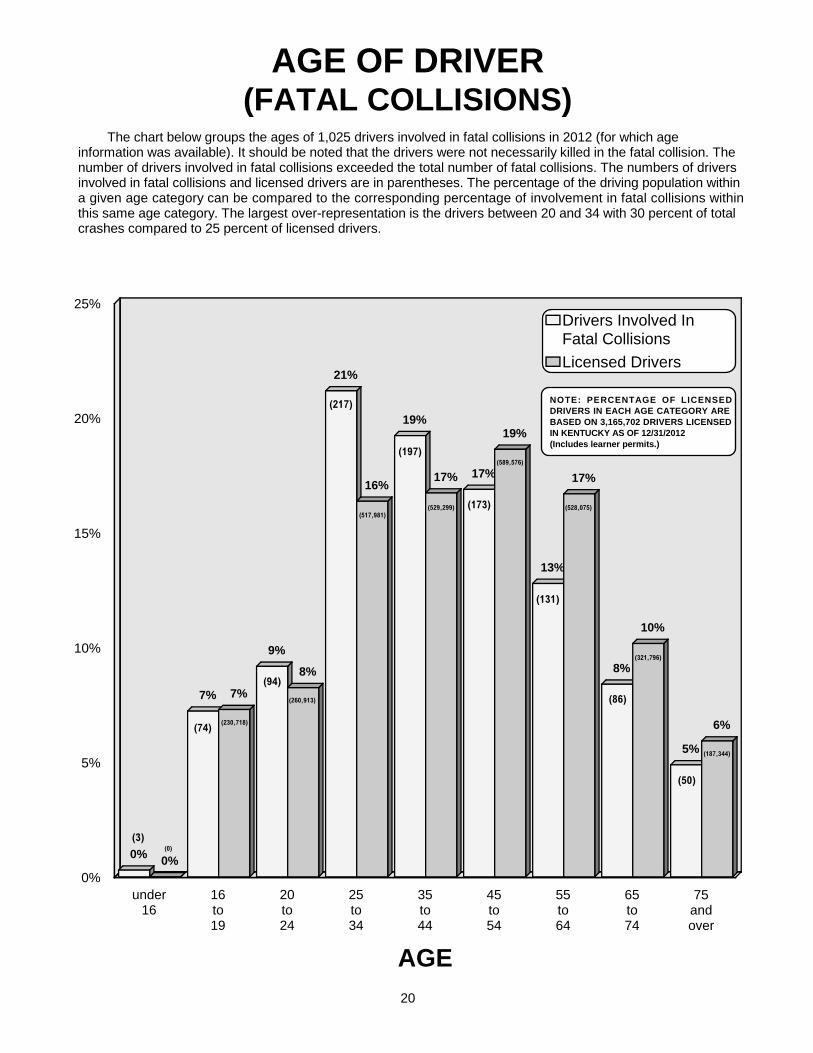
The chart below groups the ages of 1,025 drivers involved in fatal collisions in 2012 (for which age information was available). It should be noted that the drivers were not necessarily killed in the fatal collision. The number of drivers involved in fatal collisions exceeded the total number of fatal collisions. The numbers of drivers involved in fatal collisions and licensed drivers are in parentheses. The percentage of the driving population within a given age category can be compared to the corresponding percentage of involvement in fatal collisions within this same age category. The largest over-representation is the drivers between 20 and 34 with 30 percent of total crashes compared to 25 percent of licensed drivers.
(197)
(94)
(74)
(173)
(131)
(86)
(50)
(3)
20
(217)
(0)
NOTE: PERCENTAGE OF LICENSED DRIVERS IN EACH AGE CATEGORY ARE BASED ON 3,165,702 DRIVERS LICENSED IN KENTUCKY AS OF 12/31/2012(Includes learner permits.)
(230,718)
(260,913)
(517,981)(529,299)
(589,576)
(528,075)
(321,796)
(187,344)
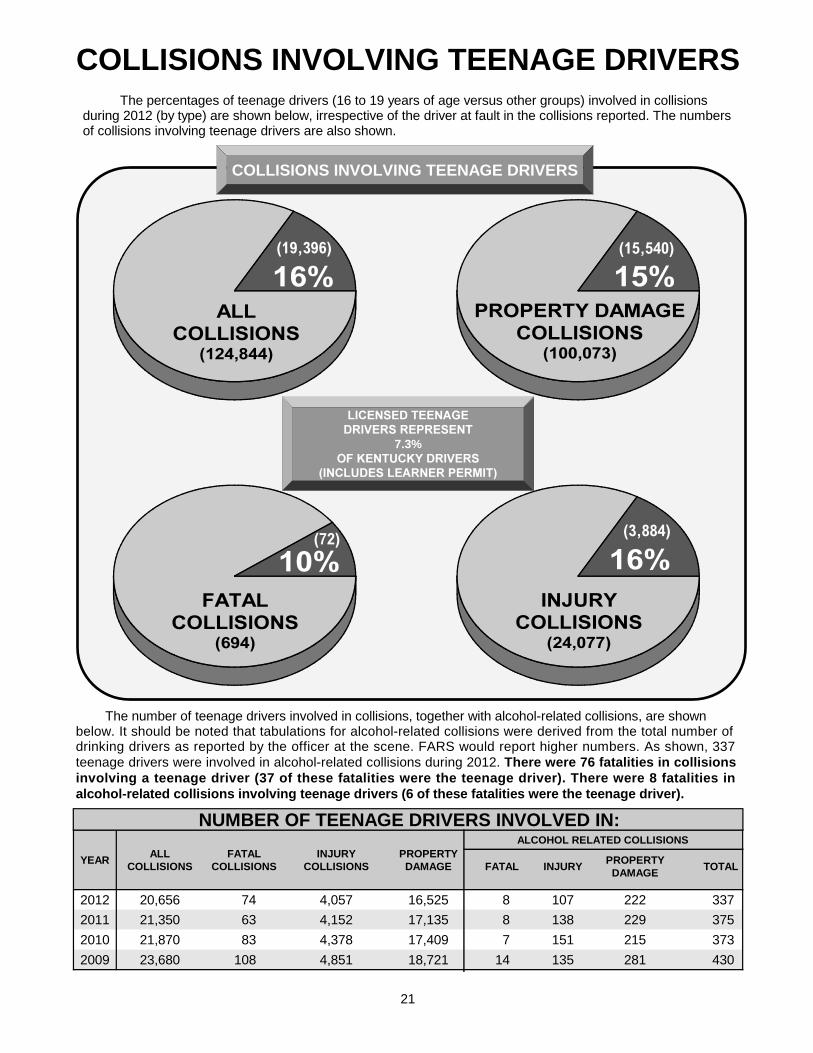
COLLISIONS INVOLVING TEENAGE DRIVERSThe percentages of teenage drivers (16 to 19 years of age versus other groups) involved in collisions
during 2012 (by type) are shown below, irrespective of the driver at fault in the collisions reported. The numbers of collisions involving teenage drivers are also shown.
COLLISIONS INVOLVING TEENAGE DRIVERS
7.3%
The number of teenage drivers involved in collisions, together with alcohol-related collisions, are shown below. It should be noted that tabulations for alcohol-related collisions were derived from the total number of drinking drivers as reported by the officer at the scene. FARS would report higher numbers. As shown, 337 teenage drivers were involved in alcohol-related collisions during 2012. There were 76 fatalities in collisions involving a teenage driver (37 of these fatalities were the teenage driver). There were 8 fatalities in alcohol-related collisions involving teenage drivers (6 of these fatalities were the teenage driver).
21
YEARALL
COLLISIONSFATAL
COLLISIONSINJURY
COLLISIONSPROPERTY
DAMAGE FATAL INJURYPROPERTY
DAMAGETOTAL
2012 20,656 74 4,057 16,525 8 107 222 337
2011 21,350 63 4,152 17,135 8 138 229 375
2010 21,870 83 4,378 17,409 7 151 215 373
2009 23,680 108 4,851 18,721 14 135 281 430
NUMBER OF TEENAGE DRIVERS INVOLVED IN:ALCOHOL RELATED COLLISIONS
(19,396) (15,540)
(3,884)(72)
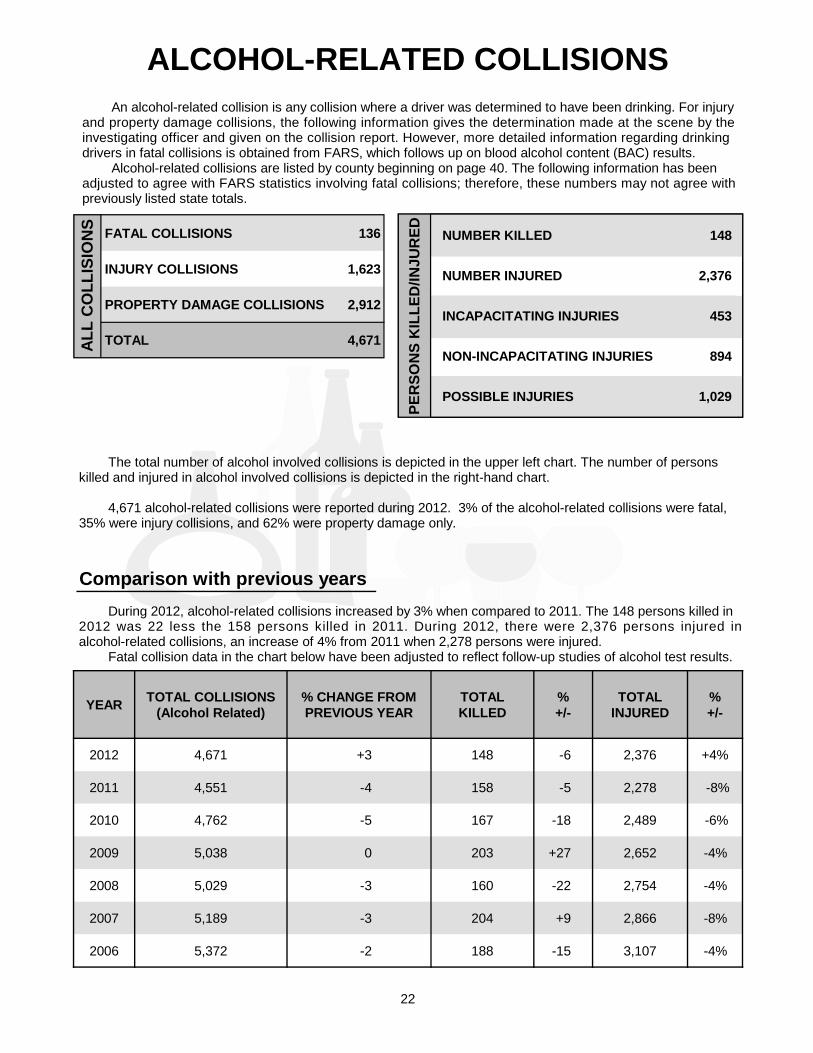
ALCOHOL-RELATED COLLISIONSAn alcohol-related collision is any collision where a driver was determined to have been drinking. For injury
and property damage collisions, the following information gives the determination made at the scene by the investigating officer and given on the collision report. However, more detailed information regarding drinking drivers in fatal collisions is obtained from FARS, which follows up on blood alcohol content (BAC) results.
Alcohol-related collisions are listed by county beginning on page 40. The following information has been adjusted to agree with FARS statistics involving fatal collisions; therefore, these numbers may not agree with previously listed state totals.
The total number of alcohol involved collisions is depicted in the upper left chart. The number of persons killed and injured in alcohol involved collisions is depicted in the right-hand chart.
4,671 alcohol-related collisions were reported during 2012. 3% of the alcohol-related collisions were fatal, 35% were injury collisions, and 62% were property damage only.
Comparison with previous years
During 2012, alcohol-related collisions increased by 3% when compared to 2011. The 148 persons killed in 2012 was 22 less the 158 persons killed in 2011. During 2012, there were 2,376 persons injured in alcohol-related collisions, an increase of 4% from 2011 when 2,278 persons were injured.
Fatal collision data in the chart below have been adjusted to reflect follow-up studies of alcohol test results.
YEARTOTAL COLLISIONS
(Alcohol Related)% CHANGE FROMPREVIOUS YEAR
TOTALKILLED
%+/-
TOTALINJURED
%+/-
2012 4,671 +3 148 -6 2,376 +4%
2011 4,551 -4 158 -5 2,278 -8%
2010 4,762 -5 167 -18 2,489 -6%
2009 5,038 0 203 +27 2,652 -4%
2008 5,029 -3 160 -22 2,754 -4%
2007 5,189 -3 204 +9 2,866 -8%
2006 5,372 -2 188 -15 3,107 -4%
22
FATAL COLLISIONS 136
INJURY COLLISIONS 1,623
PROPERTY DAMAGE COLLISIONS 2,912
TOTAL 4,671
NUMBER KILLED 148
NUMBER INJURED 2,376
INCAPACITATING INJURIES 453
NON-INCAPACITATING INJURIES 894
POSSIBLE INJURIES 1,029P
ER
SO
NS
KIL
LE
D/I
NJU
RE
D
AL
L C
OL
LIS
ION
S
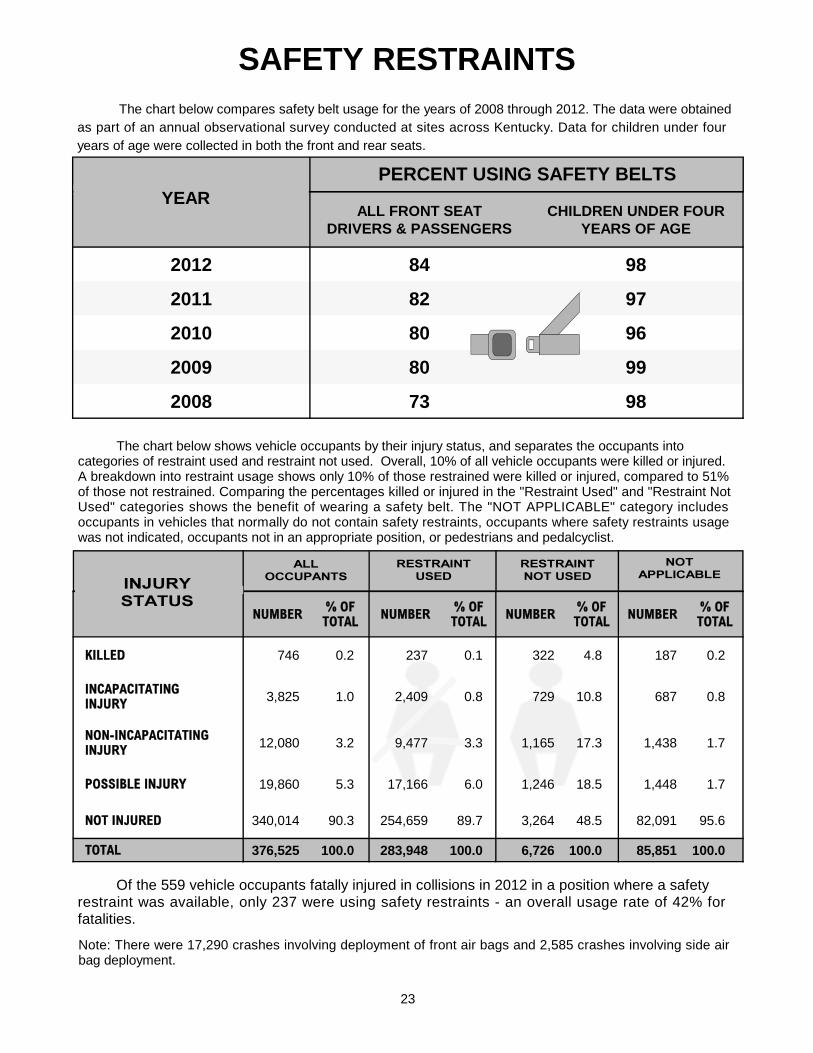
SAFETY RESTRAINTSThe chart below compares safety belt usage for the years of 2008 through 2012. The data were obtained
as part of an annual observational survey conducted at sites across Kentucky. Data for children under four years of age were collected in both the front and rear seats.
The chart below shows vehicle occupants by their injury status, and separates the occupants into categories of restraint used and restraint not used. Overall, 10% of all vehicle occupants were killed or injured. A breakdown into restraint usage shows only 10% of those restrained were killed or injured, compared to 51% of those not restrained. Comparing the percentages killed or injured in the "Restraint Used" and "Restraint Not Used" categories shows the benefit of wearing a safety belt. The "NOT APPLICABLE" category includes occupants in vehicles that normally do not contain safety restraints, occupants where safety restraints usage was not indicated, occupants not in an appropriate position, or pedestrians and pedalcyclist.
23
ALL FRONT SEATDRIVERS & PASSENGERS
CHILDREN UNDER FOUR YEARS OF AGE
2012 84 98
2011 82 97
2010 80 96
2009 80 99
2008 73 98
PERCENT USING SAFETY BELTSYEAR
Note: There were 17,290 crashes involving deployment of front air bags and 2,585 crashes involving side air bag deployment.
Of the 559 vehicle occupants fatally injured in collisions in 2012 in a position where a safety restraint was available, only 237 were using safety restraints - an overall usage rate of 42% for fatalities.
NUMBER % OFTOTAL NUMBER % OF
TOTAL NUMBER % OFTOTAL NUMBER % OF
TOTAL
KILLED 746 0.2 237 0.1 322 4.8 187 0.2
INCAPACITATINGINJURY 3,825 1.0 2,409 0.8 729 10.8 687 0.8
NON-INCAPACITATINGINJURY 12,080 3.2 9,477 3.3 1,165 17.3 1,438 1.7
POSSIBLE INJURY 19,860 5.3 17,166 6.0 1,246 18.5 1,448 1.7
NOT INJURED 340,014 90.3 254,659 89.7 3,264 48.5 82,091 95.6
TOTAL 376,525 100.0 283,948 100.0 6,726 100.0 85,851 100.0
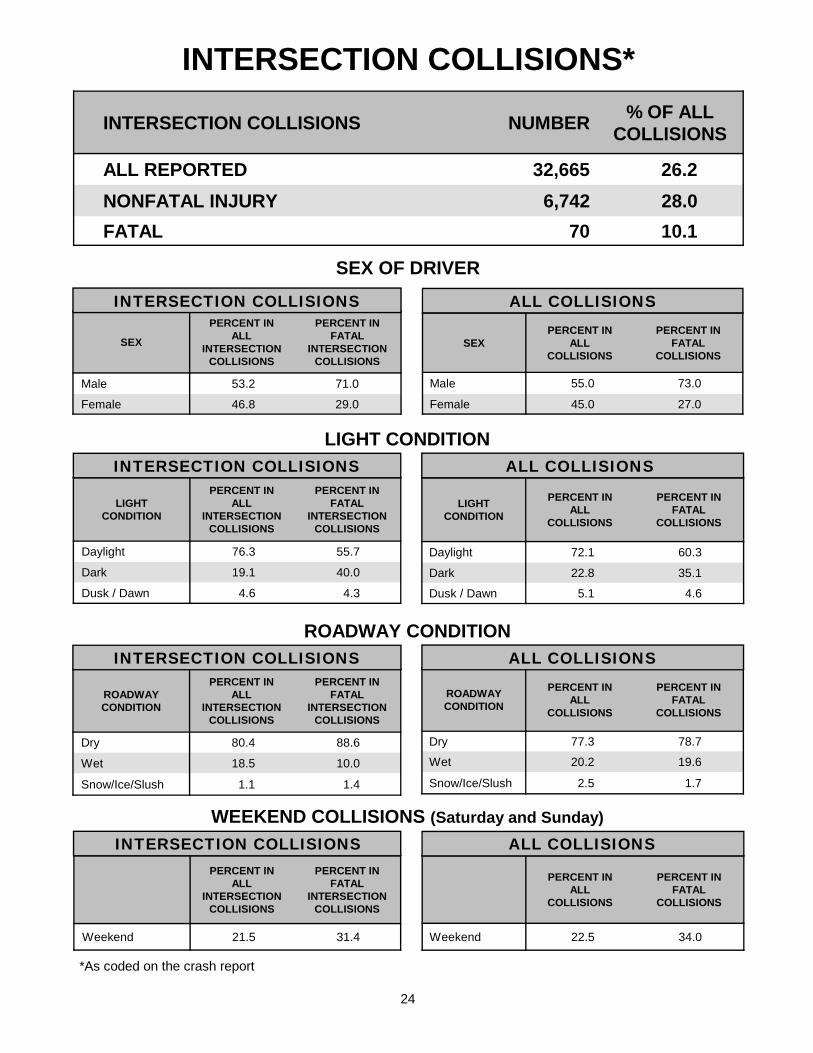
INTERSECTION COLLISIONS NUMBER% OF ALL
COLLISIONS
ALL REPORTED 32,665 26.2
NONFATAL INJURY 6,742 28.0
FATAL 70 10.1
INTERSECTION COLLISIONS*
24
*As coded on the crash report
SEX OF DRIVER
LIGHT CONDITION
ROADWAY CONDITION
WEEKEND COLLISIONS (Saturday and Sunday)
ALL COLLISIONS
SEXPERCENT IN
ALLCOLLISIONS
PERCENT INFATAL
COLLISIONS
Male 55.0 73.0
Female 45.0 27.0
SEX
PERCENT INALL
INTERSECTIONCOLLISIONS
PERCENT INFATAL
INTERSECTIONCOLLISIONS
Male 53.2 71.0
Female 46.8 29.0
INTERSECTION COLLISIONS
PERCENT INALL
COLLISIONS
PERCENT INFATAL
COLLISIONS
Weekend 22.5 34.0
ALL COLLISIONSPERCENT IN
ALLINTERSECTION
COLLISIONS
PERCENT INFATAL
INTERSECTIONCOLLISIONS
Weekend 21.5 31.4
INTERSECTION COLLISIONS
LIGHTCONDITION
PERCENT INALL
COLLISIONS
PERCENT INFATAL
COLLISIONS
Daylight 72.1 60.3
Dark 22.8 35.1
Dusk / Dawn 5.1 4.6
ALL COLLISIONS
LIGHTCONDITION
PERCENT INALL
INTERSECTIONCOLLISIONS
PERCENT INFATAL
INTERSECTIONCOLLISIONS
Daylight 76.3 55.7
Dark 19.1 40.0
Dusk / Dawn 4.6 4.3
INTERSECTION COLLISIONS
ROADWAYCONDITION
PERCENT INALL
COLLISIONS
PERCENT INFATAL
COLLISIONS
Dry 77.3 78.7
Wet 20.2 19.6
Snow/Ice/Slush 2.5 1.7
ALL COLLISIONS
ROADWAYCONDITION
PERCENT INALL
INTERSECTIONCOLLISIONS
PERCENT INFATAL
INTERSECTIONCOLLISIONS
Dry 80.4 88.6
Wet 18.5 10.0
Snow/Ice/Slush 1.1 1.4
INTERSECTION COLLISIONS
CONTRIBUTING
FACTORS

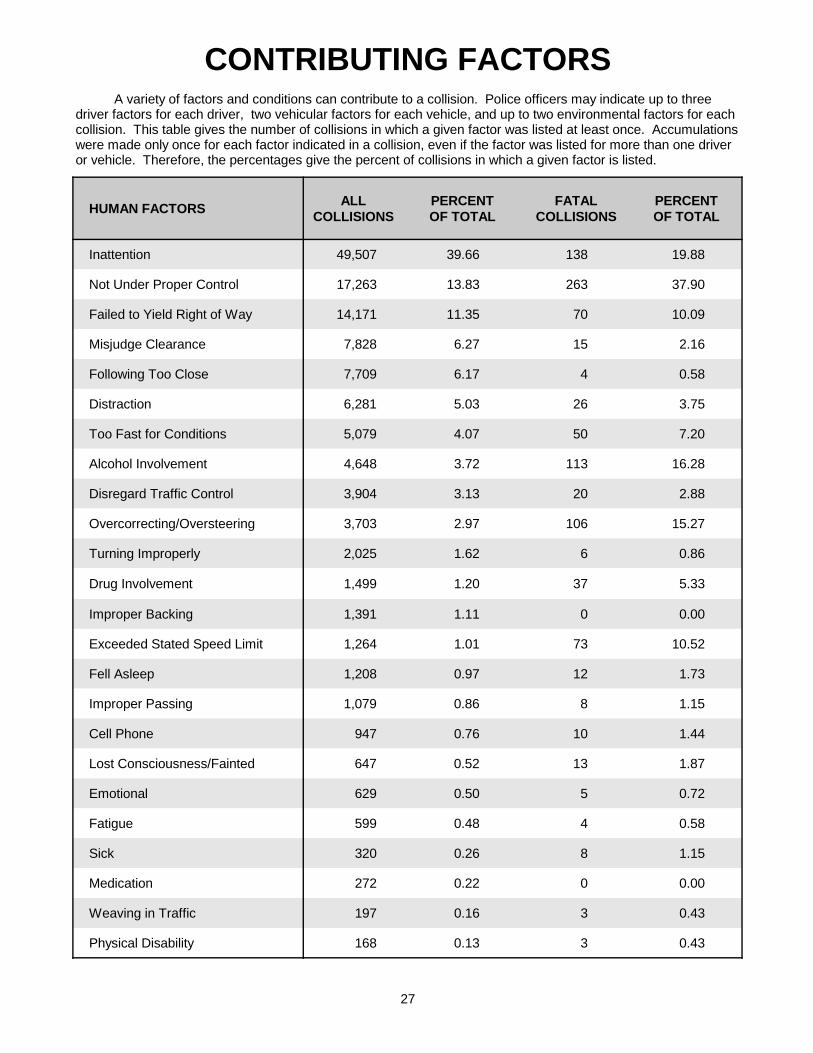
HUMAN FACTORSALL
COLLISIONSPERCENTOF TOTAL
FATALCOLLISIONS
PERCENTOF TOTAL
Inattention 49,507 39.66 138 19.88
Not Under Proper Control 17,263 13.83 263 37.90
Failed to Yield Right of Way 14,171 11.35 70 10.09
Misjudge Clearance 7,828 6.27 15 2.16
Following Too Close 7,709 6.17 4 0.58
Distraction 6,281 5.03 26 3.75
Too Fast for Conditions 5,079 4.07 50 7.20
Alcohol Involvement 4,648 3.72 113 16.28
Disregard Traffic Control 3,904 3.13 20 2.88
Overcorrecting/Oversteering 3,703 2.97 106 15.27
Turning Improperly 2,025 1.62 6 0.86
Drug Involvement 1,499 1.20 37 5.33
Improper Backing 1,391 1.11 0 0.00
Exceeded Stated Speed Limit 1,264 1.01 73 10.52
Fell Asleep 1,208 0.97 12 1.73
Improper Passing 1,079 0.86 8 1.15
Cell Phone 947 0.76 10 1.44
Lost Consciousness/Fainted 647 0.52 13 1.87
Emotional 629 0.50 5 0.72
Fatigue 599 0.48 4 0.58
Sick 320 0.26 8 1.15
Medication 272 0.22 0 0.00
Weaving in Traffic 197 0.16 3 0.43
Physical Disability 168 0.13 3 0.43
CONTRIBUTING FACTORSA variety of factors and conditions can contribute to a collision. Police officers may indicate up to three
driver factors for each driver, two vehicular factors for each vehicle, and up to two environmental factors for each collision. This table gives the number of collisions in which a given factor was listed at least once. Accumulations were made only once for each factor indicated in a collision, even if the factor was listed for more than one driver or vehicle. Therefore, the percentages give the percent of collisions in which a given factor is listed.
27
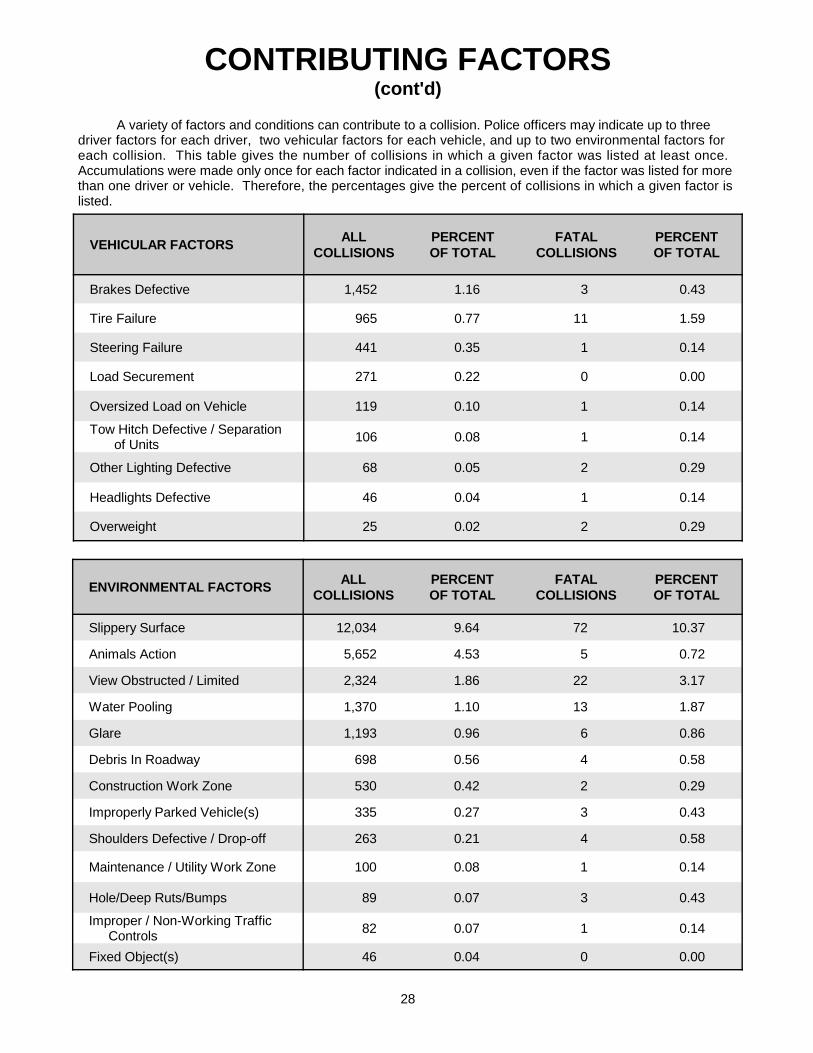
VEHICULAR FACTORSALL
COLLISIONSPERCENTOF TOTAL
FATALCOLLISIONS
PERCENTOF TOTAL
Brakes Defective 1,452 1.16 3 0.43
Tire Failure 965 0.77 11 1.59
Steering Failure 441 0.35 1 0.14
Load Securement 271 0.22 0 0.00
Oversized Load on Vehicle 119 0.10 1 0.14
Tow Hitch Defective / Separation of Units
106 0.08 1 0.14
Other Lighting Defective 68 0.05 2 0.29
Headlights Defective 46 0.04 1 0.14
Overweight 25 0.02 2 0.29
CONTRIBUTING FACTORS(cont'd)
A variety of factors and conditions can contribute to a collision. Police officers may indicate up to three driver factors for each driver, two vehicular factors for each vehicle, and up to two environmental factors for each collision. This table gives the number of collisions in which a given factor was listed at least once. Accumulations were made only once for each factor indicated in a collision, even if the factor was listed for more than one driver or vehicle. Therefore, the percentages give the percent of collisions in which a given factor is listed.
28
ENVIRONMENTAL FACTORSALL
COLLISIONSPERCENTOF TOTAL
FATALCOLLISIONS
PERCENTOF TOTAL
Slippery Surface 12,034 9.64 72 10.37
Animals Action 5,652 4.53 5 0.72
View Obstructed / Limited 2,324 1.86 22 3.17
Water Pooling 1,370 1.10 13 1.87
Glare 1,193 0.96 6 0.86
Debris In Roadway 698 0.56 4 0.58
Construction Work Zone 530 0.42 2 0.29
Improperly Parked Vehicle(s) 335 0.27 3 0.43
Shoulders Defective / Drop-off 263 0.21 4 0.58
Maintenance / Utility Work Zone 100 0.08 1 0.14
Hole/Deep Ruts/Bumps 89 0.07 3 0.43
Improper / Non-Working Traffic Controls
82 0.07 1 0.14
Fixed Object(s) 46 0.04 0 0.00
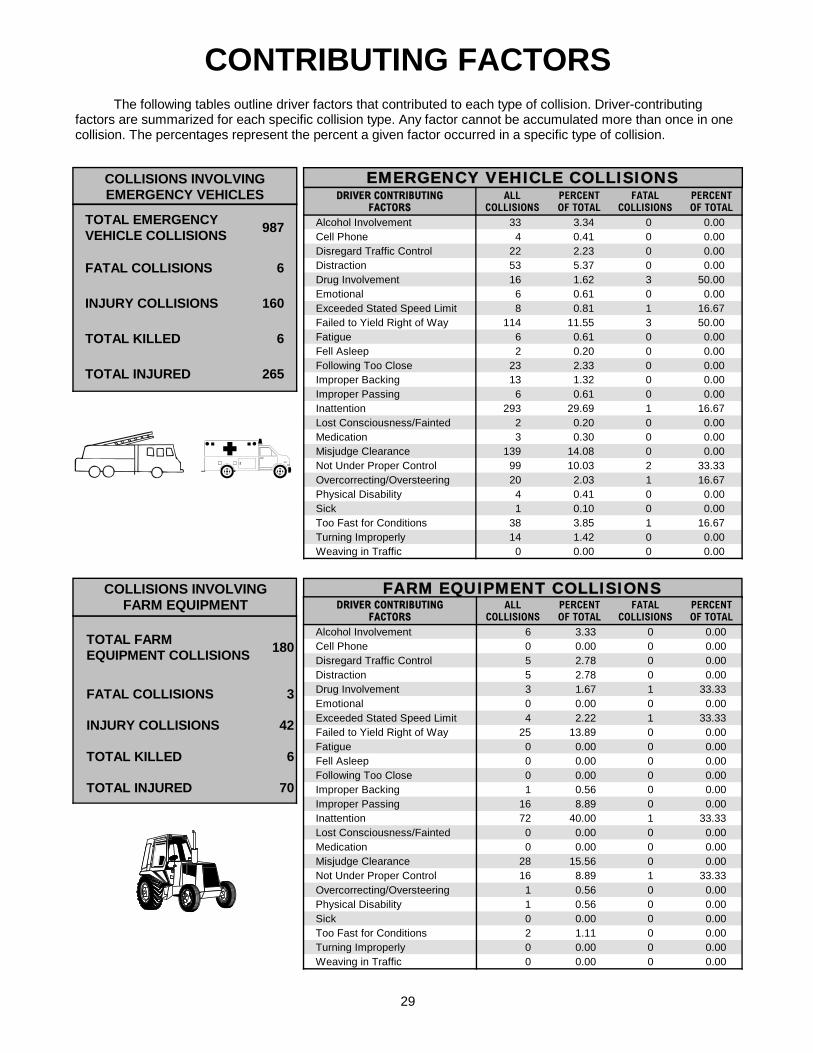
CONTRIBUTING FACTORSThe following tables outline driver factors that contributed to each type of collision. Driver-contributing
factors are summarized for each specific collision type. Any factor cannot be accumulated more than once in one collision. The percentages represent the percent a given factor occurred in a specific type of collision.
29
EMERGENCY VEHICLE COLLISIONSDRIVER CONTRIBUTING
FACTORSALL
COLLISIONSPERCENTOF TOTAL
FATALCOLLISIONS
PERCENTOF TOTAL
Alcohol Involvement 33 3.34 0 0.00Cell Phone 4 0.41 0 0.00Disregard Traffic Control 22 2.23 0 0.00Distraction 53 5.37 0 0.00Drug Involvement 16 1.62 3 50.00Emotional 6 0.61 0 0.00Exceeded Stated Speed Limit 8 0.81 1 16.67Failed to Yield Right of Way 114 11.55 3 50.00Fatigue 6 0.61 0 0.00Fell Asleep 2 0.20 0 0.00Following Too Close 23 2.33 0 0.00Improper Backing 13 1.32 0 0.00Improper Passing 6 0.61 0 0.00Inattention 293 29.69 1 16.67Lost Consciousness/Fainted 2 0.20 0 0.00Medication 3 0.30 0 0.00Misjudge Clearance 139 14.08 0 0.00Not Under Proper Control 99 10.03 2 33.33Overcorrecting/Oversteering 20 2.03 1 16.67Physical Disability 4 0.41 0 0.00Sick 1 0.10 0 0.00Too Fast for Conditions 38 3.85 1 16.67Turning Improperly 14 1.42 0 0.00Weaving in Traffic 0 0.00 0 0.00
TOTAL FARM EQUIPMENT COLLISIONS
180
FATAL COLLISIONS 3
INJURY COLLISIONS 42
TOTAL KILLED 6
TOTAL INJURED 70
COLLISIONS INVOLVINGFARM EQUIPMENT
TOTAL EMERGENCY VEHICLE COLLISIONS
987
FATAL COLLISIONS 6
INJURY COLLISIONS 160
TOTAL KILLED 6
TOTAL INJURED 265
COLLISIONS INVOLVINGEMERGENCY VEHICLES
FARM EQUIPMENT COLLISIONSDRIVER CONTRIBUTING
FACTORSALL
COLLISIONSPERCENTOF TOTAL
FATALCOLLISIONS
PERCENTOF TOTAL
Alcohol Involvement 6 3.33 0 0.00Cell Phone 0 0.00 0 0.00Disregard Traffic Control 5 2.78 0 0.00Distraction 5 2.78 0 0.00Drug Involvement 3 1.67 1 33.33Emotional 0 0.00 0 0.00Exceeded Stated Speed Limit 4 2.22 1 33.33Failed to Yield Right of Way 25 13.89 0 0.00Fatigue 0 0.00 0 0.00Fell Asleep 0 0.00 0 0.00Following Too Close 0 0.00 0 0.00Improper Backing 1 0.56 0 0.00Improper Passing 16 8.89 0 0.00Inattention 72 40.00 1 33.33Lost Consciousness/Fainted 0 0.00 0 0.00Medication 0 0.00 0 0.00Misjudge Clearance 28 15.56 0 0.00Not Under Proper Control 16 8.89 1 33.33Overcorrecting/Oversteering 1 0.56 0 0.00Physical Disability 1 0.56 0 0.00Sick 0 0.00 0 0.00Too Fast for Conditions 2 1.11 0 0.00Turning Improperly 0 0.00 0 0.00Weaving in Traffic 0 0.00 0 0.00
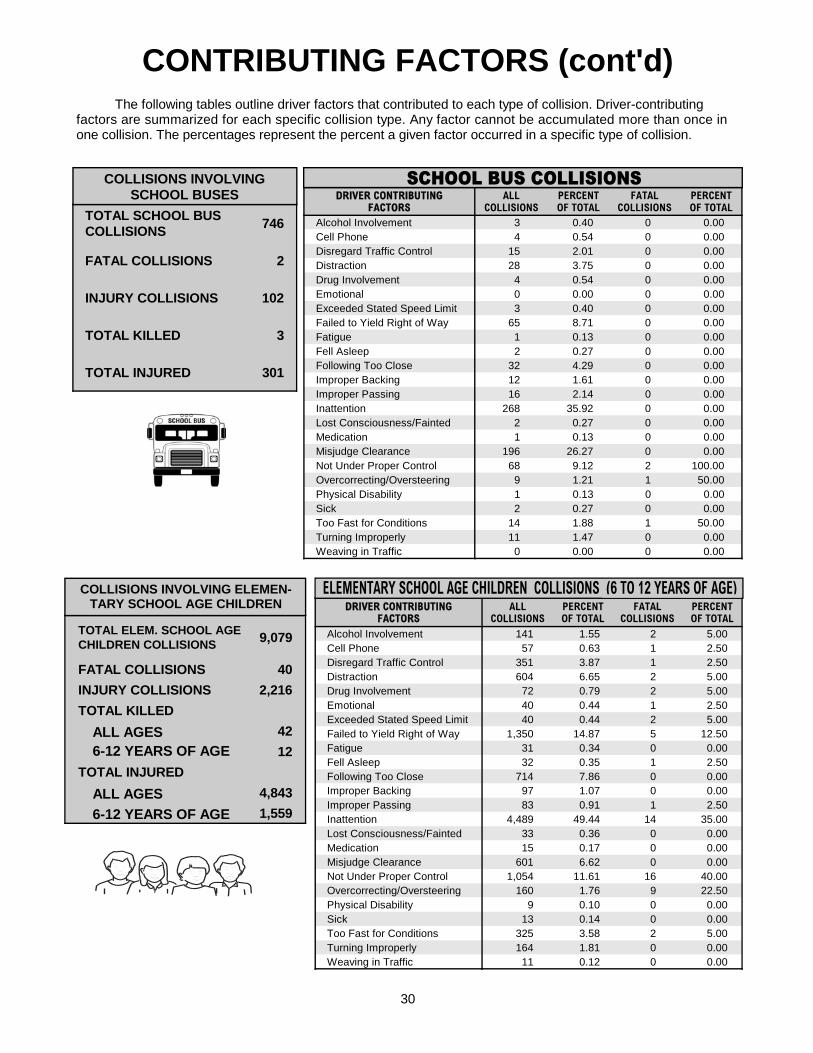
TOTAL ELEM. SCHOOL AGE CHILDREN COLLISIONS
9,079
FATAL COLLISIONS 40
INJURY COLLISIONS 2,216
TOTAL KILLED
42
12
TOTAL INJURED
4,843
1,559
COLLISIONS INVOLVING ELEMEN-TARY SCHOOL AGE CHILDREN
6-12 YEARS OF AGE
6-12 YEARS OF AGE
ALL AGES
ALL AGES
The following tables outline driver factors that contributed to each type of collision. Driver-contributing factors are summarized for each specific collision type. Any factor cannot be accumulated more than once in one collision. The percentages represent the percent a given factor occurred in a specific type of collision.
CONTRIBUTING FACTORS (cont'd)
30
DRIVER CONTRIBUTING FACTORS
ALLCOLLISIONS
PERCENTOF TOTAL
FATALCOLLISIONS
PERCENTOF TOTAL
Alcohol Involvement 3 0.40 0 0.00Cell Phone 4 0.54 0 0.00Disregard Traffic Control 15 2.01 0 0.00Distraction 28 3.75 0 0.00Drug Involvement 4 0.54 0 0.00Emotional 0 0.00 0 0.00Exceeded Stated Speed Limit 3 0.40 0 0.00Failed to Yield Right of Way 65 8.71 0 0.00Fatigue 1 0.13 0 0.00Fell Asleep 2 0.27 0 0.00Following Too Close 32 4.29 0 0.00Improper Backing 12 1.61 0 0.00Improper Passing 16 2.14 0 0.00Inattention 268 35.92 0 0.00Lost Consciousness/Fainted 2 0.27 0 0.00Medication 1 0.13 0 0.00Misjudge Clearance 196 26.27 0 0.00Not Under Proper Control 68 9.12 2 100.00Overcorrecting/Oversteering 9 1.21 1 50.00Physical Disability 1 0.13 0 0.00Sick 2 0.27 0 0.00Too Fast for Conditions 14 1.88 1 50.00Turning Improperly 11 1.47 0 0.00Weaving in Traffic 0 0.00 0 0.00
TOTAL SCHOOL BUS COLLISIONS
746
FATAL COLLISIONS 2
INJURY COLLISIONS 102
TOTAL KILLED 3
TOTAL INJURED 301
COLLISIONS INVOLVINGSCHOOL BUSES
DRIVER CONTRIBUTING FACTORS
ALLCOLLISIONS
PERCENTOF TOTAL
FATALCOLLISIONS
PERCENTOF TOTAL
Alcohol Involvement 141 1.55 2 5.00Cell Phone 57 0.63 1 2.50Disregard Traffic Control 351 3.87 1 2.50Distraction 604 6.65 2 5.00Drug Involvement 72 0.79 2 5.00Emotional 40 0.44 1 2.50Exceeded Stated Speed Limit 40 0.44 2 5.00Failed to Yield Right of Way 1,350 14.87 5 12.50Fatigue 31 0.34 0 0.00Fell Asleep 32 0.35 1 2.50Following Too Close 714 7.86 0 0.00Improper Backing 97 1.07 0 0.00Improper Passing 83 0.91 1 2.50Inattention 4,489 49.44 14 35.00Lost Consciousness/Fainted 33 0.36 0 0.00Medication 15 0.17 0 0.00Misjudge Clearance 601 6.62 0 0.00Not Under Proper Control 1,054 11.61 16 40.00Overcorrecting/Oversteering 160 1.76 9 22.50Physical Disability 9 0.10 0 0.00Sick 13 0.14 0 0.00Too Fast for Conditions 325 3.58 2 5.00Turning Improperly 164 1.81 0 0.00Weaving in Traffic 11 0.12 0 0.00
The following tables outline driver factors that contributed to each type of collision. Driver-contributing factors are summarized for each specific collision type. Any factor cannot be accumulated more than once in one collision. The percentages represent the percent a given factor occurred in a specific type of collision.
CONTRIBUTING FACTORS (cont'd)
31
DRIVER CONTRIBUTING FACTORS
ALLCOLLISIONS
PERCENTOF TOTAL
FATALCOLLISIONS
PERCENTOF TOTAL
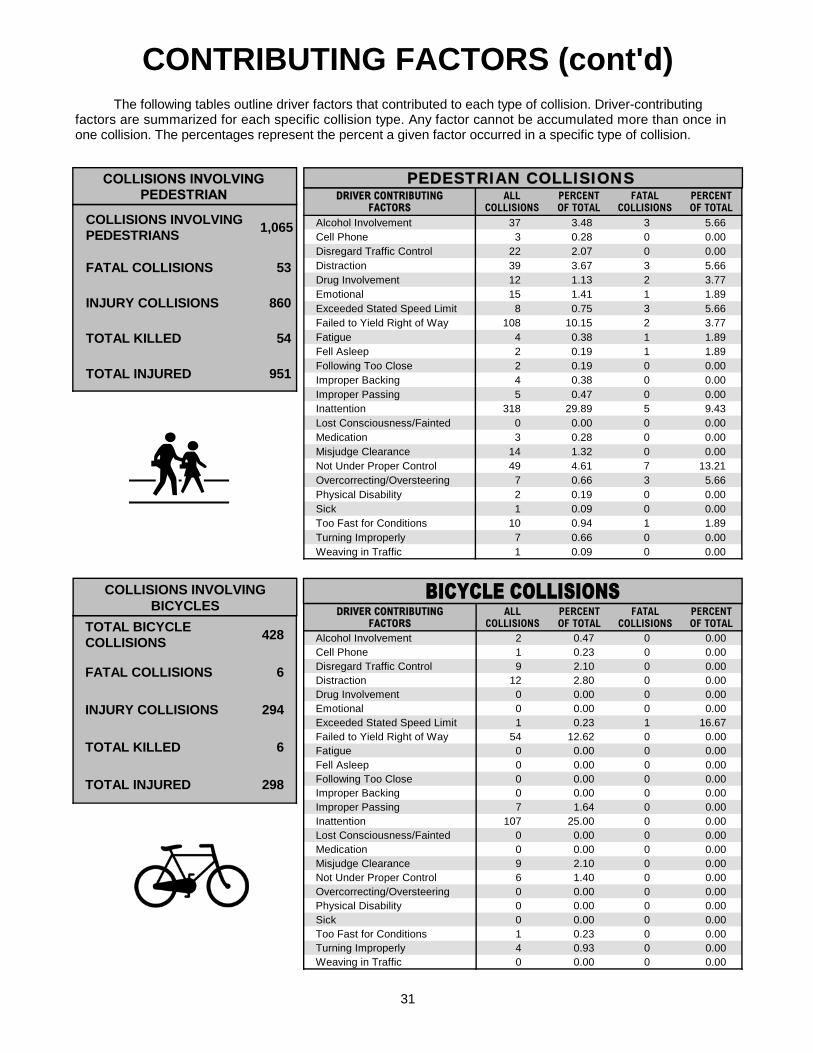
Alcohol Involvement 37 3.48 3 5.66Cell Phone 3 0.28 0 0.00Disregard Traffic Control 22 2.07 0 0.00Distraction 39 3.67 3 5.66Drug Involvement 12 1.13 2 3.77Emotional 15 1.41 1 1.89Exceeded Stated Speed Limit 8 0.75 3 5.66Failed to Yield Right of Way 108 10.15 2 3.77Fatigue 4 0.38 1 1.89Fell Asleep 2 0.19 1 1.89Following Too Close 2 0.19 0 0.00Improper Backing 4 0.38 0 0.00Improper Passing 5 0.47 0 0.00Inattention 318 29.89 5 9.43Lost Consciousness/Fainted 0 0.00 0 0.00Medication 3 0.28 0 0.00Misjudge Clearance 14 1.32 0 0.00Not Under Proper Control 49 4.61 7 13.21Overcorrecting/Oversteering 7 0.66 3 5.66Physical Disability 2 0.19 0 0.00Sick 1 0.09 0 0.00Too Fast for Conditions 10 0.94 1 1.89Turning Improperly 7 0.66 0 0.00Weaving in Traffic 1 0.09 0 0.00
PEDESTRIAN COLLISIONS
DRIVER CONTRIBUTING FACTORS
ALLCOLLISIONS
PERCENTOF TOTAL
FATALCOLLISIONS
PERCENTOF TOTAL
Alcohol Involvement 2 0.47 0 0.00Cell Phone 1 0.23 0 0.00Disregard Traffic Control 9 2.10 0 0.00Distraction 12 2.80 0 0.00Drug Involvement 0 0.00 0 0.00Emotional 0 0.00 0 0.00Exceeded Stated Speed Limit 1 0.23 1 16.67Failed to Yield Right of Way 54 12.62 0 0.00Fatigue 0 0.00 0 0.00Fell Asleep 0 0.00 0 0.00Following Too Close 0 0.00 0 0.00Improper Backing 0 0.00 0 0.00Improper Passing 7 1.64 0 0.00Inattention 107 25.00 0 0.00Lost Consciousness/Fainted 0 0.00 0 0.00Medication 0 0.00 0 0.00Misjudge Clearance 9 2.10 0 0.00Not Under Proper Control 6 1.40 0 0.00Overcorrecting/Oversteering 0 0.00 0 0.00Physical Disability 0 0.00 0 0.00Sick 0 0.00 0 0.00Too Fast for Conditions 1 0.23 0 0.00Turning Improperly 4 0.93 0 0.00Weaving in Traffic 0 0.00 0 0.00
TOTAL BICYCLECOLLISIONS
428
FATAL COLLISIONS 6
INJURY COLLISIONS 294
TOTAL KILLED 6
TOTAL INJURED 298
COLLISIONS INVOLVINGBICYCLES
COLLISIONS INVOLVING PEDESTRIANS
1,065
FATAL COLLISIONS 53
INJURY COLLISIONS 860
TOTAL KILLED 54
TOTAL INJURED 951
The following tables outline driver factors that contributed to each type of collision. Driver-contributing factors are summarized for each specific collision type. Any factor cannot be accumulated more than once in one collision. The percentages represent the percent a given factor occurred in a specific type of collision.
32
CONTRIBUTING FACTORS (cont'd)
DRIVER CONTRIBUTING FACTORS
ALLCOLLISIONS
PERCENTOF TOTAL
FATALCOLLISIONS
PERCENTOF TOTAL
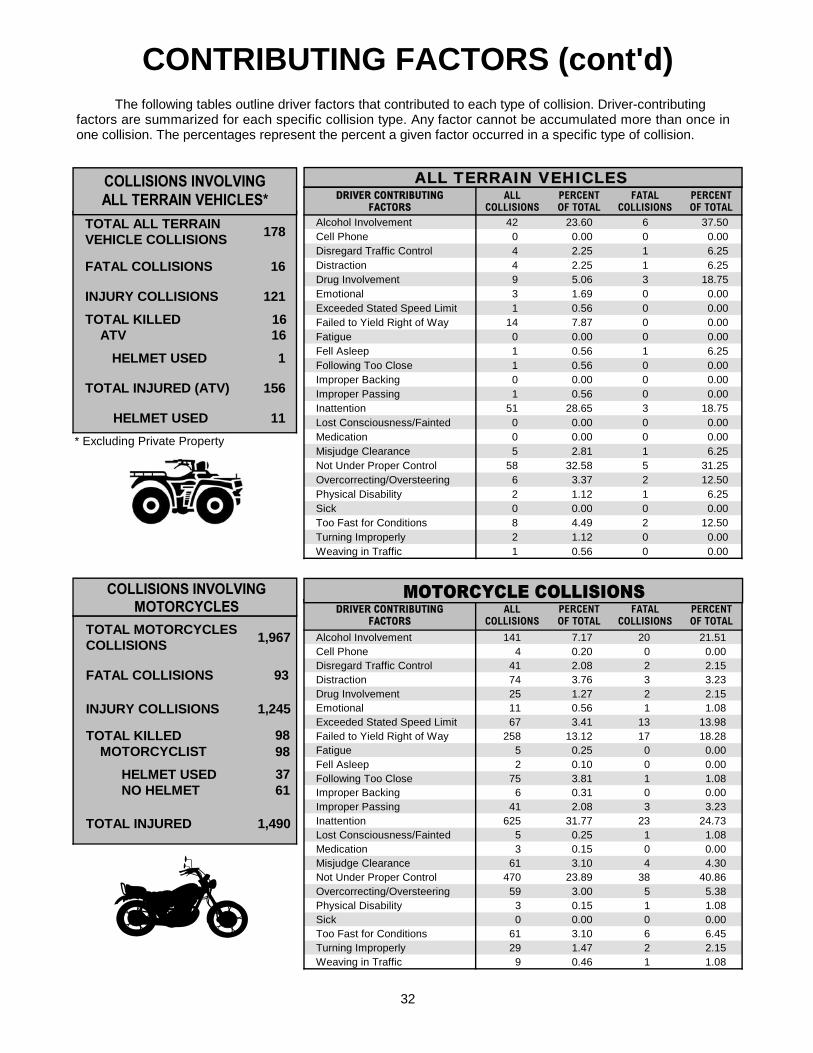
Alcohol Involvement 42 23.60 6 37.50Cell Phone 0 0.00 0 0.00Disregard Traffic Control 4 2.25 1 6.25Distraction 4 2.25 1 6.25Drug Involvement 9 5.06 3 18.75Emotional 3 1.69 0 0.00Exceeded Stated Speed Limit 1 0.56 0 0.00Failed to Yield Right of Way 14 7.87 0 0.00Fatigue 0 0.00 0 0.00Fell Asleep 1 0.56 1 6.25Following Too Close 1 0.56 0 0.00Improper Backing 0 0.00 0 0.00Improper Passing 1 0.56 0 0.00Inattention 51 28.65 3 18.75Lost Consciousness/Fainted 0 0.00 0 0.00Medication 0 0.00 0 0.00Misjudge Clearance 5 2.81 1 6.25Not Under Proper Control 58 32.58 5 31.25Overcorrecting/Oversteering 6 3.37 2 12.50Physical Disability 2 1.12 1 6.25Sick 0 0.00 0 0.00Too Fast for Conditions 8 4.49 2 12.50Turning Improperly 2 1.12 0 0.00Weaving in Traffic 1 0.56 0 0.00
DRIVER CONTRIBUTING FACTORS
ALLCOLLISIONS
PERCENTOF TOTAL
FATALCOLLISIONS
PERCENTOF TOTAL
Alcohol Involvement 141 7.17 20 21.51Cell Phone 4 0.20 0 0.00Disregard Traffic Control 41 2.08 2 2.15Distraction 74 3.76 3 3.23Drug Involvement 25 1.27 2 2.15Emotional 11 0.56 1 1.08Exceeded Stated Speed Limit 67 3.41 13 13.98Failed to Yield Right of Way 258 13.12 17 18.28Fatigue 5 0.25 0 0.00Fell Asleep 2 0.10 0 0.00Following Too Close 75 3.81 1 1.08Improper Backing 6 0.31 0 0.00Improper Passing 41 2.08 3 3.23Inattention 625 31.77 23 24.73Lost Consciousness/Fainted 5 0.25 1 1.08Medication 3 0.15 0 0.00Misjudge Clearance 61 3.10 4 4.30Not Under Proper Control 470 23.89 38 40.86Overcorrecting/Oversteering 59 3.00 5 5.38Physical Disability 3 0.15 1 1.08Sick 0 0.00 0 0.00Too Fast for Conditions 61 3.10 6 6.45Turning Improperly 29 1.47 2 2.15Weaving in Traffic 9 0.46 1 1.08
TOTAL ALL TERRAINVEHICLE COLLISIONS
178
FATAL COLLISIONS 16
INJURY COLLISIONS 121
TOTAL KILLEDATV
HELMET USED 1
TOTAL INJURED (ATV) 156
HELMET USED 11
TOTAL MOTORCYCLES COLLISIONS
1,967
FATAL COLLISIONS 93
INJURY COLLISIONS 1,245
TOTAL KILLEDMOTORCYCLIST
HELMET USEDNO HELMET
TOTAL INJURED 1,490
98
1616
98
61
* Excluding Private Property
ALL TERRAIN VEHICLES
37
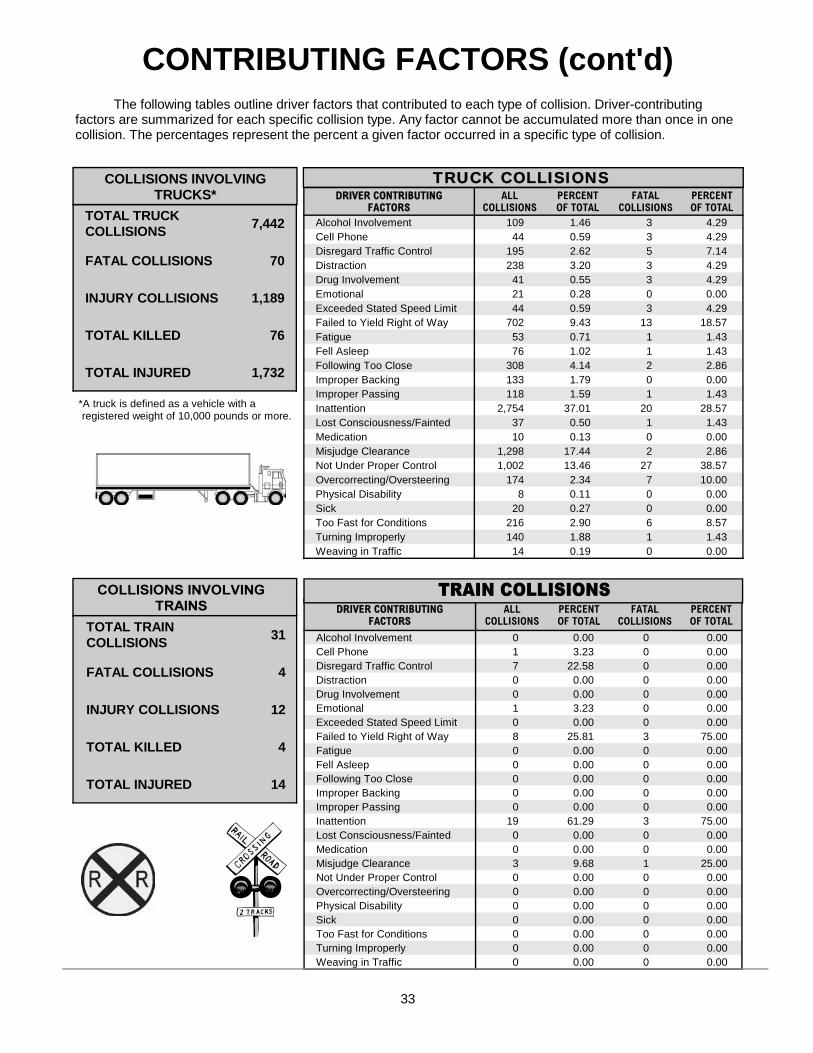
TOTAL TRUCK COLLISIONS
7,442
FATAL COLLISIONS 70
INJURY COLLISIONS 1,189
TOTAL KILLED 76
TOTAL INJURED 1,732
COLLISIONS INVOLVINGTRUCKS* DRIVER CONTRIBUTING
FACTORSALL
COLLISIONSPERCENTOF TOTAL
FATALCOLLISIONS
PERCENTOF TOTAL
Alcohol Involvement 109 1.46 3 4.29Cell Phone 44 0.59 3 4.29Disregard Traffic Control 195 2.62 5 7.14Distraction 238 3.20 3 4.29Drug Involvement 41 0.55 3 4.29Emotional 21 0.28 0 0.00Exceeded Stated Speed Limit 44 0.59 3 4.29Failed to Yield Right of Way 702 9.43 13 18.57Fatigue 53 0.71 1 1.43Fell Asleep 76 1.02 1 1.43Following Too Close 308 4.14 2 2.86Improper Backing 133 1.79 0 0.00Improper Passing 118 1.59 1 1.43Inattention 2,754 37.01 20 28.57Lost Consciousness/Fainted 37 0.50 1 1.43Medication 10 0.13 0 0.00Misjudge Clearance 1,298 17.44 2 2.86Not Under Proper Control 1,002 13.46 27 38.57Overcorrecting/Oversteering 174 2.34 7 10.00Physical Disability 8 0.11 0 0.00Sick 20 0.27 0 0.00Too Fast for Conditions 216 2.90 6 8.57Turning Improperly 140 1.88 1 1.43Weaving in Traffic 14 0.19 0 0.00
33
The following tables outline driver factors that contributed to each type of collision. Driver-contributing factors are summarized for each specific collision type. Any factor cannot be accumulated more than once in one collision. The percentages represent the percent a given factor occurred in a specific type of collision.
DRIVER CONTRIBUTING FACTORS
ALLCOLLISIONS
PERCENTOF TOTAL
FATALCOLLISIONS
PERCENTOF TOTAL
Alcohol Involvement 0 0.00 0 0.00Cell Phone 1 3.23 0 0.00Disregard Traffic Control 7 22.58 0 0.00Distraction 0 0.00 0 0.00Drug Involvement 0 0.00 0 0.00Emotional 1 3.23 0 0.00Exceeded Stated Speed Limit 0 0.00 0 0.00Failed to Yield Right of Way 8 25.81 3 75.00Fatigue 0 0.00 0 0.00Fell Asleep 0 0.00 0 0.00Following Too Close 0 0.00 0 0.00Improper Backing 0 0.00 0 0.00Improper Passing 0 0.00 0 0.00Inattention 19 61.29 3 75.00Lost Consciousness/Fainted 0 0.00 0 0.00Medication 0 0.00 0 0.00Misjudge Clearance 3 9.68 1 25.00Not Under Proper Control 0 0.00 0 0.00Overcorrecting/Oversteering 0 0.00 0 0.00Physical Disability 0 0.00 0 0.00Sick 0 0.00 0 0.00Too Fast for Conditions 0 0.00 0 0.00Turning Improperly 0 0.00 0 0.00Weaving in Traffic 0 0.00 0 0.00
CONTRIBUTING FACTORS (cont'd)
*A truck is defined as a vehicle with a registered weight of 10,000 pounds or more.
TOTAL TRAIN COLLISIONS
31
FATAL COLLISIONS 4
INJURY COLLISIONS 12
TOTAL KILLED 4
TOTAL INJURED 14
TRUCK COLLISIONS
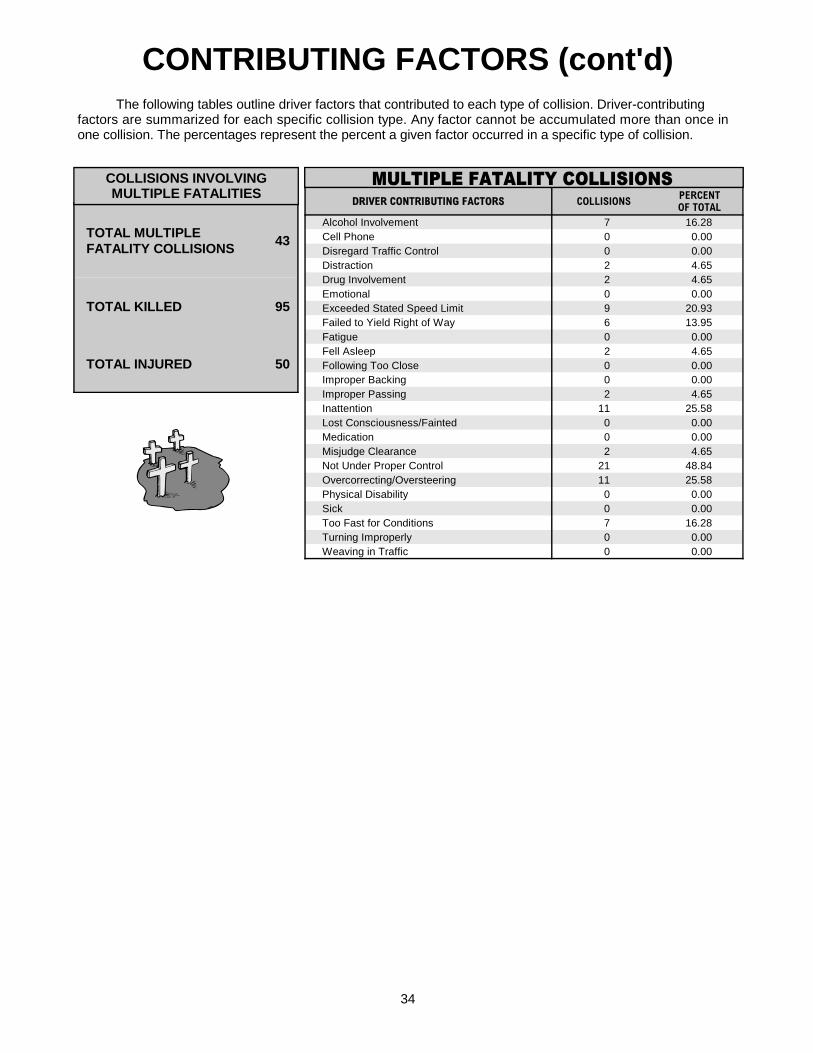
TOTAL MULTIPLE FATALITY COLLISIONS
43
TOTAL KILLED 95
TOTAL INJURED 50
COLLISIONS INVOLVINGMULTIPLE FATALITIES
DRIVER CONTRIBUTING FACTORS COLLISIONSPERCENTOF TOTAL
Alcohol Involvement 7 16.28Cell Phone 0 0.00Disregard Traffic Control 0 0.00Distraction 2 4.65Drug Involvement 2 4.65Emotional 0 0.00Exceeded Stated Speed Limit 9 20.93Failed to Yield Right of Way 6 13.95Fatigue 0 0.00Fell Asleep 2 4.65Following Too Close 0 0.00Improper Backing 0 0.00Improper Passing 2 4.65Inattention 11 25.58Lost Consciousness/Fainted 0 0.00Medication 0 0.00Misjudge Clearance 2 4.65Not Under Proper Control 21 48.84Overcorrecting/Oversteering 11 25.58Physical Disability 0 0.00Sick 0 0.00Too Fast for Conditions 7 16.28Turning Improperly 0 0.00Weaving in Traffic 0 0.00
The following tables outline driver factors that contributed to each type of collision. Driver-contributing factors are summarized for each specific collision type. Any factor cannot be accumulated more than once in one collision. The percentages represent the percent a given factor occurred in a specific type of collision.
CONTRIBUTING FACTORS (cont'd)
34
COLLISIONS
BY
COUNTY

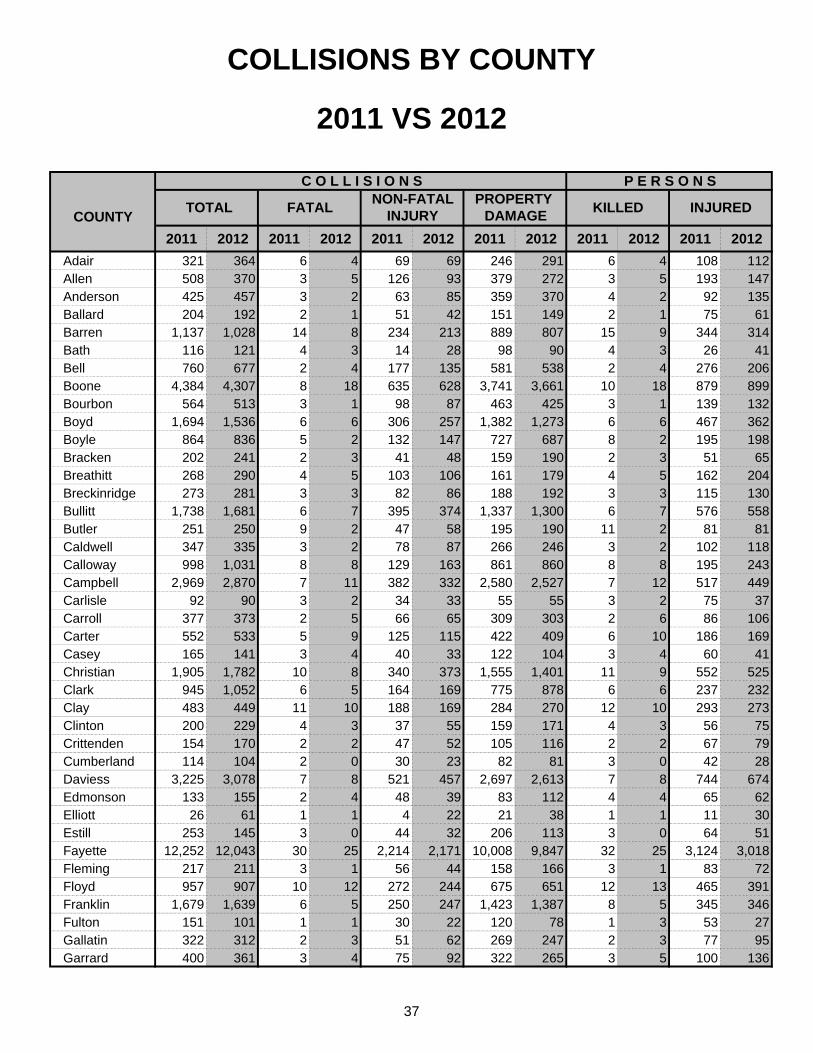
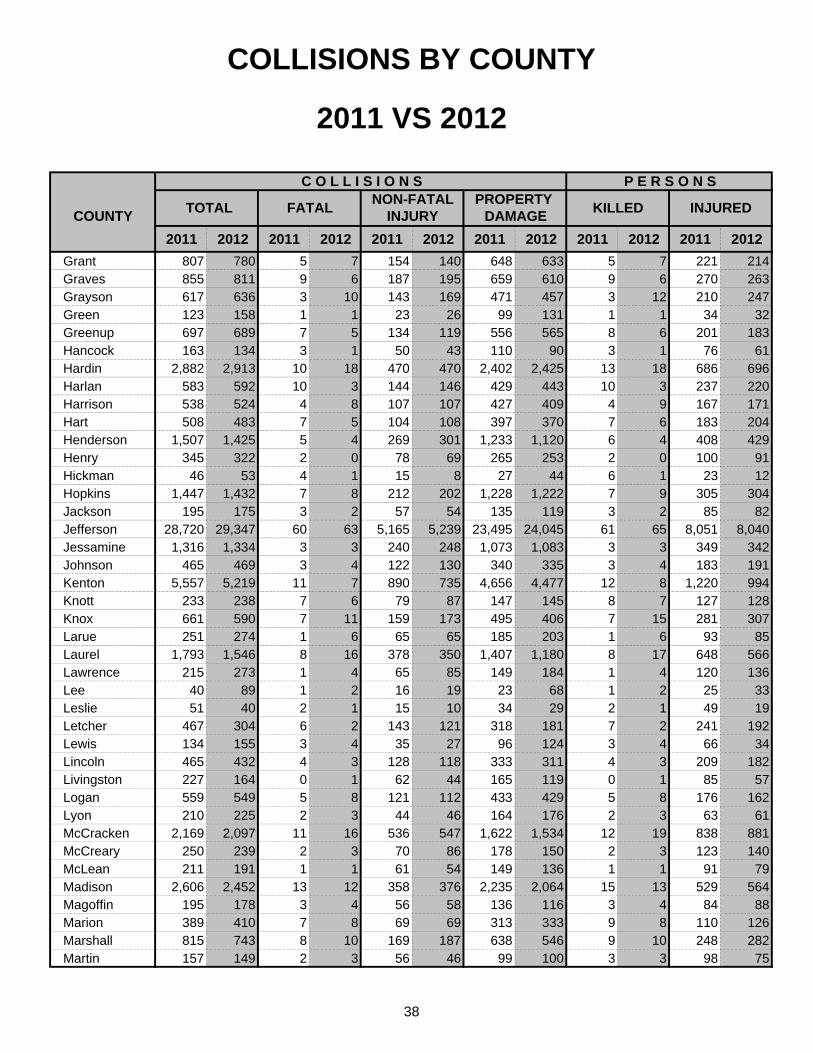
COLLISIONS BY COUNTY
2011 VS 2012
C O L L I S I O N S P E R S O N SNON-FATAL PROPERTY
COUNTY INJURY DAMAGE
2011 2012 2011 2012 2011 2012 2011 2012 2011 2012 2011 2012
Adair 321 364 6 4 69 69 246 291 6 4 108 112Allen 508 370 3 5 126 93 379 272 3 5 193 147Anderson 425 457 3 2 63 85 359 370 4 2 92 135Ballard 204 192 2 1 51 42 151 149 2 1 75 61Barren 1,137 1,028 14 8 234 213 889 807 15 9 344 314Bath 116 121 4 3 14 28 98 90 4 3 26 41Bell 760 677 2 4 177 135 581 538 2 4 276 206Boone 4,384 4,307 8 18 635 628 3,741 3,661 10 18 879 899Bourbon 564 513 3 1 98 87 463 425 3 1 139 132Boyd 1,694 1,536 6 6 306 257 1,382 1,273 6 6 467 362Boyle 864 836 5 2 132 147 727 687 8 2 195 198Bracken 202 241 2 3 41 48 159 190 2 3 51 65Breathitt 268 290 4 5 103 106 161 179 4 5 162 204Breckinridge 273 281 3 3 82 86 188 192 3 3 115 130Bullitt 1,738 1,681 6 7 395 374 1,337 1,300 6 7 576 558Butler 251 250 9 2 47 58 195 190 11 2 81 81Caldwell 347 335 3 2 78 87 266 246 3 2 102 118Calloway 998 1,031 8 8 129 163 861 860 8 8 195 243Campbell 2,969 2,870 7 11 382 332 2,580 2,527 7 12 517 449Carlisle 92 90 3 2 34 33 55 55 3 2 75 37Carroll 377 373 2 5 66 65 309 303 2 6 86 106Carter 552 533 5 9 125 115 422 409 6 10 186 169Casey 165 141 3 4 40 33 122 104 3 4 60 41Christian 1,905 1,782 10 8 340 373 1,555 1,401 11 9 552 525Clark 945 1,052 6 5 164 169 775 878 6 6 237 232Clay 483 449 11 10 188 169 284 270 12 10 293 273Clinton 200 229 4 3 37 55 159 171 4 3 56 75Crittenden 154 170 2 2 47 52 105 116 2 2 67 79Cumberland 114 104 2 0 30 23 82 81 3 0 42 28Daviess 3,225 3,078 7 8 521 457 2,697 2,613 7 8 744 674Edmonson 133 155 2 4 48 39 83 112 4 4 65 62Elliott 26 61 1 1 4 22 21 38 1 1 11 30Estill 253 145 3 0 44 32 206 113 3 0 64 51Fayette 12,252 12,043 30 25 2,214 2,171 10,008 9,847 32 25 3,124 3,018Fleming 217 211 3 1 56 44 158 166 3 1 83 72Floyd 957 907 10 12 272 244 675 651 12 13 465 391Franklin 1,679 1,639 6 5 250 247 1,423 1,387 8 5 345 346Fulton 151 101 1 1 30 22 120 78 1 3 53 27Gallatin 322 312 2 3 51 62 269 247 2 3 77 95Garrard 400 361 3 4 75 92 322 265 3 5 100 136
37
TOTAL FATAL KILLED INJURED
COLLISIONS BY COUNTY
2011 VS 2012
C O L L I S I O N S P E R S O N SNON-FATAL PROPERTY
COUNTY INJURY DAMAGE
2011 2012 2011 2012 2011 2012 2011 2012 2011 2012 2011 2012
Grant 807 780 5 7 154 140 648 633 5 7 221 214Graves 855 811 9 6 187 195 659 610 9 6 270 263Grayson 617 636 3 10 143 169 471 457 3 12 210 247Green 123 158 1 1 23 26 99 131 1 1 34 32Greenup 697 689 7 5 134 119 556 565 8 6 201 183Hancock 163 134 3 1 50 43 110 90 3 1 76 61Hardin 2,882 2,913 10 18 470 470 2,402 2,425 13 18 686 696Harlan 583 592 10 3 144 146 429 443 10 3 237 220Harrison 538 524 4 8 107 107 427 409 4 9 167 171Hart 508 483 7 5 104 108 397 370 7 6 183 204Henderson 1,507 1,425 5 4 269 301 1,233 1,120 6 4 408 429Henry 345 322 2 0 78 69 265 253 2 0 100 91Hickman 46 53 4 1 15 8 27 44 6 1 23 12Hopkins 1,447 1,432 7 8 212 202 1,228 1,222 7 9 305 304Jackson 195 175 3 2 57 54 135 119 3 2 85 82Jefferson 28,720 29,347 60 63 5,165 5,239 23,495 24,045 61 65 8,051 8,040Jessamine 1,316 1,334 3 3 240 248 1,073 1,083 3 3 349 342Johnson 465 469 3 4 122 130 340 335 3 4 183 191Kenton 5,557 5,219 11 7 890 735 4,656 4,477 12 8 1,220 994Knott 233 238 7 6 79 87 147 145 8 7 127 128Knox 661 590 7 11 159 173 495 406 7 15 281 307Larue 251 274 1 6 65 65 185 203 1 6 93 85Laurel 1,793 1,546 8 16 378 350 1,407 1,180 8 17 648 566Lawrence 215 273 1 4 65 85 149 184 1 4 120 136Lee 40 89 1 2 16 19 23 68 1 2 25 33Leslie 51 40 2 1 15 10 34 29 2 1 49 19Letcher 467 304 6 2 143 121 318 181 7 2 241 192Lewis 134 155 3 4 35 27 96 124 3 4 66 34Lincoln 465 432 4 3 128 118 333 311 4 3 209 182Livingston 227 164 0 1 62 44 165 119 0 1 85 57Logan 559 549 5 8 121 112 433 429 5 8 176 162Lyon 210 225 2 3 44 46 164 176 2 3 63 61McCracken 2,169 2,097 11 16 536 547 1,622 1,534 12 19 838 881McCreary 250 239 2 3 70 86 178 150 2 3 123 140McLean 211 191 1 1 61 54 149 136 1 1 91 79Madison 2,606 2,452 13 12 358 376 2,235 2,064 15 13 529 564Magoffin 195 178 3 4 56 58 136 116 3 4 84 88Marion 389 410 7 8 69 69 313 333 9 8 110 126Marshall 815 743 8 10 169 187 638 546 9 10 248 282Martin 157 149 2 3 56 46 99 100 3 3 98 75
38
KILLED INJURED TOTAL FATAL
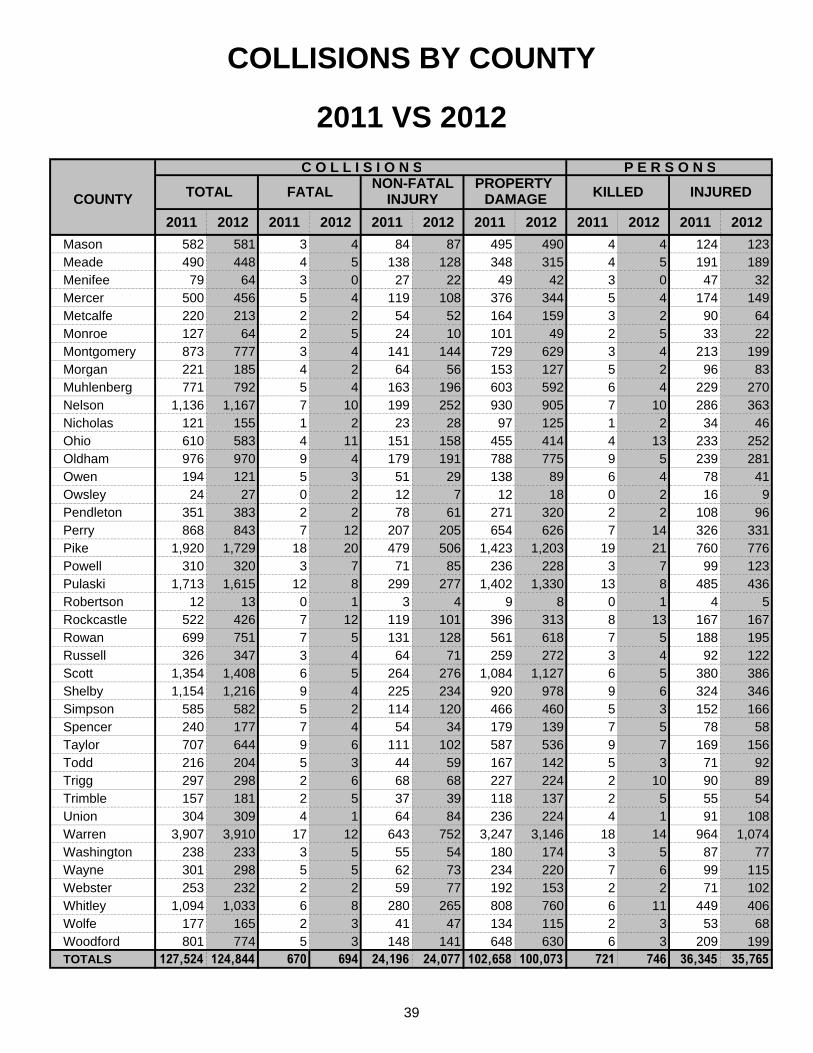
COLLISIONS BY COUNTY
2011 VS 2012
C O L L I S I O N S P E R S O N SNON-FATAL PROPERTY
COUNTY INJURY DAMAGE
2011 2012 2011 2012 2011 2012 2011 2012 2011 2012 2011 2012
Mason 582 581 3 4 84 87 495 490 4 4 124 123Meade 490 448 4 5 138 128 348 315 4 5 191 189Menifee 79 64 3 0 27 22 49 42 3 0 47 32Mercer 500 456 5 4 119 108 376 344 5 4 174 149Metcalfe 220 213 2 2 54 52 164 159 3 2 90 64Monroe 127 64 2 5 24 10 101 49 2 5 33 22Montgomery 873 777 3 4 141 144 729 629 3 4 213 199Morgan 221 185 4 2 64 56 153 127 5 2 96 83Muhlenberg 771 792 5 4 163 196 603 592 6 4 229 270Nelson 1,136 1,167 7 10 199 252 930 905 7 10 286 363Nicholas 121 155 1 2 23 28 97 125 1 2 34 46Ohio 610 583 4 11 151 158 455 414 4 13 233 252Oldham 976 970 9 4 179 191 788 775 9 5 239 281Owen 194 121 5 3 51 29 138 89 6 4 78 41Owsley 24 27 0 2 12 7 12 18 0 2 16 9Pendleton 351 383 2 2 78 61 271 320 2 2 108 96Perry 868 843 7 12 207 205 654 626 7 14 326 331Pike 1,920 1,729 18 20 479 506 1,423 1,203 19 21 760 776Powell 310 320 3 7 71 85 236 228 3 7 99 123Pulaski 1,713 1,615 12 8 299 277 1,402 1,330 13 8 485 436Robertson 12 13 0 1 3 4 9 8 0 1 4 5Rockcastle 522 426 7 12 119 101 396 313 8 13 167 167Rowan 699 751 7 5 131 128 561 618 7 5 188 195Russell 326 347 3 4 64 71 259 272 3 4 92 122Scott 1,354 1,408 6 5 264 276 1,084 1,127 6 5 380 386Shelby 1,154 1,216 9 4 225 234 920 978 9 6 324 346Simpson 585 582 5 2 114 120 466 460 5 3 152 166Spencer 240 177 7 4 54 34 179 139 7 5 78 58Taylor 707 644 9 6 111 102 587 536 9 7 169 156Todd 216 204 5 3 44 59 167 142 5 3 71 92Trigg 297 298 2 6 68 68 227 224 2 10 90 89Trimble 157 181 2 5 37 39 118 137 2 5 55 54Union 304 309 4 1 64 84 236 224 4 1 91 108Warren 3,907 3,910 17 12 643 752 3,247 3,146 18 14 964 1,074Washington 238 233 3 5 55 54 180 174 3 5 87 77Wayne 301 298 5 5 62 73 234 220 7 6 99 115Webster 253 232 2 2 59 77 192 153 2 2 71 102Whitley 1,094 1,033 6 8 280 265 808 760 6 11 449 406Wolfe 177 165 2 3 41 47 134 115 2 3 53 68Woodford 801 774 5 3 148 141 648 630 6 3 209 199TOTALS 127,524 124,844 670 694 24,196 24,077 102,658 100,073 721 746 36,345 35,765
39
KILLED INJURED TOTAL FATAL
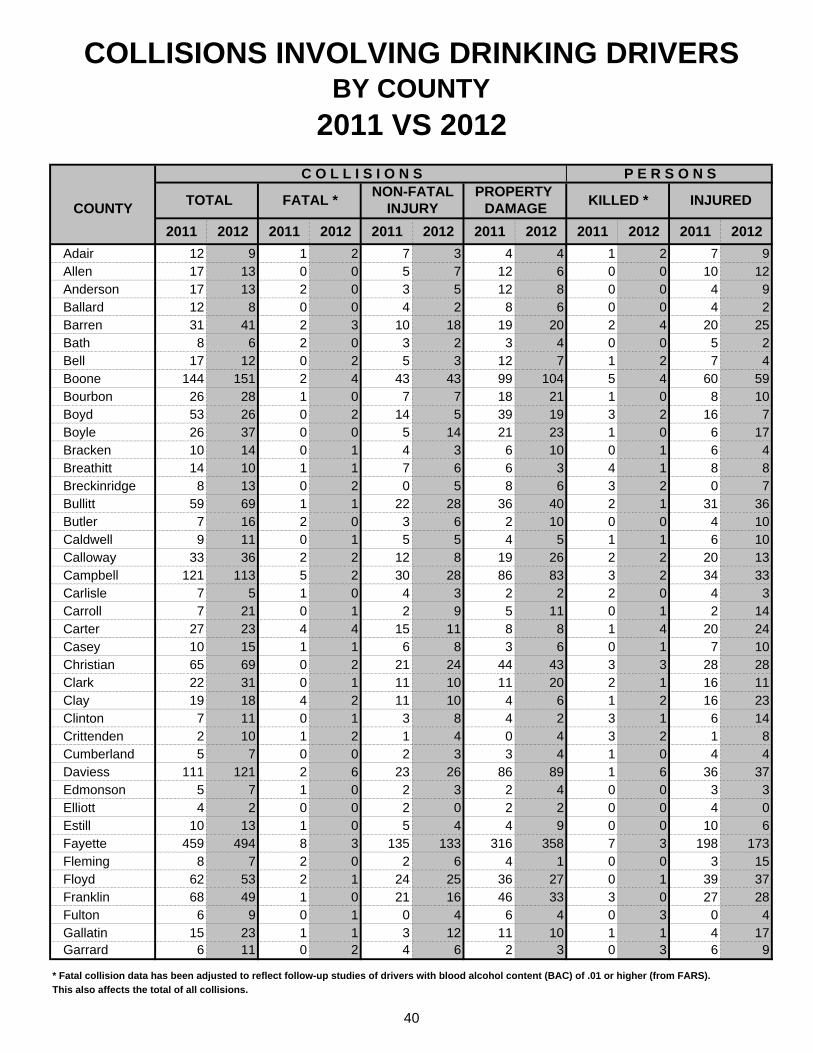
COLLISIONS INVOLVING DRINKING DRIVERSBY COUNTY
2011 VS 2012
C O L L I S I O N S P E R S O N SNON-FATAL PROPERTY
COUNTY INJURY DAMAGE
2011 2012 2011 2012 2011 2012 2011 2012 2011 2012 2011 2012
Adair 12 9 1 2 7 3 4 4 1 2 7 9Allen 17 13 0 0 5 7 12 6 0 0 10 12Anderson 17 13 2 0 3 5 12 8 0 0 4 9Ballard 12 8 0 0 4 2 8 6 0 0 4 2Barren 31 41 2 3 10 18 19 20 2 4 20 25Bath 8 6 2 0 3 2 3 4 0 0 5 2Bell 17 12 0 2 5 3 12 7 1 2 7 4Boone 144 151 2 4 43 43 99 104 5 4 60 59Bourbon 26 28 1 0 7 7 18 21 1 0 8 10Boyd 53 26 0 2 14 5 39 19 3 2 16 7Boyle 26 37 0 0 5 14 21 23 1 0 6 17Bracken 10 14 0 1 4 3 6 10 0 1 6 4Breathitt 14 10 1 1 7 6 6 3 4 1 8 8Breckinridge 8 13 0 2 0 5 8 6 3 2 0 7Bullitt 59 69 1 1 22 28 36 40 2 1 31 36Butler 7 16 2 0 3 6 2 10 0 0 4 10Caldwell 9 11 0 1 5 5 4 5 1 1 6 10Calloway 33 36 2 2 12 8 19 26 2 2 20 13Campbell 121 113 5 2 30 28 86 83 3 2 34 33Carlisle 7 5 1 0 4 3 2 2 2 0 4 3Carroll 7 21 0 1 2 9 5 11 0 1 2 14Carter 27 23 4 4 15 11 8 8 1 4 20 24Casey 10 15 1 1 6 8 3 6 0 1 7 10Christian 65 69 0 2 21 24 44 43 3 3 28 28Clark 22 31 0 1 11 10 11 20 2 1 16 11Clay 19 18 4 2 11 10 4 6 1 2 16 23Clinton 7 11 0 1 3 8 4 2 3 1 6 14Crittenden 2 10 1 2 1 4 0 4 3 2 1 8Cumberland 5 7 0 0 2 3 3 4 1 0 4 4Daviess 111 121 2 6 23 26 86 89 1 6 36 37Edmonson 5 7 1 0 2 3 2 4 0 0 3 3Elliott 4 2 0 0 2 0 2 2 0 0 4 0Estill 10 13 1 0 5 4 4 9 0 0 10 6Fayette 459 494 8 3 135 133 316 358 7 3 198 173Fleming 8 7 2 0 2 6 4 1 0 0 3 15Floyd 62 53 2 1 24 25 36 27 0 1 39 37Franklin 68 49 1 0 21 16 46 33 3 0 27 28Fulton 6 9 0 1 0 4 6 4 0 3 0 4Gallatin 15 23 1 1 3 12 11 10 1 1 4 17Garrard 6 11 0 2 4 6 2 3 0 3 6 9
* Fatal collision data has been adjusted to reflect follow-up studies of drivers with blood alcohol content (BAC) of .01 or higher (from FARS).
This also affects the total of all collisions.
INJURED
40
FATAL * TOTAL KILLED *
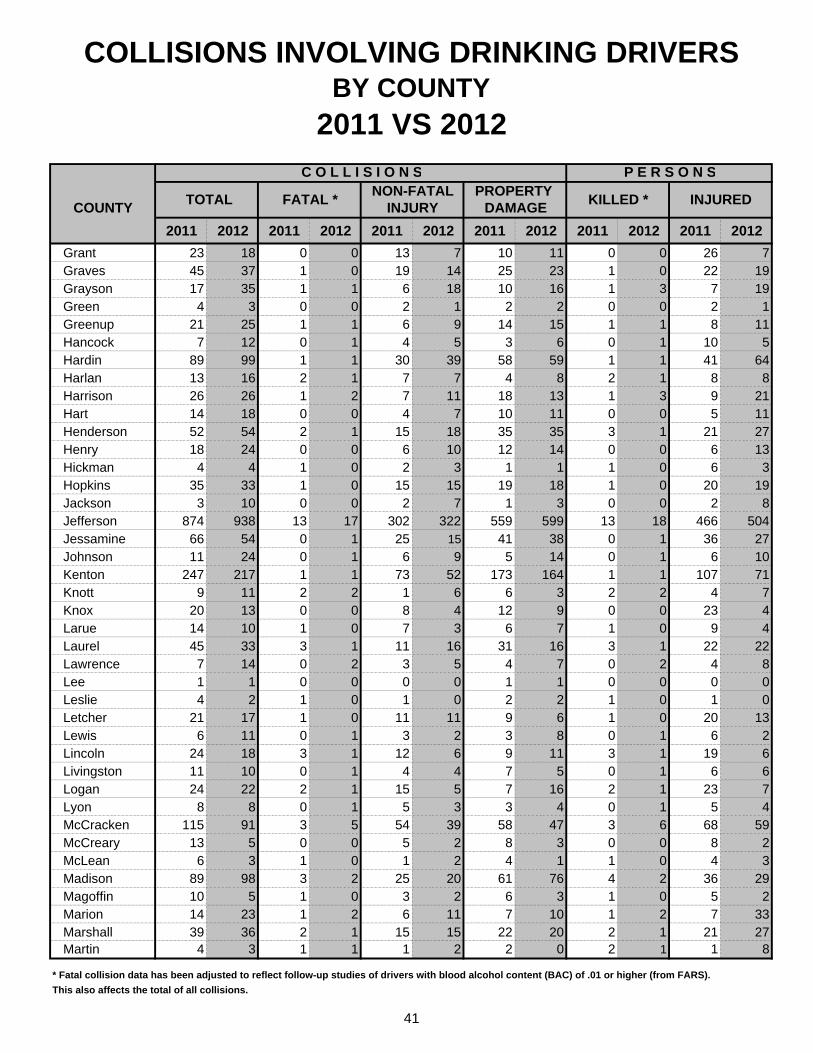
COLLISIONS INVOLVING DRINKING DRIVERSBY COUNTY
2011 VS 2012
C O L L I S I O N S P E R S O N SNON-FATAL PROPERTY
COUNTY INJURY DAMAGE
2011 2012 2011 2012 2011 2012 2011 2012 2011 2012 2011 2012
Grant 23 18 0 0 13 7 10 11 0 0 26 7Graves 45 37 1 0 19 14 25 23 1 0 22 19Grayson 17 35 1 1 6 18 10 16 1 3 7 19Green 4 3 0 0 2 1 2 2 0 0 2 1Greenup 21 25 1 1 6 9 14 15 1 1 8 11Hancock 7 12 0 1 4 5 3 6 0 1 10 5Hardin 89 99 1 1 30 39 58 59 1 1 41 64Harlan 13 16 2 1 7 7 4 8 2 1 8 8Harrison 26 26 1 2 7 11 18 13 1 3 9 21Hart 14 18 0 0 4 7 10 11 0 0 5 11Henderson 52 54 2 1 15 18 35 35 3 1 21 27Henry 18 24 0 0 6 10 12 14 0 0 6 13Hickman 4 4 1 0 2 3 1 1 1 0 6 3Hopkins 35 33 1 0 15 15 19 18 1 0 20 19Jackson 3 10 0 0 2 7 1 3 0 0 2 8Jefferson 874 938 13 17 302 322 559 599 13 18 466 504Jessamine 66 54 0 1 25 15 41 38 0 1 36 27Johnson 11 24 0 1 6 9 5 14 0 1 6 10Kenton 247 217 1 1 73 52 173 164 1 1 107 71Knott 9 11 2 2 1 6 6 3 2 2 4 7Knox 20 13 0 0 8 4 12 9 0 0 23 4Larue 14 10 1 0 7 3 6 7 1 0 9 4Laurel 45 33 3 1 11 16 31 16 3 1 22 22Lawrence 7 14 0 2 3 5 4 7 0 2 4 8Lee 1 1 0 0 0 0 1 1 0 0 0 0Leslie 4 2 1 0 1 0 2 2 1 0 1 0Letcher 21 17 1 0 11 11 9 6 1 0 20 13Lewis 6 11 0 1 3 2 3 8 0 1 6 2Lincoln 24 18 3 1 12 6 9 11 3 1 19 6Livingston 11 10 0 1 4 4 7 5 0 1 6 6Logan 24 22 2 1 15 5 7 16 2 1 23 7Lyon 8 8 0 1 5 3 3 4 0 1 5 4McCracken 115 91 3 5 54 39 58 47 3 6 68 59McCreary 13 5 0 0 5 2 8 3 0 0 8 2McLean 6 3 1 0 1 2 4 1 1 0 4 3Madison 89 98 3 2 25 20 61 76 4 2 36 29Magoffin 10 5 1 0 3 2 6 3 1 0 5 2Marion 14 23 1 2 6 11 7 10 1 2 7 33Marshall 39 36 2 1 15 15 22 20 2 1 21 27Martin 4 3 1 1 1 2 2 0 2 1 1 8
* Fatal collision data has been adjusted to reflect follow-up studies of drivers with blood alcohol content (BAC) of .01 or higher (from FARS).
This also affects the total of all collisions.
41
INJUREDFATAL * KILLED * TOTAL
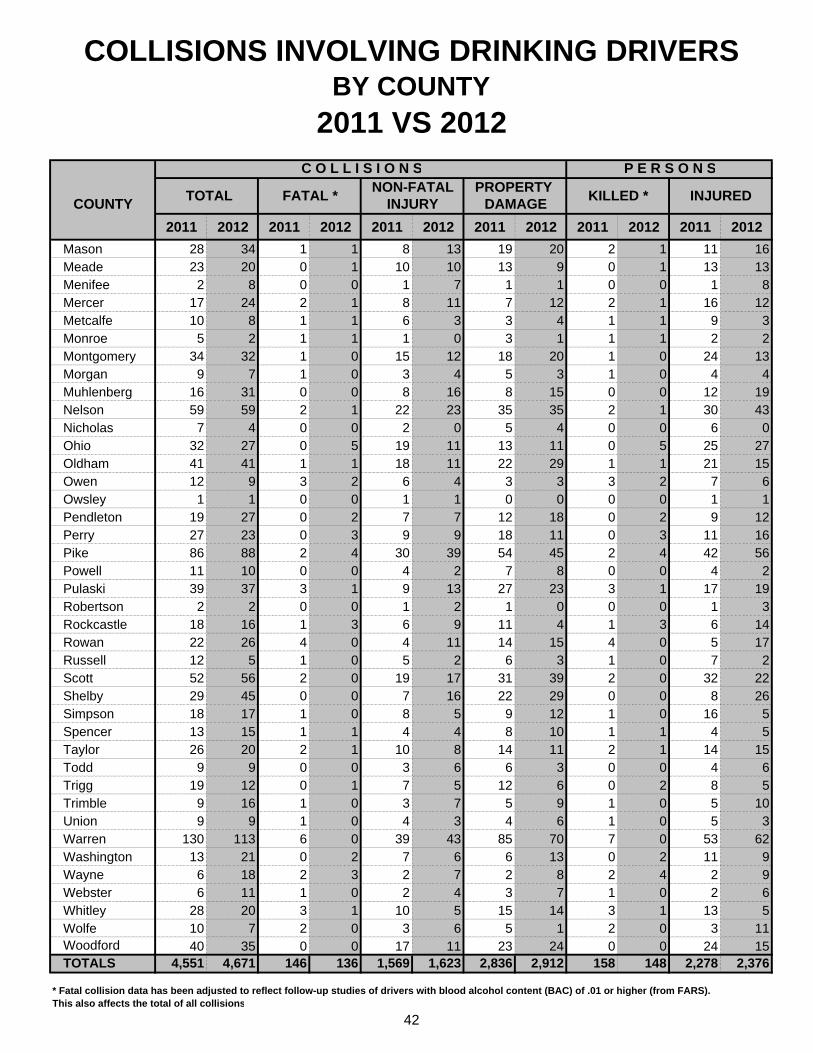
COLLISIONS INVOLVING DRINKING DRIVERSBY COUNTY
2011 VS 2012C O L L I S I O N S P E R S O N S
NON-FATAL PROPERTY COUNTY INJURY DAMAGE
2011 2012 2011 2012 2011 2012 2011 2012 2011 2012 2011 2012
Mason 28 34 1 1 8 13 19 20 2 1 11 16Meade 23 20 0 1 10 10 13 9 0 1 13 13Menifee 2 8 0 0 1 7 1 1 0 0 1 8Mercer 17 24 2 1 8 11 7 12 2 1 16 12Metcalfe 10 8 1 1 6 3 3 4 1 1 9 3Monroe 5 2 1 1 1 0 3 1 1 1 2 2Montgomery 34 32 1 0 15 12 18 20 1 0 24 13Morgan 9 7 1 0 3 4 5 3 1 0 4 4Muhlenberg 16 31 0 0 8 16 8 15 0 0 12 19Nelson 59 59 2 1 22 23 35 35 2 1 30 43Nicholas 7 4 0 0 2 0 5 4 0 0 6 0Ohio 32 27 0 5 19 11 13 11 0 5 25 27Oldham 41 41 1 1 18 11 22 29 1 1 21 15Owen 12 9 3 2 6 4 3 3 3 2 7 6Owsley 1 1 0 0 1 1 0 0 0 0 1 1Pendleton 19 27 0 2 7 7 12 18 0 2 9 12Perry 27 23 0 3 9 9 18 11 0 3 11 16Pike 86 88 2 4 30 39 54 45 2 4 42 56Powell 11 10 0 0 4 2 7 8 0 0 4 2Pulaski 39 37 3 1 9 13 27 23 3 1 17 19Robertson 2 2 0 0 1 2 1 0 0 0 1 3Rockcastle 18 16 1 3 6 9 11 4 1 3 6 14Rowan 22 26 4 0 4 11 14 15 4 0 5 17Russell 12 5 1 0 5 2 6 3 1 0 7 2Scott 52 56 2 0 19 17 31 39 2 0 32 22Shelby 29 45 0 0 7 16 22 29 0 0 8 26Simpson 18 17 1 0 8 5 9 12 1 0 16 5Spencer 13 15 1 1 4 4 8 10 1 1 4 5Taylor 26 20 2 1 10 8 14 11 2 1 14 15Todd 9 9 0 0 3 6 6 3 0 0 4 6Trigg 19 12 0 1 7 5 12 6 0 2 8 5Trimble 9 16 1 0 3 7 5 9 1 0 5 10Union 9 9 1 0 4 3 4 6 1 0 5 3Warren 130 113 6 0 39 43 85 70 7 0 53 62Washington 13 21 0 2 7 6 6 13 0 2 11 9Wayne 6 18 2 3 2 7 2 8 2 4 2 9Webster 6 11 1 0 2 4 3 7 1 0 2 6Whitley 28 20 3 1 10 5 15 14 3 1 13 5Wolfe 10 7 2 0 3 6 5 1 2 0 3 11Woodford 40 35 0 0 17 11 23 24 0 0 24 15TOTALS 4,551 4,671 146 136 1,569 1,623 2,836 2,912 158 148 2,278 2,376
* Fatal collision data has been adjusted to reflect follow-up studies of drivers with blood alcohol content (BAC) of .01 or higher (from FARS). This also affects the total of all collisions
42
KILLED * INJURED TOTAL FATAL *
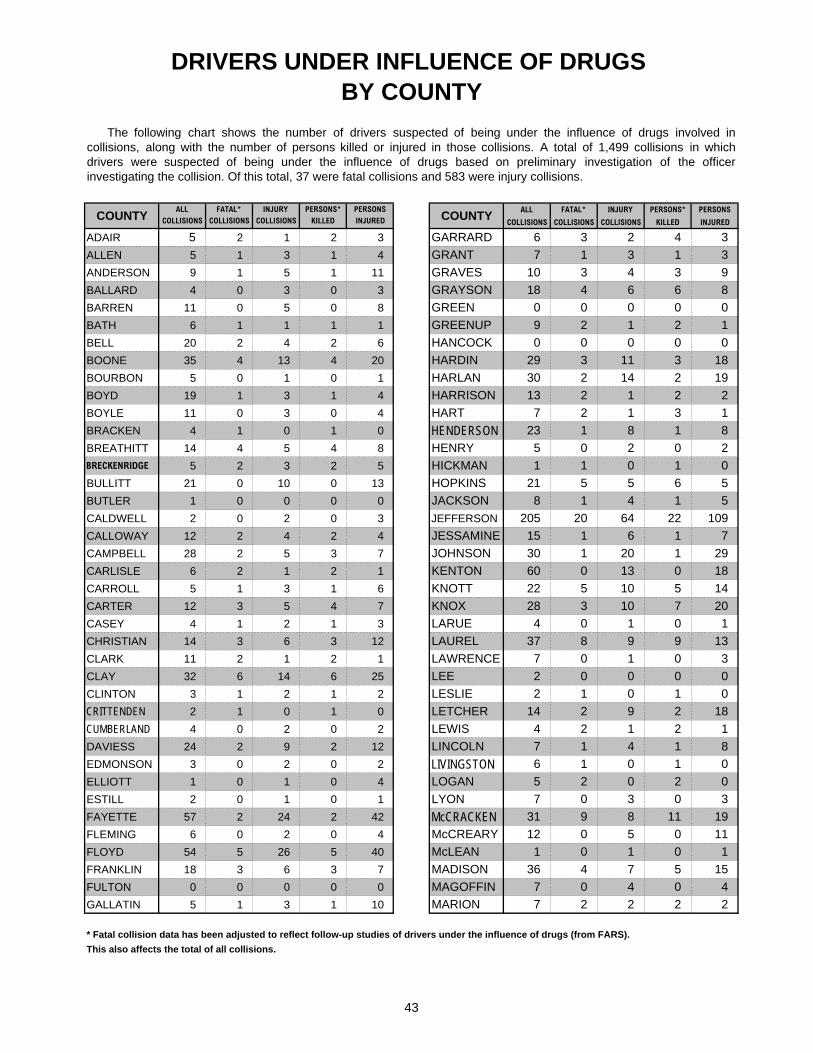
DRIVERS UNDER INFLUENCE OF DRUGS BY COUNTY
ALL FATAL* INJURY PERSONS* PERSONS ALL FATAL* INJURY PERSONS* PERSONS
COLLISIONS COLLISIONS COLLISIONS KILLED INJURED COLLISIONS COLLISIONS COLLISIONS KILLED INJURED
ADAIR 5 2 1 2 3 GARRARD 6 3 2 4 3
ALLEN 5 1 3 1 4 GRANT 7 1 3 1 3
ANDERSON 9 1 5 1 11 GRAVES 10 3 4 3 9
BALLARD 4 0 3 0 3 GRAYSON 18 4 6 6 8
BARREN 11 0 5 0 8 GREEN 0 0 0 0 0
BATH 6 1 1 1 1 GREENUP 9 2 1 2 1
BELL 20 2 4 2 6 HANCOCK 0 0 0 0 0
BOONE 35 4 13 4 20 HARDIN 29 3 11 3 18
BOURBON 5 0 1 0 1 HARLAN 30 2 14 2 19
BOYD 19 1 3 1 4 HARRISON 13 2 1 2 2
BOYLE 11 0 3 0 4 HART 7 2 1 3 1
BRACKEN 4 1 0 1 0 HENDERSON 23 1 8 1 8
BREATHITT 14 4 5 4 8 HENRY 5 0 2 0 2BRECKENRIDGE 5 2 3 2 5 HICKMAN 1 1 0 1 0
BULLITT 21 0 10 0 13 HOPKINS 21 5 5 6 5
BUTLER 1 0 0 0 0 JACKSON 8 1 4 1 5
CALDWELL 2 0 2 0 3 JEFFERSON 205 20 64 22 109
CALLOWAY 12 2 4 2 4 JESSAMINE 15 1 6 1 7
CAMPBELL 28 2 5 3 7 JOHNSON 30 1 20 1 29
CARLISLE 6 2 1 2 1 KENTON 60 0 13 0 18
CARROLL 5 1 3 1 6 KNOTT 22 5 10 5 14
CARTER 12 3 5 4 7 KNOX 28 3 10 7 20
CASEY 4 1 2 1 3 LARUE 4 0 1 0 1
CHRISTIAN 14 3 6 3 12 LAUREL 37 8 9 9 13
CLARK 11 2 1 2 1 LAWRENCE 7 0 1 0 3
CLAY 32 6 14 6 25 LEE 2 0 0 0 0
CLINTON 3 1 2 1 2 LESLIE 2 1 0 1 0
CRITTENDEN 2 1 0 1 0 LETCHER 14 2 9 2 18
CUMBERLAND 4 0 2 0 2 LEWIS 4 2 1 2 1
DAVIESS 24 2 9 2 12 LINCOLN 7 1 4 1 8
EDMONSON 3 0 2 0 2 LIVINGSTON 6 1 0 1 0
ELLIOTT 1 0 1 0 4 LOGAN 5 2 0 2 0
ESTILL 2 0 1 0 1 LYON 7 0 3 0 3
FAYETTE 57 2 24 2 42 McCRACKEN 31 9 8 11 19
FLEMING 6 0 2 0 4 McCREARY 12 0 5 0 11
FLOYD 54 5 26 5 40 McLEAN 1 0 1 0 1
FRANKLIN 18 3 6 3 7 MADISON 36 4 7 5 15
FULTON 0 0 0 0 0 MAGOFFIN 7 0 4 0 4
GALLATIN 5 1 3 1 10 MARION 7 2 2 2 2
This also affects the total of all collisions.
43
* Fatal collision data has been adjusted to reflect follow-up studies of drivers under the influence of drugs (from FARS).
COUNTY
The following chart shows the number of drivers suspected of being under the influence of drugs involved incollisions, along with the number of persons killed or injured in those collisions. A total of 1,499 collisions in whichdrivers were suspected of being under the influence of drugs based on preliminary investigation of the officerinvestigating the collision. Of this total, 37 were fatal collisions and 583 were injury collisions.
COUNTY
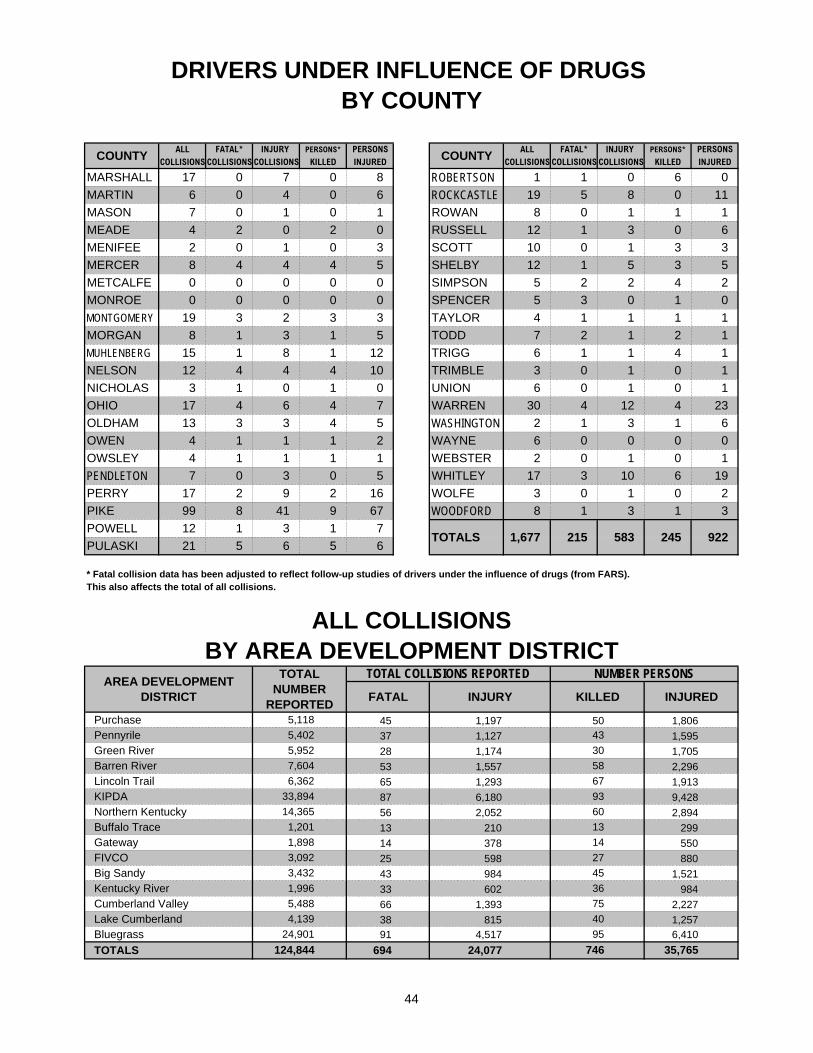
DRIVERS UNDER INFLUENCE OF DRUGS BY COUNTY
ALL FATAL* INJURY PERSONS* PERSONS ALL FATAL* INJURY PERSONS* PERSONS
COLLISIONS COLLISIONS COLLISIONS KILLED INJURED COLLISIONS COLLISIONS COLLISIONS KILLED INJURED
MARSHALL 17 0 7 0 8 ROBERTSON 1 1 0 6 0
MARTIN 6 0 4 0 6 ROCKCASTLE 19 5 8 0 11
MASON 7 0 1 0 1 ROWAN 8 0 1 1 1
MEADE 4 2 0 2 0 RUSSELL 12 1 3 0 6
MENIFEE 2 0 1 0 3 SCOTT 10 0 1 3 3
MERCER 8 4 4 4 5 SHELBY 12 1 5 3 5
METCALFE 0 0 0 0 0 SIMPSON 5 2 2 4 2
MONROE 0 0 0 0 0 SPENCER 5 3 0 1 0
MONTGOMERY 19 3 2 3 3 TAYLOR 4 1 1 1 1
MORGAN 8 1 3 1 5 TODD 7 2 1 2 1
MUHLENBERG 15 1 8 1 12 TRIGG 6 1 1 4 1
NELSON 12 4 4 4 10 TRIMBLE 3 0 1 0 1
NICHOLAS 3 1 0 1 0 UNION 6 0 1 0 1
OHIO 17 4 6 4 7 WARREN 30 4 12 4 23
OLDHAM 13 3 3 4 5 WASHINGTON 2 1 3 1 6
OWEN 4 1 1 1 2 WAYNE 6 0 0 0 0
OWSLEY 4 1 1 1 1 WEBSTER 2 0 1 0 1
PENDLETON 7 0 3 0 5 WHITLEY 17 3 10 6 19
PERRY 17 2 9 2 16 WOLFE 3 0 1 0 2
PIKE 99 8 41 9 67 WOODFORD 8 1 3 1 3
POWELL 12 1 3 1 7
PULASKI 21 5 6 5 6
* Fatal collision data has been adjusted to reflect follow-up studies of drivers under the influence of drugs (from FARS).This also affects the total of all collisions.
ALL COLLISIONS BY AREA DEVELOPMENT DISTRICT
Purchase 45 1,197Pennyrile 37 1,127Green River 28 1,174Barren River 53 1,557Lincoln Trail 65 1,293KIPDA 87 6,180Northern Kentucky 56 2,052Buffalo Trace 13 210Gateway 14 378FIVCO 25 598Big Sandy 43 984Kentucky River 33 602Cumberland Valley 66 1,393Lake Cumberland 38 815Bluegrass 91 4,517
TOTALS 694 24,077
44
5,118
5,402
5,952
7,604
6,362
33,894
14,365
1,201
3,092
3,432
24,901
124,844
4,139
299
50
67
58
30
43
14
13
60
93
1,705
1,595
1,806
75
36
45
27
2,894
1,996
5,488
COUNTY COUNTY
245
9,428
1,913
2,296
35,765
6,4101,257
583
AREA DEVELOPMENT DISTRICT
TOTAL NUMBER
REPORTED
TOTAL COLLISIONS REPORTED NUMBER PERSONS
KILLED INJURED
TOTALS 1,677
1,521
880
1,898
2,227
984
550
922
INJURYFATAL
746
95
40
215
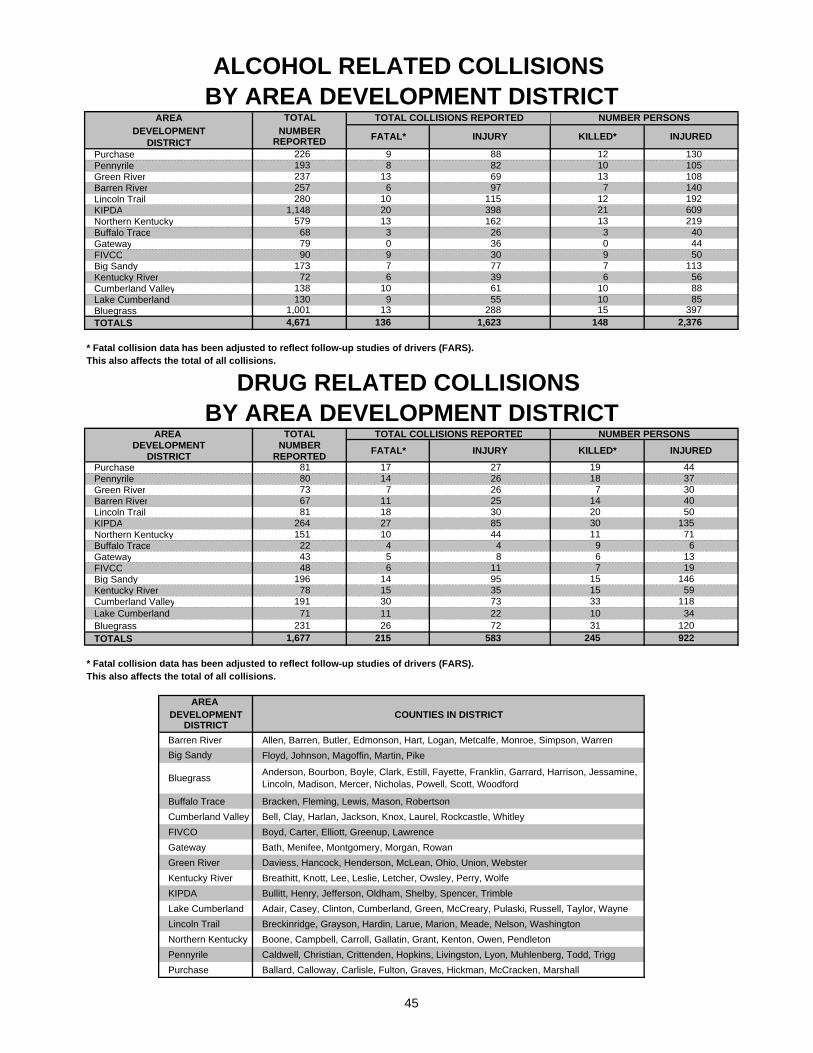
ALCOHOL RELATED COLLISIONS BY AREA DEVELOPMENT DISTRICT
TOTAL COLLISIONS REPORTED NUMBER PERSONS
Purchase 9 88Pennyrile 8 82Green River 13 69Barren River 6 97Lincoln Trail 10 115KIPDA 20 398Northern Kentucky 13 162Buffalo Trace 3 26Gateway 0 36FIVCO 9 30Big Sandy 7 77Kentucky River 6 39Cumberland Valley 10 61Lake Cumberland 9 55Bluegrass 13 288TOTALS 136 1,623
* Fatal collision data has been adjusted to reflect follow-up studies of drivers (FARS).This also affects the total of all collisions.
DRUG RELATED COLLISIONS BY AREA DEVELOPMENT DISTRICT
AREA TOTAL TOTAL COLLISIONS REPORTED NUMBER PERSONSDEVELOPMENT NUMBER
DISTRICT REPORTEDPurchase 17 27Pennyrile 14 26Green River 7 26Barren River 11 25Lincoln Trail 18 30KIPDA 27 85Northern Kentucky 10 44Buffalo Trace 4 4Gateway 5 8FIVCO 6 11Big Sandy 14 95Kentucky River 15 35Cumberland Valley 30 73Lake Cumberland 11 22Bluegrass 26 72TOTALS 215 583
* Fatal collision data has been adjusted to reflect follow-up studies of drivers (FARS).This also affects the total of all collisions.
AREA DEVELOPMENT COUNTIES IN DISTRICT
DISTRICT
Barren River Allen, Barren, Butler, Edmonson, Hart, Logan, Metcalfe, Monroe, Simpson, Warren
Floyd, Johnson, Magoffin, Martin, Pike
Buffalo Trace Bracken, Fleming, Lewis, Mason, Robertson
Cumberland Valley Bell, Clay, Harlan, Jackson, Knox, Laurel, Rockcastle, Whitley
FIVCO Boyd, Carter, Elliott, Greenup, Lawrence
Gateway Bath, Menifee, Montgomery, Morgan, Rowan
Green River Daviess, Hancock, Henderson, McLean, Ohio, Union, Webster
Kentucky River Breathitt, Knott, Lee, Leslie, Letcher, Owsley, Perry, Wolfe
KIPDA Bullitt, Henry, Jefferson, Oldham, Shelby, Spencer, Trimble
Lake Cumberland Adair, Casey, Clinton, Cumberland, Green, McCreary, Pulaski, Russell, Taylor, Wayne
Lincoln Trail Breckinridge, Grayson, Hardin, Larue, Marion, Meade, Nelson, Washington
Northern Kentucky Boone, Campbell, Carroll, Gallatin, Grant, Kenton, Owen, Pendleton
Pennyrile Caldwell, Christian, Crittenden, Hopkins, Livingston, Lyon, Muhlenberg, Todd, Trigg
Purchase Ballard, Calloway, Carlisle, Fulton, Graves, Hickman, McCracken, Marshall
45
257108105130
72173
90
68
1,148280
80
4322
151264
4,6711,001
130138
19178
196
12
127
148151010
679
1310
03
INJURYFATAL*
48
81
816773
40219609192
13
718
113020
671
135504030
44
922120
34118
59146
19
140
3744
INJURED
2,376397
858856
11350
AREADEVELOPMENT
FATAL* INJURED
1,677231
7131
3315
10
15
INJURY KILLED*
245
KILLED*
7
1321
69
19
14
DISTRICT
TOTAL
NUMBERREPORTED
579
237193
79
226
Big Sandy
BluegrassAnderson, Bourbon, Boyle, Clark, Estill, Fayette, Franklin, Garrard, Harrison, Jessamine, Lincoln, Madison, Mercer, Nicholas, Powell, Scott, Woodford

PARKING LOTS/
PRIVATE
PROPERTY

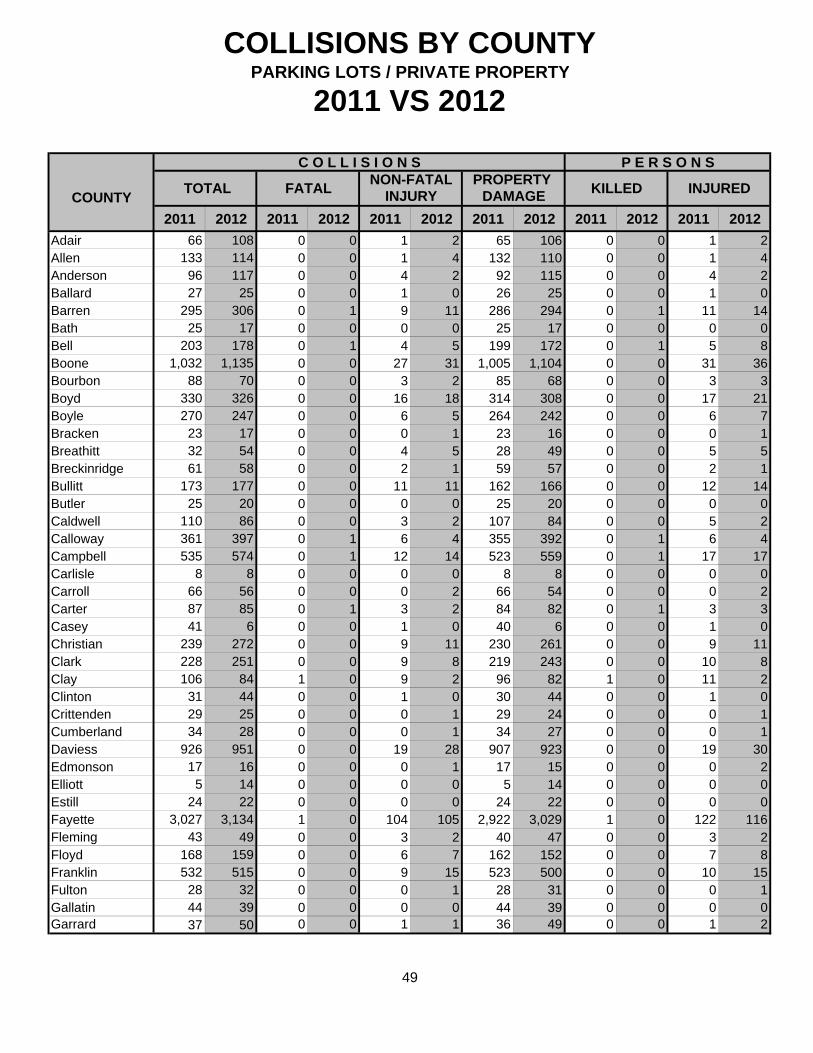
COLLISIONS BY COUNTYPARKING LOTS / PRIVATE PROPERTY
2011 VS 2012
C O L L I S I O N S P E R S O N SNON-FATAL PROPERTY
COUNTY INJURY DAMAGE
2011 2012 2011 2012 2011 2012 2011 2012 2011 2012 2011 2012
Adair 66 108 0 0 1 2 65 106 0 0 1 2Allen 133 114 0 0 1 4 132 110 0 0 1 4Anderson 96 117 0 0 4 2 92 115 0 0 4 2Ballard 27 25 0 0 1 0 26 25 0 0 1 0Barren 295 306 0 1 9 11 286 294 0 1 11 14Bath 25 17 0 0 0 0 25 17 0 0 0 0Bell 203 178 0 1 4 5 199 172 0 1 5 8Boone 1,032 1,135 0 0 27 31 1,005 1,104 0 0 31 36Bourbon 88 70 0 0 3 2 85 68 0 0 3 3Boyd 330 326 0 0 16 18 314 308 0 0 17 21Boyle 270 247 0 0 6 5 264 242 0 0 6 7Bracken 23 17 0 0 0 1 23 16 0 0 0 1Breathitt 32 54 0 0 4 5 28 49 0 0 5 5Breckinridge 61 58 0 0 2 1 59 57 0 0 2 1Bullitt 173 177 0 0 11 11 162 166 0 0 12 14Butler 25 20 0 0 0 0 25 20 0 0 0 0Caldwell 110 86 0 0 3 2 107 84 0 0 5 2Calloway 361 397 0 1 6 4 355 392 0 1 6 4Campbell 535 574 0 1 12 14 523 559 0 1 17 17Carlisle 8 8 0 0 0 0 8 8 0 0 0 0Carroll 66 56 0 0 0 2 66 54 0 0 0 2Carter 87 85 0 1 3 2 84 82 0 1 3 3Casey 41 6 0 0 1 0 40 6 0 0 1 0Christian 239 272 0 0 9 11 230 261 0 0 9 11Clark 228 251 0 0 9 8 219 243 0 0 10 8Clay 106 84 1 0 9 2 96 82 1 0 11 2Clinton 31 44 0 0 1 0 30 44 0 0 1 0Crittenden 29 25 0 0 0 1 29 24 0 0 0 1Cumberland 34 28 0 0 0 1 34 27 0 0 0 1Daviess 926 951 0 0 19 28 907 923 0 0 19 30Edmonson 17 16 0 0 0 1 17 15 0 0 0 2Elliott 5 14 0 0 0 0 5 14 0 0 0 0Estill 24 22 0 0 0 0 24 22 0 0 0 0Fayette 3,027 3,134 1 0 104 105 2,922 3,029 1 0 122 116Fleming 43 49 0 0 3 2 40 47 0 0 3 2Floyd 168 159 0 0 6 7 162 152 0 0 7 8Franklin 532 515 0 0 9 15 523 500 0 0 10 15Fulton 28 32 0 0 0 1 28 31 0 0 0 1Gallatin 44 39 0 0 0 0 44 39 0 0 0 0Garrard 37 50 0 0 1 1 36 49 0 0 1 2
49
TOTAL FATAL KILLED INJURED
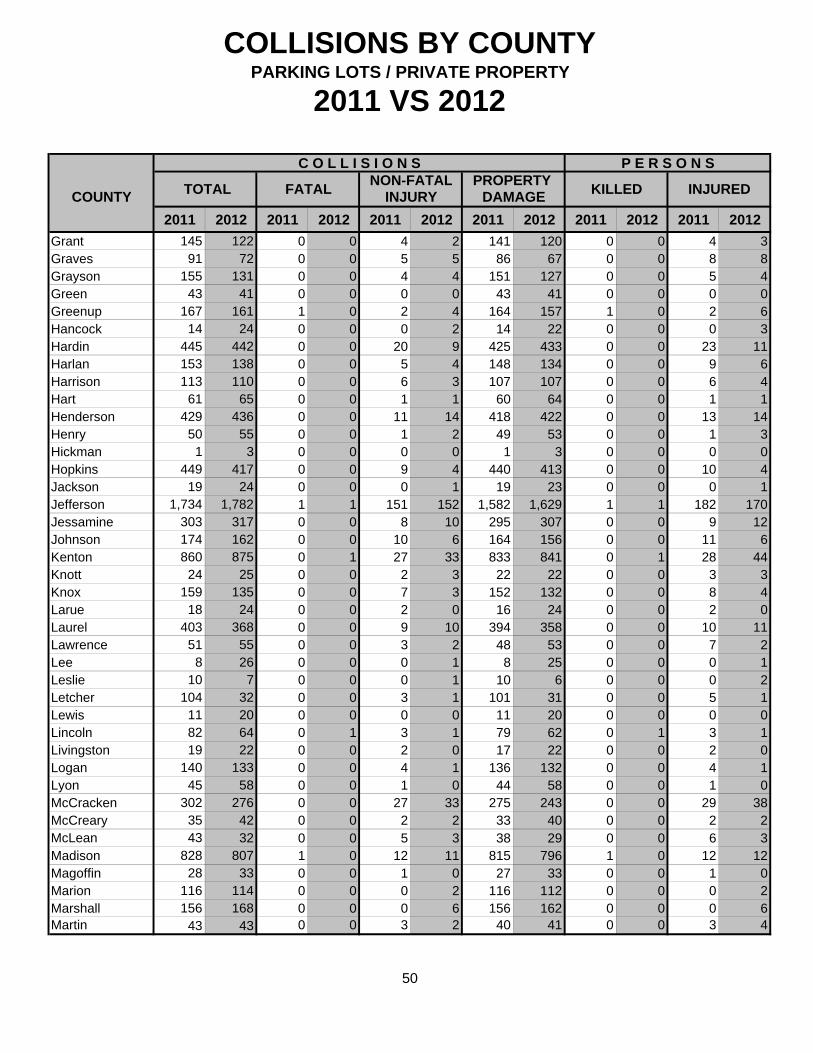
COLLISIONS BY COUNTYPARKING LOTS / PRIVATE PROPERTY
2011 VS 2012
C O L L I S I O N S P E R S O N SNON-FATAL PROPERTY
COUNTY INJURY DAMAGE
2011 2012 2011 2012 2011 2012 2011 2012 2011 2012 2011 2012
Grant 145 122 0 0 4 2 141 120 0 0 4 3Graves 91 72 0 0 5 5 86 67 0 0 8 8Grayson 155 131 0 0 4 4 151 127 0 0 5 4Green 43 41 0 0 0 0 43 41 0 0 0 0Greenup 167 161 1 0 2 4 164 157 1 0 2 6Hancock 14 24 0 0 0 2 14 22 0 0 0 3Hardin 445 442 0 0 20 9 425 433 0 0 23 11Harlan 153 138 0 0 5 4 148 134 0 0 9 6Harrison 113 110 0 0 6 3 107 107 0 0 6 4Hart 61 65 0 0 1 1 60 64 0 0 1 1Henderson 429 436 0 0 11 14 418 422 0 0 13 14Henry 50 55 0 0 1 2 49 53 0 0 1 3Hickman 1 3 0 0 0 0 1 3 0 0 0 0Hopkins 449 417 0 0 9 4 440 413 0 0 10 4Jackson 19 24 0 0 0 1 19 23 0 0 0 1Jefferson 1,734 1,782 1 1 151 152 1,582 1,629 1 1 182 170Jessamine 303 317 0 0 8 10 295 307 0 0 9 12Johnson 174 162 0 0 10 6 164 156 0 0 11 6Kenton 860 875 0 1 27 33 833 841 0 1 28 44Knott 24 25 0 0 2 3 22 22 0 0 3 3Knox 159 135 0 0 7 3 152 132 0 0 8 4Larue 18 24 0 0 2 0 16 24 0 0 2 0Laurel 403 368 0 0 9 10 394 358 0 0 10 11Lawrence 51 55 0 0 3 2 48 53 0 0 7 2Lee 8 26 0 0 0 1 8 25 0 0 0 1Leslie 10 7 0 0 0 1 10 6 0 0 0 2Letcher 104 32 0 0 3 1 101 31 0 0 5 1Lewis 11 20 0 0 0 0 11 20 0 0 0 0Lincoln 82 64 0 1 3 1 79 62 0 1 3 1Livingston 19 22 0 0 2 0 17 22 0 0 2 0Logan 140 133 0 0 4 1 136 132 0 0 4 1Lyon 45 58 0 0 1 0 44 58 0 0 1 0McCracken 302 276 0 0 27 33 275 243 0 0 29 38McCreary 35 42 0 0 2 2 33 40 0 0 2 2McLean 43 32 0 0 5 3 38 29 0 0 6 3Madison 828 807 1 0 12 11 815 796 1 0 12 12Magoffin 28 33 0 0 1 0 27 33 0 0 1 0Marion 116 114 0 0 0 2 116 112 0 0 0 2Marshall 156 168 0 0 0 6 156 162 0 0 0 6Martin 43 43 0 0 3 2 40 41 0 0 3 4
50
TOTAL FATAL KILLED INJURED
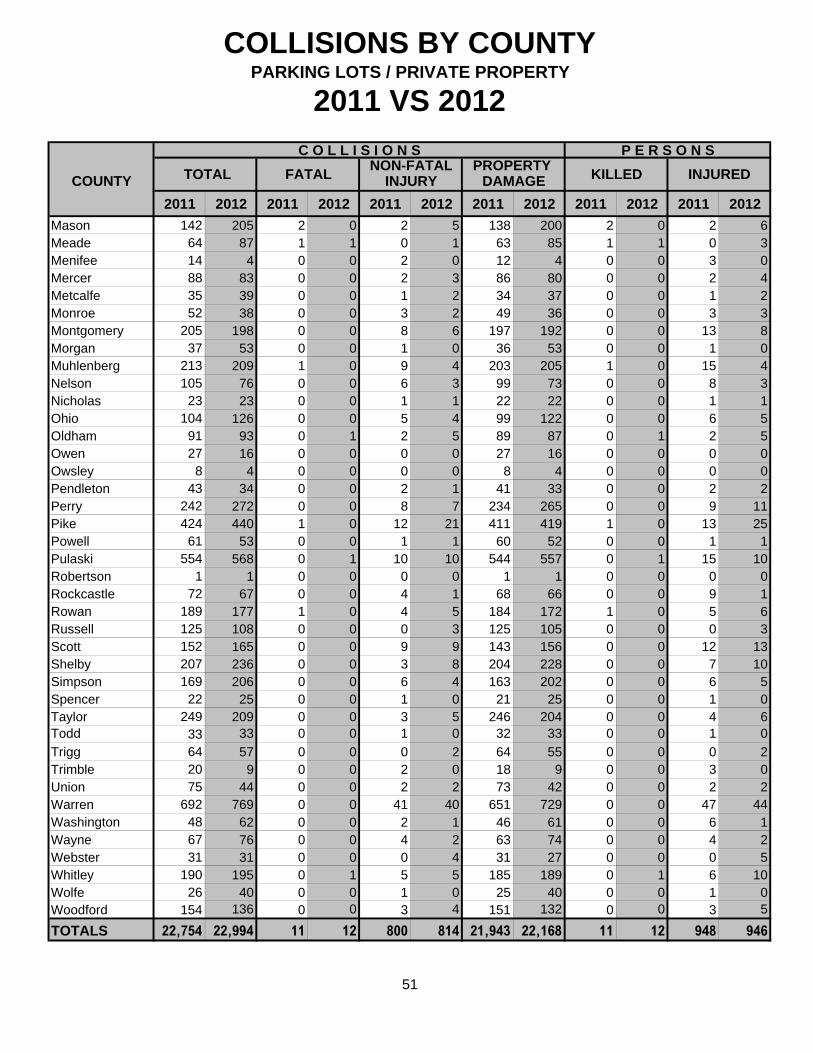
COLLISIONS BY COUNTYPARKING LOTS / PRIVATE PROPERTY
2011 VS 2012
C O L L I S I O N S P E R S O N SNON-FATAL PROPERTY
COUNTY INJURY DAMAGE
2011 2012 2011 2012 2011 2012 2011 2012 2011 2012 2011 2012
Mason 142 205 2 0 2 5 138 200 2 0 2 6Meade 64 87 1 1 0 1 63 85 1 1 0 3Menifee 14 4 0 0 2 0 12 4 0 0 3 0Mercer 88 83 0 0 2 3 86 80 0 0 2 4Metcalfe 35 39 0 0 1 2 34 37 0 0 1 2Monroe 52 38 0 0 3 2 49 36 0 0 3 3Montgomery 205 198 0 0 8 6 197 192 0 0 13 8Morgan 37 53 0 0 1 0 36 53 0 0 1 0Muhlenberg 213 209 1 0 9 4 203 205 1 0 15 4Nelson 105 76 0 0 6 3 99 73 0 0 8 3Nicholas 23 23 0 0 1 1 22 22 0 0 1 1Ohio 104 126 0 0 5 4 99 122 0 0 6 5Oldham 91 93 0 1 2 5 89 87 0 1 2 5Owen 27 16 0 0 0 0 27 16 0 0 0 0Owsley 8 4 0 0 0 0 8 4 0 0 0 0Pendleton 43 34 0 0 2 1 41 33 0 0 2 2Perry 242 272 0 0 8 7 234 265 0 0 9 11Pike 424 440 1 0 12 21 411 419 1 0 13 25Powell 61 53 0 0 1 1 60 52 0 0 1 1Pulaski 554 568 0 1 10 10 544 557 0 1 15 10Robertson 1 1 0 0 0 0 1 1 0 0 0 0Rockcastle 72 67 0 0 4 1 68 66 0 0 9 1Rowan 189 177 1 0 4 5 184 172 1 0 5 6Russell 125 108 0 0 0 3 125 105 0 0 0 3Scott 152 165 0 0 9 9 143 156 0 0 12 13Shelby 207 236 0 0 3 8 204 228 0 0 7 10Simpson 169 206 0 0 6 4 163 202 0 0 6 5Spencer 22 25 0 0 1 0 21 25 0 0 1 0Taylor 249 209 0 0 3 5 246 204 0 0 4 6Todd 33 33 0 0 1 0 32 33 0 0 1 0
Trigg 64 57 0 0 0 2 64 55 0 0 0 2Trimble 20 9 0 0 2 0 18 9 0 0 3 0Union 75 44 0 0 2 2 73 42 0 0 2 2Warren 692 769 0 0 41 40 651 729 0 0 47 44Washington 48 62 0 0 2 1 46 61 0 0 6 1Wayne 67 76 0 0 4 2 63 74 0 0 4 2Webster 31 31 0 0 0 4 31 27 0 0 0 5Whitley 190 195 0 1 5 5 185 189 0 1 6 10Wolfe 26 40 0 0 1 0 25 40 0 0 1 0Woodford 154 136 0 0 3 4 151 132 0 0 3 5
TOTALS 22,754 22,994 11 12 800 814 21,943 22,168 11 12 948 946
51
INJURED TOTAL FATAL KILLED
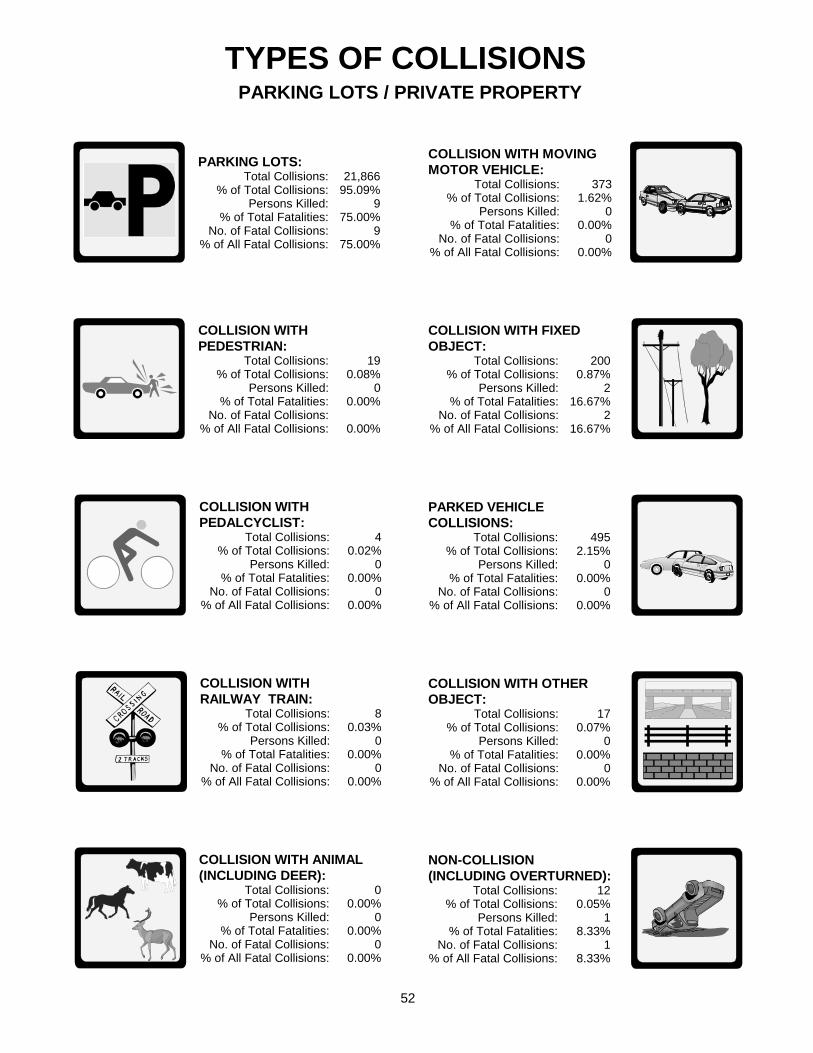
TYPES OF COLLISIONS
52
PARKING LOTS / PRIVATE PROPERTY
COLLISION WITH MOVINGMOTOR VEHICLE:
Total Collisions: 373% of Total Collisions: 1.62%
Persons Killed: 0% of Total Fatalities: 0.00%
No. of Fatal Collisions: 0% of All Fatal Collisions: 0.00%
COLLISION WITH FIXEDOBJECT:
Total Collisions: 200% of Total Collisions: 0.87%
Persons Killed: 2% of Total Fatalities: 16.67%
No. of Fatal Collisions: 2% of All Fatal Collisions: 16.67%
COLLISION WITH ANIMAL(INCLUDING DEER):
Total Collisions: 0% of Total Collisions: 0.00%
Persons Killed: 0% of Total Fatalities: 0.00%
No. of Fatal Collisions: 0% of All Fatal Collisions: 0.00%
COLLISION WITHRAILWAY TRAIN:
Total Collisions: 8% of Total Collisions: 0.03%
Persons Killed: 0% of Total Fatalities: 0.00%
No. of Fatal Collisions: 0% of All Fatal Collisions: 0.00%
COLLISION WITHPEDALCYCLIST:
Total Collisions: 4% of Total Collisions: 0.02%
Persons Killed: 0% of Total Fatalities: 0.00%
No. of Fatal Collisions: 0% of All Fatal Collisions: 0.00%
COLLISION WITHPEDESTRIAN:
Total Collisions: 19% of Total Collisions: 0.08%
Persons Killed: 0% of Total Fatalities: 0.00%
No. of Fatal Collisions: % of All Fatal Collisions: 0.00%
PARKING LOTS:Total Collisions: 21,866
% of Total Collisions: 95.09%Persons Killed: 9
% of Total Fatalities: 75.00%No. of Fatal Collisions: 9
% of All Fatal Collisions: 75.00%
PARKED VEHICLECOLLISIONS:
Total Collisions: 495% of Total Collisions: 2.15%
Persons Killed: 0% of Total Fatalities: 0.00%
No. of Fatal Collisions: 0% of All Fatal Collisions: 0.00%
COLLISION WITH OTHEROBJECT:
Total Collisions: 17% of Total Collisions: 0.07%
Persons Killed: 0% of Total Fatalities: 0.00%
No. of Fatal Collisions: 0% of All Fatal Collisions: 0.00%
NON-COLLISION(INCLUDING OVERTURNED):
Total Collisions: 12% of Total Collisions: 0.05%
Persons Killed: 1% of Total Fatalities: 8.33%
No. of Fatal Collisions: 1% of All Fatal Collisions: 8.33%
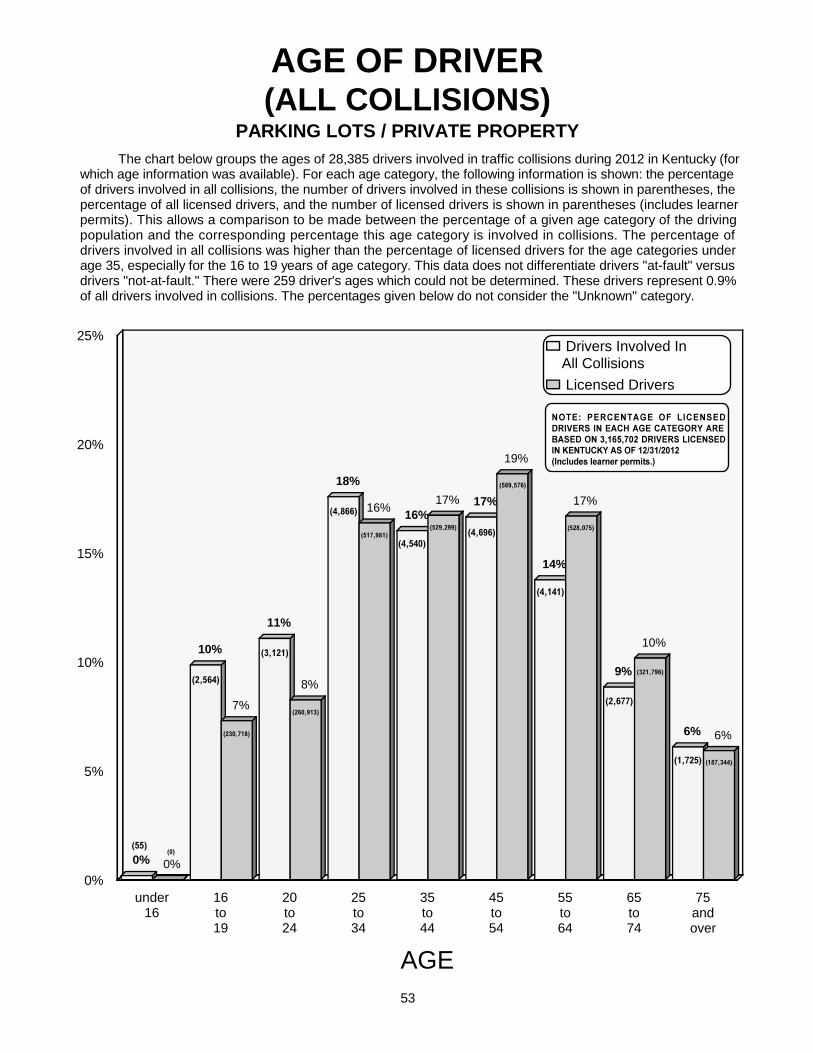
0%
10%
11%
18%
16%17%
14%
9%
6%
0%
7%
8%
16%17%
19%
17%
10%
6%
under16
16to19
20to24
25to34
35to44
45to54
55to64
65to74
75andover
AGE
0%
5%
10%
15%
20%
25% Drivers Involved InAll Collisions
Licensed Drivers
AGE OF DRIVER(ALL COLLISIONS)
The chart below groups the ages of 28,385 drivers involved in traffic collisions during 2012 in Kentucky (for which age information was available). For each age category, the following information is shown: the percentage of drivers involved in all collisions, the number of drivers involved in these collisions is shown in parentheses, the percentage of all licensed drivers, and the number of licensed drivers is shown in parentheses (includes learner permits). This allows a comparison to be made between the percentage of a given age category of the driving population and the corresponding percentage this age category is involved in collisions. The percentage of drivers involved in all collisions was higher than the percentage of licensed drivers for the age categories under age 35, especially for the 16 to 19 years of age category. This data does not differentiate drivers "at-fault" versus drivers "not-at-fault." There were 259 driver's ages which could not be determined. These drivers represent 0.9% of all drivers involved in collisions. The percentages given below do not consider the "Unknown" category.
(2,564)
(3,121)
(4,866)
(4,540)(4,696)
(4,141)
(2,677)
(1,725)
(55)
53
PARKING LOTS / PRIVATE PROPERTY
(0)
(230,718)
(260,913)
(517,981)(529,299)
(589,576)
(528,075)
(321,796)
(187,344)
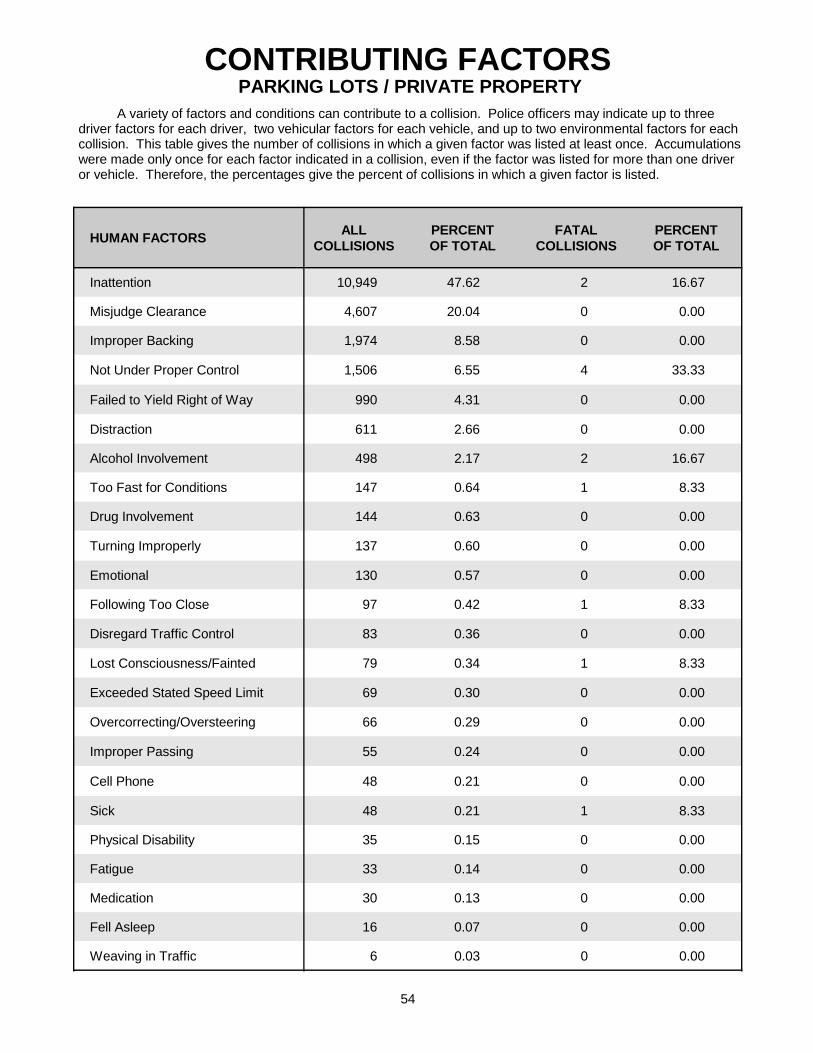
HUMAN FACTORSALL
COLLISIONSPERCENTOF TOTAL
FATALCOLLISIONS
PERCENTOF TOTAL
Inattention 10,949 47.62 2 16.67
Misjudge Clearance 4,607 20.04 0 0.00
Improper Backing 1,974 8.58 0 0.00
Not Under Proper Control 1,506 6.55 4 33.33
Failed to Yield Right of Way 990 4.31 0 0.00
Distraction 611 2.66 0 0.00
Alcohol Involvement 498 2.17 2 16.67
Too Fast for Conditions 147 0.64 1 8.33
Drug Involvement 144 0.63 0 0.00
Turning Improperly 137 0.60 0 0.00
Emotional 130 0.57 0 0.00
Following Too Close 97 0.42 1 8.33
Disregard Traffic Control 83 0.36 0 0.00
Lost Consciousness/Fainted 79 0.34 1 8.33
Exceeded Stated Speed Limit 69 0.30 0 0.00
Overcorrecting/Oversteering 66 0.29 0 0.00
Improper Passing 55 0.24 0 0.00
Cell Phone 48 0.21 0 0.00
Sick 48 0.21 1 8.33
Physical Disability 35 0.15 0 0.00
Fatigue 33 0.14 0 0.00
Medication 30 0.13 0 0.00
Fell Asleep 16 0.07 0 0.00
Weaving in Traffic 6 0.03 0 0.00
CONTRIBUTING FACTORS
A variety of factors and conditions can contribute to a collision. Police officers may indicate up to three driver factors for each driver, two vehicular factors for each vehicle, and up to two environmental factors for each collision. This table gives the number of collisions in which a given factor was listed at least once. Accumulations were made only once for each factor indicated in a collision, even if the factor was listed for more than one driver or vehicle. Therefore, the percentages give the percent of collisions in which a given factor is listed.
54
PARKING LOTS / PRIVATE PROPERTY
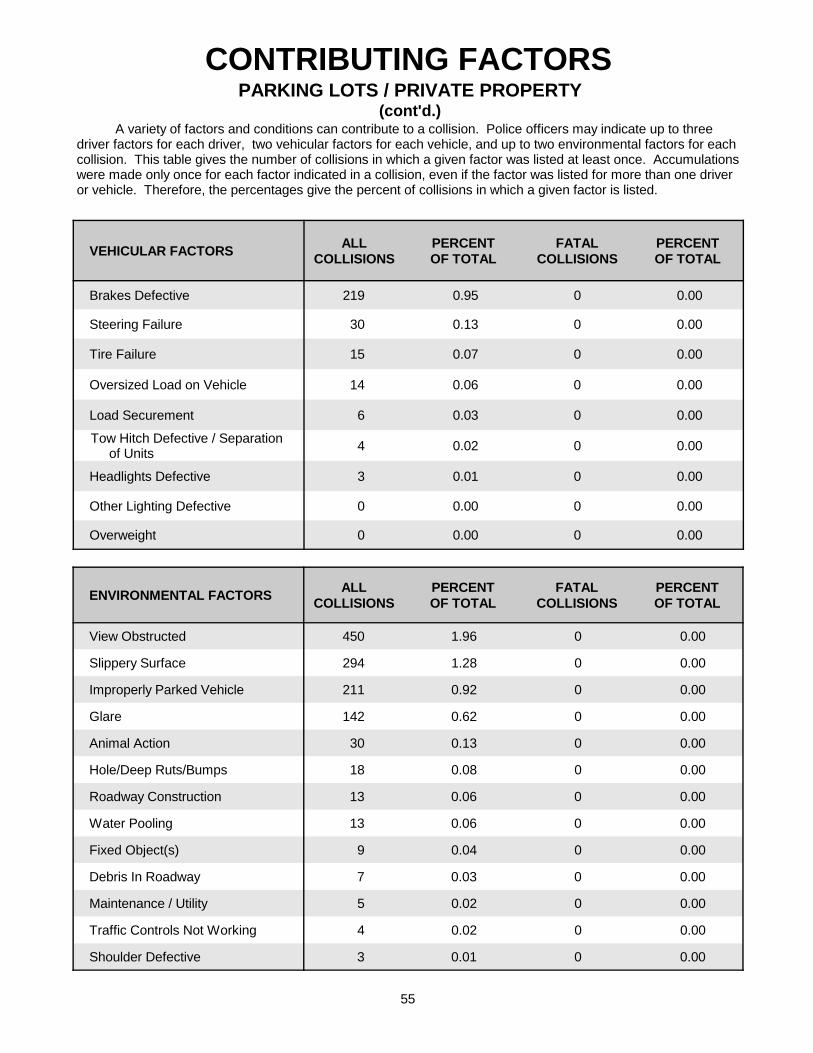
VEHICULAR FACTORSALL
COLLISIONSPERCENTOF TOTAL
FATALCOLLISIONS
PERCENTOF TOTAL
Brakes Defective 219 0.95 0 0.00
Steering Failure 30 0.13 0 0.00
Tire Failure 15 0.07 0 0.00
Oversized Load on Vehicle 14 0.06 0 0.00
Load Securement 6 0.03 0 0.00
Tow Hitch Defective / Separation of Units
4 0.02 0 0.00
Headlights Defective 3 0.01 0 0.00
Other Lighting Defective 0 0.00 0 0.00
Overweight 0 0.00 0 0.00
CONTRIBUTING FACTORS
A variety of factors and conditions can contribute to a collision. Police officers may indicate up to three driver factors for each driver, two vehicular factors for each vehicle, and up to two environmental factors for each collision. This table gives the number of collisions in which a given factor was listed at least once. Accumulations were made only once for each factor indicated in a collision, even if the factor was listed for more than one driver or vehicle. Therefore, the percentages give the percent of collisions in which a given factor is listed.
55
ENVIRONMENTAL FACTORSALL
COLLISIONSPERCENTOF TOTAL
FATALCOLLISIONS
PERCENTOF TOTAL
View Obstructed 450 1.96 0 0.00
Slippery Surface 294 1.28 0 0.00
Improperly Parked Vehicle 211 0.92 0 0.00
Glare 142 0.62 0 0.00
Animal Action 30 0.13 0 0.00
Hole/Deep Ruts/Bumps 18 0.08 0 0.00
Roadway Construction 13 0.06 0 0.00
Water Pooling 13 0.06 0 0.00
Fixed Object(s) 9 0.04 0 0.00
Debris In Roadway 7 0.03 0 0.00
Maintenance / Utility 5 0.02 0 0.00
Traffic Controls Not Working 4 0.02 0 0.00
Shoulder Defective 3 0.01 0 0.00
PARKING LOTS / PRIVATE PROPERTY(cont'd.)

FATALITY
ANALYSIS
REPORTING
SYSTEM

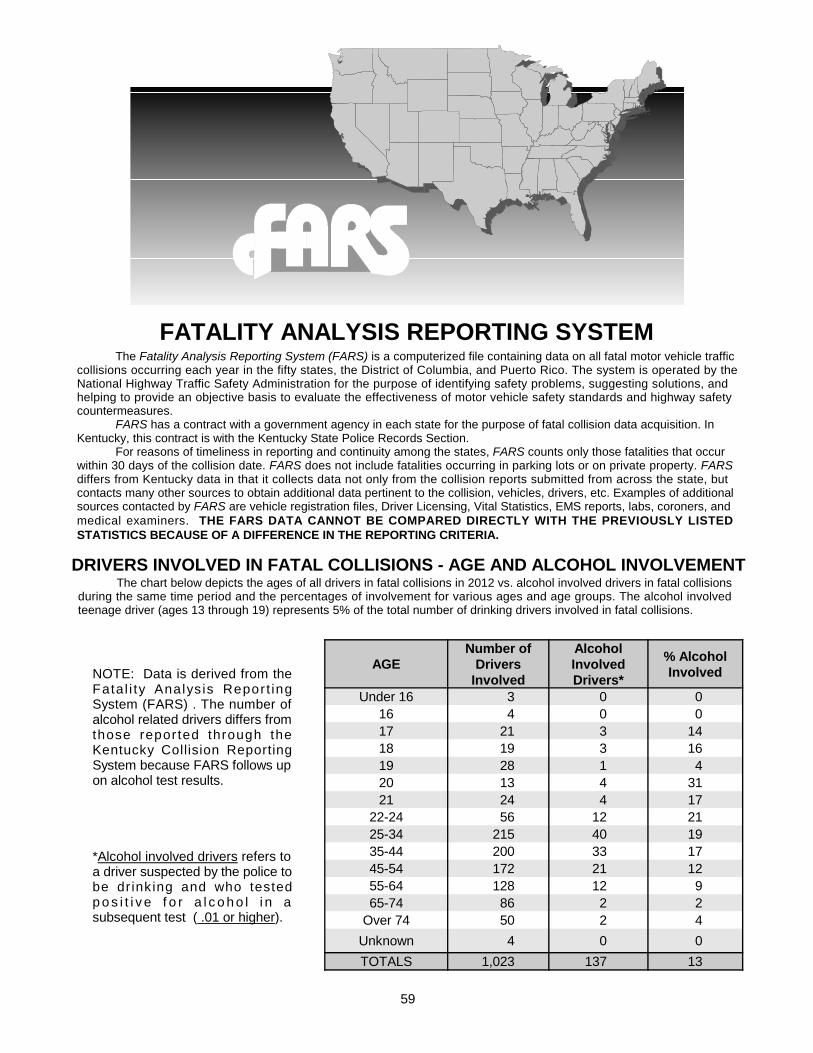
FATALITY ANALYSIS REPORTING SYSTEMThe Fatality Analysis Reporting System (FARS) is a computerized file containing data on all fatal motor vehicle traffic
collisions occurring each year in the fifty states, the District of Columbia, and Puerto Rico. The system is operated by the National Highway Traffic Safety Administration for the purpose of identifying safety problems, suggesting solutions, and helping to provide an objective basis to evaluate the effectiveness of motor vehicle safety standards and highway safety countermeasures.
FARS has a contract with a government agency in each state for the purpose of fatal collision data acquisition. In Kentucky, this contract is with the Kentucky State Police Records Section.
For reasons of timeliness in reporting and continuity among the states, FARS counts only those fatalities that occur within 30 days of the collision date. FARS does not include fatalities occurring in parking lots or on private property. FARS differs from Kentucky data in that it collects data not only from the collision reports submitted from across the state, but contacts many other sources to obtain additional data pertinent to the collision, vehicles, drivers, etc. Examples of additional sources contacted by FARS are vehicle registration files, Driver Licensing, Vital Statistics, EMS reports, labs, coroners, and medical examiners. THE FARS DATA CANNOT BE COMPARED DIRECTLY WITH THE PREVIOUSLY LISTED STATISTICS BECAUSE OF A DIFFERENCE IN THE REPORTING CRITERIA.
The chart below depicts the ages of all drivers in fatal collisions in 2012 vs. alcohol involved drivers in fatal collisions during the same time period and the percentages of involvement for various ages and age groups. The alcohol involved teenage driver (ages 13 through 19) represents 5% of the total number of drinking drivers involved in fatal collisions.
DRIVERS INVOLVED IN FATAL COLLISIONS - AGE AND ALCOHOL INVOLVEMENT
59
NOTE: Data is derived from the Fatal i ty Analys is Repor t ing System (FARS) . The number of alcohol related drivers differs from those repor ted through the Kentucky Collision Reporting System because FARS follows up on alcohol test results.
*Alcohol involved drivers refers to a driver suspected by the police to be dr ink ing and who tested p o s i t i v e f o r a l c o h o l i n a subsequent test ( .01 or higher).
AGENumber of
DriversInvolved
AlcoholInvolvedDrivers*
% AlcoholInvolved
Under 16 3 0 016 4 0 017 21 3 1418 19 3 1619 28 1 420 13 4 3121 24 4 17
22-24 56 12 2125-34 215 40 1935-44 200 33 1745-54 172 21 1255-64 128 12 965-74 86 2 2
Over 74 50 2 4
Unknown 4 0 0
TOTALS 1,023 137 13
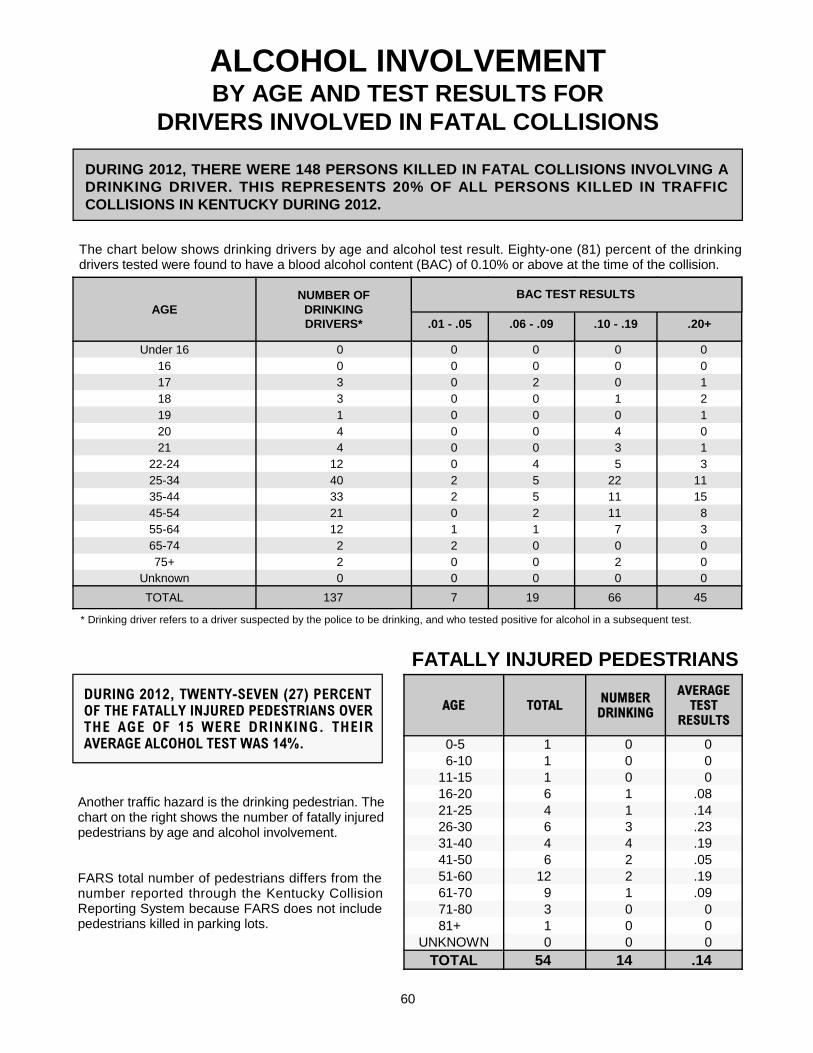
ALCOHOL INVOLVEMENTBY AGE AND TEST RESULTS FOR
DRIVERS INVOLVED IN FATAL COLLISIONS
The chart below shows drinking drivers by age and alcohol test result. Eighty-one (81) percent of the drinking drivers tested were found to have a blood alcohol content (BAC) of 0.10% or above at the time of the collision.
AGENUMBER OFDRINKINGDRIVERS* .01 - .05 .06 - .09 .10 - .19 .20+
Under 16 0 0 0 0 016 0 0 0 0 017 3 0 2 0 118 3 0 0 1 219 1 0 0 0 120 4 0 0 4 021 4 0 0 3 1
22-24 12 0 4 5 325-34 40 2 5 22 1135-44 33 2 5 11 1545-54 21 0 2 11 855-64 12 1 1 7 365-74 2 2 0 0 075+ 2 0 0 2 0
Unknown 0 0 0 0 0
TOTAL 137 7 19 66 45
* Drinking driver refers to a driver suspected by the police to be drinking, and who tested positive for alcohol in a subsequent test.
AGE TOTAL NUMBERDRINKING
AVERAGETEST
RESULTS
0-5 1 0 06-10 1 0 0
11-15 1 0 016-20 6 1 .0821-25 4 1 .1426-30 6 3 .2331-40 4 4 .1941-50 6 2 .0551-60 12 2 .1961-70 9 1 .0971-80 3 0 081+ 1 0 0
UNKNOWN 0 0 0TOTAL 54 14 .14
60
BAC TEST RESULTS
FATALLY INJURED PEDESTRIANS
Another traffic hazard is the drinking pedestrian. The chart on the right shows the number of fatally injured pedestrians by age and alcohol involvement.
FARS total number of pedestrians differs from the number reported through the Kentucky Collision Reporting System because FARS does not include pedestrians killed in parking lots.
DURING 2012, THERE WERE 148 PERSONS KILLED IN FATAL COLLISIONS INVOLVING A DRINKING DRIVER. THIS REPRESENTS 20% OF ALL PERSONS KILLED IN TRAFFIC COLLISIONS IN KENTUCKY DURING 2012.
DURING 2012, TWENTY-SEVEN (27) PERCENT OF THE FATALLY INJURED PEDESTRIANS OVER THE AGE OF 15 WERE DRINKING. THEIR AVERAGE ALCOHOL TEST WAS 14%.
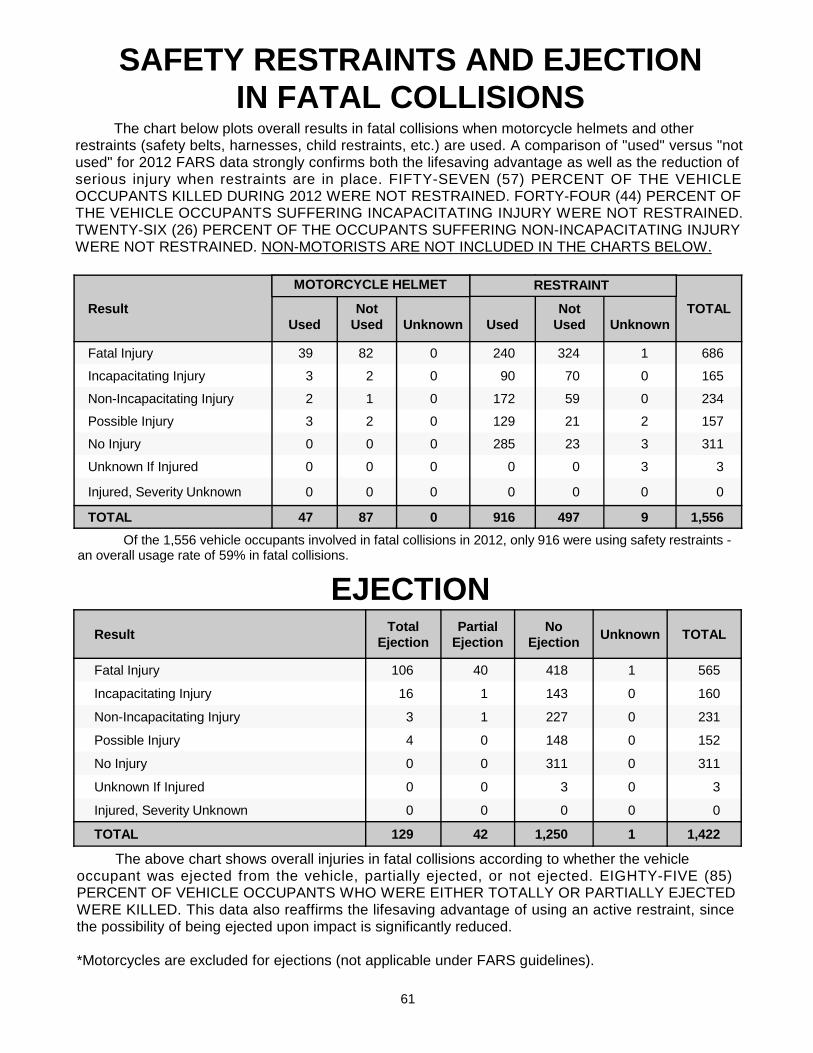
ResultUsed
NotUsed Unknown Used
NotUsed Unknown
TOTAL
Fatal Injury 39 82 0 240 324 1 686
Incapacitating Injury 3 2 0 90 70 0 165
Non-Incapacitating Injury 2 1 0 172 59 0 234
Possible Injury 3 2 0 129 21 2 157
No Injury 0 0 0 285 23 3 311
Unknown If Injured 0 0 0 0 0 3 3
Injured, Severity Unknown 0 0 0 0 0 0 0
TOTAL 47 87 0 916 497 9 1,556
SAFETY RESTRAINTS AND EJECTIONIN FATAL COLLISIONS
The chart below plots overall results in fatal collisions when motorcycle helmets and other restraints (safety belts, harnesses, child restraints, etc.) are used. A comparison of "used" versus "not used" for 2012 FARS data strongly confirms both the lifesaving advantage as well as the reduction of serious injury when restraints are in place. FIFTY-SEVEN (57) PERCENT OF THE VEHICLE OCCUPANTS KILLED DURING 2012 WERE NOT RESTRAINED. FORTY-FOUR (44) PERCENT OF THE VEHICLE OCCUPANTS SUFFERING INCAPACITATING INJURY WERE NOT RESTRAINED. TWENTY-SIX (26) PERCENT OF THE OCCUPANTS SUFFERING NON-INCAPACITATING INJURY WERE NOT RESTRAINED. NON-MOTORISTS ARE NOT INCLUDED IN THE CHARTS BELOW.
ResultTotal
EjectionPartial
EjectionNo
EjectionUnknown TOTAL
Fatal Injury 106 40 418 1 565
Incapacitating Injury 16 1 143 0 160
Non-Incapacitating Injury 3 1 227 0 231
Possible Injury 4 0 148 0 152
No Injury 0 0 311 0 311
Unknown If Injured 0 0 3 0 3
Injured, Severity Unknown 0 0 0 0 0
TOTAL 129 42 1,250 1 1,422
EJECTION
The above chart shows overall injuries in fatal collisions according to whether the vehicle occupant was ejected from the vehicle, partially ejected, or not ejected. EIGHTY-FIVE (85) PERCENT OF VEHICLE OCCUPANTS WHO WERE EITHER TOTALLY OR PARTIALLY EJECTED WERE KILLED. This data also reaffirms the lifesaving advantage of using an active restraint, since the possibility of being ejected upon impact is significantly reduced.
*Motorcycles are excluded for ejections (not applicable under FARS guidelines).
61
MOTORCYCLE HELMET RESTRAINT
Of the 1,556 vehicle occupants involved in fatal collisions in 2012, only 916 were using safety restraints - an overall usage rate of 59% in fatal collisions.
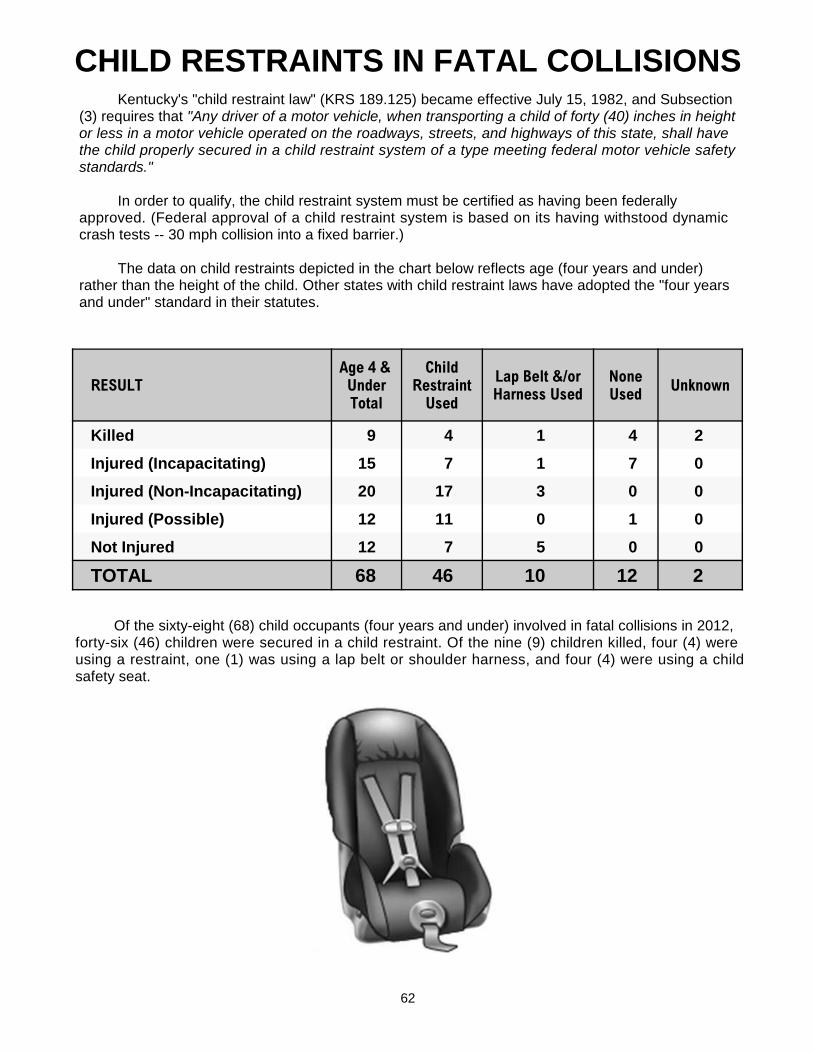
62
RESULTAge 4 &UnderTotal
Child Restraint
Used
Lap Belt &/orHarness Used
NoneUsed
Unknown
Killed 9 4 1 4 2
Injured (Incapacitating) 15 7 1 7 0
Injured (Non-Incapacitating) 20 17 3 0 0
Injured (Possible) 12 11 0 1 0
Not Injured 12 7 5 0 0
TOTAL 68 46 10 12 2
CHILD RESTRAINTS IN FATAL COLLISIONSKentucky's "child restraint law" (KRS 189.125) became effective July 15, 1982, and Subsection
(3) requires that "Any driver of a motor vehicle, when transporting a child of forty (40) inches in height or less in a motor vehicle operated on the roadways, streets, and highways of this state, shall have the child properly secured in a child restraint system of a type meeting federal motor vehicle safety standards."
In order to qualify, the child restraint system must be certified as having been federally approved. (Federal approval of a child restraint system is based on its having withstood dynamic crash tests -- 30 mph collision into a fixed barrier.)
The data on child restraints depicted in the chart below reflects age (four years and under) rather than the height of the child. Other states with child restraint laws have adopted the "four years and under" standard in their statutes.
Of the sixty-eight (68) child occupants (four years and under) involved in fatal collisions in 2012, forty-six (46) children were secured in a child restraint. Of the nine (9) children killed, four (4) were using a restraint, one (1) was using a lap belt or shoulder harness, and four (4) were using a child safety seat.
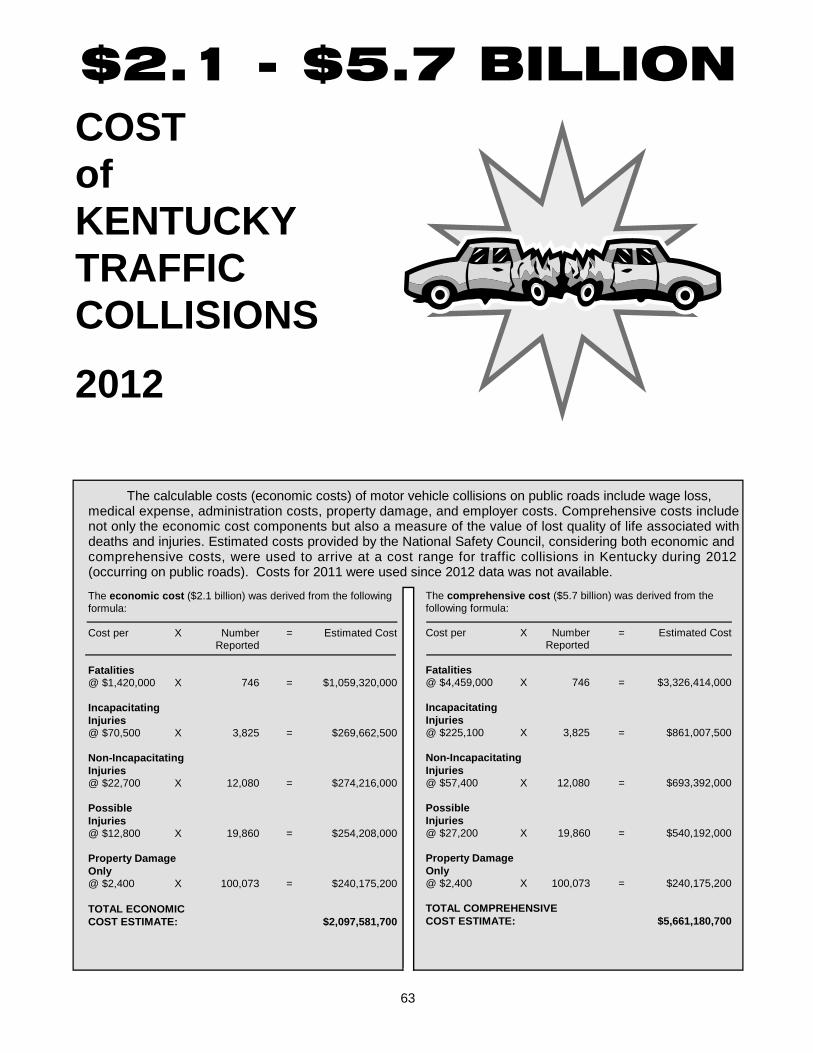
$2.1 - $5.7 BILLIONCOSTofKENTUCKYTRAFFICCOLLISIONS
2012
The calculable costs (economic costs) of motor vehicle collisions on public roads include wage loss, medical expense, administration costs, property damage, and employer costs. Comprehensive costs include not only the economic cost components but also a measure of the value of lost quality of life associated with deaths and injuries. Estimated costs provided by the National Safety Council, considering both economic and comprehensive costs, were used to arrive at a cost range for traffic collisions in Kentucky during 2012 (occurring on public roads). Costs for 2011 were used since 2012 data was not available.
The economic cost ($2.1 billion) was derived from the following formula:
Cost per X Number = Estimated Cost Reported
Fatalities@ $1,420,000 X 746 = $1,059,320,000
IncapacitatingInjuries@ $70,500 X 3,825 = $269,662,500
Non-IncapacitatingInjuries@ $22,700 X 12,080 = $274,216,000
PossibleInjuries@ $12,800 X 19,860 = $254,208,000
Property DamageOnly@ $2,400 X 100,073 = $240,175,200
TOTAL ECONOMICCOST ESTIMATE: $2,097,581,700
The comprehensive cost ($5.7 billion) was derived from the following formula:
Cost per X Number = Estimated Cost Reported
Fatalities@ $4,459,000 X 746 = $3,326,414,000
IncapacitatingInjuries@ $225,100 X 3,825 = $861,007,500
Non-IncapacitatingInjuries@ $57,400 X 12,080 = $693,392,000
PossibleInjuries@ $27,200 X 19,860 = $540,192,000
Property DamageOnly@ $2,400 X 100,073 = $240,175,200
TOTAL COMPREHENSIVECOST ESTIMATE: $5,661,180,700
63
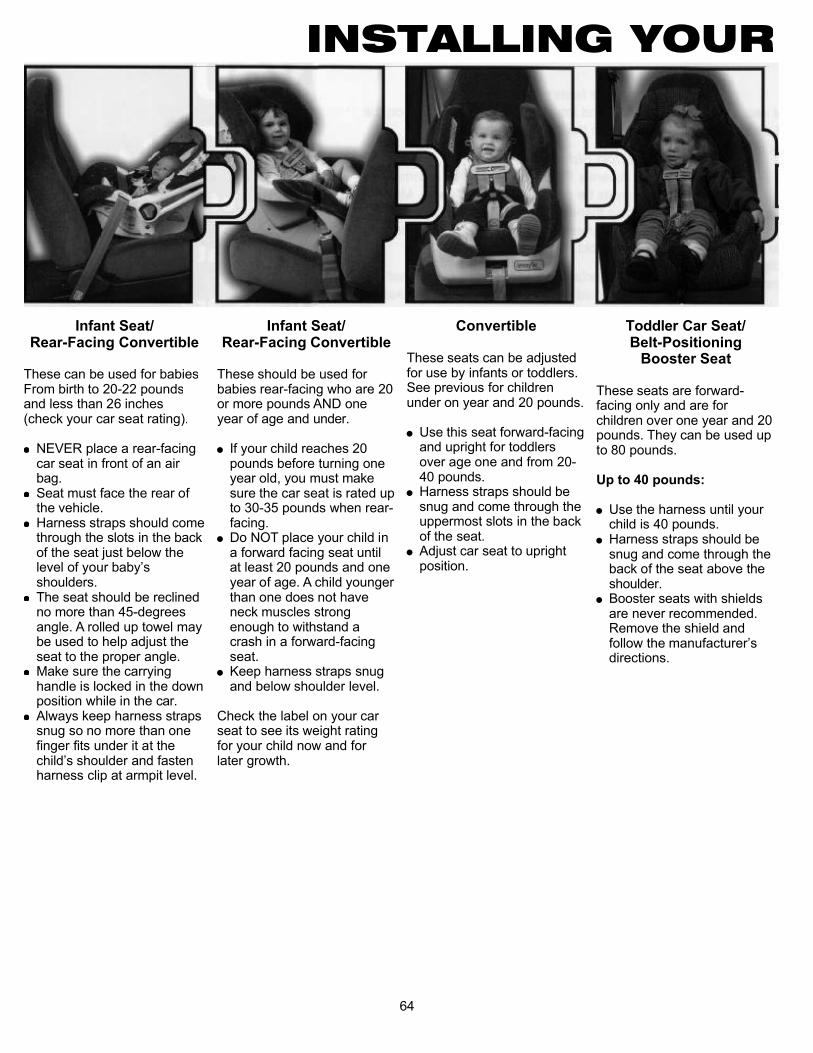
Infant Seat/Rear-Facing Convertible
These can be used for babiesFrom birth to 20-22 poundsand less than 26 inches(check your car seat rating).
NEVER place a rear-facingcar seat in front of an airbag.Seat must face the rear ofthe vehicle.Harness straps should comethrough the slots in the backof the seat just below thelevel of your baby’sshoulders.The seat should be reclinedno more than 45-degreesangle. A rolled up towel maybe used to help adjust theseat to the proper angle.Make sure the carryinghandle is locked in the downposition while in the car.Always keep harness strapssnug so no more than onefinger fits under it at thechild’s shoulder and fastenharness clip at armpit level.
!
!
!
!
!
!
Infant Seat/Rear-Facing Convertible
These should be used forbabies rear-facing who are 20or more pounds AND oneyear of age and under.
If your child reaches 20pounds before turning oneyear old, you must makesure the car seat is rated upto 30-35 pounds when rear-facing.Do NOT place your child ina forward facing seat untilat least 20 pounds and oneyear of age. A child youngerthan one does not haveneck muscles strongenough to withstand acrash in a forward-facingseat.Keep harness straps snugand below shoulder level.
Check the label on your carseat to see its weight ratingfor your child now and forlater growth.
!
!
!
Convertible
These seats can be adjustedfor use by infants or toddlers.See previous for childrenunder on year and 20 pounds.
Use this seat forward-facingand upright for toddlersover age one and from 20-40 pounds.Harness straps should besnug and come through theuppermost slots in the backof the seat.Adjust car seat to uprightposition.
!
!
!
Toddler Car Seat/Belt-Positioning
Booster Seat
These seats are forward-facing only and are forchildren over one year and 20pounds. They can be used upto 80 pounds.
Use the harness until yourchild is 40 pounds.Harness straps should besnug and come through theback of the seat above theshoulder.Booster seats with shieldsare never recommended.Remove the shield andfollow the manufacturer’sdirections.
Up to 40 pounds:
!
!
!
INSTALLING YOUR
64
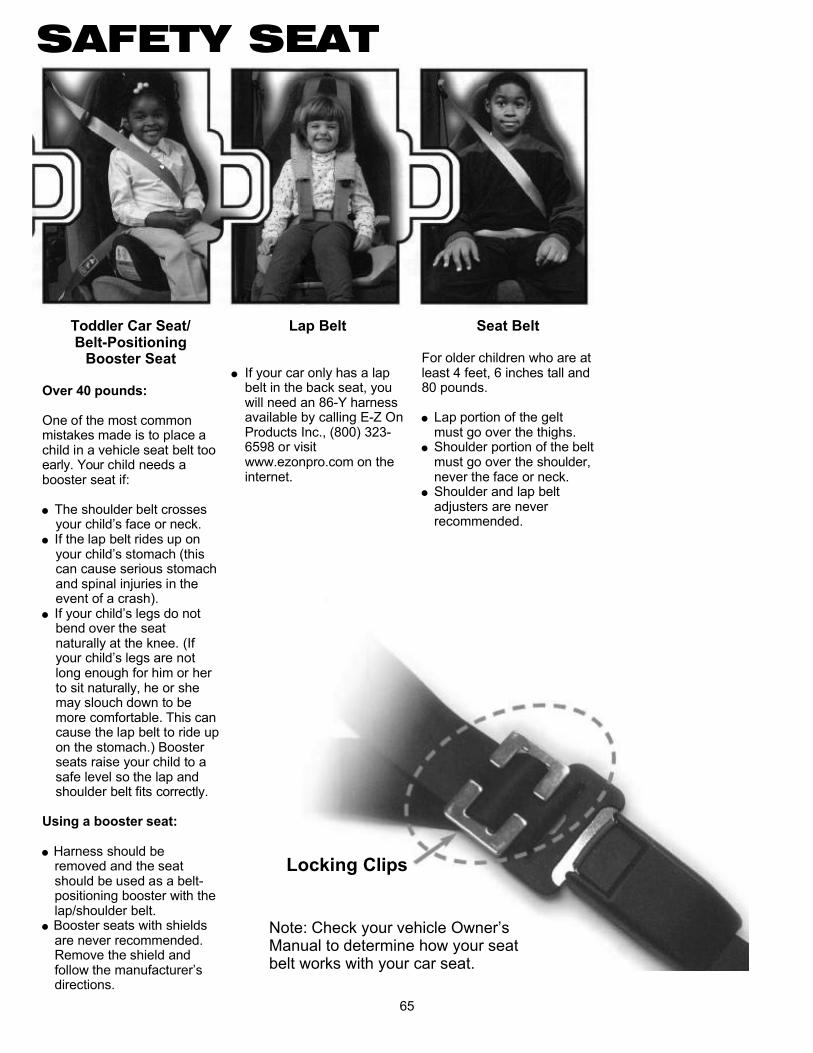
Toddler Car Seat/Belt-Positioning
Booster Seat
Over 40 pounds:
Using a booster seat:
One of the most commonmistakes made is to place achild in a vehicle seat belt tooearly. Your child needs abooster seat if:
The shoulder belt crossesyour child’s face or neck.If the lap belt rides up onyour child’s stomach (thiscan cause serious stomachand spinal injuries in theevent of a crash).If your child’s legs do notbend over the seatnaturally at the knee. (Ifyour child’s legs are notlong enough for him or herto sit naturally, he or shemay slouch down to bemore comfortable. This cancause the lap belt to ride upon the stomach.) Boosterseats raise your child to asafe level so the lap andshoulder belt fits correctly.
Harness should beremoved and the seatshould be used as a belt-positioning booster with thelap/shoulder belt.Booster seats with shieldsare never recommended.Remove the shield andfollow the manufacturer’sdirections.
!
!
!
!
!
Lap Belt
! If your car only has a lapbelt in the back seat, youwill need an 86-Y harnessavailable by calling E-Z OnProducts Inc., (800) 323-6598 or visitwww.ezonpro.com on theinternet.
Seat Belt
For older children who are atleast 4 feet, 6 inches tall and80 pounds.
Lap portion of the geltmust go over the thighs.Shoulder portion of the beltmust go over the shoulder,never the face or neck.Shoulder and lap beltadjusters are neverrecommended.
!
!
!
SAFETY SEAT
Locking Clips
Note: Check your vehicle Owner’sManual to determine how your seatbelt works with your car seat.
65