kentucky economics association october 2014 paul coomes, ph.d. emeritus professor of economics...
TRANSCRIPT

Kentucky Economics AssociationOctober 2014
Paul Coomes, Ph.D.Emeritus Professor of Economics
University of Louisville
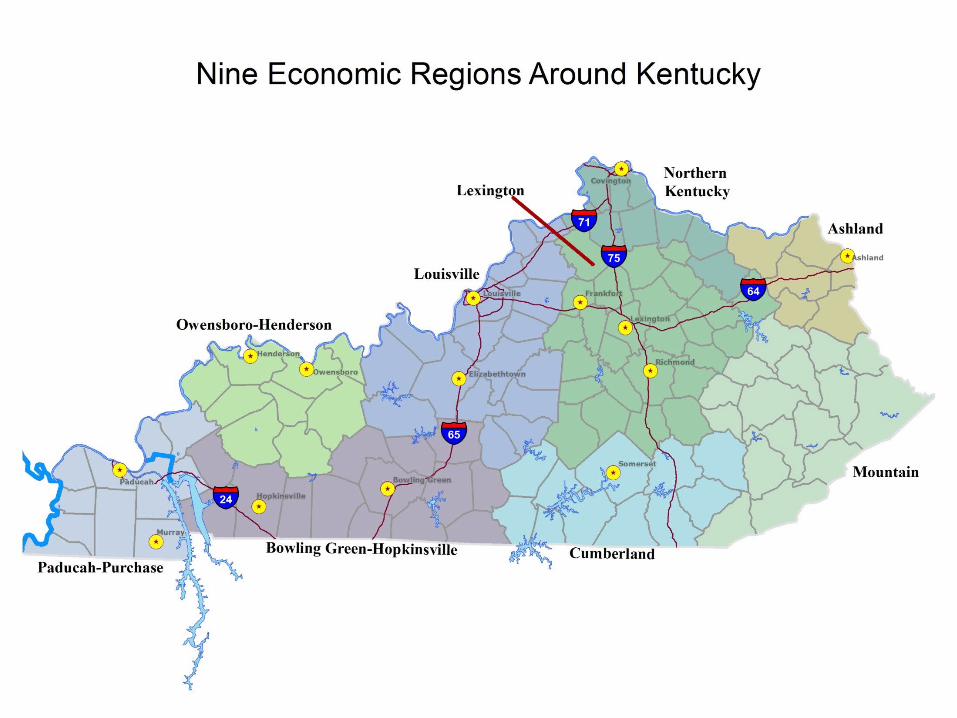
Nine Economic Regions of Kentuckyprovocative facts, policy challenges for future
What was Kentucky’s 1958 rank among states in terms of earned per capita income?
32nd
38th
46th
50th
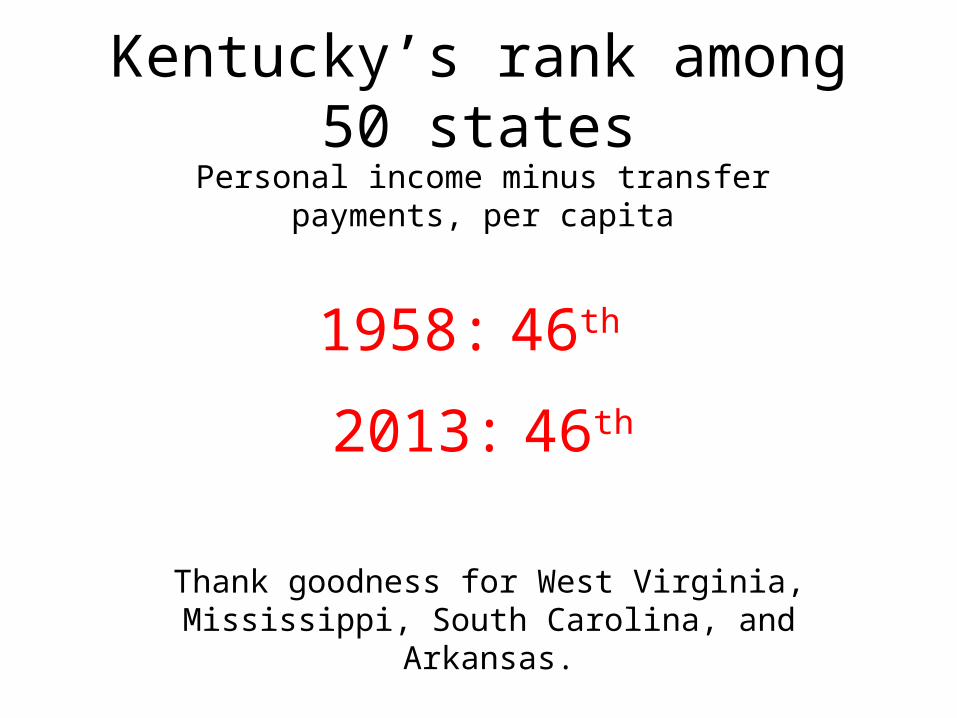
Kentucky’s rank among 50 statesPersonal income minus transfer payments, per capita
1958: 46th
2013: 46th
Thank goodness for West Virginia, Mississippi, South Carolina, and Arkansas.
0.62
0.64
0.66
0.68
0.70
0.72
0.74
0.76
0.78
0.80
0.82
0.84
1958 1963 1968 1973 1978 1983 1988 1993 1998 2003 2008 2013
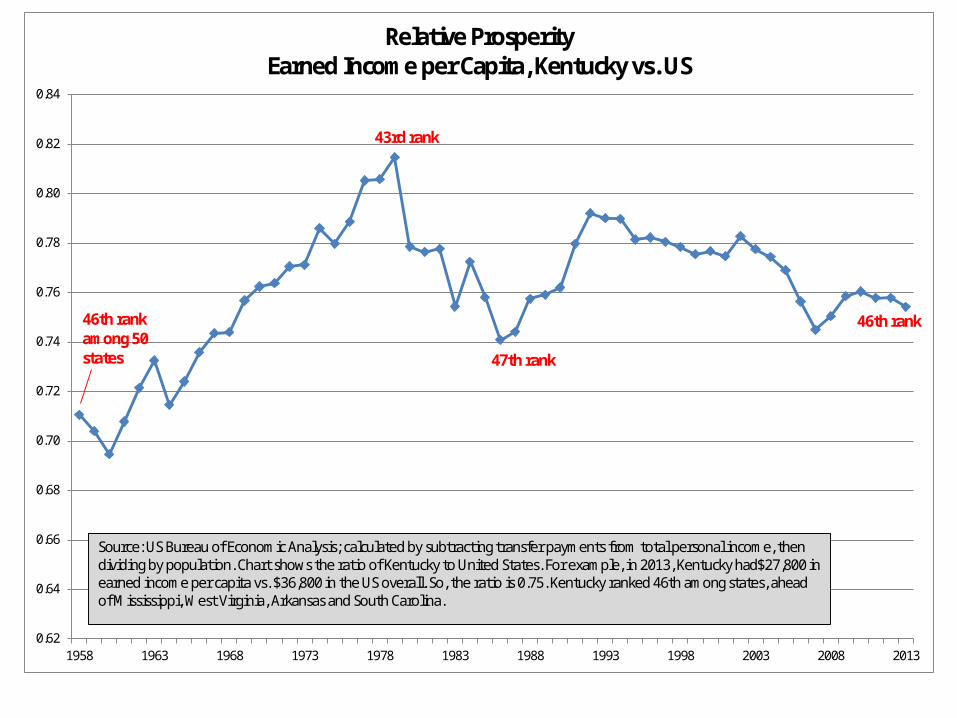
Relative ProsperityEarned Income per Capita, Kentucky vs. US
Source: US Bureau of Economic Analysis; calculated by subtracting transfer payments from total personal income, then dividing by population. Chart shows the ratio of Kentucky to United States. For example, in 2013, Kentucky had$27,800 in earned income per capita vs. $36,800 in the US overall. So, the ratio is 0.75. Kentucky ranked 46th among states, ahead of Mississippi, West Virginia, Arkansas and South Carolina.
46th rank among 50 states
43rd rank
47th rank
46th rank
Regional Economic Development in KentuckyWhere are we? Where have we been? Where are we going?
Talking about the per capita income of Kentuckians is like talking about the average elevation of Colorado. It is the variation around the average that is interesting.
The State of Kentucky is not an economy in any meaningful sense – not a labor market, not a housing market, not a retail market, not a media market. States, counties, municipalities are political and administrative entities.
While a county is closer than a state to a market boundary, most markets encompass many counties. Consider television market areas (the ABC, CBS, NBC network broadcast territories).
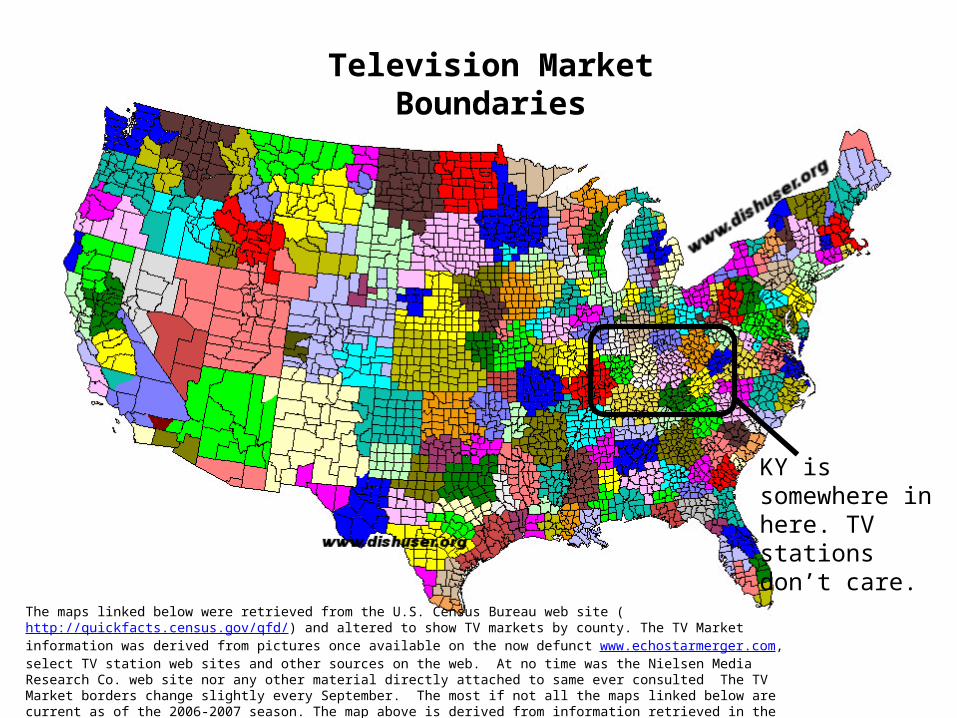
Television Market Boundaries
The maps linked below were retrieved from the U.S. Census Bureau web site (http://quickfacts.census.gov/qfd/) and altered to show TV markets by county. The TV Market information was derived from pictures once available on the now defunct www.echostarmerger.com, select TV station web sites and other sources on the web. At no time was the Nielsen Media Research Co. web site nor any other material directly attached to same ever consulted The TV Market borders change slightly every September. The most if not all the maps linked below are current as of the 2006-2007 season. The map above is derived from information retrieved in the 2002-2003 season and is there for historical purposes. If you have any questions, comments or corrections, please e-mail me at [email protected]
KY is somewhere in here. TV stations don’t care.
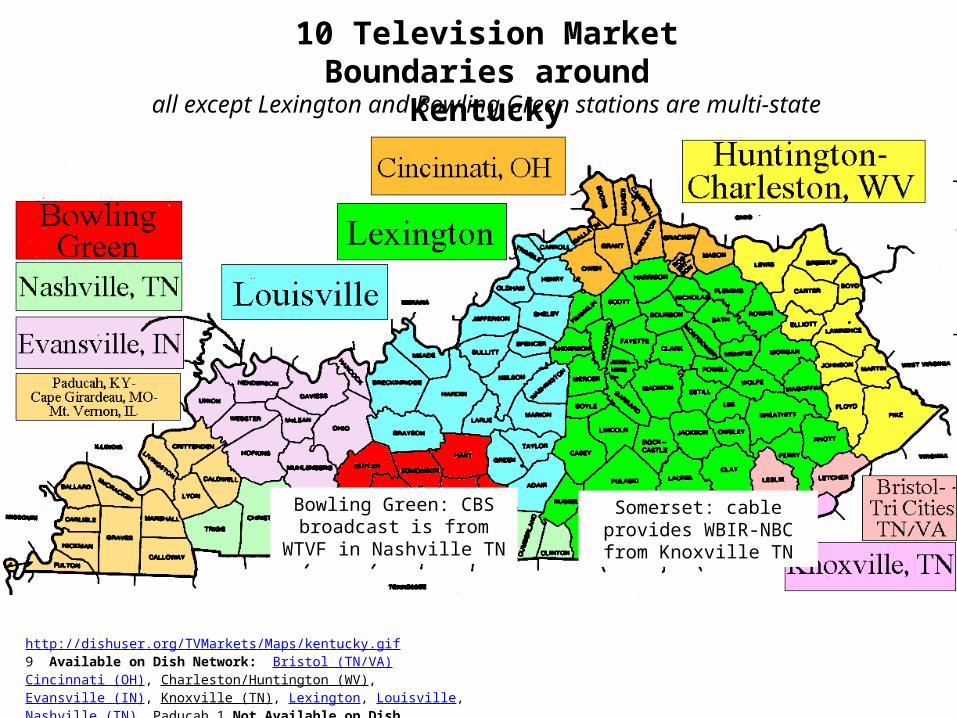
http://dishuser.org/TVMarkets/Maps/kentucky.gif9 Available on Dish Network: Bristol (TN/VA) Cincinnati (OH), Charleston/Huntington (WV), Evansville (IN), Knoxville (TN), Lexington, Louisville, Nashville (TN), Paducah 1 Not Available on Dish Network: Bowling Green
Somerset: cable provides WBIR-NBC from Knoxville TN
Bowling Green: CBS broadcast is from WTVF in Nashville TN
10 Television Market Boundaries around Kentucky
all except Lexington and Bowling Green stations are multi-state
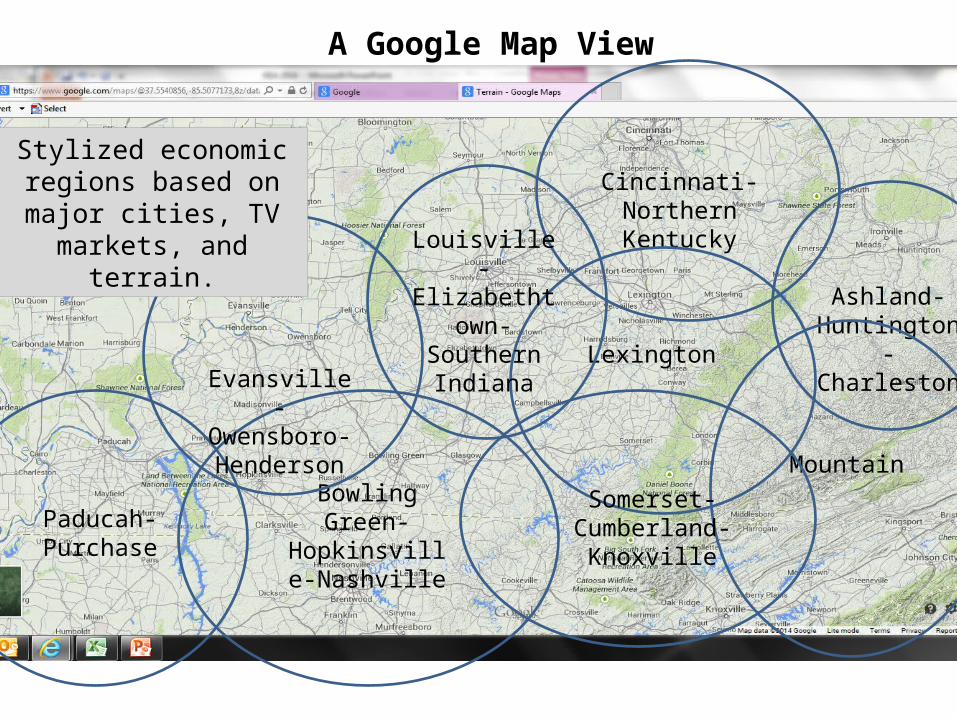
A Google Map View
Cincinnati- Northern Kentucky
Ashland-Huntington-CharlestonLexington
Bowling Green-Hopkinsville-
NashvillePaducah-Purchase
Evansville-Owensboro-Henderson
Louisville-Elizabethtown-
Southern Indiana
Mountain
Stylized economic regions based on major cities, TV
markets, and terrain.
Somerset-Cumberland-
Knoxville
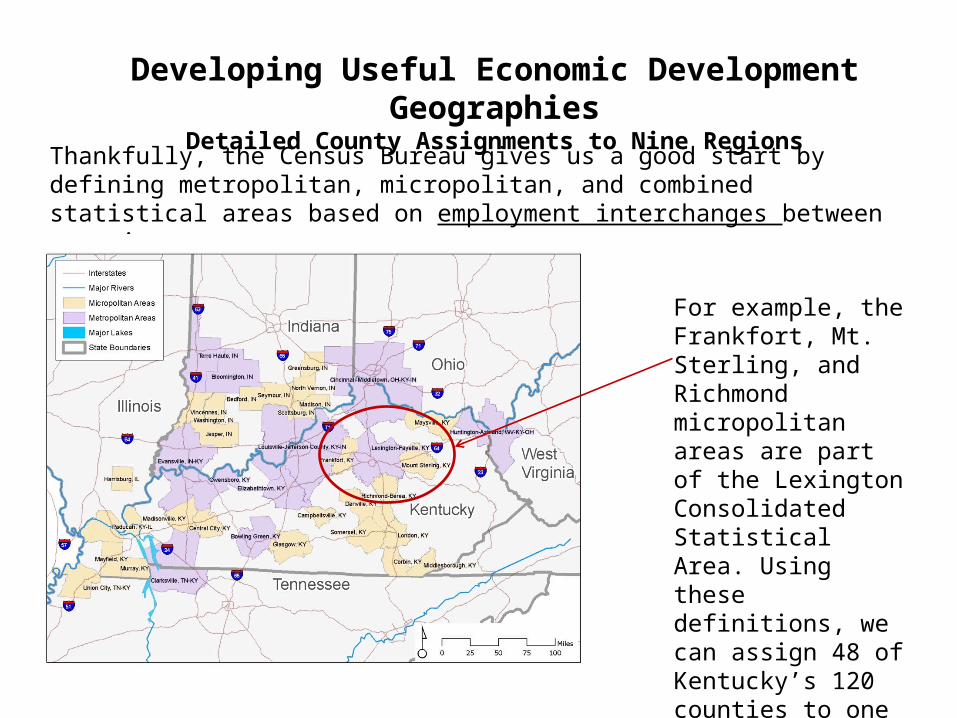
Developing Useful Economic Development GeographiesDetailed County Assignments to Nine Regions
Thankfully, the Census Bureau gives us a good start by defining metropolitan, micropolitan, and combined statistical areas based on employment interchanges between counties.
For example, the Frankfort, Mt. Sterling, and Richmond micropolitan areas are part of the Lexington Consolidated Statistical Area. Using these definitions, we can assign 48 of Kentucky’s 120 counties to one of the nine economic regions.
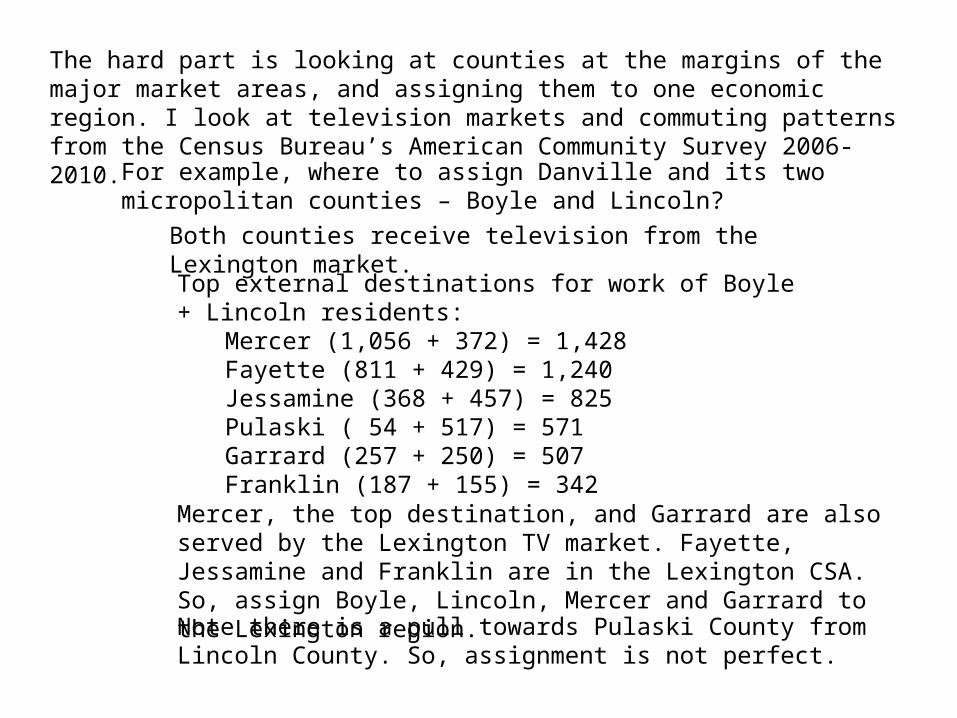
The hard part is looking at counties at the margins of the major market areas, and assigning them to one economic region. I look at television markets and commuting patterns from the Census Bureau’s American Community Survey 2006-2010.
For example, where to assign Danville and its two micropolitan counties – Boyle and Lincoln?
Both counties receive television from the Lexington market.
Top external destinations for work of Boyle + Lincoln residents:Mercer (1,056 + 372) = 1,428Fayette (811 + 429) = 1,240Jessamine (368 + 457) = 825Pulaski ( 54 + 517) = 571Garrard (257 + 250) = 507Franklin (187 + 155) = 342
Mercer, the top destination, and Garrard are also served by the Lexington TV market. Fayette, Jessamine and Franklin are in the Lexington CSA. So, assign Boyle, Lincoln, Mercer and Garrard to the Lexington region.
Note there is a pull towards Pulaski County from Lincoln County. So, assignment is not perfect.
Louisville
Cincinnati
New York
DestinNaples
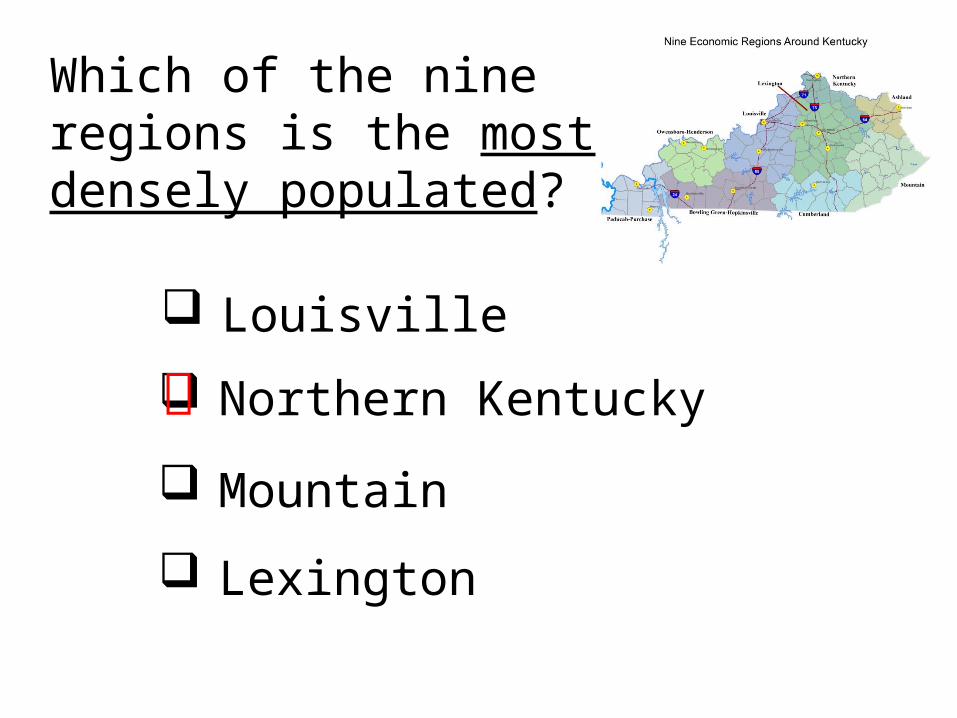
Which of the nine regions is the most densely populated?
Louisville
Northern Kentucky
Mountain
Lexington
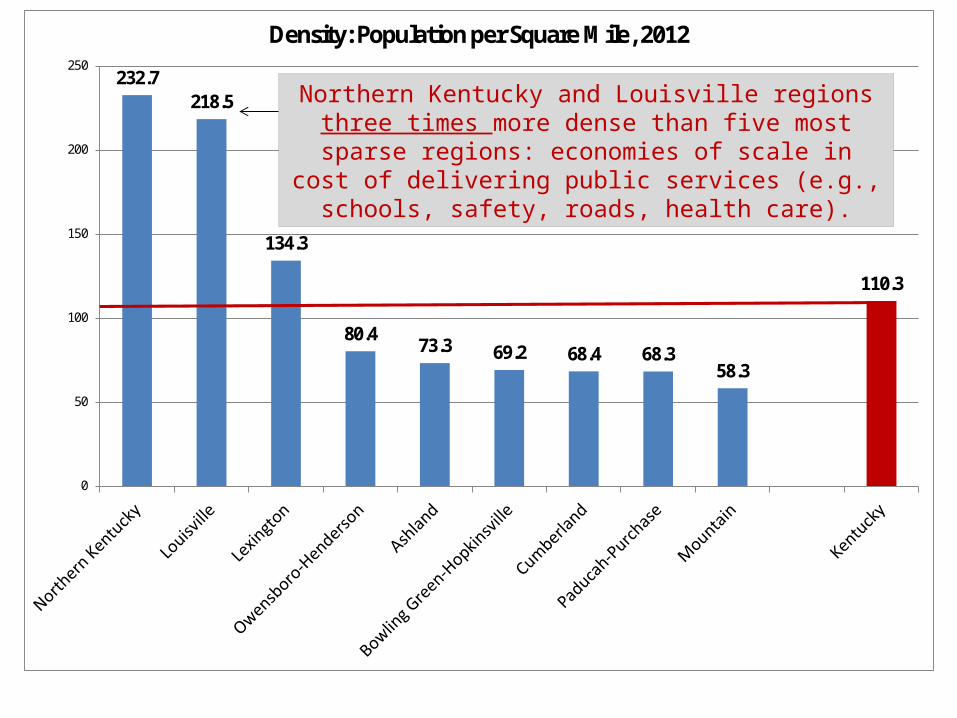
232.7218.5
134.3
80.473.3 69.2 68.4 68.3
58.3
110.3
0
50
100
150
200
250
Density: Population per Square Mile, 2012
Northern Kentucky and Louisville regions three times more dense than five most sparse regions: economies of scale in
cost of delivering public services (e.g., schools, safety, roads, health care).
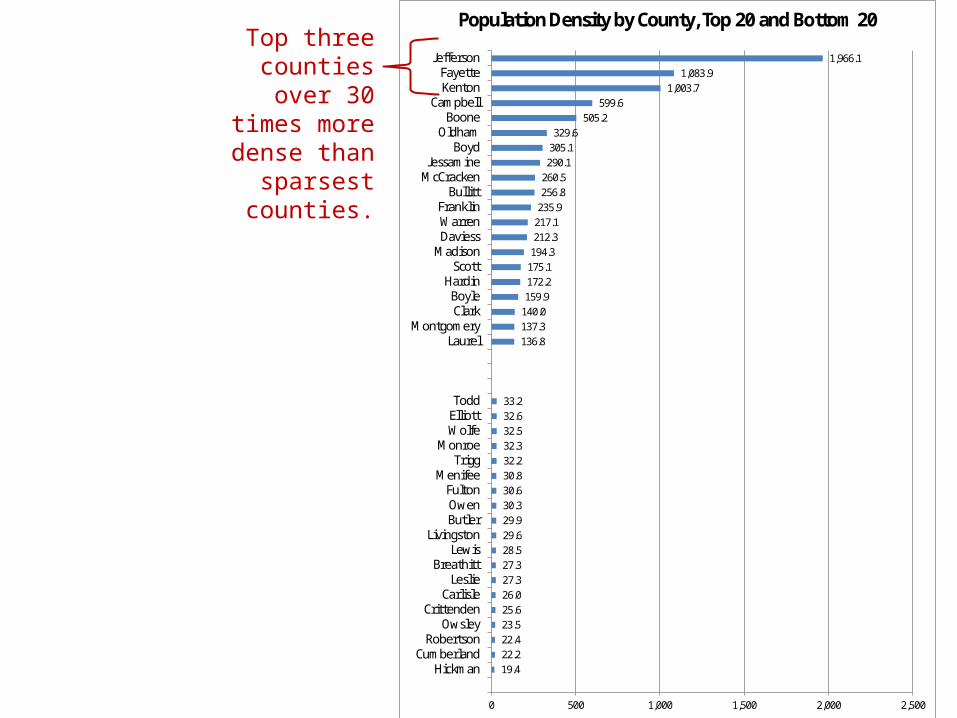
19.422.222.423.525.626.027.327.328.529.629.930.330.630.832.232.332.532.633.2
136.8137.3140.0159.9172.2175.1194.3212.3217.1235.9256.8260.5
290.1305.1329.6
505.2599.6
1,003.71,083.9
1,966.1
0 500 1,000 1,500 2,000 2,500
HickmanCumberland
RobertsonOwsley
CrittendenCarlisle
LeslieBreathitt
LewisLivingston
ButlerOwenFulton
MenifeeTrigg
MonroeWolfeElliottTodd
LaurelMontgomery
ClarkBoyle
HardinScott
MadisonDaviessWarrenFranklin
BullittMcCrackenJessamine
BoydOldham
BooneCampbell
KentonFayette
Jefferson
Population Density by County, Top 20 and Bottom 20Top three
counties over 30 times more dense than
sparsest counties.

Which of the nine regions has the least population growth this decade?
Mountain
Cumberland
Paducah - Purchase
Louisville
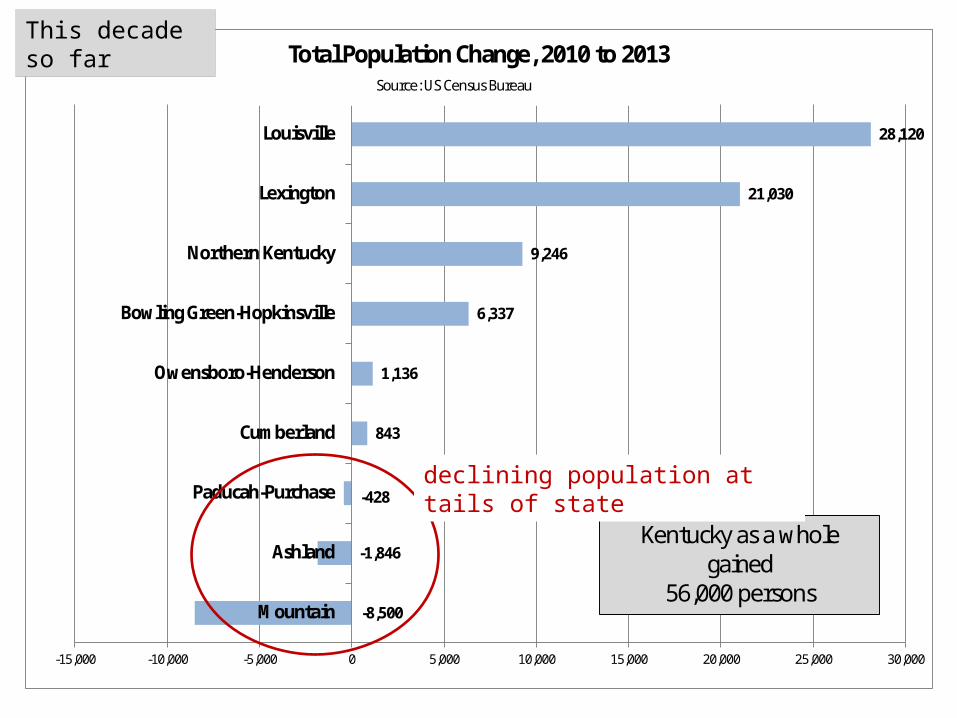
-8,500
-1,846
-428
843
1,136
6,337
9,246
21,030
28,120
-15,000 -10,000 -5,000 0 5,000 10,000 15,000 20,000 25,000 30,000
Mountain
Ashland
Paducah-Purchase
Cumberland
Owensboro-Henderson
Bowling Green-Hopkinsville
Northern Kentucky
Lexington
Louisville
Total Population Change, 2010 to 2013Source: US Census Bureau
Kentucky as a whole gained
56,000 persons
This decade so far
declining population at tails of state
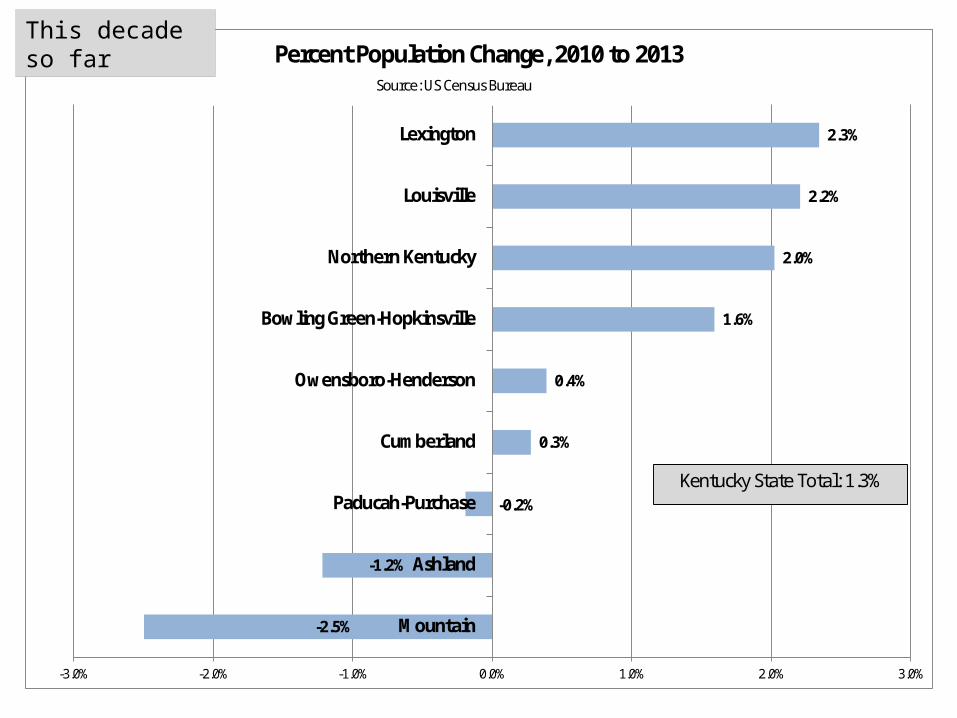
-2.5%
-1.2%
-0.2%
0.3%
0.4%
1.6%
2.0%
2.2%
2.3%
-3.0% -2.0% -1.0% 0.0% 1.0% 2.0% 3.0%
Mountain
Ashland
Paducah-Purchase
Cumberland
Owensboro-Henderson
Bowling Green-Hopkinsville
Northern Kentucky
Louisville
Lexington
Percent Population Change, 2010 to 2013Source: US Census Bureau
Kentucky State Total: 1.3%
This decade so far
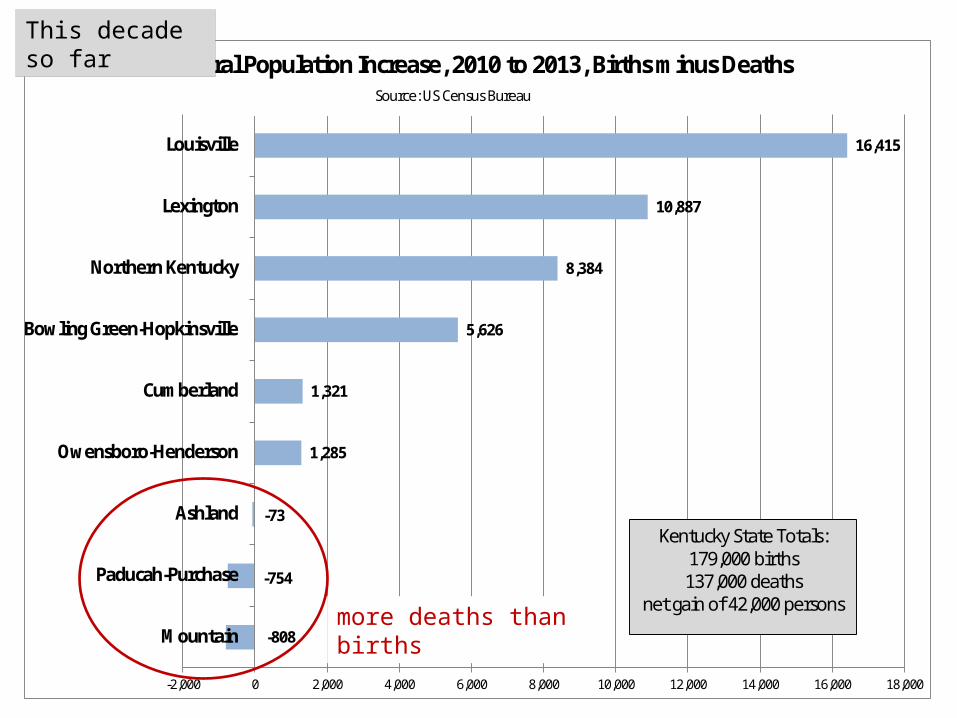
-808
-754
-73
1,285
1,321
5,626
8,384
10,887
16,415
-2,000 0 2,000 4,000 6,000 8,000 10,000 12,000 14,000 16,000 18,000
Mountain
Paducah-Purchase
Ashland
Owensboro-Henderson
Cumberland
Bowling Green-Hopkinsville
Northern Kentucky
Lexington
Louisville
Natural Population Increase, 2010 to 2013, Births minus DeathsSource: US Census Bureau
Kentucky State Totals:179,000 births137,000 deaths
net gain of 42,000 persons
This decade so far
more deaths than births
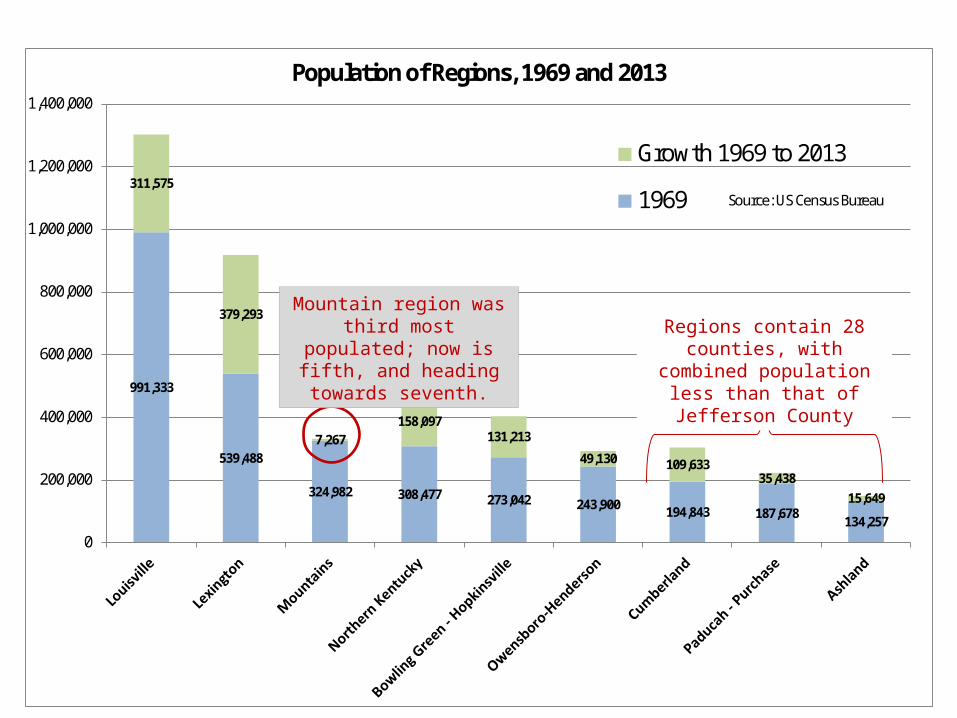
991,333
539,488
324,982 308,477 273,042 243,900 194,843 187,678134,257
311,575
379,293
7,267158,097
131,213
49,130 109,63335,438
15,649
0
200,000
400,000
600,000
800,000
1,000,000
1,200,000
1,400,000
Population of Regions, 1969 and 2013
Growth 1969 to 2013
1969 Source: US Census Bureau
Mountain region was third most populated; now is fifth,
and heading towards seventh.
Regions contain 28 counties, with combined population less than that of Jefferson County
0
50,000
100,000
150,000
200,000
250,000
300,000
350,000
400,000
450,000
1969
1970
1971
1972
1973
1974
1975
1976
1977
1978
1979
1980
1981
1982
1983
1984
1985
1986
1987
1988
1989
1990
1991
1992
1993
1994
1995
1996
1997
1998
1999
2000
2001
2002
2003
2004
2005
2006
2007
2008
2009
2010
2011
2012
2013
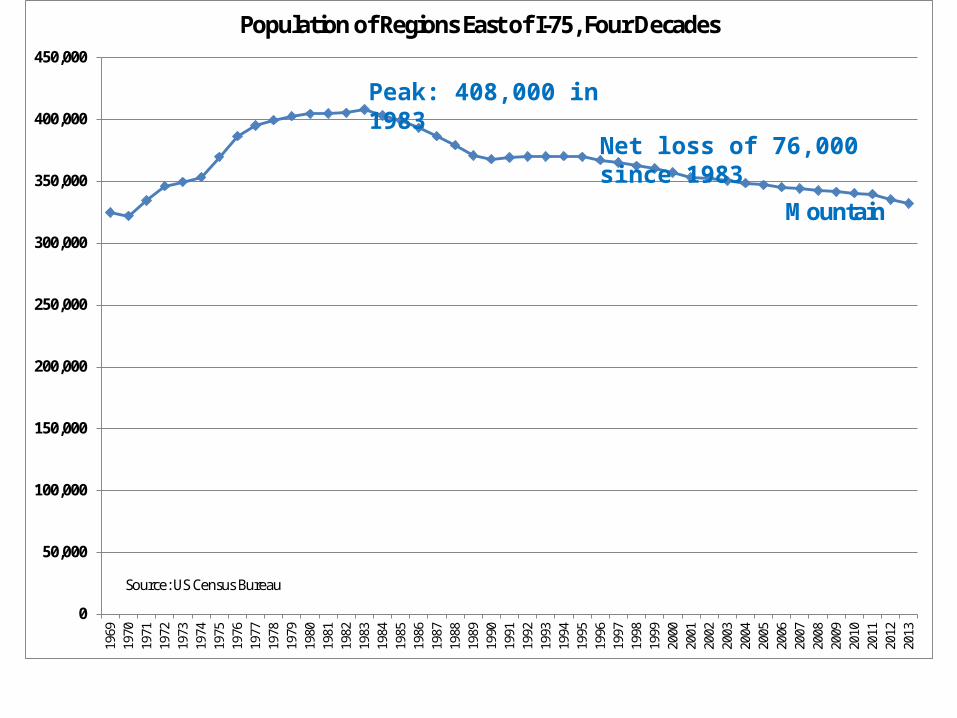
Population of Regions East of I-75, Four Decades
Source: US Census Bureau
Mountain
Peak: 408,000 in 1983
Net loss of 76,000 since 1983
0
50,000
100,000
150,000
200,000
250,000
300,000
350,000
400,000
450,000
1969
1970
1971
1972
1973
1974
1975
1976
1977
1978
1979
1980
1981
1982
1983
1984
1985
1986
1987
1988
1989
1990
1991
1992
1993
1994
1995
1996
1997
1998
1999
2000
2001
2002
2003
2004
2005
2006
2007
2008
2009
2010
2011
2012
2013
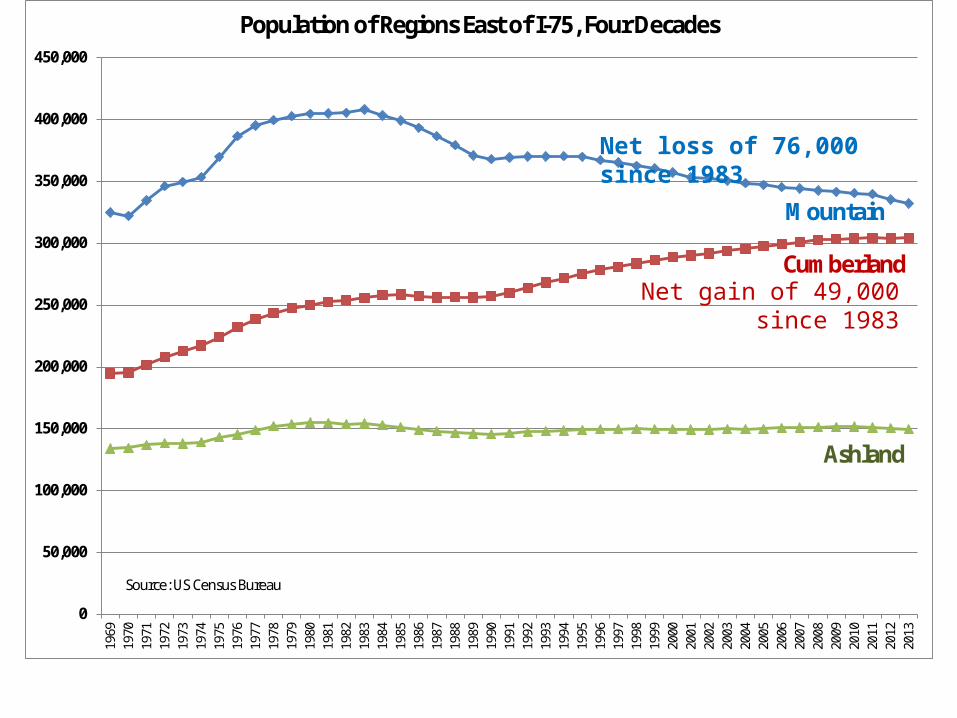
Population of Regions East of I-75, Four Decades
Source: US Census Bureau
Mountain
Cumberland
Ashland
Net loss of 76,000 since 1983
Net gain of 49,000 since 1983
Which region has the highest income from farming?
Owensboro-Henderson
Bowling Green - Hopkinsville
Cumberland
Lexington
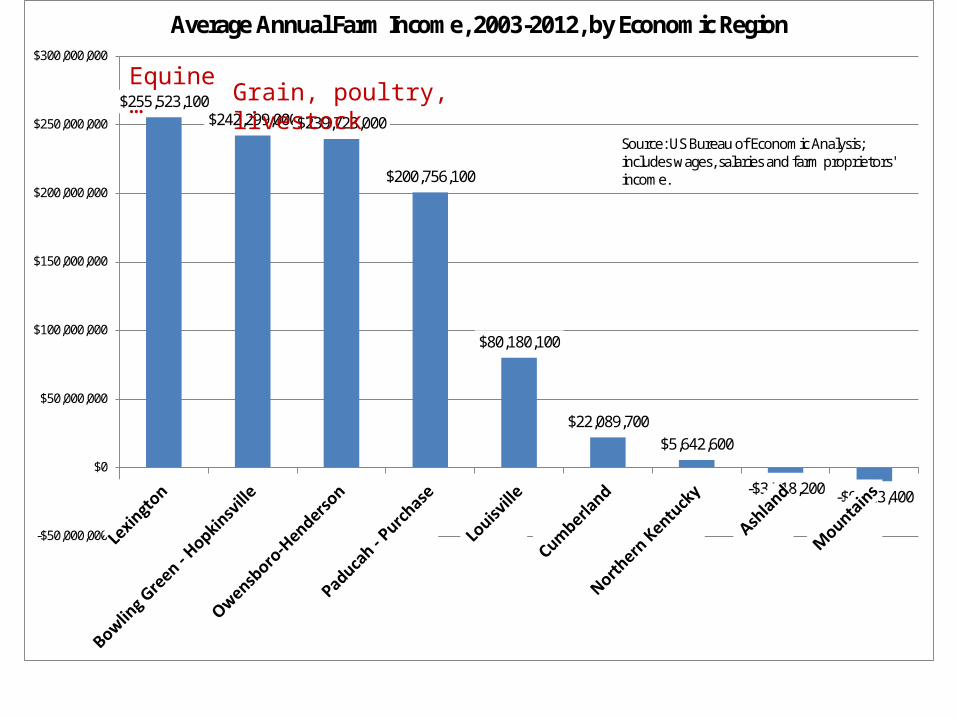
$255,523,100$242,299,000$239,723,000
$200,756,100
$80,180,100
$22,089,700$5,642,600
-$3,718,200 -$9,913,400
-$50,000,000
$0
$50,000,000
$100,000,000
$150,000,000
$200,000,000
$250,000,000
$300,000,000
Average Annual Farm Income, 2003-2012, by Economic Region
Source: US Bureau of Economic Analysis; includes wages, salaries and farm proprietors' income.
Equine…Grain, poultry, livestock
Which region has the highest income from mining?
Owensboro-Henderson
Paducah - Purchase
Mountain
Lexington
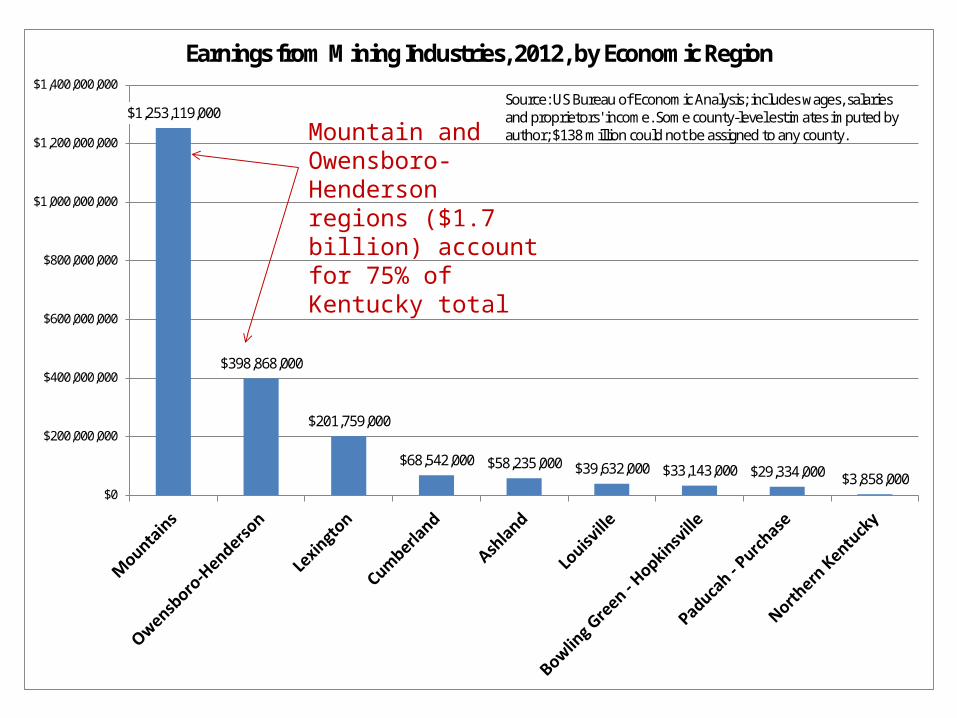
$1,253,119,000
$398,868,000
$201,759,000
$68,542,000 $58,235,000 $39,632,000 $33,143,000 $29,334,000 $3,858,000$0
$200,000,000
$400,000,000
$600,000,000
$800,000,000
$1,000,000,000
$1,200,000,000
$1,400,000,000
Earnings from Mining Industries, 2012, by Economic Region
Source: US Bureau of Economic Analysis; includes wages, salaries and proprietors' income. Some county-level estimates imputed by author; $138 million could not be assigned to any county.Mountain and
Owensboro-Henderson regions ($1.7 billion) account for 75% of Kentucky total
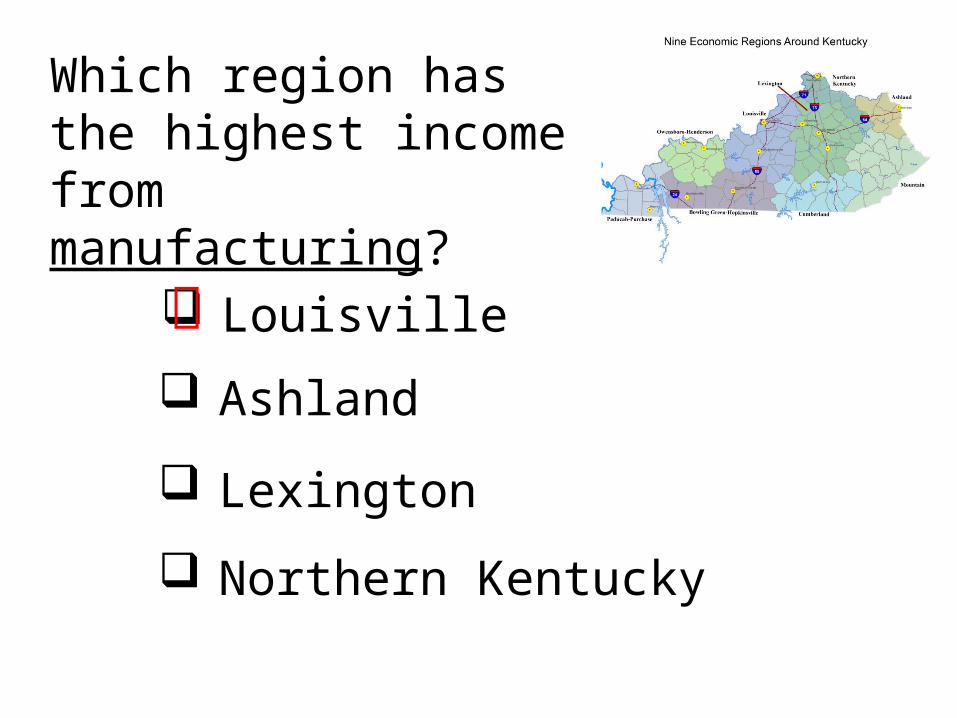
Which region has the highest income from manufacturing?
Louisville
Ashland
Lexington
Northern Kentucky
$5,421,629,000
$3,622,803,000
$1,683,255,000$1,629,833,000
$1,275,473,000
$817,746,000$669,310,000
$378,213,000$125,637,000
$0
$1,000,000,000
$2,000,000,000
$3,000,000,000
$4,000,000,000
$5,000,000,000
$6,000,000,000
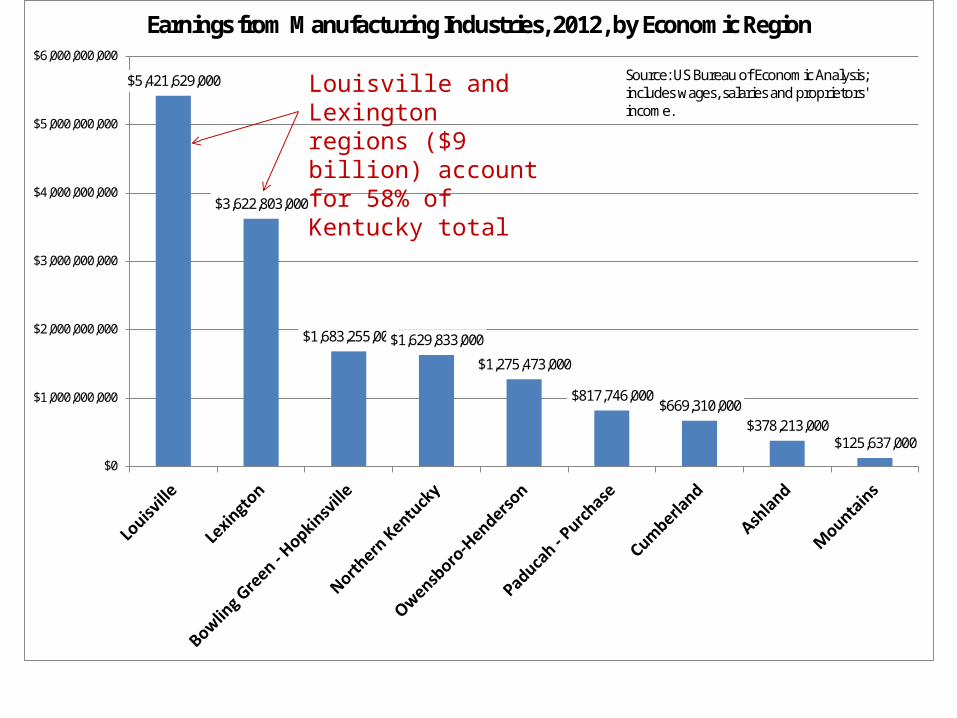
Earnings from Manufacturing Industries, 2012, by Economic Region
Source: US Bureau of Economic Analysis; includes wages, salaries and proprietors' income.
Louisville and Lexington regions ($9 billion) account for 58% of Kentucky total
$2,547,205,000
$731,517,000$582,648,000
$367,043,000$222,557,000 $203,341,000 $184,580,000 $174,393,000 $150,239,000
$0
$500,000,000
$1,000,000,000
$1,500,000,000
$2,000,000,000
$2,500,000,000
$3,000,000,000
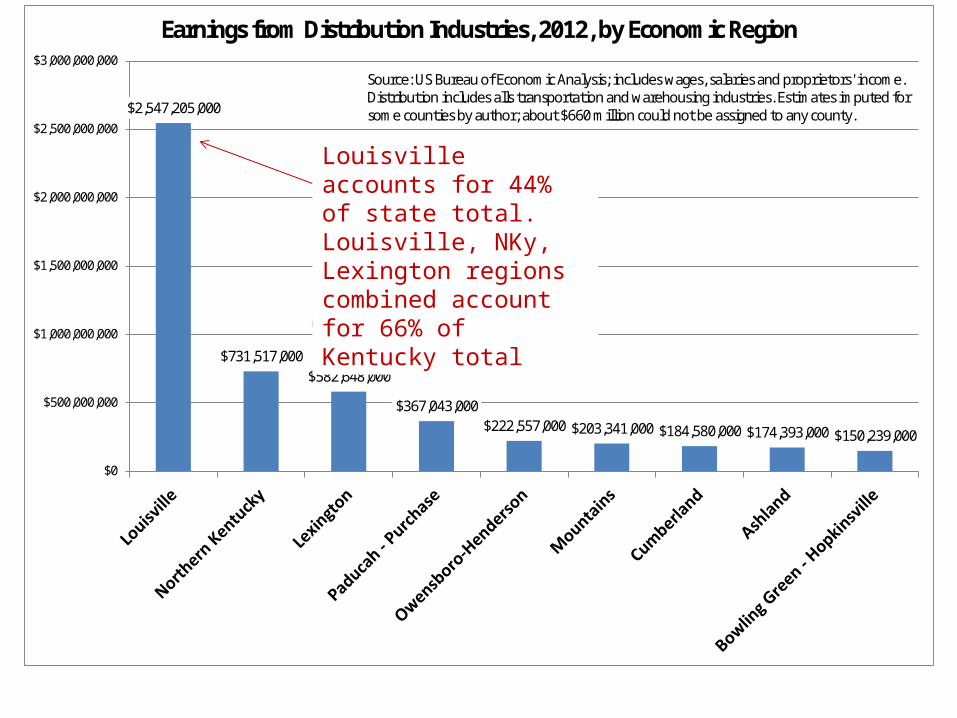
Earnings from Distribution Industries, 2012, by Economic Region
Source: US Bureau of Economic Analysis; includes wages, salaries and proprietors' income. Distribution includes alls transportation and warehousing industries. Estimates imputed for some counties by author; about $660 million could not be assigned to any county.
Louisville accounts for 44% of state total. Louisville, NKy, Lexington regions combined account for 66% of Kentucky total
$2,643,889,000
$1,358,505,000
$559,664,000
$283,357,000$162,867,000 $161,675,000 $124,528,000 $122,822,000 $105,255,000
$0
$500,000,000
$1,000,000,000
$1,500,000,000
$2,000,000,000
$2,500,000,000
$3,000,000,000
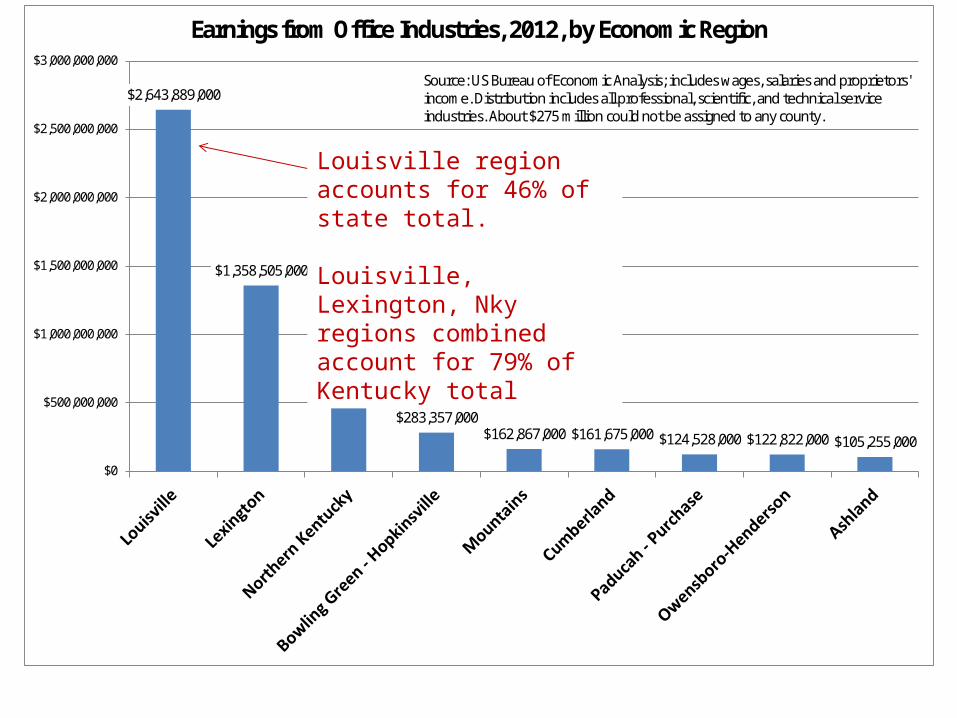
Earnings from Office Industries, 2012, by Economic Region
Source: US Bureau of Economic Analysis; includes wages, salaries and proprietors' income. Distribution includes all professional, scientific, and technical service industries. About $275 million could not be assigned to any county.
Louisville region accounts for 46% of state total.
Louisville, Lexington, Nky regions combined account for 79% of Kentucky total
Which region has had the strongest job growth since the bottom of the 2008-09 recession?
Lexington
Bowling Green - Hopkinsville
Paducah - Purchase
Ashland

13.1%
-5.3%
6.4%
11.3%
6.7%
8.5%
12.7%
8.0%
3.4%
9.9%
7.3%
3.4%4.8%
6.6%
12.6%
-8.5%
8.5%
22.3%
12.6%
0.7%
11.1%
3.6%
-15%
-10%
-5%
0%
5%
10%
15%
20%
25%
Employment Growth Since Bottom of Last RecessionAll Industries, and Manufacturing
All IndustriesManufacturing
Source: US Bureau of Labor Statistics, Quarterly Census of Employment and Wages, compiled from county details. Growth is from July 2009 to December 2013.
17.3%
-9.7%
8.5%
17.0%18.8%
20.2% 20.1%
23.6%
5.8%
16.8%
25.0%
14.8%
2.3%
28.3%
33.7%
17.7%
30.0%
33.6%
39.8%
9.7%
27.1%
23.7%
-20%
-10%
0%
10%
20%
30%
40%
50%
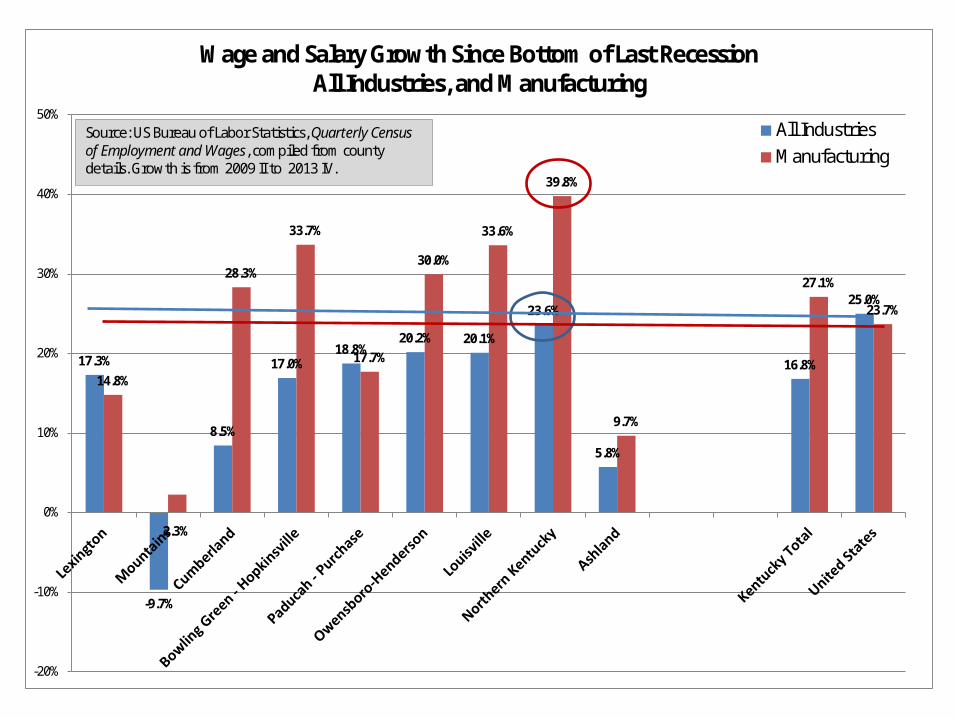
Wage and Salary Growth Since Bottom of Last RecessionAll Industries, and Manufacturing
All IndustriesManufacturing
Source: US Bureau of Labor Statistics, Quarterly Census of Employment and Wages, compiled from countydetails. Growth is from 2009 II to 2013 IV.
Which region has had the highest ratio of employed persons to population?
Lexington
Bowling Green - Hopkinsville
Northern Kentucky
Louisville
58.7%
54.7%
38.6%
44.1%
44.8%
52.3%
53.1%
54.8%
57.8%
58.6%
62.4%
0% 10% 20% 30% 40% 50% 60% 70%
United States
Kentucky
Mountains
Cumberland
Ashland
Paducah - Purchase
Owensboro-Henderson
Bowling Green -Hopkinsville
Lexington
Louisville
Northern Kentucky
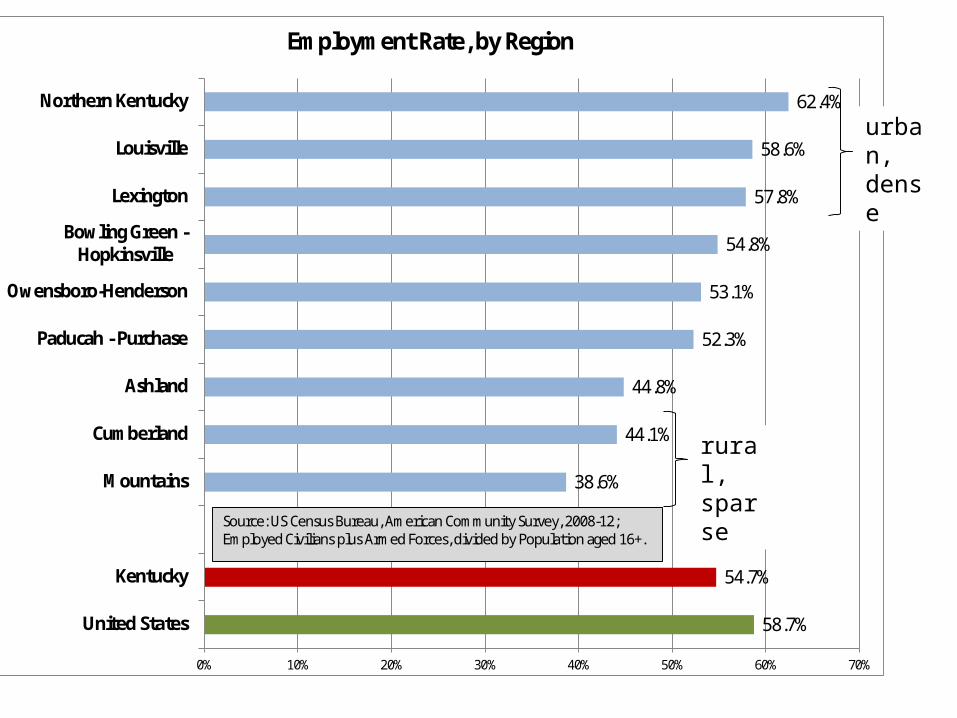
Employment Rate, by Region
Source: US Census Bureau, American Community Survey, 2008-12; Employed Civilians plus Armed Forces, divided by Population aged 16+.
urban, dense
rural, sparse
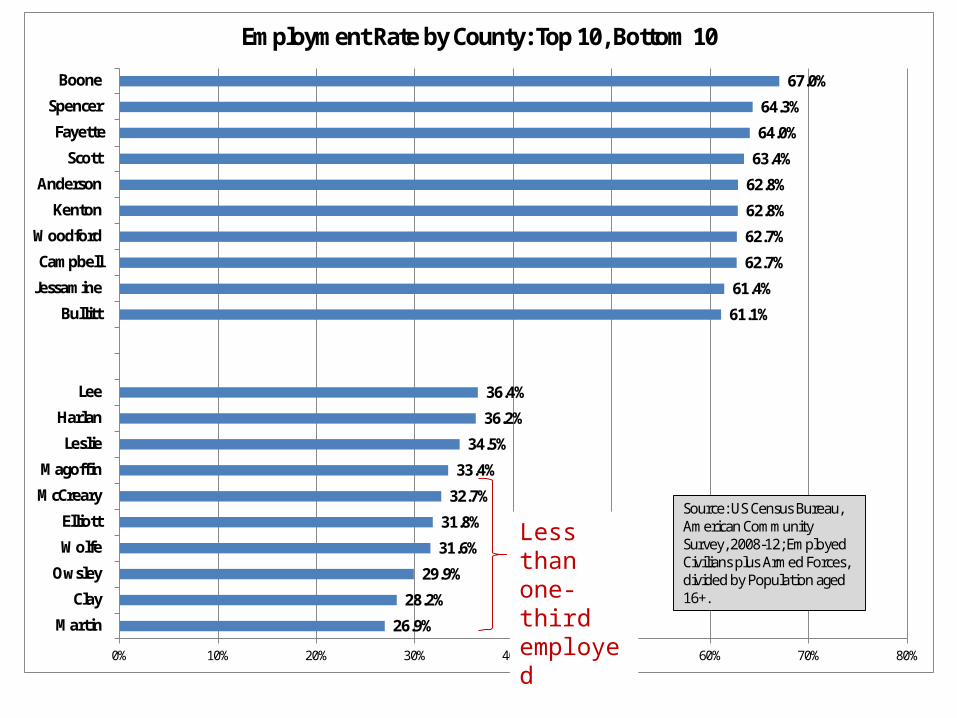
26.9%
28.2%
29.9%
31.6%
31.8%
32.7%
33.4%
34.5%
36.2%
36.4%
61.1%
61.4%
62.7%
62.7%
62.8%
62.8%
63.4%
64.0%
64.3%
67.0%
0% 10% 20% 30% 40% 50% 60% 70% 80%
Martin
Clay
Owsley
Wolfe
Elliott
McCreary
Magoffin
Leslie
Harlan
Lee
Bullitt
Jessamine
Campbell
Woodford
Kenton
Anderson
Scott
Fayette
Spencer
Boone
Employment Rate by County: Top 10, Bottom 10
Source: US Census Bureau, American Community Survey, 2008-12; Employed Civilians plus Armed Forces, divided by Population aged 16+.
Less than one-third employed
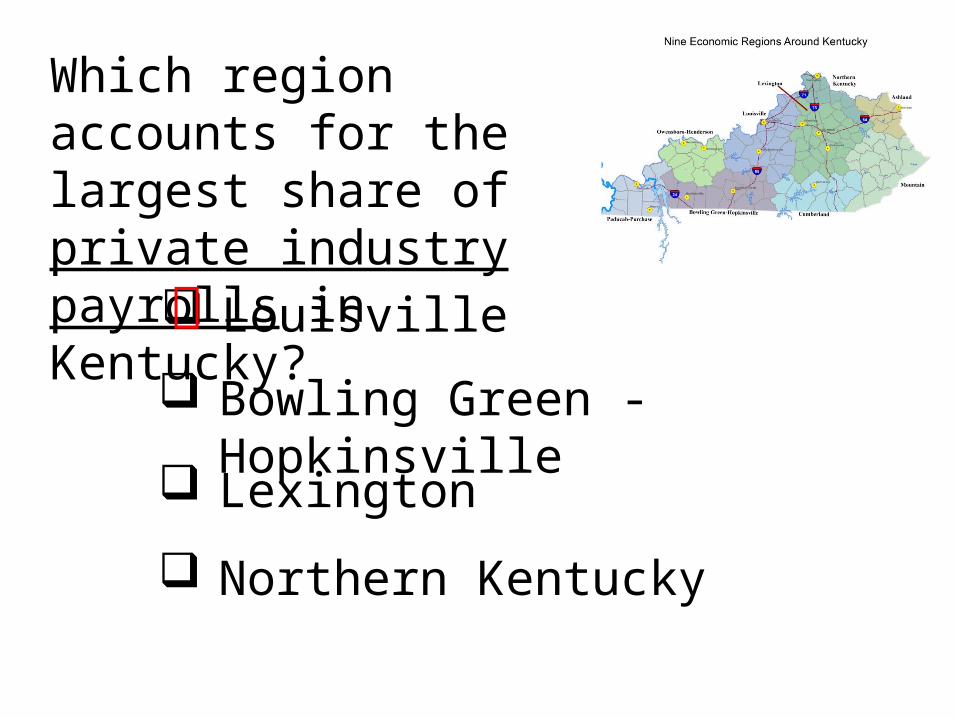
Which region accounts for the largest share of private industry payrolls in Kentucky?
Louisville
Bowling Green - Hopkinsville
Lexington
Northern Kentucky
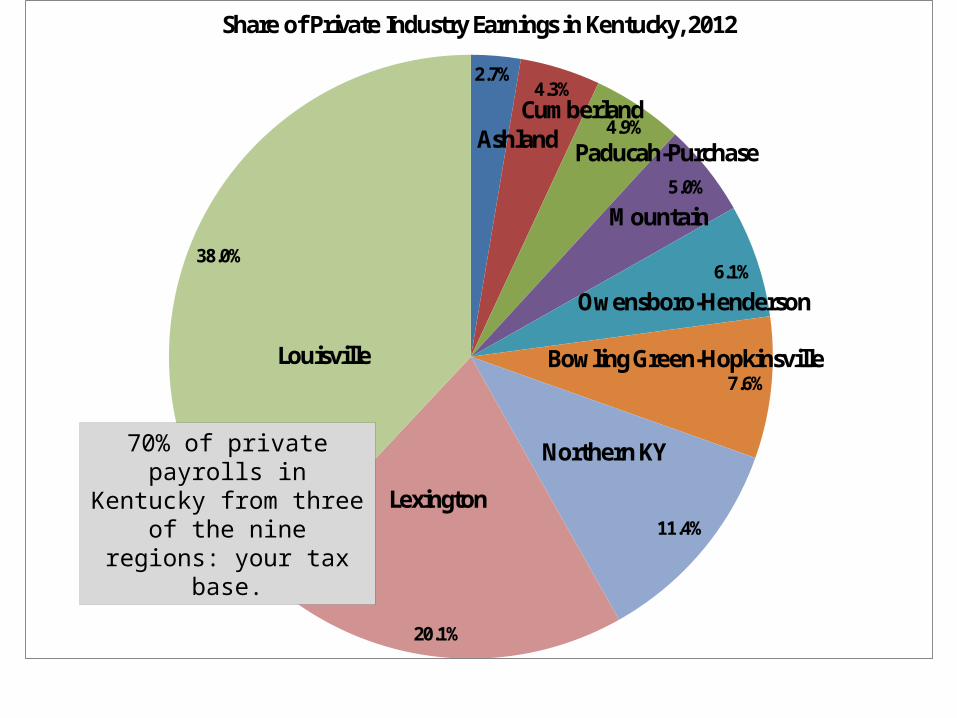
2.7%4.3%
4.9%
5.0%
6.1%
7.6%
11.4%
20.1%
38.0%
Share of Private Industry Earnings in Kentucky, 2012
Louisville
Ashland
Mountain
Owensboro-Henderson
Bowling Green-Hopkinsville
Northern KY
Lexington
Cumberland
Paducah-Purchase
70% of private payrolls in Kentucky from three of the nine regions: your tax base.
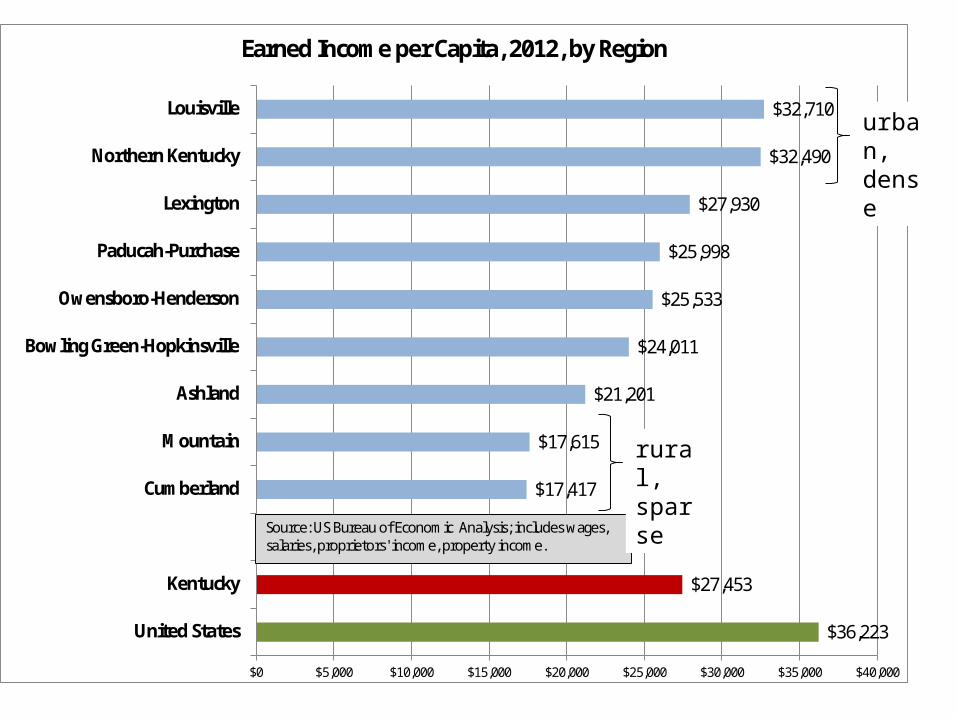
$36,223
$27,453
$17,417
$17,615
$21,201
$24,011
$25,533
$25,998
$27,930
$32,490
$32,710
$0 $5,000 $10,000 $15,000 $20,000 $25,000 $30,000 $35,000 $40,000
United States
Kentucky
Cumberland
Mountain
Ashland
Bowling Green-Hopkinsville
Owensboro-Henderson
Paducah-Purchase
Lexington
Northern Kentucky
Louisville
Earned Income per Capita, 2012, by Region
Source: US Bureau of Economic Analysis; includes wages, salaries, proprietors' income, property income.
urban, dense
rural, sparse

Private EarningsShare of
State
Share of All
Earnings in
County
Jefferson $26,501,818,000 30.8% 88.4%
Fayette $8,771,357,000 10.2% 75.6%
Boone $4,197,889,000 4.9% 91.0%
Kenton $3,567,815,000 4.2% 82.8%
Warren $2,518,242,000 2.9% 81.8%
McCracken $1,920,737,000 2.2% 87.2%
Daviess $1,808,665,000 2.1% 76.1%
Hardin $1,674,054,000 1.9% 46.9%
Boyd $1,481,972,000 1.7% 88.2%
Scott $1,387,776,000 1.6% 91.6%
rest of state $32,076,812,000 37.3% 71.4%
Kentucky, total $85,907,137,000 100.0% 78.2%Source: US Bureau of Economic Analysis
Top Ten Counties in Terms of Private Industry Labor and Proprietors' Earnings, 2012
Four counties account for one-half of Kentucky total private sector income
Note: all top counties are urban, except Scott (Toyota)
Louisville
Lexington
Florence
Covington
Bowling Green
Paducah
Owensboro
Elizabethtown
Ashland
Georgetown
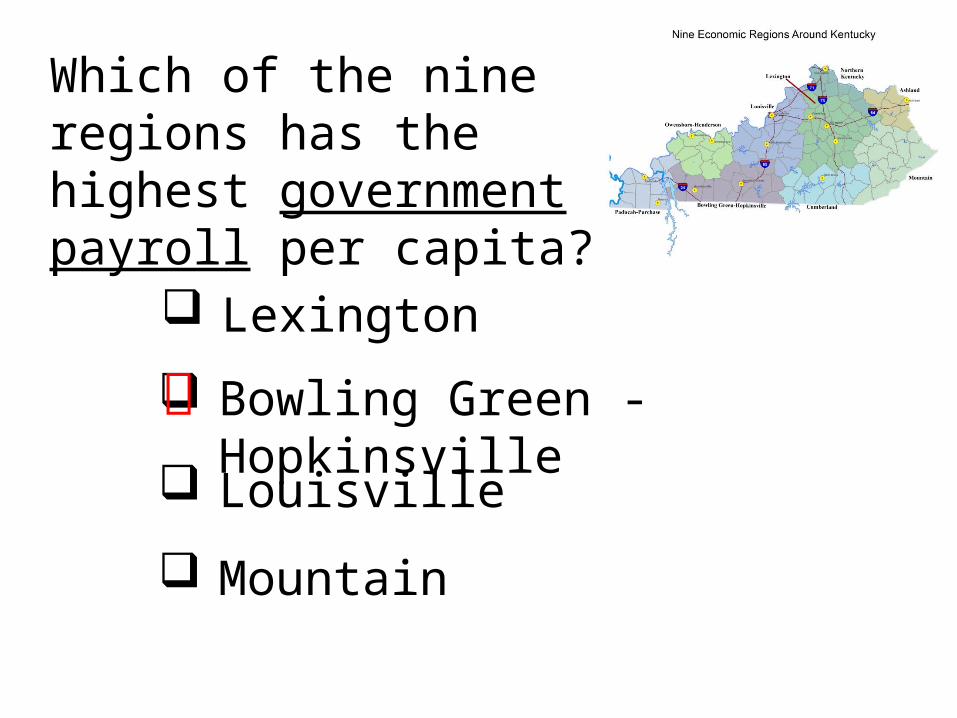
Which of the nine regions has the highest government payroll per capita?
Lexington
Bowling Green - Hopkinsville
Louisville
Mountain
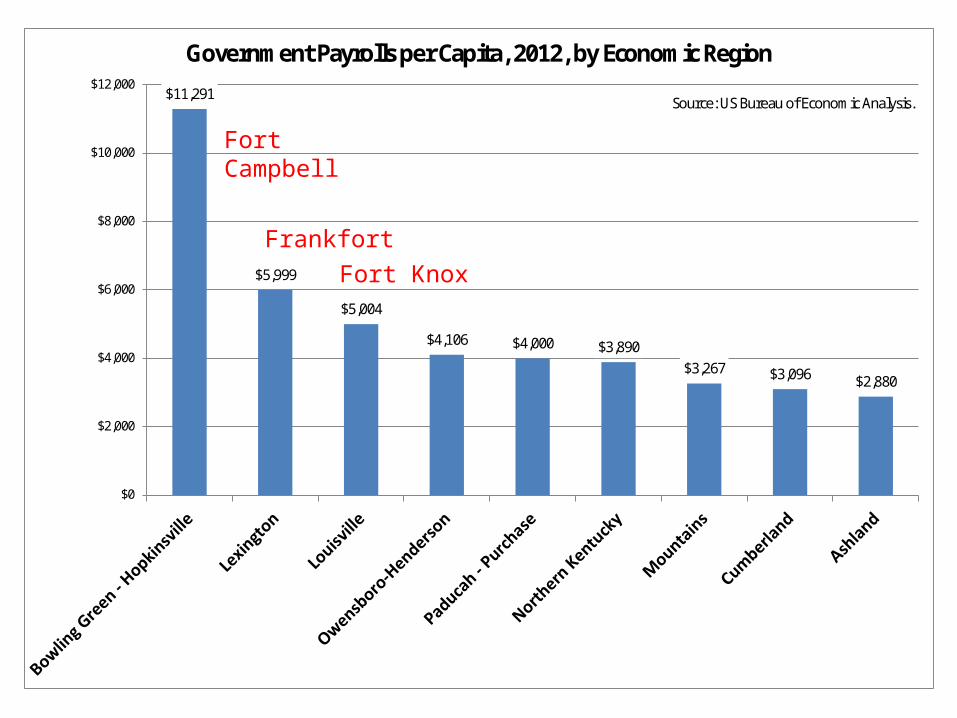
$11,291
$5,999
$5,004
$4,106 $4,000 $3,890$3,267 $3,096 $2,880
$0
$2,000
$4,000
$6,000
$8,000
$10,000
$12,000
Government Payrolls per Capita, 2012, by Economic Region
Source: US Bureau of Economic Analysis.
Fort Campbell
FrankfortFort Knox
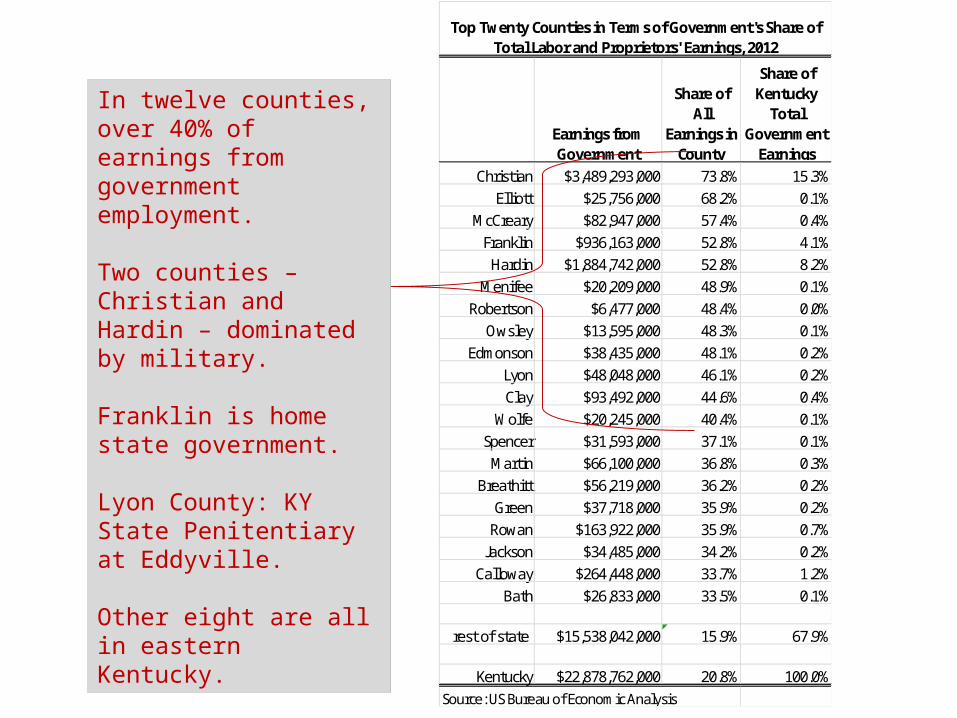
Earnings from Government
Share of All
Earnings in County
Share of Kentucky
Total Government
EarningsChristian $3,489,293,000 73.8% 15.3%
Elliott $25,756,000 68.2% 0.1%McCreary $82,947,000 57.4% 0.4%
Franklin $936,163,000 52.8% 4.1%Hardin $1,884,742,000 52.8% 8.2%
Menifee $20,209,000 48.9% 0.1%Robertson $6,477,000 48.4% 0.0%
Owsley $13,595,000 48.3% 0.1%Edmonson $38,435,000 48.1% 0.2%
Lyon $48,048,000 46.1% 0.2%Clay $93,492,000 44.6% 0.4%
Wolfe $20,245,000 40.4% 0.1%Spencer $31,593,000 37.1% 0.1%
Martin $66,100,000 36.8% 0.3%Breathitt $56,219,000 36.2% 0.2%
Green $37,718,000 35.9% 0.2%Rowan $163,922,000 35.9% 0.7%
Jackson $34,485,000 34.2% 0.2%Calloway $264,448,000 33.7% 1.2%
Bath $26,833,000 33.5% 0.1%
rest of state $15,538,042,000 15.9% 67.9%
Kentucky $22,878,762,000 20.8% 100.0%Source: US Bureau of Economic Analysis
Top Twenty Counties in Terms of Government's Share of Total Labor and Proprietors' Earnings, 2012
In twelve counties, over 40% of earnings from government employment.
Two counties – Christian and Hardin – dominated by military.
Franklin is home state government.
Lyon County: KY State Penitentiary at Eddyville.
Other eight are all in eastern Kentucky.
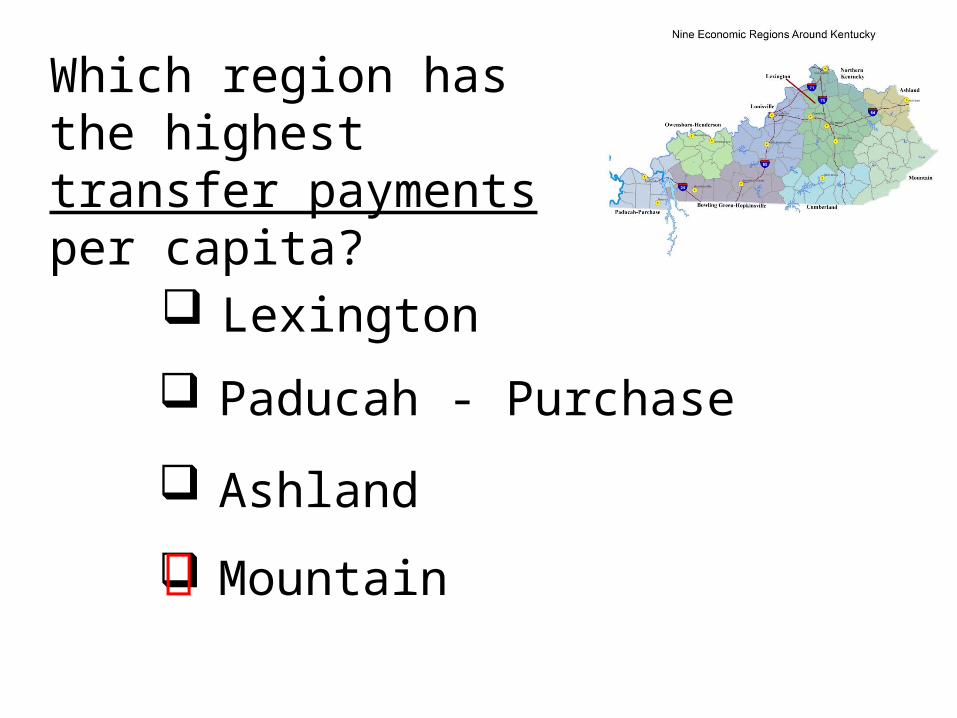
Which region has the highest transfer payments per capita?
Lexington
Paducah - Purchase
Ashland
Mountain
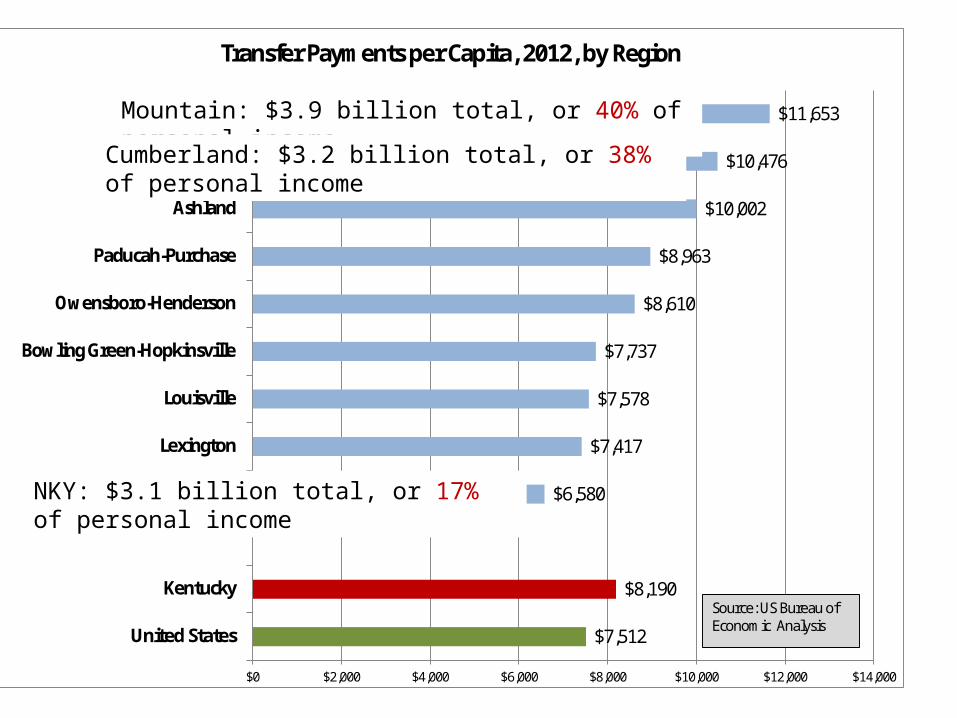
$7,512
$8,190
$6,580
$7,417
$7,578
$7,737
$8,610
$8,963
$10,002
$10,476
$11,653
$0 $2,000 $4,000 $6,000 $8,000 $10,000 $12,000 $14,000
United States
Kentucky
Northern Kentucky
Lexington
Louisville
Bowling Green-Hopkinsville
Owensboro-Henderson
Paducah-Purchase
Ashland
Cumberland
Mountain
Transfer Payments per Capita, 2012, by Region
Source: US Bureau of Economic Analysis
Mountain: $3.9 billion total, or 40% of personal income
Cumberland: $3.2 billion total, or 38% of personal income
NKY: $3.1 billion total, or 17% of personal income
0.8
0.9
1.0
1.1
1.2
1.3
1.4
1.5
1.6
0.8 0.9 1.0 1.1 1.2 1.3 1.4 1.5 1.6
Tran
sfer
Pay
men
ts p
er C
apita
, 201
2
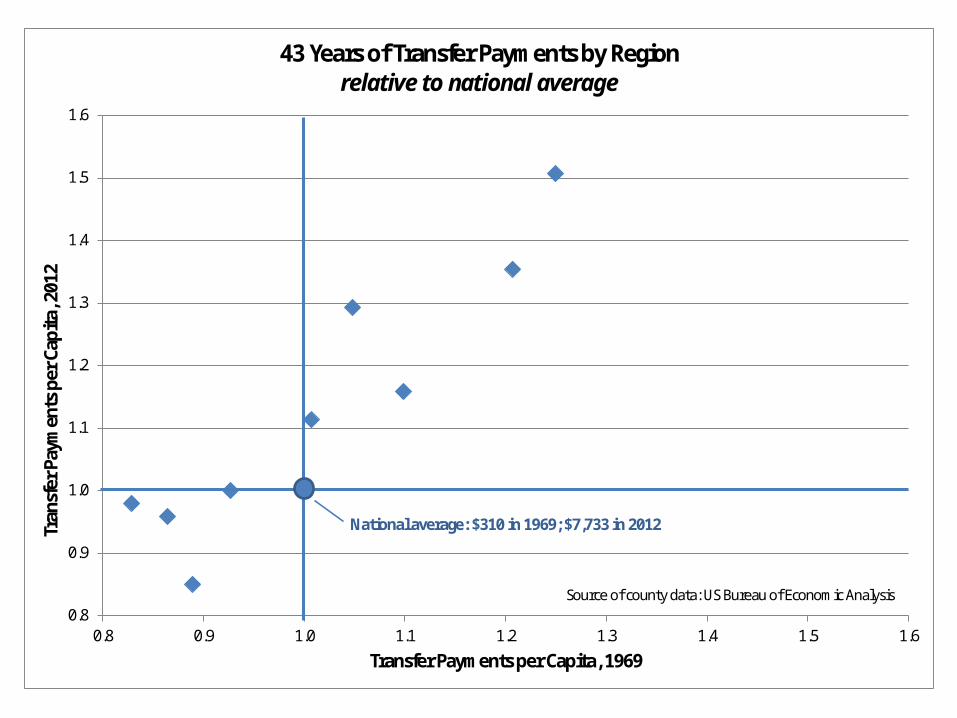
Transfer Payments per Capita, 1969
43 Years of Transfer Payments by Regionrelative to national average
National average: $310 in 1969; $7,733 in 2012
Source of county data: US Bureau of Economic Analysis
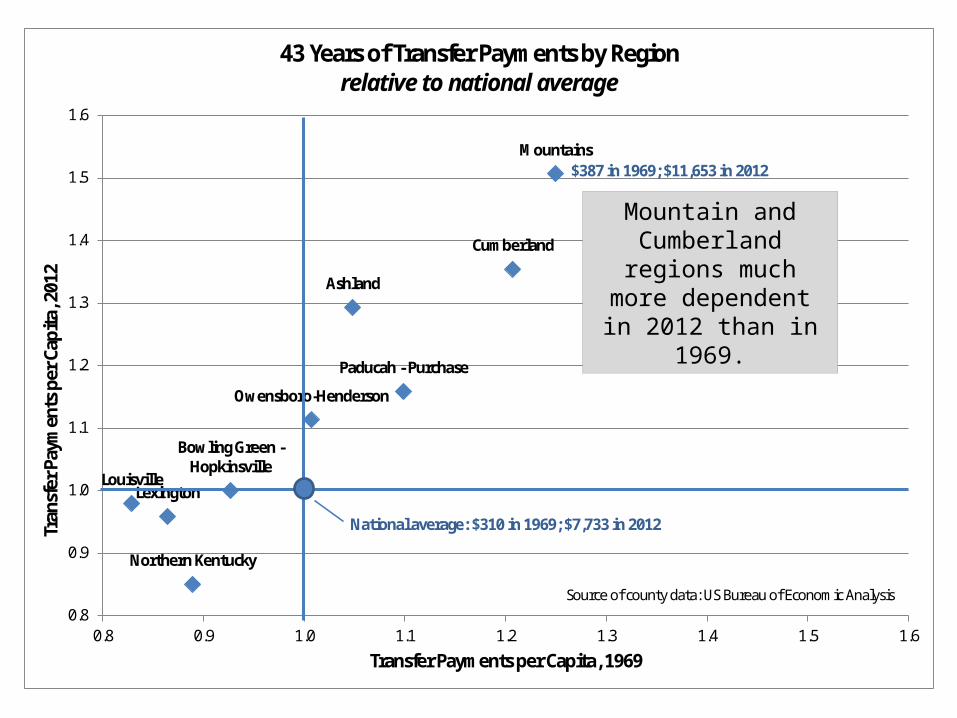
Lexington
Mountains
Cumberland
Bowling Green -Hopkinsville
Paducah - Purchase
Owensboro-Henderson
Louisville
Northern Kentucky
Ashland
0.8
0.9
1.0
1.1
1.2
1.3
1.4
1.5
1.6
0.8 0.9 1.0 1.1 1.2 1.3 1.4 1.5 1.6
Tran
sfer
Pay
men
ts p
er C
apita
, 201
2
Transfer Payments per Capita, 1969
43 Years of Transfer Payments by Regionrelative to national average
National average: $310 in 1969; $7,733 in 2012
$387 in 1969; $11,653 in 2012
Source of county data: US Bureau of Economic Analysis
Mountain and Cumberland regions
much more dependent in 2012 than in 1969.
0%
10%
20%
30%
40%
50%
60%
Ow
sley
Mag
offin
Men
ifee
Bell
Lesl
ie
Lew
is
Way
ne
Knott
Letc
her
John
son
Perr
y
Case
y
Fulto
n
Russ
ell
Butle
r
Trim
ble
Pike
Muh
lenb
erg
Row
an
Cald
wel
l
Boyd
Was
hing
ton
Loga
n
Todd
Gre
enup
Mar
shal
l
Hic
kman
Hen
ders
on
Mer
cer
Web
ster
Bour
bon
Mad
ison
Fran
klin
Trig
g
War
ren
Chris
tian
Jeff
erso
n
Spen
cer
Faye
tte
Woo
dfor
d
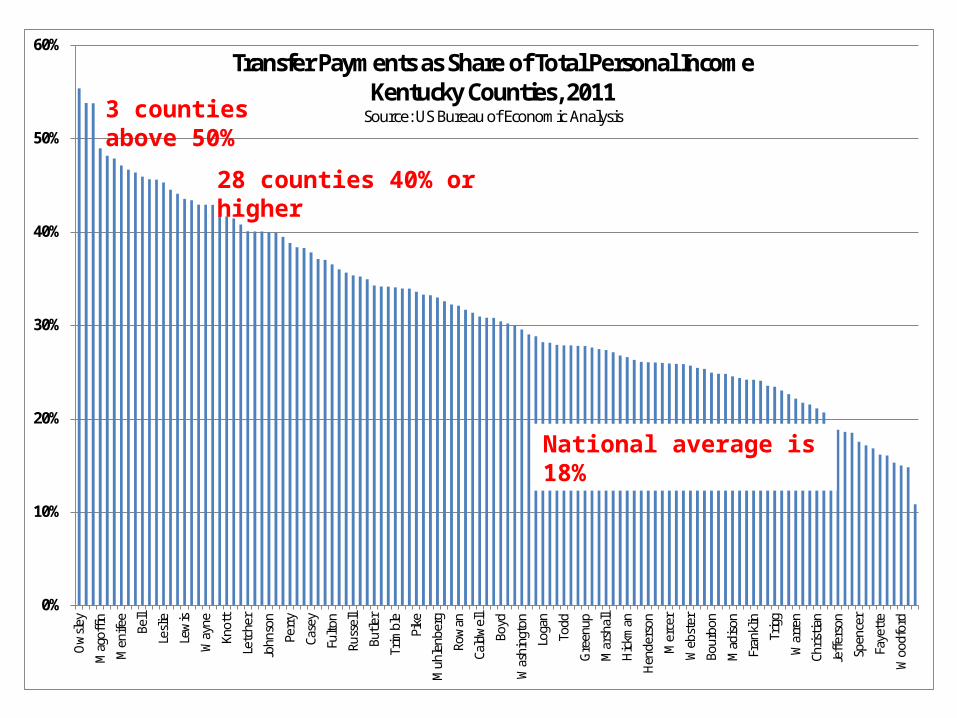
Transfer Payments as Share of Total Personal IncomeKentucky Counties, 2011
Source: US Bureau of Economic Analysis3 counties above 50%
28 counties 40% or higher
National average is 18%
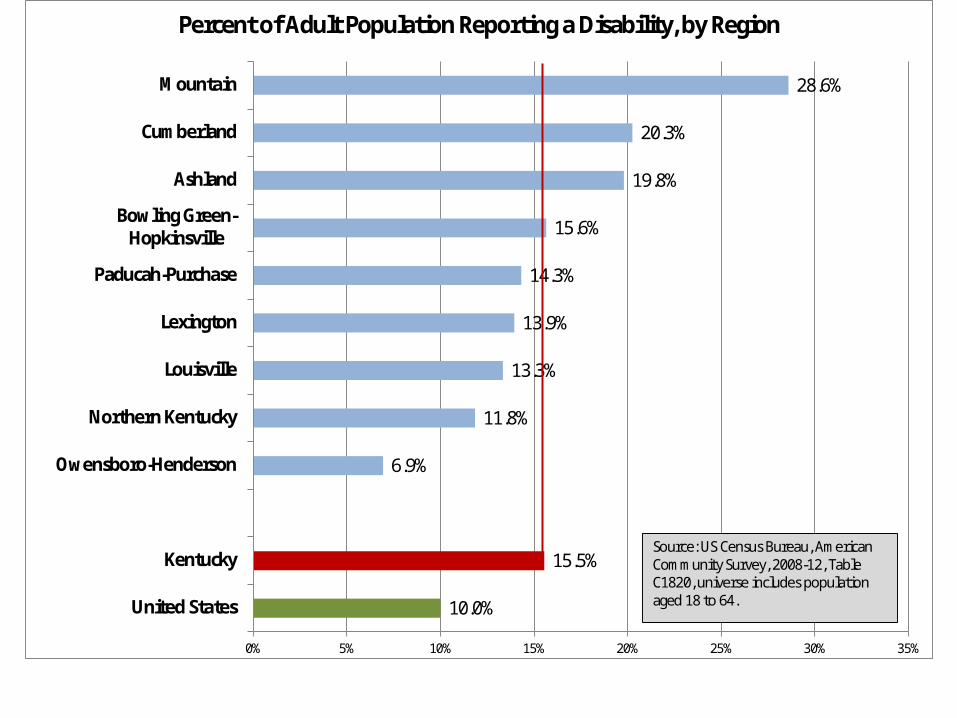
10.0%
15.5%
6.9%
11.8%
13.3%
13.9%
14.3%
15.6%
19.8%
20.3%
28.6%
0% 5% 10% 15% 20% 25% 30% 35%
United States
Kentucky
Owensboro-Henderson
Northern Kentucky
Louisville
Lexington
Paducah-Purchase
Bowling Green-Hopkinsville
Ashland
Cumberland
Mountain
Percent of Adult Population Reporting a Disability, by Region
Source: US Census Bureau, American Community Survey, 2008-12, Table C1820, universe includes population aged 18 to 64.
0% 5% 10% 15% 20% 25% 30% 35%
OldhamFayetteShelby
ScottKenton
JeffersonChristianSimpson
RowanHardinGrant
BallardAnderson
ClarkOhio
FranklinMasonOwen
HancockCarrollHenry
BarrenFleming
AllenBoyd
CaseyMontgomery
PulaskiLivingston
KnoxMorgan
BathPerry
BellEstill
MenifeeMagoffin
JacksonMcCrearyBreathitt
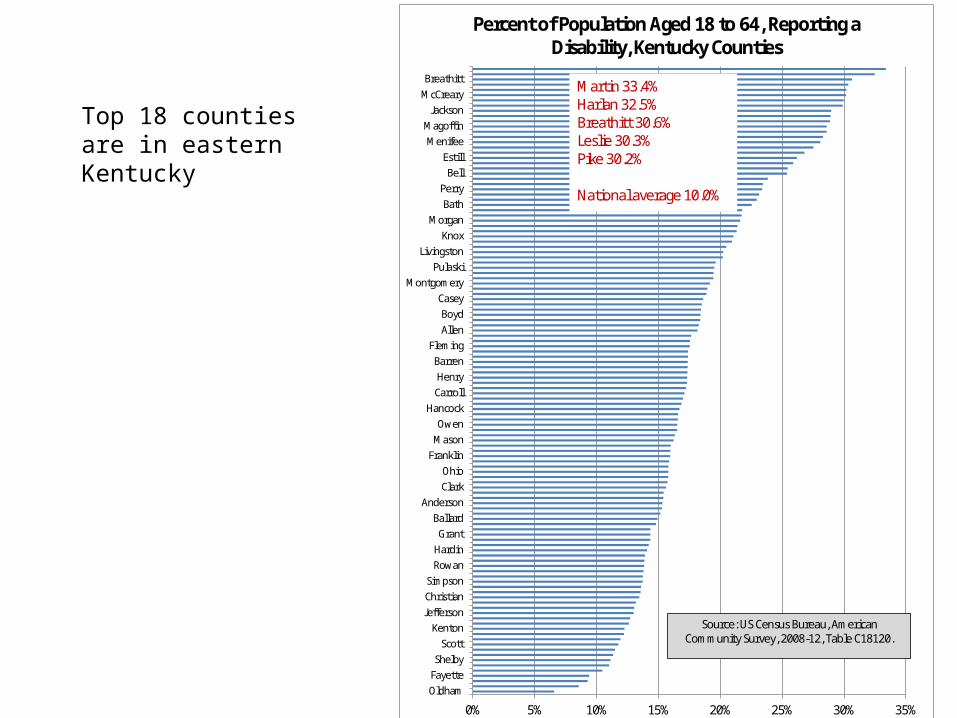
Percent of Population Aged 18 to 64, Reporting a Disability, Kentucky Counties
Source: US Census Bureau, American Community Survey, 2008-12, Table C18120.
Martin 33.4%Harlan 32.5%Breathitt 30.6%Leslie 30.3%Pike 30.2%
National average 10.0%
Top 18 counties are in eastern Kentucky
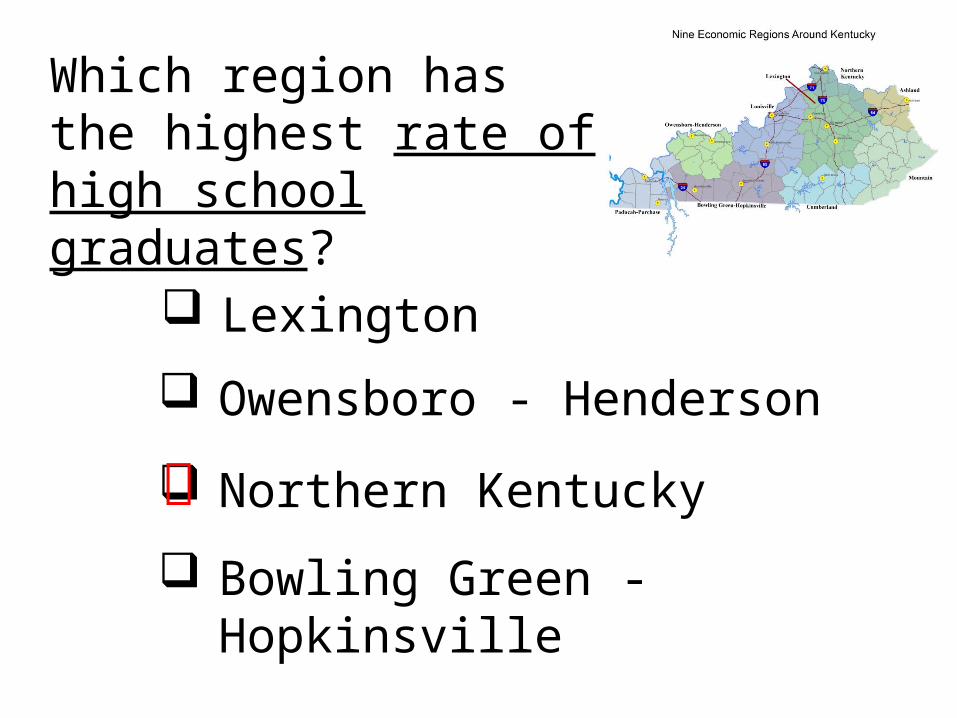
Which region has the highest rate of high school graduates?
Lexington
Owensboro - Henderson
Northern Kentucky
Bowling Green - Hopkinsville
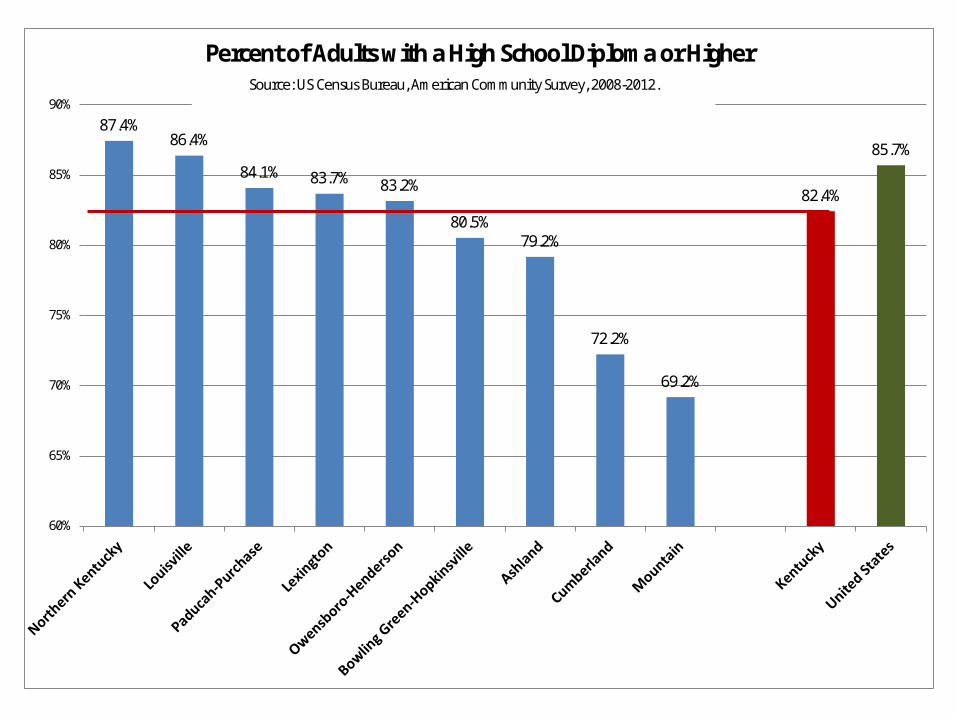
87.4%86.4%
84.1% 83.7% 83.2%
80.5%79.2%
72.2%
69.2%
82.4%
85.7%
60%
65%
70%
75%
80%
85%
90%
Percent of Adults with a High School Diploma or HigherSource: US Census Bureau, American Community Survey, 2008-2012.
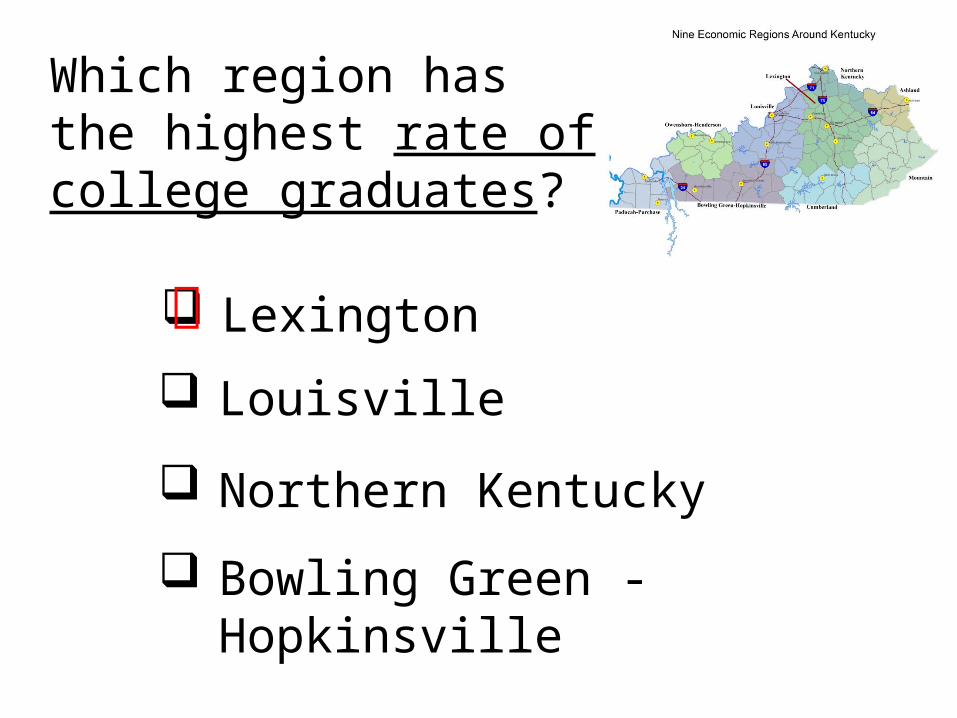
Which region has the highest rate of college graduates?
Lexington
Louisville
Northern Kentucky
Bowling Green - Hopkinsville

26.6%25.2% 24.8%
18.4%
16.5%14.7%
13.1%11.5% 11.2%
21.0%
28.5%
0%
5%
10%
15%
20%
25%
30%
Percent of Adults with a Bachelor Degree or Higher
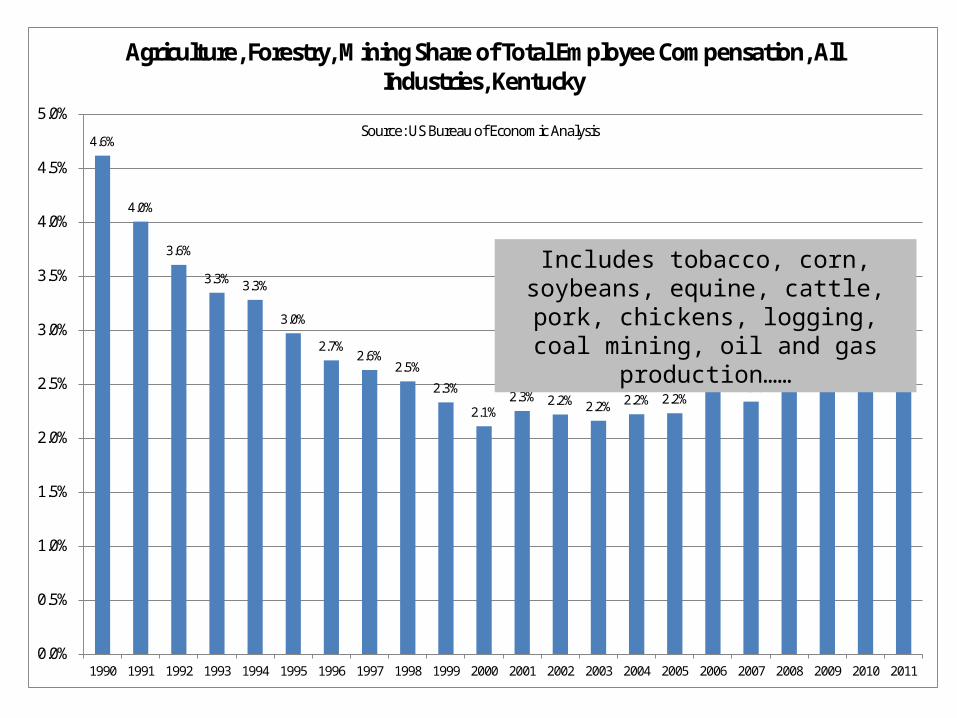
Nostalgia EconomicsAgriculture and Mining’s Share of Labor Income4.6%
4.0%
3.6%
3.3% 3.3%
3.0%
2.7%2.6%
2.5%
2.3%
2.1%2.3% 2.2% 2.2% 2.2% 2.2%
2.5%2.3%
2.6% 2.7% 2.6% 2.7%
0.0%
0.5%
1.0%
1.5%
2.0%
2.5%
3.0%
3.5%
4.0%
4.5%
5.0%
1990 1991 1992 1993 1994 1995 1996 1997 1998 1999 2000 2001 2002 2003 2004 2005 2006 2007 2008 2009 2010 2011
Agriculture, Forestry, Mining Share of Total Employee Compensation, All Industries, Kentucky
Source: US Bureau of Economic Analysis
Includes tobacco, corn, soybeans, equine, cattle, pork, chickens, logging, coal mining, oil and gas production……
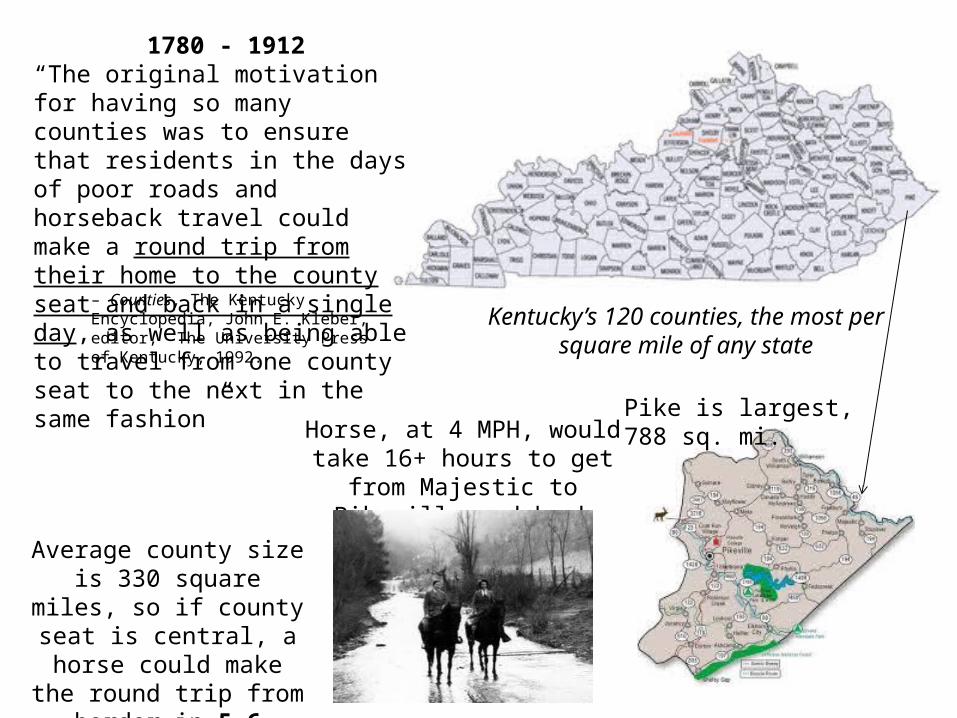
1780 - 1912“The original motivation for having so many counties was to ensure that residents in the days of poor roads and horseback travel could make a round trip from their home to the county seat and back in a single day, as well as being able to travel from one county seat to the next in the same fashion”
– Counties, The Kentucky Encyclopedia, John E. Kleber, editor, The University Press of Kentucky, 1992.
Kentucky’s 120 counties, the most per square mile of any state
Pike is largest, 788 sq. mi.
Average county size is 330 square miles, so if county
seat is central, a horse could make the round trip from
border in 5-6 hours.
Horse, at 4 MPH, would take 16+ hours to get from Majestic
to Pikeville and back
Constitution requires each county to have County judge, county court clerk, county attorney, county treasurer, county sheriff, jailer, coroner, surveyor, three to eight justices of the peace, and three to eight constables. In counties; where the fiscal court is composed of commissioners, three commissioners must also be elected The state also pays for a county attorney, PVA, jails, DMV, in every county.
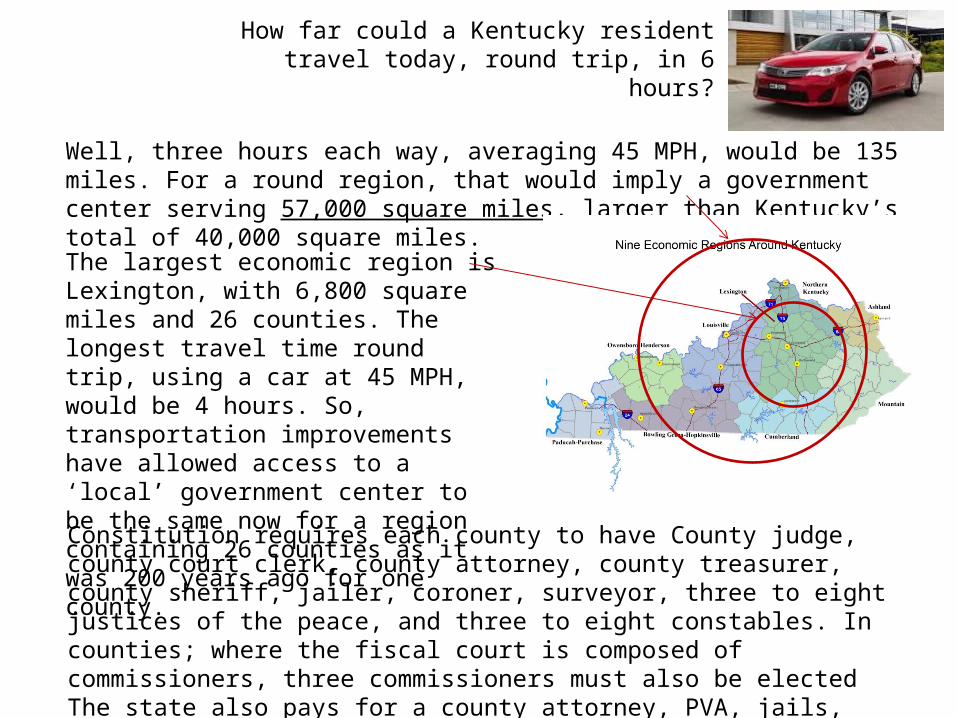
How far could a Kentucky resident travel today, round trip, in 6 hours?
Well, three hours each way, averaging 45 MPH, would be 135 miles. For a round region, that would imply a government center serving 57,000 square miles, larger than Kentucky’s total of 40,000 square miles.
The largest economic region is Lexington, with 6,800 square miles and 26 counties. The longest travel time round trip, using a car at 45 MPH, would be 4 hours. So, transportation improvements have allowed access to a ‘local’ government center to be the same now for a region containing 26 counties as it was 200 years ago for one county.

Thank you!
Go to http://kentuckyeconomicassociation.org/ to download a copy of this presentation.