kenmare resources plc/media/files/k/kenmare... · 3 . moma titanium minerals mine in mozambique one...
TRANSCRIPT
1
Kenmare Resources plc
June 2013
2
This Confidential Presentation (the “Presentation”) has been prepared and issued by Kenmare Resources plc (the “Company” or “Kenmare”). While this Presentation has been prepared in good faith, the Company and its respective officers, employees, agents and representatives expressly disclaim any and all liability for the contents of, or omissions from, this Presentation, and for any other written or oral communication transmitted or made available to the recipient or any of its officers, employees, agents or representatives. No representations or warranties are or will be expressed or are to be implied on the part of the Company, or any of its respective officers, employees, agents or representatives in or from this Presentation or any other written or oral communication from the Company, or any of its respective officers, employees, agents or representatives concerning the Company or any other factors relevant to any transaction involving the Company or as to the accuracy, completeness or fairness of this Presentation, the information or opinions on which it is based, or any other written or oral information made available in connection with the Company.
This Presentation does not constitute or form part of, and should not be construed as, an offer, invitation or inducement to purchase or subscribe for any securities of the Company nor shall it or any part of it form the basis of, or be relied upon in connection with, any contract or investment decision relating to such securities, nor does it constitute a recommendation regarding the securities of the Company.
This Presentation is as of the date hereof. This Presentation includes certain statements, estimates and projections provided by the Company with respect to the anticipated future performance of the Company or the industry in which it operates. Such statements, estimates and projections reflect various assumptions and subjective judgments by the Company’s management concerning anticipated results, certain of which assumptions and judgments may be significant in the context of the statements, estimates and projections made. These assumptions and judgments may or may not prove to be correct and there can be no assurance that any projected results are attainable or will be realised. In particular, certain statements in this Presentation relating to future financials, results, plans and expectations regarding the Company’s business, growth and profitability, as well as the general economic conditions to which the Company is exposed, are forward looking by nature and may be affected by a variety of factors. The Company is under no obligation to update or keep current the information contained in this Presentation, to correct any inaccuracies which may become apparent, or to publicly announce the result of any revision to the statements made herein and any opinions expressed in the Presentation or in any related materials are subject to change without notice.
Disclaimer
2
3
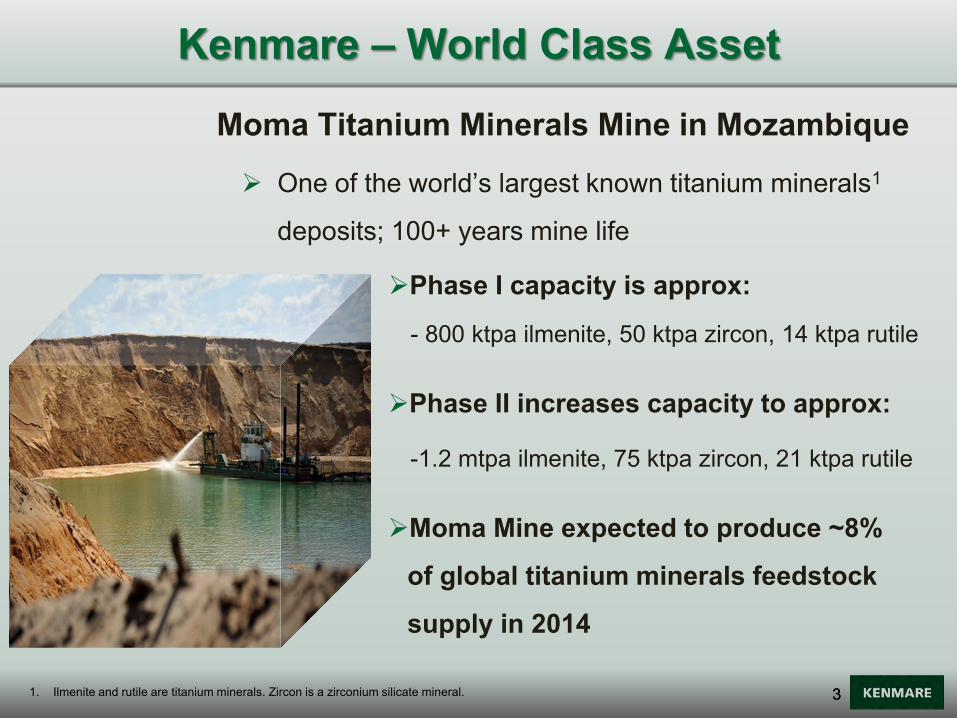
Moma Titanium Minerals Mine in Mozambique
One of the world’s largest known titanium minerals1
deposits; 100+ years mine life
Phase I capacity is approx:
- 800 ktpa ilmenite, 50 ktpa zircon, 14 ktpa rutile
Phase II increases capacity to approx:
-1.2 mtpa ilmenite, 75 ktpa zircon, 21 ktpa rutile
Moma Mine expected to produce ~8%
of global titanium minerals feedstock
supply in 2014
Kenmare – World Class Asset
3 1. Ilmenite and rutile are titanium minerals. Zircon is a zirconium silicate mineral.
4
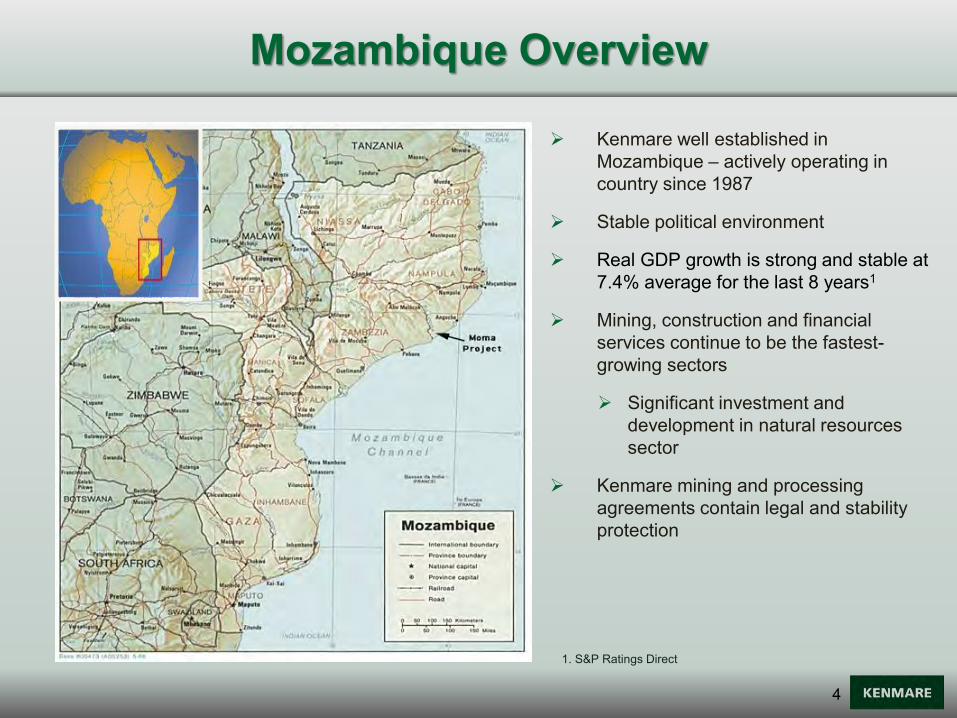
Mozambique Overview
Kenmare well established in Mozambique – actively operating in country since 1987
Stable political environment
Real GDP growth is strong and stable at 7.4% average for the last 8 years1
Mining, construction and financial services continue to be the fastest-growing sectors
Significant investment and development in natural resources sector
Kenmare mining and processing agreements contain legal and stability protection
1. S&P Ratings Direct

5
Key Company Highlights
Long life ore body producing high quality products
Low cost mining, efficient materials handling, well-established producer
50% expansion in commissioning, with vast majority of capex spent
Significant share of global feedstock supply of titanium minerals
Favourable mineral sands supply/demand dynamics
Important asset for Mozambique
5
6
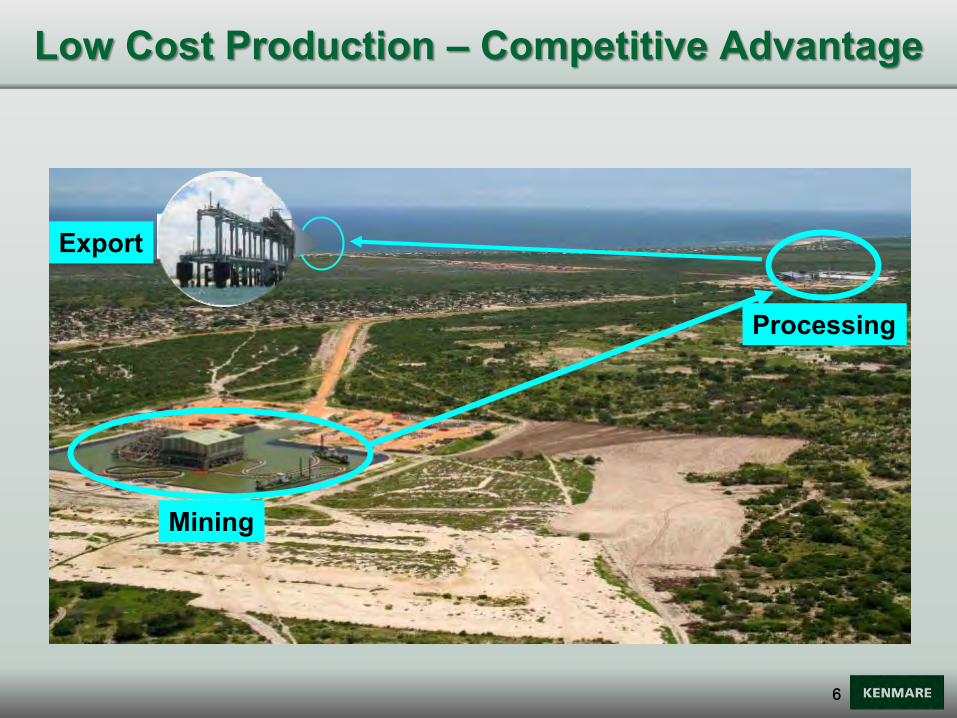
Low Cost Production – Competitive Advantage
Export
Mining
Processing
6
7
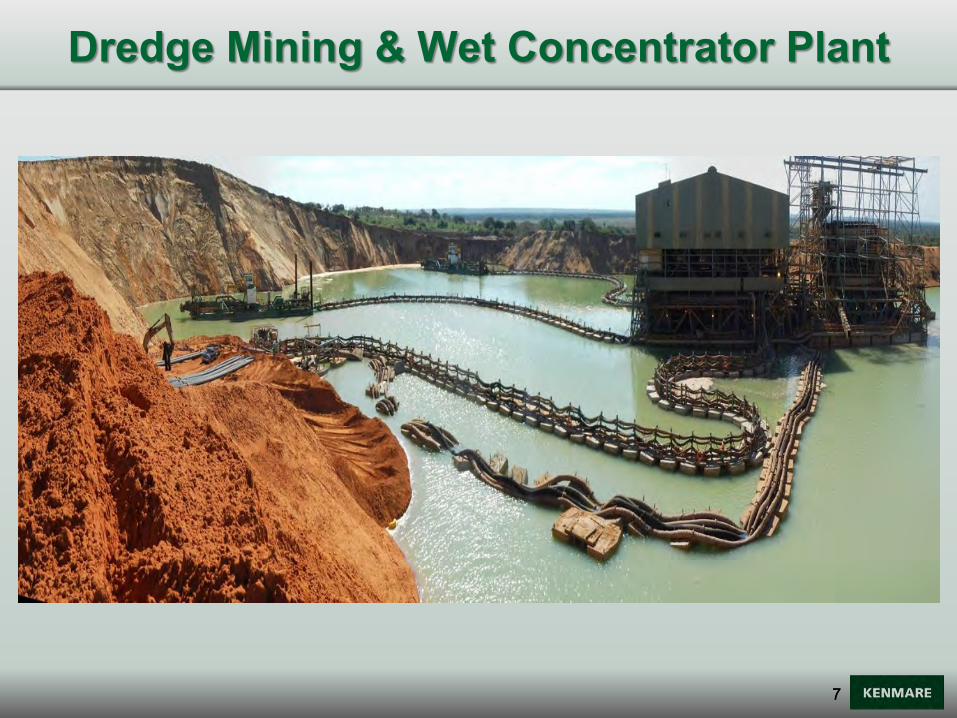
Dredge Mining & Wet Concentrator Plant
7
8
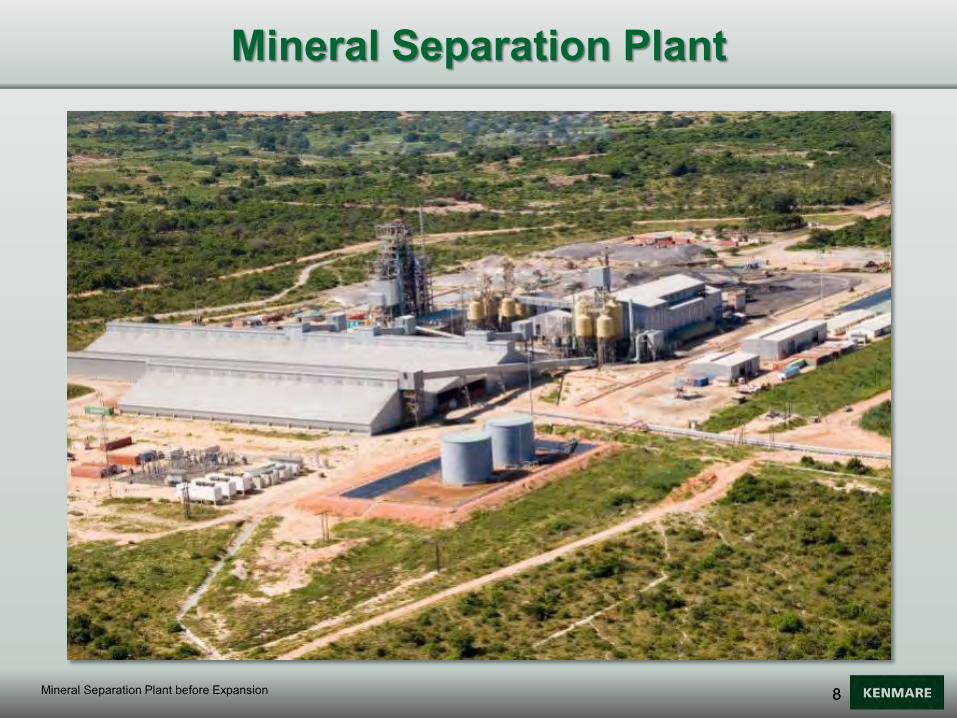
Mineral Separation Plant
8 Mineral Separation Plant before Expansion
9
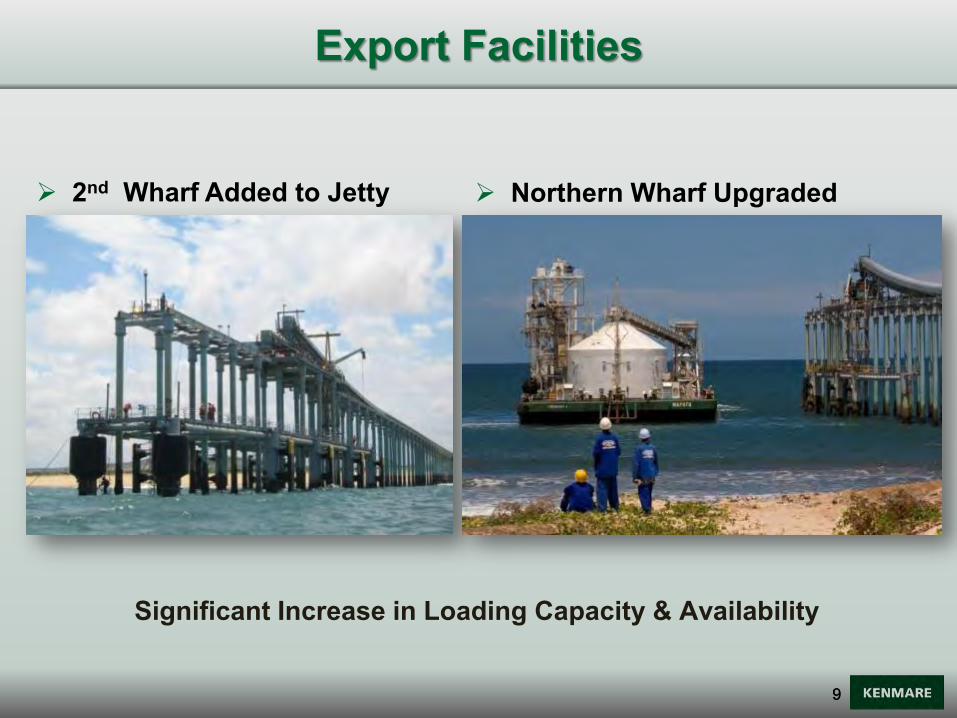
Significant Increase in Loading Capacity & Availability
Export Facilities
Northern Wharf Upgraded 2nd Wharf Added to Jetty
9

10
Current mine area WCP A to 2024 WCP B to 2020
100+ year life at Phase II expanded production level1
Dredge Path WCP A
Dredge Path WCP B
Namalope dredge path plan
Moma Mine – Resource Base Map
10 1. Based on mining reserves and resources under licence.

11
Monthly Production 2013
-
20,000
40,000
60,000
80,000
100,000
120,000
Jan-13 Feb-13 Mar-13 Apr-13 May-13
tonn
es
HMC Monthly Production
-
10,000
20,000
30,000
40,000
50,000
60,000
70,000
80,000
Jan-13 Feb-13 Mar-13 Apr-13 May-13
tonn
es
Ilmenite Monthly Production
- 500
1,000 1,500 2,000 2,500 3,000 3,500 4,000 4,500
Jan-13 Feb-13 Mar-13 Apr-13 May-13
tonn
es
Zircon Monthly Production Secondary Zircon
Primary Zircon
12
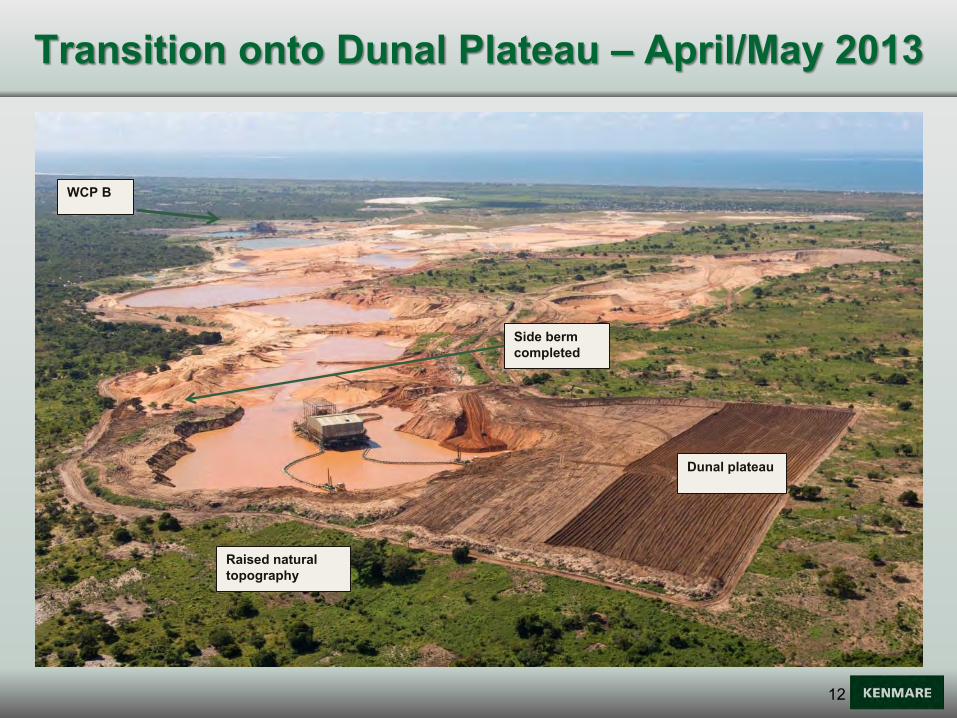
Transition onto Dunal Plateau – April/May 2013
Raised natural topography
Side berm completed
Dunal plateau
WCP B
13
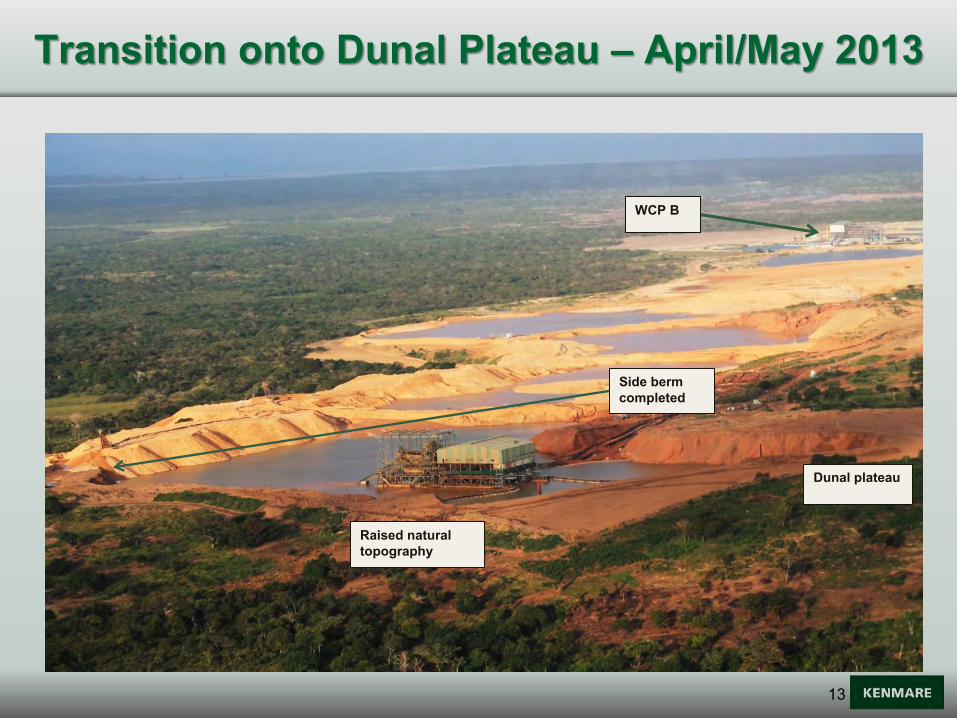
Transition onto Dunal Plateau – April/May 2013
Side berm completed
Dunal plateau
Raised natural topography
WCP B
14
Power Reliability Electrical Supply Stability
SVC at Mocuba – now commissioned, improved stability
SVC upgrade at Alto Molocue – now commissioned
Voltage Stabilisation Equipment (Dip Doctor) – expected to be completed mid-2013
Improved Network Voltage Support
Installation of network capacitors at Nampula – now commissioned
Installation of network capacitors at Moma – completed and ready for commissioning as Expansion load increases
Installation of network capacitors at Alto Molocue – completed and commissioned
15
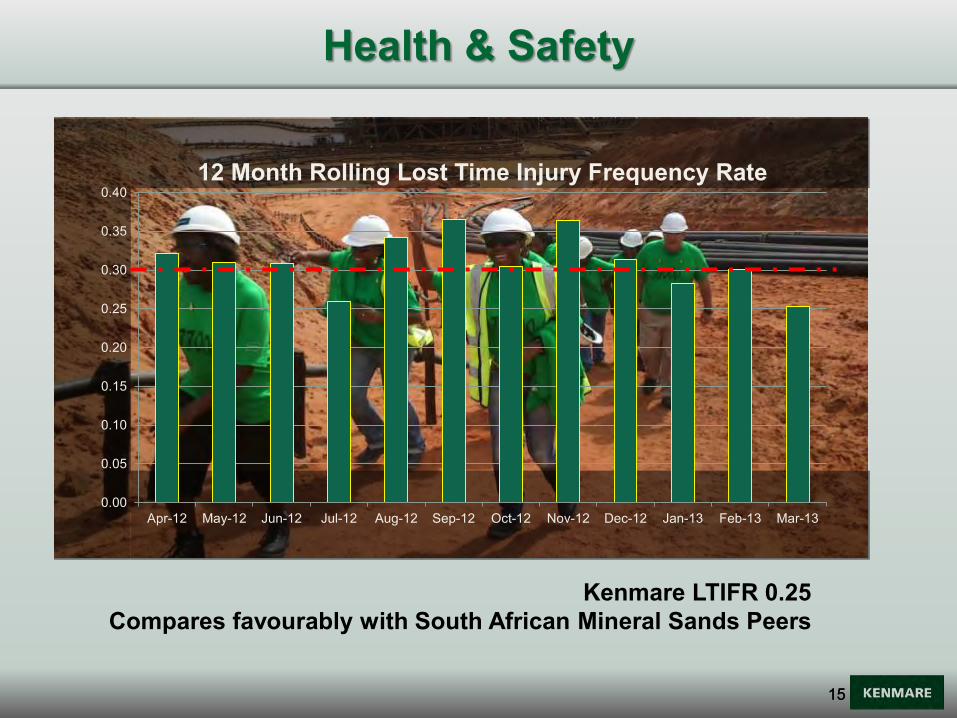
Health & Safety
Kenmare LTIFR 0.25 Compares favourably with South African Mineral Sands Peers
15
0.00
0.05
0.10
0.15
0.20
0.25
0.30
0.35
0.40
Apr-12 May-12 Jun-12 Jul-12 Aug-12 Sep-12 Oct-12 Nov-12 Dec-12 Jan-13 Feb-13 Mar-13
12 Month Rolling Lost Time Injury Frequency Rate

16
Kenmare Moma Development Association
Five-Year Plan being Implemented
Support from First Class Partners:
WWF, FMO, Clusa, Mozmed & MIGA
Community Projects:
Health Projects: Health Clinic at Moma
in construction phase, Malaria
Eradication
Income Generation: Savings & Credit,
Horticulture, Poultry, Sewing, Animal
Husbandry, Salt
Socio-Cultural: Schools, Sports,
Scholarships

17
Phase II Expansion
18
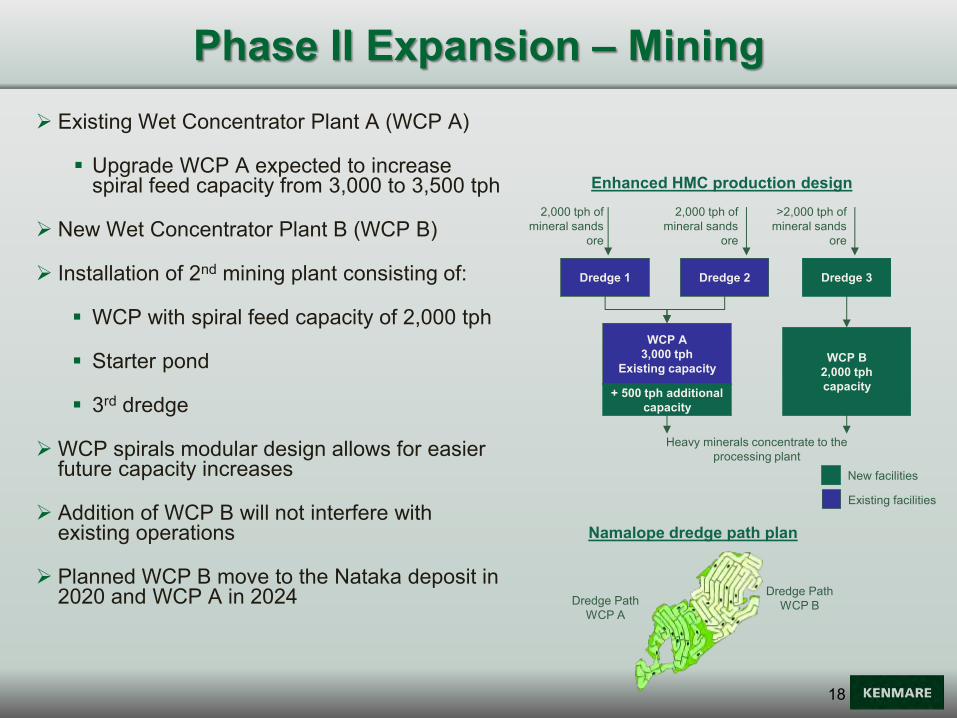
Existing Wet Concentrator Plant A (WCP A)
Upgrade WCP A expected to increase spiral feed capacity from 3,000 to 3,500 tph
New Wet Concentrator Plant B (WCP B)
Installation of 2nd mining plant consisting of:
WCP with spiral feed capacity of 2,000 tph
Starter pond
3rd dredge
WCP spirals modular design allows for easier future capacity increases
Addition of WCP B will not interfere with existing operations
Planned WCP B move to the Nataka deposit in 2020 and WCP A in 2024
Phase II Expansion – Mining
New facilities
Existing facilities
2,000 tph of mineral sands
ore
2,000 tph of mineral sands
ore
>2,000 tph of mineral sands
ore
Dredge 2 Dredge 3 Dredge 1
WCP A 3,000 tph
Existing capacity
Heavy minerals concentrate to the processing plant
+ 500 tph additional capacity
WCP B 2,000 tph capacity
Dredge Path WCP A
Dredge Path WCP B
Enhanced HMC production design
Namalope dredge path plan
19
Phase II Expansion – Processing
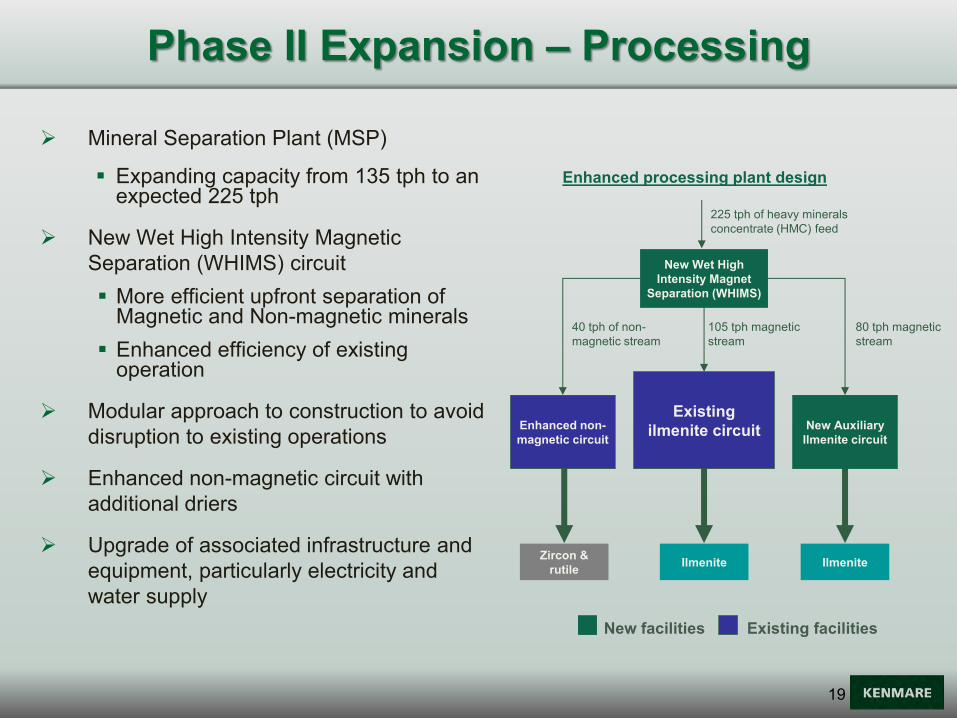
Mineral Separation Plant (MSP)
Expanding capacity from 135 tph to an expected 225 tph
New Wet High Intensity Magnetic Separation (WHIMS) circuit More efficient upfront separation of
Magnetic and Non-magnetic minerals Enhanced efficiency of existing
operation
Modular approach to construction to avoid disruption to existing operations
Enhanced non-magnetic circuit with additional driers
Upgrade of associated infrastructure and equipment, particularly electricity and water supply
New Wet High Intensity Magnet
Separation (WHIMS)
105 tph magnetic stream
80 tph magnetic stream
40 tph of non-magnetic stream
225 tph of heavy minerals concentrate (HMC) feed
Enhanced processing plant design
Zircon & rutile Ilmenite Ilmenite
New facilities Existing facilities
Enhanced non-magnetic circuit
Existing ilmenite circuit New Auxiliary
Ilmenite circuit

20
Expansion Progress – Dredge
3rd Dredge fully commissioned and mining ore

21
Expansion Progress – WCP B
WCP B Processing ore
22
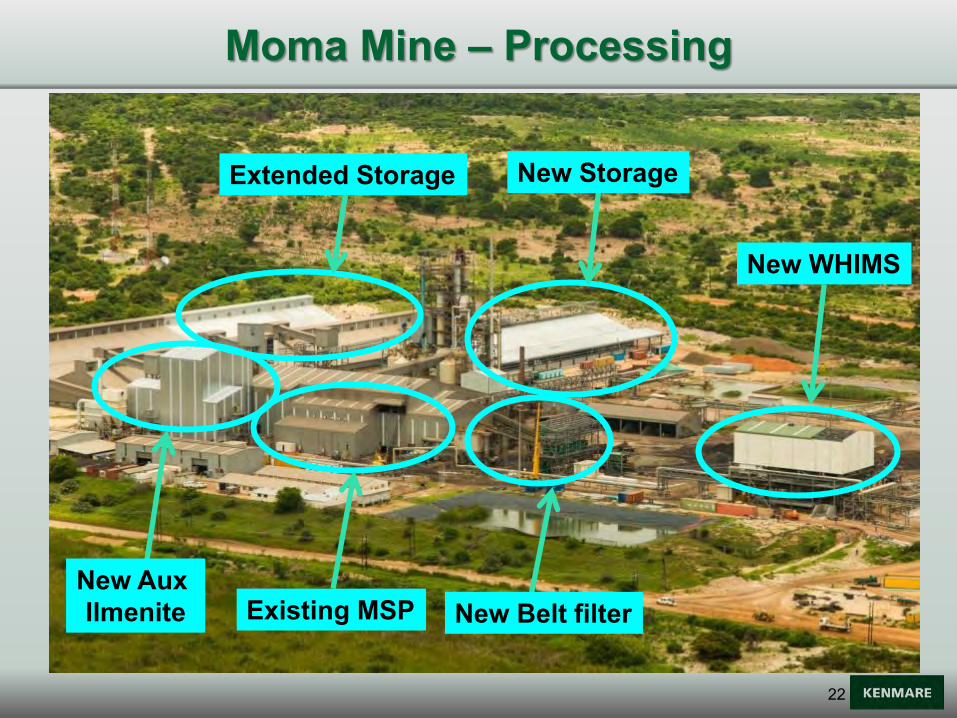
Moma Mine – Processing
New WHIMS
Existing MSP
Extended Storage
New Aux Ilmenite
New Storage
New Belt filter
23
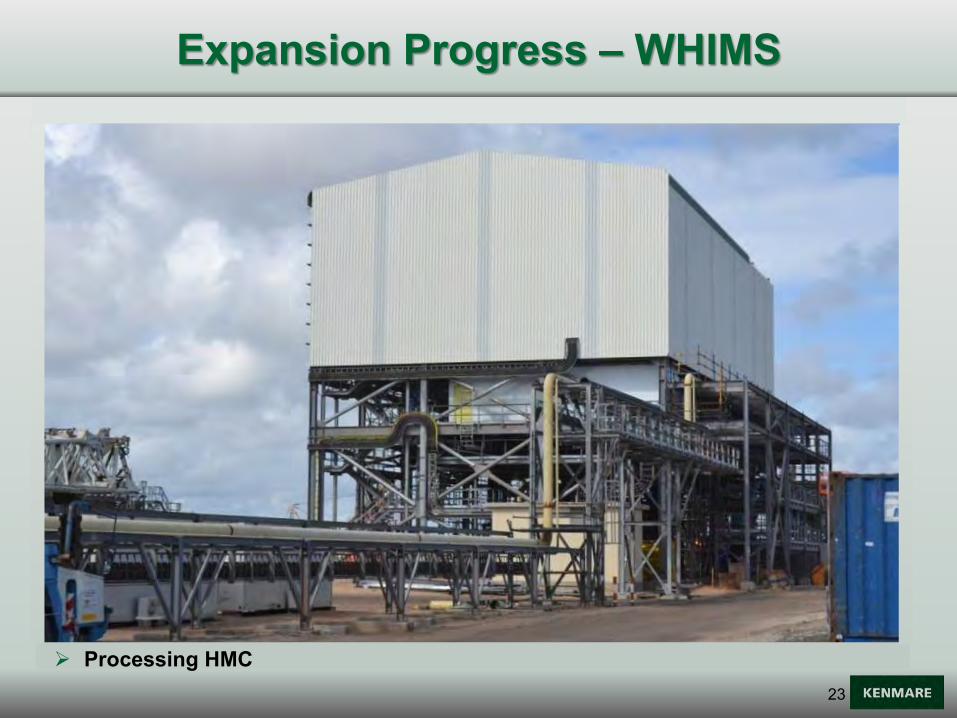
Expansion Progress – WHIMS
Processing HMC
24
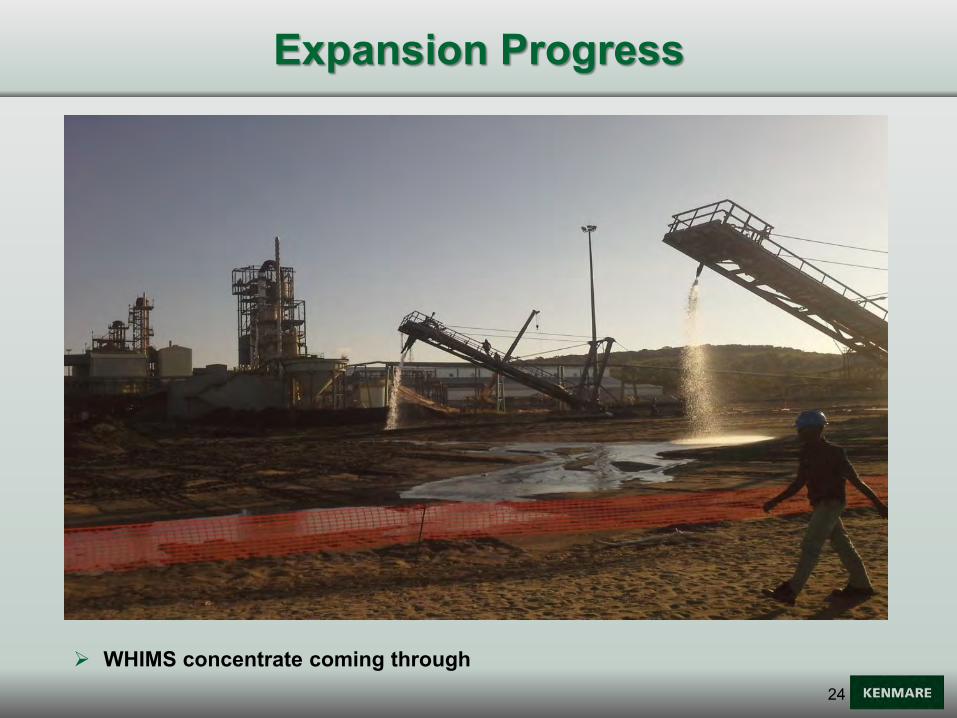
Expansion Progress
WHIMS concentrate coming through

25
Expansion Progress – Auxiliary Ilmenite Plant
Ready to process concentrate

26
Expansion Progress – Product Storage
Storage shed complete

27
Industry Overview
28
Pigment90%
Metal5%
Other5%
Paint58%Plastics
22%
Paper9%
Inks4%
Fibres2%
Others5%Kronos 8%
Huntsman 9%
Tronox 7%
Sachtleben 6%
ISK 3%Others 9%
DuPont 19%
China 27%
Cristal Global 12%
Description End uses
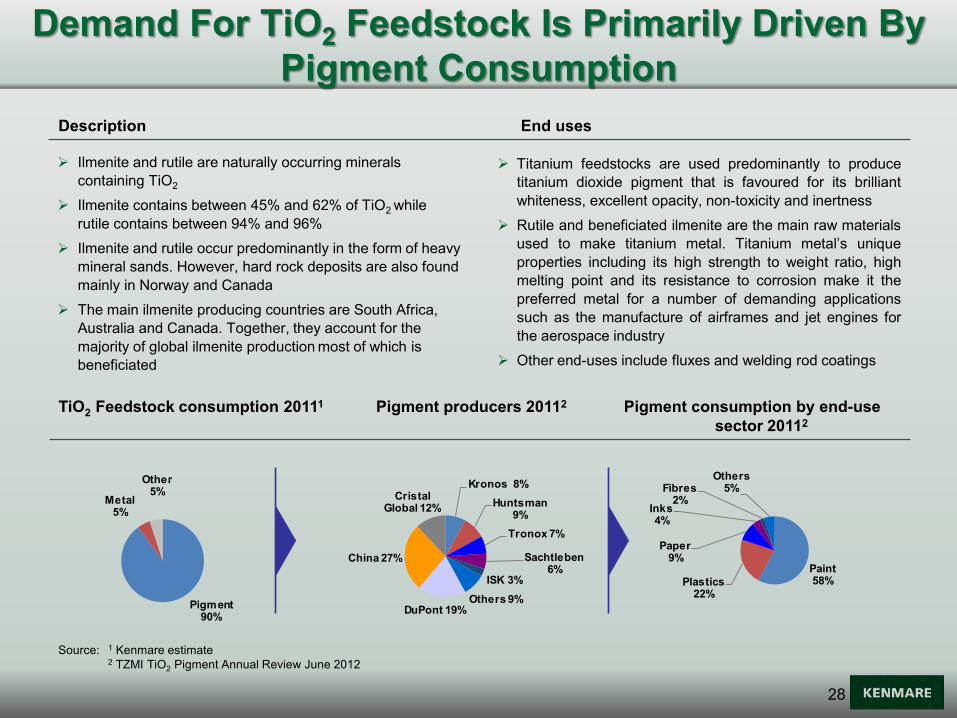
Demand For TiO2 Feedstock Is Primarily Driven By Pigment Consumption
TiO2 Feedstock consumption 20111 Pigment producers 20112 Pigment consumption by end-use sector 20112
Ilmenite and rutile are naturally occurring minerals containing TiO2
Ilmenite contains between 45% and 62% of TiO2 while rutile contains between 94% and 96%
Ilmenite and rutile occur predominantly in the form of heavy mineral sands. However, hard rock deposits are also found mainly in Norway and Canada
The main ilmenite producing countries are South Africa, Australia and Canada. Together, they account for the majority of global ilmenite production most of which is beneficiated
Titanium feedstocks are used predominantly to produce titanium dioxide pigment that is favoured for its brilliant whiteness, excellent opacity, non-toxicity and inertness
Rutile and beneficiated ilmenite are the main raw materials used to make titanium metal. Titanium metal’s unique properties including its high strength to weight ratio, high melting point and its resistance to corrosion make it the preferred metal for a number of demanding applications such as the manufacture of airframes and jet engines for the aerospace industry
Other end-uses include fluxes and welding rod coatings
Source: 1 Kenmare estimate 2 TZMI TiO2 Pigment Annual Review June 2012
29
Description End uses
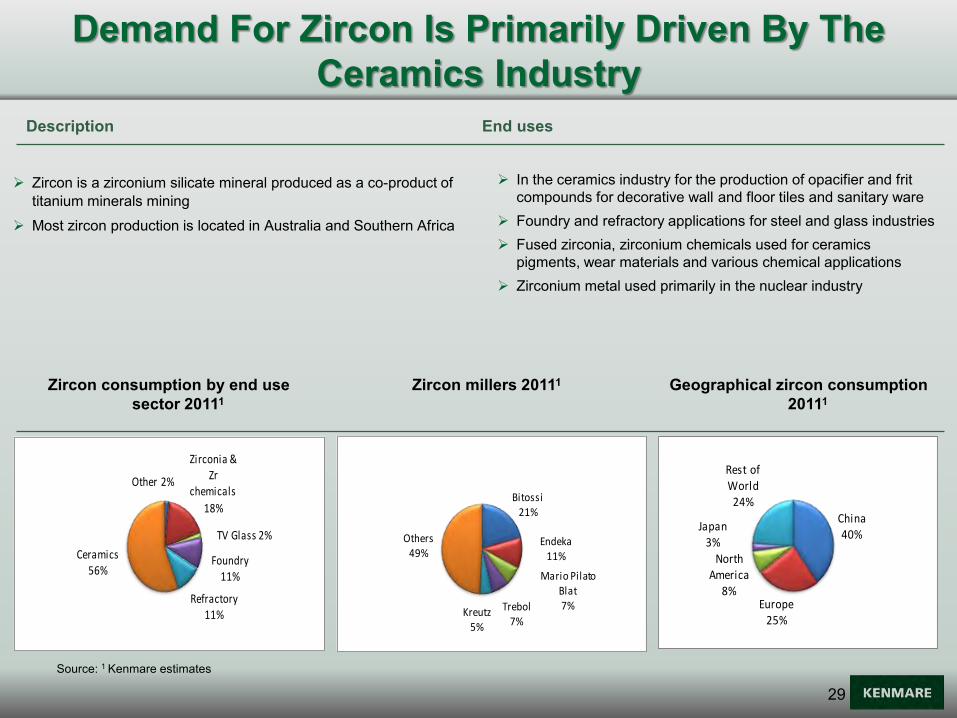
Zircon consumption by end use sector 20111
Zircon millers 20111 Geographical zircon consumption 20111
Demand For Zircon Is Primarily Driven By The Ceramics Industry
Other 2%
Zirconia & Zr
chemicals
18%
TV Glass 2%
Foundry 11%
Refractory 11%
Ceramics 56%
China40%
Europe25%
North America
8%
Japan3%
Rest of World
24%Bitossi21%
Endeka11%
Mario Pilato Blat7%Trebol
7%Kreutz
5%
Others49%
Zircon is a zirconium silicate mineral produced as a co-product of titanium minerals mining
Most zircon production is located in Australia and Southern Africa
In the ceramics industry for the production of opacifier and frit compounds for decorative wall and floor tiles and sanitary ware
Foundry and refractory applications for steel and glass industries Fused zirconia, zirconium chemicals used for ceramics
pigments, wear materials and various chemical applications Zirconium metal used primarily in the nuclear industry
Source: 1 Kenmare estimates

30
0
1,000
2,000
3,000
4,000
5,000
6,000
1991 1993 1995 1997 1999 2001 2003 2005 2007 2009 2011
Global Pigment Demand (1991 - 2011)('000 tonnes)
China WORLD
3.0% CAGR
17.0% CAGR
China - Key Source Of Growth In Pigment Demand For 20 Years Pigment Demand Growth for 20 Years
31
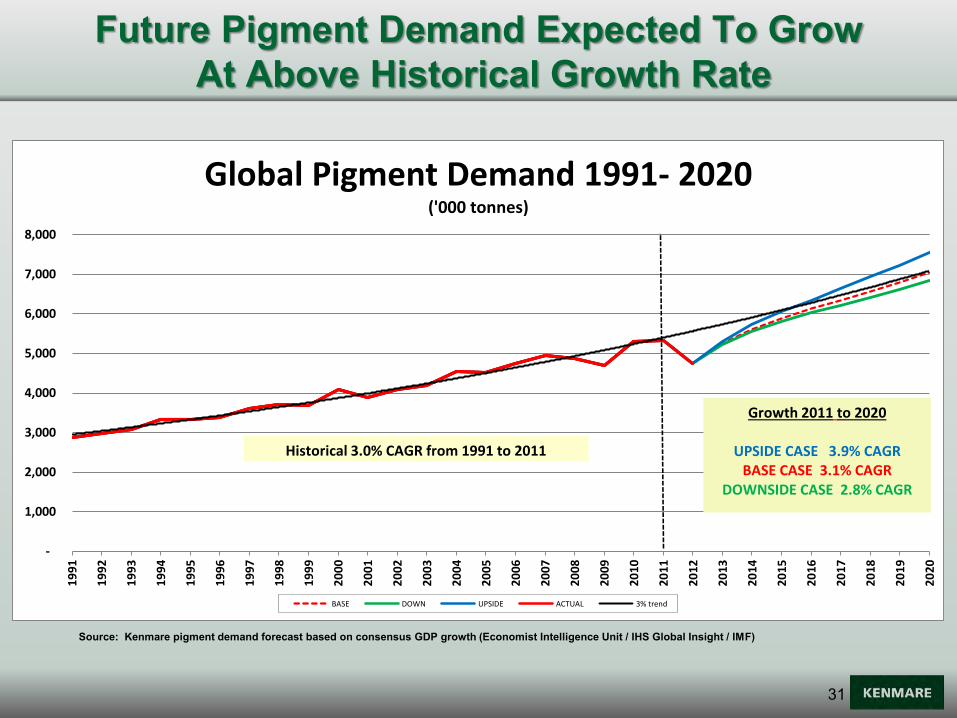
Source: Kenmare pigment demand forecast based on consensus GDP growth (Economist Intelligence Unit / IHS Global Insight / IMF)
Future Pigment Demand Expected To Grow At Above Historical Growth Rate
-
1,000
2,000
3,000
4,000
5,000
6,000
7,000
8,000
19
91
19
92
19
93
19
94
19
95
19
96
19
97
19
98
19
99
20
00
20
01
20
02
20
03
20
04
20
05
20
06
20
07
20
08
20
09
20
10
20
11
20
12
20
13
20
14
20
15
20
16
20
17
20
18
20
19
20
20
Global Pigment Demand 1991- 2020('000 tonnes)
BASE DOWN UPSIDE ACTUAL 3% trend
Historical 3.0% CAGR from 1991 to 2011
Growth 2011 to 2020
UPSIDE CASE 3.9% CAGRBASE CASE 3.1% CAGR
DOWNSIDE CASE 2.8% CAGR

32
Pigment Demand Growth Drivers
Pigment Consumption Intensity of TiO2 in 20101
1 Source TZMI Ilmenite Study & Price Forecasts Update April 2011
Demand growth drivers in developing
economies:
Pigment intensity of use at early stage of growth curve
Increasing per capita GDP
Urbanisation trends
Per capita consumption rates of ~3kg in
Western developed economies
Currently below 1kg per capita in BRIC and
other developing economies
3.1% CAGR from 2011 to 2020 driven by strong
growth in developing economies
33
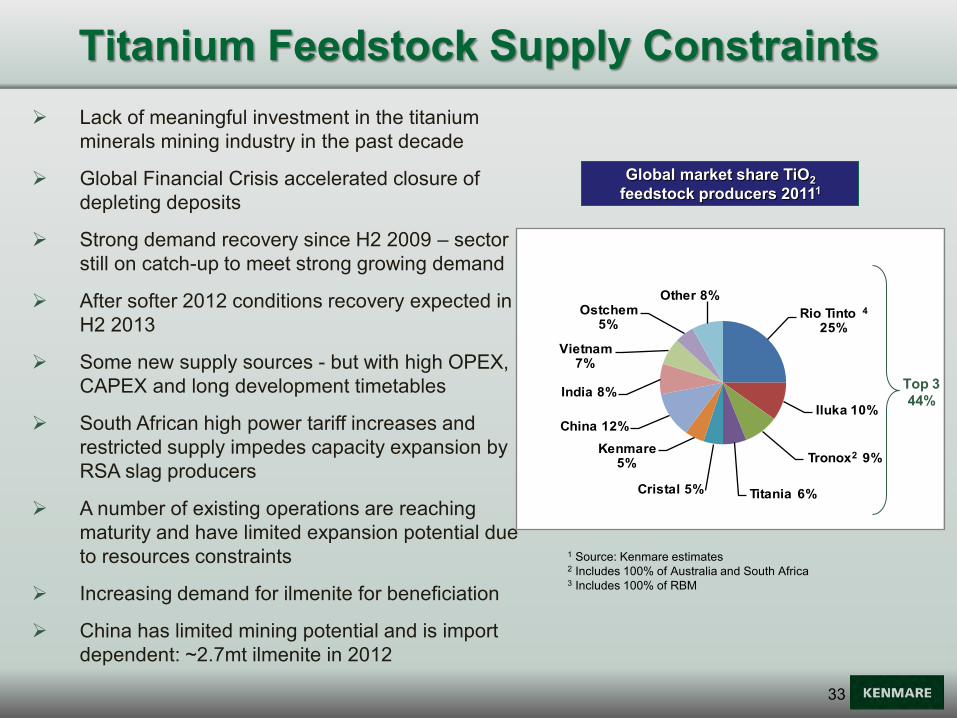
Lack of meaningful investment in the titanium minerals mining industry in the past decade
Global Financial Crisis accelerated closure of depleting deposits
Strong demand recovery since H2 2009 – sector still on catch-up to meet strong growing demand
After softer 2012 conditions recovery expected in H2 2013
Some new supply sources - but with high OPEX, CAPEX and long development timetables
South African high power tariff increases and restricted supply impedes capacity expansion by RSA slag producers
A number of existing operations are reaching maturity and have limited expansion potential due to resources constraints
Increasing demand for ilmenite for beneficiation
China has limited mining potential and is import dependent: ~2.7mt ilmenite in 2012
Global market share TiO2 feedstock producers 20111
51%
Titanium Feedstock Supply Constraints
Rio Tinto 4
25%
Iluka 10%
Tronox2 9%
Titania 6%Cristal 5%
Kenmare 5%
China 12%
India 8%
Vietnam 7%
Ostchem 5%
Other 8%
Top 3 44%
1 Source: Kenmare estimates 2 Includes 100% of Australia and South Africa 3 Includes 100% of RBM
34
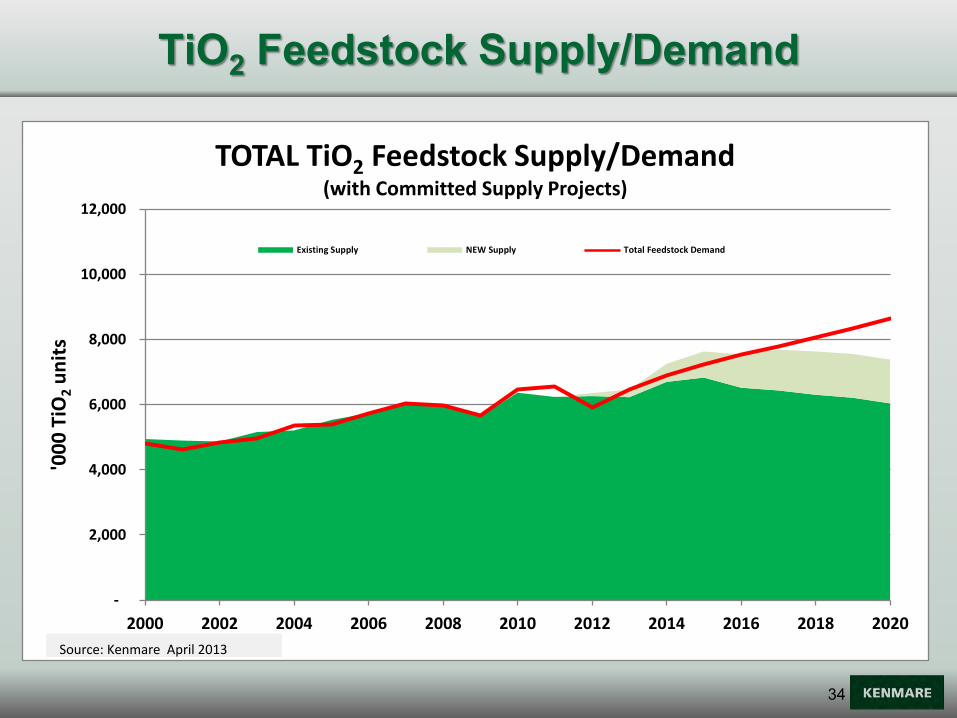
TiO2 Feedstock Supply/Demand
-
2,000
4,000
6,000
8,000
10,000
12,000
2000 2002 2004 2006 2008 2010 2012 2014 2016 2018 2020
'00
0 T
iO2
un
its
TOTAL TiO2 Feedstock Supply/Demand(with Committed Supply Projects)
Existing Supply NEW Supply Total Feedstock Demand
Source: Kenmare April 2013

35
Financials

36
Revenue & EBITDA 2010 – 2012
0
20
40
60
80
100
120
0
50
100
150
200
250
2010 2011 2012
EBIT
DA
US$
m
Rev
enue
US$
m
Revenue EBITDA
37
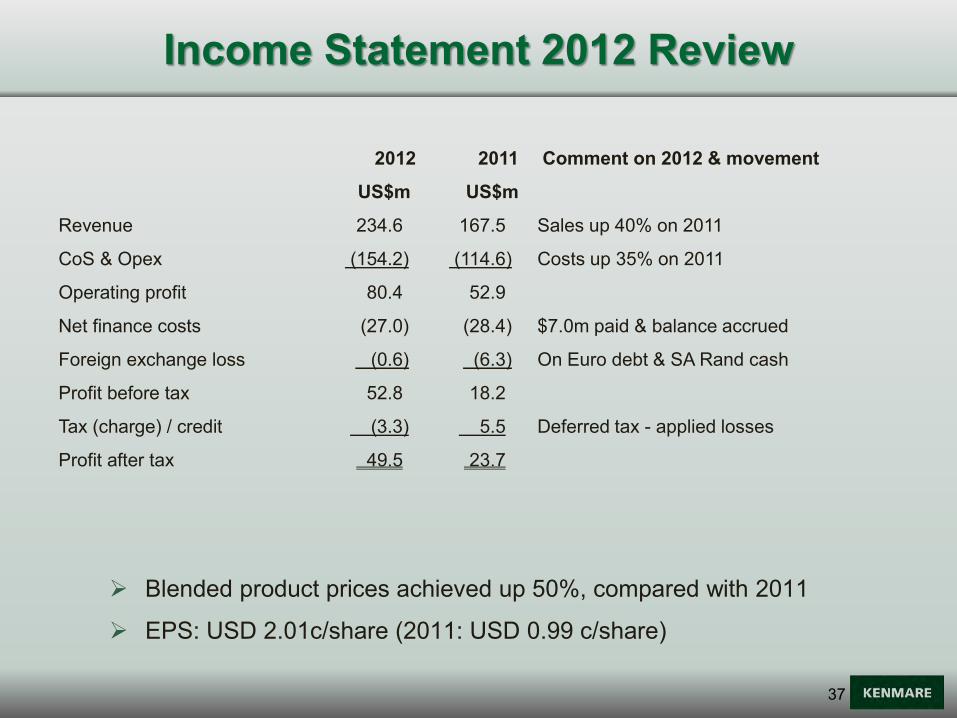
Income Statement 2012 Review
2012 2011 Comment on 2012 & movement
US$m US$m
Revenue 234.6 167.5 Sales up 40% on 2011
CoS & Opex (154.2) (114.6) Costs up 35% on 2011
Operating profit 80.4 52.9
Net finance costs (27.0) (28.4) $7.0m paid & balance accrued
Foreign exchange loss (0.6) (6.3) On Euro debt & SA Rand cash
Profit before tax 52.8 18.2
Tax (charge) / credit (3.3) 5.5 Deferred tax - applied losses
Profit after tax 49.5 23.7
Blended product prices achieved up 50%, compared with 2011
EPS: USD 2.01c/share (2011: USD 0.99 c/share)

38
Balance Sheet 2012 Review
Significant Balance Sheet movements are expansion related
2012 2011 Comment on 2012 & movement
US$m US$m
Property, plant & equipment 887.5 714.1 Largely expansion investment
Deferred tax asset 2.2 5.5 Used with increasing profitability
Inventories 22.4 25.8 Lower product stocks & higher spares
Trade & other receivables 35.7 38.8 No bad debts
Cash 46.1 77.3 Reduced due to expansion investment
Total assets 993.9 861.5
Equity & reserves 605.6 495.4 2012 profit & share placing July ’12
Bank loans 324.4 327.1 Repaying senior & roll-up Sub debt
Creditors & provisions 63.9 39.0 Increase in expansion creditors
Total equity & liabilities 993.9 861.5
39
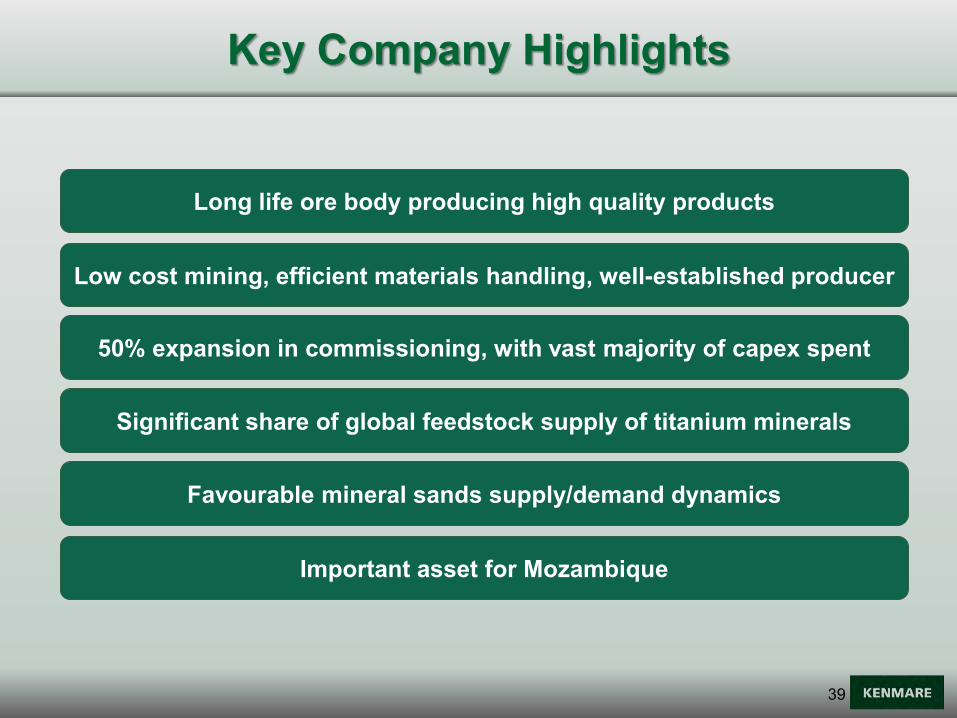
Key Company Highlights
Long life ore body producing high quality products
Low cost mining, efficient materials handling, well-established producer
50% expansion in commissioning, with vast majority of capex spent
Significant share of global feedstock supply of titanium minerals
Favourable mineral sands supply/demand dynamics
Important asset for Mozambique

40
Kenmare Resources plc
Chatham House , Chatham Street
Dublin 2, Ireland
www.kenmareresources.com