keeping college graduates in michigan - michigan … college graduates in michigan michigan colleges...
TRANSCRIPT

Keeping College Graduates in Michigan Michigan Colleges Foundation Student Survey Findings 1
Keeping College
Graduates in
Michigan
Michigan Colleges Foundation
Student Survey Findings
April 13, 2011
© 2011 Michigan Colleges Foundation
Keepin
g C
olle
ge G
raduat
es
in M
ichig
an

TABLE OF CONTENTS
Rationale: Why this project? Why now? ....................................................................................................... 2
Next Cities & The Seven Indexes ................................................................................................................... 3
Overview: Survey Demographics ................................................................................................................... 4
Key Findings: What Did We Learn?
1. Overall, Michigan natives are committed to staying in the state but they are not
“ambassadors” of the state. ...................................................................................................................... 5
2. The perceptions students have of Michigan and the regions of Detroit, Grand Rapids, and
Lansing are not measuring up to their values and may hinder the state‟s ability to retain
students following graduation. ................................................................................................................. 6
3. The perceived lack of “Earning” opportunities in Michigan is the primary reason college
graduates will leave the state. ................................................................................................................13
4. Educating students about life after college in Michigan will require word of mouth,
technology, and carefully crafted visits.................................................................................................13
5. Promoting specific quality of life amenities - like good-paying jobs, affordable housing,
commute times, access to parks, bike and hike trails - is key to marketing post-graduate life
in Michigan. .................................................................................................................................................15
Conclusion: Where do we go from here?: ...............................................................................................16

Keeping College Graduates in Michigan Michigan Colleges Foundation Student Survey Findings 3
RATIONALE | Why This Project? Why Now?
In the State of Michigan, nearly 50% of the more than 300,000 students educated by its 15
public universities will leave the state upon graduation.1
The steady leak of talent out of Michigan is not new. From 2000-2010, Michigan was the only
state in the nation to lose population.2
This is a trend that must be addressed, and if possible, reversed. Research shows that 58
percent of a city‟s success, as measured by per capita income, can be attributed to post-
secondary degree attainment3.
For Michigan to grow its economy, it must engage and retain its college graduates before they
decide to leave, while there‟s still time:
“For Michigan‟s turnaround, the ability to attract, engage and retain talent is a linchpin.
Connecting students in personal and meaningful ways to Michigan‟s future before they
graduate and plan their lives elsewhere is a critical component to the state‟s economic
transformation, particularly for our major urban centers.”
- Michigan Colleges Foundation, Partnership for Michigan
To address this transformation, the central questions of this study were:
Why - and how - do Michigan college students form their opinions about Michigan communities?
What can we do to address their perceptions, and reposition Michigan as a smart choice for
smart graduates? What - beyond jobs - do they value in “cool communities?”
Certainly, jobs are important to retain Michigan‟s college graduates. But, as many 20-somethings
will tell you, “there‟s more to life than work.” This study also addressed students‟ perceptions
of seven quality of life indexes, as outlined on the following page.
1 "Slowing the Brain Drain", by Dustin Walsh
2 2010 Census shows Michigan's population declined since 2000
3 CEO’s For Cities, source: http://www.ceosforcities.org/blog/entry/2976/ceos-for-cities-launches-the-talent-
dividend-prize

NEXT CITIES & THE SEVEN INDEXES
Next Cities™ are places (states/cities/regions) with the assets and amenities that attract and
keep a young, educated workforce. Think bustling downtowns, walkable neighborhoods, diverse
career opportunities, and a vibrant art and music scene. Next Cities™ are places the next
generation proudly calls “home” because they nurture the attributes the next generation values.
Next Generation Consulting (“Next Generation”) groups these attributes into Seven Indexes:
Cost of Lifestyle | Recent graduates and young professionals are just getting started in their
careers, and for many, affordability is key. This index includes variables that encapsulate a roof
over the head and food on the table.
Earning | High school guidance counselors tell students that they‟ll have between nine and
eleven jobs in their lifetime. The Earning index considers Michigan‟s average household income,
the percentage of jobs in the knowledge-based sector, and more.
Learning | Is Michigan committed to high quality education for all of its residents? This index
considers educational expenditures, student-teacher ratio, educational attainment, Wi-Fi
hotspots, and more.
Social Capital | Great talent comes in every race, creed, and color. This index accounts for
how open, safe, and accessible the state is to all people. It includes measures of diversity,
integration, and crime rates.
Vitality | How committed is Michigan to an active and healthy lifestyle? This index considers
water quality, air quality, physicians per capita, farmers‟ markets, and dog parks.
After Hours | There‟s more to life than work. This index considers the places to go and
things to do after work and on weekends in Michigan‟s communities.
Around Town | How easy is it to get to where you want to go in Michigan? This index
considers “walkability,” commute times, public transit usage, and more.

Keeping College Graduates in Michigan Michigan Colleges Foundation Student Survey Findings 5
OVERVIEW | Survey Demographics
The Michigan Colleges Foundation (MCF) Survey was open from February 21, 2011, until March
13, 2011. Students from MCF‟s fourteen member institutions participated and a total of 3,8254
completed responses were captured.
Survey participants were asked general demographic and perception based questions about
Michigan and their plans following graduation. Participants were also randomized into three
survey “branches” - Detroit, Grand Rapids, and Lansing - and were asked a set of perception
questions specific to each region.
At a quick glance, respondents were:
• Upper class-men (59% have a Junior, Senior, or 5th Year Senior class standing)
• Female (71%)
• White/Caucasian (86%)
• Average age of 21.9
• Michigan Natives (71%)
• Attending:
Adrian College 4%
Albion College 5%
Alma College 7%
Andrews University 8%
Aquinas College 16%
Calvin College 10%
Hillsdale College 8%
Hope College 19%
Kalamazoo College 2%
Madonna University 2%
Marygrove College 2%
Olivet College 2%
Siena Heights University 3%
Spring Arbor University 12%
Relationship to Michigan
Of the total respondents, 71% have lived in Michigan for more than half their lives and 29% are
not originally from the state. Of the Michigan “natives” over half (54%) are from rural or small
communities compared to only 38% of non-natives.
The majority (72%) of respondents had no relationship to the region in which the survey
“branched” their questioning. Those that were from the region grew up in the larger metro
area, not within the city boundaries.
4 In total, more than 4,500 responses were collected. Only 3,825 were complete, valid responses.

KEY FINDINGS | What did we learn?
1. Overall, Michigan natives are committed to staying in the state but they are
not “ambassadors” of the state.
When considering the state‟s ability to retain current Michigan natives, the survey results show
that Michigan is performing well. More than half of natives (59%) said they are considering
staying in the state after graduation. Only 11% of Michigan natives indicated they plan on leaving
the state, however, 30% said they are unsure about their plans. This means Michigan has the
potential to keep 89% of students originally from the state.
Furthermore, when respondents were asked what cities in which they were considering living
after graduation, many Michigan cities ranked high on the list. Figure 1, is a “word cloud” image.
This visual gives greater prominence to cities that were listed more frequently.
Figure 1: Cities in Consideration for “Life After Graduation”
As the word cloud depicts, several Michigan communities rank high on students‟ lists of places
to live after graduation. Grand Rapids, MI was the top named city followed by Chicago, IL;
Holland, MI; Ann Arbor, MI; Seattle, WA; and Denver, CO. Other cities frequently listed were
Lansing, MI; Boston, MA; Detroit, MI; Washington D.C.; and New York, NY.
Although these findings fare well for the state‟s efforts to retain its existing native-student
population, the state struggles in developing these students as promoters for Michigan.
There is no better way to retain non-native students to Michigan than to create “ambassadors” -
loyal customers - who are proud to be from Michigan and share the good reasons to call
Michigan “home.”
Next Generation uses the Net Promoter Score (NPS)5 to measure respondents‟ likelihood – on
a scale of 0 to 10 – to promote Michigan to friends or family who are considering
staying/relocating.
5 The Net Promoter Score is based on years of research on customer loyalty and profitability spanning several
industries and decades. To learn more about the Net Promoter Score and how it‟s being used by a variety of
industries, see http://www.netpromoter.com/.
Keeping College Graduates in Michigan Michigan Colleges Foundation Student Survey Findings 7
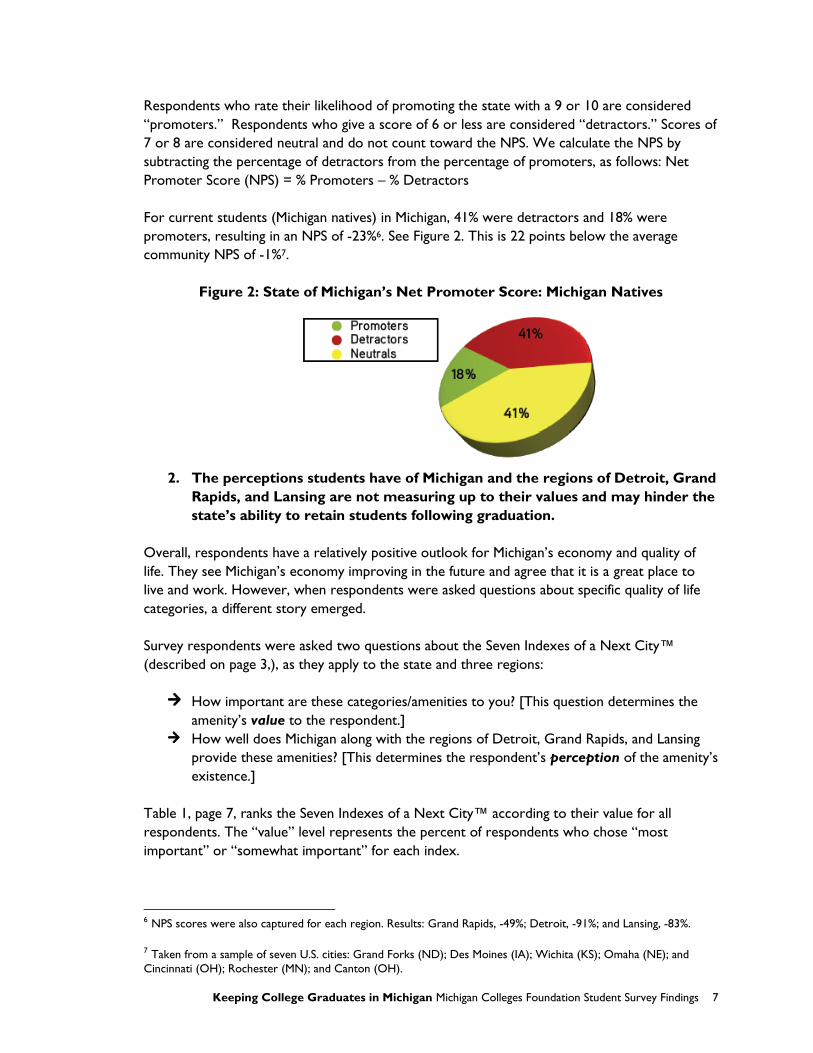
Respondents who rate their likelihood of promoting the state with a 9 or 10 are considered
“promoters.” Respondents who give a score of 6 or less are considered “detractors.” Scores of
7 or 8 are considered neutral and do not count toward the NPS. We calculate the NPS by
subtracting the percentage of detractors from the percentage of promoters, as follows: Net
Promoter Score (NPS) = % Promoters – % Detractors
For current students (Michigan natives) in Michigan, 41% were detractors and 18% were
promoters, resulting in an NPS of -23%6. See Figure 2. This is 22 points below the average
community NPS of -1%7.
Figure 2: State of Michigan’s Net Promoter Score: Michigan Natives
2. The perceptions students have of Michigan and the regions of Detroit, Grand
Rapids, and Lansing are not measuring up to their values and may hinder the
state’s ability to retain students following graduation.
Overall, respondents have a relatively positive outlook for Michigan‟s economy and quality of
life. They see Michigan‟s economy improving in the future and agree that it is a great place to
live and work. However, when respondents were asked questions about specific quality of life
categories, a different story emerged.
Survey respondents were asked two questions about the Seven Indexes of a Next City™
(described on page 3,), as they apply to the state and three regions:
How important are these categories/amenities to you? [This question determines the
amenity‟s value to the respondent.]
How well does Michigan along with the regions of Detroit, Grand Rapids, and Lansing
provide these amenities? [This determines the respondent‟s perception of the amenity‟s
existence.]
Table 1, page 7, ranks the Seven Indexes of a Next City™ according to their value for all
respondents. The “value” level represents the percent of respondents who chose “most
important” or “somewhat important” for each index.
6 NPS scores were also captured for each region. Results: Grand Rapids, -49%; Detroit, -91%; and Lansing, -83%.
7 Taken from a sample of seven U.S. cities: Grand Forks (ND); Des Moines (IA); Wichita (KS); Omaha (NE); and
Cincinnati (OH); Rochester (MN); and Canton (OH).

Table 1: Student Values for the Seven Indexes of a Next City™
Index Value
COST OF LIFESTYLE: I want a community where I can afford to live, work, and play
(affordable housing/rent and amenities).
94%
EARNING: I want a stable economy with good jobs, a broad choice of places to work, and
an environment that is friendly to entrepreneurs.
90%
LEARNING: I want to plug into a smart community with strong schools (K-12 and lifelong
learning opportunities (higher education & personal enrichment)
84%
SOCIAL CAPITAL: I value living in a safe (low crime) and diverse community, with other
young people. Where all people are engaged and involved in community life.
83%
VITALITY: I value living in a vibrant community where people are kind to the environment,
healthy, and "out and about" - using public parks, trails, recreation areas, and attending
farmers‟ markets.
82%
AFTER HOURS: I want plenty to do with authentic local places to have dinner, meet for
coffee, hear live music, visit galleries, attend theatre, or just hang out.
77%
AROUND TOWN: I want to live in a community that's connected and easy to navigate
using multiple modes of transit including foot, bike, car, and bus (walkable
neighborhoods/downtown, bike lanes, public transit, etc.).
76%
Students value Cost of Lifestyle more than any other index followed by Earning and
Learning.
This matches recent findings by Next Generation which identified that under-40s will choose
„Cost of Lifestyle‟ as the single most important factor when choosing where to live, e.g.
nationally, 96% say it‟s either „Very Important or „Somewhat Important‟.
Figure 3, offers another way of looking at the value students place on each index. This spider
diagram is what Next Generation calls a “Handprint”. This particular handprint shows the level
of value, on a scale of 0-10, that Michigan students place on each index.
Figure 3: Michigan Student’s Value Level Handprint

Keeping College Graduates in Michigan Michigan Colleges Foundation Student Survey Findings 9
Table 2, compares students‟ perceptions of the state and three regions and offers an average
variance compared to the value level for each index and overall. The “perception” level
represents the percent of respondents who chose “completely agree” or “agree” with how well
the state and each region offer amenities in each index.
Table 2: Student Perceptions for State & Regions in the Seven Indexes of a Next City™
Index Value
Perception Average
Variance
from
Value
per Index Michigan Detroit
Grand Rapids
Lansing
COST OF LIFESTYLE: I can afford to live,
work, and play in [Michigan/Detroit/Grand
Rapids/Lansing] (affordable housing/rent and
amenities).
94% 69% 11% 46% 21% -56%
EARNING: [Michigan/Detroit/Grand
Rapids/Lansing]‟s economy is stable and offers
good jobs, broad choices of places to work,
and an environment that is friendly to
entrepreneurs.
89% 11% 34% 38% 24% -63%
LEARNING: I believe
[Michigan/Detroit/Grand Rapids/Lansing]
offers strong schools (K-12) and lifelong
learning opportunities (higher education &
personal enrichment).
84% 64% 10% 46% 23% -46%
SOCIAL CAPITAL: [Michigan/Detroit/Grand
Rapids/Lansing]‟s communities are safe (low
crime) and diverse, with other young people.
All people are engaged and involved in
community life.
83% 42% 34% 55% 36% -37%
VITALITY: [Michigan/Detroit/Grand
Rapids/Lansing]‟s communities are vibrant
communities, where people are kind to the
environment, healthy, and "out and about" - using public parks, trails, recreation areas, and
attending farmer's markets.
82% 54% 54% 71% 44% -30%
AFTER HOURS: [Michigan/Detroit/Grand
Rapids/Lansing] offers plenty to do with
authentic local places to have dinner, meet for
coffee, hear live music, visit galleries, attend
theatre, or just hang out.
77% 67% 8% 43% 24% -46%
AROUND TOWN: [Michigan/Detroit/Grand
Rapids/Lansing]‟s communities are connected
and easy to navigate using multiple modes of
transit including foot, bike, car, air, and bus
(walkable neighborhoods/downtown, bike
lanes, public transit, etc.).
76% 51% 7% 32% 23% -49%
Average Variance for all Indexes compared
to Value for Michigan & Regions
84% -32% -61% -36% -56% -46%

In looking at the variances in Table 2, page 8, the closer the difference is to “0,” the better the
match between respondent‟s value for that index, and their perception that the index is strong.
The average variance between value and perception for all indexes in the state and the three
regions is -46%. Ideally, the variance for each index would be less than 15%.
This indicates the State of Michigan has significant perception problems with gaps in all seven
indexes, the largest being the low perception of Earning opportunities in the state. This Earning
gap along with the overall gap is impacting Michigan‟s ability to retain college graduates and it
must be addressed to keep students in the state following graduation.
Figures 4-7, takes Figure 3: Michigan Student‟s Value Level Handprint, and lays the perception
levels on top of it to provide a visual diagram of the variances between value and perception in
each index for the State of Michigan, Detroit, Grand Rapids, and Lansing.
Figure 4: State of Michigan Value vs. Perception Diagram
Keeping College Graduates in Michigan Michigan Colleges Foundation Student Survey Findings 11
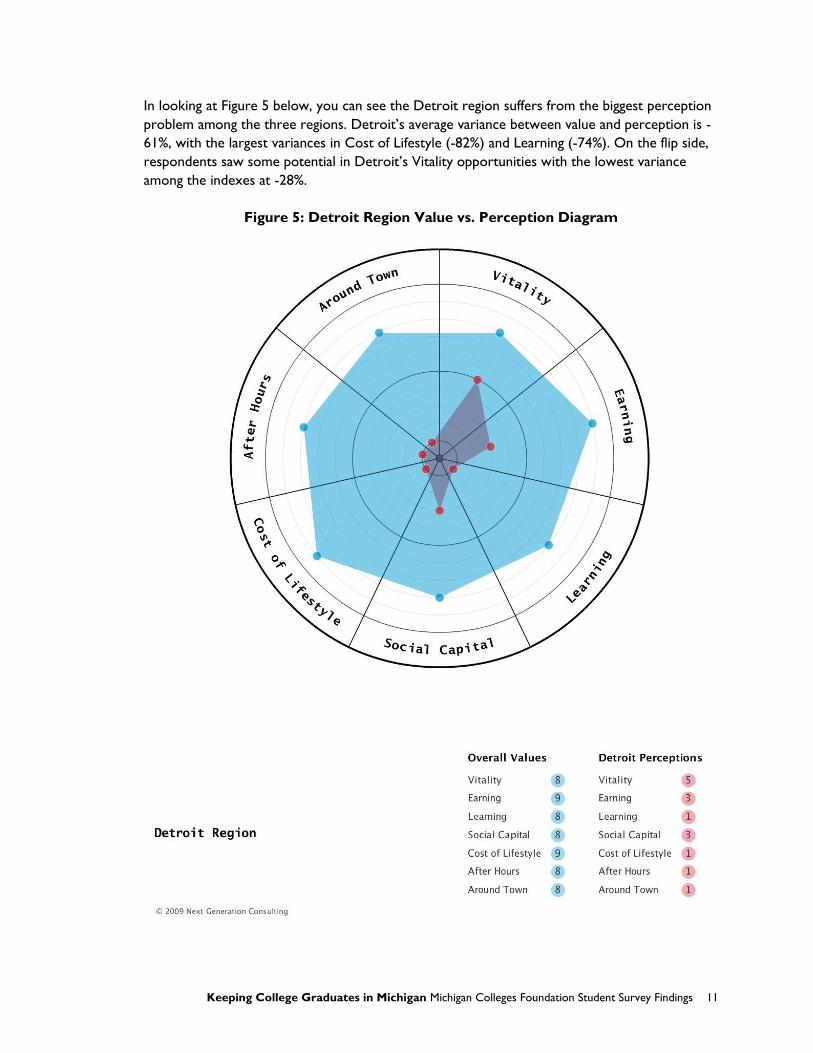
In looking at Figure 5 below, you can see the Detroit region suffers from the biggest perception
problem among the three regions. Detroit‟s average variance between value and perception is -
61%, with the largest variances in Cost of Lifestyle (-82%) and Learning (-74%). On the flip side,
respondents saw some potential in Detroit‟s Vitality opportunities with the lowest variance
among the indexes at -28%.
Figure 5: Detroit Region Value vs. Perception Diagram
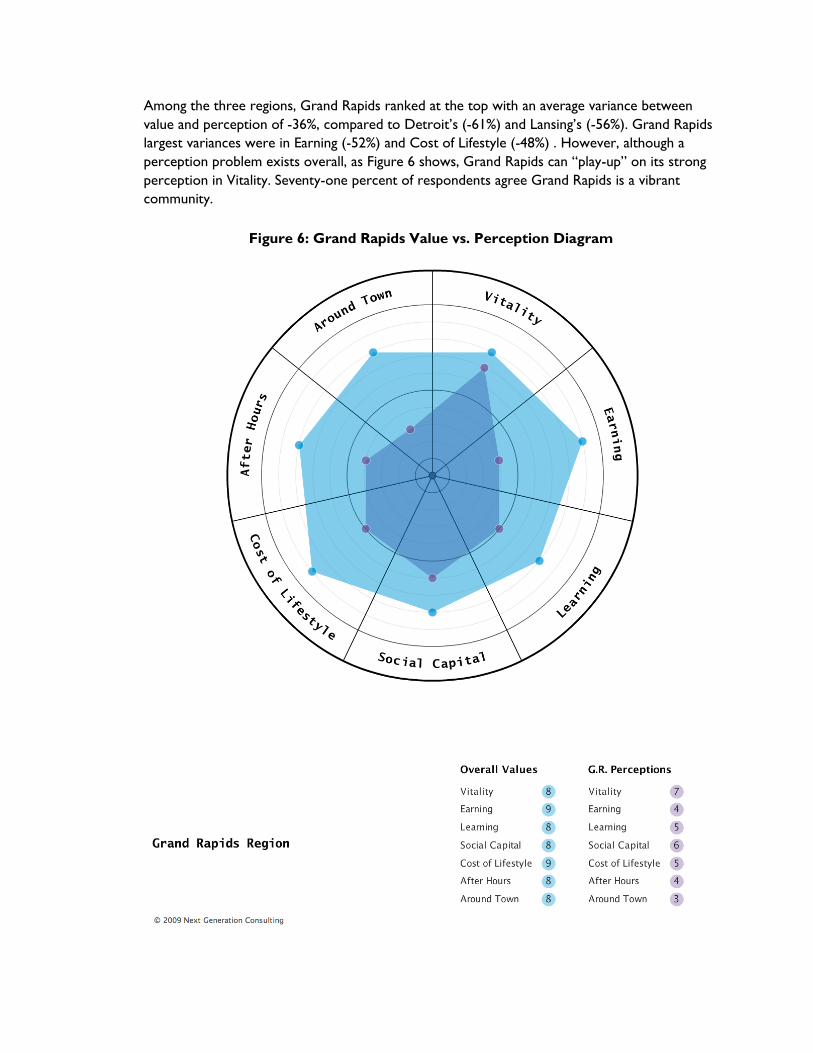
Among the three regions, Grand Rapids ranked at the top with an average variance between
value and perception of -36%, compared to Detroit‟s (-61%) and Lansing‟s (-56%). Grand Rapids
largest variances were in Earning (-52%) and Cost of Lifestyle (-48%) . However, although a
perception problem exists overall, as Figure 6 shows, Grand Rapids can “play-up” on its strong
perception in Vitality. Seventy-one percent of respondents agree Grand Rapids is a vibrant
community.
Figure 6: Grand Rapids Value vs. Perception Diagram

Keeping College Graduates in Michigan Michigan Colleges Foundation Student Survey Findings 13
Figure 7, provides a visual for the variances in each index for the Lansing region. Like Detroit,
Lansing battles a big perception problem with an average variance between value and perception
of -56%. The largest variances are in Cost of Lifestyle (-73%) and Earning (-65%). Lansing‟s
lowest variances were in Vitality (-39%) and Social Capital (-47%).
Figure 7: Lansing Region Value vs. Perception Diagram

Typically, Next Generation would recommend focusing any marketing efforts on highlighting the
strengths of each region. For example, Grand Rapids is currently the most appealing region
based on perception levels, and has strengths in Vitality that can be leveraged.
However, prior to launching any marketing efforts, it would be wise for the state and each
region to determine if these perception issues are in fact the reality or if they are just mis-
guided perceptions. If it‟s the reality, efforts beyond marketing will need to be done.
3. The perceived lack of “Earning” opportunities in Michigan is the primary
reason college graduates will leave the state.
As Table 1 shows, Earning is the second most valued index for Michigan students. It‟s also the
index with the largest discrepancies between value and perception.
While 89% of students value Earning, only 11% agree that Michigan has broad enough
employment opportunities. This indicates students are not confident about job opportunities in
the state and will be tempted to leave the state to pursue their careers.
Following graduation, students often take one of two approaches to deciding on a place to live.
Some students decide where they want to live, then look for a job in that place. Other students
look for the best job and move to the place where that job is. - place being a secondary
consideration.
When we asked survey respondents about which approach they favored, just over half (51%) of
students indicated they will go where they can find the best job. Nearly a third (31%) indicated
they will first choose where they want to live, then look for a job.
Therefore promoting Earning opportunities, coupled with affordability and a strong quality of
place, will be a key marketing strategy in reaching emerging professionals.
4. Educating students about life after college in Michigan will require word of
mouth, technology, and carefully crafted visits.
The majority (80%) of survey respondents are most likely to reach out to friends & family to
learn about potential areas to live. First-hand visits were a close second (79%), followed by
internet sources (71%).
Figure 8, page 14, shows the sources students are most likely to use in learning about potentials
areas to live.

Keeping College Graduates in Michigan Michigan Colleges Foundation Student Survey Findings 15
Figure 8: Sources Used for Gathering “Life After College” Information
Figure 9, provides insight into what students are most interested in learning about potential
areas to live after graduation.
Figure 9: Most Important “Life After College” Information

As Figure 8 & 9 show, in today‟s digital age, it will be important to use both traditional web
technology and social media in unique ways to showcase job opportunities, quality of life
experiences, housing information, and more.
5. Promoting specific quality of life amenities - like good-paying jobs, affordable housing,
commute times, access to parks, bike and hike trails - is key to marketing post-graduate
life in Michigan.
What is the next generation really looking for in a “cool city?” To help us dive deeper we asked
respondents to identify what they value MOST in each index when considering a place to call
home. Table 3, highlights the top assets, across all indexes, that students are looking for in a
community of choice.
Table 3: Most Desired Community Assets
Community Assets % of Agreement
Ease of commute from home to office 67%
Quality of K12 education system 53%
Variety of outdoor amenities - parks, bike & hiking trails, etc. 52%
Good paying job opportunities 50%
Affordable housing market 46%
Opportunities to advance my career not just start it 42%
Variety of social activities - restaurants, bars clubs, shopping, etc. 37%
Variety of cultural activities - theaters, galleries, concerts, etc 34%
Public safety, low crime 29%
Close to my family 24%
Good environment - quality awareness 22%
MCF should consider highlighting these amenities in all marketing efforts to students with special
emphasis on job opportunities, housing options, and recreational activities.

Keeping College Graduates in Michigan Michigan Colleges Foundation Student Survey Findings 17
CONCLUSION | Where do we go from here?
On the first page of this report, we shared the quantitative importance of growing Michigan‟s
economy by retaining and engaging a college educated workforce.
In this study, we learned what Michigan college students are looking for, when choosing where
to relocate after graduation. We learned that - in their eyes - Grand Rapids is the most
attractive region in Michigan. We also learned that college students‟ perceptions of Michigan -
on the whole - are not strong.
As the Michigan Colleges Foundation sets out to address these findings, we strongly encourage
you to:
Measure how well Michigan really scores in the seven indexes. It‟s possible that
students‟ perceptions of Detroit, Lansing, and Grand Rapids are worse than the
reality. By addressing these gaps, you develop strong talking points, to share what life
in Michigan is really like.
Parents, peers, college professors, and college faculty influence students‟ post-
graduate decisions. Whenever possible, make sure that these influentials have the
right information about Michigan‟s possibilities, so that they don‟t inadvertently steer
students out of Michigan
Focus on the “Convincibles.” Half (50%) of all survey respondents indicated they are
considering staying in the state following graduation. Another 31% are unsure. Taken
together, 80% of survey respondents could be convinced to stay. We call this group
your “Convincibles,” and they should be the focus of ongoing marketing
initiatives. The Convincibles see potential in Michigan and may have connections
here - friends & family. As they think about life after college, the Partnership for
Michigan has the opportunity to develop a more positive perception of Michigan and
create stronger connections for them - making them nostalgic for Michigan before
they ever have a chance to leave.
There‟s a saying in business, “It‟s easier to keep your current customers than it is to attract new
ones.” The same is true in workforce and economic development; it is more cost-effective to
retain the young talent already living, studying, and working in Michigan than to convince new
migrants to relocate to Michigan.
A smart investment in Michigan‟s future is to invest in encouraging the Convincibles to stay.