keep palm coast march 27, 2012 city council workshop
TRANSCRIPT
KEEP PALM COAST M O V I N GMarch 27, 2012 City Council Workshop
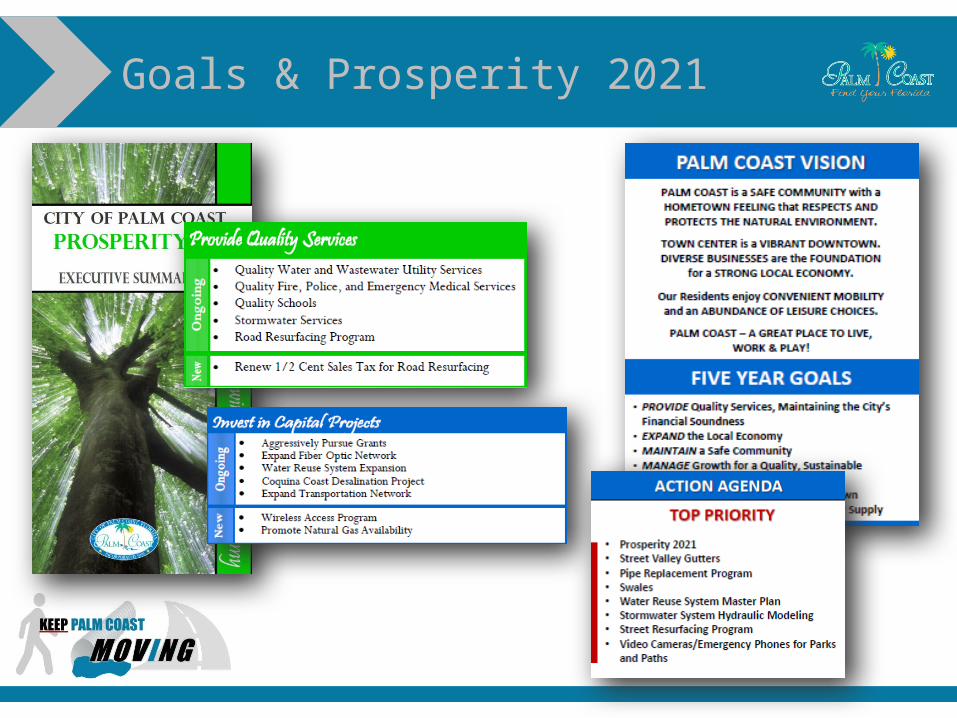
Goals & Prosperity 2021
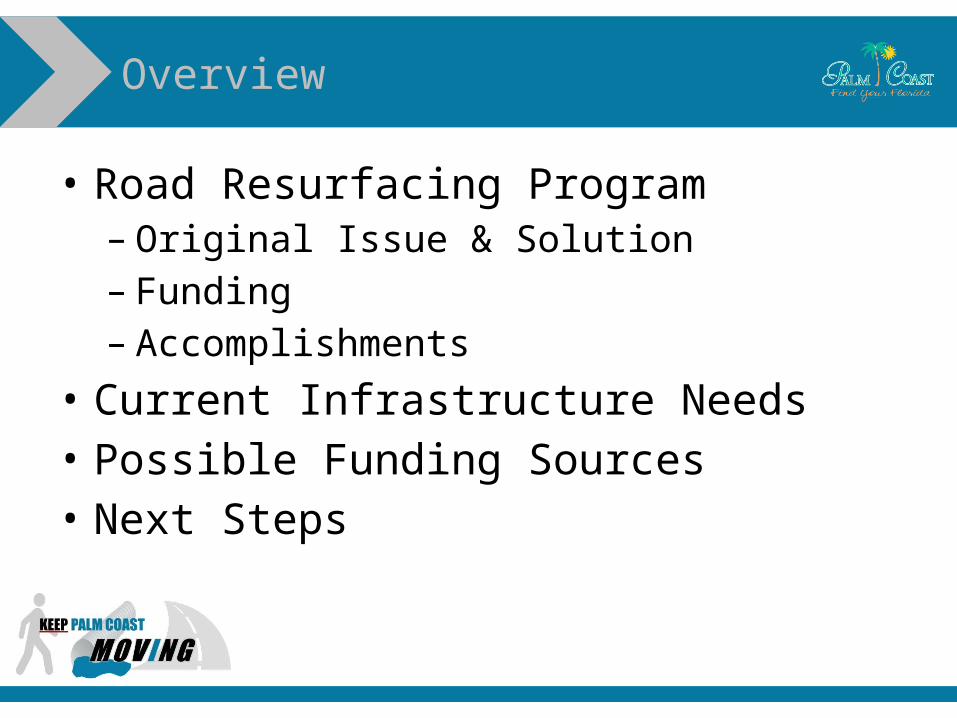
• Road Resurfacing Program– Original Issue & Solution– Funding– Accomplishments
• Current Infrastructure Needs• Possible Funding Sources• Next Steps
Overview
Road Resurfacing Program
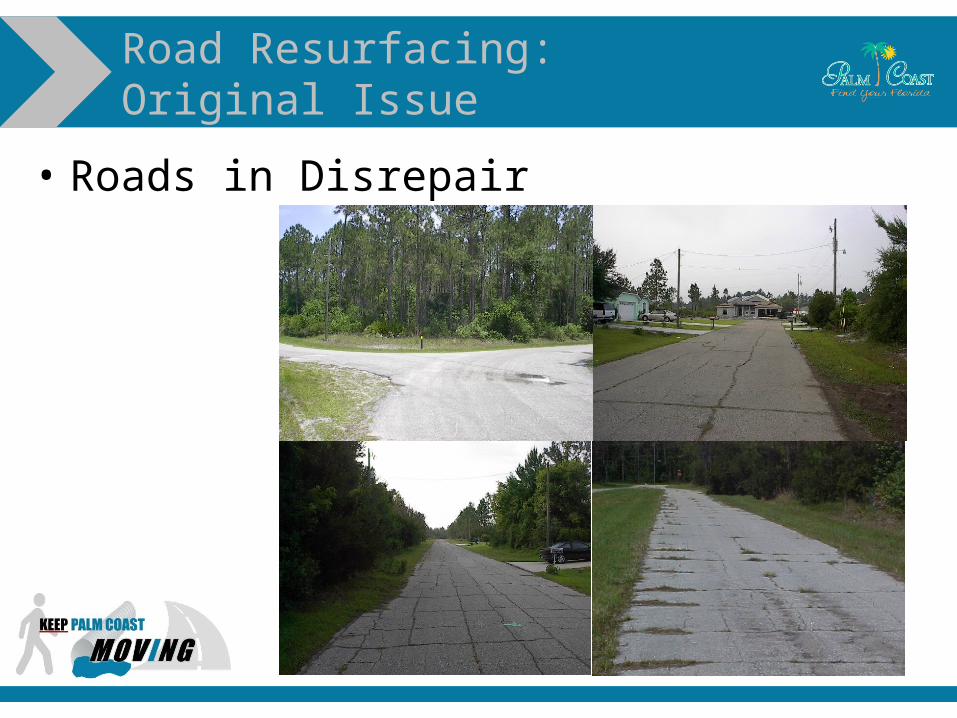
• Roads in Disrepair
Road Resurfacing: Original Issue
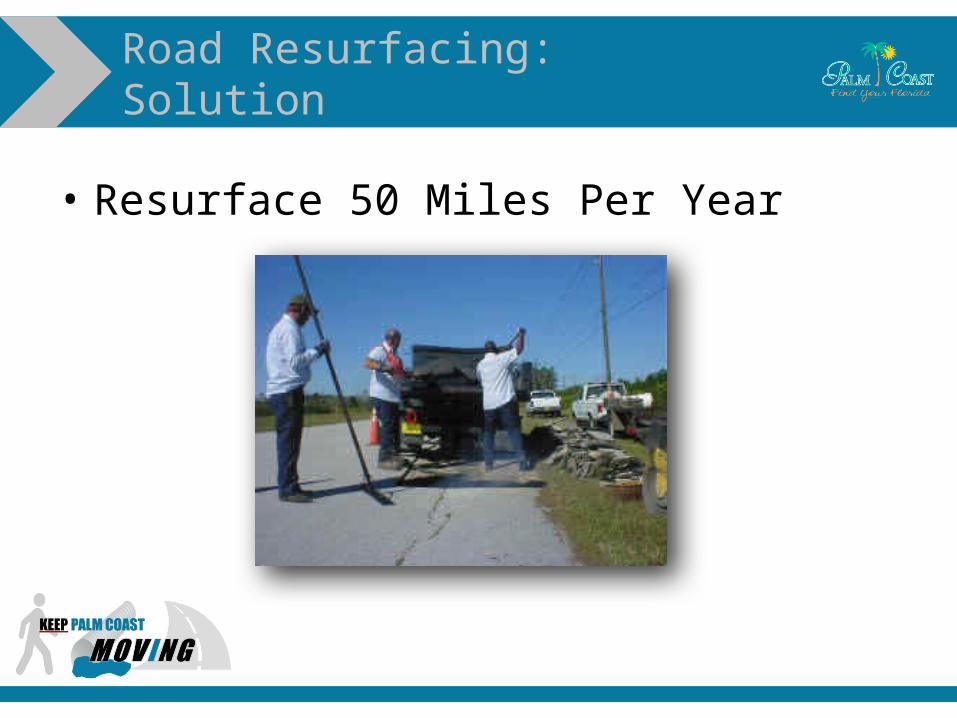
• Resurface 50 Miles Per Year
Road Resurfacing: Solution
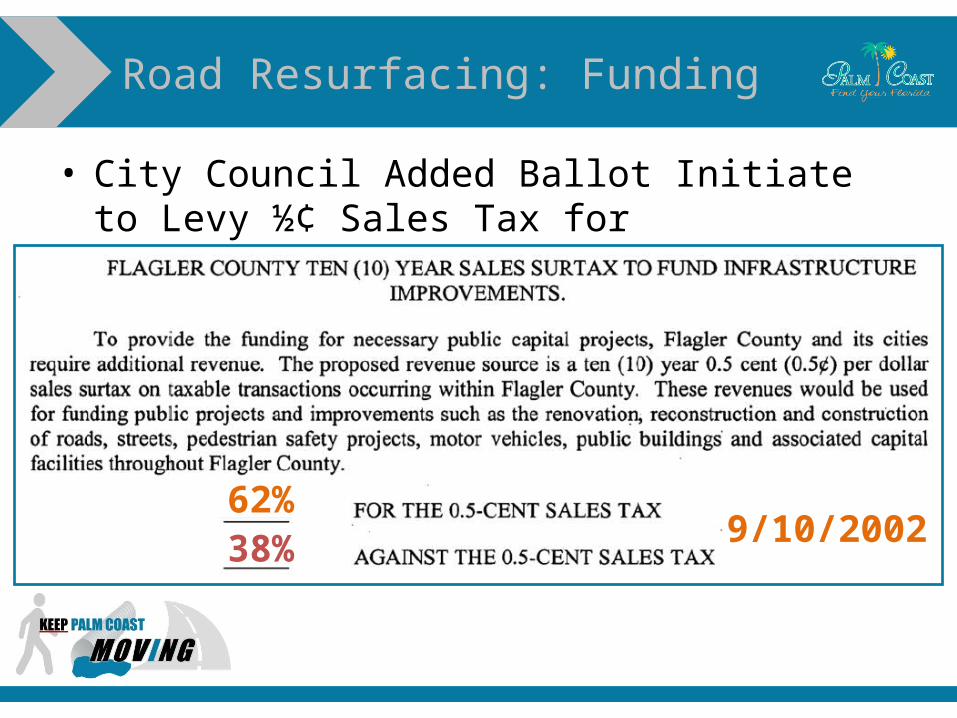
• City Council Added Ballot Initiate to Levy ½¢ Sales Tax for Infrastructure (6/4/2002)
Road Resurfacing: Funding
62%38% 9/10/2002
• Interlocal Agreement between County & Cities (11/18/2002)
• Distribution of ½¢ Sales Tax Levy–½ State Default Formula–½ Local Population Based Formula
Road Resurfacing: Funding
Road Resurfacing: Funding
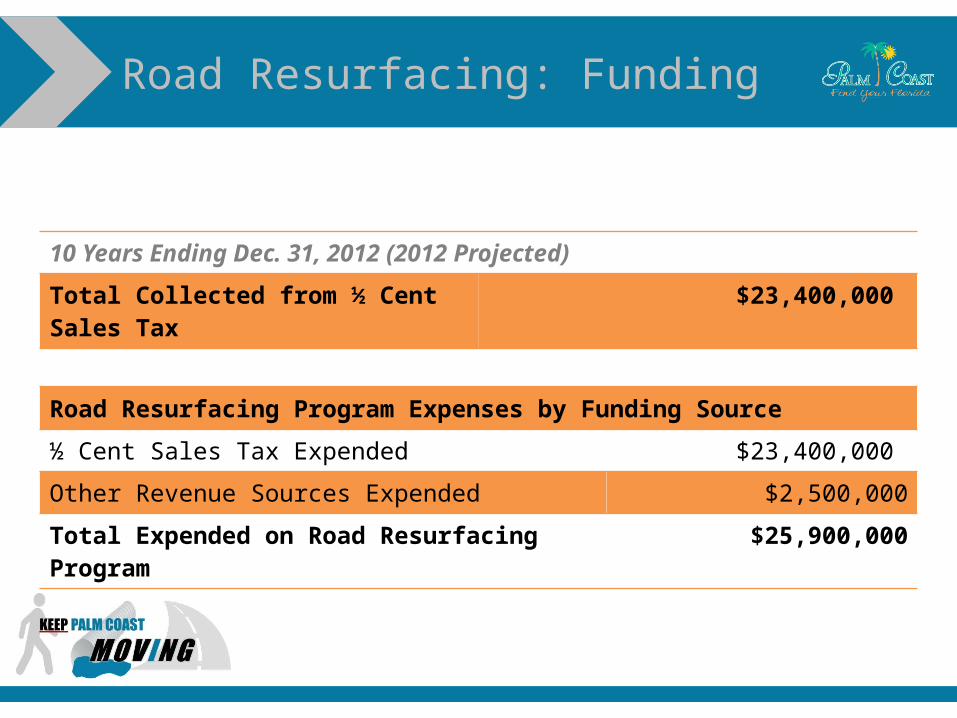
10 Years Ending Dec. 31, 2012 (2012 Projected)
Total Collected from ½ Cent Sales Tax $23,400,000
Road Resurfacing Program Expenses by Funding Source
½ Cent Sales Tax Expended $23,400,000
Other Revenue Sources Expended $2,500,000
Total Expended on Road Resurfacing Program $25,900,000
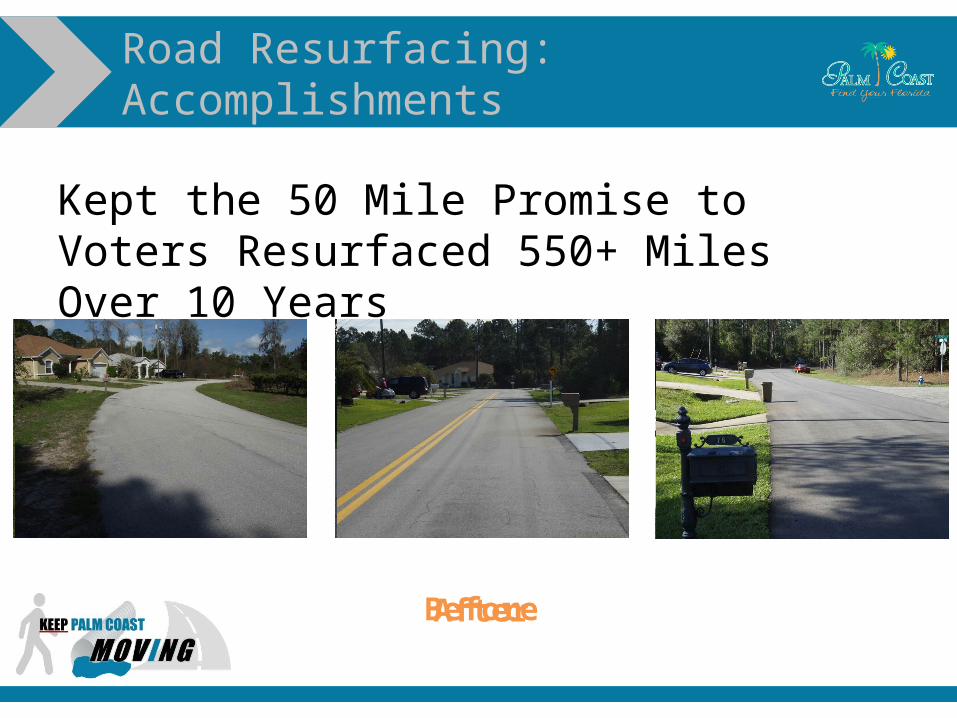
Kept the 50 Mile Promise to Voters Resurfaced 550+ Miles Over 10 Years
Road Resurfacing: Accomplishments
BeforeAfter

Current Infrastructure Needs
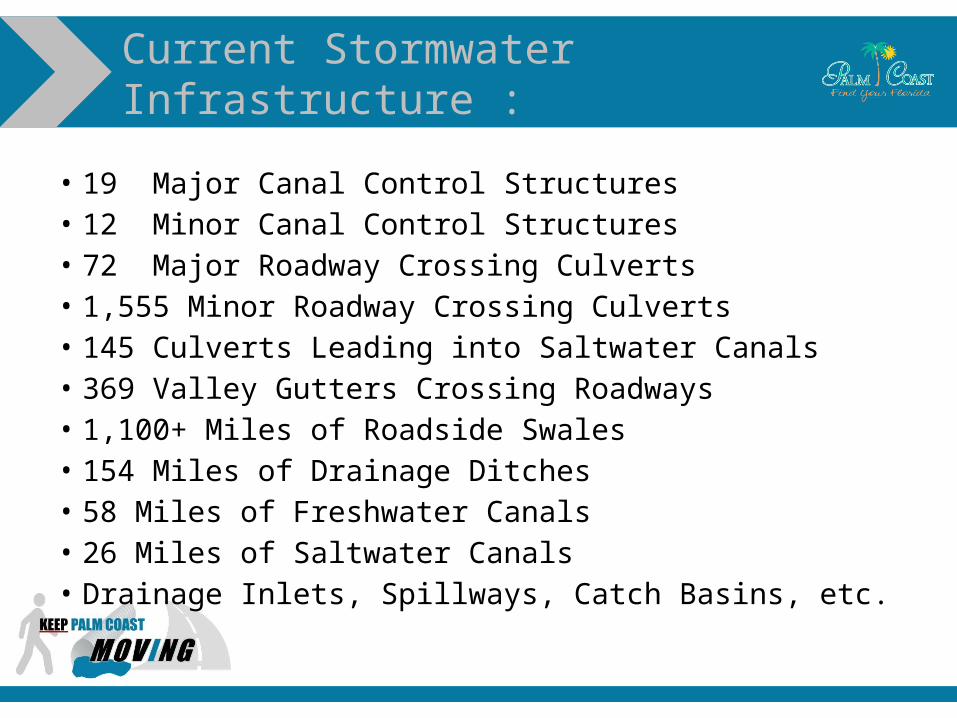
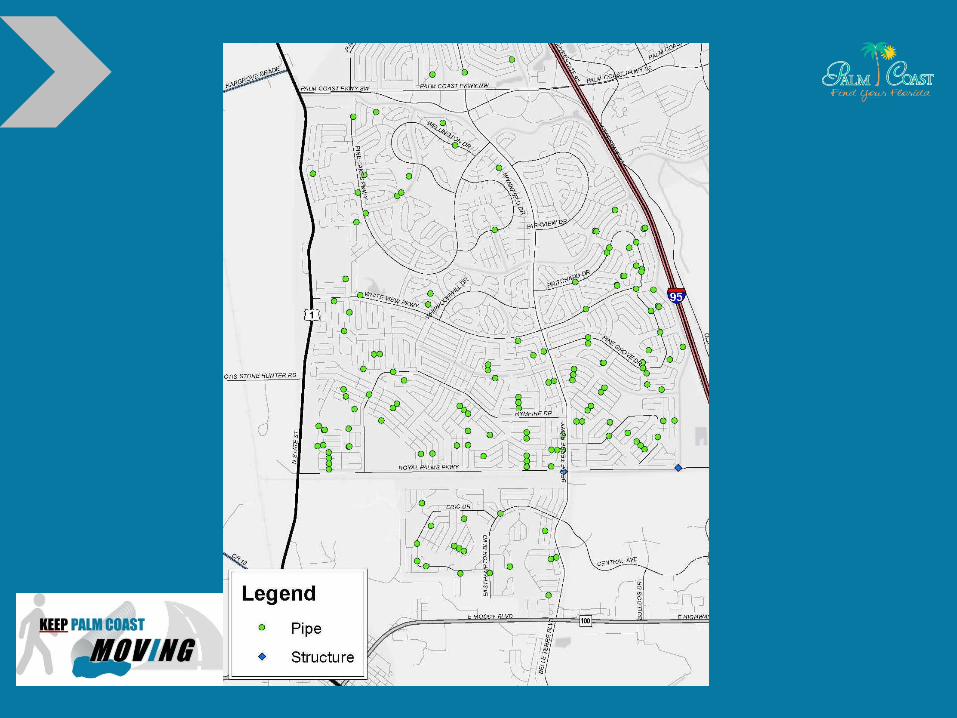
• 19 Major Canal Control Structures• 12 Minor Canal Control Structures• 72 Major Roadway Crossing Culverts• 1,555 Minor Roadway Crossing Culverts• 145 Culverts Leading into Saltwater Canals• 369 Valley Gutters Crossing Roadways• 1,100+ Miles of Roadside Swales• 154 Miles of Drainage Ditches• 58 Miles of Freshwater Canals• 26 Miles of Saltwater Canals• Drainage Inlets, Spillways, Catch Basins, etc.
Current Stormwater Infrastructure :
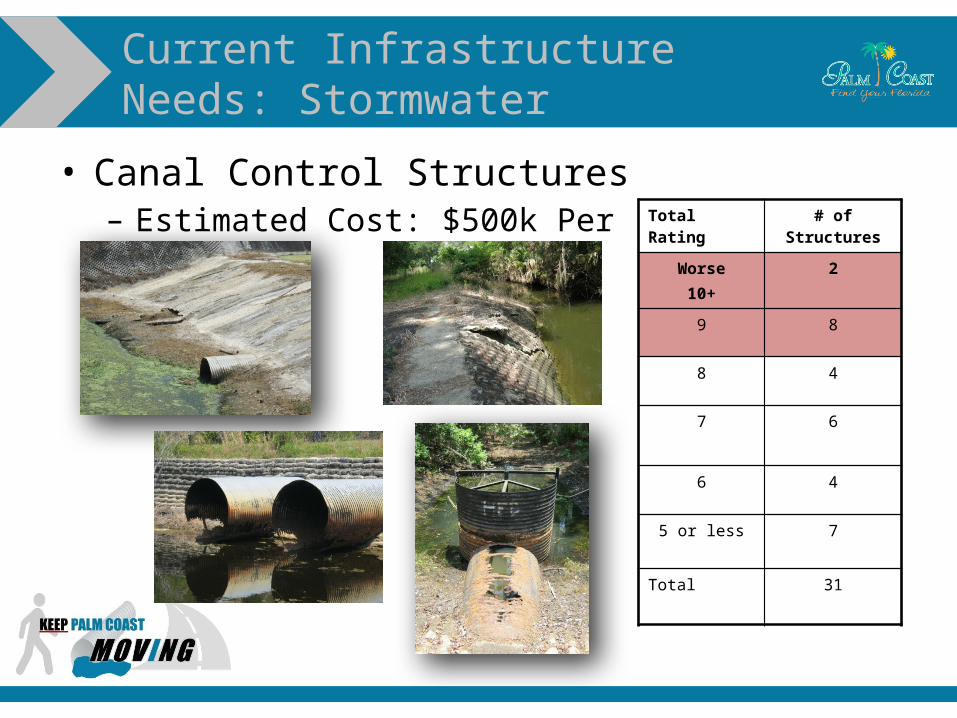
• Canal Control Structures– Estimated Cost: $500k Per
Current Infrastructure Needs: Stormwater
Total Rating
# of Structures
Worse10+
2
9 8
8 4
7 6
6 4
5 or less 7
Total 31
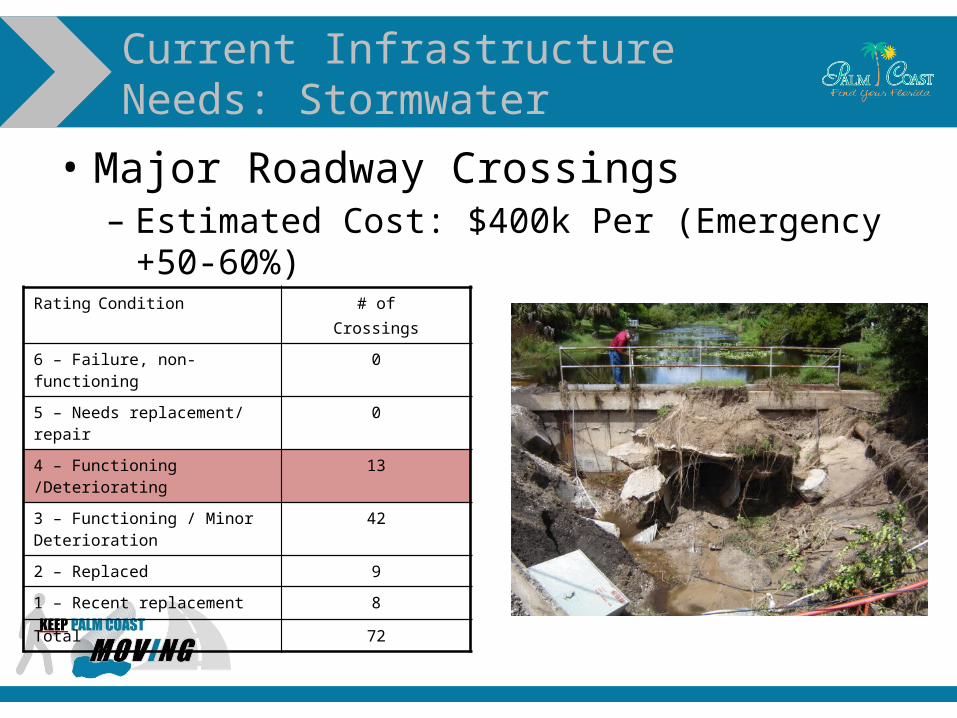
• Major Roadway Crossings– Estimated Cost: $400k Per (Emergency
+50-60%)
Current Infrastructure Needs: Stormwater
Rating Condition # ofCrossings
6 – Failure, non-functioning 0
5 – Needs replacement/ repair
0
4 – Functioning /Deteriorating 13
3 – Functioning / Minor Deterioration
42
2 – Replaced 9
1 – Recent replacement 8
Total 72
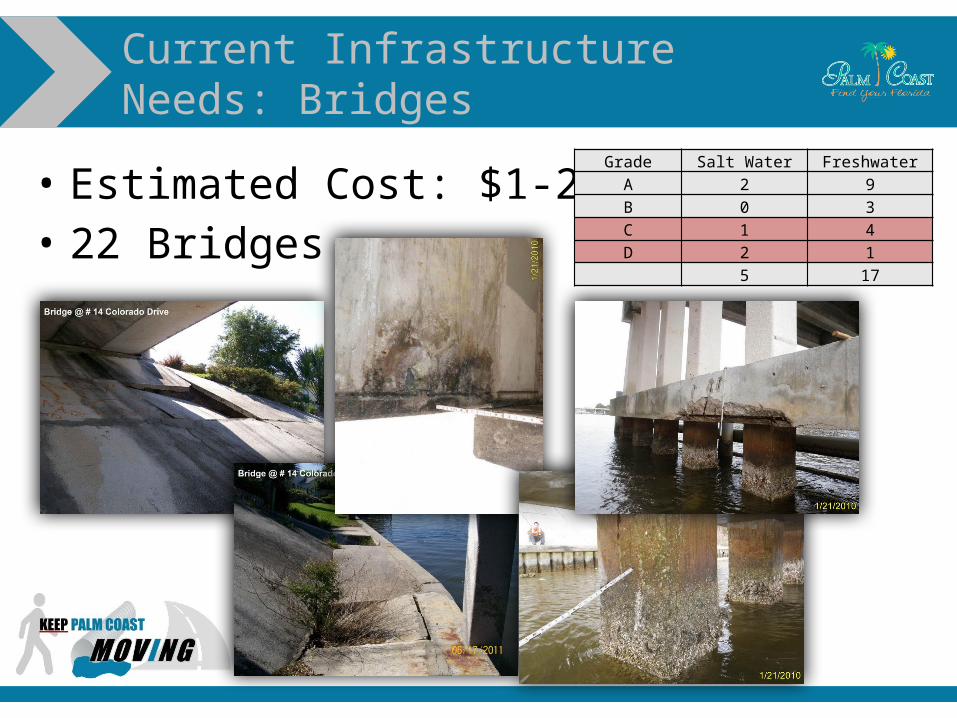
• Estimated Cost: $1-2M Per• 22 Bridges
Current Infrastructure Needs: Bridges
Grade Salt Water FreshwaterA 2 9B 0 3C 1 4D 2 1
5 17
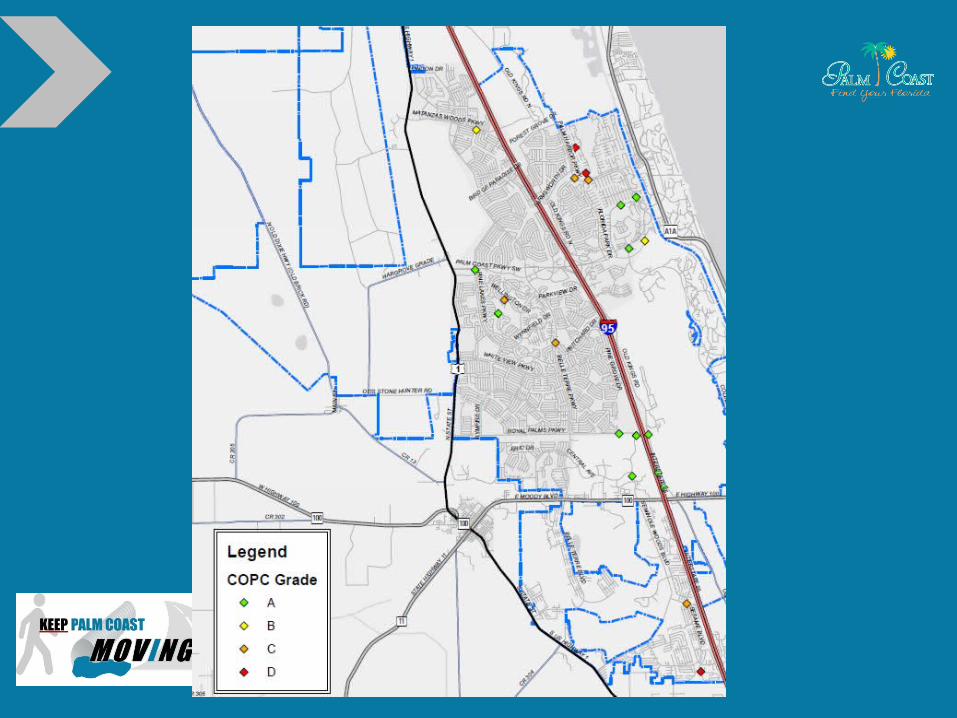
Bridge Map
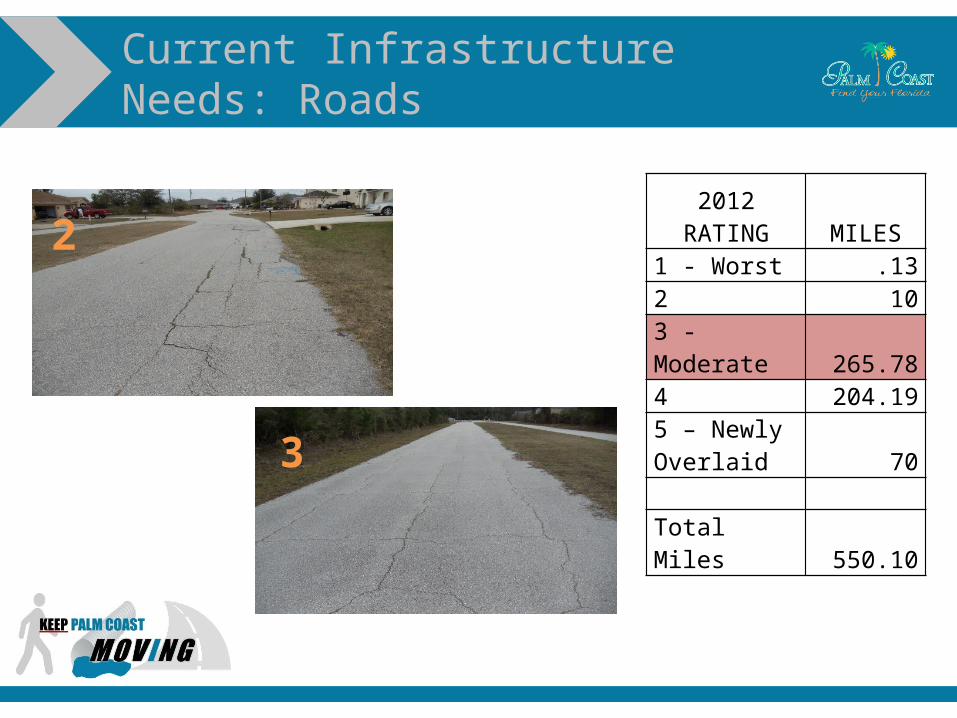
Current Infrastructure Needs: Roads
2012 RATING MILES1 - Worst .132 103 - Moderate 265.784 204.195 – Newly Overlaid 70 Total Miles 550.10
2
3
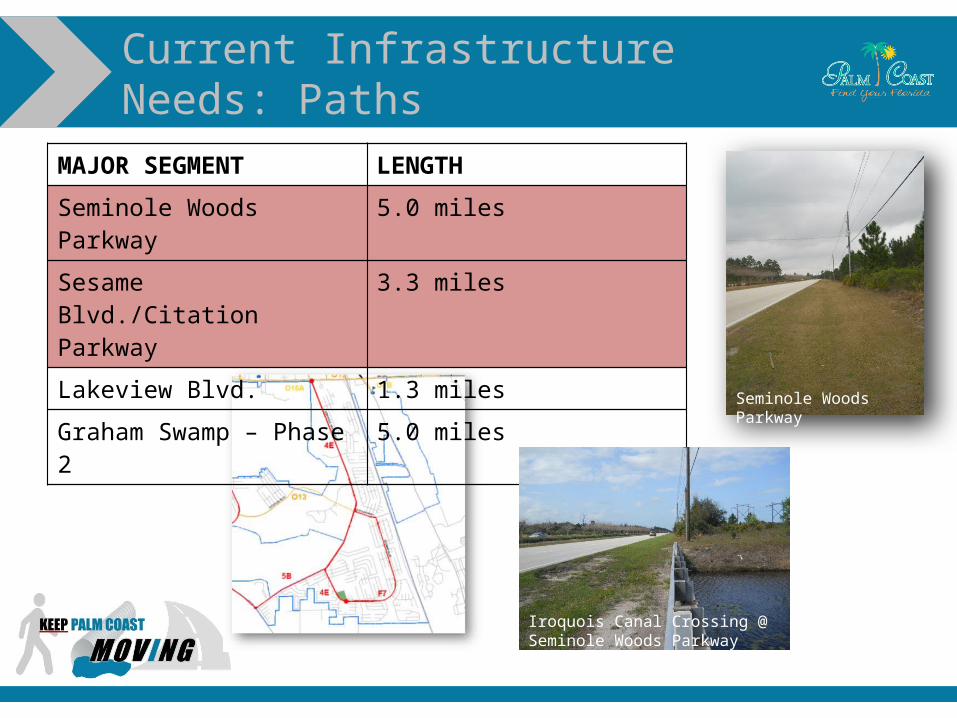
Current Infrastructure Needs: Paths
MAJOR SEGMENT LENGTH
Seminole Woods Parkway 5.0 miles
Sesame Blvd./Citation Parkway 3.3 miles
Lakeview Blvd. 1.3 miles
Graham Swamp – Phase 2 5.0 miles
Seminole Woods Parkway
Iroquois Canal Crossing @ Seminole Woods Parkway
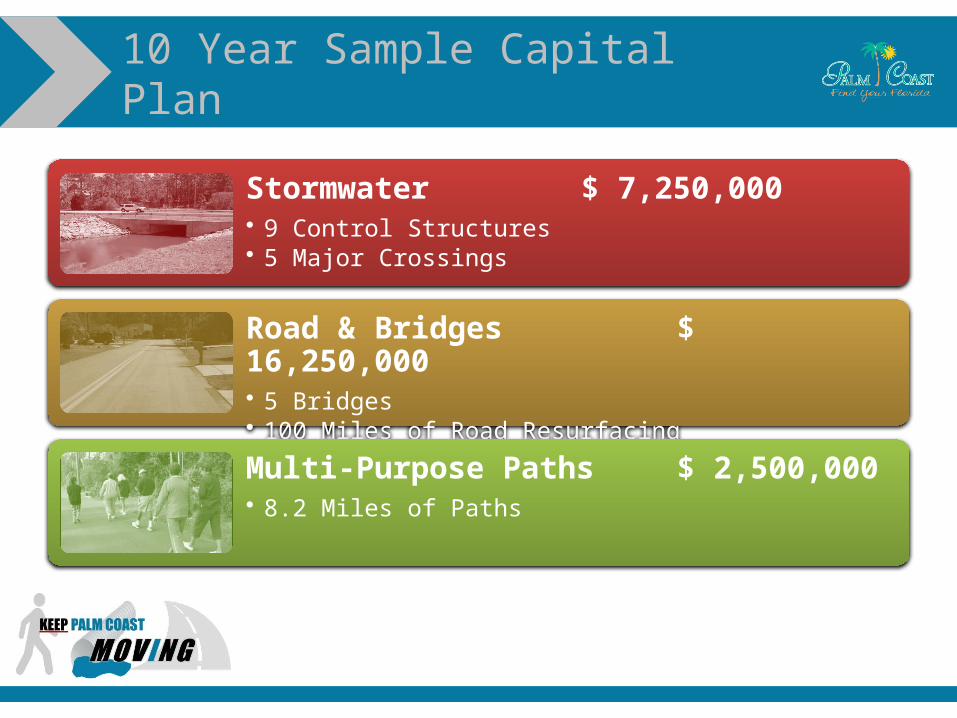
10 Year Sample Capital Plan
Stormwater $ 7,250,000• 9 Control Structures• 5 Major Crossings
Road & Bridges $ 16,250,000• 5 Bridges• 100 Miles of Road Resurfacing
Multi-Purpose Paths $ 2,500,000• 8.2 Miles of Paths
Possible Funding Sources
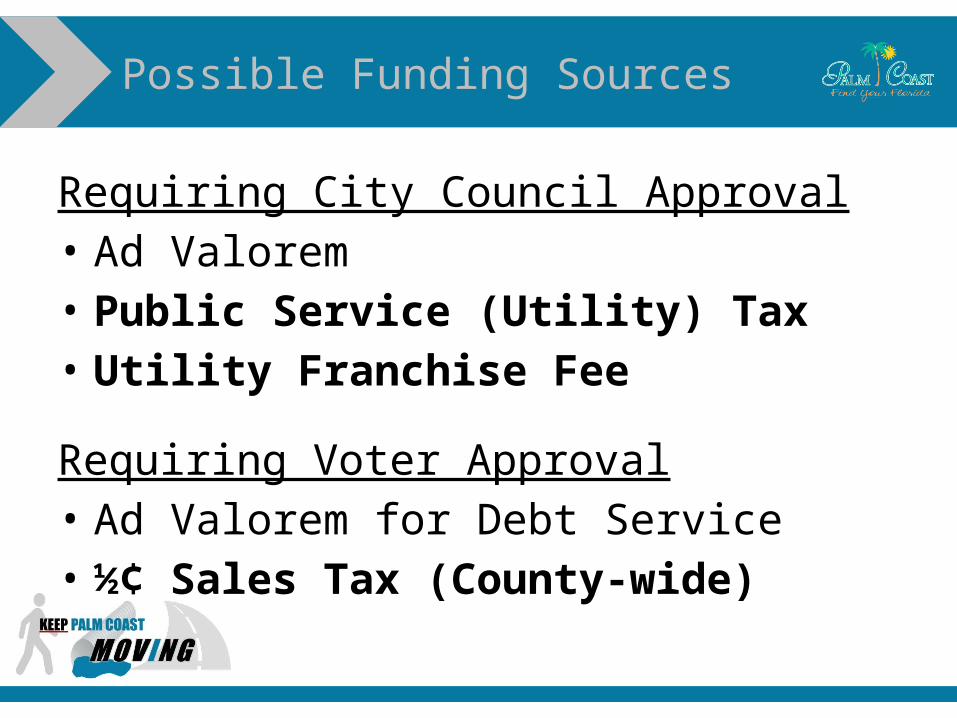
Requiring City Council Approval• Ad Valorem• Public Service (Utility) Tax • Utility Franchise Fee
Requiring Voter Approval• Ad Valorem for Debt Service• ½¢ Sales Tax (County-wide)
Possible Funding Sources
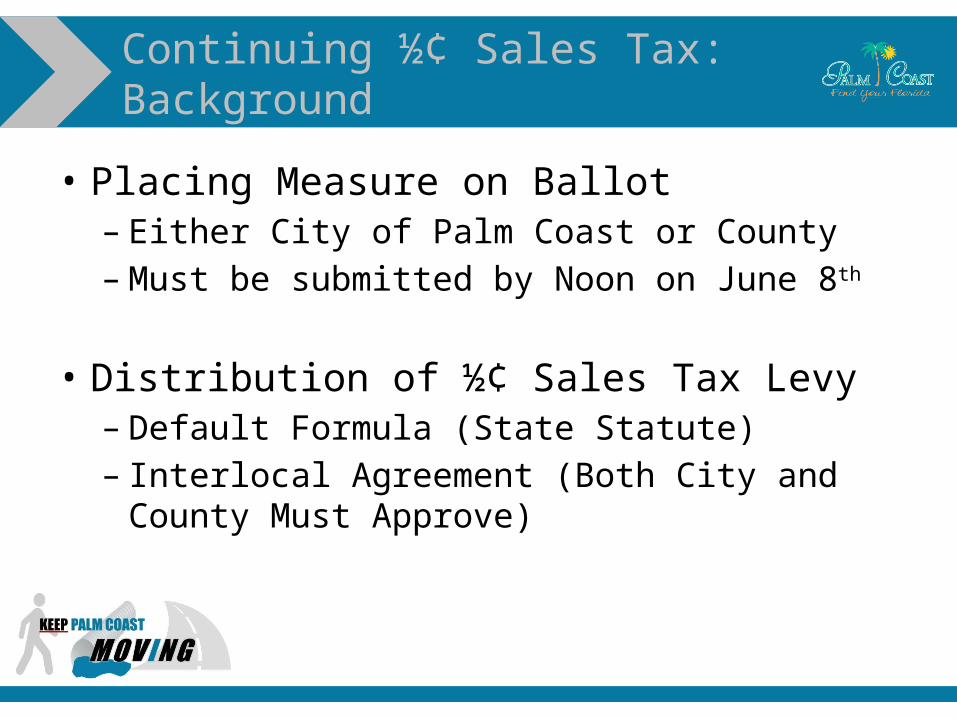
• Placing Measure on Ballot– Either City of Palm Coast or County–Must be submitted by Noon on June 8th
• Distribution of ½¢ Sales Tax Levy– Default Formula (State Statute)– Interlocal Agreement (Both City and
County Must Approve)
Continuing ½¢ Sales Tax: Background
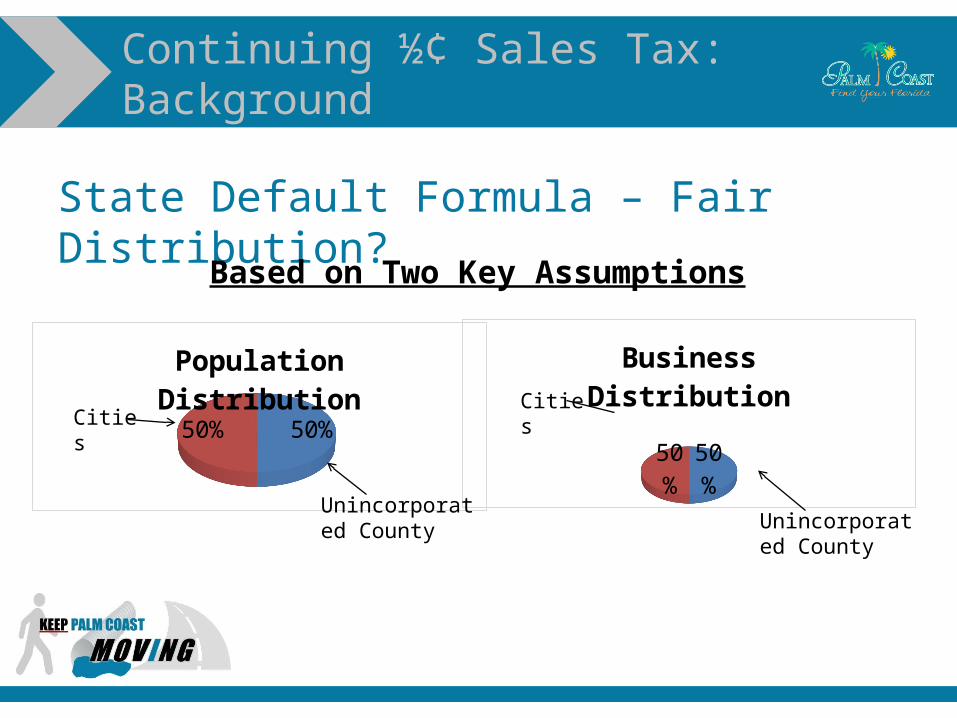
State Default Formula – Fair Distribution?
Continuing ½¢ Sales Tax: Background
50%50%
Population Distribution
50%50%
Business Distribution
Based on Two Key Assumptions
Cities
Unincorporated County Unincorporated
County
Cities
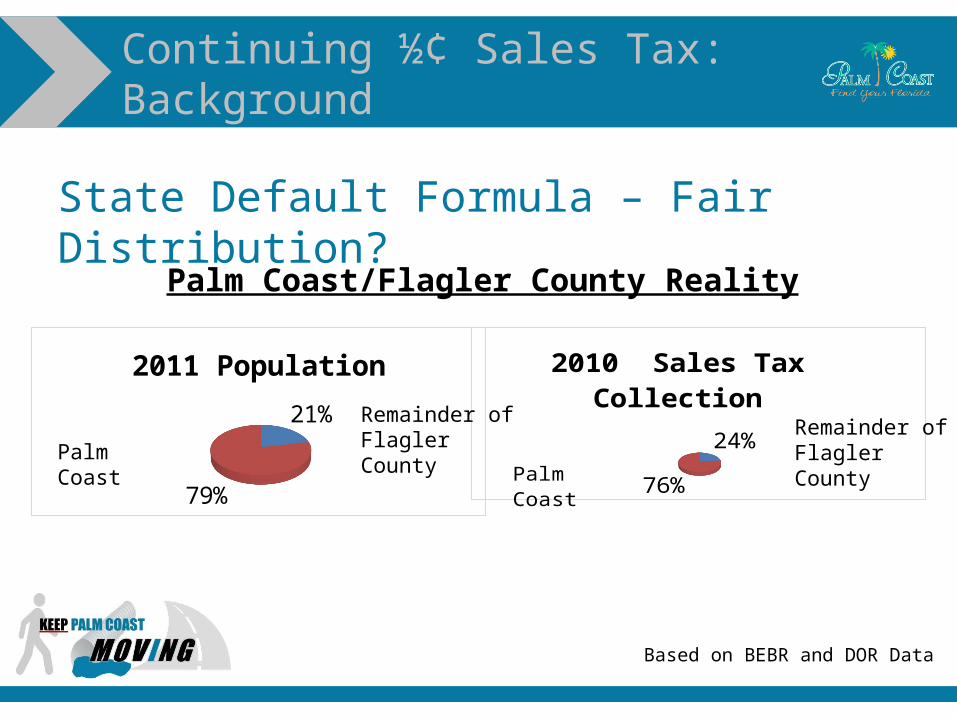
State Default Formula – Fair Distribution?
Continuing ½¢ Sales Tax: Background
21%
79%
2011 Population
24%
76%
2010 Sales Tax Collection
Palm Coast
Palm Coast/Flagler County Reality
Based on BEBR and DOR Data
Palm Coast
Remainder of Flagler County Remainder of
Flagler County
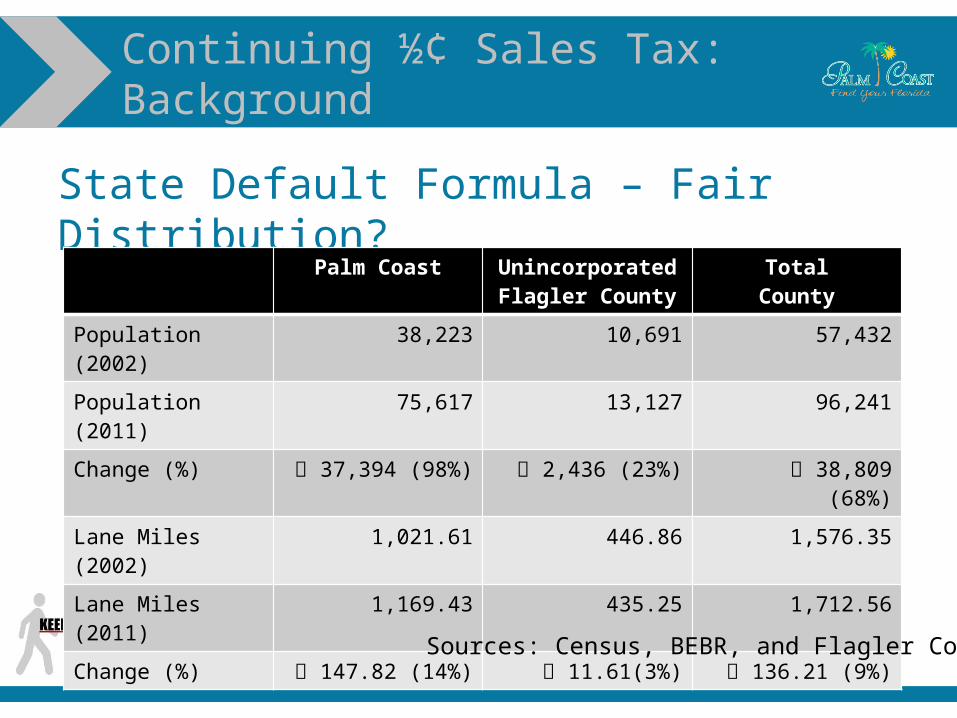
State Default Formula – Fair Distribution?
Continuing ½¢ Sales Tax: Background
Palm Coast Unincorporated Flagler County
TotalCounty
Population (2002) 38,223 10,691 57,432Population (2011) 75,617 13,127 96,241Change (%) 37,394 (98%) 2,436 (23%) 38,809 (68%)Lane Miles (2002) 1,021.61 446.86 1,576.35Lane Miles (2011) 1,169.43 435.25 1,712.56Change (%) 147.82 (14%) 11.61(3%) 136.21 (9%)
Sources: Census, BEBR, and Flagler County
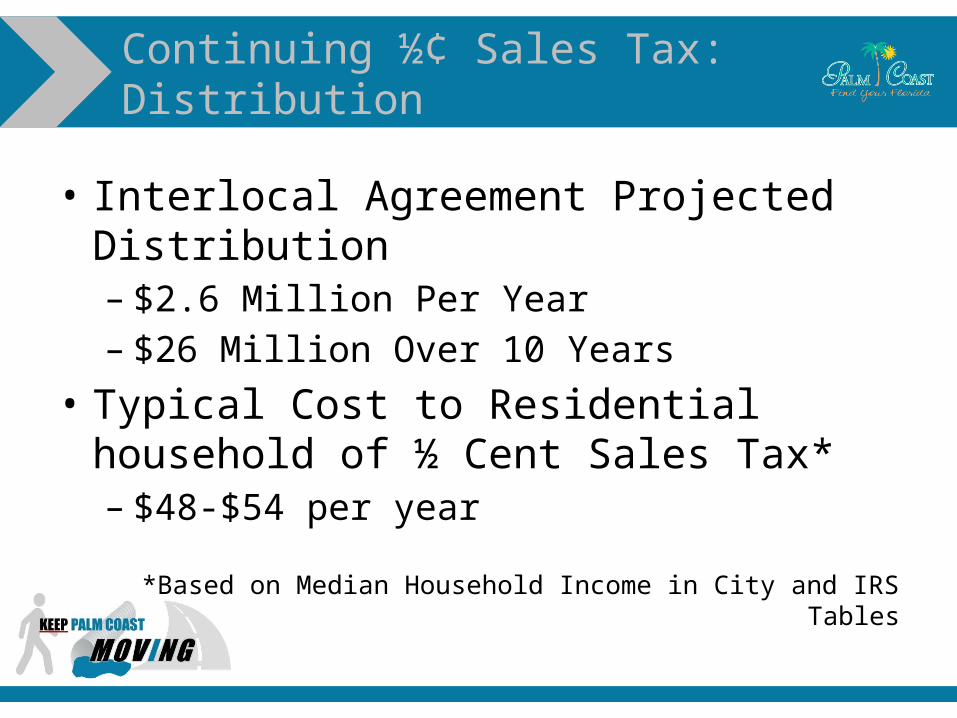
• Interlocal Agreement Projected Distribution– $2.6 Million Per Year– $26 Million Over 10 Years
• Typical Cost to Residential household of ½ Cent Sales Tax*– $48-$54 per year
*Based on Median Household Income in City and IRS Tables
Continuing ½¢ Sales Tax: Distribution
Revenue Diversification
• Public Service (Utility) Tax– General Revenue, Unrestricted– Tax on Usage Portion of Utilities
(Electricity, Natural Gas, Fuel Oil, Bottled Gas, and/or Water Service)
– Up to 10% Tax– Approved by City Council Ordinance
Public Service (Utility) Tax
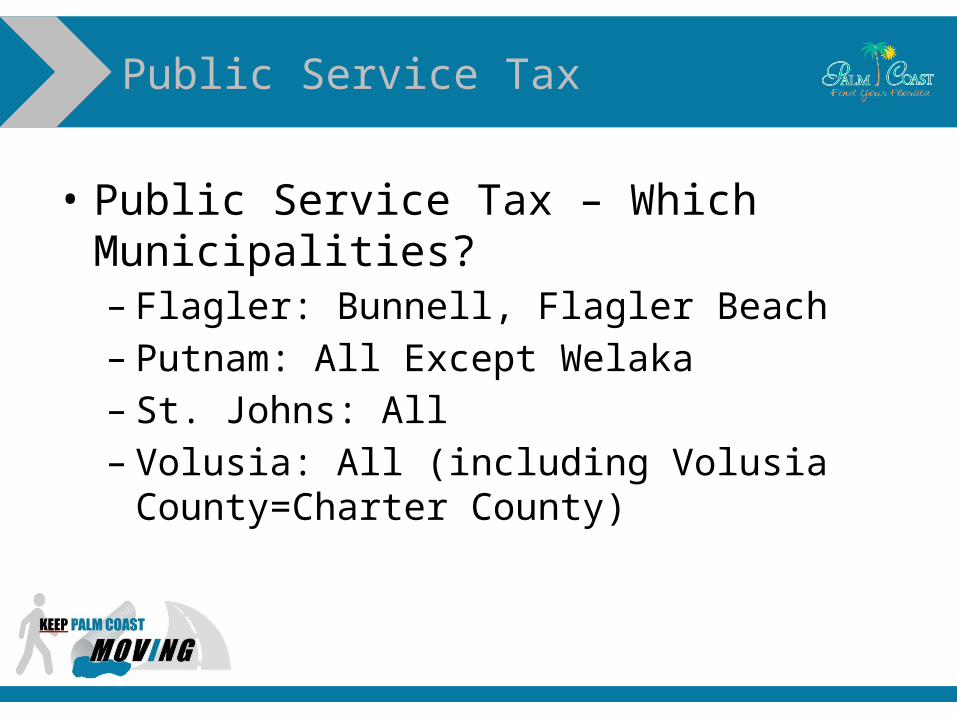
• Public Service Tax – Which Municipalities?– Flagler: Bunnell, Flagler Beach– Putnam: All Except Welaka– St. Johns: All– Volusia: All (including Volusia
County=Charter County)
Public Service Tax
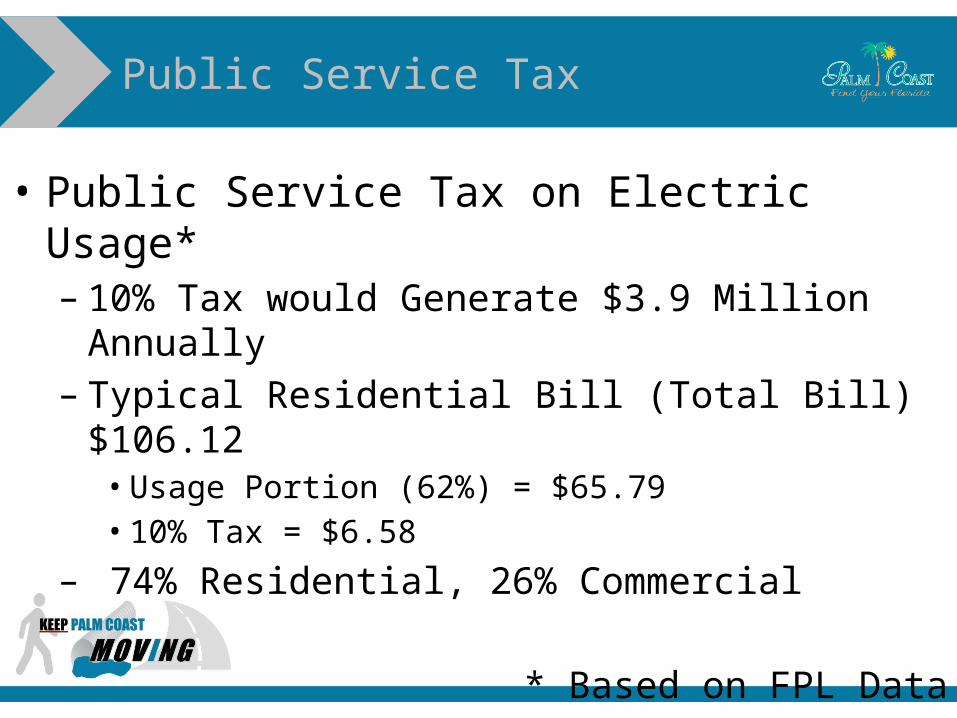
• Public Service Tax on Electric Usage*– 10% Tax would Generate $3.9 Million
Annually– Typical Residential Bill (Total Bill) $106.12• Usage Portion (62%) = $65.79• 10% Tax = $6.58
– 74% Residential, 26% Commercial
* Based on FPL Data
Public Service Tax
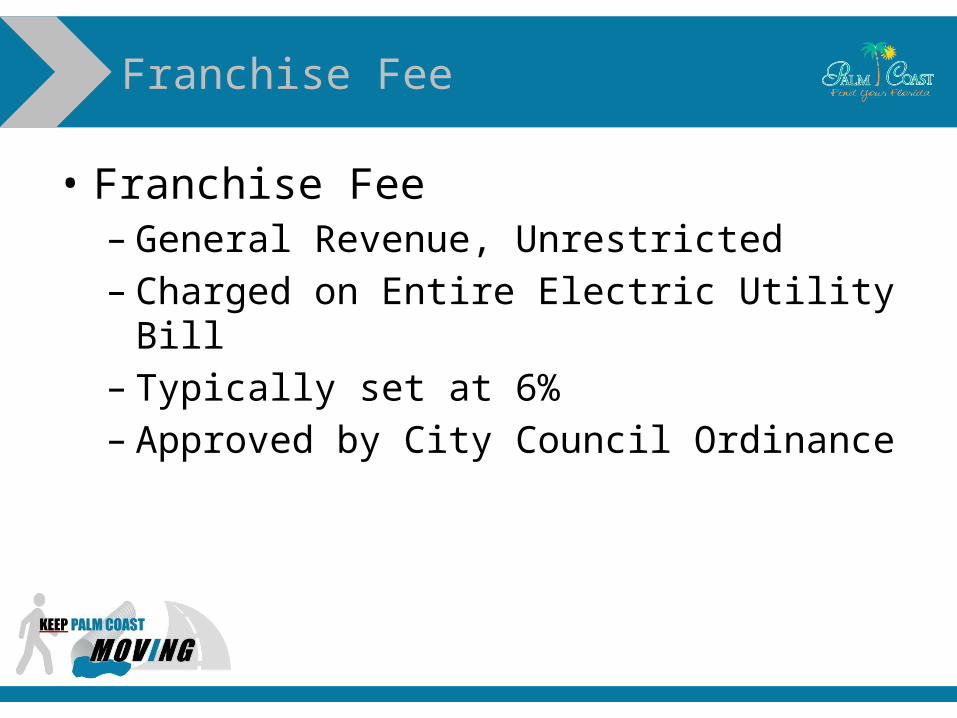
• Franchise Fee– General Revenue, Unrestricted– Charged on Entire Electric Utility Bill– Typically set at 6% – Approved by City Council Ordinance
Franchise Fee
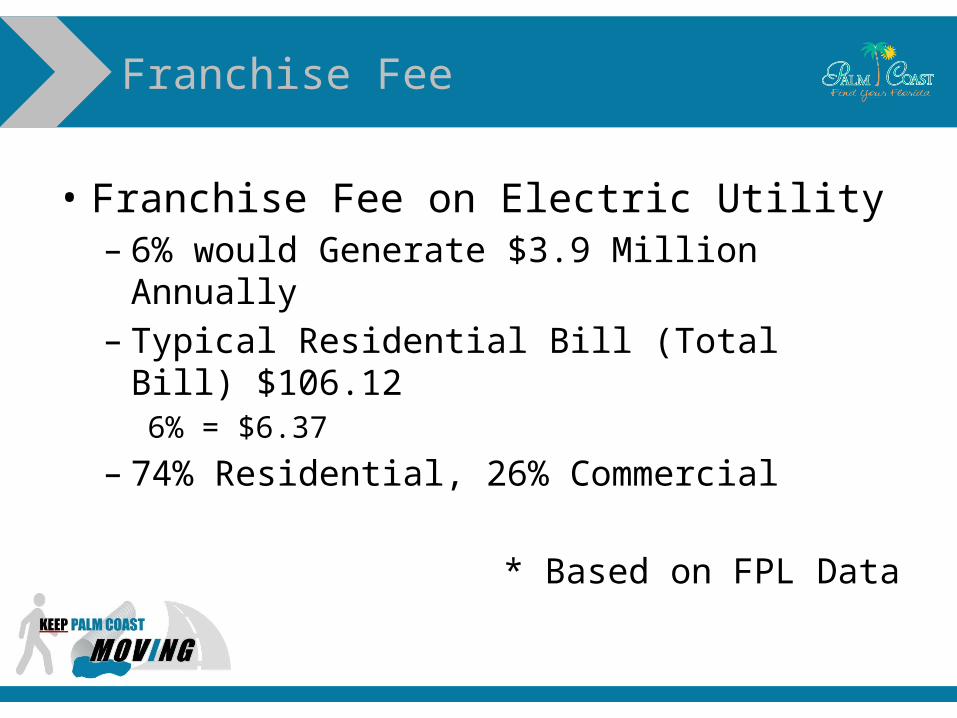
• Franchise Fee on Electric Utility– 6% would Generate $3.9 Million
Annually– Typical Residential Bill (Total Bill)
$106.126% = $6.37
– 74% Residential, 26% Commercial
* Based on FPL Data
Franchise Fee
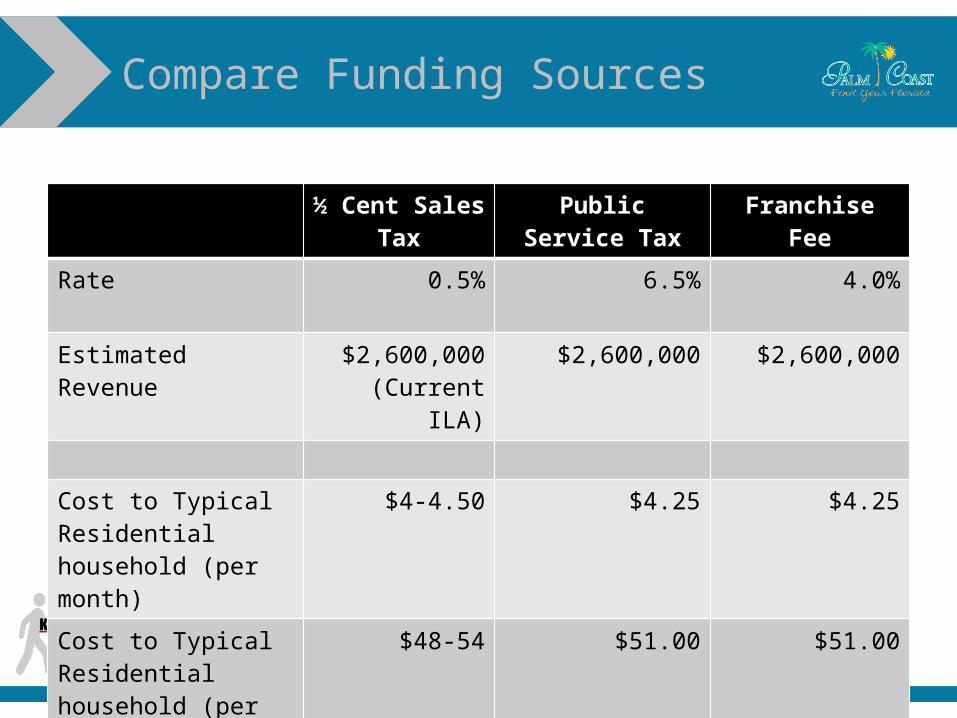
Compare Funding Sources
½ Cent Sales Tax Public Service Tax Franchise Fee
Rate 0.5% 6.5% 4.0%
Estimated Revenue $2,600,000(Current ILA)
$2,600,000 $2,600,000
Cost to Typical Residential household (per month)
$4-4.50 $4.25 $4.25
Cost to Typical Residential household (per year)
$48-54 $51.00 $51.00
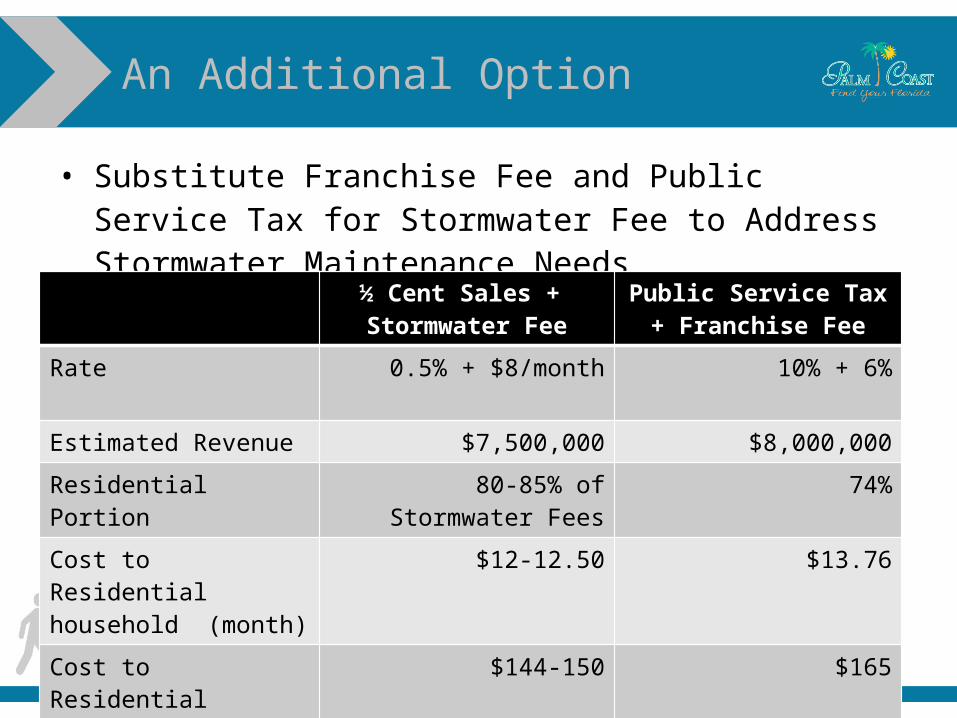
• Substitute Franchise Fee and Public Service Tax for Stormwater Fee to Address Stormwater Maintenance Needs
An Additional Option
½ Cent Sales + Stormwater Fee
Public Service Tax + Franchise Fee
Rate 0.5% + $8/month 10% + 6%
Estimated Revenue $7,500,000 $8,000,000
Residential Portion 80-85% of Stormwater Fees 74%
Cost to Residential household (month)
$12-12.50 $13.76
Cost to Residential household (year)
$144-150 $165
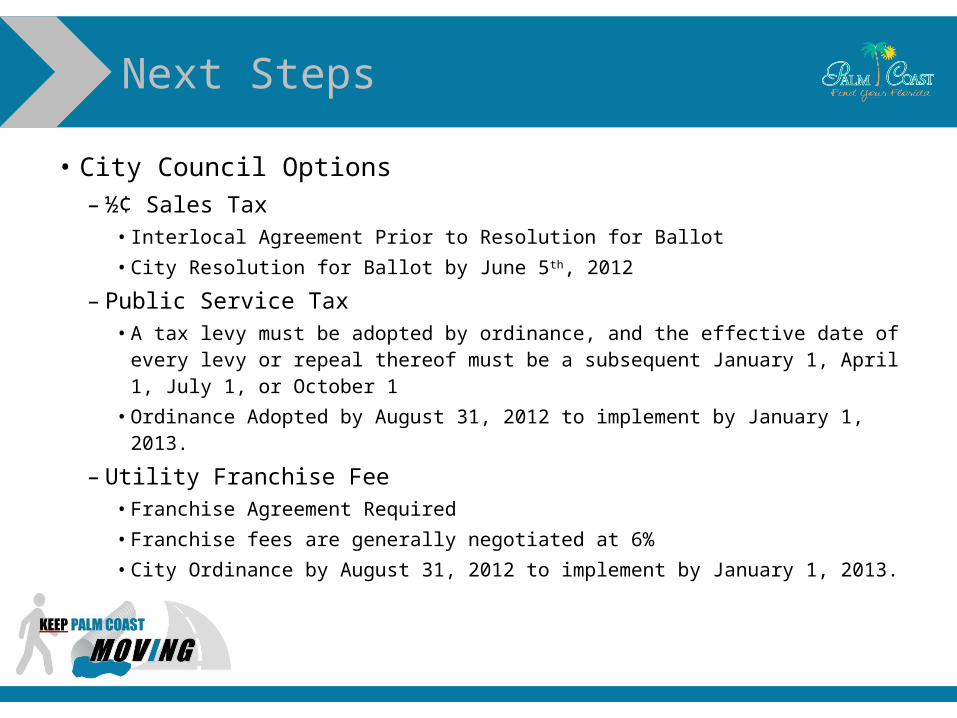
• City Council Options– ½¢ Sales Tax
• Interlocal Agreement Prior to Resolution for Ballot• City Resolution for Ballot by June 5th, 2012
– Public Service Tax• A tax levy must be adopted by ordinance, and the effective date
of every levy or repeal thereof must be a subsequent January 1, April 1, July 1, or October 1
• Ordinance Adopted by August 31, 2012 to implement by January 1, 2013.
– Utility Franchise Fee• Franchise Agreement Required • Franchise fees are generally negotiated at 6% • City Ordinance by August 31, 2012 to implement by January 1,
2013.
Next Steps