ke trade pro html5 trading platform user manual trade pro html5 . trading platform user manual . 2...
TRANSCRIPT

1
KE Trade PRO HTML5
Trading Platform User Manual

2
1. Overview
What’s New in KE Trade PRO HTML5?
We have always been working on new features and enhancing existing functions. Here’s where you can learn the new features.
Drag-and-Drop of Counter
HTML5 version allows the client to visually drag a counter from one widget to another widget so that the designated widget can show the information of that counter.
Auto-Snap Widgets to Grid
The system helps user to optimize his page by laying out widgets without gaps. It does this by snapping the widgets to a grid.
Dynamic Change of Columns
User can organize or resize columns dynamically within the widget by dragging and resizing the columns. The columns to display within a widget can also be set up intuitively.
The columns to display within a widget can also be set up intuitively by:
1) Click on Menu.
2) Click Select Columns.
3) Select your desired column(s) from Available list.
4) Click > button to move the selected column(s) to the Selected list.
5) Click Save.
Alternatively, you can click >> to move all columns from Available list to Selected list.

3
Publish Information to Widgets
By double-clicking on a counter, the linked widgets will be populated with the selected counter information.
Link/Unlink Widget
All available widgets are linked, by default, so that when the client double-clicks on a counter, its information is populated to all relevant widgets. User has the flexibility to unlink a widget so that this is not automatically done.
New Visual Aids
New visual aids like pie chart, bar chart, heat map are available to better visualize the performance of the market or client's portfolio.
Integrated Charts
Chart is now presented in widget form, which means that user can present multiple charts within one page, with the support for drag-and-drop, etc.
New Alert Layout
New sound and flashing text appears when a new alert arrives. A new icon shows the number of unread alert messages.
New Scroll-up Indices
To maximize our trading space, indices changes by scrolling the information in an upward direction.
Market Data Color Codes
Our market data are displayed in different color codes as an visual aid to view the market movements. Refer below for the color code definitions:
Predictive Suggestion
As you type in text fields, we enable users to quickly find and select from a pre-populated list of values as you type and hence, leveraging searching and filtering.

4
Widgets Customization
You will be able to create and name your own page, and add useful widgets to suit your trading needs. You can select different widgets to be added into a page.
Themes Selection
You can choose your preferred color themes from our Gallery.

5
Font Customization
You can choose your preferred fonts from the available list of font family.

6
Table Layout
The application provides user the convenience to save their preferred table layout as template, reset the changed table layout to saved template, or reset the table layout to system default template.
To save as Template
1) Click on Select Columns to add/remove columns.
2) A pop-up screen will be shown for you to:
Available: Choose from the available columns to display.
Click > button to move the selected column(s) to the Selected list.
Selected: Once you selected the column, the column will be listed in Selected list.
3) Click Save.
4) Click Menu.
5) Mouse-over Table Layout.
6) Click Save as Template.
You can also do a reset of template after re-arranging the columns.
1) Organize or resize columns dynamically within the widget by dragging and resizing the columns.
2) Click Menu.
3) Click Table Layout and select Reset to Template or Reset to Default.
To Maximize/Minimize Widget
The application allows users to maximize a widget by:

7
1) Double click on widget's header.
Or
1) Click on widget's menu.
2) Select Maximize.
The application allows user to minimize a widget by:
1) Double click on widget's header.
Or
1) Click on widget's menu.
2) Select Reduce Size.

8
2. Widget
Quotes/Watchlist
The widget displays the stocks of top 40 ranking by different markets and users would also be able to view enriched market data.
Following enriched market data are available from KE Trade PRO:
1) New ranking information:
• Top $Value • Top Gap Up %, Gap Down % • Top Gap Up, Gap Down • Top Volume, Gainer%, Gainer, Loser%, Loser less warrants
2) New predefined filters
• Recent IPO listings • Pending IPO listings • By Ex/Cum Bonus, Dividend, Right, Interest • Halt / Suspend • Touched 52 Weeks Hi/Lo • RSI > 70, RSI < 30
3) Additional market information for each counter
• Freq (number of trades) • Value (total trade value) • L/Qty (last traded quantity) • B% (Buy % of trades) • 52 Week, Month, Week Hi/Lo • Last Trade Time • Trade Summary by Volume Band
The system allows user to do local sorting of counters by any column within the watchlist and do own arrangement of counters within the watchlist.
Exchanges/Markets Selection
You can select any exchanges from the available list of exchanges set up. The Top X / Quotes widget will change to the selected exchanges accordingly.
To change to Hongkong Exchange, you can:
1) Click Market select box.
2) Click HKG.

9
Screener Selection
You can select the different screeners of the stocks from the selection box below. The widget would display the stocks based on the screener selected. Please refer to the individual explanation of the screeners available.
To change to other screener, you can:
1) Click Screener select box.
2) Click on Top Gainer, for example.

10
Quotes
You can select quotes sorted by Alphabets.
To view stocks starting with an alphabet:
1) You can click on ALL.
2) Select an alphabet from the drop-down box.
Customize Columns
To customize the columns:
1) Click the widget menu.
2) Click Select Columns.
To save the customized table layout:
1) Click widget menu.
2) Mouse-over Table Layout.
3) Click Save as Template.
11
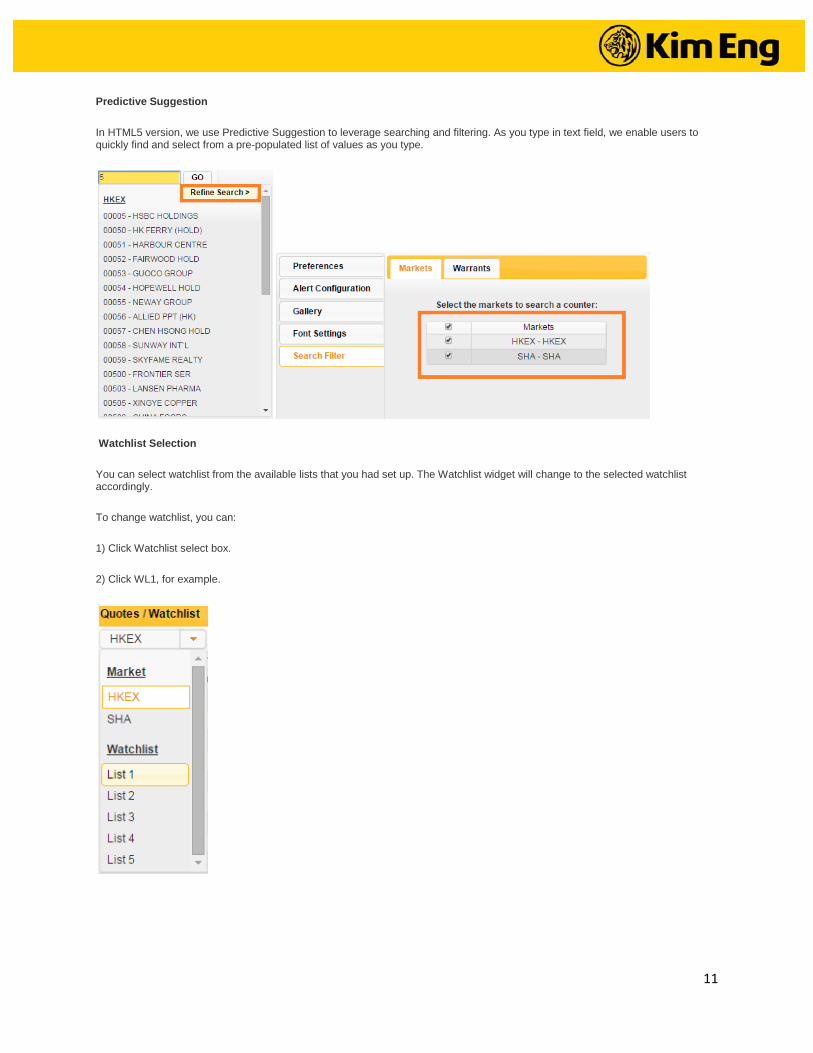
Predictive Suggestion
In HTML5 version, we use Predictive Suggestion to leverage searching and filtering. As you type in text field, we enable users to quickly find and select from a pre-populated list of values as you type.
Watchlist Selection
You can select watchlist from the available lists that you had set up. The Watchlist widget will change to the selected watchlist accordingly.
To change watchlist, you can:
1) Click Watchlist select box.
2) Click WL1, for example.
12
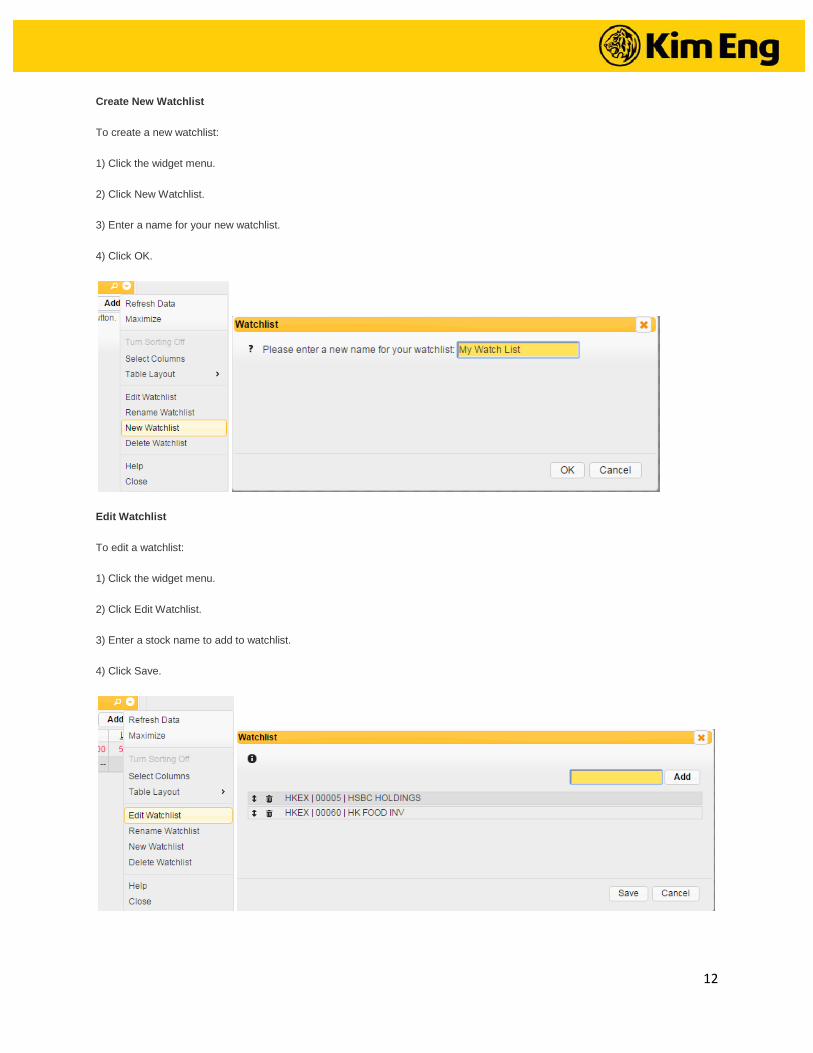
Create New Watchlist
To create a new watchlist:
1) Click the widget menu.
2) Click New Watchlist.
3) Enter a name for your new watchlist.
4) Click OK.
Edit Watchlist
To edit a watchlist:
1) Click the widget menu.
2) Click Edit Watchlist.
3) Enter a stock name to add to watchlist.
4) Click Save.

13
Delete Watchlist
To delete a watchlist:
1) Select watchlist from window.
2) Click the widget menu.
3) Click Delete Watchlist.
4) Click OK when the deletion confirmation pops up.
Indices
Indices have two options. You may choose to view Summary or Stock Components.
To view Summary or Stock Components, you can:
1) Click Widget Menu.
2) Select Summary or Stock Components. The selected page will be displayed.
Summary screen will show you HKEX and SHA Indices.
Stock Components screen will show you the composite sectors of the stock.
Right click on the sectorial index for more options.

14
Market Data Color Codes
Our market data are displayed in different color codes as an visual aid to view the market movements. Refer below for the color code definitions:
Market Summary
Market Summary shows you the market overview of SGX. Our screen can provide the SGX Sectors Indexes. We have 3 options for you to view the information.
To view Market Summary, you can:
1) Click Widget Menu.
2) Select Summary.
To view Summary Chart, you can:
1) Click Widget Menu.
2) Select Chart View.
To view Summary and Chart, you can:
1) Click Widget Menu.
2) Select Summary + Chart.

15
Stock Tracker
Stock Tracker helps to track the price of stock you are interested in. Stock Tracker is divided into 3 Tabs, namely Market Depth, Trade and Trade Summary.
To view any of the Stock Tracker Tabs, you can:
1) Enter a stock code or stock name in the Pre-Suggestion field.
2) Click Go.
3) Click Market Depth, Trade or Summ tabs to toggle to look at the price information you are interested in.
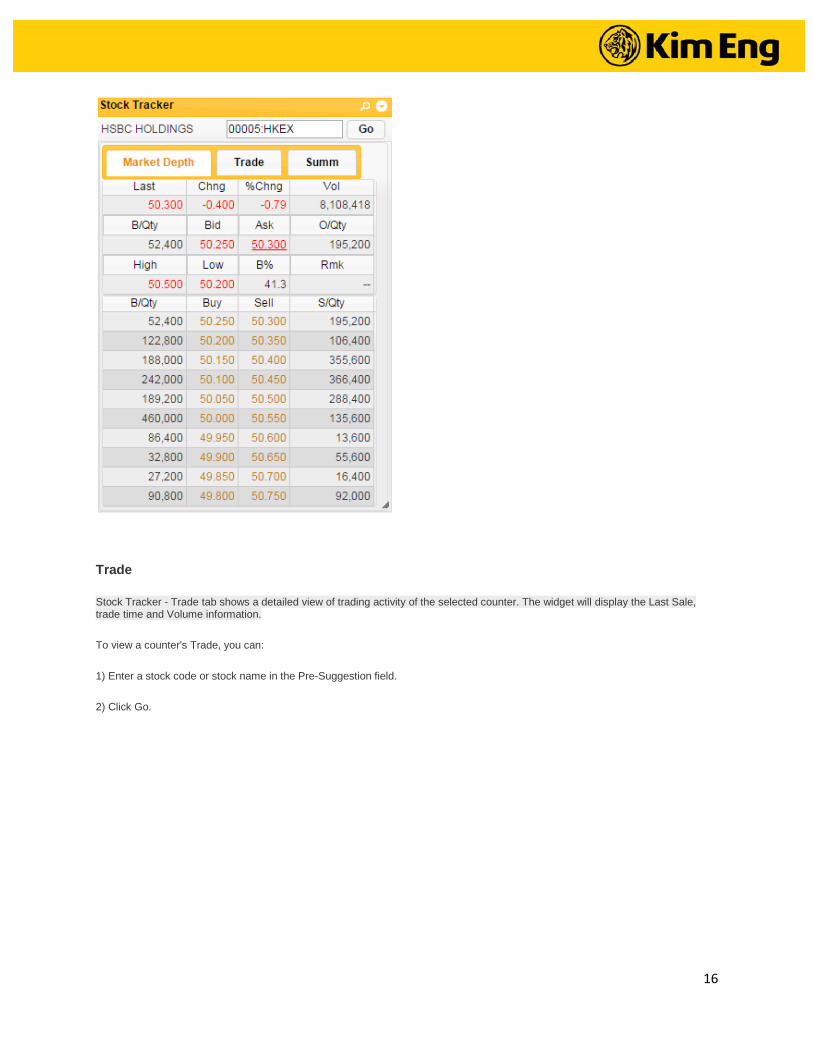
Market Depth
The system displays both the bid prices and the ask prices in the queue. It allows you to monitor the bid / ask prices at a glance.
16
Trade
Stock Tracker - Trade tab shows a detailed view of trading activity of the selected counter. The widget will display the Last Sale, trade time and Volume information.
To view a counter's Trade, you can:
1) Enter a stock code or stock name in the Pre-Suggestion field.
2) Click Go.

17
Trade Summary - by Price
Stock Tracker also provides you with a view of Trade Summary by Price. The widget display shows the selected counter's Price and Total Volume traded in intraday.
To view a counter's Trade Summary by Price, you can:
1) Enter a stock code or stock name in the Pre-Suggestion field.
2) Click Go.
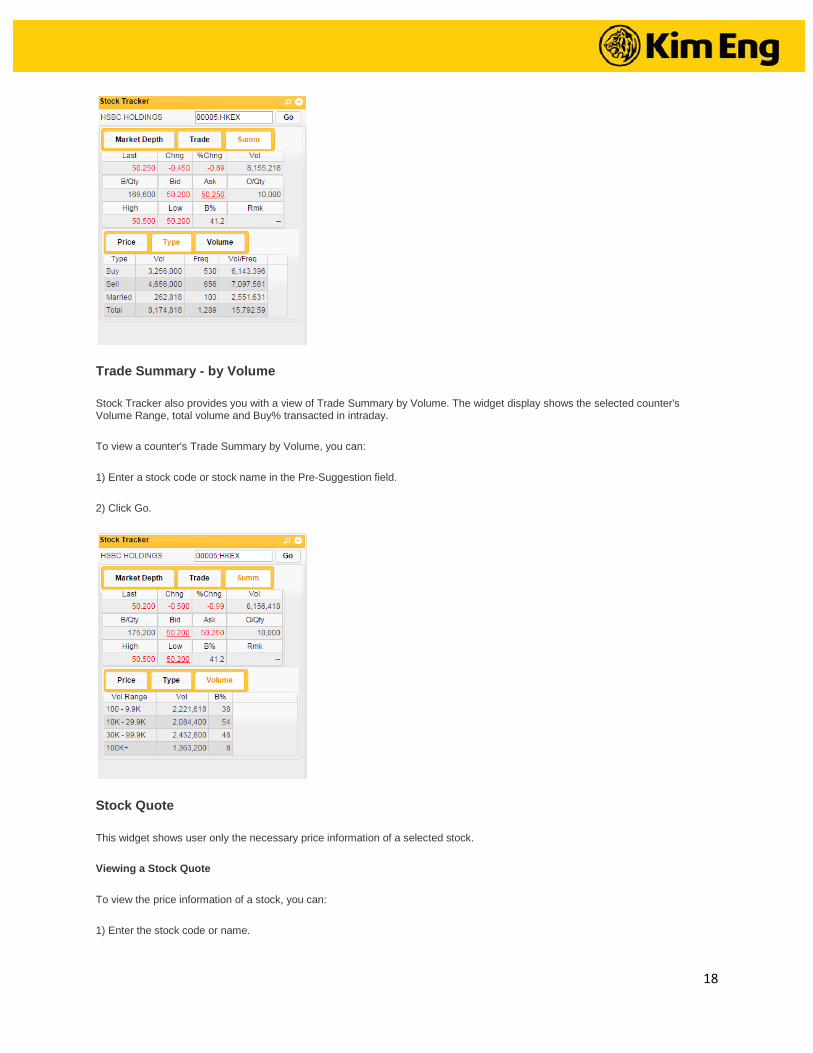
Trade Summary - by Type
Stock Tracker also provides you with a view of Trade Summary by Type. The widget display shows the selected counter's different transacted action (Buy, Sell or Married), Total Volume and number of trades transacted in intraday.
To view a counter's Trade Summary by Type, you can:
1) Enter a stock code or stock name in the Pre-Suggestion field.
2) Click Go.
18
Trade Summary - by Volume
Stock Tracker also provides you with a view of Trade Summary by Volume. The widget display shows the selected counter's Volume Range, total volume and Buy% transacted in intraday.
To view a counter's Trade Summary by Volume, you can:
1) Enter a stock code or stock name in the Pre-Suggestion field.
2) Click Go.
Stock Quote
This widget shows user only the necessary price information of a selected stock.
Viewing a Stock Quote
To view the price information of a stock, you can:
1) Enter the stock code or name.

19
2) Click GO.
The price information of the stock will be populated on-screen.
Warrant List
This widget lists all the warrant stocks of the selected main stock code.
Viewing Warrant List
To view the warrant list of a stock, you can:
1) Enter the stock code.
2) Click GO.
The warrant list of the stock will be populated on-screen.
Right-Click on Warrant List
You can right-click on your interested warrant from the list to:
• Buy or Sell
20
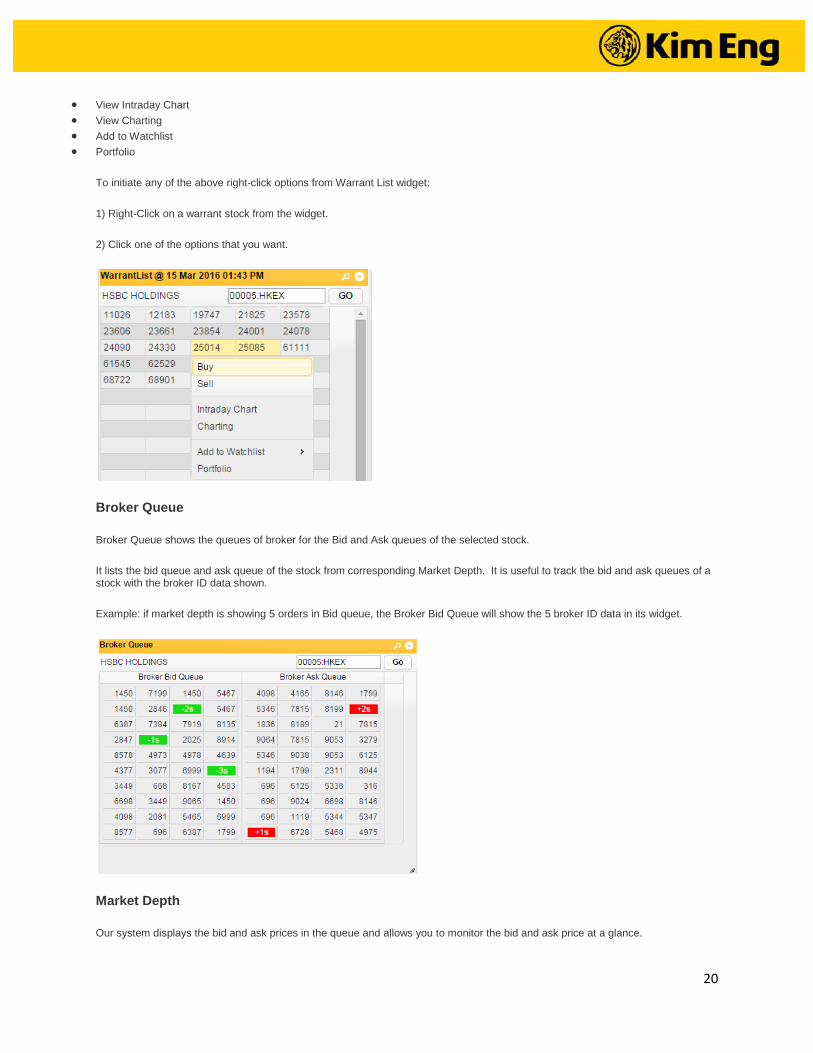
• View Intraday Chart • View Charting • Add to Watchlist • Portfolio
To initiate any of the above right-click options from Warrant List widget:
1) Right-Click on a warrant stock from the widget.
2) Click one of the options that you want.
Broker Queue
Broker Queue shows the queues of broker for the Bid and Ask queues of the selected stock.
It lists the bid queue and ask queue of the stock from corresponding Market Depth. It is useful to track the bid and ask queues of a stock with the broker ID data shown.
Example: if market depth is showing 5 orders in Bid queue, the Broker Bid Queue will show the 5 broker ID data in its widget.
Market Depth
Our system displays the bid and ask prices in the queue and allows you to monitor the bid and ask price at a glance.

21
To view a stock's Market Depth:
1) Enter a stock code or name.
2) Click GO.
Time & Sales
Time & Sales shows the individual trade done in chronological order with a time stamp for each transaction. The latest transaction is shown first.
It is useful to track the price movement of a stock with the data shown:
• Time of transaction • Last Done Price • Volume • %Change
Set Rows Per Page
You can update to your own preferred number of rows per page.

22
1) Click Menu.
2) Mouse-over Rows per Page.
3) Click your preferred number of rows to display on a page.
Distribution Chart
Distribution Chart is a statistical interpretation of the current sentiment on each stock in graphical format. KE Trade PRO provides 1 Day Trade Distribution Chart.
The Trade Distribution Chart goes through all the transactions, broken down by the price done per trade and groups each trade into different bars, differentiated by "Buy Up" and "Sell Down" activity.
Legend:
Green Bar - Buy Up
Red Bar - Sell Down
Black Bar - Married Trade

23
To view a stock's trade distribution chart:
1) Enter your interested stock code or name.
2) Click Go.
Distribution Chart
Distribution Chart is a statistical interpretation of the current sentiment on each stock in graphical format. KE Trade PRO provides 1 Day Volume Distribution Chart.
The Volume Distribution Chart goes through all the transactions, broken down by the volume done and groups each trade into different volume range bars, differentiated by "Buy Up" and "Sell Down" activity.
24
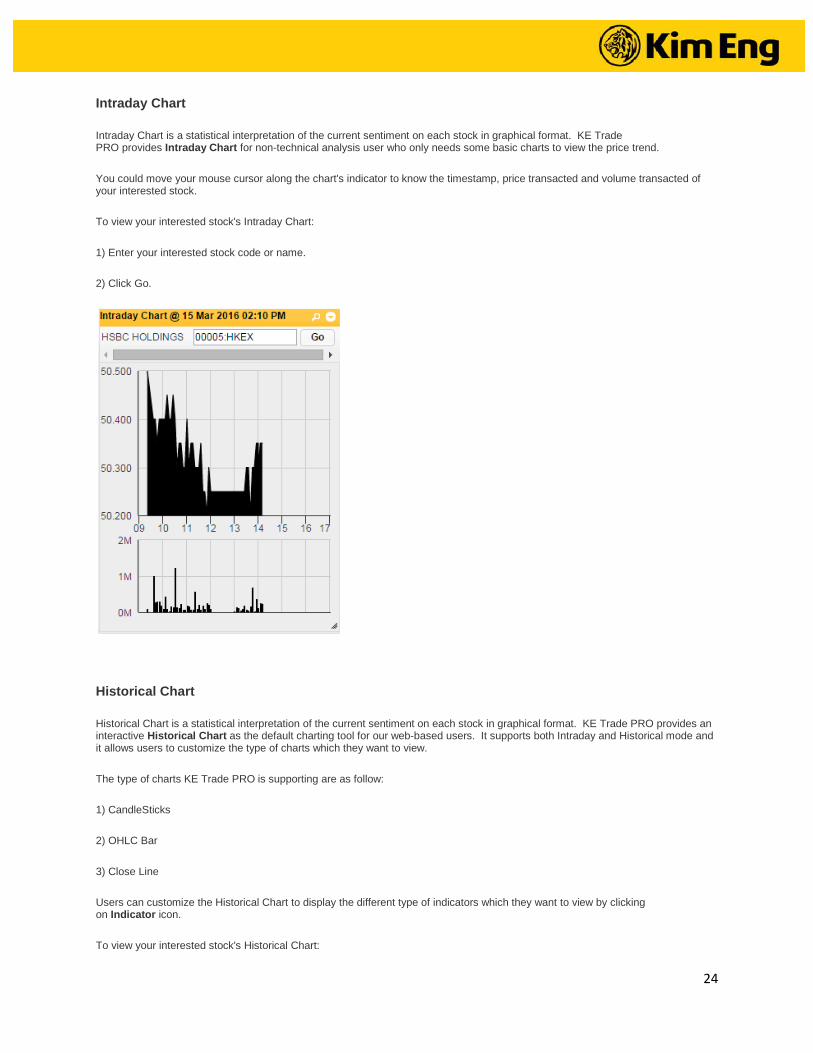
Intraday Chart
Intraday Chart is a statistical interpretation of the current sentiment on each stock in graphical format. KE Trade PRO provides Intraday Chart for non-technical analysis user who only needs some basic charts to view the price trend.
You could move your mouse cursor along the chart's indicator to know the timestamp, price transacted and volume transacted of your interested stock.
To view your interested stock's Intraday Chart:
1) Enter your interested stock code or name.
2) Click Go.
Historical Chart
Historical Chart is a statistical interpretation of the current sentiment on each stock in graphical format. KE Trade PRO provides an interactive Historical Chart as the default charting tool for our web-based users. It supports both Intraday and Historical mode and it allows users to customize the type of charts which they want to view.
The type of charts KE Trade PRO is supporting are as follow:
1) CandleSticks
2) OHLC Bar
3) Close Line
Users can customize the Historical Chart to display the different type of indicators which they want to view by clicking on Indicator icon.
To view your interested stock's Historical Chart:

25
1) Enter your interested stock code or name.
2) Click Go.
Order Book
View Your Order Detail
All the order will show up here. You can click on Details for more information about the order and breakdown of quantity and price filled, if any. You can also Amend and Cancel the order here.
Sorting of Orders
Click on any underlined column header to sort your orders by that field.
Click on the order no. and you can check the order details.

26
Place Order
Place Order widget allows user to place a limit day order or advance order. The Place Order widget incorporates the price data for users to have a quick view of the market movement.
For Basic Order Ticket, you can:
1) By selecting a Client Trading Account No., the Place Order screen loads the Client Name and Available Buy/Sell Limits.
2) Enter your interested stock code/name and the screen loads the following information:
• Company Name • Stock Currency • Stock Last Done Price • Stock's Price feed • Client's Stock Balance
3) Select an Action. You can select Buy, Sell or Short Sell.
4) Enter Quantity that you want to buy or sell. Our program will calculate and display the Order Value base on your entered Quantity and Stock Price.
5) You may amend the price you want to buy or sell at.
6) Select an Order Type. Order Type is defaulted to Limit.
7) Select the currency you want to settle in for the order.
8) KE Trade PRO will calculate and display the estimated Brokerage Percentage and Floor Amount based on your entered Quantity and Stock Price.
9) Click Submit.

27
Order Type:
Auction Limit Order (AL) Input as an at-auction limit order with a specified price during 9:00 am – 9:15 am. An at-auction limit order with a specified price at or more competitive than the final Indicative Equilibrium Price (IEP, in case of buying, the specified price is equal to or higher than the final IEP, or in case of selling, the specified price is equal to or lower than the final IEP) may be matched at the final IEP subject to availability of eligible matching order on the opposite side. An at-auction limit order will be matched in price and time priority at the final IEP. No at-auction limit order will be matched at a price worse than the final IEP. Any outstanding at-auction limit orders at the end of the Pre-opening Session will be carried forward to the Continuous Trading Session and treated as limit orders provided that the specified price of that at-auction limit order does not deviate 9 times or more from the nominal price. Such orders will be put in the price queue of the input price.
At-Auction Order (AO) An at-auction order is an order with no specified price and is entered into the AMS/3 for execution at the final Indicative Equilibrium Price (IEP). It enjoys a higher order matching priority than an at-auction limit order and will be matched in time priority at the final IEP. Any outstanding at-auction orders after the end of the Pre-opening Session will be cancelled before the commencement of the Continuous Trading Session.
Limit Order (L) A limit order will allow matching only at the specified price. The sell order input price cannot be made at a price below the best bid price, if available whereas the buy order input price cannot be made at a price above the best ask price, if available. Any outstanding limit order will be put in the price queue of the input price.
Enhanced Limit Order (EL) An enhanced limit order will allow matching of up to 10 price queues (i.e. the best price queue and up to the 10th queue at 9 spreads away) at a time provided that the traded price is not worse than the input price. Any outstanding enhanced limit order will be treated as a limit order and put in the price queue of the input price.
Special Limit Order (SL) A special limit order will allow matching of up to 10 price queues (i.e. the best price queue and up to the 10th queue at 9 spreads away) at a time provided that the traded price is not worse than the input price. A special limit order has no restriction on the input price as long as the order input price is at or below the best bid price for a sell order or at or above the best ask price for a buy order. Any outstanding special limit order will be canceled and will not be stored in the AMS/3.

28
10) A Confirmation screen will pop up for you review and confirm the order.
11) Click confirm.
12) An Order Result screen will pop up to inform that the order has been accepted by our system.
13) Click confirm.
29
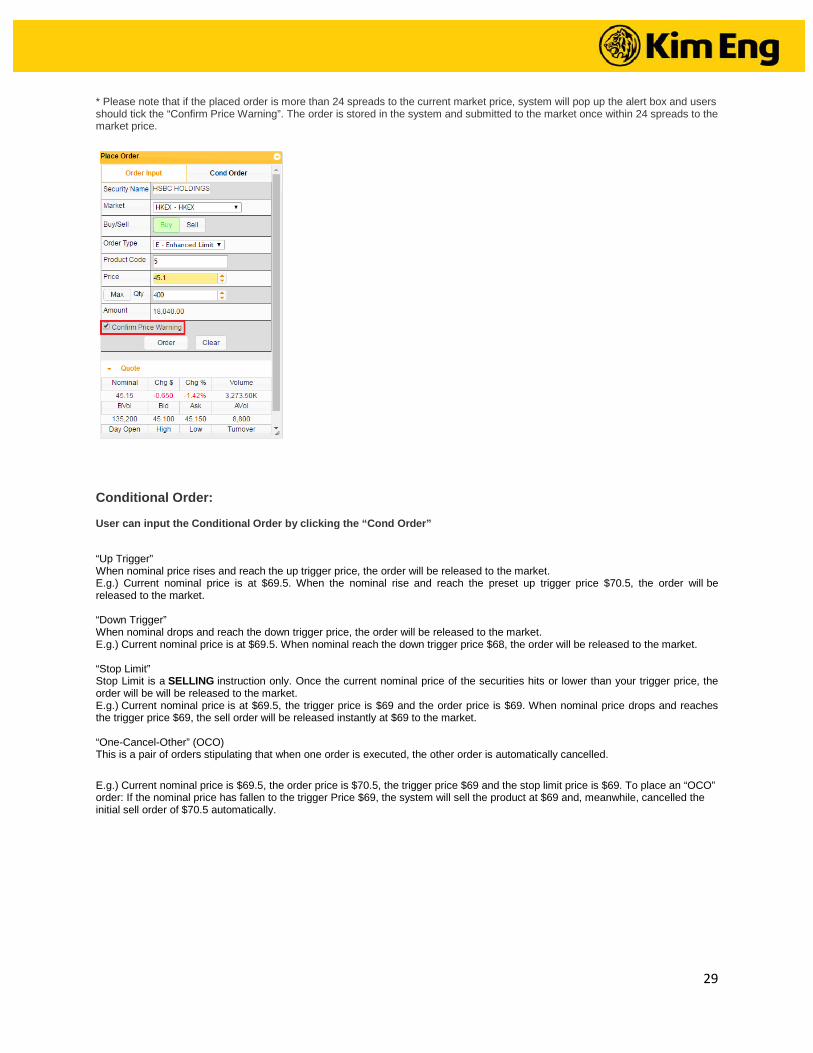
* Please note that if the placed order is more than 24 spreads to the current market price, system will pop up the alert box and users should tick the “Confirm Price Warning”. The order is stored in the system and submitted to the market once within 24 spreads to the market price.
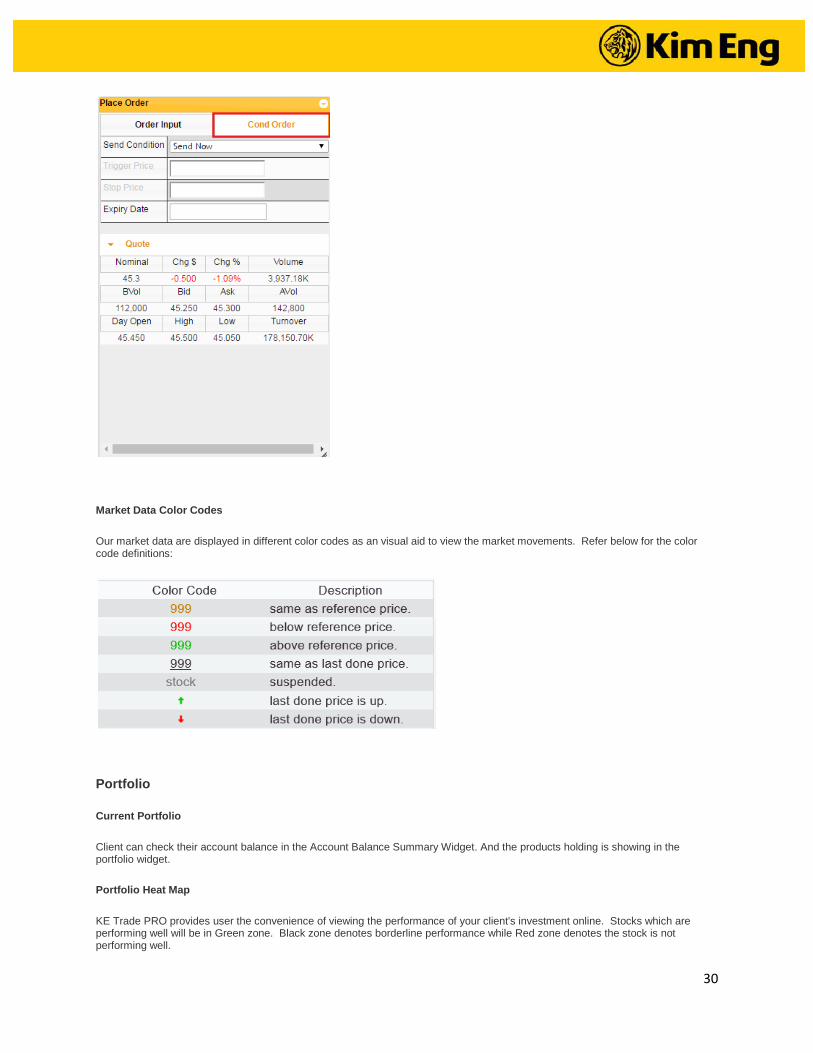
Conditional Order: User can input the Conditional Order by clicking the “Cond Order” “Up Trigger” When nominal price rises and reach the up trigger price, the order will be released to the market. E.g.) Current nominal price is at $69.5. When the nominal rise and reach the preset up trigger price $70.5, the order will be released to the market. “Down Trigger” When nominal drops and reach the down trigger price, the order will be released to the market. E.g.) Current nominal price is at $69.5. When nominal reach the down trigger price $68, the order will be released to the market. “Stop Limit” Stop Limit is a SELLING instruction only. Once the current nominal price of the securities hits or lower than your trigger price, the order will be will be released to the market. E.g.) Current nominal price is at $69.5, the trigger price is $69 and the order price is $69. When nominal price drops and reaches the trigger price $69, the sell order will be released instantly at $69 to the market. “One-Cancel-Other” (OCO) This is a pair of orders stipulating that when one order is executed, the other order is automatically cancelled.
E.g.) Current nominal price is $69.5, the order price is $70.5, the trigger price $69 and the stop limit price is $69. To place an “OCO” order: If the nominal price has fallen to the trigger Price $69, the system will sell the product at $69 and, meanwhile, cancelled the initial sell order of $70.5 automatically.
30
Market Data Color Codes
Our market data are displayed in different color codes as an visual aid to view the market movements. Refer below for the color code definitions:
Portfolio
Current Portfolio
Client can check their account balance in the Account Balance Summary Widget. And the products holding is showing in the portfolio widget.
Portfolio Heat Map
KE Trade PRO provides user the convenience of viewing the performance of your client's investment online. Stocks which are performing well will be in Green zone. Black zone denotes borderline performance while Red zone denotes the stock is not performing well.

31
Alerts
KE Trade PRO provides user the convenience of receiving different types of useful alerts online. Clients and Dealers will receive the alerts through our system. If they are logged in, they will see the flash of incoming alerts. If they missed it or they are not login to our system, they can still view them in Alerts widget.
News
Users can view/read stock's news or research material available through KE TRADE PRO. When users login, they will see news or research information dated of the day. They may filter the news/research by date range or particular stock.

32

33
Account Balance Summary
In Eqv. tab, you can view your account balance at Account Balance Summary.
The system will list the amount of available cash, credit limit, used limit, available limit, stock value and portfolio.
You can also view as another currency by selecting Eqv. drop down list.
In Cash Bal. tab, you can view your different currency account cash balance.
Account Management
In Change User Password tab, you can change your account login password.
In Client Account tab, you can change your login id and select whether to receive order notification email.

34
Account Statement - Order Report
Order Report allows you to generate / export the order records within the period of date.
To generate an order report:
1) Decide the period of date that you want to generate / export the data.
2) Select the start date and end date in drop down box.
3) Select the stock market.
4) You can specify a Product Code that you want to generate. Leave the textbox blank if you want to generate all product codes.
5) Click "Run Report" if you want to view on web, you can also click "Export" to download the file in csv format.

35
Account Statement - Trade Report
Trade Report allows you to generate / export the trade records within the period of date.
To generate a trade report:
1) Decide the period of date that you want to generate / export the data.
2) Select the start date and end date in drop down box.
3) Select the stock market.
4) You can specify a Product Code that you want to generate. Leave the textbox blank if you want to generate all product codes.
5) Click "Run Report" if you want to view on web, you can also click "Export" to download the file in csv format.

36
Account Statement - Order Trade Report
Order Trade Report allows you to generate / export the order records and trade records within the period of date.
To generate an order trade report:
1) Decide the period of date that you want to generate / export the data.
2) Select the start date and end date in drop down box.
3) Select the stock market.
4) You can specify a Product Code that you want to generate. Leave the textbox blank if you want to generate all product codes.
5) Click "Run Report" if you want to view on web, you can also click "Export" to download the file in csv format.

37
Fund Management - Fund Deposit
Fund Deposit allows you to indicate your deposit record in our web.
To submit a deposit ticket:
1) Deposit the fund to the bank account by system's instruction.
2) Select your bank account that made the deposit action.

38
3) Select your deposit method.
4) Enter your deposit amount.
5) And select the deposit date and time
6) Enter any remarks (Optional)
7) Click "Submit" button.
The system will ask you to confirm all data are valid, If you checked your inputted data are valid, click 'Confirm' button to submit the deposit ticket.

39
IPO
You can apply e-IPO through KE TRADE PRO. Here will display the available IPO that you may apply.
Click "Apply" hyperlink to view the detailed information of the IPO
To submit a e-IPO application:
1) Select the Apply Qty. You can view the Quantity / Amount Table by clicking the tab above.
2) Select Loan Financing. (And input the responding amount or percentage if the textbox is enabled)
3) Click the "Apply" button

40
System will display a confirmation window to you, please verify the data is correct.
Click the "Confirm" button to finish the IPO application.

41
3. Preferences
Hot Key
This function can set the default short-cut keys for “Order Input”
Trade On Click
You can set to pop-up Place Order widget when you do a click on a particular counter or click on either Bid/Offer of a particular counter in Market Info Quotes widget.

42
Up / Down Color
You can change the up/down color which is HK and Mainland style.
Login & Password
How do I login?
To log into your Trading account:
a) Username: You can enter your assigned Username.
b) Enter your Password.
c) Choose your preferred language for trading. Currently, we have English, Traditional Chinese and Simplified Chinese for your selection.
c) Click Login to my account.

43
Create your Trading Workspace
KE TRADE PROI Trader provides you customisable trading space to suit your trading needs.
Create a Page
How do I create a new page?
To create a new page:
1) Click on + icon to create a new page.
2) A pop-up screen will be shown for you to:
3) Page Name: Enter a name for your customized page.
4) Click Select to choose available template.
5) Click Create.

44
Adding Widget to Trading Workspace
How do I add a widget to a page?
To add a widget to a page:
1) Click on Add Widget icon.
2) A pop-up screen will be shown for you to select the widget you want to add.
3) Click on the widget menu to expand the list of widgets available, e.g. Market Info.

45
4) Click on one of the widget to add it to your page, e.g. Quotes/Watchlist.