kc016757 final report - tetra pak · final report prepared for tetra pak, inc. by franklin...
TRANSCRIPT
LIFE CYCLE INVENTORY OF CONTAINER SYSTEMS FOR WINE
Final Report
Prepared for
Tetra Pak, Inc.
By
Franklin Associates, A Division of ERG Prairie Village, KS
October 16, 2006

CLIENTS\TETRAPAK\KC016757.doc 10.16.06 3560.00.003.002
iii
Table of Contents
EXECUTIVE SUMMARY – LIFE CYCLE INVENTORY OF WINE CONTAINER SYSTEMS ............................................................................................................................................... ES-1
INTRODUCTION................................................................................................................................ES-1
LCI METHODOLOGY........................................................................................................................ES-1
SYSTEMS STUDIED ..........................................................................................................................ES-1
SCOPE AND BOUNDARIES .............................................................................................................ES-2
LIMITATIONS AND ASSUMPTIONS ..............................................................................................ES-3
LCI RESULTS .....................................................................................................................................ES-4 Energy..............................................................................................................................................ES-6 Solid Waste ......................................................................................................................................ES-7 Environmental Emissions ................................................................................................................ES-9
LCI CONCLUSIONS.........................................................................................................................ES-10 Energy Requirements.....................................................................................................................ES-11 Solid Wastes ..................................................................................................................................ES-11 Greenhouse Gas Emissions............................................................................................................ES-12
CHAPTER 1 – SYSTEM DESCRIPTIONS AND LCI ASSUMPTIONS ............................................ 1-1
INTRODUCTION.................................................................................................................................. 1-1 Systems Studied................................................................................................................................. 1-1 Scope and Boundaries........................................................................................................................ 1-3 Limitations and Assumptions............................................................................................................. 1-3
CHAPTER 2 – LCI RESULTS AND CONCLUSIONS FOR MULTI-SERVING WINE CONTAINERS .......................................................................................................................................... 2-1
INTRODUCTION.................................................................................................................................. 2-1
ENERGY................................................................................................................................................ 2-2 Energy of Material Resource ............................................................................................................. 2-3 Process Energy................................................................................................................................... 2-3 Transportation Energy ....................................................................................................................... 2-3 Energy Profile .................................................................................................................................... 2-5 Energy Recovery................................................................................................................................ 2-7
SOLID WASTE...................................................................................................................................... 2-9 Solid Waste by Weight ...................................................................................................................... 2-9 Solid Waste by Volume ................................................................................................................... 2-11
ENVIRONMENTAL EMISSIONS...................................................................................................... 2-14 Atmospheric Emissions ................................................................................................................... 2-15 Waterborne Emissions ..................................................................................................................... 2-17
CONCLUSIONS .................................................................................................................................. 2-17 Energy Requirements....................................................................................................................... 2-17 Solid Wastes .................................................................................................................................... 2-18 Greenhouse Gas Emissions.............................................................................................................. 2-18
CHAPTER 3 – LCI RESULTS AND CONCLUSIONS FOR SINGLE-SERVING WINE CONTAINERS .......................................................................................................................................... 3-1
INTRODUCTION.................................................................................................................................. 3-1

CLIENTS\TETRAPAK\KC016757.doc 10.16.06 3560.00.003.002
iv
Table of Contents (Cont'd) ENERGY................................................................................................................................................ 3-2
Energy of Material Resource ............................................................................................................. 3-3 Process Energy................................................................................................................................... 3-3 Transportation Energy ....................................................................................................................... 3-3 Energy Profile .................................................................................................................................... 3-5 Energy Recovery................................................................................................................................ 3-7
SOLID WASTE...................................................................................................................................... 3-8 Solid Waste by Weight ...................................................................................................................... 3-8 Solid Waste by Volume ................................................................................................................... 3-10
ENVIRONMENTAL EMISSIONS...................................................................................................... 3-12 Atmospheric Emissions ................................................................................................................... 3-13 Waterborne Emissions ..................................................................................................................... 3-15
CONCLUSIONS .................................................................................................................................. 3-15 Energy Requirements....................................................................................................................... 3-15 Solid Wastes .................................................................................................................................... 3-16 Greenhouse Gas Emissions.............................................................................................................. 3-16
CHAPTER 4 – GREENHOUSE GAS EMISSIONS FROM WINE CONTAINER SYSTEMS ........ 4-1
INTRODUCTION.................................................................................................................................. 4-1
GREENHOUSE GAS EMISSIONS FROM LANDFILLS.................................................................... 4-1
POTENTIAL EMISSIONS FROM LANDFILLED WINE CONTAINERS......................................... 4-2
COMPARISON OF LANDFILL EMISSIONS AND LCI EMISSIONS............................................... 4-3
LANDFILL EMISSIONS EXPRESSED AS CARBON DIOXIDE EQUIVALENTS.......................... 4-4
SUMMARY ........................................................................................................................................... 4-6
CHAPTER 5 – SENSITIVITY OF LCI RESULTS TO POST CONSUMER RECYCLING RATES........................................................................................................................................................ 5-1
INTRODUCTION.................................................................................................................................. 5-1
ASSUMPTIONS .................................................................................................................................... 5-1 Recycling Rates ................................................................................................................................. 5-1 Geography.......................................................................................................................................... 5-1 Recycling Methodology..................................................................................................................... 5-2
RESULTS............................................................................................................................................... 5-2
SUMMARY ........................................................................................................................................... 5-4
APPENDIX A – STUDY APPROACH AND METHODOLOGY ....................................................... A-1
INTRODUCTION................................................................................................................................. A-1
GOALS OF THE STUDY..................................................................................................................... A-1
STUDY SCOPE .................................................................................................................................... A-2 Functional Unit ................................................................................................................................. A-2 System Boundaries............................................................................................................................ A-2 Description of Data Categories ......................................................................................................... A-3 Inclusion of Inputs and Outputs ........................................................................................................ A-6

CLIENTS\TETRAPAK\KC016757.doc 10.16.06 3560.00.003.002
v
Table of Contents (Cont'd) DATA.................................................................................................................................................... A-7
Process Data...................................................................................................................................... A-7 Fuel Data........................................................................................................................................... A-8 Data Quality Goals for This Study.................................................................................................... A-9 Data Accuracy................................................................................................................................... A-9
METHODOLOGY .............................................................................................................................. A-10 Coproduct Credit............................................................................................................................. A-11 Energy of Material Resource .......................................................................................................... A-12 Recycling ........................................................................................................................................ A-14 Greenhouse Gas Accounting........................................................................................................... A-14
GENERAL DECISIONS..................................................................................................................... A-15 Geographic Scope ........................................................................................................................... A-15 Precombustion Energy and Emissions ............................................................................................ A-15 Electricity Fuel Profile .................................................................................................................... A-15 System Components Not Included.................................................................................................. A-16
APPENDIX B – CONSIDERATIONS FOR INTERPRETATION OF DATA AND RESULTS...... B-1
INTRODUCTION................................................................................................................................. B-1
STATISTICAL CONSIDERATIONS .................................................................................................. B-1
CONCLUSIONS ................................................................................................................................... B-4
APPENDIX C – ATMOSPHERIC AND WATERBORNE EMISSIONS........................................... C-1
APPENDIX D – RECYCLING THEORY AND METHODOLOGY.................................................. D-1
INTRODUCTION................................................................................................................................. D-1
APPENDIX E – GREENHOUSE GAS EMISSIONS FROM LANDFILLED PRODUCTS............. E-1
INTRODUCTION..................................................................................................................................E-1
GREENHOUSE GAS EMISSIONS FROM LANDFILLS....................................................................E-1
REFINEMENT OF GLOBAL WARMING CALCULATIONS ...........................................................E-3
ADDITIONAL ISSUES WITH LANDFILL GAS EMISSIONS ..........................................................E-4
DATA QUALITY ISSUES ....................................................................................................................E-5
APPENDIX E - REFERENCES.............................................................................................................E-7
PEER REVIEW REPORT AND FRANKLIN ASSOCIATES RESPONSES ..................................PR-1
INTRODUCTION............................................................................................................................... PR-3
COMMENTS ...................................................................................................................................... PR-4 Report ............................................................................................................................................. PR-4 Appendices.................................................................................................................................... PR-12
PEER REVIEW PANEL QUALIFICATIONS................................................................................. PR-15 Beth H. Quay ................................................................................................................................ PR-15 David T. Allen .............................................................................................................................. PR-15 Gregory A. Keoleian, PhD............................................................................................................ PR-16

FRANKLIN ASSOCIATES, A Division of ERG
CLIENTS\TETRAPAK\KC016757.doc 10.16.06 3560.00.003.002
ES-1
EXECUTIVE SUMMARY
LIFE CYCLE INVENTORY OF WINE CONTAINER SYSTEMS INTRODUCTION A Life Cycle Inventory (LCI) quantifies the resource use (materials and energy) and environmental emissions associated with the life cycle of specific products. The purpose of this study is to evaluate the resource use, solid wastes, and atmospheric and waterborne emissions associated with packaging used for wine. This study also evaluates the sensitivity of environmental burdens to different disposal and recycling scenarios.
This LCI was performed for Tetra Pak Inc. As a part of Tetra Pak’s commitment to sustainability, Tetra Pak will use the results of this study to evaluate the environmental footprint of its packages as well as alternative packages used for the same application. LCI METHODOLOGY
The methodology used for goal and scope definition and inventory analysis in this study is consistent with the methodology for Life Cycle Inventory (LCI) as described in the ISO 14040 and 14041 Standard documents. A life cycle inventory quantifies the energy consumption and environmental emissions (i.e., atmospheric emissions, waterborne wastes, and solid wastes) for a given product based upon the study scope and boundaries established. This LCI is a cradle-to-grave analysis, covering steps from raw material extraction through container disposal. To ensure that this study adheres to the above standards, the full report and supporting documentation for this study will be presented to a peer review panel. SYSTEMS STUDIED This LCI evaluates three types of container systems for wine: paperboard containers, glass bottles, and PET bottles. The paperboard containers (which are composed of a laminate of paperboard, aluminum, and polyolefin resins) are manufactured by Tetra Pak and include the Tetra Brik™ and Tetra Prisma™. The paperboard containers range from a capacity of 200 milliliters to 1 liter. The alternative systems are 187-milliliter and 750-milliliter glass bottles, and 187-milliliter and 750-milliliter PET bottles. The secondary and tertiary packaging (such as corrugated boxes) used for transporting filled containers from the winery to a distribution center are also included.
The weights of the container systems are shown in Table ES-1, which includes the weights of the containers, closures, and secondary/tertiary packaging as well as the total weight per packaging system. Table ES-1 also includes the weight of packaging per delivery of one liter of wine. By showing the weights of all systems per delivery of the same volume of product (one liter of wine), the packaging efficiency of each system is demonstrated. The weight of a product is not the only determinant of its environmental burdens; however, in many cases there is a strong correlation between system weight and

FRANKLIN ASSOCIATES, A Division of ERG
CLIENTS\TETRAPAK\KC016757.doc 10.16.06 3560.00.003.002
ES-2
environmental burdens. The paperboard systems have a lower weight per liter than the glass or PET systems, and the multi-serving systems have a lower weight per liter than the single-serving systems.
TABLE ES-1
Weight Summary for Wine Container Systems (All weights are expressed in grams)
Container weight
Closure weight
Secondary and Tertiary Packaging
Total weight per
container (1)
Total weight per
liter (2) Paperboard Systems
Tetra Brik (1 liter) 31.4 2.18 23.2 56.7 56.7 Tetra Prisma (1 liter) 34.5 2.18 27.2 63.9 63.9 Tetra Prisma (500 milliliters) 20.3 2.18 15.9 38.4 76.8 Tetra Prisma (250 milliliters) 12.0 (3) 12.5 24.5 98.0 Tetra Prisma (200 milliliters) 8.52 (3) 11.1 19.6 98.0
Glass Systems Glass bottle (750 milliliters) 527 (3) 47.7 574 765 Glass bottle (187 milliliters) 150 1.91 10.9 163 872
PET Systems PET bottle (750 milliliters) 54.0 4.59 28.6 87.2 116 PET bottle (187 milliliters) 22.2 1.91 20.4 44.6 239
(1) Total weight per container is the sum of the container, closure, and secondary/tertiary packaging. Due to rounding errors, the total weights in this table do not agree exactly with the sum of component weights. (2) Total weight per liter expresses the weights of all container systems in this table on the basis: the delivery of 1 liter of wine. (3) The weights of closures for some systems account for a negligible percentage of total system weight and are thus not included in this analysis.
In order to express the results on an equivalent basis, a functional unit of equivalent volume was chosen for this analysis. Results are expressed on the basis of the delivery of 1,000 liters of wine. For the single-serving containers, this is equivalent to 4,000 250-milliliter containers, 5,000 200-milliliter containers, or 5,348 187-milliliter containers. For the multi-serving containers, this is equivalent to 2,000 500-liter containers, 1,333 750-milliliter containers, or 1,000 1-liter containers. A conventional case of wine contains 12 750-milliliter glass bottles, for a total volume of 9 liters. The basis of 1,000 liters of wine is thus equivalent to 111 cases of wine. SCOPE AND BOUNDARIES
This analysis includes the following five steps for each container system:
1. Production of the container materials, which includes all steps from the extraction of raw materials through the production of the component materials of the containers.
2. Fabrication of the container systems from their component materials. 3. Transportation of empty containers from the container producer to a winery.

FRANKLIN ASSOCIATES, A Division of ERG
CLIENTS\TETRAPAK\KC016757.doc 10.16.06 3560.00.003.002
ES-3
4. Transportation of filled containers from the winery to a distribution center. (The subsequent transportation from distribution center to retailer is not included in this analysis due to a lack of data as well as the assumption that such a transportation step is negligible in comparison to upstream transportation steps.)
5. Postconsumer disposal and recycling of container systems, including recycling, landfill, and combustion scenarios for the United States and Canada.
LIMITATIONS AND ASSUMPTIONS
The key assumptions of this analysis fall into a few categories. The types of assumptions made in this analysis are summarized below. (A thorough list of assumptions is included in Chapter 1 of the LCI report.)
Based on the types of materials and nature of the markets for the systems of this analysis, it was assumed that the majority of processes for the life cycles of the container systems occur in the United States. This includes the production of the Tetra Brik and Tetra Prisma, which are fabricated in Texas. These geographical assumptions include the use of the average U.S. electricity grid for all industrial processes except for the primary aluminum supply chain, which was modeled with the electricity grids of its corresponding geographies. System components that comprise less than one percent of total system weight were excluded. This cut-off assumption is based on past LCI studies, which demonstrate that materials that comprise less than one percent of system weight have a negligible affect on the LCI results. Examples of these components include tertiary packaging such as stretch wrap used for pallets, container labels and, in some cases, container closures.
In some cases, data were excluded from the LCI because reliable data sources could not be found. This includes data for the emission of volatile organic compounds (VOCs) from the printing of container labels and data for the transportation requirements from distribution centers to retailers. Based on the contribution of similar processes to the LCI results, it was concluded that the exclusion of these data had a negligible affect on the LCI results.
Proprietary materials were modeled with data representative of commodity materials. This includes the oxygen scavenger additive used in PET bottles. The oxygen scavenger is a proprietary additive that is derived from PET, is made by the same producers who make bottle-grade PET, and comprises less than five percent of the total weight of a PET bottle.
Assumptions related to the management of postconsumer waste in the United States and Canada were based on statistics compiled by Franklin Associates, discussions with Statistics Canada, and statistics published by organizations such as APC (American Plastics Council). These assumptions include the postconsumer recycling rates of containers and

FRANKLIN ASSOCIATES, A Division of ERG
CLIENTS\TETRAPAK\KC016757.doc 10.16.06 3560.00.003.002
ES-4
the percent split between landfilling and combustion with energy recovery. The waste management assumptions for this analysis are summarized in Table ES-2.
TABLE ES-2
Assumed Rates for Postconsumer Solid Waste Recycling, Landfilling,
and Combustion with Energy Recovery (1) Tetra Brik or
Tetra Prisma Glass Bottle PET Bottle
United States Recycling 5% 15% 22% Landfill 86% 86% 86% Combustion 14% 14% 14%
Canada Recycling 27% 30% 36% Landfill 95% 95% 95% Combustion 5% 5% 5%
(1) The total of percentages for recycling, landfill, and combustion do not equal 100% because the landfill and combustion percentages represent the disposal of material after recovery for recycling has occurred. The original LCI models and draft report for this analysis used the recycling rates shown in Table ES-2. Based on comments received from the peer review panel and from representatives of Tetra Pak in Canada, the sensitivity of the LCI results to changes in recycling rates was evaluated. In particular, a recycling rate of approximately 65 percent was assumed for glass bottles and a recycling rate of approximately 50 percent was assumed for PET bottles. The sensitivity analysis compared the nationwide recycling rates of Canada to the provincial recycling rates of Ontario. The sensitivity analysis concluded that the total LCI energy and greenhouse gas emissions do not change significantly when the recycling rates are changed. Postconsumer solid waste is reduced when recycling rates are increased; however, for all recycling rates considered, the Tetra Pak systems generate lower solid wastes than the PET or glass systems. The results of this sensitivity analysis are presented in Chapter 5 of this report. LCI RESULTS The LCI results include energy consumption, solid waste generation, and environmental emissions to air and water. A summary of the results for the multi-serving container systems is shown in Table ES-3. A summary of the results for the single-serving container systems is shown in Table ES-4.

FRANKLIN ASSOCIATES, A Division of ERG
CLIENTS\TETRAPAK\KC016757.doc 10.16.06 3560.00.003.002
ES-5
EnergyTetra Brik (1 Liter) 3.26 MM Btu 143 lbs 0.22 cu yd 333 lbsTetra Prisma (1 Liter) 3.77 MM Btu 158 lbs 0.24 cu yd 378 lbsTetra Prisma (500 mL) 4.84 MM Btu 196 lbs 0.30 cu yd 484 lbsGlass Bottle (750 mL) 10.8 MM Btu 1,545 lbs 0.60 cu yd 1,916 lbsPET Bottle (750 mL) 8.17 MM Btu 286 lbs 0.57 cu yd 922 lbs
EnergyTetra Brik (1 Liter) 3.13 MM Btu 145 lbs 0.22 cu yd 327 lbsTetra Prisma (1 Liter) 3.61 MM Btu 161 lbs 0.25 cu yd 372 lbsTetra Prisma (500 mL) 4.66 MM Btu 199 lbs 0.31 cu yd 476 lbsGlass Bottle (750 mL) 10.8 MM Btu 1,344 lbs 0.52 cu yd 1,901 lbsPET Bottle (750 mL) 7.86 MM Btu 293 lbs 0.59 cu yd 899 lbs
Source: Franklin Associates, a Division of ERG
TOTAL ENERGY AND GREENHOUSE GAS EMISSIONS FOR MULTI-SERVING WINE CONTAINER SYSTEMS
(per 1,000 liters)
Solid Waste(weight and volume)
Solid Waste(weight and volume)
Greenhouse Gases(CO2 equivalents)
Greenhouse Gases(CO2 equivalents)
CANADA
UNITED STATES
Table ES-3
EnergyTetra Prisma (250 mL) 5.38 MM Btu 244 lbs 0.37 cu yd 557 lbsTetra Prisma (200 mL) 5.29 MM Btu 244 lbs 0.37 cu yd 571 lbsGlass Bottle (187 mL) 16.7 MM Btu 1,988 lbs 0.81 cu yd 2,690 lbsPET Bottle (187 mL) 15.4 MM Btu 593 lbs 1.22 cu yd 1,699 lbs
EnergyTetra Prisma (250 mL) 5.16 MM Btu 249 lbs 0.39 cu yd 548 lbsTetra Prisma (200 mL) 5.11 MM Btu 250 lbs 0.39 cu yd 563 lbsGlass Bottle (187 mL) 16.6 MM Btu 1,756 lbs 0.72 cu yd 2,673 lbsPET Bottle (187 mL) 14.9 MM Btu 615 lbs 1.28 cu yd 1,660 lbs
Source: Franklin Associates, a Division of ERG
Table ES-4
TOTAL ENERGY AND GREENHOUSE GAS EMISSIONS FOR SINGLE-SERVING WINE CONTAINER SYSTEMS
(per 1,000 liters)
UNITED STATESSolid Waste
(weight and volume)Greenhouse Gases(CO2 equivalents)
CANADASolid Waste
(weight and volume)Greenhouse Gases(CO2 equivalents)

FRANKLIN ASSOCIATES, A Division of ERG
CLIENTS\TETRAPAK\KC016757.doc 10.16.06 3560.00.003.002
ES-6
Energy
The total energy requirements for each system include the energy for manufacturing and transporting materials at each life cycle phase, as well as the energy content of fuel resources used as raw materials. Figure ES-1 is based on the energy results shown in Tables ES-3 and ES-4.
Figure ES-1 shows total energy for each system in the United States and Canada. The differences between the United States and Canadian results are due only to the different solid waste management scenarios of the two countries. Figure ES-1 illustrates that the two waste management scenarios do not significantly affect the energy results. In fact, none of the results categories (including solid wastes and greenhouse gas emissions) are sensitive to changes in waste management scenarios.
The total energy for each system is shown in Figure ES-1, but the life cycle phases are not shown. Of the five life cycle phases included in this analysis (material production, container fabrication, transportation to winery, distribution, and postconsumer waste management), the production of container materials accounts for the largest share of total energy for all container systems. For all systems of this analysis, at least half of total system energy is attributable to material production.
FIGURE ES-1Total Energy for Wine Container Systems
(Million Btu per 1,000 Liters of Wine)
02468
1012141618
Tetra
Brik
(1 L
iter)
Tetra
Pris
ma
(1 L
iter)
Tetra
Pris
ma
(500
mL)
Gla
ss B
ottle
(750
mL)
PE
T B
ottle
(750
mL)
Tetra
Pris
ma
(250
mL)
Tetra
Pris
ma
(200
mL)
Gla
ss B
ottle
(187
mL)
PE
T B
ottle
(187
mL)
Ene
rgy
(MM
Btu
)
US Canada
Multi-Serving Containers Single-Serving Containers

FRANKLIN ASSOCIATES, A Division of ERG
CLIENTS\TETRAPAK\KC016757.doc 10.16.06 3560.00.003.002
ES-7
Transportation energy did not account for a majority of total energy requirements for the container systems. However, due to their relatively high weight, the glass bottles have significantly higher transportation requirements than the other systems. The transportation requirements of the paperboard containers and PET bottles range between 7 and 12 percent of total system energy, while the transportation requirements of the glass containers range between 22 and 27 percent of total system energy.
Energy of material resource (EMR) is an energy category that represents the use of petroleum, natural gas, or coal for the production of materials instead of for combustion as fuels. The paperboard container systems include polyethylene and polypropylene, which are derived from petroleum and natural gas; EMR ranges between 15 and 22 percent of total energy for the paperboard systems. PET resin is also derived from petroleum and natural gas; EMR accounts for approximately 30 percent of total energy for the PET systems. The glass systems have a negligible EMR.
The EMR of the paperboard and PET systems can be recovered if combustion with energy recovery is used for waste management. However, based on the combustion practices in the United States and Canada, a relatively small percentage of total system energy is recovered. After materials are recovered for recycling, 14 percent of postconsumer solid waste is combusted in the United States and 5 percent is combusted in Canada. When the heating values of the container systems (including secondary packaging) are factored with the combustion practices in the United States, the energy recovery of the paperboard systems are approximately 4 percent of total system energy, and the energy recovery of the PET systems are 2.6 percent of total system energy. When the heating values of the container systems (including secondary packaging) are factored with the combustion practices in Canada, the energy recovery of the paperboard systems are approximately 1 percent of total system energy, and the energy recovery of the PET systems are 0.8 percent of total system energy.
The total energy requirements for each system can also be categorized by the fuels from which the energy is derived. Energy sources include fossil fuels (natural gas, petroleum, and coal) and non-fossil fuels (wood, nuclear, or hydroelectric). Compared to the glass and PET container systems, the paperboard container systems consume a lower percentage of fossil fuels and a higher percentage of wood fuel. The consumption of wood fuel is due to the combustion of wood residues at paper mills. The paperboard and PET container systems consume a comparable percentage of hydropower, which is due to the aluminum components of both systems. A significant portion of the electricity used for primary aluminum smelting is generated from hydropower. Solid Waste Solid waste is categorized into process wastes, fuel-related wastes, and postconsumer wastes. Process wastes are the solid wastes generated by the various processes throughout the life cycle of the container systems. Fuel-related wastes are the wastes from the production and combustion of fuels used for energy and transportation. Together, process wastes and fuel-related wastes are reported as industrial solid waste.

FRANKLIN ASSOCIATES, A Division of ERG
CLIENTS\TETRAPAK\KC016757.doc 10.16.06 3560.00.003.002
ES-8
Postconsumer wastes are the wastes discarded by the final users of the product. The total solid waste for the container systems are shown graphically in Figure ES-2a.
Postconsumer waste accounts for a majority of total solid waste for all container systems, especially the glass container systems. The weight of postconsumer waste is directly related to the weight of a product. The paperboard systems have the lowest weight of packaging per delivered volume of wine and the lowest total solid wastes. The glass system has the highest weight per delivered volume of wine and the highest total solid wastes.
Weight is not the only basis for evaluating a quantity of solid waste; solid waste quantities can also be evaluated on a volume basis. Landfills do not fill up because of the weight of materials, but because of the space occupied by the materials. Glass has a high density compared to paperboard and PET. When expressed on a volume basis instead of a weight basis, the solid wastes of the glass container systems do not vary as much in comparison to the paperboard and PET systems. The volumes of solid wastes are shown graphically in Figure ES-2b.
FIGURE ES-2aTotal Weight of Solid Waste for Wine Container Systems
(Pounds per 1,000 Liters of Wine)
0200400600800
100012001400160018002000
Tetra
Brik
(1 L
iter)
Tetra
Pris
ma
(1 L
iter)
Tetra
Pris
ma
(500
mL)
Gla
ss B
ottle
(750
mL)
PE
T B
ottle
(750
mL)
Tetra
Pris
ma
(250
mL)
Tetra
Pris
ma
(200
mL)
Gla
ss B
ottle
(187
mL)
PE
T B
ottle
(187
mL)
Sol
id W
aste
(lbs
)
US Canada
Multi-Serving Containers Single-Serving Containers

FRANKLIN ASSOCIATES, A Division of ERG
CLIENTS\TETRAPAK\KC016757.doc 10.16.06 3560.00.003.002
ES-9
Environmental Emissions Atmospheric and waterborne emissions for each system include process emissions and fuel emissions. Process emissions may be released from process reactions or evaporative losses, or may result from equipment leaks, venting, or other losses during production or transport of a material. Fuel emissions result from the combustion of fuels. Atmospheric and waterborne emissions arise from both process- and fuel- related activities. The predominant atmospheric emissions from the container systems include greenhouse gases (particularly carbon dioxide, methane, and nitrous oxide), volatile organic compounds (VOC), sulfur oxides, particulates, and other organic compounds. The predominant waterborne emissions from the container systems include dissolved solids, suspended solids, COD (chemical oxygen demand), BOD (biological oxygen demand), chlorides, and various metals. No firm conclusions can be made from the various atmospheric or waterborne emissions that result from the container systems. Comprehensive tables of the atmospheric and waterborne emissions are shown in Appendix C of the report. Greenhouse gas emissions are closely related to system energy, and thus the trends observed for system energy requirements also apply to system greenhouse gas emissions. The paperboard container systems have the lowest energy requirements and thus generate the lowest quantity of greenhouse gas emissions. The glass container systems have the highest energy requirements and thus generate the highest quantity of greenhouse gas emissions.
FIGURE ES-2bTotal Volume of Solid Waste for Wine Container Systems
(Cubic Yards per 1,000 Liters of Wine)
0.0
0.2
0.4
0.6
0.8
1.0
1.2
1.4Te
tra B
rik(1
Lite
r)
Tetra
Pris
ma
(1 L
iter)
Tetra
Pris
ma
(500
mL)
Gla
ss B
ottle
(750
mL)
PE
T B
ottle
(750
mL)
Tetra
Pris
ma
(250
mL)
Tetra
Pris
ma
(200
mL)
Gla
ss B
ottle
(187
mL)
PE
T B
ottle
(187
mL)
Sol
id W
aste
(cub
ic y
ards
)
US Canada
Multi-Serving Containers Single-Serving Containers

FRANKLIN ASSOCIATES, A Division of ERG
CLIENTS\TETRAPAK\KC016757.doc 10.16.06 3560.00.003.002
ES-10
The carbon dioxide emissions from combustion of wood waste (a fuel used for paperboard production) are not included in the calculation of greenhouse gas emissions. By EPA convention, carbon dioxide released by wood combustion is considered part of the natural carbon cycle. In other words, when wood is burned, carbon dioxide consumed by the tree during its growth cycle is returned to the atmosphere, so there is no net increase in atmospheric carbon dioxide.
This analysis is not an LCIA (life cycle impact assessment) and thus the impacts of various environmental emissions are not evaluated. However, this report does express the emissions of greenhouse gases as carbon dioxide equivalents, which is an LCIA tool. Carbon dioxide equivalents use global warming potentials developed by the International Panel on Climate Change (IPCC) to normalize the various greenhouse gases (including carbon dioxide, methane, and nitrous oxide) to a single value -- the equivalent weight of carbon dioxide. Due to our understanding of the relationship between greenhouse gases and global warming, it is reasonable to develop conclusions based on the quantity of greenhouse gases generated by a system. The carbon dioxide equivalents for the wine container systems are shown graphically in Figure ES-3.
FIGURE ES-3Total Greenhouse Gas Emissions for Wine Container Systems
(Pounds of CO2 Equivalents per 1,000 Liters of Wine)
0
400
800
1200
1600
2000
2400
2800
Tetra
Brik
(1 L
iter)
Tetra
Pris
ma
(1 L
iter)
Tetra
Pris
ma
(500
mL)
Gla
ss B
ottle
(750
mL)
PE
T B
ottle
(750
mL)
Tetra
Pris
ma
(250
mL)
Tetra
Pris
ma
(200
mL)
Gla
ss B
ottle
(187
mL)
PE
T B
ottle
(187
mL)
Car
bon
Dio
xide
Equ
ival
ents
(lbs
)
US Canada
Multi-Serving Containers Single-Serving Containers
LCI CONCLUSIONS A life cycle inventory (LCI) is an environmental profile that expresses environmental burdens from the perspective of energy consumption, solid waste generation, atmospheric emissions, and waterborne emissions. This LCI evaluated three types of container systems and found significant conclusions in three categories of

FRANKLIN ASSOCIATES, A Division of ERG
CLIENTS\TETRAPAK\KC016757.doc 10.16.06 3560.00.003.002
ES-11
environmental burdens: 1) energy requirements, 2) solid waste generation, and 3) greenhouse gas emissions. Conclusions within each of these categories are summarized below. Energy Requirements
• There is a correlation between system weight and energy requirements. The paperboard systems have the lowest weight per delivered volume of wine and the lowest total energy requirements; the glass systems have the highest weight per delivered volume of wine and the highest total energy requirements.
• The production of container materials accounts for the largest share of total energy for all container systems.
• The glass bottles have significantly higher transportation requirements than the paperboard containers or PET bottles. In particular, the transportation between winery and distribution center accounts for the majority of transportation requirements for the life cycle of the glass bottle system.
• Compared to the glass and PET container systems, the paperboard container systems consume a lower percentage of fossil fuels (petroleum, natural gas, and coal) and a higher percentage of wood fuel due to the combustion of wood residues at paper mills.
• The energy of material resource (EMR) is highest for the PET bottle system because PET is derived from petroleum feedstocks. The paperboard container systems also have an EMR, which is attributable to the polyethylene and polypropylene components of the containers. The glass systems have a negligible EMR.
• Waste management represents a small portion of total system energy. Changes in waste management scenarios do not significantly affect total energy requirements.
• The paperboard and PET systems contain a high percentage of combustible material, but combustion with energy recovery accounts for a small percentage of the postconsumer solid waste management in the United States and Canada. Thus, while the paperboard and PET container systems have a higher percentage of combustible material than the glass container systems, less than four percent of total system energy (depending on country and container system) is recovered with current solid waste management practices.
Solid Wastes
• The weight of postconsumer waste is directly related to the weight the container system. The paperboard systems have the lowest weight per delivered volume of wine and the lowest total solid wastes. The glass system has the highest weight per delivered volume of wine and the highest total solid wastes.

FRANKLIN ASSOCIATES, A Division of ERG
CLIENTS\TETRAPAK\KC016757.doc 10.16.06 3560.00.003.002
ES-12
• When expressed on a volume basis, the solid wastes of the container systems are closer than when expressed on a weight basis. This is attributable to the high density of glass; a given weight of glass will occupy significantly less volume than an equal weight of paperboard or plastic.
• The solid wastes of the container systems were not sensitive to a change in waste management scenarios.
Greenhouse Gas Emissions
• Greenhouse gas emissions are closely related to system energy, and thus the conclusions for system energy requirements also apply to system greenhouse gas emissions.
• The only exception to the above correlation is the portion of system energy that is related to energy of material resource (EMR). EMR is an energy category that does not result in greenhouse gas emissions. Both the PET and paperboard systems include a significant EMR, and thus this exception did not change the conclusions of this analysis. The paperboard systems have the lowest total energy as well as the lowest greenhouse gas emissions; the glass systems have the highest total energy as well as the highest greenhouse gas emissions.

FRANKLIN ASSOCIATES, A Division of ERG
CLIENTS\TETRAPAK\KC016757.doc 10.16.06 3560.00.003.002
1-1
CHAPTER 1
SYSTEM DESCRIPTIONS AND LCI ASSUMPTIONS INTRODUCTION An LCI (life cycle inventory) quantifies the resource use (energy and material consumption) and environmental emissions associated with the life cycles of specific products. The purpose of this study is to use LCI to evaluate the energy and material use, solid wastes, and atmospheric and waterborne emissions associated with wine containers. As a part of Tetra Pak’s commitment to sustainability, Tetra Pak will use the results of this study to evaluate the environmental footprint of its product in comparison to alternative products. Systems Studied This LCI evaluates three types of container systems for wine: paperboard containers, glass bottles, and PET bottles. The paperboard containers (which are composed of a laminate of paperboard, aluminum, and polyolefin resins) are manufactured by Tetra Pak and include the Tetra Brik™ and Tetra Prisma™. The paperboard containers range from a capacity of 200 milliliters to 1 liter. The alternative systems are 187-milliliter and 750-milliliter glass bottles, and 187-milliliter and 750-milliliter PET bottles. The secondary and tertiary packaging used for transporting filled containers from the winery (the site of filling) to a distribution center are also included.
The systems of this analysis include single- and multi-serving containers. The single-serving containers range from 187 to 250 milliliters. The multi-serving containers range from 500 milliliters to 1 liter. The components and weights of the container systems are shown in Table 1-1a. Container weights were based on data provided by Tetra Pak as well as measurements of containers purchased from retailers. The percentage weight of each system component is shown in Table 1-1b.
A functional unit of equivalent volume was chosen for this analysis. Results are expressed on the basis of the delivery of 1,000 liters of wine. For the single-serving containers, this is equivalent to 4,000 250-milliliter containers, 5,000 200-milliliter containers, or 5,348 187-milliliter containers. For the multi-serving containers, this is equivalent to 2,000 500-liter containers, 1,333 750-milliliter containers, or 1,000 1-liter containers. A conventional case of wine contains 12 750-milliliter glass bottles, for a total volume of 9 liters. The basis of 1,000 liters of wine is thus equivalent to 111 cases of wine.

FRANKLIN ASSOCIATES, A Division of ERG
CLIENTS\TETRAPAK\KC016757.doc 10.16.06 3560.00.003.002
1-2
Container Closure Seconday/Tertiary Packaging Total
Bleached Paperboard
Primary Aluminum
Low Density Poly-
ethylenePoly-
propylene Glass PETPoly-
propylene
High Density Poly-
ethylene Aluminum
Virgin Unbleached Paperboard
CarrierCorrugated
Box
Recycled Paperboard
Liner
Weight of all System
ComponentsTetra Brik (1 L) 0.056 0.0031 0.010 0.0024 0.0024 0.051 0.13Tetra Prisma (1 L) 0.053 0.0042 0.016 0.0028 0.0024 0.0024 0.060 0.14Tetra Prisma (500 mL) 0.031 0.0026 0.0094 0.0018 0.0024 0.0024 0.035 0.085Tetra Prisma (250 mL) * 0.019 0.0012 0.0051 0.0011 negligible 0.0095 0.018 0.054Tetra Prisma (200 mL) * 0.014 0.0010 0.0029 8.6E-04 negligible 0.0085 0.016 0.043Glass bottle (750 mL) 1.16 0.064 0.041 1.27Glass bottle (187 mL) * 0.33 0.0042 0.024 0.000 0.36PET bottle (750 mL) 0.119 0.0101 0.000 0.063 0.19PET bottle (187 mL) * 0.049 0.0042 0.021 0.024 0.098
Container Closure Seconday/Tertiary Packaging Total
Bleached Paperboard
Primary Aluminum
Low Density Poly-
ethylenePoly-
propylene Glass PETPoly-
propylene
High Density Poly-
ethylene Aluminum
Virgin Unbleached Paperboard
CarrierCorrugated
Box
Recycled Paperboard
LinerAll System
ComponentsTetra Brik (1 L) 44.6% 2.4% 8.2% 0.0% 0.0% 0.0% 1.9% 1.9% 0.0% 0.0% 40.9% 0.0% 100%Tetra Prisma (1 L) 37.6% 3.0% 11.3% 2.0% 0.0% 0.0% 1.7% 1.7% 0.0% 0.0% 42.7% 0.0% 100%Tetra Prisma (500 mL) 36.8% 3.1% 11.0% 2.1% 0.0% 0.0% 2.8% 2.8% 0.0% 0.0% 41.3% 0.0% 100%Tetra Prisma (250 mL) * 35.7% 2.2% 9.4% 2.1% 0.0% 0.0% 0.0% 0.0% negligible 17.7% 32.8% 0.0% 100%Tetra Prisma (200 mL) * 32.4% 2.4% 6.6% 2.0% 0.0% 0.0% 0.0% 0.0% negligible 19.8% 36.8% 0.0% 100%Glass bottle (750 mL) 0.0% 0.0% 0.0% 0.0% 91.7% 0.0% 0.0% 0.0% 0.0% 0.0% 5.0% 3.3% 100%Glass bottle (187 mL) * 0.0% 0.0% 0.0% 0.0% 92.2% 0.0% 0.0% 0.0% 1.2% 0.0% 6.6% 0.0% 100%PET bottle (750 mL) 0.0% 0.0% 0.0% 0.0% 0.0% 61.8% 0.0% 0.0% 5.3% 0.0% 33.0% 0.0% 100%PET bottle (187 mL) * 0.0% 0.0% 0.0% 0.0% 0.0% 50.2% 0.0% 0.0% 4.3% 21.1% 24.5% 0.0% 100%
* Single-serving containers are sold in 4-packs. The weights in this table include all secondary and tertiary packaging normalized to the basis of a single container.
(% weight of component materials for each wine container system)
Table 1-1b
Table 1-1a
SYSTEM MATERIALS AND WEIGHTS FOR WINE PACKAGING(lbs per wine container system)
SYSTEM MATERIALS AND WEIGHT PERCENTAGES FOR WINE PACKAGING

FRANKLIN ASSOCIATES, A Division of ERG
CLIENTS\TETRAPAK\KC016757.doc 10.16.06 3560.00.003.002
1-3
Scope and Boundaries
This analysis includes the following five steps for each container system:
1. Production of the container materials (all steps from extraction of raw materials through the production of materials that comprise the containers).
2. Fabrication of the container systems from their component materials. 3. Transport of empty containers from container producer to winery. 4. Transport of filled containers from the winery to a distribution center. (The
subsequent transportation from distribution center to retailer is not included in this analysis due to a lack of data as well as the assumption that such a transportation step is negligible in comparison to upstream transportation steps.)
5. Postconsumer disposal and recycling of the container systems, including recycling, landfill, and combustion scenarios for the United States and Canada.
Limitations and Assumptions
The paperboard, aluminum, glass, and plastic included in this analysis are common materials for which Franklin Associates has life cycle data of high quality. Key assumptions of the LCI model are as follows:
• The majority of processes included in this LCI occur in the United States and thus the fuel profile of the average U.S. electricity grid is used to represent the electricity requirements for these processes. The only exception to this assumption is the supply chain for primary aluminum production; bauxite mining, alumina refining, and aluminum smelting were modeled with electricity grids representative of their geographies and manufacturing technologies.
• Labels for glass and PET bottles represent less than 0.5 percent by weight of the container and are thus excluded from this analysis.
• Closures were not modeled for the single-serving Tetra Prisma (200- and 250-milliliters). The single-serving Tetra Prisma uses an aluminum foil strip closure that accounts for less than 0.8 percent of the weight of the Tetra Prisma containers. The Tetra Prisma container also includes an aluminum layer that represents between 2.2 and 2.4 percent of total system weight; this aluminum component was included in the LCI.
• Closures were not modeled for the 750-milliliter glass bottle. A variety of closures can be used for the 750-milliliter glass bottle, including a natural cork stopper, a plastic stopper, or an aluminum twist cap. These closures account for between 1 and 2 percent of total container weight. Based on research of the material and energy flows of natural cork production, it was determined that the inclusion of a natural cork closure would have a negligible influence on the LCI results. A plastic stopper, made from polyurethane or styrene-butadiene-styrene (SBS) polymers, would

FRANKLIN ASSOCIATES, A Division of ERG
CLIENTS\TETRAPAK\KC016757.doc 10.16.06 3560.00.003.002
1-4
introduce an energy of material resource (EMR) to the 750-milliliter glass bottle system. Similarly, due to the high electricity requirements of aluminum smelting, an aluminum twist cap would increase the energy requirements of the 750-milliliter glass bottle system. Due to time and budgetary concerns, the plastic and aluminum closures were not included for the 750-milliliter glass bottle system. While the inclusion of these closures would increase the total energy of the 750-milliliter glass bottle system, it was determined that it would not change any conclusions of this analysis.
• When PET bottles are used for wine or other beverages, a barrier is necessary to prevent oxygen transport through the walls of the bottle. The PET bottles in this analysis use an oxygen scavenger that accounts for less than 5 percent of the weight of the PET bottle. The oxygen scavenger is a proprietary additive that is derived from PET and is made by the same producers who make bottle-grade PET. This analysis does not model the oxygen scavenger separately, but assumes that conventional PET resin is representative of the entire weight of the PET bottle.
• Due to a lack of available data, the VOCs (volatile organic compounds) that may be released from label printing are not included for the glass and PET container systems. Data for VOC emissions from the printing of the Tetra Brik and Tetra Prisma containers are included.
• Data for the filling of containers are not included. It is assumed that the energy requirements for filling containers are comparable for all three systems of this analysis. Wine filling occurs at ambient temperatures; no heating processes are required as may be the case for other beverage or food products.
• The boxes used for transporting filled wine containers from the winery to distribution center are made of corrugated paperboard. Corrugated paperboard is a composite of a fluted medium sandwiched between two layers of paperboard. The recycled content of the corrugated material is based on average industry data.
• Tertiary packaging (such as stretch wrap used for pallets) represents less than 0.5 percent by weight of the container systems and is thus not included in this LCI.
• Based on 2003 statistics on municipal solid waste in the U.S., this analysis assumes that 86 percent of postconsumer waste is landfilled and the remaining 14 percent is combusted with energy recovery. The corresponding statistics for postconsumer waste in Canada are 95 percent landfill and 5 percent combustion with energy recovery. These percentages represent the fate of materials after material recovery for recycling has occurred.
• The paperboard containers are assumed to have a HHV (higher heating value) of 10,395 Btu/lb. This HHV is calculated from the known heating values of the component materials (paperboard, polyethylene, and aluminum). This HHV is used only in the calculations of energy recovery from combustion of postconsumer waste.

FRANKLIN ASSOCIATES, A Division of ERG
CLIENTS\TETRAPAK\KC016757.doc 10.16.06 3560.00.003.002
1-5
• Based on data provided by Tetra Pak, the postconsumer recycling rates for the paperboard containers are 5 percent in the U.S. and 27 percent in Canada.
• The postconsumer recycling rates for glass wine bottles are assumed to be 15 percent in the United States and 30 percent in Canada. The recycling rate for glass in the United States is based on statistics compiled by Franklin Associates. No statistics are available to verify the Canadian recycling rate of glass wine bottles; a rate of 30 percent was chosen to test the sensitivity of the LCI results to a change in recycling rates.
• The postconsumer recycling rates for PET bottles are assumed to be 22 percent for the United States and 36 percent for Canada. The recycling rate for PET bottles in the United States is based on 2004 statistics provided by the American Plastics Council (APC). The recycling rate for PET bottles in Canada is based on 2004 statistics provided by the Environment and Plastics Industry Council (EPIC).
• The data in the Franklin Associates LCI models include transportation requirements between manufacturing steps. For upstream processes (such as crude oil extraction, polyethylene production, roundwood harvesting, glass sand mining, aluminum production, and paperboard manufacture) the transportation modes and distances are based on average industry data. For the final steps of container production (processes unique to this LCI) the transportation requirements were based on data provided by Tetra Pak and assumptions by Franklin Associates.
• The transportation of filled wine containers from distribution center to retailer is not included in this analysis. It is difficult to characterize this transportation step because more than one type of product is shipped in the same truck; distribution centers send trucks holding many types of products to retailers. The distances between distribution centers and retailers are assumed to be significantly shorter than the distances from wine producers and distribution centers. Thus, the transportation from distribution center to retailer is not included in this analysis. The transportation requirements for the final manufacturing and distribution steps of the container systems are shown in Table 1-2.
From To miles ton-miles Truck RailTetra Pak (Tetra Brik and Tetra Prisma)
Paperboard to container fabrication Evadale, TX Denton, TX 330 165 33% 67%Polyethylene production to container fabrication Houston, TX Denton, TX 280 140 50% 50%Primary aluminum production to container fabrication Tennessee Denton, TX 825 413 50% 50%Container fabrication to winery Denton, TX Northern California 1675 837.5 100% 0%Filled container from winery to eistribution Center Northern California Average US/Canada 1500 750 100% 0%
GlassGlass bottle production to winery for filling Northern California Northern California 100 50 100% 0%Filled glass bottle from winery to distribution center Northern California Average US/Canada 1500 750 100% 0%
PlasticPET resin production to PET bottle production Houston, TX Northern California 1900 950 0% 100%PET bottle production to winery Northern California Northern California 100 50 100% 0%Filled PET bottle from winery to distribution center Northern California Average US/Canada 1500 750 100% 0%
Source: Franklin Associates, A Division of ERG
Mode (% share)
Table 1-2
TRANSPORTATION REQUIREMENTS FOR WINE PACKAGING

FRANKLIN ASSOCIATES, A Division of ERG
CLIENTS\TETRAPAK\KC016757.doc 10.16.06 3560.00.003.002
2-1
CHAPTER 2
LCI RESULTS AND CONCLUSIONS FOR MULTI-SERVING WINE CONTAINERS
INTRODUCTION
An LCI (life cycle inventory) quantifies the resource use (energy and material consumption) and environmental emissions associated with the life cycles of specific products. The purpose of this study is to use LCI to evaluate the energy and material use, solid wastes, and atmospheric and waterborne emissions associated with packaging used for wine. Three types of packaging were modeled: paperboard containers (made from a composite of bleached paper, aluminum foil, and polyolefin resins), glass bottles, and PET (polyethylene terephthalate) bottles.
Wine packaging is available in single-serving and multi-serving sizes, ranging from 187-milliliter containers to 1-liter containers. This chapter focuses on the multi-serving containers, which have volumes of 500-milliters or greater. This includes three types of paperboard containers (1-liter Tetra Brik, 1-liter Tetra Prisma, and 500-milliliter Tetra Prisma), one glass container (750-milliliter glass bottle), and one plastic container (750-milliliter PET bottle). Details on the composition of these containers are provided in Chapter 1 (“System Descriptions and LCI Assumptions”) of this report.
All results are expressed on an equivalent volume basis: the delivery of 1,000 liters of wine. This is equivalent to 2,000 500-liter containers, 1,333 750-milliliter containers, or 1,000 1-liter containers. A conventional case of wine contains 12 750-milliliter glass bottles, for a total volume of 9 liters. The basis of 1,000 liters of wine is thus equivalent to 111 cases of wine.
In response to the different solid waste management practices between the United States and Canada, one goal of this study was to evaluate the sensitivity of environmental burdens to different disposal and recycling scenarios. Of the postconsumer solid waste that remains after material recovery for recycling, 86 percent is landfilled in the U.S. and 95 percent is landfilled in Canada. The remaining solid waste is combusted with energy recovery. A change in the split between landfilling and combustion with energy recovery will change the solid wastes and potential energy recovery of a system. A change in recycling rates not only affects the environmental burdens of waste management, but also affects upstream manufacturing processes. LCI methodology allocates energy and material flows according to the percentage of a product’s material that is recovered for recycling and whether the material is recycled into the same product (closed loop recycling) or a different product (open loop recycling). A detailed discussion of the Franklin Associates recycling methodology is provided in Appendix D. Due to the different waste management scenarios between the United States and Canada, the results for the two countries are thus shown separately throughout this chapter.

FRANKLIN ASSOCIATES, A Division of ERG
CLIENTS\TETRAPAK\KC016757.doc 10.16.06 3560.00.003.002
2-2
The total energy consumption, solid waste generation, and greenhouse gas emissions (expressed as carbon dioxide equivalents) are summarized in Table 2-1.
The following sections discuss the categories of energy consumption, solid waste generation, and environmental emissions in greater detail. ENERGY
The total energy requirements for each system include the energy for manufacturing and transporting materials at each stage of the life cycle, as well as the energy content of fuel resources used as raw materials.
The total energy of each container system varies slightly between the United States and Canadian scenarios; any difference in the results between the United States and Canadian scenarios is due solely to the different waste management practices of the two countries. The total energies of the paperboard container systems range between 3 and 5 million Btu per 1,000 liters of delivered wine. The total energy of the PET container system is approximately 8 million Btu per 1,000 liters of delivered wine. The total energy of the glass container system is approximately 11 million Btu per 1,000 liters of delivered wine.
Energy(million Btu)
Tetra Brik (1 Liter) 3.26 MM Btu 143 lbs 0.22 cu yd 333 lbsTetra Prisma (1 Liter) 3.77 MM Btu 158 lbs 0.24 cu yd 378 lbsTetra Prisma (500 mL) 4.84 MM Btu 196 lbs 0.30 cu yd 484 lbsGlass Bottle (750 mL) 10.8 MM Btu 1,545 lbs 0.60 cu yd 1,916 lbsPET Bottle (750 mL) 8.17 MM Btu 286 lbs 0.57 cu yd 922 lbs
Energy(million Btu)
Tetra Brik (1 Liter) 3.13 MM Btu 145 lbs 0.22 cu yd 327 lbsTetra Prisma (1 Liter) 3.61 MM Btu 161 lbs 0.25 cu yd 372 lbsTetra Prisma (500 mL) 4.66 MM Btu 199 lbs 0.31 cu yd 476 lbsGlass Bottle (750 mL) 10.8 MM Btu 1,344 lbs 0.52 cu yd 1,901 lbsPET Bottle (750 mL) 7.86 MM Btu 293 lbs 0.59 cu yd 899 lbs
Source: Franklin Associates, a Division of ERG
Table 2-1
Greenhouse Gases(CO2 equivalents)
Greenhouse Gases(CO2 equivalents)
CANADA
UNITED STATES
TOTAL ENERGY AND GREENHOUSE GAS EMISSIONS FOR WINE CONTAINER SYSTEMS(per 1,000 liters)
Solid Waste(weight and volume)
Solid Waste(weight and volume)

FRANKLIN ASSOCIATES, A Division of ERG
CLIENTS\TETRAPAK\KC016757.doc 10.16.06 3560.00.003.002
2-3
There is a correlation between system weight and energy requirements. The paperboard systems have the lowest weight per delivered volume of wine and the lowest total energy requirements. The glass system has the highest weight per delivered volume of wine and the highest total energy requirements.
The energy requirements for three categories – energy of material resource, process energy, and transportation energy – are discussed below. Energy of Material Resource
Energy of material resource is the energy value of fuel resources used as raw materials. As explained in the methodology appendix (Appendix A) of this report, LCI methodology assigns a fuel-energy equivalent to raw materials that are derived from fossil fuels. Therefore, the total energy requirement for coal-, natural gas-, or petroleum-based materials includes the fuel energy of the raw material (energy of material resource). No fuel-energy equivalent is assigned to combustible materials such as wood that are not major fuel sources in this country.
The paperboard and PET container systems contain plastics and thus include energy of material resource. Energy of material resource accounts for approximately 30 percent of the total energy of the PET container system and between 15 and 22 percent of the total energy of the paperboard container systems. The glass container system does not include any energy of material resource. Process Energy
Process energy includes all energy used to extract and process raw materials into usable forms, manufacture the container systems, and manage postconsumer materials. For material disposal, process energy includes diesel fuel used to run landfill equipment.
Process energy accounts for the majority of energy requirements for all container systems. Process energy is 61 to 63 percent of the total energy of the PET container system, 68 to 74 percent of the total energy of the paperboard container systems, and 73 percent of the total energy of the glass container system. Transportation Energy
Total energy requirements for each component include the energy to transport materials from each step to the next. Examples of the transportation steps included in this analysis include crude oil to refineries, roundwood to paper mills, empty containers to wineries, and filled containers to distribution centers.
To understand their relative contribution to the entire life cycles of the container systems, the transportation of filled containers from the winery to the distribution center were isolated in this analysis.

FRANKLIN ASSOCIATES, A Division of ERG
CLIENTS\TETRAPAK\KC016757.doc 10.16.06 3560.00.003.002
2-4
The glass container system has the highest transportation energy. Transportation accounts for approximately 27 percent of the total energy of the glass bottle system, between 10 and 12 percent of the total energy of the paperboard systems, and approximately 8 percent of the total energy of the PET system.
Tables 2-2a and 2-2b show detailed energy requirements by category (process energy, transport energy, and energy of material resource) for the two container systems. Table 2-2a is representative of postconsumer waste management in the United States, and Table 2-2b is representative of postconsumer waste management in Canada. If the energy of one system is 10 percent different from another, it can be concluded that the difference is significant. Percent difference is defined as the difference between two values divided by the average of the two values. (See Appendix B for an explanation of this certainty range.)
ProcessTranspor-
tation
Energy of Material Resource Total Process
Transportation
Energy of Material Resource Total
Tetra Brik (1 Liter)Materials Production 1.65 0.048 0.50 2.20 50.6% 1.5% 15.5% 67.5%Container Production 0.17 0.10 0 0.26 5.1% 3.0% 0.0% 8.1%Secondary/Tertiary Packaging Production 0.57 0.050 3.2E-04 0.62 17.4% 1.5% 0.0% 19.0%Transportation (from Winery to Distribution Center) 0 0.16 0 0.16 0.0% 5.0% 0.0% 5.0%Waste Management 0.015 9.4E-04 0 0.016 0.4% 0.0% 0.0% 0.5%Total 2.40 0.36 0.50 3.26 73.5% 11.0% 15.5% 100%
Tetra Prisma (1 Liter)Materials Production 1.78 0.054 0.74 2.57 47.2% 1.4% 19.6% 68.2%Container Production 0.17 0.11 0 0.27 4.4% 2.8% 0.0% 7.3%Secondary/Tertiary Packaging Production 0.67 0.059 3.8E-04 0.72 17.7% 1.6% 0.0% 19.2%Transportation (from Winery to Distribution Center) 0 0.18 0 0.18 0.0% 4.8% 0.0% 4.8%Waste Management 0.016 1.0E-03 0 0.017 0.4% 0.0% 0.0% 0.5%Total 2.62 0.40 0.74 3.77 69.7% 10.7% 19.7% 100%
Tetra Prisma (500 mL)Materials Production 2.18 0.068 1.05 3.30 45.0% 1.4% 21.6% 68.0%Container Production 0.33 0.13 0 0.46 6.9% 2.6% 0.0% 9.5%Secondary/Tertiary Packaging Production 0.78 0.069 4.4E-04 0.85 16.0% 1.4% 0.0% 17.5%Transportation (from Winery to Distribution Center) 0 0.22 0 0.22 0.0% 4.6% 0.0% 4.6%Waste Management 0.019 0.0012 0 0.020 0.4% 0.0% 0.0% 0.4%Total 3.31 0.49 1.05 4.84 68.4% 10.0% 21.6% 100%
Glass Bottle (750 mL)Materials Production 6.64 0.21 0 6.85 61.2% 2.0% 0.0% 63.2%Container Production 0 0.45 0 0.45 0.0% 4.2% 0.0% 4.2%Secondary/Tertiary Packaging Production 1.28 0.12 5.3E-04 1.40 11.8% 1.1% 0.0% 12.9%Transportation (from Winery to Distribution Center) 0 2.13 0 2.13 0.0% 19.6% 0.0% 19.6%Waste Management 0.0104 7.1E-04 0 0.011 0.1% 0.0% 0.0% 0.1%Total 7.93 2.92 5.3E-04 10.8 73.1% 26.9% 0.0% 100%
PET Bottle (750 mL)Materials Production 3.14 0.18 2.51 5.84 38.4% 2.3% 30.7% 71.4%Container Production 0.91 0.017 0 0.93 11.2% 0.2% 0.0% 11.4%Secondary/Tertiary Packaging Production 0.93 0.083 5.3E-04 1.02 11.4% 1.0% 0.0% 12.4%Transportation (from Winery to Distribution Center) 0 0.32 0 0.32 0.0% 4.0% 0.0% 4.0%Waste Management 0.062 0.0050 0 0.067 0.8% 0.1% 0.0% 0.8%Total 5.05 0.61 2.51 8.17 61.8% 7.5% 30.7% 100%
Source: Franklin Associates, a Division of ERG
Table 2-2a
ENERGY BY LIFE CYCLE PHASE AND ENERGY CATEGORY FOR WINE CONTAINER SYSTEMS - UNITED STATES(Million Btu per 1,000 liters)
Energy Category Energy Category (percent)

FRANKLIN ASSOCIATES, A Division of ERG
CLIENTS\TETRAPAK\KC016757.doc 10.16.06 3560.00.003.002
2-5
Energy Profile
The total energy requirements for each system can also be categorized by the fuels from which energy is derived. Energy sources include fossil fuels (natural gas, petroleum, and coal) and non-fossil fuels. Non-fossil fuels include nuclear energy, hydroelectric energy, and energy produced from wood wastes at pulp and paper mills.
Compared to the glass and PET container systems, the paperboard container systems consume a lower percentage of fossil fuels (petroleum, natural gas, and coal) and a higher percentage of wood fuel. Two to three percent of the total energy of the paperboard and PET container systems is from hydroelectric power.
Wood combustion, a significant portion of the energy profile of the paperboard container systems, can be attributed to the combustion of wood at paper mills. The smelting of aluminum relies on a significant percentage of hydroelectric power, and thus containers that include aluminum have a higher share of hydroelectric power than container systems that do not include aluminum.
ProcessTranspor-
tation
Energy of Material Resource Total Process
Transportation
Energy of Material Resource Total
Tetra Brik (1 Liter)Materials Production 1.50 0.044 0.47 2.02 48.0% 1.4% 15.1% 64.5%Container Production 0.17 0.10 0 0.26 5.3% 3.1% 0.0% 8.5%Secondary/Tertiary Packaging Production 0.57 0.050 3.2E-04 0.62 18.2% 1.6% 0.0% 19.8%Transportation (from Winery to Distribution Center) 0 0.16 0 0.16 0.0% 5.2% 0.0% 5.2%Waste Management 0.060 0.0037 0 0.064 1.9% 0.1% 0.0% 2.0%Total 2.30 0.36 0.47 3.13 73.5% 11.4% 15.1% 100%
Tetra Prisma (1 Liter)Materials Production 1.63 0.050 0.68 2.36 45.1% 1.4% 18.9% 65.4%Container Production 0.17 0.11 0 0.27 4.6% 3.0% 0.0% 7.6%Secondary/Tertiary Packaging Production 0.67 0.059 3.8E-04 0.72 18.4% 1.6% 0.0% 20.1%Transportation (from Winery to Distribution Center) 0 0.18 0 0.18 0.0% 5.0% 0.0% 5.0%Waste Management 0.066 0.0041 0 0.070 1.8% 0.1% 0.0% 1.9%Total 2.53 0.40 0.68 3.61 70.0% 11.1% 18.9% 100%
Tetra Prisma (500 mL)Materials Production 2.01 0.063 0.98 3.05 43.1% 1.4% 21.0% 65.4%Container Production 0.33 0.13 0 0.46 7.2% 2.7% 0.0% 9.9%Secondary/Tertiary Packaging Production 0.78 0.069 4.4E-04 0.85 16.7% 1.5% 0.0% 18.2%Transportation (from Winery to Distribution Center) 0 0.22 0 0.22 0.0% 4.7% 0.0% 4.7%Waste Management 0.078 0.0049 0 0.083 1.7% 0.1% 0.0% 1.8%Total 3.19 0.48 0.98 4.66 68.6% 10.4% 21.0% 100%
Glass Bottle (750 mL)Materials Production 6.58 0.19 0 6.77 61.1% # 1.8% # 0.0% 62.9%Container Production 0 0.45 0 0.45 0.0% # 4.2% # 0.0% 4.2%Secondary/Tertiary Packaging Production 1.28 0.12 5.3E-04 1.40 11.9% # 1.1% # 0.0% 13.0%Transportation (from Winery to Distribution Center) 0 2.13 0 2.13 0.0% # 19.8% # 0.0% 19.8%Waste Management 0.0100 6.2E-04 0 0.0106 0.1% # 0.0% # 0.0% 0.1%Total 7.86 2.90 5.3E-04 10.8 73.1% 26.9% 0.0% 100%
PET Bottle (750 mL)Materials Production 2.99 0.17 2.32 5.49 38.1% 2.2% 29.5% 69.8%Container Production 0.91 0.017 0 0.93 11.6% 0.2% 0.0% 11.8%Secondary/Tertiary Packaging Production 0.93 0.083 5.3E-04 1.02 11.9% 1.0% 0.0% 12.9%Transportation (from Winery to Distribution Center) 0 0.32 0 0.32 0.0% 4.1% 0.0% 4.1%Waste Management 0.095 0.0076 0 0.103 1.2% 0.1% 0.0% 1.3%Total 4.93 0.60 2.32 7.86 62.8% 7.7% 29.5% 100%
Source: Franklin Associates, a Division of ERG
Table 2-2b
ENERGY BY LIFE CYCLE PHASE AND ENERGY CATEGORY FOR WINE CONTAINER SYSTEMS - CANADA(Million Btu per 1,000 liters)
Energy Category Energy Category (percent)

FRANKLIN ASSOCIATES, A Division of ERG
CLIENTS\TETRAPAK\KC016757.doc 10.16.06 3560.00.003.002
2-6
Tables 2-3a and 2-3b show the fuel profiles for wine container systems in the United States and Canada, respectively. Table 2-3a is representative of postconsumer waste management in the United States, and Table 2-3b is representative of postconsumer waste management in Canada.
Nat. Gas Petroleum Coal Hydropower Nuclear Wood Other TotalTetra Brik (1 Liter)
Materials Production 0.75 0.27 0.37 0.053 0.042 0.70 0.023 2.20Container Production 0.044 0.098 0.092 0.0042 0.022 0 0.0043 0.26Secondary/Tertiary Packaging Production 0.10 0.067 0.20 0.0039 0.021 0.22 0.0039 0.62Transportation (from Winery to Distribution Center) 0.0077 0.15 0.0040 1.9E-04 0.0010 0 2.0E-04 0.16Waste Management 0.0057 0.0052 0.0034 1.6E-04 8.7E-04 0 1.6E-04 0.016Total 0.90 0.58 0.68 0.061 0.087 0.92 0.032 3.26Percent Total 28% 18% 21% 2% 3% 28% 1% 100%
Tetra Prisma (1 Liter)Materials Production 1.00 0.35 0.41 0.071 0.049 0.66 0.031 2.57Container Production 0.045 0.11 0.092 0.0042 0.022 0 0.0043 0.27Secondary/Tertiary Packaging Production 0.12 0.078 0.24 0.0046 0.024 0.26 0.0045 0.72Transportation (from Winery to Distribution Center) 0.0086 0.17 0.0045 2.2E-04 0.0011 0 2.3E-04 0.18Waste Management 0.0062 0.0057 0.0038 1.8E-04 9.5E-04 0 1.7E-04 0.017Total 1.18 0.70 0.75 0.080 0.098 0.92 0.041 3.77Percent Total 31% 19% 20% 2% 3% 24% 1% 100%
Tetra Prisma (500 mL)Materials Production 1.36 0.47 0.50 0.088 0.061 0.78 0.043 3.30Container Production 0.085 0.13 0.18 0.0083 0.044 0 0.0084 0.46Secondary/Tertiary Packaging Production 0.14 0.091 0.28 0.0053 0.028 0.30 0.0053 0.85Transportation (from Winery to Distribution Center) 0.011 0.20 0.0054 2.6E-04 0.0014 0 2.8E-04 0.22Waste Management 0.0074 0.0070 0.0045 2.1E-04 0.0011 0 2.1E-04 0.020Total 1.60 0.90 0.97 0.10 0.14 1.08 0.057 4.84Percent Total 33% 19% 20% 2% 3% 22% 1% 100%
Glass Bottle (750 mL)Materials Production 4.37 1.17 1.04 0.038 0.20 0 0.036 6.85Container Production 0.022 0.42 0.011 5.4E-04 0.0029 0 5.7E-04 0.45Secondary/Tertiary Packaging Production 0.23 0.16 0.56 0.011 0.058 0.36 0.011 1.40Transportation (from Winery to Distribution Center) 0.10 1.96 0.053 0.0025 0.014 0 0.0027 2.13Waste Management 5.4E-04 0.010 1.8E-05 1.4E-05 7.2E-05 0 8.9E-07 0.011Total 4.73 3.72 1.67 0.052 0.28 0.36 0.050 10.8Percent Total 44% 34% 15% 0% 3% 3% 0% 100%
PET Bottle (750 mL)Materials Production 2.15 2.37 0.87 0.23 0.16 0 0.061 5.84Container Production 0.18 0.063 0.52 0.024 0.13 0 0.024 0.93Secondary/Tertiary Packaging Production 0.16 0.11 0.33 0.0064 0.034 0.36 0.0064 1.02Transportation (from Winery to Distribution Center) 0.015 0.30 0.0080 3.9E-04 0.0021 0 4.1E-04 0.32Waste Management 0.011 0.018 0.029 0.0013 0.0071 0 0.0013 0.067Total 2.52 2.86 1.75 0.26 0.33 0.36 0.093 8.17Percent Total 31% 35% 21% 3% 4% 4% 1% 100%
Source: Franklin Associates, a Division of ERG
Table 2-3a
FUEL PROFILE FOR WINE CONTAINER SYSTEMS - UNITED STATES(Million Btu per 1,000 liters)

FRANKLIN ASSOCIATES, A Division of ERG
CLIENTS\TETRAPAK\KC016757.doc 10.16.06 3560.00.003.002
2-7
Energy Recovery
The total energy requirements for each system may be reduced by the energy recovered by waste-to-energy combustion of postconsumer materials. Based on 2003 statistics, 14 percent of municipal solid waste in the U.S. is incinerated with energy recovery. Approximately 5 percent of municipal solid waste in Canada is incinerated with energy recovery. These percentages represent the fate of materials after material recovery for recycling has occurred.
In addition to the percentage of a waste stream that is combusted, the extent of energy recovery also depends on the heating value of waste materials. The estimated heating value of the Tetra Brik and Tetra Prisma is 9,776 Btu/lb; the closures for these containers have an estimated heating value of 18,100 Btu/lb. The estimated heating value of PET bottles is 9,900 Btu/lb. Glass is a non-combustible material and thus has no potential for energy recovery from combustion. Secondary packaging also has the potential for energy recovery; corrugated boxes, which are used by all systems of this analysis, have a heating value of 8,947 Btu/lb.
Nat. Gas Petroleum Coal Hydropower Nuclear Wood Other TotalTetra Brik (1 Liter)
Materials Production 0.69 0.25 0.34 0.052 0.039 0.62 0.022 2.02Container Production 0.044 0.098 0.092 0.0042 0.022 0 0.0043 0.26Secondary/Tertiary Packaging Production 0.10 0.067 0.20 0.0039 0.021 0.22 0.0039 0.62Transportation (from Winery to Distribution Center) 0.0077 0.15 0.0040 1.9E-04 0.0010 0 2.0E-04 0.16Waste Management 0.030 0.0092 0.019 8.6E-04 0.0046 0 8.6E-04 0.064Total 0.88 0.57 0.66 0.061 0.088 0.84 0.031 3.13Percent Total 28% 18% 21% 2% 3% 27% 1% 100%
Tetra Prisma (1 Liter)Materials Production 0.92 0.32 0.38 0.070 0.046 0.59 0.029 2.36Container Production 0.045 0.11 0.092 0.0042 0.022 0 0.0043 0.27Secondary/Tertiary Packaging Production 0.12 0.078 0.24 0.0046 0.024 0.26 0.0045 0.72Transportation (from Winery to Distribution Center) 0.0086 0.17 0.0045 2.2E-04 0.0011 0 2.3E-04 0.18Waste Management 0.032 0.010 0.020 9.4E-04 0.0050 0 9.4E-04 0.070Total 1.13 0.69 0.73 0.080 0.10 0.84 0.039 3.61Percent Total 31% 19% 20% 2% 3% 23% 1% 100%
Tetra Prisma (500 mL)Materials Production 1.27 0.44 0.46 0.088 0.058 0.69 0.040 3.05Container Production 0.085 0.13 0.18 0.0083 0.044 0 0.0084 0.46Secondary/Tertiary Packaging Production 0.14 0.091 0.28 0.0053 0.028 0.30 0.0053 0.85Transportation (from Winery to Distribution Center) 0.011 0.20 0.0054 2.6E-04 0.0014 0 2.8E-04 0.22Waste Management 0.038 0.012 0.024 0.0011 0.0060 0 0.0011 0.083Total 1.54 0.88 0.95 0.10 0.14 0.99 0.055 4.66Percent Total 33% 19% 20% 2% 3% 21% 1% 100%
Glass Bottle (750 mL)Materials Production 4.35 1.15 1.01 0.036 0.19 0 0.034 6.77Container Production 0.022 0.42 0.011 5.4E-04 0.0029 0 5.7E-04 0.45Secondary/Tertiary Packaging Production 0.23 0.16 0.56 0.011 0.058 0.36 0.011 1.40Transportation (from Winery to Distribution Center) 0.10 1.96 0.053 0.0025 0.014 0 0.0027 2.13Waste Management 5.2E-04 0.010 1.6E-05 1.3E-05 6.9E-05 0 7.8E-07 0.011Total 4.71 3.69 1.63 0.050 0.27 0.36 0.048 10.8Percent Total 44% 34% 15% 0% 2% 3% 0% 100%
PET Bottle (750 mL)Materials Production 2.01 2.20 0.84 0.23 0.15 0 0.058 5.49Container Production 0.18 0.063 0.52 0.024 0.13 0 0.024 0.93Secondary/Tertiary Packaging Production 0.16 0.11 0.33 0.0064 0.034 0.36 0.0064 1.02Transportation (from Winery to Distribution Center) 0.015 0.30 0.0080 3.9E-04 0.0021 0 4.1E-04 0.32Waste Management 0.017 0.022 0.047 0.0022 0.012 0 0.0022 0.10Total 2.39 2.69 1.74 0.26 0.33 0.36 0.091 7.86Percent Total 30% 34% 22% 3% 4% 5% 1% 100%
Source: Franklin Associates, a Division of ERG
FUEL PROFILE FOR WINE CONTAINER SYSTEMS - CANADA(Million Btu per 1,000 liters)
Table 2-3b

FRANKLIN ASSOCIATES, A Division of ERG
CLIENTS\TETRAPAK\KC016757.doc 10.16.06 3560.00.003.002
2-8
The potential energy recovery from the combustion of postconsumer container systems is shown in Table 2-4. The values in Table 2-4 are based on the weights of the container systems, the national rates for combustion with energy recovery, and the heating values of component materials. Since the glass container itself is not combustible, the glass system has a lower potential energy recovery than the other container systems. The paperboard container systems have the highest potential energy recovery at 4.1 percent of total system energy in the U.S. and 1.1 percent of total system energy in Canada. These percentages are based on the higher heating values (HHV) of the recovered materials. The energy recovery shown in Table 3-4 represents the recovery of thermal energy from the combustion of solid waste, not the potential electricity generation from solid waste combustion.
Tetra Brik (1 Liter) 3.26 MM Btu 0.14 MM Btu 3.13 MM Btu 4.1%Tetra Prisma (1 Liter) 3.77 MM Btu 0.15 MM Btu 3.62 MM Btu 3.9%Tetra Prisma (500 mL) 4.84 MM Btu 0.19 MM Btu 4.65 MM Btu 3.9%Glass Bottle (750 mL) 10.85 MM Btu 0.10 MM Btu 10.75 MM Btu 0.9%PET Bottle (750 mL) 8.17 MM Btu 0.21 MM Btu 7.96 MM Btu 2.6%
Tetra Brik (1 Liter) 3.13 MM Btu 0.03 MM Btu 3.09 MM Btu 1.1%Tetra Prisma (1 Liter) 3.61 MM Btu 0.04 MM Btu 3.57 MM Btu 1.1%Tetra Prisma (500 mL) 4.66 MM Btu 0.04 MM Btu 4.61 MM Btu 1.0%Glass Bottle (750 mL) 10.76 MM Btu 0.04 MM Btu 10.73 MM Btu 0.3%PET Bottle (750 mL) 7.86 MM Btu 0.07 MM Btu 7.79 MM Btu 0.8%
Source: Franklin Associates, a Division of ERG
* Percent energy recovery is the ratio of Energy Recovery to Total Energy multiplied by 100%.
CANADA
Total Energy Energy Recovery Net Energy% Energy Recovery *
(per 1,000 liters)
UNITED STATES
Total Energy Energy Recovery Net Energy% Energy Recovery *
Table 2-4
POTENTIAL ENERGY RECOVERY FROM SOLID WASTE COMBUSTION

FRANKLIN ASSOCIATES, A Division of ERG
CLIENTS\TETRAPAK\KC016757.doc 10.16.06 3560.00.003.002
2-9
SOLID WASTE Solid waste is categorized into process wastes, fuel-related wastes, and postconsumer wastes. Process wastes are the solid wastes generated by the various processes throughout the life cycle of the container systems. Fuel-related wastes are the wastes from the production and combustion of fuels used for energy and transportation. Together, process wastes and fuel-related wastes are reported as industrial solid waste. Postconsumer wastes are the wastes discarded by the end users of the product. Solid Waste by Weight For the systems of this analysis, all process wastes occur during the production of the container materials. The subsequent life cycle phases are fabrication, transport, or postconsumer processes and do not produce significant process wastes. Unlike process wastes, which occur only during the materials production phase of this analysis, fuel-related wastes occur during all life cycle steps. Postconsumer wastes correspond directly to the weights of each container system. The paperboard systems have the lowest weight per delivered volume of wine and the lowest total solid wastes. The glass system has the highest weight per delivered volume of wine and the highest total solid wastes. Tables 2-5a and 2-5b show the solid wastes from the container systems for the United States and Canada. If the weight of industrial solid waste of one system is 25 percent different from another, it can be concluded that the difference is significant. If the weight of postconsumer solid waste of one system is 10 percent different from another, it can be concluded that the difference is significant. Percent difference is defined as the difference between two values divided by the average of the two values. (See Appendix B for an explanation of these certainty ranges.)
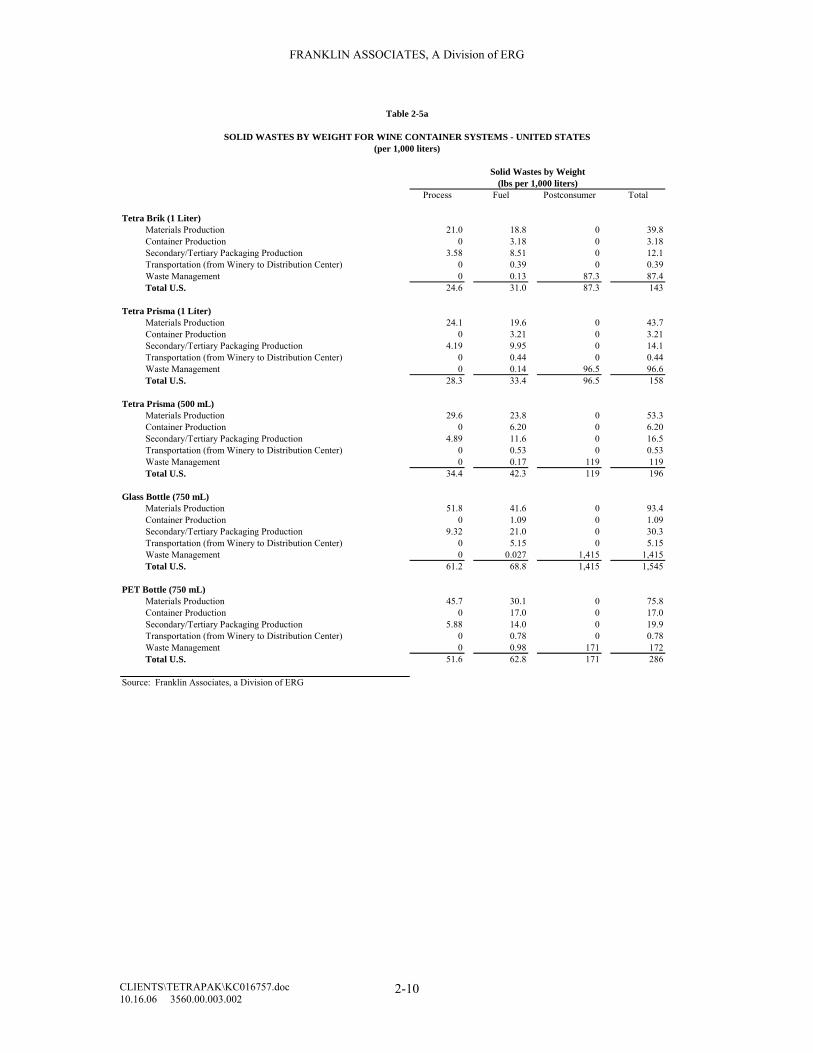
FRANKLIN ASSOCIATES, A Division of ERG
CLIENTS\TETRAPAK\KC016757.doc 10.16.06 3560.00.003.002
2-10
Process Fuel Postconsumer Total
Tetra Brik (1 Liter)Materials Production 21.0 18.8 0 39.8Container Production 0 3.18 0 3.18Secondary/Tertiary Packaging Production 3.58 8.51 0 12.1Transportation (from Winery to Distribution Center) 0 0.39 0 0.39Waste Management 0 0.13 87.3 87.4Total U.S. 24.6 31.0 87.3 143
Tetra Prisma (1 Liter)Materials Production 24.1 19.6 0 43.7Container Production 0 3.21 0 3.21Secondary/Tertiary Packaging Production 4.19 9.95 0 14.1Transportation (from Winery to Distribution Center) 0 0.44 0 0.44Waste Management 0 0.14 96.5 96.6Total U.S. 28.3 33.4 96.5 158
Tetra Prisma (500 mL)Materials Production 29.6 23.8 0 53.3Container Production 0 6.20 0 6.20Secondary/Tertiary Packaging Production 4.89 11.6 0 16.5Transportation (from Winery to Distribution Center) 0 0.53 0 0.53Waste Management 0 0.17 119 119Total U.S. 34.4 42.3 119 196
Glass Bottle (750 mL)Materials Production 51.8 41.6 0 93.4Container Production 0 1.09 0 1.09Secondary/Tertiary Packaging Production 9.32 21.0 0 30.3Transportation (from Winery to Distribution Center) 0 5.15 0 5.15Waste Management 0 0.027 1,415 1,415Total U.S. 61.2 68.8 1,415 1,545
PET Bottle (750 mL)Materials Production 45.7 30.1 0 75.8Container Production 0 17.0 0 17.0Secondary/Tertiary Packaging Production 5.88 14.0 0 19.9Transportation (from Winery to Distribution Center) 0 0.78 0 0.78Waste Management 0 0.98 171 172Total U.S. 51.6 62.8 171 286
Source: Franklin Associates, a Division of ERG
Table 2-5a
SOLID WASTES BY WEIGHT FOR WINE CONTAINER SYSTEMS - UNITED STATES(per 1,000 liters)
Solid Wastes by Weight(lbs per 1,000 liters)
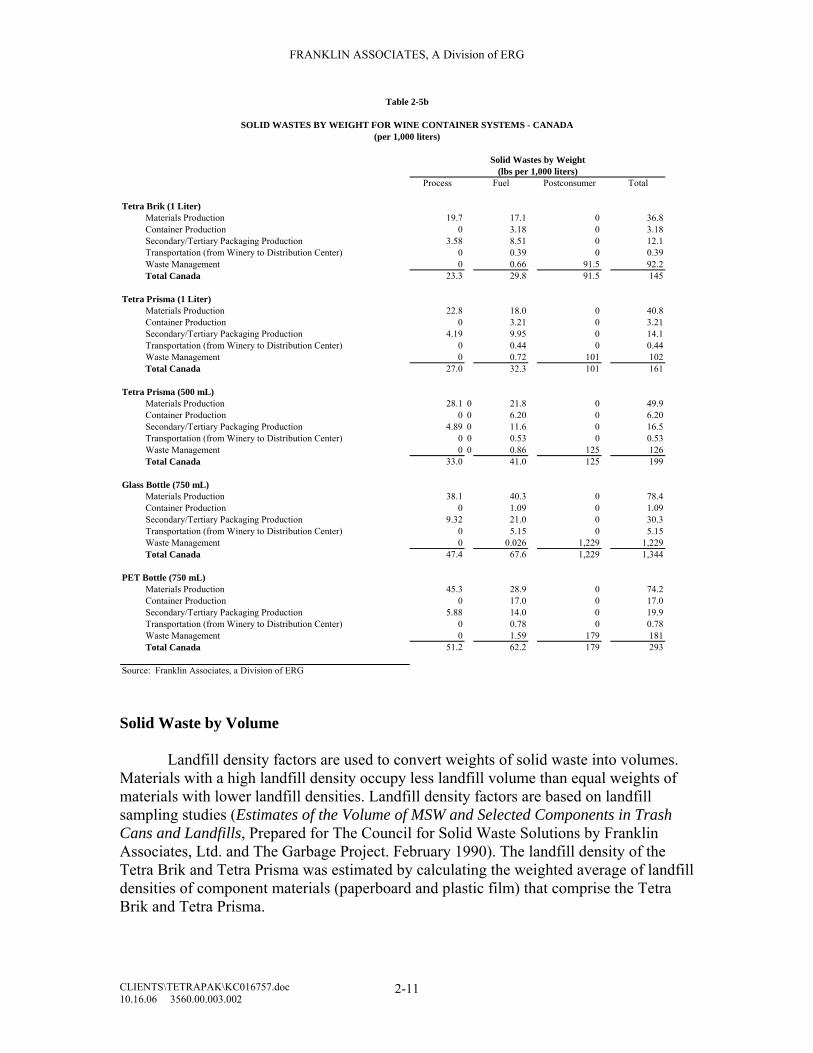
FRANKLIN ASSOCIATES, A Division of ERG
CLIENTS\TETRAPAK\KC016757.doc 10.16.06 3560.00.003.002
2-11
Solid Waste by Volume
Landfill density factors are used to convert weights of solid waste into volumes. Materials with a high landfill density occupy less landfill volume than equal weights of materials with lower landfill densities. Landfill density factors are based on landfill sampling studies (Estimates of the Volume of MSW and Selected Components in Trash Cans and Landfills, Prepared for The Council for Solid Waste Solutions by Franklin Associates, Ltd. and The Garbage Project. February 1990). The landfill density of the Tetra Brik and Tetra Prisma was estimated by calculating the weighted average of landfill densities of component materials (paperboard and plastic film) that comprise the Tetra Brik and Tetra Prisma.
Process Fuel Postconsumer Total
Tetra Brik (1 Liter)Materials Production 19.7 17.1 0 36.8Container Production 0 3.18 0 3.18Secondary/Tertiary Packaging Production 3.58 8.51 0 12.1Transportation (from Winery to Distribution Center) 0 0.39 0 0.39Waste Management 0 0.66 91.5 92.2Total Canada 23.3 29.8 91.5 145
Tetra Prisma (1 Liter)Materials Production 22.8 18.0 0 40.8Container Production 0 3.21 0 3.21Secondary/Tertiary Packaging Production 4.19 9.95 0 14.1Transportation (from Winery to Distribution Center) 0 0.44 0 0.44Waste Management 0 0.72 101 102Total Canada 27.0 32.3 101 161
Tetra Prisma (500 mL)Materials Production 28.1 0 21.8 0 49.9Container Production 0 0 6.20 0 6.20Secondary/Tertiary Packaging Production 4.89 0 11.6 0 16.5Transportation (from Winery to Distribution Center) 0 0 0.53 0 0.53Waste Management 0 0 0.86 125 126Total Canada 33.0 41.0 125 199
Glass Bottle (750 mL)Materials Production 38.1 40.3 0 78.4Container Production 0 1.09 0 1.09Secondary/Tertiary Packaging Production 9.32 21.0 0 30.3Transportation (from Winery to Distribution Center) 0 5.15 0 5.15Waste Management 0 0.026 1,229 1,229Total Canada 47.4 67.6 1,229 1,344
PET Bottle (750 mL)Materials Production 45.3 28.9 0 74.2Container Production 0 17.0 0 17.0Secondary/Tertiary Packaging Production 5.88 14.0 0 19.9Transportation (from Winery to Distribution Center) 0 0.78 0 0.78Waste Management 0 1.59 179 181Total Canada 51.2 62.2 179 293
Source: Franklin Associates, a Division of ERG
Table 2-5b
SOLID WASTES BY WEIGHT FOR WINE CONTAINER SYSTEMS - CANADA(per 1,000 liters)
Solid Wastes by Weight(lbs per 1,000 liters)

FRANKLIN ASSOCIATES, A Division of ERG
CLIENTS\TETRAPAK\KC016757.doc 10.16.06 3560.00.003.002
2-12
A constant factor (1,350 pounds per cubic yard) was used to convert process wastes from a weight basis to a volume basis. Thus, the discussion on the relative weights of process wastes of the container systems also applies to the relative volumes of process wastes. The same factor (1,350 pounds per cubic yard) was used to convert fuel wastes from a weight basis to a volume basis. Thus, the discussion on the relative weights of fuel wastes for various container systems also applies to the relative volumes of fuel wastes. The greatest variation between the weight and volume of solid waste usually occurs in the category of postconsumer wastes, because different materials can have very different landfill densities. In particular, glass has a significantly higher landfill density than paperboard or plastic. The landfill density of glass is 2,800 pounds per cubic yard, while the landfill densities of the Tetra Pak and plastic containers are 500 and 355 pounds per cubic yard, respectively. A given weight of glass thus occupies a significantly lower landfill volume than equal weights of paperboard or plastic materials. Tables 2-6a and 2-6b show the solid wastes by volume for each container system. The volumes of postconsumer wastes were calculated by multiplying the weights in Tables 2-5a and 2-5b by the landfill densities of the containers.

FRANKLIN ASSOCIATES, A Division of ERG
CLIENTS\TETRAPAK\KC016757.doc 10.16.06 3560.00.003.002
2-13
Process Fuel Postconsumer Total
Tetra Brik (1 Liter)Materials Production 0.016 0.014 0 0.029Container Production 0 0.0024 0 0.0024Secondary/Tertiary Packaging Production 0.0027 0.0063 0 0.0090Transportation (from Winery to Distribution Center) 0 2.9E-04 0 2.9E-04Waste Management 0 9.7E-05 0.17 0.17Total U.S. 0.018 0.023 0.17 0.22
Tetra Prisma (1 Liter)Materials Production 0.018 0.015 0 0.032Container Production 0 0.0024 0 0.0024Secondary/Tertiary Packaging Production 0.0031 0.0074 0 0.010Transportation (from Winery to Distribution Center) 0 3.2E-04 0 3.2E-04Waste Management 0 1.1E-04 0.19 0.19Total U.S. 0.021 0.025 0.19 0.24
Tetra Prisma (500 mL)Materials Production 0.022 0.018 0 0.040Container Production 0 0.0046 0 0.0046Secondary/Tertiary Packaging Production 0.0036 0.0086 0 0.012Transportation (from Winery to Distribution Center) 0 4.0E-04 0 4.0E-04Waste Management 0 1.3E-04 0.24 0.24Total U.S. 0.026 0.031 0.24 0.30
Glass Bottle (750 mL)Materials Production 0.038 0.031 0 0.069Container Production 0 8.1E-04 0 8.1E-04Secondary/Tertiary Packaging Production 0.0069 0.016 0 0.022Transportation (from Winery to Distribution Center) 0 0.0038 0 0.0038Waste Management 0 2.0E-05 0.51 0.51Total U.S. 0.045 0.051 0.51 0.60
PET Bottle (750 mL)Materials Production 0.034 0.022 0 0.056Container Production 0 0.013 0 0.013Secondary/Tertiary Packaging Production 0.0044 0.010 0 0.015Transportation (from Winery to Distribution Center) 0 5.8E-04 0 5.8E-04Waste Management 0 7.3E-04 0.48 0.48Total U.S. 0.038 0.047 0.48 0.57
Source: Franklin Associates, a Division of ERG
(per 1,000 liters)
Solid Wastes by Volume(cubic yards per 1,000 liters)
Table 2-6a
SOLID WASTES BY VOLUME FOR WINE CONTAINER SYSTEMS - UNITED STATES

FRANKLIN ASSOCIATES, A Division of ERG
CLIENTS\TETRAPAK\KC016757.doc 10.16.06 3560.00.003.002
2-14
ENVIRONMENTAL EMISSIONS Atmospheric and waterborne emissions for each system include process emissions and fuel emissions. Process emissions are released from process reactions or evaporative losses, or may result from equipment leaks, venting, or other losses during production or transport of a material. Fuel emissions result from the combustion of fuels.
Process Fuel Postconsumer Total
Tetra Brik (1 Liter)Materials Production 0.015 0.013 0 0.027Container Production 0 0.0024 0 0.0024Secondary/Tertiary Packaging Production 0.0027 0.0063 0 0.0090Transportation (from Winery to Distribution Center) 0 2.9E-04 0 2.9E-04Waste Management 0 4.9E-04 0.18 0.18Total Canada 0.017 0.022 0.18 0.22
Tetra Prisma (1 Liter)Materials Production 0.017 0.013 0 0.030Container Production 0 0.0024 0 0.0024Secondary/Tertiary Packaging Production 0.0031 0.0074 0 0.010Transportation (from Winery to Distribution Center) 0 3.2E-04 0 3.2E-04Waste Management 0 5.3E-04 0.20 0.20Total Canada 0.020 0.024 0.20 0.25
Tetra Prisma (500 mL)Materials Production 0.021 0 0.016 0 0.037Container Production 0 0 0.0046 0 0.0046Secondary/Tertiary Packaging Production 0.0036 0 0.0086 0 0.012Transportation (from Winery to Distribution Center) 0 0 4.0E-04 0 4.0E-04Waste Management 0 0 6.3E-04 0.25 0.25Total Canada 0.024 0.030 0.25 0.31
Glass Bottle (750 mL)Materials Production 0.028 0.030 0 0.058Container Production 0 8.1E-04 0 8.1E-04Secondary/Tertiary Packaging Production 0.0069 0.016 0 0.022Transportation (from Winery to Distribution Center) 0 0.0038 0 0.0038Waste Management 0 1.9E-05 0.44 0.44Total Canada 0.035 0.050 0.44 0.52
PET Bottle (750 mL)Materials Production 0.034 0.021 0 0.055Container Production 0 0.013 0 0.013Secondary/Tertiary Packaging Production 0.0044 0.010 0 0.015Transportation (from Winery to Distribution Center) 0 5.8E-04 0 5.8E-04Waste Management 0 0.0012 0.5054 0.5066Total Canada 0.038 0.046 0.5054 0.589
Source: Franklin Associates, a Division of ERG
Solid Wastes by Volume(cubic yards per 1,000 liters)
Table 2-6b
SOLID WASTES BY VOLUME FOR WINE CONTAINER SYSTEMS - CANADA(per 1,000 liters)

FRANKLIN ASSOCIATES, A Division of ERG
CLIENTS\TETRAPAK\KC016757.doc 10.16.06 3560.00.003.002
2-15
It is important to realize that interpretation of emissions data requires great care. The effect of the various emissions on humans and the environment are not fully known, and it is not valid to simply add the weights of various pollutants together to arrive at a total effect. The degree of potential environmental disruption due to environmental releases is not related to the weight of the releases in a simple way. Life cycle impact assessment (LCIA) is required to evaluate the potential impacts of different substances on human health and the environment. However, with the exception of the calculation of carbon dioxide equivalents, this analysis is limited to a life cycle inventory (LCI). If the weight of atmospheric emissions or waterborne emissions of a system is 25 percent different from another, it can be concluded that the difference is significant. Percent difference is defined as the difference between two values divided by the average of the two values. (See Appendix B for an explanation of these certainty ranges.) Atmospheric Emissions
The predominant atmospheric emissions for the container systems include greenhouse gases (carbon dioxide, methane, and nitrous oxide), volatile organic compounds (VOC), sulfur oxides, particulates, and other organic compounds. Some of these emissions (such as other organics, volatile organic compounds, or particulates) do not represent a distinct chemical species, but rather a general category of compounds with similar properties.
Fuel combustion atmospheric emissions are directly related to the energy requirements of the container systems and the profile of fuels used for energy. Thus, the same conclusions that were discussed in the energy section of this chapter can be applied to the atmospheric emissions from fuel combustion. An exception is energy of material resource (EMR). EMR is a measure of the energy content of fuel resources used as raw materials and represents a significant portion of total energy requirements for plastic materials but does not have associated fuel combustion emissions. Tables 2-7a and 2-7b show the greenhouse gases released by the container systems for the United States and Canada, respectively. The greenhouse gas emissions shown in these tables are multiplied by global warming potentials developed by the IPCC (Intergovernmental Panel on Climate Change). The global warming potentials are based on a 100-year time frame and represent the heat trapping capacity of the gases relative to an equal weight of carbon dioxide.
The carbon dioxide emissions from combustion of wood waste (a fuel used for paperboard production) are not included in the calculation of greenhouse gas emissions. By EPA convention, carbon dioxide released by wood combustion is considered part of the natural carbon cycle. In other words, when wood is burned, carbon dioxide consumed by the tree during its growth cycle is returned to the atmosphere, so there is no net increase in atmospheric carbon dioxide.

FRANKLIN ASSOCIATES, A Division of ERG
CLIENTS\TETRAPAK\KC016757.doc 10.16.06 3560.00.003.002
2-16
Tetra Brik(1 Liter)
Tetra Prisma(1 Liter)
Tetra Prisma(500 mL)
Glass Bottle(750 mL)
PET Bottle (750 mL)
carbon dioxide (fossil) 303 343 438 1,799 847methane 21.8 26.8 35.6 101 67.1nitrous oxide 8.05 8.44 10.2 16.1 8.62methyl bromide 1.1E-05 1.1E-05 1.3E-05 2.2E-05 9.6E-06methyl chloride 1.1E-04 1.2E-04 1.4E-04 2.4E-04 1.0E-04trichloroethane 3.8E-05 4.0E-05 4.7E-05 8.1E-05 3.5E-05chloroform 2.4E-05 2.5E-05 2.9E-05 5.0E-05 2.1E-05methylene chloride 0.0028 0.0028 0.0033 0.0016 0.0015carbon tetrachloride 0.075 0.074 0.088 0.030 0.029
Total 333 378 484 1,916 922
Source: Franklin Associates, a Division of ERG
GREENHOUSE GAS SUMMARY FOR WINE CONTAINER SYSTEMS - UNITED STATES(lbs of carbon dioxide equivalents per 1,000 liters)
Note: The 100 year global warming potentials used in this table are as follows: fossil carbon dioxide--1, methane--23, nitrous oxide--296, methyl bromide--5, methyl chloride--16, trichloroethane--140, chloroform--30, methylene chloride--10, and carbon tetrachloride--1800.
Table 2-7a
Tetra Brik(1 Liter)
Tetra Prisma(1 Liter)
Tetra Prisma(500 mL)
Glass Bottle(750 mL)
PET Bottle (750 mL)
carbon dioxide (fossil) 298 338 432 1,785 826methane 21.2 25.9 34.5 100 64.1nitrous oxide 7.54 7.95 9.61 16.0 8.48methyl bromide 1.0E-05 1.1E-05 1.2E-05 2.2E-05 9.5E-06methyl chloride 1.1E-04 1.1E-04 1.3E-04 2.4E-04 1.0E-04trichloroethane 3.6E-05 3.7E-05 4.4E-05 8.1E-05 3.4E-05chloroform 2.2E-05 2.3E-05 2.8E-05 5.0E-05 2.1E-05methylene chloride 0.0026 0.0026 0.0031 0.0016 0.0014carbon tetrachloride 0.068 0.068 0.080 0.030 0.029
Total 327 372 476 1,901 899
Source: Franklin Associates, a Division of ERG
GREENHOUSE GAS SUMMARY FOR WINE CONTAINER SYSTEMS - CANADA(lbs of carbon dioxide equivalents per 1,000 liters)
Note: The 100 year global warming potentials used in this table are as follows: fossil carbon dioxide--1, methane--23, nitrous oxide--296, methyl bromide--5, methyl chloride--16, trichloroethane--140, chloroform--30, methylene chloride--10, and carbon tetrachloride--1800.
Table 2-7b

FRANKLIN ASSOCIATES, A Division of ERG
CLIENTS\TETRAPAK\KC016757.doc 10.16.06 3560.00.003.002
2-17
In addition to the greenhouse gas emissions shown above, a comprehensive list of the atmospheric emissions from the container systems is shown in Appendix C. Waterborne Emissions
The process-related waterborne emissions for the container systems include dissolved solids, suspended solids, COD (chemical oxygen demand), BOD (biological oxygen demand), chlorides, and various metals. No firm conclusions can be made from the waterborne emissions that result from the systems of this analysis. As stated earlier, the degree of potential environmental disruption due to environmental releases is not related to the weight of the releases in a simple way.
Fuel combustion waterborne emissions are directly related to the energy requirements of the container systems and the profile of fuels used for energy. Thus, the same conclusions that were discussed in the energy section of this chapter can be applied to the waterborne emissions from fuel combustion. One exception to this relationship is energy of material resource (EMR). As was the case with fuel-related atmospheric emissions, no fuel-related waterborne emissions are associated with energy of material resource.
A comprehensive list of the waterborne emissions from the container systems are shown in Appendix C. CONCLUSIONS A life cycle inventory (LCI) is an environmental profile that expresses environmental burdens from the perspective of energy consumption, solid waste generation, atmospheric emissions, and waterborne emissions. This LCI evaluated three types of container systems and found significant conclusions in three categories of environmental burdens: 1) energy requirements, 2) solid waste generation, and 3) greenhouse gas emissions. The LCI conclusions for each of these categories are summarized below. Energy Requirements
• There is a correlation between system weight and energy requirements. The paperboard systems have the lowest weight per delivered volume of wine and the lowest total energy requirements. The glass system has the highest weight per delivered volume of wine and the highest total energy requirements.
• The manufacture of container materials (from raw material extraction to container fabrication) accounts for the largest share of total energy for all container systems.
• The glass bottles have significantly higher transportation requirements than the paperboard containers or PET bottles.

FRANKLIN ASSOCIATES, A Division of ERG
CLIENTS\TETRAPAK\KC016757.doc 10.16.06 3560.00.003.002
2-18
• Compared to the glass and PET container systems, the paperboard container systems consume a lower percentage of fossil fuels (petroleum, natural gas, and coal) and a higher percentage of wood fuel. The consumption of wood fuel is due to the combustion of wood residues at paper mills. The paperboard and PET container systems consume a comparable percentage of hydropower, which is due to the aluminum components of both systems. A significant portion of the electricity used for primary aluminum smelting is generated from hydropower.
• The energy of material resource (EMR) is highest for the PET bottle system because PET resin is derived from petroleum feedstocks that could also be used as fuels. The paperboard container systems also have an EMR, which is attributable to the polyethylene and polypropylene components of the containers. The glass system has no EMR.
• Waste management does not account for a significant portion of total system energy. Changes in waste management scenarios do not significantly affect total energy requirements.
• Potential energy recovery from waste combustion is negligible for all systems of this analysis. However, the paperboard and PET container systems have a higher percentage of combustible material and thus have a greater potential for energy recovery than the glass container system.
Solid Wastes
• There is a correlation between system weight and solid waste. In particular, the weight of postconsumer waste is directly related to the weight of a product. The paperboard systems have the lowest weight per delivered volume of wine and the lowest total solid wastes. The glass system has the highest weight per delivered volume of wine and the highest total solid wastes.
• The greatest variation between the weight and volume of solid waste usually occurs in the category of postconsumer wastes, because different materials can have very different landfill densities. When expressed on a volume basis, the solid wastes of the container systems are closer than when expressed on a weight basis. This is attributable to the high density of glass; a given weight of glass will occupy significantly less volume than an equal weight of paperboard or plastic.
• The solid wastes of the container systems were not sensitive to a change in waste management scenarios.
Greenhouse Gas Emissions
• Greenhouse gas emissions are closely related to system energy, and thus the conclusions for system energy requirements also apply to system greenhouse gas emissions.

FRANKLIN ASSOCIATES, A Division of ERG
CLIENTS\TETRAPAK\KC016757.doc 10.16.06 3560.00.003.002
2-19
• One exception to the correlation between system energy and greenhouse gas emissions is the relationship between EMR (energy of material resource) and greenhouse gas emissions. Systems with a high EMR have relatively low greenhouse gas emissions when compared to systems with similar total energies but no EMR; when petroleum is used for material production, it is not burned as a fuel and thus does not release combustion emissions. The PET container system has the highest EMR of the three container systems of this analysis. However, regardless of its relatively high EMR, the total greenhouse gas emissions of the PET system are still higher than those of the paperboard systems.

FRANKLIN ASSOCIATES, A Division of ERG
CLIENTS\TETRAPAK\KC016757.doc 10.16.06 3560.00.003.002
3-1
CHAPTER 3
LCI RESULTS AND CONCLUSIONS FOR SINGLE-SERVING WINE CONTAINERS
INTRODUCTION
An LCI (life cycle inventory) quantifies the resource use (energy and material consumption) and environmental emissions associated with the life cycles of specific products. The purpose of this study is to use LCI to evaluate the energy and material use, solid wastes, and atmospheric and waterborne emissions associated with packaging used for wine. Three types of packaging were modeled: paperboard containers (made from a composite of bleached paper, aluminum foil, and polyolefin resins), glass bottles, and PET (polyethylene terephthalate) bottles.
Wine packaging is available in single-serving and multi-serving sizes, ranging from 187-milliliter containers to 1-liter containers. This chapter focuses on the single-serving containers, which have volumes ranging from 187-milliters to 250-milliliters. This includes two paperboard containers (200-milliliter Tetra Prisma and 250-milliliter Tetra Prisma) one glass container (187-milliliter glass bottle), and one plastic container (187-milliliter PET bottle). Details on the composition of these containers are provided in Chapter 1 (“System Descriptions and LCI Assumptions”) of this report.
All results are expressed on an equivalent volume basis: the delivery of 1,000 liters of wine. This is equivalent to 4,000 250-milliliter containers, 5,000 200-milliliter containers, or 5,348 187-milliliter containers. A conventional case of wine contains 12 750-milliliter glass bottles, for a total volume of nine liters. The basis of 1,000 liters of wine is thus equivalent to 111 cases of wine.
In response to the different solid waste management practices between the United States and Canada, one goal of this study was to evaluate the sensitivity of environmental burdens to different disposal and recycling scenarios. Of the postconsumer solid waste that remains after material recovery for recycling, 86 percent is landfilled in the U.S. and 95 percent is landfilled in Canada. The remaining solid waste is combusted with energy recovery. A change in the split between landfilling and combustion with energy recovery will change the solid wastes and potential energy recovery of a system. A change in recycling rates not only affects the environmental burdens of waste management, but also affects upstream manufacturing processes. LCI methodology allocates energy and material flows according to the percentage of a product’s material that is recovered for recycling and whether the material is recycled into the same product (closed loop recycling) or a different product (open loop recycling). A detailed discussion of the Franklin Associates recycling methodology is provided in Appendix D. Due to the different waste management scenarios between the United States and Canada, the results for the two countries are thus shown separately throughout this chapter.

FRANKLIN ASSOCIATES, A Division of ERG
CLIENTS\TETRAPAK\KC016757.doc 10.16.06 3560.00.003.002
3-2
The total energy consumption, solid waste generation, and greenhouse gas emissions (expressed as carbon dioxide equivalents) are summarized in Table 3-1.
The following sections discuss the categories of energy consumption, solid waste generation, and environmental emissions in greater detail. ENERGY
The total energy requirements for each system include the energy for manufacturing and transporting materials at each stage of the life cycle, as well as the energy content of fuel resources used as raw materials.
The total energy of each container system varies slightly between the United States and Canadian scenarios; any difference in the results between the United States and Canadian scenarios is due solely to the different waste management practices of the two countries. The total energies of the paperboard container systems range between 5.1 and 5.4 million Btu per 1,000 liters of delivered wine. The total energy of the PET container system ranges between 14.9 and 15.4 million Btu per 1,000 liters of delivered wine. The total energy of the glass container system ranges between 16.6 and 16.7 million Btu per 1,000 liters of delivered wine.
There is a correlation between system weight and energy requirements. The paperboard systems have the lowest weight per delivered volume of wine and the lowest
Energy(million Btu)
Tetra Prisma (250 mL) 5.38 MM Btu 244 lbs 0.37 cu yd 557 lbsTetra Prisma (200 mL) 5.29 MM Btu 244 lbs 0.37 cu yd 571 lbsGlass Bottle (187 mL) 16.7 MM Btu 1,988 lbs 0.81 cu yd 2,690 lbsPET Bottle (187 mL) 15.4 MM Btu 593 lbs 1.22 cu yd 1,699 lbs
Energy(million Btu)
Tetra Prisma (250 mL) 5.16 MM Btu 249 lbs 0.39 cu yd 548 lbsTetra Prisma (200 mL) 5.11 MM Btu 250 lbs 0.39 cu yd 563 lbsGlass Bottle (187 mL) 16.6 MM Btu 1,756 lbs 0.72 cu yd 2,673 lbsPET Bottle (187 mL) 14.9 MM Btu 615 lbs 1.28 cu yd 1,660 lbs
Source: Franklin Associates, a Division of ERG
TOTAL ENERGY AND GREENHOUSE GAS EMISSIONS FOR WINE CONTAINER SYSTEMS(per 1,000 liters)
Solid Waste(weight and volume)
Solid Waste(weight and volume)
Greenhouse Gases(CO2 equivalents)
Greenhouse Gases(CO2 equivalents)
CANADA
UNITED STATES
Table 3-1

FRANKLIN ASSOCIATES, A Division of ERG
CLIENTS\TETRAPAK\KC016757.doc 10.16.06 3560.00.003.002
3-3
total energy requirements. The glass system has the highest weight per delivered volume of wine and the highest total energy requirements.
The energy requirements for three categories – energy of material resource, process energy, and transportation energy – are discussed below. Energy of Material Resource
Energy of material resource is the energy value of fuel resources used as raw materials. As explained in the methodology appendix (Appendix A) of this report, LCI methodology assigns a fuel-energy equivalent to raw materials that are derived from fossil fuels. Therefore, the total energy requirement for coal-, natural gas-, or petroleum-based materials includes the fuel energy of the raw material (energy of material resource). No fuel-energy equivalent is assigned to combustible materials such as wood that are not major fuel sources in this country.
The paperboard and PET container systems contain plastics and thus include energy of material resource. Energy of material resource accounts for between 26.0 and 27.2 percent of the total energy of the PET container system and between 9.6 and 13.2 percent of the total energy of the paperboard container systems. The glass container system includes a negligible amount (less than one percent) of energy of material resource, which is attributable to the production of carbon anodes for aluminum smelting (the 187-milliliter glass bottle has an aluminum closure). Process Energy
Process energy includes all energy used to extract and process raw materials into usable forms, manufacture the container systems, and manage postconsumer materials. For material disposal, process energy includes diesel fuel used to run landfill equipment.
Process energy accounts for the majority of energy requirements for all container systems. Process energy is 64.7 to 65.7 percent of the total energy of the PET container system, 75.7 to 79.0 percent of the total energy of the paperboard container systems, and 77.1 percent of the total energy of the glass container system. Transportation Energy
Total energy requirements for each component include the energy to transport materials from each step to the next. Examples of the transportation steps included in this analysis include crude oil to refineries, roundwood to paper mills, empty containers to wineries, and filled containers to distribution centers.
To understand their relative contribution to the entire life cycles of the container systems, the transportation of filled containers from the winery to the distribution center were isolated in this analysis.

FRANKLIN ASSOCIATES, A Division of ERG
CLIENTS\TETRAPAK\KC016757.doc 10.16.06 3560.00.003.002
3-4
The glass container system has the highest transportation energy. Transportation accounts for approximately 22 percent of the total energy of the glass bottle system, approximately 11 percent of the total energy of the paperboard systems, and approximately 8 percent of the total energy of the PET system.
Tables 3-2a and 3-2b show detailed energy requirements by category (process energy, transport energy, and energy of material resource) for the two container systems. Table 3-2a is representative of postconsumer waste management in the United States, and Table 3-2b is representative of postconsumer waste management in Canada.
ProcessTranspor-
tation
Energy of Material Resource Total Process
Transportation
Energy of Material Resource Total
Tetra Prisma (250 mL)Materials Production 2.33 0.067 0.71 3.10 43.2% 1.2% 13.2% 57.6%Container Production 0.38 0.15 0 0.53 7.0% 2.8% 0.0% 9.8%Secondary/Tertiary Packaging Production 1.35 0.11 6.1E-04 1.46 25.1% 2.0% 0.0% 27.1%Transportation (from Winery to Distribution Center) 0 0.27 0 0.27 0.0% 5.0% 0.0% 5.0%Waste Management 0.023 0.0015 0 0.025 0.4% 0.0% 0.0% 0.5%Total 4.08 0.60 0.71 05.4 75.7% 11.1% 13.2% 100%
Tetra Prisma (200 mL)Materials Production 2.15 0.061 0.54 2.76 40.6% 1.2% 10.3% 52.1%Container Production 0.47 0.13 0 0.60 8.9% 2.5% 0.0% 11.4%Secondary/Tertiary Packaging Production 1.52 0.12 6.9E-04 1.64 28.7% 2.3% 0.0% 31.0%Transportation (from Winery to Distribution Center) 0 0.27 0 0.27 0.0% 5.1% 0.0% 5.1%Waste Management 0.021 0.0014 0 0.023 0.4% 0.0% 0.0% 0.4%Total 4.16 0.59 0.54 05.3 78.6% 11.1% 10.3% 100%
Glass Bottle (187 mL)Materials Production 9.75 0.31 0.16 10.2 58.4% 1.9% 1.0% 61.3%Container Production 0 0.52 0 0.52 0.0% 3.1% 0.0% 3.1%Secondary/Tertiary Packaging Production 3.10 0.24 0.0013 3.34 18.6% 1.4% 0.0% 20.0%Transportation (from Winery to Distribution Center) 0 2.59 0 2.59 0.0% 15.5% 0.0% 15.5%Waste Management 0.013 8.7E-04 0 0.013 0.1% 0.0% 0.0% 0.1%Total 12.9 3.66 0.17 16.7 77.1% 21.9% 1.0% 100%
PET Bottle (187 mL)Materials Production 5.21 0.31 4.18 9.70 33.9% 2.0% 27.2% 63.1%Container Production 1.52 0.028 0 1.55 9.9% 0.2% 0.0% 10.1%Secondary/Tertiary Packaging Production 3.10 0.24 0.0013 3.34 20.2% 1.5% 0.0% 21.7%Transportation (from Winery to Distribution Center) 0 0.66 0 0.66 0.0% 4.3% 0.0% 4.3%Waste Management 0.11 0.0087 0 0.12 0.7% 0.1% 0.0% 0.8%Total 9.95 1.24 4.18 15.4 64.7% 8.1% 27.2% 100%
Source: Franklin Associates, a Division of ERG
Table 3-2a
ENERGY BY LIFE CYCLE PHASE AND ENERGY CATEGORY FOR WINE CONTAINER SYSTEMS - UNITED STATES(Million Btu per 1,000 liters)
Energy Category Energy Category (percent)

FRANKLIN ASSOCIATES, A Division of ERG
CLIENTS\TETRAPAK\KC016757.doc 10.16.06 3560.00.003.002
3-5
Energy Profile
The total energy requirements for each system can also be categorized by the fuels from which energy is derived. Energy sources include fossil fuels (natural gas, petroleum, and coal) and non-fossil fuels. Non-fossil fuels include nuclear energy, hydroelectric energy, and energy produced from wood wastes at pulp and paper mills.
Compared to the glass and PET container systems, the paperboard container systems consume a lower percentage of fossil fuels (petroleum, natural gas, and coal) and a higher percentage of wood fuel. All container systems include a small percentage (between 2 and 3 percent) of hydroelectric power.
Wood combustion, a significant portion of the energy profile of the paperboard container systems, can be attributed to the combustion of wood at paper mills. The smelting of aluminum relies on a significant percentage of hydroelectric power, and thus containers that include aluminum have a higher share of hydroelectric power than container systems that do not include aluminum.
ProcessTranspor-
tation
Energy of Material Resource Total Process
Transportation
Energy of Material Resource Total
Tetra Prisma (250 mL)Materials Production 2.11 0.061 0.63 2.81 40.9% 1.2% 12.3% 54.4%Container Production 0.38 0.15 0 0.53 7.3% 2.9% 0.0% 10.2%Secondary/Tertiary Packaging Production 1.35 0.11 6.1E-04 1.46 26.2% 2.1% 0.0% 28.3%Transportation (from Winery to Distribution Center) 0 0.27 0 0.27 0.0% 5.2% 0.0% 5.2%Waste Management 0.093 0.0058 0 0.098 1.8% 0.1% 0.0% 1.9%Total 3.93 0.59 0.64 05.2 76.2% 11.5% 12.3% 100%
Tetra Prisma (200 mL)Materials Production 1.96 0.056 0.49 2.50 38.4% 1.1% 9.5% 49.0%Container Production 0.47 0.13 0 0.60 9.2% 2.6% 0.0% 11.8%Secondary/Tertiary Packaging Production 1.52 0.12 6.9E-04 1.64 29.8% 2.4% 0.0% 32.1%Transportation (from Winery to Distribution Center) 0 0.27 0 0.27 0.0% 5.3% 0.0% 5.3%Waste Management 0.082 0.0052 0 0.088 1.6% 0.1% 0.0% 1.7%Total 4.03 0.58 0.49 05.1 79.0% 11.5% 9.6% 100%
Glass Bottle (187 mL)Materials Production 9.68 0.28 0.16 10.1 58.3% 1.7% 1.0% 61.0%Container Production 0 0.52 0 0.52 0.0% 3.1% 0.0% 3.1%Secondary/Tertiary Packaging Production 3.10 0.24 0.0013 3.34 18.7% 1.4% 0.0% 20.1%Transportation (from Winery to Distribution Center) 0 2.59 0 2.59 0.0% 15.6% 0.0% 15.6%Waste Management 0.012 7.6E-04 0 0.013 0.1% 0.0% 0.0% 0.1%Total 12.8 3.63 0.17 16.6 77.1% 21.9% 1.0% 100%
PET Bottle (187 mL)Materials Production 4.97 0.29 3.86 9.12 33.5% 1.9% 26.0% 61.4%Container Production 1.52 0.028 0 1.55 10.2% 0.2% 0.0% 10.4%Secondary/Tertiary Packaging Production 3.10 0.24 0.0013 3.34 20.9% 1.6% 0.0% 22.5%Transportation (from Winery to Distribution Center) 0 0.66 0 0.66 0.0% 4.5% 0.0% 4.5%Waste Management 0.16 0.013 0 0.18 1.1% 0.1% 0.0% 1.2%Total 9.76 1.23 3.86 14.9 65.7% 8.3% 26.0% 100%
Source: Franklin Associates, a Division of ERG
Table 3-2b
ENERGY BY LIFE CYCLE PHASE AND ENERGY CATEGORY FOR WINE CONTAINER SYSTEMS - CANADA(Million Btu per 1,000 liters)
Energy Category Energy Category (percent)

FRANKLIN ASSOCIATES, A Division of ERG
CLIENTS\TETRAPAK\KC016757.doc 10.16.06 3560.00.003.002
3-6
Tables 3-3a and 3-3b show the fuel profiles for wine container systems in the United States and Canada, respectively. Table 3-3a is representative of postconsumer waste management in the United States, and Table 3-3b is representative of postconsumer waste management in Canada. If the energy of one system is 10 percent different from another, it can be concluded that the difference is significant. Percent difference is defined as the difference between two values divided by the average of the two values. (See Appendix B for an explanation of this certainty range.)
Nat. Gas Petroleum Coal Hydropower Nuclear Wood Other TotalTetra Prisma (250 mL)
Materials Production 1.07 0.38 0.53 0.081 0.061 0.95 0.033 3.10Container Production 0.11 0.16 0.20 0.009 0.048 0 0.009 0.53Secondary/Tertiary Packaging Production 0.20 0.14 0.41 0.0065 0.035 0.66 0.0064 1.46Transportation (from Winery to Distribution Center) 0.013 0.25 0.0067 3.2E-04 0.0017 0 3.4E-04 0.27Waste Management 0.0087 0.0089 0.0053 2.5E-04 0.0013 0 2.4E-04 0.025Total 1.40 0.93 1.15 0.10 0.15 1.61 0.049 05.4Percent Total 26% 17% 21% 2% 3% 30% 1% 100%
Tetra Prisma (200 mL)Materials Production 0.87 0.33 0.51 0.087 0.059 0.87 0.028 2.76Container Production 0.13 0.14 0.24 0.011 0.06 0 0.011 0.60Secondary/Tertiary Packaging Production 0.22 0.16 0.46 0.0073 0.039 0.74 0.0072 1.64Transportation (from Winery to Distribution Center) 0.013 0.25 0.0067 3.2E-04 0.0017 0 3.4E-04 0.27Waste Management 0.0077 0.0086 0.0046 2.2E-04 0.0012 0 2.1E-04 0.023Total 1.25 0.89 1.23 0.11 0.16 1.61 0.047 05.3Percent Total 24% 17% 23% 2% 3% 30% 1% 100%
Glass Bottle (187 mL)Materials Production 5.64 1.78 1.98 0.39 0.35 0 0.080 10.2Container Production 0.025 0.48 0.013 6.2E-04 0.0033 0 6.5E-04 0.52Secondary/Tertiary Packaging Production 0.43 0.32 0.90 0.013 0.070 1.59 0.013 3.34Transportation (from Winery to Distribution Center) 0.12 2.38 0.064 0.0031 0.016 0 0.0032 2.59Waste Management 6.6E-04 0.013 2.2E-05 1.6E-05 8.8E-05 0 1.1E-06 0.013Total 6.22 4.97 2.96 0.41 0.44 1.59 0.097 16.7Percent Total 37% 30% 18% 2% 3% 10% 1% 100%
PET Bottle (187 mL)Materials Production 3.57 3.94 1.44 0.38 0.27 0 0.10 9.70Container Production 0.30 0.10 0.86 0.039 0.21 0 0.040 1.55Secondary/Tertiary Packaging Production 0.43 0.32 0.90 0.013 0.070 1.59 0.013 3.34Transportation (from Winery to Distribution Center) 0.032 0.61 0.016 7.9E-04 0.0042 0 8.3E-04 0.66Waste Management 0.018 0.036 0.048 0.0022 0.012 0 0.0022 0.12Total 4.35 5.01 3.27 0.43 0.56 1.59 0.16 15.4Percent Total 28% 33% 21% 3% 4% 10% 1% 100%
Source: Franklin Associates, a Division of ERG
Table 3-3a
FUEL PROFILE FOR WINE CONTAINER SYSTEMS - UNITED STATES(Million Btu per 1,000 liters)

FRANKLIN ASSOCIATES, A Division of ERG
CLIENTS\TETRAPAK\KC016757.doc 10.16.06 3560.00.003.002
3-7
Energy Recovery
The total energy requirements for each system may be reduced by the energy recovered by waste-to-energy combustion of postconsumer materials. Based on 2003 statistics, 14 percent of municipal solid waste in the U.S. is incinerated with energy recovery. Approximately 5 percent of municipal solid waste in Canada is incinerated with energy recovery. These percentages represent the fate of materials after material recovery for recycling has occurred.
In addition to the percentage of a waste stream that is combusted, the extent of energy recovery also depends on the heating value of waste materials. The estimated heating value of the Tetra Brik and Tetra Prisma is 9,776 Btu/lb; the closures for these containers have an estimated heating value of 18,100 Btu/lb. The estimated heating value of PET bottles is 9,900 Btu/lb. Glass is a non-combustible material and thus has no potential for energy recovery from combustion. Secondary and tertiary packaging also has the potential for energy recovery; paperboard carriers and corrugated boxes, which are used by all systems of this analysis, have a heating value of 8,947 Btu/lb.
The potential energy recovery from the combustion of postconsumer container systems is shown in Table 3-4. The values in Table 3-4 are based on the weights of the container systems, the national rates for combustion with energy recovery, and the heating values of component materials. Since the glass container itself is not combustible, the glass system has a lower potential energy recovery than the other container systems.
Nat. Gas Petroleum Coal Hydropower Nuclear Wood Other TotalTetra Prisma (250 mL)
Materials Production 0.96 0.35 0.49 0.081 0.057 0.85 0.030 2.81Container Production 0.11 0.16 0.20 0.009 0.048 0 0.009 0.53Secondary/Tertiary Packaging Production 0.20 0.14 0.41 0.0065 0.035 0.66 0.0064 1.46Transportation (from Winery to Distribution Center) 0.013 0.25 0.0067 3.2E-04 0.0017 0 3.4E-04 0.27Waste Management 0.045 0.015 0.028 0.0013 0.0070 0 0.0013 0.098Total 1.33 0.91 1.13 0.10 0.15 1.50 0.047 05.2Percent Total 26% 18% 22% 2% 3% 29% 1% 100%
Tetra Prisma (200 mL)Materials Production 0.79 0.30 0.47 0.086 0.055 0.77 0.026 2.50Container Production 0.13 0.14 0.24 0.011 0.06 0 0.011 0.60Secondary/Tertiary Packaging Production 0.22 0.16 0.46 0.0073 0.039 0.74 0.0072 1.64Transportation (from Winery to Distribution Center) 0.013 0.25 0.0067 3.2E-04 0.0017 0 3.4E-04 0.27Waste Management 0.040 0.014 0.025 0.0012 0.0062 0 0.0012 0.088Total 1.20 0.87 1.21 0.11 0.16 1.51 0.046 05.1Percent Total 24% 17% 24% 2% 3% 30% 1% 100%
Glass Bottle (187 mL)Materials Production 5.62 1.75 1.94 0.39 0.34 0 0.078 10.1Container Production 0.025 0.48 0.013 6.2E-04 0.0033 0 6.5E-04 0.52Secondary/Tertiary Packaging Production 0.43 0.32 0.90 0.013 0.070 1.59 0.013 3.34Transportation (from Winery to Distribution Center) 0.12 2.38 0.064 0.0031 0.016 0 0.0032 2.59Waste Management 6.4E-04 0.012 1.9E-05 1.6E-05 8.4E-05 0 9.5E-07 0.013Total 6.20 4.95 2.92 0.41 0.43 1.59 0.095 16.6Percent Total 37% 30% 18% 2% 3% 10% 1% 100%
PET Bottle (187 mL)Materials Production 3.34 3.66 1.39 0.38 0.25 0 0.096 9.12Container Production 0.30 0.10 0.86 0.039 0.21 0 0.040 1.55Secondary/Tertiary Packaging Production 0.43 0.32 0.90 0.013 0.070 1.59 0.013 3.34Transportation (from Winery to Distribution Center) 0.032 0.61 0.016 7.9E-04 0.0042 0 8.3E-04 0.66Waste Management 0.029 0.044 0.078 0.0036 0.019 0 0.0036 0.18Total 4.13 4.74 3.24 0.43 0.56 1.59 0.15 14.9Percent Total 28% 32% 22% 3% 4% 11% 1% 100%
Source: Franklin Associates, a Division of ERG
FUEL PROFILE FOR WINE CONTAINER SYSTEMS - CANADA(Million Btu per 1,000 liters)
Table 3-3b

FRANKLIN ASSOCIATES, A Division of ERG
CLIENTS\TETRAPAK\KC016757.doc 10.16.06 3560.00.003.002
3-8
The paperboard container systems have the highest potential energy recovery at 3.9 percent of total system energy in the U.S. and 1.2 percent of total system energy in Canada. These percentages are based on the higher heating values (HHV) of the recovered materials. The energy recovery shown in Table 3-4 represents the recovery of thermal energy from the combustion of solid waste, not the potential electricity generation from solid waste combustion.
Tetra Prisma (250 mL) 5.38 MM Btu 0.21 MM Btu 5.17 MM Btu 3.9%Tetra Prisma (200 mL) 5.29 MM Btu 0.21 MM Btu 5.09 MM Btu 3.9%Glass Bottle (187 mL) 16.7 MM Btu 0.18 MM Btu 16.5 MM Btu 1.1%PET Bottle (187 mL) 15.4 MM Btu 0.46 MM Btu 14.9 MM Btu 3.0%
Tetra Prisma (250 mL) 5.16 MM Btu 0.064 MM Btu 5.10 MM Btu 1.2%Tetra Prisma (200 mL) 5.11 MM Btu 0.063 MM Btu 5.04 MM Btu 1.2%Glass Bottle (187 mL) 16.6 MM Btu 0.064 MM Btu 16.5 MM Btu 0.4%PET Bottle (187 mL) 14.9 MM Btu 0.15 MM Btu 14.7 MM Btu 1.0%
Source: Franklin Associates, a Division of ERG
Table 3-4
POTENTIAL ENERGY RECOVERY FROM SOLID WASTE COMBUSTION(per 1,000 liters)
UNITED STATES
Total Energy Energy Recovery Net Energy% Energy Recovery *
* Percent energy recovery is the ratio of Energy Recovery to Total Energy multiplied by 100%.
CANADA
Total Energy Energy Recovery Net Energy% Energy Recovery *
SOLID WASTE Solid waste is categorized into process wastes, fuel-related wastes, and postconsumer wastes. Process wastes are the solid wastes generated by the various processes throughout the life cycle of the container systems. Fuel-related wastes are the wastes from the production and combustion of fuels used for energy and transportation. Together, process wastes and fuel-related wastes are reported as industrial solid waste. Postconsumer wastes are the wastes discarded by the end users of the product. Solid Waste by Weight For the systems of this analysis, all process wastes occur during the production of the container materials. The subsequent life cycle phases are fabrication, transport, or postconsumer processes and do not produce significant process wastes. Unlike process wastes, which occur only during the materials production phase of this analysis, fuel-

FRANKLIN ASSOCIATES, A Division of ERG
CLIENTS\TETRAPAK\KC016757.doc 10.16.06 3560.00.003.002
3-9
related wastes occur during all life cycle steps. Postconsumer wastes correspond directly to the weights of each container system. The paperboard systems have the lowest weight per delivered volume of wine and the lowest total solid wastes. The glass system has the highest weight per delivered volume of wine and the highest total solid wastes. Tables 3-5a and 3-5b show the solid wastes from the container systems for the United States and Canada. If the weight of industrial solid waste of one system is 25 percent different from another, it can be concluded that the difference is significant. If the weight of postconsumer solid waste of one system is 10 percent different from another, it can be concluded that the difference is significant. Percent difference is defined as the difference between two values divided by the average of the two values. (See Appendix B for an explanation of these certainty ranges.)
Process Fuel Postconsumer Total
Tetra Prisma (250 mL)Materials Production 30.5 26.4 0 56.8Container Production 0 06.7 0 06.7Secondary/Tertiary Packaging Production 7.76 19.2 0 27.0Transportation (from Winery to Distribution Center) 0 0.65 0 0.65Waste Management 0 0.20 153 153Total 38.2 53.1 153 244
Tetra Prisma (200 mL)Materials Production 30.2 24.7 0 54.9Container Production 0 08.3 0 08.3Secondary/Tertiary Packaging Production 8.73 21.6 0 30.3Transportation (from Winery to Distribution Center) 0 0.66 0 0.66Waste Management 0 0.18 150 150Total 38.9 55.4 150 244
Glass Bottle (187 mL)Materials Production 128 72.6 0 200Container Production 0 1.26 0 1.26Secondary/Tertiary Packaging Production 17.3 43.4 0 60.8Transportation (from Winery to Distribution Center) 0 6.25 0 6.25Waste Management 0 0.033 1,720 1,720Total 145 124 1,720 1,988
PET Bottle (187 mL)Materials Production 75.8 49.9 0 126Container Production 0 28.3 0 28.3Secondary/Tertiary Packaging Production 17.3 43.4 0 60.8Transportation (from Winery to Distribution Center) 0 1.60 0 1.60Waste Management 0 1.65 375 377Total 93.1 125 375 593
Source: Franklin Associates, a Division of ERG
Table 3-5a
SOLID WASTES BY WEIGHT FOR WINE CONTAINER SYSTEMS - UNITED STATES(per 1,000 liters)
Solid Wastes by Weight(lbs per 1,000 liters)

FRANKLIN ASSOCIATES, A Division of ERG
CLIENTS\TETRAPAK\KC016757.doc 10.16.06 3560.00.003.002
3-10
Solid Waste by Volume
Landfill density factors are used to convert weights of solid waste into volumes. Materials with a high landfill density occupy less landfill volume than equal weights of materials with lower landfill densities. Landfill density factors are based on landfill sampling studies (Estimates of the Volume of MSW and Selected Components in Trash Cans and Landfills, Prepared for The Council for Solid Waste Solutions by Franklin Associates, Ltd. and The Garbage Project. February 1990). The landfill density of the Tetra Brik and Tetra Prisma was estimated by calculating the weighted average of landfill densities of component materials (paperboard and plastic film) that comprise the Tetra Brik and Tetra Prisma. A constant factor (1,350 pounds per cubic yard) was used to convert process wastes from a weight basis to a volume basis. Thus, the discussion on the relative weights of process wastes of the container systems also applies to the relative volumes of process wastes. The same factor (1,350 pounds per cubic yard) was used to convert fuel wastes
Process Fuel Postconsumer Total
Tetra Prisma (250 mL)Materials Production 28.6 24.0 0 52.6Container Production 0 06.7 0 06.7Secondary/Tertiary Packaging Production 7.76 19.2 0 27.0Transportation (from Winery to Distribution Center) 0 0.65 0 0.65Waste Management 0 1.01 161 162Total 36.4 51.6 161 249
Tetra Prisma (200 mL)Materials Production 28.5 22.6 0 51.1Container Production 0 08.3 0 08.3Secondary/Tertiary Packaging Production 8.73 21.6 0 30.3Transportation (from Winery to Distribution Center) 0 0.66 0 0.66Waste Management 0 0.89 159 160Total 37.3 54.0 159 250
Glass Bottle (187 mL)Materials Production 112 71.2 0 183Container Production 0 1.26 0 1.26Secondary/Tertiary Packaging Production 17.3 43.4 0 60.8Transportation (from Winery to Distribution Center) 0 6.25 0 6.25Waste Management 0 0.032 1,505 1,505Total 129 122 1,505 1,756
PET Bottle (187 mL)Materials Production 75.2 47.9 0 123Container Production 0 28.3 0 28.3Secondary/Tertiary Packaging Production 17.3 43.4 0 60.8Transportation (from Winery to Distribution Center) 0 1.60 0 1.60Waste Management 0 2.67 398 401Total 92.5 124 398 615
Source: Franklin Associates, a Division of ERG
Table 3-5b
(lbs per 1,000 liters)
SOLID WASTES BY WEIGHT FOR WINE CONTAINER SYSTEMS - CANADA(per 1,000 liters)
Solid Wastes by Weight

FRANKLIN ASSOCIATES, A Division of ERG
CLIENTS\TETRAPAK\KC016757.doc 10.16.06 3560.00.003.002
3-11
from a weight basis to a volume basis. Thus, the discussion on the relative weights of fuel wastes for various container systems also applies to the relative volumes of fuel wastes. The greatest variation between the weight and volume of solid waste usually occurs in the category of postconsumer wastes, because different materials can have very different landfill densities. In particular, glass has a significantly higher landfill density than paperboard or plastic. The landfill density of glass is 2,800 pounds per cubic yard, while the landfill densities of the Tetra Pak and plastic containers are 500 and 355 pounds per cubic yard, respectively. A given weight of glass thus occupies a significantly lower landfill volume than equal weights of paperboard or plastic materials. Tables 3-6a and 3-6b show the solid wastes by volume for each container system. The volumes of postconsumer wastes were calculated by multiplying the weights in Tables 3-5a and 3-5b by the landfill densities of the containers.
Process Fuel Postconsumer Total
Tetra Prisma (250 mL)Materials Production 0.023 0.020 0 0.042Container Production 0 0.005 0 0.005Secondary/Tertiary Packaging Production 0.0057 0.014 0 0.020Transportation (from Winery to Distribution Center) 0 4.8E-04 0 4.8E-04Waste Management 0 1.5E-04 0.31 0.31Total 0.028 0.039 0.31 0.37
Tetra Prisma (200 mL)Materials Production 0.022 0.018 0 0.041Container Production 0 0.006 0 0.006Secondary/Tertiary Packaging Production 0.0065 0.016 0 0.022Transportation (from Winery to Distribution Center) 0 4.9E-04 0 4.9E-04Waste Management 0 1.3E-04 0.30 0.30Total 0.029 0.041 0.30 0.37
Glass Bottle (187 mL)Materials Production 0.095 0.054 0 0.15Container Production 0 9.3E-04 0 9.3E-04Secondary/Tertiary Packaging Production 0.013 0.032 0 0.045Transportation (from Winery to Distribution Center) 0 0.0046 0 0.0046Waste Management 0 2.5E-05 0.61 0.61Total 0.11 0.092 0.61 0.81
PET Bottle (187 mL)Materials Production 0.056 0.037 0 0.093Container Production 0 0.021 0 0.021Secondary/Tertiary Packaging Production 0.013 0.032 0 0.045Transportation (from Winery to Distribution Center) 0 0.0012 0 0.0012Waste Management 0 0.0012 1.06 1.06Total 0.069 0.092 1.06 1.22
Source: Franklin Associates, a Division of ERG
(cubic yards per 1,000 liters)
Table 3-6a
SOLID WASTES BY VOLUME FOR WINE CONTAINER SYSTEMS - UNITED STATES(per 1,000 liters)
Solid Wastes by Volume

FRANKLIN ASSOCIATES, A Division of ERG
CLIENTS\TETRAPAK\KC016757.doc 10.16.06 3560.00.003.002
3-12
ENVIRONMENTAL EMISSIONS Atmospheric and waterborne emissions for each system include process emissions and fuel emissions. Process emissions are released from process reactions or evaporative losses, or may result from equipment leaks, venting, or other losses during production or transport of a material. Fuel emissions result from the combustion of fuels. It is important to realize that interpretation of emissions data requires great care. The effect of the various emissions on humans and the environment are not fully known, and it is not valid to simply add the weights of various pollutants together to arrive at a total effect. The degree of potential environmental disruption due to environmental releases is not related to the weight of the releases in a simple way. Life cycle impact assessment (LCIA) is required to evaluate the potential impacts of different substances on human health and the environment. However, with the exception of the calculation of carbon dioxide equivalents, this analysis is limited to a life cycle inventory (LCI).
Process Fuel Postconsumer Total
Tetra Prisma (250 mL)Materials Production 0.021 0.018 0 0.039Container Production 0 0.005 0 0.005Secondary/Tertiary Packaging Production 0.0057 0.014 0 0.020Transportation (from Winery to Distribution Center) 0 4.8E-04 0 4.8E-04Waste Management 0 7.5E-04 0.32 0.32Total 0.027 0.038 0.32 0.39
Tetra Prisma (200 mL)Materials Production 0.021 0.017 0 0.038Container Production 0 0.006 0 0.006Secondary/Tertiary Packaging Production 0.0065 0.016 0 0.022Transportation (from Winery to Distribution Center) 0 4.9E-04 0 4.9E-04Waste Management 0 6.6E-04 0.32 0.32Total 0.028 0.040 0.32 0.39
Glass Bottle (187 mL)Materials Production 0.083 0.053 0 0.14Container Production 0 9.3E-04 0 9.3E-04Secondary/Tertiary Packaging Production 0.013 0.032 0 0.045Transportation (from Winery to Distribution Center) 0 0.0046 0 0.0046Waste Management 0 2.4E-05 0.54 0.54Total 0.096 0.091 0.54 0.72
PET Bottle (187 mL)Materials Production 0.056 0.035 0 0.091Container Production 0 0.021 0 0.021Secondary/Tertiary Packaging Production 0.013 0.032 0 0.045Transportation (from Winery to Distribution Center) 0 0.0012 0 0.0012Waste Management 0 0.0020 1.12 1.12Total 0.069 0.092 1.12 1.28
Source: Franklin Associates, a Division of ERG
(cubic yards per 1,000 liters)
SOLID WASTES BY VOLUME FOR WINE CONTAINER SYSTEMS - CANADA(per 1,000 liters)
Solid Wastes by Volume
Table 3-6b

FRANKLIN ASSOCIATES, A Division of ERG
CLIENTS\TETRAPAK\KC016757.doc 10.16.06 3560.00.003.002
3-13
If the weight of atmospheric emissions or waterborne emissions of a system is 25 percent different from another, it can be concluded that the difference is significant. Percent difference is defined as the difference between two values divided by the average of the two values. (See Appendix B for an explanation of these certainty ranges.) Atmospheric Emissions
The predominant atmospheric emissions for the container systems include greenhouse gases (carbon dioxide, methane, and nitrous oxide), volatile organic compounds (VOC), sulfur oxides, particulates, and other organic compounds. Some of these emissions (such as other organics, volatile organic compounds, or particulates) do not represent a distinct chemical species, but rather a general category of compounds with similar properties.
Fuel combustion atmospheric emissions are directly related to the energy requirements of the container systems and the profile of fuels used for energy. Thus, the same conclusions that were discussed in the energy section of this chapter can be applied to the atmospheric emissions from fuel combustion. An exception is energy of material resource (EMR). EMR is a measure of the energy content of fuel resources used as raw materials and represents a significant portion of total energy requirements for plastic materials but does not have associated fuel combustion emissions. Tables 3-7a and 3-7b show the greenhouse gases released by the container systems for the United States and Canada, respectively. The greenhouse gas emissions shown in these tables are multiplied by global warming potentials developed by the IPCC (Intergovernmental Panel on Climate Change). The global warming potentials are based on a 100-year time frame and represent the heat trapping capacity of the gases relative to an equal weight of carbon dioxide.
The carbon dioxide emissions from combustion of wood waste (a fuel used for paperboard production) are not included in the calculation of greenhouse gas emissions. By EPA convention, carbon dioxide released by wood combustion is considered part of the natural carbon cycle. In other words, when wood is burned, carbon dioxide consumed by the tree during its growth cycle is returned to the atmosphere, so there is no net increase in atmospheric carbon dioxide.

FRANKLIN ASSOCIATES, A Division of ERG
CLIENTS\TETRAPAK\KC016757.doc 10.16.06 3560.00.003.002
3-14
Tetra Prisma (250 mL)
Tetra Prisma(200 mL)
Glass Bottle (187 mL)
PET Bottle (187 mL)
carbon dioxide (fossil) 508 523 2,521 1,559methane 34.9 33.5 140 119nitrous oxide 13.9 14.1 27.8 21.7methyl bromide 1.9E-05 2.0E-05 3.6E-05 2.7E-05methyl chloride 2.0E-04 2.1E-04 3.8E-04 2.9E-04trichloroethane 6.7E-05 6.9E-05 1.3E-04 9.7E-05chloroform 4.2E-05 4.3E-05 7.9E-05 6.0E-05methylene chloride 0.0049 0.0049 0.0055 0.0053carbon tetrachloride 0.13 0.13 0.13 0.13
Total 557 571 2,690 1,699
GREENHOUSE GAS SUMMARY FOR WINE CONTAINER SYSTEMS - UNITED STATES(pounds of carbon dioxide equivalents per 1,000 liters)
Note: The 100 year global warming potentials used in this table are as follows: fossil carbon dioxide--1, methane--23, nitrous oxide--296, methyl bromide--5, methyl chloride--16, trichloroethane--140, chloroform--30, methylene chloride--10, and carbon tetrachloride--1800.
Table 3-7a
Tetra Prisma (250 mL)
Tetra Prisma(200 mL)
Glass Bottle (187 mL)
PET Bottle (187 mL)
carbon dioxide (fossil) 501 517 2,505 1,525methane 33.7 32.5 140 114nitrous oxide 13.2 13.5 27.7 21.5methyl bromide 1.8E-05 1.9E-05 3.6E-05 2.7E-05methyl chloride 1.9E-04 2.0E-04 3.8E-04 2.9E-04trichloroethane 6.4E-05 6.6E-05 1.3E-04 9.6E-05chloroform 4.0E-05 4.1E-05 7.9E-05 6.0E-05methylene chloride 0.0046 0.0046 0.0055 0.0053carbon tetrachloride 0.12 0.15 0.13 0.13
Total 548 563 2,673 1,660
(pounds of carbon dioxide equivalents per 1,000 liters)
Note: The 100 year global warming potentials used in this table are as follows: fossil carbon dioxide--1, methane--23, nitrous oxide--296, methyl bromide--5, methyl chloride--16, trichloroethane--140, chloroform--30, methylene chloride--10, and carbon tetrachloride--1800.
Table 3-7b
GREENHOUSE GAS SUMMARY FOR WINE CONTAINER SYSTEMS - CANADA

FRANKLIN ASSOCIATES, A Division of ERG
CLIENTS\TETRAPAK\KC016757.doc 10.16.06 3560.00.003.002
3-15
In addition to the greenhouse gas emissions shown above, a comprehensive list of the atmospheric emissions from the container systems is shown in Appendix C. Waterborne Emissions
The process-related waterborne emissions for the container systems include dissolved solids, suspended solids, COD (chemical oxygen demand), BOD (biological oxygen demand), chlorides, and various metals. No firm conclusions can be made from the waterborne emissions that result from the systems of this analysis. As stated earlier, the degree of potential environmental disruption due to environmental releases is not related to the weight of the releases in a simple way.
Fuel combustion waterborne emissions are directly related to the energy requirements of the container systems and the profile of fuels used for energy. Thus, the same conclusions that were discussed in the energy section of this chapter can be applied to the waterborne emissions from fuel combustion. One exception to this relationship is energy of material resource (EMR). As was the case with fuel-related atmospheric emissions, no fuel-related waterborne emissions are associated with energy of material resource.
A comprehensive list of the waterborne emissions from the container systems are shown in Appendix C. CONCLUSIONS A life cycle inventory (LCI) is an environmental profile that expresses environmental burdens from the perspective of energy consumption, solid waste generation, atmospheric emissions, and waterborne emissions. This LCI evaluated three types of container systems and found significant conclusions in three categories of environmental burdens: 1) energy requirements, 2) solid waste generation, and 3) greenhouse gas emissions. The LCI conclusions for each of these categories are summarized below. Energy Requirements
• There is a correlation between system weight and energy requirements. The paperboard systems have the lowest weight per delivered volume of wine and the lowest total energy requirements. The glass system has the highest weight per delivered volume of wine and the highest total energy requirements.
• The manufacture of container materials (from raw material extraction to container fabrication) accounts for the largest share of total energy for all container systems.
• The glass bottles have significantly higher transportation requirements than the paperboard containers or PET bottles.

FRANKLIN ASSOCIATES, A Division of ERG
CLIENTS\TETRAPAK\KC016757.doc 10.16.06 3560.00.003.002
3-16
• Compared to the glass and PET container systems, the paperboard container systems consume a lower percentage of fossil fuels (petroleum, natural gas, and coal) and a higher percentage of wood fuel. The consumption of wood fuel is due to the combustion of wood residues at paper mills. The paperboard and PET container systems consume a comparable percentage of hydropower, which is due to the aluminum components of both systems. A significant portion of the electricity used for primary aluminum smelting is generated from hydropower.
• The energy of material resource (EMR) is highest for the PET bottle system because PET resin is derived from petroleum feedstocks that could also be used as fuels. The paperboard container systems also have an EMR, which is attributable to the polyethylene and polypropylene components of the containers. The glass system has no EMR.
• Waste management does not account for a significant portion of total system energy. Changes in waste management scenarios do not significantly affect total energy requirements.
• Potential energy recovery from waste combustion is negligible for all systems of this analysis. However, the paperboard and PET container systems have a higher percentage of combustible material and thus have a greater potential for energy recovery than the glass container system.
Solid Wastes
• There is a correlation between system weight and solid waste. In particular, the weight of postconsumer waste is directly related to the weight of a product. The paperboard systems have the lowest weight per delivered volume of wine and the lowest total solid wastes. The glass system has the highest weight per delivered volume of wine and the highest total solid wastes.
• The greatest variation between the weight and volume of solid waste usually occurs in the category of postconsumer wastes, because different materials can have very different landfill densities. When expressed on a volume basis, the solid wastes of the container systems are closer than when expressed on a weight basis. This is attributable to the high density of glass; a given weight of glass will occupy significantly less volume than an equal weight of paperboard or plastic.
• With exception of the glass container system, the solid wastes of the container systems were not sensitive to a change in waste management scenarios.
Greenhouse Gas Emissions
• Greenhouse gas emissions are closely related to system energy, and thus the conclusions for system energy requirements also apply to system greenhouse gas emissions.

FRANKLIN ASSOCIATES, A Division of ERG
CLIENTS\TETRAPAK\KC016757.doc 10.16.06 3560.00.003.002
3-17
• One exception to the correlation between system energy and greenhouse gas emissions is the relationship between EMR (energy of material resource) and greenhouse gas emissions. Systems with a high EMR have relatively low greenhouse gas emissions when compared to systems with similar total energies but no EMR; when petroleum is used for material production, it is not burned as a fuel and thus does not release combustion emissions. The PET container system has the highest EMR of the three types of container systems of this analysis. However, regardless of its relatively high EMR, the total greenhouse gas emissions of the PET system are still higher than those of the paperboard systems.

FRANKLIN ASSOCIATES, A Division of ERG
CLIENTS\TETRAPAK\KC016757.doc 10.16.06 3560.00.003.002
4-1
CHAPTER 4
GREENHOUSE GAS EMISSIONS FROM WINE CONTAINER SYSTEMS
INTRODUCTION Historically, LCI studies have not included emissions from landfilled materials because of a lack of data of suitable quality. The primary greenhouse gas emissions are carbon dioxide (CO2) and methane (CH4). Until a few years ago, these emissions to the air were not of great interest, partly because they do not appear to create a significant threat to human health. Today they are of interest because of the rising concern about global warming.
The Tetra Pak wine container systems in this study contain paperboard that may degrade in a landfill. However, the paperboard components of these systems are laminated with plastics and aluminum foil, which will inhibit degradation.
The purpose of this chapter is to evaluate potential landfill emissions of greenhouse gases for Tetra Pak’s wine container systems in comparison to the greenhouse gas emissions reported in the LCI. Portions of this chapter are based on Appendix E, which discusses the degradation processes in landfills and develops emission factors for the degradation of paperboard in landfills. GREENHOUSE GAS EMISSIONS FROM LANDFILLS Solid wastes placed in a landfill undergo a number of simultaneous biological, chemical, and physical changes. These changes result in the production of landfill gas and leachate. The dominant components of landfill gas are carbon dioxide (CO2) and methane (CH4). The degradation processes that result in landfill emissions are very similar to natural processes outside landfills. These are primarily caused by aerobic and anaerobic microorganisms that are found over most of the earth. However, as opposed to natural degradation, placing degradable wastes in landfills will result in an increase in the fraction of material that degrades by anaerobic processes. This shift may cause differences in the global warming for different waste management scenarios. A key issue is that if biomass is left to degrade in nature, the predominant mechanism may result primarily in the conversion of carbon to CO2. If the biomass degrades in a landfill, the conversion of carbon to CH4 will dominate. Methane is considered to be many times more effective at causing global warming than CO2. The fate of degradable materials in a landfill is a very complex subject. Decomposition in a landfill proceeds mostly by anaerobic processes. Aerobic conditions exist when material is first disposed because air entrapped in the landfill, but within a few weeks the conditions become anaerobic. It may take decades for degradable material to decompose completely in a landfill, although many products are suspected to partially

FRANKLIN ASSOCIATES, A Division of ERG
CLIENTS\TETRAPAK\KC016757.doc 10.16.06 3560.00.003.002
4-2
decompose rapidly at first. The laminated paperboard considered in this study presents even greater resistance to degradation. The paperboard fiber is laminated with plastic and aluminum foil which inhibit contact between the paperboard fiber and moisture in the landfill. A detailed discussion of the degradation mechanisms in landfills is provided in Appendix E. The following discussion applies the factors developed in Appendix E to the Tetra Pak wine container systems. POTENTIAL EMISSIONS FROM LANDFILLED WINE CONTAINERS The Tetra Pak wine container systems use paperboard that can potentially degrade under landfill conditions. It is not possible to accurately estimate the emissions from landfills, but it is possible to make some approximate calculations that can put an upper limit on the greenhouse emissions. Appendix E develops the following emission factors for coated paperboard:
• 0.06 pounds of methane per pound dry weight of paperboard • 0.11 pounds of carbon dioxide per pound dry weight of paperboard
The above factors are used to develop maximum theoretical greenhouse gas emissions resulting from the landfilling of containers, which are shown in Tables 4-1a and 4-1b. As mentioned earlier, these values should be considered maximum values because the coatings and laminations will inhibit degradation. The following tables use the same functional unit as the other chapters of this report: the delivery of 1,000 liters of wine. Table 4-1a represents the waste management practices in the United States and Table 4-1b represents the waste management practices in Canada.
Pounds of Paperboard
Landfilled (1)(lbs)
Maximum Methane Emissions (2)
(lbs)
Maximum Carbon Dioxide Emissions (3)
(lbs)
Tetra Brik (1L) 45.8 2.75 5.03Tetra Prisma (1L) 43.3 2.60 4.76Tetra Prisma (500 mL) 50.7 3.04 5.57Tetra Prisma (250 mL) 62.1 3.73 6.83Tetra Prisma (200 mL) 57.2 3.43 6.29
(1) Pounds landfilled after recycling and waste to energy combustion of wine containers.(2) Based on 0.06 pounds of methane per pound of paperboard landfilled.(3) Based on 0.11 pounds of carbon dioxide per pound of paperboard landfilled.
Source: Franklin Associates, A Division of ERG
Table 4-1a
MAXIMUM THEORETICAL CARBON DIOXIDE AND METHANE EMISSIONSFROM LANDFILLING 1,000 LITERS OF WINE CONTAINERS
IN THE UNITED STATES

FRANKLIN ASSOCIATES, A Division of ERG
CLIENTS\TETRAPAK\KC016757.doc 10.16.06 3560.00.003.002
4-3
Pounds of Paperboard
Landfilled (1)(lbs)
Maximum Methane Emissions (2)
(lbs)
Maximum Carbon Dioxide Emissions (3)
(lbs)
Tetra Brik (1L) 38.8 2.33 4.27Tetra Prisma (1L) 36.8 2.21 4.04Tetra Prisma (500 mL) 43.0 2.58 4.73Tetra Prisma (250 mL) 52.7 3.16 5.80Tetra Prisma (200 mL) 48.5 2.91 5.34
(1) Pounds landfilled after recycling and waste to energy combustion of wine containers.(2) Based on 0.06 pounds of methane per pound of paperboard landfilled.(3) Based on 0.11 pounds of carbon dioxide per pound of paperboard landfilled.
Source: Franklin Associates, A Division of ERG
Table 4-1b
MAXIMUM THEORETICAL CARBON DIOXIDE AND METHANE EMISSIONSFROM LANDFILLING 1,000 LITERS OF WINE CONTAINERS
IN CANADA
COMPARISON OF LANDFILL EMISSIONS AND LCI EMISSIONS When the maximum potential landfill emission of carbon dioxide and methane are compared to the LCI emissions from cradle-to-disposal (the LCI results discussed in Chapters 2 and 3 of this report), the potential carbon dioxide emissions from landfill decomposition of the containers are small in comparison to LCI carbon dioxide emissions. The potential methane emissions from the degradation of Tetra Pak containers in landfills are twice as high as the methane emissions calculated for the LCI methane emissions. It is important to remember that the maximum potential landfill emissions represent decomposition of the entire paperboard content of the landfilled product. No factors are included to account for the effect of coatings and laminations in delaying or preventing decomposition, nor do the calculations include an estimate of the period of time over which the emissions might be released. Tables 4-2a and 4-2b compare the potential landfill emissions to the LCI CO2 and methane emissions discussed in Chapters 2 and 3 of this report. Table 4-2a represents the waste management practices in the United States, and Table 4-2b represents the waste management practices in Canada.

FRANKLIN ASSOCIATES, A Division of ERG
CLIENTS\TETRAPAK\KC016757.doc 10.16.06 3560.00.003.002
4-4
Maximum Landfill Methane
Emissions (1)(lbs)
LCI Total Methane Emissions (2)
(lbs)
Maximum Landfill Carbon Dioxide Emissions (1)
(lbs)
LCI Total Carbon Dioxide Emissions
(2)(lbs)
Tetra Brik (1L) 2.75 0.95 5.03 498Tetra Prisma (1L) 2.60 1.17 4.76 537Tetra Prisma (500 mL) 3.04 1.55 5.57 666Tetra Prisma (250 mL) 3.73 1.52 6.83 843Tetra Prisma (200 mL) 3.43 1.46 6.29 856
(1) From Table 4-1a(2) From Tables C-1a and C-1b. Includes process and fuel-related emissions.Carbon dioxide emissions include fossil and non-fossil emissions.
Source: Franklin Associates, A Division of ERG
Table 4-2a
CARBON DIOXIDE AND METHANE EMISSIONS FROM THE LIFE CYCLE OF 1,000 LITERS OF WINE CONTAINERS
IN THE UNITED STATESCOMPARED TO POTENTIAL EMISSIONS FROM LANDFILLING
Maximum Landfill Methane
Emissions (1)(lbs)
LCI Total Methane Emissions (2)
(lbs)
Maximum Landfill Carbon Dioxide Emissions (1)
(lbs)
LCI Total Carbon Dioxide Emissions
(2)(lbs)
Tetra Brik (1L) 2.33 0.92 4.27 475Tetra Prisma (1L) 2.21 1.13 4.04 516Tetra Prisma (500 mL) 2.58 1.50 4.73 641Tetra Prisma (250 mL) 3.16 1.46 5.80 813Tetra Prisma (200 mL) 2.91 1.41 5.34 829
(1) From Table 4-1b(2) From Tables C-3a and C-3b. Includes process and fuel-related emissions.Carbon dioxide emissions include fossil and non-fossil emissions.
Source: Franklin Associates, A Division of ERG
CARBON DIOXIDE AND METHANE EMISSIONS FROM THE LIFE CYCLE OF 1,000 LITERS OF WINE CONTAINERSCOMPARED TO POTENTIAL EMISSIONS FROM LANDFILLING
IN THE CANADA
Table 4-2b
LANDFILL EMISSIONS EXPRESSED AS CARBON DIOXIDE EQUIVALENTS If biomass is left to degrade in nature, the predominant mechanism for degradation is the aerobic conversion of carbon to CO2. Any CO2 that results from the landfill degradation of paper is carbon neutral because the tree consumed carbon dioxide during its growth cycle and the paper releases carbon dioxide when it decays, resulting in zero net carbon emissions. However, if biomass degrades by anaerobic activity (the predominant degradation mechanism in a landfill) carbon is converted to methane (CH4) instead of CO2. Methane is many times more effective at causing global warming than CO2. According to factors developed by the IPCC (Intergovernmental Panel on Climate

FRANKLIN ASSOCIATES, A Division of ERG
CLIENTS\TETRAPAK\KC016757.doc 10.16.06 3560.00.003.002
4-5
Change), a given weight of methane has 23 times the global warming potential as an equal weight of CO2. Using the IPCC factor of 23 for methane, Tables 4-3a and 4-3b express the potential methane emissions from the landfilling of wine containers in terms of carbon dioxide equivalents (Table 4-3a represents the waste management scenarios in the United States and Table 4-3b represents the waste management scenarios in Canada). The carbon dioxide emissions from the landfilling of wine containers are not included in these tables because they are considered carbon neutral. If the landfill carbon dioxide equivalents are added to the LCI carbon dioxide equivalents (the results discussed in Chapters 2 and 3 of this report), the total carbon dioxide equivalents are increased by 14 to 19 percent. Even with this increase, the total carbon dioxide equivalents of the Tetra Pak wine container systems are significantly lower than those of the glass bottle and plastic bottle systems of this analysis.
LCI Greenhouse Gas Emissions (1)
(lbs of CO2 Equivalents)
Maximum Landfill Greenhouse Gas Emissions (2)
(lbs of CO2 Equivalents)
LCI Greenhouse Gas Emissions+ Maximum Landfill Greenhouse
Gas Emissions(lbs of CO2 Equivalents)
Percent Increase in Greenhouse Gas Emissions
if Maximum Landfill Greenhouse Gas Emissions
are Included
Tetra Brik (1L) 333 63.1 396 19%Tetra Prisma (1L) 378 59.8 438 16%Tetra Prisma (500 mL) 484 69.9 554 14%Tetra Prisma (250 mL) 557 85.7 643 15%Tetra Prisma (200 mL) 571 78.9 650 14%
(1) From Tables ES-3 and ES-4. The LCI greenhouse gas emissions in this table do not agree with the total emissions in Table 4-2a; Table 4-2 shows both fossil and non-fossil carbon dioxide emissions and does not apply the global warming factor of 23 to methane emissions.(2) Calculated by multiplying the maximum landfill methane emissions in Table 4-2a by the global warming potential of 23 to arrive at carbon dioxide equivalents. Landfill emissions of carbon dioxide are not included because they represent aerobic decay of paper fiber, which is carbon neutral.
Source: Franklin Associates, A Division of ERG
Table 4-3a
GREENHOUSE GAS EMISSIONS FROM THE LIFE CYCLE OF 1,000 LITERS OF WINE CONTAINERSCOMPARED TO POTENTIAL GREENHOUSE GAS EMISSIONS FROM LANDFILLING
IN THE UNITED STATES
LCI Greenhouse Gas Emissions (1)
(lbs of CO2 Equivalents)
Maximum Landfill Greenhouse Gas Emissions (2)
(lbs of CO2 Equivalents)
LCI Greenhouse Gas Emissions+ Maximum Landfill Greenhouse
Gas Emissions(lbs of CO2 Equivalents)
Percent Increase in Greenhouse Gas Emissions
if Maximum Landfill Greenhouse Gas Emissions
are Included
Tetra Brik (1L) 327 53.6 380 16%Tetra Prisma (1L) 372 50.7 422 14%Tetra Prisma (500 mL) 476 59.3 535 12%Tetra Prisma (250 mL) 548 72.7 620 13%Tetra Prisma (200 mL) 563 67.0 630 12%
(1) From Tables ES-3 and ES-4. The LCI greenhouse gas emissions in this table do not agree with the total emissions in Table 4-2a; Table 4-2 shows both fossil and non-fossil carbon dioxide emissions and does not apply the global warming factor of 23 to methane emissions.(2) Calculated by multiplying the maximum landfill methane emissions in Table 4-2a by the global warming potential of 23 to arrive at carbon dioxide equivalents. Landfill emissions of carbon dioxide are not included because they represent aerobic decay of paper fiber, which is carbon neutral.
Source: Franklin Associates, A Division of ERG
GREENHOUSE GAS EMISSIONS FROM THE LIFE CYCLE OF 1,000 LITERS OF WINE CONTAINERSCOMPARED TO POTENTIAL GREENHOUSE GAS EMISSIONS FROM LANDFILLING
IN THE CANADA
Table 4-3b

FRANKLIN ASSOCIATES, A Division of ERG
CLIENTS\TETRAPAK\KC016757.doc 10.16.06 3560.00.003.002
4-6
SUMMARY
• Greenhouse gas emissions from landfills are potentially important to consider in LCI calculations, but it is premature to report them along with other LCI emissions data until an acceptable methodology for estimating actual releases is agreed upon by experts.
• Compared to the entire life cycle of paperboard, negligible carbon dioxide
emissions result from the landfill degradation of paperboard. Any carbon dioxide emissions that do result from landfill degradation of paperboard are considered carbon neutral because they do not result in a net increase in atmospheric carbon dioxide.
• Methane emissions result from the landfill degradation of paperboard.
Using IPCC factors, methane emissions can be expressed as carbon dioxide equivalents. The inclusion of carbon dioxide equivalents from landfill gas in the total LCI results increases the total LCI greenhouse gas emissions of the Tetra Pak systems by 14 to 19 percent. This increase is still less than the emissions of the glass and plastic wine container systems.

FRANKLIN ASSOCIATES, A Division of ERG
CLIENTS\TETRAPAK\KC016757.doc 10.16.06 3560.00.003.002
5-1
CHAPTER 5
SENSITIVITY OF LCI RESULTS TO POSTCONSUMER REYCLING RATES
INTRODUCTION
The original LCI model of this analysis assumed different recycling rates for the United States and Canada and demonstrated that total LCI energy and emissions do not change significantly with changes in recycling rates. Solid waste is the only environmental category that is directly related to recycling rates (recycling diverts materials from disposal). Based on comments received from the peer review panel and from representatives of Tetra Pak in Canada, the sensitivity of the LCI results to changes in recycling rates was further evaluated. The assumptions and results of the sensitivity analysis are presented below. (This chapter has not been peer reviewed.)
ASSUMPTIONS Assumptions for the sensitivity analysis include the recycling rates for the container systems, geography, and the LCI methodology used for open-loop and closed-loop recycling scenarios. Recycling Rates The postconsumer recycling rates of the container systems are shown in Table 5-1. These recycling rates are based on data provided by Tetra Pak’s Canadian operations. Tetra Pak contacted industry representatives throughout Canada to determine current recycling rates for postconsumer materials.
Table 5-1
RATES FOR POSTCONSUMER RECYCLING IN CANADA Tetra Brik or
Tetra Prisma Glass Bottle PET Bottle Recycling in Canada 27% 65% 55% Recycling in Ontario 13% 64% 50%
Geography The sensitivity analysis modeled national and provincial end-of-life scenarios for Canada and Ontario, respectively. The sensitivity analysis was not performed for end-of-life scenarios in the United States; however, the conclusions made for Canadian geography are applicable to the United States.

FRANKLIN ASSOCIATES, A Division of ERG
CLIENTS\TETRAPAK\KC016757.doc 10.16.06 3560.00.003.002
5-2
Recycling Methodology The sensitivity analysis used the same recycling methodology that was used for the original LCI. The recycling rates were the only variables that were changed. The Tetra Pak containers were modeled with an open-loop recycling scenario in which the paperboard material is used in two products: the material is first used in the Tetra Pak container and is then recycled into another product that uses paper fiber. The glass bottles were modeled with a closed-loop recycling scenario; container glass is recycled many times into the same type of product. The average postconsumer content of container glass is 27 percent. Thus, the model assumes that any recovery of glass bottles that exceeds 27 percent is diverted from disposal, but is not recycled into a container. The plastic (PET) containers were modeled with an open-loop recycling scenario in which the plastic material is used in two products: the material is first used in the plastic container and is then recycled into another product that uses PET resin. RESULTS The results of the sensitivity analysis (in terms of energy consumption, solid waste, and greenhouse gases) are shown in Tables 5-2 and 5-3. Table 5-2 shows the results for the multi-serving systems and Table 5-3 shows the results for the single-serving systems. (The format of these tables is the same as Tables ES-3 and ES-4 in the Executive Summary.)

FRANKLIN ASSOCIATES, A Division of ERG
CLIENTS\TETRAPAK\KC016757.doc 10.16.06 3560.00.003.002
5-3
EnergyTetra Brik (1 Liter) 3.13 MM Btu 145 lbs 0.22 cu yd 327 lbsTetra Prisma (1 Liter) 3.61 MM Btu 161 lbs 0.25 cu yd 373 lbsTetra Prisma (500 mL) 4.66 MM Btu 199 lbs 0.31 cu yd 479 lbsGlass Bottle (750 mL) 10.8 MM Btu 755 lbs 0.31 cu yd 1,903 lbsPET Bottle (750 mL) 7.43 MM Btu 279 lbs 0.55 cu yd 869 lbs
EnergyTetra Brik (1 Liter) 3.21 MM Btu 149 lbs 0.23 cu yd 332 lbsTetra Prisma (1 Liter) 3.71 MM Btu 165 lbs 0.25 cu yd 377 lbsTetra Prisma (500 mL) 4.78 MM Btu 205 lbs 0.31 cu yd 484 lbsGlass Bottle (750 mL) 10.8 MM Btu 771 lbs 0.32 cu yd 1,903 lbsPET Bottle (750 mL) 7.55 MM Btu 282 lbs 0.56 cu yd 875 lbs
(1) Postconsumer recovery rates in Canada: Tetra Brik and Tetra Prisma = 27%; Glass = 65%; PET = 50%(2) Postconsumer recovery rates in Ontario: Tetra Brik and Tetra Prisma = 13%; Glass = 64%; PET = 50%
Source: Franklin Associates, a Division of ERG
TOTAL ENERGY AND GREENHOUSE GAS EMISSIONS FOR MULTI-SERVING WINE CONTAINER SYSTEMS
(per 1,000 liters)
Solid Waste(weight and volume)
Solid Waste(weight and volume)
Greenhouse Gases(CO2 equivalents)
Greenhouse Gases(CO2 equivalents)
ONTARIO (2)
CANADA (1)
Table 5-2
EnergyTetra Prisma (250 mL) 5.16 MM Btu 249 lbs 0.39 cu yd 553 lbsTetra Prisma (200 mL) 5.11 MM Btu 250 lbs 0.39 cu yd 569 lbsGlass Bottle (187 mL) 16.6 MM Btu 1,076 lbs 0.48 cu yd 2,680 lbsPET Bottle (187 mL) 14.1 MM Btu 591 lbs 1.22 cu yd 1,614 lbs
EnergyTetra Prisma (250 mL) 5.30 MM Btu 256 lbs 0.40 cu yd 559 lbsTetra Prisma (200 mL) 5.23 MM Btu 256 lbs 0.40 cu yd 575 lbsGlass Bottle (187 mL) 16.6 MM Btu 1,094 lbs 0.49 cu yd 2,680 lbsPET Bottle (187 mL) 14.3 MM Btu 597 lbs 1.24 cu yd 1,621 lbs
(1) Postconsumer recovery rates in Canada: Tetra Brik and Tetra Prisma = 27%; Glass = 65%; PET = 50%(2) Postconsumer recovery rates in Ontario: Tetra Brik and Tetra Prisma = 13%; Glass = 64%; PET = 50%
Source: Franklin Associates, a Division of ERG
Table 5-3
TOTAL ENERGY AND GREENHOUSE GAS EMISSIONS FOR SINGLE-SERVING WINE CONTAINER SYSTEMS
(per 1,000 liters)
CANADA (1)Solid Waste
(weight and volume)Greenhouse Gases(CO2 equivalents)
ONTARIO (2)Solid Waste
(weight and volume)Greenhouse Gases(CO2 equivalents)

FRANKLIN ASSOCIATES, A Division of ERG
CLIENTS\TETRAPAK\KC016757.doc 10.16.06 3560.00.003.002
5-4
The energy requirements and greenhouse gas emissions shown in the above tables
are comparable to the results of the original LCI (see Tables ES-3 and ES-4 in the Executive Summary). The energy requirements and greenhouse gas emissions do not change significantly with changes in recycling rates. For example, the Canadian national recycling rate of Tetra Pak containers is 27 percent, which results in a total life cycle energy of 3.13 million Btu per 1,000 liters when wine is delivered in a one-liter Tetra Prisma. When the recycling rate for Tetra Pak containers is reduced to 13 percent (the Ontario recycling rate for Tetra Pak containers), the total life cycle energy per the same basis is 3.21 million Btu. Thus, when the Tetra Pak recycling rate is cut in half (from 27 percent to 13 percent), the total energy requirements of the one-liter Tetra Prisma containers increase by only 2.5 percent (from 3.13 million Btu to 3.21 million Btu per 1,000 liters). Similarly, the same recycling rate reduction results in only a 2.5 percent increase in total greenhouse gas emissions from the one-liter Tetra Prisma containers. This example focuses on the one-liter Tetra Prisma containers, but the relationship between recycling rates and LCI results are similar for the other Tetra Pak container systems of this analysis.
If the recycling rates for the glass bottles are greater than 27 percent, the energy
requirements and greenhouse gas emissions are not sensitive to a change in the recycling rate. This is due to the fact that the LCI model uses a closed loop recycling scenario (glass bottles are recycled into glass bottles) in which the maximum postconsumer content of glass containers is 27 percent. The LCI model assumes that any recovery of glass bottles that exceeds 27 percent is diverted from disposal (thus reducing postconsumer solid waste), but is not recycled into a container.
Solid wastes are sensitive to changes in recycling rates. However, even with the
relatively low recycling rates for the Tetra Pak systems, the Tetra Pak systems have lower solid wastes than the glass or PET systems. SUMMARY
• Energy requirements and greenhouse gas emissions do not change significantly with changes in postconsumer recycling rates. This is due to a couple reasons. First, the recovery and recycling of materials can incur energy requirements and greenhouse gas emissions comparable to the energy and emissions from the virgin production of the same types of materials. Second, end-of-life management (i.e., recycling and disposal) of materials is a small percentage of total life cycle burdens; the processes from raw material extraction through container fabrication represent the majority of life cycle burdens.
• Solid wastes are directly related to postconsumer recycling rates because recycling
diverts materials from disposal.

FRANKLIN ASSOCIATES, A Division of ERG
CLIENTS\TETRAPAK\KC016757.doc 10.16.06 3560.00.003.002
5-5
• The Tetra Pak systems have lower recycling rates than the glass and PET systems, but the solid wastes of the Tetra Pak systems are still lower than the other systems on a weight basis.

FRANKLIN ASSOCIATES, A Division of ERG
CLIENTS\TETRAPAK\KC016757.doc 10.16.06 3560.00.003.002
A-1
APPENDIX A
STUDY APPROACH AND METHODOLOGY INTRODUCTION The life cycle inventory presented in this study quantifies the total energy requirements, energy sources, atmospheric pollutants, waterborne pollutants, and solid waste resulting from the production of wine container systems. The methodology used for goal and scope definition and inventory analysis in this study is consistent with the methodology for Life Cycle Inventory (LCI)1 as described by the ISO 14040 and 14041 Standard documents. This analysis is not an impact assessment. It does not attempt to determine the fate of emissions, or the relative risk to humans or to the environment due to emissions from the systems. In addition, no judgments are made as to the merit of obtaining natural resources from various sources. A life cycle inventory quantifies the energy consumption and environmental emissions (i.e., atmospheric emissions, waterborne wastes, and solid wastes) for a given product based upon the study scope and boundaries established. Figure A-1 illustrates the general approach used in an LCI analysis. This LCI is a cradle-to-grave analysis, covering steps from raw material extraction through container disposal. The information from this type of analysis can be used as the basis for further study of the potential improvement of resource use and environmental emissions associated with the product. It can also pinpoint areas (e.g., material components or processes) where changes would be most beneficial in terms of reduced energy use or environmental emissions. GOALS OF THE STUDY The principal goal of this study is to evaluate the energy, solid wastes, and environmental emissions associated with the production of wine container systems.
1 SETAC. 1991. A Technical Framework for Life-Cycle Assessment. Workshop report from the Smugglers
Notch, Vermont, USA, workshop held August 18-23, 1990.

FRANKLIN ASSOCIATES, A Division of ERG
CLIENTS\TETRAPAK\KC016757.doc 10.16.06 3560.00.003.002
A-2
Final Disposition – Landfill,
Combustion, Recycle, or Reuse
Raw Materials Acquisition
Materials Manufacture
Product Manufacture
Product Use or
Consumption
Energy Energy Energy Energy Energy
Wastes Wastes Wastes Wastes
Reuse
Product Recycling One or limited number of return cycles into product that is then disposed = open-loop recycling
Repeated recycling into same or similar product, keeping material from disposal = closed-loop recycling
Figure A-1. General materials flow for “cradle-to-grave” analysis of a product
This LCI evaluates three types of container systems for wine: paperboard containers (specifically, the Tetra Brik™ and Tetra Prisma™), glass bottles, and PET (polyethylene terephthalate) bottles. The Tetra Brik and Tetra Prisma are laminated paperboard containers with volumes ranging from 200 milliliters to 1 liter. The alternative systems are glass bottles with volumes of 187 and 750 milliliters, and a PET bottle with a volume of 187 milliliter. The secondary packaging used for transporting filled containers from the winery to distribution center is also included. STUDY SCOPE Functional Unit
In order to provide a basis for the reporting of LCI results, a reference unit must be defined. The reference unit for an LCI is described in detail in the standards ISO 14040 and 14041. The reference unit is based upon the function of the product. This common basis, or functional unit, is used to normalize the inputs and outputs of the LCI.
A functional unit of equivalent volume was chosen for this analysis. Results are expressed on the basis of the delivery of 1,000 liters of wine. For the single-serving containers, this is equivalent to 4,000 250-milliliter containers, 5,000 200-milliliter containers, or 5,348 187-milliliter containers. For the multi-serving containers, this is equivalent to 2,000 500-liter containers, 1,333 750-milliliter containers, or 1,000 1-liter containers. A conventional case of wine contains 12 750-milliliter glass bottles, for a total volume of 9 liters. The basis of 1,000 liters of wine is thus equivalent to 111 cases of wine. System Boundaries
Beginning with acquisition of initial raw materials from the earth, this study examines the sequence of processing steps for the production of the container systems.

FRANKLIN ASSOCIATES, A Division of ERG
CLIENTS\TETRAPAK\KC016757.doc 10.16.06 3560.00.003.002
A-3
The distribution requirements for each system are included. The secondary packaging requirements for each system are included.
The postconsumer scenarios of each container system are also examined. This includes the landfilling, combustion with energy recovery, and recycling scenarios for each system. The postconsumer recycling rates for the U.S. and Canada are compared. Description of Data Categories
Key elements of the LCI methodology include the resource inventory (raw materials and energy), emissions inventory (atmospheric, waterborne, and solid waste), and disposal practices.
Figure A-2 illustrates the basic approach to data development for each major process in an LCI analysis. This approach provides the essential building blocks of data used to construct a complete resource and environmental emissions inventory profile for the entire life cycle of a product. Using this approach, each individual process included in the study is examined as a closed system, or “black box”, by fully accounting for all resource inputs and process outputs associated with that particular process. Resource inputs accounted for in the LCI include raw materials and energy use, while process outputs accounted for include products manufactured and environmental emissions to land, air, and water.
ManufacturingProcess
EnergyRequirements
AirEmissions
SolidWastes
WaterborneEmissions
Raw Material A
Raw Material B
Raw Material C
Product
Useful By-Product A
Useful By-Product B
Figure A-2. "Black box" concept for developing LCI data

FRANKLIN ASSOCIATES, A Division of ERG
CLIENTS\TETRAPAK\KC016757.doc 10.16.06 3560.00.003.002
A-4
Material Requirements. Once the LCI study boundaries have been defined and the individual processes identified, a material balance is performed for each individual process. This analysis identifies and quantifies the input raw materials required per standard unit of output, such as 1,000 pounds, for each individual process included in the LCI. The purpose of the material balance is to determine the appropriate weighting factors used in calculating the total energy requirements and environmental emissions associated with the systems studied. Energy requirements and environmental emissions are determined and expressed in terms of the standard unit of output. Once the detailed material balance has been established for a standard unit of output for each process included in the LCI, a comprehensive material balance for the entire life cycle of the system is constructed. This analysis determines the quantity of materials required from each process to produce and dispose of the required quantity of each system component and is typically illustrated as a flow chart. Data must be gathered for each process shown in the flow diagram, and the weight relationships of inputs and outputs for the various processes must be developed.
Energy Requirements. The average energy requirements for each industrial process are first quantified in terms of fuel or electricity units such as cubic feet of natural gas, gallons of diesel fuel, or kilowatt-hours (kWh) of electricity. Transportation requirements are developed in the conventional units of ton-miles by each transport mode (e.g. truck, rail, barge, etc.). Statistical data for the average efficiency of each transportation mode are used to convert from ton-miles to fuel consumption.
Once the fuel consumption for each industrial process and transportation step is quantified, the fuel units are converted to energy units (Btu) using standard energy factors. These conversion factors have been developed to account for the energy required to extract, transport, and process the fuels and to account for the energy content of the fuels. The energy to extract, transport, and process fuels into a usable form is referred to in this report as “precombustion energy” (precombustion energy is also commonly referred to in the life cycle literature as “upstream energy”). For electricity, precombustion energy calculations include adjustments for the average efficiency of conversion of fuel to electricity and for transmission losses in power lines.
The LCI methodology assigns raw materials that are derived from fossil fuels with their fuel-energy equivalent. Therefore, the total energy requirement for coal, natural gas, or petroleum-based raw materials includes the fuel energy of the material (called energy of material resource or inherent energy). No fuel-energy equivalent is assigned to combustible materials, such as wood, that are not major fuel sources in the United States. For example, in an LCI of paperboard, the calorific value of the wood fiber that is used to make the paperboard would not be included in the energy analysis.
The Btu values for fuels and electricity consumed in each industrial process are summed and categorized into an energy profile according to the six major energy sources listed below:
FRANKLIN ASSOCIATES, A Division of ERG
CLIENTS\TETRAPAK\KC016757.doc 10.16.06 3560.00.003.002
A-5
• Natural gas • Petroleum • Coal • Hydropower • Nuclear • Wood-derived
Also included in the systems energy profile are the Btu values for all transportation
steps and all fossil fuel-derived raw materials. An additional electricity generation category “Other” includes the portion of electricity generated from sources such as wind and solar power. Environmental Emissions. Environmental emissions include air pollutants, solid wastes, and waterborne wastes. Through various data sources identified later in this appendix, every effort is made to obtain actual industry data. Emission standards are often used as a guide when operating data are not available. It is not uncommon for data provided by some individual plants to be more complete than that submitted by others. Other factors, such as the measuring and reporting methods used, also affect the quality of air and waterborne emissions data. This makes comparison of the air and waterborne emissions between the systems more difficult. Comparisons of LCA databases have shown that airborne and waterborne pollutant emissions for a particular material production inventory can easily vary by 200 percent. Energy and solid waste values are generally more agreeable between databases. The best use of the detailed air and waterborne emissions data at this point in time is for internal improvement. A close look at the reason for certain air or waterborne pollutants within each system may identify areas where process or material changes could reduce emissions.
Substances may be reported in speciated or unspeciated form, depending on the compositional information available. General categories such as “Acid” and “Metal Ion” are used to report unspeciated data. Emissions are reported only in the most descriptive single category applicable; speciated data are not reported again in the broadly applicable unspeciated category. For example, emissions reported as “HCl” are not additionally reported under the category “Acid,” nor are emissions reported as “Chromium” additionally reported under “Metal Ion.”
The scope of this analysis is to identify what wastes are generated through a cradle-to-grave analysis of the system being examined. No attempt has been made to determine the relative environmental effects of these pollutants. Atmospheric Emissions. These emissions include carbon dioxide and all other substances classified as air pollutants. Emissions are reported as pounds of pollutant per functional unit. The amounts reported represent actual discharges into the atmosphere after existing emission control devices. The emissions associated with the combustion of fuel for process or transportation energy as well as the process emissions are included in
FRANKLIN ASSOCIATES, A Division of ERG
CLIENTS\TETRAPAK\KC016757.doc 10.16.06 3560.00.003.002
A-6
the analysis. Some of the most commonly reported atmospheric emissions are particulates, nitrogen oxides, hydrocarbons, sulfur oxides, and carbon monoxide. In one case, the evaluation of greenhouse gas emissions, this study applies the LCI results to LCIA (life cycle impact assessment). Global warming potentials (GWP) are used to normalize various greenhouse gas emissions to the basis of carbon dioxide equivalents. The use of global warming potentials is a standard LCIA practice. Waterborne Wastes. As with atmospheric emissions, waterborne wastes include all substances classified as pollutants. Waterborne wastes are reported as pounds of pollutant per functional unit. The values reported are the average quantity of pollutants still present in the wastewater stream after wastewater treatment and represent discharges into receiving waters. Some of the most commonly reported waterborne wastes are biochemical oxygen demand (BOD), chemical oxygen demand (COD), suspended solids, dissolved solids, iron, chromium, acid, and ammonia. Solid Wastes. This category includes solid wastes generated from all sources that are landfilled or disposed in some other way. This also includes materials that are burned to ash at combustion facilities. It does not include materials that are recycled or coproducts. When a product is evaluated on an environmental basis, attention is often focused on postconsumer wastes. Industrial wastes generated during the manufacture of the product are sometimes overlooked. Industrial solid wastes include wastewater treatment sludges, solids collected in air pollution control devices, trim or waste materials from manufacturing operations that are not recycled, fuel combustion residues such as the ash generated by burning coal or wood, and mineral extraction wastes. Waste materials that are left on-site or diverted from landfill and returned to the land without treatment (e.g., overburden returned to mine site, forest residues left in the forest to decompose) are not reported as wastes. Inclusion of Inputs and Outputs Franklin Associates commonly uses a mass basis to decide if materials should be included in an analysis; however, it is recognized that use of mass exclusion criteria could result in oversight of minor constituents that are highly toxic. Before the decision is made to exclude a material from the study based on its mass, the analyst evaluates the likelihood of significant energy, solid waste, or emissions burdens associated with the material. Any material less than one percent of the mass in the system is generally considered negligible if its contributions are estimated to be negligible, based on the information available to the analyst. In some cases materials that have small mass but potentially significant burdens may have to be excluded from the study because of the unavailability of LCI data, particularly for proprietary or chemically complex substances; in such cases, the exclusions are specifically noted in the study limitations. Further discussion on this topic specific to this study can be found later in this chapter in the section System Components Not Included, subsection Miscellaneous Materials and Additives.

FRANKLIN ASSOCIATES, A Division of ERG
CLIENTS\TETRAPAK\KC016757.doc 10.16.06 3560.00.003.002
A-7
DATA The accuracy of the study is only as good as the quality of input data. The development of methodology for the collection of data is essential to obtaining quality data. Careful adherence to that methodology determines not only data quality but also objectivity. Franklin Associates has developed a methodology for incorporating data quality and uncertainty into LCI calculations. Data quality and uncertainty are discussed in more detail at the end of this section. Data necessary for conducting this analysis are separated into two categories: process-related data and fuel-related data. Process Data Methodology for Collection/Verification. The process of gathering data is an iterative one. The data-gathering process for each system begins with a literature search to identify raw materials and processes necessary to produce the final product. The search is then extended to identify the raw materials and processes used to produce these raw materials. In this way, a flow diagram is systematically constructed to represent the production pathway of each system. Each process identified during the construction of the flow diagram is then researched to identify potential industry sources for data. Each source for process data is contacted and worksheets are provided to assist in gathering the necessary process data for their product. Each worksheet is accompanied by a description of the process boundaries. Upon receipt of the completed worksheets, the data are evaluated for completeness and reviewed for any material inputs that are additions or changes to the flow diagrams. In this way, the flow diagram is revised to represent current industrial practices. Data suppliers are then contacted again to discuss the data, process technology, waste treatment, identify coproducts, and any assumptions necessary to understand the data and boundaries. After each dataset has been completed and verified, the datasets for each process are aggregated into a single set of data for that process. The method of aggregation for each process is determined on a case-by-case basis. For example, if more than one process technology is involved, market shares for these processes are used to create a weighted average. In this way, a representative set of data can be estimated from a limited number of data sources. The provided process dataset and assumptions are then documented and returned with the aggregated data to each data supplier for their review. At times, the scope or budget of an analysis do not allow for primary data collection. In this case, secondary data sources are used. These sources may be other LCI databases, government documents, or literature sources.

FRANKLIN ASSOCIATES, A Division of ERG
CLIENTS\TETRAPAK\KC016757.doc 10.16.06 3560.00.003.002
A-8
Confidentiality. Potential suppliers of data often consider the data requested in the worksheets proprietary. The method used to collect and review data provides each supplier the opportunity to review the aggregated average data calculated from all data supplied by industry. This allows each supplier to verify that their company’s data are not being published and that the averaged data are not aggregated in such a way that individual company data can be calculated or identified. Objectivity. Each unit process is researched independently of all other processes. No calculations are performed to link processes together with the production of their raw materials until after data gathering and review are complete. The procedure of providing the aggregated data and documentation to suppliers and other industry experts provides several opportunities to review the individual data sets without affecting the objectivity of the research. This process serves as an external expert review of each process. Also, because these data are reviewed individually, assumptions are reviewed based on their relevance to the process rather than their effect on the overall outcome of the study. Data Sources. Many of the process data sets used in this study were drawn from Franklin Associates’ U.S. LCI database, which was developed using the data collection and review process described above. Data for the production of the Tetra Brik and Tetra Prisma, including the production of laminated paperboard, were provided by Tetra Pak. Fuel Data When fuels are used for process or transportation energy, there are energy and emissions associated with the production and delivery of the fuels as well as the energy and emissions released when the fuels are burned. Before each fuel is usable, it must be mined, as in the case of coal or uranium, or extracted from the earth in some manner. Further processing is often necessary before the fuel is usable. For example, coal is crushed or pulverized and sometimes cleaned. Crude oil is refined to produce fuel oils, and “wet” natural gas is processed to produce natural gas liquids for fuel or feedstock. To distinguish between environmental emissions from the combustion of fuels and emissions associated with the production of fuels, different terms are used to describe the different emissions. The combustion products of fuels are defined as “combustion data.” Energy consumption and emissions that result from the mining, refining, and transportation of fuels are defined as “precombustion data.” Precombustion data and combustion data together are referred to as “fuel-related data.” Fuel-related data are developed for fuels that are burned directly in industrial furnaces, boilers, and transport vehicles. Fuel-related data are also developed for the production of electricity. These data are assembled into a database from which the energy requirements and environmental emissions for the production and combustion of process fuels are calculated. Energy data are developed in the form of units of each primary fuel required per unit of each fuel type. For electricity production, International Energy Agency statistical

FRANKLIN ASSOCIATES, A Division of ERG
CLIENTS\TETRAPAK\KC016757.doc 10.16.06 3560.00.003.002
A-9
records provided data for the amount of fuel required to produce electricity from each fuel source and the total amount of electricity generated from petroleum, natural gas, coal, nuclear, hydropower, and other (solar, geothermal, etc.). Literature sources and U.S. federal government statistical records provided data for the emissions resulting from the combustion of fuels in utility boilers, industrial boilers, stationary equipment such as pumps and compressors, and transportation equipment. Because electricity is required to produce primary fuels, which are in turn used to generate electricity, a circular loop is created. Iteration techniques are utilized to resolve this loop. In 2003, Franklin Associates updated their fuels and energy database for inclusion in the U.S. LCI database. With the exception of the electricity fuel sources and generation, this U.S. fuels and energy database is used in this analysis. Because of differences in national environmental emissions regulations, as well as differences in fuel characteristics, the use of U.S. emissions factors may not be entirely representative of emissions for Europe. Data Quality Goals for This Study
ISO standards 14040, 14041 and 14043 each detail various aspects of data quality and data quality analysis. ISO 14041 Section 5.3.6 states: “Descriptions of data quality are important to understand the reliability of the study results and properly interpret the outcome of the study.” The section goes on to list three critical data quality requirements: time-related coverage, geographical coverage, and technology coverage. Additional data quality descriptors that should be considered include whether primary or secondary data were used and whether the data were measured, calculated, or estimated.
The data quality goal for this study is to use the best available and most representative data for the materials used and processes performed in terms of time, geographic, and technology coverage.
All fuel data were reviewed and updated in 2003 for the United States. Electricity fuel sources and generation meet all the data quality goals. Data Accuracy An important issue to consider when using LCI study results is the reliability of the data. In a complex study with literally thousands of numeric entries, the accuracy of the data and how it affects conclusions is truly a complex subject, and one that does not lend itself to standard error analysis techniques. Techniques such as Monte Carlo analysis can be used to study uncertainty, but the greatest challenge is the lack of uncertainty data or probability distributions for key parameters, which are often only available as single point estimates. However, the reliability of the study can be assessed in other ways. A key question is whether the LCI profiles are accurate and study conclusions are correct. It is important that the environmental profiles accurately reflect the relative magnitude of energy requirements and other environmental burdens for the various materials analyzed.

FRANKLIN ASSOCIATES, A Division of ERG
CLIENTS\TETRAPAK\KC016757.doc 10.16.06 3560.00.003.002
A-10
The accuracy of an environmental profile depends on the accuracy of the numbers
that are combined to arrive at that conclusion. Because of the many processes required to produce wine containers, many numbers in the LCI are added together for a total numeric result. Each number by itself may contribute little to the total, so the accuracy of each number by itself has a small effect on the overall accuracy of the total. There is no widely accepted analytical method for assessing the accuracy of each number to any degree of confidence. There are several other important points with regard to data accuracy. Each number generally contributes a small part to the total value, so a large error in one data point does not necessarily create a problem. For process steps that make a larger than average contribution to the total, special care is taken with the data quality. It is assumed that with careful scrutiny of the data, any errors will be random. That is, some numbers will be a little high due to errors, and some will be slightly low, but in the summing process these random high and low errors will offset each other to some extent. There is another dimension to the reliability of the data. Certain numbers do not stand alone, but rather affect several numbers in the system. An example is the amount of a raw material required for a process. This number will affect every step in the production sequence prior to the process. Errors such as this that propagate throughout the system are more significant in steps that are closest to the end of the production sequence. For example, changing the weight of an input to the fabrication of a container changes the amounts of the inputs to that process, and so on back to the quantities of raw materials.
In summary, for the particular data sources used and for the specific methodology described in this report, the results of this report are believed to be as accurate and reasonable as possible. METHODOLOGY
There is general consensus among life cycle practitioners on the fundamental methodology for performing LCIs, as described in ISO Standards 14040-14041, and the series of documents developed under the leadership of SETAC in Europe and the U.S2. For some specific aspects of life cycle inventory, however, there is more than one methodological approach that may be used. These areas include: the method used to allocate energy requirements and environmental releases among more than one useful product produced by a process; the method used to account for the energy contained in material feedstocks; recycling of materials; and greenhouse gas accounting. LCI practitioners vary to some extent in their approaches to these issues. The following sections describe the approach to each issue used in this study and the justification for the approach used.
2 SETAC. 1993. Guidelines for Life-Cycle Assessment: A “Code of Practice.” 1st ed. Workshop report from the
Sesimbra, Portugal, workshop held March 31 through April 3, 1993.

FRANKLIN ASSOCIATES, A Division of ERG
CLIENTS\TETRAPAK\KC016757.doc 10.16.06 3560.00.003.002
A-11
Coproduct Credit One unique feature of life cycle inventories is that the quantification of inputs and outputs are related to a specific amount of product from a process. However, controversy in LCI studies often occurs because it is sometimes difficult or impossible to identify which inputs and outputs are associated with one of multiple products from a process. The practice of allocating inputs and outputs among multiple products from a process is often referred to as “coproduct credit”3 or “partitioning”4.
Coproduct credit is done out of necessity when raw materials and emissions cannot be directly attributed to one of several product outputs from a system. It has long been recognized that the practice of giving coproduct credit is less desirable than being able to identify which inputs lead to particular outputs. It is possible to divide a larger process into sub-processes. To use this approach, data must be available for sub-processes. In many cases, this may not be possible either due to the nature of the process or to less detailed data. Eventually, a sub-process will be reached where it is necessary to allocate energy and emissions among multiple products based on some calculated ratio. The method of calculating this ratio is subject to much discussion among LCA researchers, and various methods of calculating this ratio are discussed in literature.5,6,7,8,9 Where allocation of energy and emissions among multiple products based on a calculated ratio is necessary in this study, the ratio is calculated based on the relative mass outputs of products, which is the most common approach by experienced practitioners. Figure A-3 illustrates the concept of coproduct allocation on a mass basis.
3 Hunt, Robert G., Sellers, Jere D., and Franklin, William E. Resource and Environmental Profile Analysis: A
Life Cycle Environmental Assessment for Products and Procedures. Environmental Impact Assessment Review. 1992; 12:245-269.
4 Boustead, Ian. Eco-balance Methodology for Commodity Thermoplastics. A report for The Centre for Plastics in the Environment (PWMI). Brussels, Belgium. December, 1992.
5 Hunt, Robert G., Sellers, Jere D., and Franklin, William E. Resource and Environmental Profile Analysis: A Life Cycle Environmental Assessment for Products and Procedures. Environmental Impact Assessment Review. 1992; 12:245-269.
6 Boustead, Ian. Eco-balance Methodology for Commodity Thermoplastics. A report for The Centre for Plastics in the Environment (PWMI). Brussels, Belgium. December, 1992.
7 SETAC. 1993. Guidelines for Life-Cycle Assessment: A “Code of Practice.” 1st ed. Workshop report from the Sesimbra, Portugal, workshop held March 31 through April 3, 1993.
8 Life-Cycle Assessment: Inventory Guidelines and Principles. Risk Reduction Engineering Laboratory, Office of Research and Development, United States Environmental Protection Agency. EPA/600/R-92/245. February, 1993.
9 Product Life Cycle Assessment–Principles and Methodology. Nord 1992:9. ISBN 92 9120 012 3.

FRANKLIN ASSOCIATES, A Division of ERG
CLIENTS\TETRAPAK\KC016757.doc 10.16.06 3560.00.003.002
A-12
Energy of Material Resource For some raw materials, such as petroleum, natural gas, and coal, the amount consumed in all applications as fuel far exceeds the amount consumed as raw materials (feedstock) for products. The primary use of these materials is for energy. The total amount of these materials can be viewed as an energy pool or reserve. This concept is illustrated in Figure A-4.
ManufacturingPlant
ManufacturingPlant
1,600 pounds ofraw materials
Energy3 x 109 Btu
1,000 pounds of product
500 pounds of coproduct
100 poundsof wastes
Energy2 x 109 Btu
1,067 pounds ofraw materials 1,000 pounds of product
67 poundsof wastes
Figure A-3. Flow diagram illustrating coproduct mass allocation for a product.
Using coproduct allocation, the flow diagram utilized in the LCI for the main product, whichaccounts for 2/3 of the output, would be as shown below.

FRANKLIN ASSOCIATES, A Division of ERG
CLIENTS\TETRAPAK\KC016757.doc 10.16.06 3560.00.003.002
A-13
The use of a certain amount of these materials as feedstocks for products, rather than as fuels, removes that amount of material from the energy pool, thereby reducing the amount of energy available for consumption. This use of available energy as feedstock is called the “energy of material resource” and is included in the inventory. The energy of material resource represents the amount the energy pool is reduced by the consumption of fuel materials as raw materials in products and is quantified in energy units.
Wood
Oleochemicals
Nuclear Material
Petroleum
Coal
Natural Gas
Energy Pool (Fuel Resources)
Non-Fuel Resources
Total Resources
Figure A-4. Illustration of the Energy of Material Resource concept.
The energy of material resource is the energy content of the fuel materials input as raw materials or feedstocks. The energy of material resource assigned to a material is not the energy value of the final product, but is the energy value of the raw material at the point of extraction from its natural environment. For fossil fuels, this definition is straightforward. For instance, petroleum is extracted in the form of crude oil. Therefore, the energy of material resource for petroleum is the higher heating value of crude oil. Once the feedstock is converted to a product, there is energy content that could be recovered, for instance through combustion in a waste-to-energy waste disposal facility. The energy that can be recovered in this manner is always somewhat less than the feedstock energy because the steps to convert from a gas or liquid to a solid material reduces the amount of energy left in the product itself. The materials which are primarily used as fuels can change over time and with location. In the industrially developed countries included in this analysis, the material resources whose primary use is for fuel are petroleum, natural gas, coal, and nuclear
FRANKLIN ASSOCIATES, A Division of ERG
CLIENTS\TETRAPAK\KC016757.doc 10.16.06 3560.00.003.002
A-14
material. While some wood is burned for energy, the primary use for wood is as a material input for products such as paper and lumber. Similarly, some oleochemical oils such as palm oils are burned for fuels, often referred to as “bio-diesel.” However, as in the case of wood, their primary consumption is as raw materials for products such as soaps, surfactants, cosmetics, etc. Recycling Recycling is a means to reduce the environmental burdens for production of materials and to divert materials from the municipal solid waste stream at end of life. When recycling scenarios are included in LCI models, the environmental burdens are allocated among product systems based on the number of times a material is recycled as well as whether closed-loop or open-loop recycling occurs. This analysis allocates the burdens for virgin material production and end-of-life disposal among all systems that use the material, whether it is the first system using the virgin material or the last system using postconsumer material recovered from a previous useful life. Each useful life of the material carries its own fabrication and use burdens. Recovery and reprocessing burdens are allocated to each useful life of the recycled material using the equation (R x n)/(n+1), where R is the recycling burdens and n is the number of times the material is recycled. Thus, (n+1) is the total number of useful lives of the material: initial use + recycled uses. For material that is recycled once, n=1; thus, the equation reduces to R/2, and half the recycling burdens are allocated to each useful life. The Tetra Pak containers and PET bottles of this analysis are assumed to be recycled once (n=1), and the above recycling methodology was used to allocate the virgin material requirements and end-of-life environmental burdens among the two useful lives of the materials. Closed-loop recycling is assumed for the glass bottles. Greenhouse Gas Accounting
Emissions that contribute to global warming include carbon dioxide, methane, and nitrous oxide. Carbon dioxide emissions generally dominate life cycle greenhouse gas emission profiles. Although carbon dioxide emissions can come from a variety of life cycle processes, the predominant sources are combustion of fuels for process and transportation energy.
It is recognized that the combustion of postconsumer products in waste-to-energy facilities produces atmospheric and waterborne emissions; however, these emissions are not included in this study. Allocating atmospheric and waterborne wastes from municipal combustion facilities to specific product systems is not feasible, due to the variety of materials present in combusted municipal solid waste. Theoretical carbon dioxide emissions from incinerated containers could be calculated based on their carbon content and assuming complete oxidation; however, this may not be an accurate representation of the results of mixed MSW combustion. Therefore, this analysis does not account for end-of-life carbon sequestration from landfilling materials, nor does it include greenhouse gas emissions from decomposition of materials in landfills or from combustion of postconsumer solid wastes in municipal mixed-waste incinerators.

FRANKLIN ASSOCIATES, A Division of ERG
CLIENTS\TETRAPAK\KC016757.doc 10.16.06 3560.00.003.002
A-15
GENERAL DECISIONS
Some general decisions are always necessary to limit a study such as this to a reasonable scope. It is important to know what those decisions are. The principal decisions and limitations for this study are discussed in the following sections. Geographic Scope
The systems in this analysis were modeled using Franklin Associates’ proprietary life cycle inventory databases and models. The Franklin Associates databases and models are based on U.S. data.
In the Franklin Associates’ database, there are a few data sets that include processes that occur outside of North America. Data for these processes are generally not available. This is usually only a consideration for the production of oil that is obtained from overseas. In cases such as this, the energy requirements and emissions are assumed to be the same as if the materials originated in North America. Since foreign standards and regulations vary from those in the United States, it is acknowledged that this assumption will likely introduce error. Emissions data for oil production include U.S. data for unflared methane emissions but do not include fossil carbon dioxide emissions from flaring of natural gas. In the U.S. flaring is usually done as a last resort to minimize the global warming impact of methane releases that are unavoidable or are too small to capture economically; however, methane flaring may be practiced to a greater extent in overseas countries. Fuel usage for transportation of materials from overseas locations is included in the study. Precombustion Energy and Emissions
In addition to the energy obtained from combustion of a fuel, energy is required for resource extraction, processing, and transportation to deliver the fuel in the form in which it is used. In this study, this additional energy is called precombustion energy. Precombustion energy refers to all the energy that must be expended to prepare and deliver the primary fuel. Adjustments for losses during transmission, spills, leaks, exploration, and drilling/mining operations are incorporated into the calculation of precombustion energy.
Precombustion environmental emissions (air, waterborne, and solid waste) are also associated with the acquisition, processing, and transportation of the primary fuel. These precombustion emissions are added to the emissions resulting from the burning of the fuels. Electricity Fuel Profile
In general, detailed data do not exist on the fuels used to generate the electricity consumed by each industry. Electricity production and distribution systems in the United

FRANKLIN ASSOCIATES, A Division of ERG
CLIENTS\TETRAPAK\KC016757.doc 10.16.06 3560.00.003.002
A-16
States are interlinked and are not easily separated. Users of electricity, in general, cannot specify the fuels used to produce their share of the electric power grid. Electricity generated on-site at a manufacturing facility is represented in the process data by the fuels used to produce it. A portion of on-site generated electricity is sold to the electricity grid. This portion is accounted for in the calculations for the fuel mix in the grid. System Components Not Included
The following components of each system are not included in this study: Capital Equipment. The energy and wastes associated with the manufacture of capital equipment are not included. This includes equipment to manufacture buildings, motor vehicles, and industrial machinery. These types of capital equipment are used to produce large quantities of product output over a useful life of many years. Thus, energy and emissions associated with production of these facilities and equipment generally become negligible when allocated to 1,000-pound product output modules. Space Conditioning. The fuels and power consumed to heat, cool, and light manufacturing establishments are omitted from the calculations in most cases. Space conditioning was not explicitly included in the scope of the study; however, primary LCI unit process data are often based on overall facility utility use and may include some space conditioning data.
For most industries, space conditioning energy is quite low compared to process energy. A possible exception may be processes that are relatively low in energy requirements but occupy large amounts of plant floor space, such as assembly line operations. U.S. Department of Energy data for the industrial sector indicates that non-process energy use including HVAC and lighting accounts for 10 -15 percent of the total end use fuel energy consumption in the case of electricity and natural gas (http://www.eia.doe.gov/emeu/mecs/mecs98/datatables/d98n6_4.htm). A significant amount of the overall industrial HVAC and lighting energy is likely for office areas, cafeteria space, etc. not directly associated with specific unit processes (see Support Personnel Requirements, below), as opposed to HVAC and lighting requirements for the plant floor space associated with specific unit processes. Support Personnel Requirements. The energy and wastes associated with research and development, sales, and administrative personnel or related activities have not been included in this study. Similar to space conditioning, energy requirements and related emissions are assumed to be quite small for support personnel activities. Miscellaneous Materials and Additives. Selected materials such as catalysts, pigments, or other additives which total less than one percent of the net process inputs are often excluded from the inventory if their contributions are estimated to be negligible. Omitting miscellaneous materials and additives helps keep the scope of the study focused
FRANKLIN ASSOCIATES, A Division of ERG
CLIENTS\TETRAPAK\KC016757.doc 10.16.06 3560.00.003.002
A-17
and manageable within budget and time constraints. The oxygen scavenger additive used for blow molded PET bottles was not modeled separately in this analysis; the material and energy flows for the oxygen scavenger additive were assumed to be comparable to the production of bottle-grade PET. Emissions from Combustion and Landfilling of Postconsumer Waste. It is recognized that the combustion of postconsumer products in waste-to-energy facilities produces atmospheric and waterborne emissions; however, these emissions are not included in this study. Allocating atmospheric and waterborne wastes from municipal combustion facilities to specific product systems is not feasible, due to the variety of materials present in combusted municipal solid waste. Theoretical carbon dioxide emissions from incinerated packaging could be calculated based on their carbon content and assuming complete oxidation; however, this may not be an accurate representation of the results of mixed MSW combustion. Therefore, emissions from incineration of packaging components in mixed MSW are not included in the analysis. Similarly, emissions of methane and carbon dioxide from aerobic and anaerobic decomposition of landfilled paperboard components are not estimated for this analysis, nor are estimates of leachate from landfilled packaging items included. Historically, LCI studies have not included emissions from landfilled materials because of a lack of data of suitable quality. Although some packaging components in this study contain bio-based materials (such as paperboard) that may degrade in a landfill, the fate of degradable materials in a landfill is a very complex subject. A large number of variables come into play, such as moisture, permeability of cover, temperature, pH of surroundings, and time. Landfill decomposition generally is strongly affected by moisture content, which is highly variable from landfill to landfill, and even more so from place to place within a landfill. Anaerobic decomposition proceeds only under a narrow range of environmental conditions, including appropriate temperature, pH, and moisture level. Decomposition in a landfill occurs due to a combination of aerobic and anaerobic processes. At first, air entrapped in a landfill, but with time, probably within a few weeks or months, landfill conditions become anaerobic. Timeframe should also be considered. It may take a century or more for degradable material to decompose completely in a landfill, although many products are suspected to partially decompose rapidly at first. Even when degradable materials decompose, not all gas produced by the decomposition enters the atmosphere. Some methane reacts with other chemicals in a landfill, some is oxidized in the soil, and some is recovered and flared or burned as a fuel. Possibly an even greater fraction of CO2 generated never makes it through the landfill cover because it is soluble in water and may exit the landfill as leachate. In summary, emissions from landfills (particularly greenhouse gas emissions) are potentially important to consider in LCI calculations, but it is premature to report them

FRANKLIN ASSOCIATES, A Division of ERG
CLIENTS\TETRAPAK\KC016757.doc 10.16.06 3560.00.003.002
A-18
along with other LCI emissions data until there is general agreement among experts on an acceptable methodology for estimating actual releases. Readers interested in this topic may wish to refer to the report EPA530-R-02-006, Solid Waste Management and Greenhouse Gases: A Life-Cycle Assessment of Emissions and Sinks, 2nd edition, May 2002, available at www.epa.gov. This report presents data on net GHG releases from WTE combustion and landfilling of various products and materials in municipal solid waste. It is beyond the scope of this study to attempt to evaluate the applicability of the EPA GHG methodology and models to the specific packaging components studied in this analysis.

FRANKLIN ASSOCIATES, A Division of ERG
CLIENTS\TETRAPAK\KC016757.doc 10.16.06 3560.00.003.002
B-1
APPENDIX B
CONSIDERATIONS FOR INTERPRETATION OF DATA AND RESULTS
INTRODUCTION An important issue with LCI results is whether two numbers are really different from one another. For example, if one product has a total system requirement of 100 energy units, is it really different from another product system that requires 110 energy units? If the error or variability in the data is sufficiently large, it cannot be concluded that the two numbers are actually different. STATISTICAL CONSIDERATIONS A statistical analysis that yields clear numerical answers would be ideal, but unfortunately LCI data are not amenable to this. The data are not (1) random samples from (2) large populations that result in (3) “normal curve” distributions. LCI data meet none of these requirements for statistical analysis. LCI data for a given sub-process (such as potato production, roundwood harvesting, or caustic soda manufacture, for example) are generally selected to be representative of a process or industry, and are typically calculated as an average of two to five data points. In statistical terminology, these are not random samples, but “judgment samples,” selected so as to reduce the possible errors incurred by limited sampling or limited population sizes. Formal statistics cannot be applied to judgment samples; however, a hypothetical data framework can be constructed to help assess in a general sense the reliability of LCI results. The first step in this assessment is reporting standard deviation values from LCI data, calculated by:
s =( )
,1
21
−
−∑n
xx mean
where xi is a measured value in the data set and xmean is the average of n values. An analysis of sub-process data from Franklin Associates’ files shows that, for a typical sub-process with two to five different companies supplying information, the standard deviation of the sample is about 30 percent of the sample average. In a typical LCI study, the total energy of a product system consists of the sum of many sub-processes. For the moment, consider an example of adding only two numbers. If both numbers are independent of each other and are an average of measurements which have a sample standard deviation, s, of 30, the standard deviation of the sum is obtained by adding the variances of each term to form the sum of the variances, then taking the square root. Variances are calculated by squaring the standard deviation, s2, so the sum

FRANKLIN ASSOCIATES, A Division of ERG
CLIENTS\TETRAPAK\KC016757.doc 10.16.06 3560.00.003.002
B-2
of the variances is 302 + 302 = 900 + 900 = 1800 . The new standard deviation of the sum is the square root of the sum of the variances, or 1800 = 42.4. In this example, suppose both average values are 100, with a sum of 200. If reported as a percent of the sum, the new standard deviation is 42.4/200 = 21.3% of the sum. Another way of
obtaining this value is to use the formula s% = s/xmean
n , where the term s% is defined
as the standard deviation of n data points, expressed as a % of the average, where each entry has approximately the same standard deviation, s. For the example, then, s% = 30% 2
= 21.3%.
Going back to a hypothetical LCI example, consider a common product system consisting of a sum of approximately 40 subsystems. First, a special hypothetical case is examined where all of the values are approximately the same size, and all have a
standard deviation of 30%. The standard deviation in the result is s% = 30%
40 = 4.7%.
The act of summing reduces the standard deviation of the result with respect to the standard deviation of each entry because of the assumption that errors are randomly distributed, and by combining values there is some cancellation of total error because some data values in each component system are higher than the true values and some are lower. The point of this analysis, however, is to compare two results, e.g., the energy totals for two different product systems, and decide if the difference between them is significant or not. To test a hypothetical data set it will be assumed that two product systems consist of a sum of 40 values, and that the standard deviation, s%, is 4.7% for each product system. If there is statistical knowledge of the sample only, and not of the populations from which they were drawn, “t” statistics can be used to find if the two product totals are different or not. The expression selected is:
21
11'025.2121
nnstxx +−+−=− µµ , where 21 µµ − is the difference in
population means, x1-x2 is the difference in sample means, and s' is a pooled standard deviation of the two samples. For the hypothetical case, where it is assumed that the standard deviation of the two samples is the same, the pooled value is simply replaced with the standard deviation of the samples. The goal is to find an expression that compares our sample means to “true,” or population, means. A new quantity is defined:
( ) ( )2121 xx −−−=∆ µµ , and the sample sizes are assumed to be the same (i.e., n1=n2).
The result is n
st 2'025.=∆ , where ∆ is the minimum difference corresponding to a 95%

FRANKLIN ASSOCIATES, A Division of ERG
CLIENTS\TETRAPAK\KC016757.doc 10.16.06 3560.00.003.002
B-3
confidence level, s' is the standard deviation of the sum of n values, and t.025 is a t statistic for 95% confidence levels. The values for t are a function of n and are found in tables. This expression can be converted to percent notation by dividing both sides by the
average of the sample means, which results in n
st 2'%025.% =∆ , where %∆ is now the
percent difference corresponding to a 95% confidence level, and s'% is the standard deviation expressed as a percent of the average of the sample means. This formula can be
simplified for the example calculation by remembering that s'% = s%
n , where s% is the
standard deviation of each energy entry for a product system. Now the equation becomes
nst 2%025.% =∆ . For the example, t = 2.0, s = 30%, and n = 40, so that %∆ = 2.1%.
This means that if the two product system energy totals differ by more than 2.1%, there is a 95% confidence level that the difference is significant. That is, if 100 independent studies were conducted (in which new data samples were drawn from the same population and the study was conducted in the identical manner), then 95 of these studies would find the energy values for the two product systems to differ by more than 2.1%. The previous discussion applies only to a hypothetical and highly idealized framework to which statistical mathematics apply. LCI data differ from this in some important ways. One is that the 40 or so numbers that are added together for a final energy value of a product system are of widely varying size and have different variances. The importance of this is that large numbers contribute more to the total variance of the result. For example, if 20 energy units and 2,000 energy units are added, the sum is 2,020 energy units. If the standard deviation of the smaller value is 30% (or 6 units), the variance is 62 = 36. If the standard deviation of the larger number is 10% (or 200), the variance is 2002 = 40,000. The total variance of the sum is 36 + 40,000 = 40,036, leading
to a standard deviation in the sum of (40036) 2020 = 9.9%. Clearly, the variance in the
result is much more greatly influenced by larger numbers. In a set of LCI energy data, standard deviations may range from 10% to 60%. If a large number has a large percentage standard deviation, then the sum will also be more uncertain. If the variance of the large number is small, the answer will be more certain. To offset the potential problem of a large variance, Franklin Associates goes to great lengths to increase the reliability of the larger numbers, but there may simply be inherent variability in some numbers which is beyond the researchers’ control. If only a few numbers contribute most of the total energy in a system, the value of
%∆ goes up. This can be illustrated by going back to the formula for %∆ and calculating examples for n = 5 and 10. From statistical tables, the values for 025.t are
2.78 for n = 5, and 2.26 for n = 10. Referring back to the hypothetical two-product data set with s% = 30% for each entry, the corresponding values for %∆ are 24% for n = 5 and 9.6% for n = 10. Thus, if only 5 numbers out of 40 contribute most of the energy, the percent difference in the two product system energy values must increase to 24% to

FRANKLIN ASSOCIATES, A Division of ERG
CLIENTS\TETRAPAK\KC016757.doc 10.16.06 3560.00.003.002
B-4
achieve the 95% confidence level that the two values are different. The minimum difference decreases to 9.6% if there are 10 major contributors out of the 40 energy numbers in a product system. CONCLUSIONS The discussion above highlights the importance of sample size, and of the variability of the sample. However, once again it must be emphasized that the statistical analysis does not apply to LCI data. It only serves to illustrate the important issues. Valid standard deviations cannot be calculated because of the failure of the data to meet the required statistical formula assumptions. Nevertheless, it is important to achieve a maximum sample size with minimum variability in the data. Franklin Associates examines the data, identifies the large values contributing to a sum, and then conducts more intensive analysis of those values. This has the effect of increasing the number of data points, and therefore decreasing the “standard deviation.” Even though a calculated standard deviation of 30% may be typical for Franklin Associates’ LCI data, the actual confidence level is much higher for the large values that control the variability of the data than for the small values. However, none of this can be quantified to the satisfaction of a statistician who draws conclusions based upon random sampling. In the case of LCI data, it comes down to a matter of professional judgment and experience. The increase in confidence level resulting from judgment and experience is not measurable. It is the professional judgment of Franklin Associates, based upon over 30 years of experience in analyzing LCI data, that a 10% rule is a reasonable value for %∆ for stating results of product system energy totals. That is, if the energy of one system is 10% different from another, it can be concluded that the difference is significant. It is clear that this convention is a matter of judgment. This is not claimed to be a highly accurate statement; however, the statistical arguments with hypothetical, but similar, data lend plausibility to this convention. We also conclude that the weight of postconsumer solid waste data can be analyzed in a similar way. These data are at least as accurate as the energy data, perhaps with even less uncertainty in the results. Therefore, the 10% rule applies to postconsumer solid waste weight. However, we apply a 25% rule to the solid waste volume data because of greater potential variability in the volume conversion factors. Air and water pollution and industrial solid waste data are not included in the 10% rule. Their variability is much higher. Data reported by similar plants may differ by a factor of two, or even a factor of ten or higher in some cases. Standard deviations may be as high as 150%, although 75% is typical. This translates to a hypothetical standard deviation in a final result of 12%, or a difference of at least 25% being required for a 95% confidence of two totals being different if 10 subsystems are major contributors to the final results. However, this rule applies only to single emission categories, and cannot be extended to general statements about environmental emissions resulting from a single product system. The interpretation of environmental emission data is further complicated

FRANKLIN ASSOCIATES, A Division of ERG
CLIENTS\TETRAPAK\KC016757.doc 10.16.06 3560.00.003.002
B-5
by the fact that not all plants report the same emission categories, and that there is not an accepted method of evaluating the relative importance of various emissions. It is the intent of this appendix to convey an explanation of Franklin Associates’ 10% and 25% rules and establish their plausibility. Franklin Associates’ policy is to consider product system totals for energy and weight of postconsumer solid waste weight to be different if there is at least a 10% difference in the totals. Otherwise, the difference is considered to be insignificant. In the detailed tables of this report there are many specific pollutant categories that are variable between systems. For the air and waterborne emissions, industrial solid waste, and postconsumer solid waste volume, the 25% rule should be applied. The formula used to calculate the difference between two systems is:
% Diff =
⎝⎜⎜⎛
⎠⎟⎟⎞ x-y
x+y2
X 100,
where x and y are the summed totals of energy or waste for two product systems. The denominator of this expression is the average of the two values.

FRANKLIN ASSOCIATES, A Division of ERG
CLIENTS\TETRAPAK\KC016757.doc 10.16.06 3560.00.003.002
C-1
APPENDIX C
ATMOSPHERIC AND WATERBORNE EMISSIONS The comprehensive tables of atmospheric and waterborne emissions from the LCI of wine container systems are shown in this appendix. The title for each table is listed below: Table C-1a: Atmospheric Emissions for Multi-Serving Wine Container Systems in the
United States Table C-1b: Atmospheric Emissions for Single-Serving Wine Container Systems in the
United States Table C-2a: Waterborne Emissions for Multi-Serving Wine Container Systems in the
United States Table C-2b: Waterborne Emissions for Single-Serving Wine Container Systems for the
United States Table C-3a: Atmospheric Emissions for Multi-Serving Wine Container Systems for
Canada Table C-3b: Atmospheric Emissions for Single-Serving Wine Container Systems for
Canada Table C-4a: Waterborne Emissions for Multi-Serving Wine Container Systems for
Canada Table C-4b: Waterborne Emissions for Single-Serving Wine Container Systems for
Canada

FRANKLIN ASSOCIATES, A Division of ERG
CLIENTS\TETRAPAK\KC016757.doc 10.16.06 3560.00.003.002
C-2
Tetra Brik(1 Liter)
Tetra Prisma(1 Liter)
Tetra Prisma(500 mL)
Glass Bottle(750 mL)
PET Bottle (750 mL)
Process Fuel Process Fuel Process Fuel Process Fuel Process FuelAcenaphthene 1.7E-08 1.8E-08 2.4E-08 4.3E-08 4.4E-08Acenaphthylene 8.2E-09 9.0E-09 1.2E-08 2.1E-08 2.1E-08Acetophenone 2.0E-07 2.1E-07 2.5E-07 4.2E-07 1.8E-07Acrolein 0.0037 0.0037 0.0043 0.0015 0.0015Aldehydes (Acetaldehyde) 7.9E-04 7.9E-04 9.3E-04 3.4E-04 3.3E-04Aldehydes (Formaldehyde) 0.0042 0.0042 0.0050 0.0024 0.0020Aldehydes (Propionaldehyde) 5.1E-06 5.4E-06 6.3E-06 1.1E-05 4.6E-06Aldehydes (unspecified) 0.0060 0.0010 0.0059 0.0012 0.0070 0.0015 4.1E-04 0.0082 0.027 0.0025Ammonia 0.0055 5.1E-04 0.0057 5.8E-04 0.0068 7.2E-04 0.0031 0.0041 0.81 0.0012Ammonia Chloride 1.4E-05 1.5E-05 2.1E-05 4.3E-05 5.1E-05Anthracene 6.9E-09 7.6E-09 9.8E-09 1.8E-08 1.8E-08Antimony 7.9E-06 7.9E-06 9.4E-06 4.4E-06 4.4E-06Arsenic 3.3E-05 3.5E-05 4.3E-05 4.8E-05 4.6E-05Benzene 0.0074 0.0079 0.0096 0.025 0.010Benzo(a)anthracene 2.6E-09 2.9E-09 3.7E-09 6.7E-09 6.8E-09Benzo(a)pyrene 1.2E-09 1.4E-09 1.8E-09 3.2E-09 3.2E-09Benzo(b,j,k)fluroanthene 3.6E-09 4.0E-09 5.1E-09 9.2E-09 9.4E-09Benzo(g,h,i) perylene 8.8E-10 9.7E-10 1.3E-09 2.3E-09 2.3E-09Benzyl Chloride 9.5E-06 9.9E-06 1.2E-05 2.0E-05 8.4E-06Beryllium 1.7E-06 1.8E-06 2.2E-06 3.5E-06 2.5E-06Biphenyl 5.6E-08 6.1E-08 7.9E-08 1.4E-07 1.5E-07Bis(2-ethylhexyl) Phthalate (DEHP) 9.9E-07 1.0E-06 1.2E-06 2.1E-06 8.8E-07Bromoform 5.3E-07 5.5E-07 6.5E-07 1.1E-06 4.7E-071,3 Butadiene 9.6E-07 1.0E-06 1.2E-06 1.1E-06 1.2E-06Cadmium 6.7E-06 7.0E-06 8.6E-06 1.5E-05 9.4E-06Carbon Disulfide 1.8E-06 1.8E-06 2.2E-06 3.7E-06 1.6E-06Carbon Monoxide 0.44 1.14 0.58 1.21 0.73 1.46 0.28 4.27 2.31 1.52Carbon Tetrachloride 5.9E-11 4.1E-05 8.7E-11 4.1E-05 1.2E-10 4.9E-05 1.6E-05 9.8E-10 1.6E-05CFC12 5.9E-10 2.8E-09 8.7E-10 3.2E-09 1.2E-09 3.9E-09 2.2E-08 9.8E-09 6.7E-09Chlorine 3.3E-04 7.3E-04 3.4E-04 7.3E-04 4.0E-04 8.5E-04 3.2E-08 2.9E-04 2.5E-04 2.9E-04Chlorobenzene 3.0E-07 3.1E-07 3.6E-07 6.2E-07 2.7E-07Chloroform 8.0E-07 8.3E-07 9.8E-07 1.7E-06 7.1E-07Chromium 2.8E-05 2.9E-05 3.6E-05 3.9E-05 3.4E-05Chromium (VI) 2.6E-06 2.8E-06 3.7E-06 6.6E-06 6.7E-06Chrysene 3.3E-09 3.6E-09 4.7E-09 8.4E-09 8.5E-09CO2 (fossil) 5.70 298 7.81 335 9.80 428 194 1,605 58.8 788CO2 (non-fossil) 15.5 179 14.8 179 17.4 211 97.8 71.3 0.92 70.7Cobalt 1.2E-05 1.3E-05 1.6E-05 3.5E-05 2.6E-05Copper 1.1E-07 1.3E-07 1.6E-07 2.7E-06 4.9E-07COS 0.0034 0.0047 0.0059 0.015 Cumene 7.2E-08 7.5E-08 8.8E-08 1.5E-07 6.4E-08Cyanide 3.4E-05 3.5E-05 4.1E-05 7.0E-05 3.0E-05Dimethyl Sulfate 6.5E-07 6.8E-07 7.9E-07 1.3E-06 5.8E-072,4-Dinitrotoluene 3.8E-09 3.9E-09 4.6E-09 7.9E-09 3.4E-09Dioxins (unspecified) 1.5E-06 1.5E-06 1.8E-06 6.1E-07 6.1E-07Ethyl Chloride 5.7E-07 5.9E-07 7.0E-07 1.2E-06 5.1E-07Ethylbenzene 2.7E-04 3.2E-04 4.1E-04 0.0024 9.1E-04Ethylene Dibromide 1.6E-08 1.7E-08 2.0E-08 3.4E-08 1.4E-08Ethylene Dichloride 5.4E-07 5.6E-07 6.6E-07 1.1E-06 4.8E-07Fluorine 5.8E-05 3.0E-08 8.0E-05 3.3E-08 1.0E-04 4.3E-08 7.6E-08 2.6E-04 7.8E-08Fluoranthene 2.3E-08 2.6E-08 3.3E-08 6.0E-08 6.1E-08Fluorides 6.0E-04 6.3E-04 7.4E-04 0.0013 5.4E-04Furans (unspecified) 8.9E-11 1.0E-10 1.4E-10 2.5E-10 3.4E-10
(lb per delivery of 1,000 liters of wine)(Page 1 of 2)
Table C-1a
ATMOSPHERIC EMISSIONS FOR MULTI-SERVING WINE CONTAINER SYSTEMS IN THE UNITED STATES

FRANKLIN ASSOCIATES, A Division of ERG
CLIENTS\TETRAPAK\KC016757.doc 10.16.06 3560.00.003.002
C-3
Tetra Brik(1 Liter)
Tetra Prisma(1 Liter)
Tetra Prisma(500 mL)
Glass Bottle(750 mL)
PET Bottle (750 mL)
Process Fuel Process Fuel Process Fuel Process Fuel Process FuelHCFC/HFCs 3.8E-04 5.2E-04 6.5E-04 0.0016 HCl 0.0020 0.049 0.0027 0.053 0.0034 0.068 3.5E-09 0.096 0.0087 0.10Hexane 9.1E-07 9.4E-07 1.1E-06 1.9E-06 8.1E-07Hydrocarbons (unspecified) 0.045 0.049 0.058 0.056 0.075 0.069 0.0015 0.40 0.97 0.12Hydrogen 1.9E-05 2.8E-05 4.0E-05 3.1E-05 Hydrogen cyanide 1.1E-04 1.5E-04 1.9E-04 5.0E-04 Hydrogen Fluoride 0.0033 0.0043 0.0039 0.0048 0.0048 0.0063 0.011 0.0085 0.012Indeno(1,2,3-cd)pyrene 2.0E-09 2.2E-09 2.9E-09 5.1E-09 5.2E-09Isophorone (C9H14O) 7.8E-06 8.2E-06 9.6E-06 1.6E-05 7.0E-06Kerosene 2.4E-05 2.8E-05 3.8E-05 7.8E-05 9.2E-05Lead 3.3E-07 1.0E-04 4.6E-07 1.0E-04 5.7E-07 1.3E-04 9.6E-11 1.5E-04 1.5E-06 9.7E-05Magnesium 3.6E-04 4.0E-04 5.1E-04 9.2E-04 9.4E-04Manganese 0.0015 0.0015 0.0018 6.4E-04 6.3E-04Mercaptan 0.0029 0.0031 0.0036 0.0061 0.0026Mercury 3.4E-06 2.3E-05 3.8E-06 2.4E-05 4.5E-06 2.8E-05 3.4E-06 4.6E-05 4.5E-06 2.4E-05Metals 4.9E-06 0.039 6.8E-06 0.039 8.5E-06 0.046 0.016 2.2E-05 0.016Methane 0.25 0.70 0.37 0.80 0.52 1.03 4.39 0.91 2.00Methyl Bromide 2.2E-06 2.3E-06 2.6E-06 4.5E-06 1.9E-06Methyl Chloride 7.2E-06 7.5E-06 8.8E-06 1.5E-05 6.4E-065-Methyl Chrysene 7.2E-10 7.9E-10 1.0E-09 1.8E-09 1.9E-09Methyl Ethyl Ketone 5.3E-06 5.5E-06 6.5E-06 1.1E-05 4.7E-06Methyl Hydrazine 2.3E-06 2.4E-06 2.8E-06 4.8E-06 2.1E-06Methyl Methacrylate 2.7E-07 2.8E-07 3.3E-07 5.6E-07 2.4E-07Methyl Tert Butyl Ether (MTBE) 4.7E-07 4.9E-07 5.8E-07 9.8E-07 4.2E-07Methylene Chloride 2.8E-04 2.8E-04 3.3E-04 1.6E-04 1.5E-04Naphthalene 9.0E-05 9.1E-05 1.1E-04 4.4E-05 4.0E-05Nickel 7.9E-05 8.6E-05 1.1E-04 3.8E-04 2.5E-04Nitrogen Oxides 0.39 1.26 0.42 1.39 0.50 1.73 4.59 5.68 0.56 2.89Nitrous Oxide (N2O) 2.0E-04 0.027 3.0E-04 0.028 4.3E-04 0.034 0.054 3.1E-04 0.029Other Organics 0.0061 1.2E-04 0.0089 1.3E-04 0.013 1.8E-04 3.4E-04 0.18 4.5E-04Particulates (PM 2.5) 1.3E-04 1.7E-04 2.5E-04 2.8E-05 Particulates (PM 10) 0.0014 0.53 0.0019 0.54 0.0027 0.64 0.42 0.0014 0.29Particulates (unspecified) 0.34 0.11 0.37 0.13 0.44 0.16 23.1 0.32 0.45 0.30Perchloroethylene 1.4E-06 1.6E-06 2.1E-06 4.1E-06 3.9E-06PFC (perfluorocarbons) 0.0012 0.0016 0.0020 0.0051 Phenanthrene 8.8E-08 9.7E-08 1.3E-07 2.3E-07 2.3E-07Phenols 4.9E-05 5.0E-05 5.9E-05 4.5E-05 3.1E-05Particulates (PM 10) 0.0014 0.53 0.0019 0.54 0.0027 0.64 0.42 0.0014 0.29Polyaromatic hydrocarbons (PAH) 4.8E-04 4.8E-06 6.5E-04 5.1E-06 8.2E-04 6.2E-06 6.6E-06 0.0021 7.0E-06Propylene 6.3E-05 6.7E-05 8.1E-05 7.4E-05 8.0E-05Pyrene 1.1E-08 1.2E-08 1.5E-08 2.8E-08 2.8E-08Radionuclides (curies) 0.0014 0.0016 0.0022 0.0044 0.0052Selenium 4.6E-05 5.0E-05 6.5E-05 0.0062 1.2E-04 1.1E-04Styrene 3.4E-07 3.5E-07 4.1E-07 7.0E-07 3.0E-07Sulfur Dioxide 1.58 1.79 2.32 7.71 4.49Sulfur Oxides 1.03 0.14 1.27 0.16 1.64 0.19 1.18 0.86 1.63 0.38Sulfuric acid 6.1E-06 8.4E-06 1.0E-05 2.7E-05 TOC 0.0096 0.010 0.012 0.015 0.011 0.013Toluene 0.0035 0.0041 0.0053 0.031 0.012Total reduced sulfur 0.019 0.018 0.022 0.0019 0.0019 Trichloroethane 2.7E-07 2.8E-07 3.3E-07 5.8E-07 2.5E-07Trichloroethylene 4.8E-10 7.0E-10 1.0E-09 7.9E-09 Vinyl Acetate 1.0E-07 1.1E-07 1.3E-07 2.1E-07 9.2E-08VOC 0.086 0.048 0.089 0.055 0.13 0.069 0.37 0.025 0.13Xylenes 0.0020 0.0024 0.0031 0.018 0.0068Zinc compounds 2.4E-09 7.2E-08 5.2E-09 8.6E-08 8.3E-09 1.1E-07 1.8E-06 3.3E-07
Source: Franklin Associates, a Division of ERG
Table C-1a (continued)
ATMOSPHERIC EMISSIONS FOR MULTI-SERVING WINE CONTAINER SYSTEMS IN THE UNITED STATES(lb per delivery of 1,000 liters of wine)
(Page 2 of 2)

FRANKLIN ASSOCIATES, A Division of ERG
CLIENTS\TETRAPAK\KC016757.doc 10.16.06 3560.00.003.002
C-4
Tetra Prisma (250 mL)
Tetra Prisma (200 mL)
Glass Bottle(187 mL)
PET Bottle (187 mL)
Process Fuel Process Fuel Process Fuel Process FuelAcenaphthene 2.8E-08 3.0E-08 7.4E-08 8.1E-08Acenaphthylene 1.4E-08 1.5E-08 3.6E-08 4.0E-08Acetophenone 3.6E-07 3.7E-07 6.7E-07 5.1E-07Acrolein 0.0065 0.0065 0.0064 0.0064Aldehydes (Acetaldehyde) 0.0014 0.0014 0.0014 0.0014Aldehydes (Formaldehyde) 0.0074 0.0074 0.0081 0.0078Aldehydes (Propionaldehyde) 9.0E-06 9.3E-06 1.7E-05 1.3E-05Aldehydes (unspecified) 0.0087 0.0017 0.0081 0.0017 0.0023 0.011 0.047 0.0047Ammonia 0.011 8.4E-04 0.011 8.3E-04 0.015 0.0053 1.36 0.0023Ammonia Chloride 2.3E-05 2.5E-05 6.9E-05 8.8E-05Anthracene 1.2E-08 1.2E-08 3.0E-08 3.3E-08Antimony 1.4E-05 1.4E-05 1.5E-05 1.5E-05Arsenic 5.7E-05 5.9E-05 1.0E-04 1.0E-04Benzene 0.013 0.013 0.038 0.023Benzo(a)anthracene 4.4E-09 4.7E-09 1.2E-08 1.3E-08Benzo(a)pyrene 2.1E-09 2.3E-09 5.5E-09 6.0E-09Benzo(b,j,k)fluroanthene 6.1E-09 6.5E-09 1.6E-08 1.7E-08Benzo(g,h,i) perylene 1.5E-09 1.6E-09 3.9E-09 4.3E-09Benzyl Chloride 1.7E-05 1.7E-05 3.1E-05 2.4E-05Beryllium 2.9E-06 3.0E-06 6.5E-06 5.5E-06Biphenyl 9.5E-08 1.0E-07 2.5E-07 2.7E-07Bis(2-ethylhexyl) Phthalate (DEHP) 1.7E-06 1.8E-06 3.3E-06 2.5E-06Bromoform 9.2E-07 9.5E-07 1.7E-06 1.3E-061,3 Butadiene 1.7E-06 1.7E-06 2.8E-06 3.1E-06Cadmium 1.2E-05 1.2E-05 2.6E-05 2.1E-05Carbon Disulfide 3.1E-06 3.2E-06 5.8E-06 4.4E-06Carbon Monoxide 0.96 1.94 1.03 1.94 2.85 6.30 4.71 3.48Carbon Tetrachloride 8.3E-11 7.3E-05 6.2E-11 7.2E-05 7.2E-05 1.6E-09 7.2E-05CFC12 8.3E-10 4.6E-09 6.2E-10 4.5E-09 2.9E-08 1.6E-08 1.3E-08Chlorine 4.6E-04 0.0013 4.4E-04 0.0013 4.1E-04 0.0013 4.1E-04 0.0013Chlorobenzene 5.2E-07 5.4E-07 9.8E-07 7.5E-07Chloroform 1.4E-06 1.4E-06 2.6E-06 2.0E-06Chromium 4.9E-05 5.0E-05 8.3E-05 8.1E-05Chromium (VI) 4.4E-06 4.7E-06 1.1E-05 1.3E-05Chrysene 5.6E-09 5.9E-09 1.4E-08 1.6E-08CO2 (fossil) 9.19 499 9.92 513 264 2,257 98.5 1,460CO2 (non-fossil) 21.2 314 19.4 314 114 311 1.52 311Cobalt 2.0E-05 2.1E-05 5.8E-05 5.2E-05Copper 1.8E-07 1.8E-07 3.5E-06 8.5E-07COS 0.0053 0.0058 0.025 0.025 Cumene 1.3E-07 1.3E-07 2.4E-07 1.8E-07Cyanide 5.9E-05 6.1E-05 1.1E-04 8.5E-05Dimethyl Sulfate 1.1E-06 1.2E-06 2.1E-06 1.6E-062,4-Dinitrotoluene 6.6E-09 6.8E-09 1.2E-08 9.5E-09Dioxins (unspecified) 2.7E-06 2.7E-06 2.7E-06 2.7E-06Ethyl Chloride 1.0E-06 1.0E-06 1.9E-06 1.4E-06Ethylbenzene 4.4E-04 4.4E-04 0.0032 0.0016Ethylene Dibromide 2.8E-08 2.9E-08 5.3E-08 4.1E-08Ethylene Dichloride 9.5E-07 9.8E-07 1.8E-06 1.4E-06Fluorine 9.0E-05 5.1E-08 9.8E-05 5.4E-08 4.3E-04 1.3E-07 4.3E-04 1.4E-07Fluoranthene 3.9E-08 4.2E-08 1.0E-07 1.1E-07Fluorides 0.0011 0.0011 0.0020 0.0015Furans (unspecified) 1.5E-10 1.6E-10 4.7E-10 5.8E-10
(lb per delivery of 1,000 liters of wine)(Page 1 of 2)
Table C-1b
ATMOSPHERIC EMISSIONS FOR SINGLE-SERVING WINE CONTAINER SYSTEMS IN THE UNITED STATES

FRANKLIN ASSOCIATES, A Division of ERG
CLIENTS\TETRAPAK\KC016757.doc 10.16.06 3560.00.003.002
C-5
Tetra Prisma (250 mL)
Tetra Prisma (200 mL)
Glass Bottle(187 mL)
PET Bottle (187 mL)
Process Fuel Process Fuel Process Fuel Process FuelHCFC/HFCs 5.9E-04 6.4E-04 0.0027 0.0027 HCl 0.0031 0.084 0.0033 0.088 0.014 0.18 0.014 0.20Hexane 1.6E-06 1.6E-06 3.0E-06 2.3E-06Hydrocarbons (unspecified) 0.067 0.081 0.058 0.080 0.072 0.51 1.61 0.23Hydrogen 2.7E-05 2.0E-05 5.2E-05 Hydrogen cyanide 1.8E-04 1.9E-04 8.3E-04 8.3E-04 Hydrogen Fluoride 0.0049 0.0073 0.0050 0.0078 0.014 0.020 0.014 0.022Indeno(1,2,3-cd)pyrene 3.4E-09 3.6E-09 8.8E-09 9.7E-09Isophorone (C9H14O) 1.4E-05 1.4E-05 2.6E-05 2.0E-05Kerosene 4.1E-05 4.5E-05 1.2E-04 1.6E-04Lead 5.2E-07 1.8E-04 5.6E-07 1.8E-04 2.4E-06 2.9E-04 2.4E-06 2.6E-04Magnesium 6.1E-04 6.5E-04 0.0016 0.0017Manganese 0.0026 0.0026 0.0026 0.0026Mercaptan 0.0051 0.0053 0.0097 0.0074Mercury 8.5E-06 4.0E-05 9.3E-06 4.1E-05 1.8E-05 7.6E-05 1.8E-05 6.2E-05Metals 7.7E-06 0.069 8.4E-06 0.069 3.6E-05 0.068 3.6E-05 0.068Methane 0.35 1.17 0.27 1.19 0.045 6.06 1.52 3.64Methyl Bromide 3.8E-06 3.9E-06 7.1E-06 5.4E-06Methyl Chloride 1.3E-05 1.3E-05 2.4E-05 1.8E-055-Methyl Chrysene 1.2E-09 1.3E-09 3.2E-09 3.5E-09Methyl Ethyl Ketone 9.2E-06 9.5E-06 1.7E-05 1.3E-05Methyl Hydrazine 4.0E-06 4.1E-06 7.6E-06 5.8E-06Methyl Methacrylate 4.7E-07 4.9E-07 8.9E-07 6.8E-07Methyl Tert Butyl Ether (MTBE) 8.3E-07 8.5E-07 1.6E-06 1.2E-06Methylene Chloride 4.9E-04 4.9E-04 5.5E-04 5.3E-04Naphthalene 1.6E-04 1.6E-04 1.7E-04 1.6E-04Nickel 1.3E-04 1.3E-04 5.7E-04 4.7E-04Nitrogen Oxides 0.81 2.13 0.85 2.17 6.60 8.27 1.68 5.63Nitrous Oxide (N2O) 2.9E-04 0.047 2.3E-04 0.047 4.8E-05 0.094 5.2E-04 0.073Other Organics 0.0087 1.9E-04 0.0065 2.1E-04 2.6E-04 6.1E-04 0.30 7.6E-04Particulates (PM 2.5) 1.3E-04 9.6E-05 3.2E-07 4.7E-05 Particulates (PM 10) 0.0018 0.94 0.0013 0.94 5.7E-05 1.16 0.0023 1.05Particulates (unspecified) 0.54 0.19 0.55 0.20 27.4 0.54 0.93 0.55Perchloroethylene 2.5E-06 2.6E-06 6.9E-06 7.2E-06PFC (perfluorocarbons) 0.0018 0.0020 0.0085 0.0085 Phenanthrene 1.5E-07 1.6E-07 3.9E-07 4.3E-07Phenols 8.6E-05 8.6E-05 1.2E-04 1.0E-04Particulates (PM 10) 0.0018 0.94 0.0013 0.94 5.7E-05 1.16 0.0023 1.05Polyaromatic hydrocarbons (PAH) 7.4E-04 8.4E-06 8.1E-04 8.6E-06 0.0035 1.5E-05 0.0035 1.7E-05Propylene 1.1E-04 1.1E-04 1.8E-04 2.0E-04Pyrene 1.8E-08 2.0E-08 4.8E-08 5.2E-08Radionuclides (curies) 0.0023 0.0025 0.0070 0.0089Selenium 7.8E-05 8.3E-05 0.0072 2.1E-04 2.2E-04Styrene 5.9E-07 6.1E-07 1.1E-06 8.5E-07Sulfur Dioxide 2.67 2.77 11.2 8.18Sulfur Oxides 1.89 0.23 1.81 0.23 3.26 1.18 3.98 0.71Sulfuric acid 9.5E-06 1.0E-05 4.5E-05 4.5E-05 TOC 0.017 0.017 0.030 0.019 0.030Toluene 0.0057 0.0057 0.041 0.021Total reduced sulfur 0.028 0.027 0.0094 0.0094 Trichloroethane 4.8E-07 4.9E-07 9.2E-07 6.9E-07Trichloroethylene 6.7E-10 5.0E-10 1.3E-08 Vinyl Acetate 1.8E-07 1.9E-07 3.4E-07 2.6E-07VOC 0.17 0.079 0.18 0.079 9.2E-05 0.49 0.041 0.25Xylenes 0.0033 0.0033 0.024 0.012Zinc compounds 4.5E-09 1.2E-07 4.2E-09 1.2E-07 2.3E-06 5.7E-07
Source: Franklin Associates, a Division of ERG
Table C-1b (continued)
ATMOSPHERIC EMISSIONS FOR SINGLE-SERVING WINE CONTAINER SYSTEMS IN THE UNITED STATES(lb per delivery of 1,000 liters of wine)
(Page 2 of 2)

FRANKLIN ASSOCIATES, A Division of ERG
CLIENTS\TETRAPAK\KC016757.doc 10.16.06 3560.00.003.002
C-6
Tetra Brik(1 Liter)
Tetra Prisma(1 Liter)
Tetra Prisma(500 mL)
Glass Bottle(750 mL)
PET Bottle (750 mL)
Process Fuel Process Fuel Process Fuel Process Fuel Process FuelAcetone 9.3E-07 1.9E-06 1.4E-06 2.2E-06 1.9E-06 2.8E-06 1.6E-05 4.6E-06 5.6E-06Acid (benzoic) 9.4E-05 1.9E-04 1.4E-04 2.3E-04 2.0E-04 2.9E-04 0.0017 4.7E-04 5.7E-04Acid (hexanoic) 1.9E-05 4.0E-05 2.9E-05 4.7E-05 4.0E-05 5.9E-05 3.5E-04 9.6E-05 1.2E-04Acid (unspecified) 0.018 1.3E-04 0.017 1.5E-04 0.020 1.9E-04 9.9E-04 0.0011 0.0076 4.2E-04Alkalinity 0.0074 0.015 0.011 0.018 0.015 0.023 0.13 0.036 0.045Alkylated benzenes 1.8E-06 5.3E-06 2.6E-06 6.1E-06 3.7E-06 7.7E-06 4.4E-05 1.7E-05 1.4E-05Alkylated fluorenes 1.0E-07 3.1E-07 1.5E-07 3.6E-07 2.1E-07 4.4E-07 2.6E-06 9.9E-07 8.0E-07Alkylated naphthalenes 2.9E-08 8.8E-08 4.3E-08 1.0E-07 6.0E-08 1.3E-07 7.3E-07 2.8E-07 2.3E-07Alkylated phenanthrenes 1.2E-08 3.6E-08 1.8E-08 4.2E-08 2.5E-08 5.2E-08 3.0E-07 1.2E-07 9.4E-08Aluminum 0.0081 0.010 0.010 0.011 0.013 0.014 0.013 0.082 0.039 0.026Ammonia 0.0023 0.0032 0.0031 0.0037 0.0040 0.0047 0.0019 0.027 0.025 0.0091Ammonium ion 3.1E-06 1.1E-05 4.2E-06 1.2E-05 5.2E-06 1.7E-05 3.5E-05 1.3E-05 4.1E-05Antimony 2.0E-06 6.1E-06 3.0E-06 7.0E-06 4.2E-06 8.8E-06 5.0E-05 2.0E-05 1.6E-05AOX 0.0016 0.0016 0.0018 Arsenic 2.2E-05 4.7E-05 3.2E-05 5.5E-05 4.5E-05 7.0E-05 4.0E-04 1.2E-04 1.4E-04Barium 0.047 0.14 0.069 0.16 0.097 0.20 1.14 0.43 0.36Benzene 1.6E-04 3.2E-04 2.3E-04 3.7E-04 3.2E-04 4.7E-04 0.0028 7.7E-04 9.4E-04Beryllium 1.1E-06 2.4E-06 1.5E-06 2.8E-06 2.2E-06 3.5E-06 2.0E-05 6.3E-06 6.8E-06BOD 0.33 1.81 0.35 1.81 0.42 2.13 0.39 0.88 0.42 0.77Boron 2.9E-04 6.0E-04 4.3E-04 7.0E-04 6.0E-04 8.9E-04 0.0052 0.0014 0.0018Bromide 0.020 0.041 0.029 0.048 0.041 0.061 0.35 0.098 0.12Cadmium 3.2E-06 7.1E-06 4.7E-06 8.2E-06 6.6E-06 1.0E-05 6.0E-05 1.8E-05 2.0E-05Calcium 0.30 0.61 0.44 0.71 0.62 0.91 5.29 1.47 1.80Chlorides 3.35 6.90 4.92 8.04 6.95 10.2 59.4 16.6 20.2Chromium (hexavalent) 1.8E-07 2.7E-07 3.8E-07 3.0E-06 Chromium (unspecified) 9.2E-05 2.8E-04 1.3E-04 3.2E-04 1.9E-04 4.0E-04 1.1E-09 0.0023 0.0018 7.2E-04Cobalt 2.1E-06 4.2E-06 3.0E-06 4.9E-06 4.3E-06 6.3E-06 3.6E-05 1.0E-05 1.2E-05COD 0.87 0.035 0.94 0.041 1.11 0.053 0.97 0.31 1.07 0.11Copper 1.6E-05 4.3E-05 2.4E-05 4.9E-05 3.4E-05 6.3E-05 3.5E-04 1.1E-04 1.2E-04Cresols 1.1E-05 1.3E-05 1.7E-05 9.6E-05 3.3E-05Cyanide 2.1E-06 1.4E-08 2.9E-06 1.6E-08 3.6E-06 2.0E-08 7.9E-09 1.2E-07 9.4E-06 4.0E-08Cymene 1.9E-08 2.2E-08 2.8E-08 1.6E-07 5.6E-08Detergents 1.9E-06 2.6E-06 3.3E-06 8.4E-06 Dibenzofuran 1.8E-08 3.6E-08 2.6E-08 4.2E-08 3.7E-08 5.4E-08 3.1E-07 8.7E-08 1.1E-07Dibenzothiophene 1.4E-08 2.9E-08 2.1E-08 3.4E-08 3.0E-08 4.4E-08 2.5E-07 7.1E-08 8.6E-08Dissolved organics 2.2E-04 3.0E-04 3.8E-04 9.7E-04 Dissolved Solids 9.25 8.52 10.9 9.91 14.3 12.6 0.032 73.3 20.5 24.9Ethylbenzene 8.9E-06 1.8E-05 1.3E-05 2.1E-05 1.9E-05 2.7E-05 1.6E-04 4.4E-05 5.3E-05Fluorides 1.8E-04 2.5E-04 3.1E-04 8.1E-04 Fluorine 4.7E-06 1.8E-04 6.5E-06 2.0E-04 8.1E-06 2.8E-04 5.6E-04 2.8E-05 6.7E-04Furans 4.8E-09 4.8E-09 9.7E-09 Hardness 0.92 1.89 1.35 2.20 1.91 2.80 16.3 4.54 5.53Heavy metals 1.0E-04 1.4E-04 1.7E-04 4.5E-04 HFC/HCFC 1.0E-06 1.6E-06 1.8E-06 Hydrocarbons 4.9E-06 3.8E-05 4.9E-06 4.5E-05 9.8E-06 5.7E-05 3.3E-04 1.9E-07 1.1E-04Iron 0.013 0.023 0.018 0.026 0.023 0.033 0.019 0.18 0.073 0.061Isopropyl Alcohol 1.0E-06 1.6E-06 1.8E-06 Lead 3.8E-05 8.5E-05 5.4E-05 9.8E-05 7.6E-05 1.2E-04 1.4E-10 7.2E-04 2.3E-04 2.4E-04Lead 210 9.6E-15 1.4E-14 2.0E-14 4.8E-14 Lithium 0.076 0.11 0.11 0.13 0.16 0.17 1.00 0.15 0.37Magnesium 0.058 0.12 0.085 0.14 0.12 0.18 1.03 0.29 0.35Manganese 9.7E-05 6.0E-04 1.4E-04 6.8E-04 2.0E-04 8.8E-04 0.0027 4.7E-04 0.0017Mercury 1.1E-05 1.1E-07 1.0E-05 1.3E-07 1.2E-05 1.6E-07 1.4E-10 9.0E-07 3.6E-07 2.9E-07Metal Ion (unspecified) 5.0E-04 1.60 6.7E-04 1.89 8.4E-04 2.45 5.6E-07 14.5 0.0021 5.38
(Page 1 of 2)
Table C-2a
WATERBORNE EMISSIONS FOR MULTI-SERVING WINE CONTAINER SYSTEMS FOR THE UNITED STATES(lb per delivery of 1,000 liters of wine)

FRANKLIN ASSOCIATES, A Division of ERG
CLIENTS\TETRAPAK\KC016757.doc 10.16.06 3560.00.003.002
C-7
Tetra Brik(1 Liter)
Tetra Prisma(1 Liter)
Tetra Prisma(500 mL)
Glass Bottle(750 mL)
PET Bottle (750 mL)
Process Fuel Process Fuel Process Fuel Process Fuel Process FuelMethanol 0.0027 0.0026 0.0031 Methyl Chloride 3.7E-09 7.7E-09 5.5E-09 9.0E-09 7.7E-09 1.1E-08 6.6E-08 1.8E-08 2.3E-08Methyl Ethyl Ketone 7.5E-09 1.5E-08 1.1E-08 1.8E-08 1.5E-08 2.3E-08 1.3E-07 3.7E-08 4.5E-08Molybdenum 2.1E-06 4.4E-06 3.1E-06 5.1E-06 4.4E-06 6.5E-06 3.8E-05 1.1E-05 1.3E-05m-Xylene 2.8E-06 4.1E-06 5.8E-06 1.4E-05 Naphthalene 1.7E-06 3.5E-06 2.5E-06 4.0E-06 3.5E-06 5.1E-06 3.0E-05 8.4E-06 1.0E-05n-Decane 2.7E-06 4.0E-06 5.6E-06 1.3E-05 n-Docosane 9.9E-08 1.5E-07 2.1E-07 4.9E-07 n-Dodecane 5.1E-06 7.5E-06 1.1E-05 2.5E-05 n-Eicosane 1.4E-06 2.1E-06 2.9E-06 7.0E-06 n-Hexacosane 6.2E-08 9.1E-08 1.3E-07 3.1E-07 n-Hexadecane 5.6E-06 8.2E-06 1.2E-05 2.8E-05 Nickel 1.8E-05 4.2E-05 2.7E-05 4.9E-05 3.8E-05 6.2E-05 9.8E-11 3.6E-04 1.1E-04 1.2E-04Nitrates 5.3E-05 2.7E-05 6.2E-05 3.1E-05 7.3E-05 4.3E-05 8.0E-05 8.6E-05 9.7E-05 1.0E-04Nitrogen 0.0056 0.0056 0.0066 0.0027 0.0027 n-Octadecane 1.4E-06 2.0E-06 2.9E-06 6.8E-06 n-Tetradecane 2.2E-06 3.3E-06 4.7E-06 1.1E-05 o + p-Xyxlene 2.0E-06 3.0E-06 4.2E-06 1.0E-05 o-Cresol 2.7E-06 3.9E-06 5.5E-06 1.3E-05 Oil 0.0071 0.0040 0.0089 0.0047 0.011 0.0059 0.019 0.034 0.019 0.012Other nitrogen 3.1E-08 9.5E-06 4.2E-08 1.1E-05 5.2E-08 1.5E-05 3.0E-05 1.4E-07 3.6E-05p-Cresol 2.9E-06 4.2E-06 6.0E-06 1.4E-05 p-Cymene 9.3E-09 1.4E-08 1.9E-08 4.6E-08 Pentamethylbenzene 7.0E-09 1.4E-08 1.0E-08 1.7E-08 1.4E-08 2.1E-08 1.2E-07 3.4E-08 4.2E-08Phenanthrene 1.5E-08 3.8E-08 2.3E-08 4.4E-08 3.2E-08 5.6E-08 3.2E-07 1.1E-07 1.1E-07Phenol 1.1E-04 9.1E-05 1.4E-04 1.1E-04 1.8E-04 1.3E-04 2.3E-04 7.8E-04 3.3E-04 2.6E-04Phosphates 0.0058 0.0064 0.0075 0.010 0.0064 Phosphorus 0.0013 0.0015 0.0018 0.0022 0.0022 Radionuclides (unspecified) 1.9E-08 2.2E-08 3.0E-08 6.1E-08 7.3E-08Radium 226 3.4E-12 4.9E-12 7.0E-12 1.7E-11 Radium 228 1.7E-14 2.5E-14 3.6E-14 8.5E-14 Selenium 4.0E-07 5.0E-06 5.8E-07 5.7E-06 8.2E-07 7.7E-06 2.2E-05 3.8E-06 1.8E-05Silver 1.9E-04 4.0E-04 2.9E-04 4.7E-04 4.0E-04 5.9E-04 0.0035 9.6E-04 0.0012Sodium 0.96 1.95 1.40 2.27 1.98 2.88 16.8 4.72 5.70Sodium dichromate 8.5E-07 8.0E-07 9.5E-07 Strontium 0.0051 0.010 0.0074 0.012 0.010 0.015 0.090 0.025 0.030Styrene 1.7E-09 2.6E-09 3.6E-09 2.8E-09 Sulfates 0.017 0.032 0.024 0.036 0.032 0.048 0.18 0.079 0.11Sulfides 0.0051 4.5E-06 0.0059 5.1E-06 0.0069 6.3E-06 0.019 3.6E-05 0.0084 1.1E-05Sulfur 2.5E-04 5.1E-04 3.6E-04 5.9E-04 5.1E-04 7.5E-04 0.0044 0.0012 0.0015Surfactants 8.9E-05 1.8E-04 1.3E-04 2.1E-04 1.8E-04 2.6E-04 0.0015 4.1E-04 5.2E-04Suspended Solids 0.48 0.32 0.55 0.36 0.68 0.45 1.29 2.58 1.24 0.82Thallium 4.3E-07 1.3E-06 6.3E-07 1.5E-06 8.8E-07 1.8E-06 1.1E-05 4.1E-06 3.3E-06Tin 1.3E-05 3.1E-05 1.9E-05 3.6E-05 2.6E-05 4.5E-05 2.6E-04 8.7E-05 8.6E-05Titanium 3.1E-05 9.4E-05 4.6E-05 1.1E-04 6.4E-05 1.3E-04 7.8E-04 3.0E-04 2.4E-04TOC 1.7E-05 5.2E-04 2.6E-05 6.2E-04 3.6E-05 8.0E-04 0.0047 0.0062 0.0018Toluene 1.5E-04 3.0E-04 2.2E-04 3.5E-04 3.1E-04 4.5E-04 0.0026 7.3E-04 8.9E-04Total biphenyls 1.2E-07 3.5E-07 1.7E-07 4.0E-07 2.4E-07 5.0E-07 2.9E-06 1.1E-06 9.0E-07Total dibenzothiophenes 3.6E-10 1.1E-09 5.2E-10 1.2E-09 7.3E-10 1.5E-09 8.8E-09 3.4E-09 2.8E-09Vanadium 2.5E-06 5.2E-06 3.7E-06 6.0E-06 5.2E-06 7.7E-06 4.5E-05 1.2E-05 1.5E-05Xylene 9.2E-05 1.6E-04 1.3E-04 1.9E-04 1.9E-04 2.4E-04 0.0014 4.0E-04 4.7E-04Yttrium 6.2E-07 1.3E-06 9.2E-07 1.5E-06 1.3E-06 1.9E-06 1.1E-05 3.1E-06 3.8E-06Zinc 4.8E-04 2.4E-04 5.1E-04 2.7E-04 6.3E-04 3.4E-04 2.7E-04 0.0020 0.0017 6.3E-04
Source: Franklin Associates, a Division of ERG
(lb per delivery of 1,000 liters of wine)(Page 2 of 2)
Table C-2a (continued)
WATERBORNE EMISSIONS FOR MULTI-SERVING WINE CONTAINER SYSTEMS FOR THE UNITED STATES

FRANKLIN ASSOCIATES, A Division of ERG
CLIENTS\TETRAPAK\KC016757.doc 10.16.06 3560.00.003.002
C-8
Tetra Prisma (250 mL)
Tetra Prisma (200 mL)
Glass Bottle(187 mL)
PET Bottle (187 mL)
Process Fuel Process Fuel Process Fuel Process FuelAcetone 1.3E-06 3.1E-06 1.0E-06 3.1E-06 3.0E-07 2.1E-05 7.6E-06 1.0E-05Acid (benzoic) 1.3E-04 3.2E-04 1.0E-04 3.2E-04 3.0E-05 0.0022 7.7E-04 0.0010Acid (hexanoic) 2.7E-05 6.6E-05 2.1E-05 6.5E-05 6.3E-06 4.5E-04 1.6E-04 2.1E-04Acid (unspecified) 0.025 2.1E-04 0.023 2.1E-04 0.0069 0.0015 0.015 7.4E-04Alkalinity 0.010 0.025 0.0080 0.025 0.0023 0.17 0.061 0.081Alkylated benzenes 2.5E-06 8.8E-06 2.0E-06 8.7E-06 1.5E-06 5.7E-05 2.8E-05 2.6E-05Alkylated fluorenes 1.5E-07 5.1E-07 1.2E-07 5.0E-07 8.5E-08 3.3E-06 1.6E-06 1.5E-06Alkylated naphthalenes 4.2E-08 1.4E-07 3.3E-08 1.4E-07 2.4E-08 9.4E-07 4.6E-07 4.2E-07Alkylated phenanthrenes 1.7E-08 6.0E-08 1.4E-08 5.9E-08 1.0E-08 3.9E-07 1.9E-07 1.8E-07Aluminum 0.015 0.016 0.016 0.016 0.027 0.11 0.076 0.048Ammonia 0.0048 0.0052 0.0048 0.0052 0.0078 0.035 0.046 0.017Ammonium ion 4.7E-06 1.8E-05 5.2E-06 2.0E-05 2.2E-05 5.5E-05 2.2E-05 7.0E-05Antimony 2.9E-06 1.0E-05 2.3E-06 9.9E-06 1.7E-06 6.6E-05 3.2E-05 2.9E-05AOX 0.0022 0.0020 Arsenic 3.1E-05 7.8E-05 2.4E-05 7.7E-05 8.3E-06 5.3E-04 2.0E-04 2.5E-04Barium 0.067 0.23 0.053 0.22 0.037 1.48 0.72 0.67Benzene 2.2E-04 5.3E-04 1.7E-04 5.2E-04 5.0E-05 0.0036 0.0013 0.0017Beryllium 1.5E-06 4.0E-06 1.1E-06 3.9E-06 4.6E-07 2.7E-05 1.1E-05 1.2E-05BOD 0.51 3.16 0.51 3.16 0.49 3.33 0.82 3.21Boron 4.1E-04 9.9E-04 3.1E-04 9.8E-04 9.4E-05 0.0067 0.0024 0.0032Bromide 0.028 0.067 0.021 0.067 0.0064 0.46 0.16 0.22Cadmium 4.5E-06 1.2E-05 3.4E-06 1.2E-05 1.2E-06 7.8E-05 2.9E-05 3.7E-05Calcium 0.42 1.01 0.32 1.00 0.096 6.91 2.45 3.25Chlorides 4.72 11.4 3.61 11.2 1.08 77.7 27.6 36.5Chromium (hexavalent) 2.6E-07 1.9E-07 5.0E-06 Chromium (unspecified) 1.3E-04 4.6E-04 1.0E-04 4.5E-04 7.1E-05 0.0030 0.0030 0.0013Cobalt 2.9E-06 7.0E-06 2.2E-06 6.9E-06 6.6E-07 4.8E-05 1.7E-05 2.2E-05COD 1.69 0.058 1.76 0.057 2.54 0.41 3.13 0.20Copper 2.3E-05 7.1E-05 1.8E-05 7.0E-05 8.6E-06 4.6E-04 1.9E-04 2.2E-04Cresols 1.8E-05 1.8E-05 1.3E-04 5.9E-05Cyanide 3.3E-06 2.3E-08 3.6E-06 2.2E-08 1.5E-05 1.6E-07 1.6E-05 7.3E-08Cymene 3.1E-08 3.1E-08 2.1E-07 1.0E-07Detergents 3.0E-06 3.2E-06 1.4E-05 1.4E-05 Dibenzofuran 2.5E-08 6.0E-08 1.9E-08 5.9E-08 5.7E-09 4.1E-07 1.5E-07 1.9E-07Dibenzothiophene 2.0E-08 4.8E-08 1.5E-08 4.8E-08 4.6E-09 3.3E-07 1.2E-07 1.6E-07Dissolved organics 3.4E-04 3.7E-04 0.0016 0.0016 Dissolved Solids 12.8 14.0 10.8 13.9 1.50 95.8 34.2 45.1Ethylbenzene 1.3E-05 3.0E-05 9.6E-06 2.9E-05 2.8E-06 2.0E-04 7.3E-05 9.5E-05Fluorides 2.8E-04 3.1E-04 0.0013 0.0013 Fluorine 7.3E-06 3.0E-04 8.0E-06 3.3E-04 3.4E-05 9.0E-04 4.7E-05 0.0011Furans Hardness 1.29 3.11 0.99 3.08 0.30 21.3 7.56 10.0Heavy metals 1.6E-04 1.7E-04 7.4E-04 7.4E-04 HFC/HCFC 2.0E-06 1.4E-06 Hydrocarbons 6.6E-08 6.3E-05 7.2E-08 6.2E-05 3.1E-07 4.3E-04 3.1E-07 2.0E-04Iron 0.018 0.037 0.017 0.037 0.018 0.24 0.12 0.11Isopropyl Alcohol 2.0E-06 1.4E-06 Lead 5.3E-05 1.4E-04 4.2E-05 1.4E-04 1.8E-05 9.4E-04 3.9E-04 4.3E-04Lead 210 1.4E-14 1.0E-14 3.1E-15 7.9E-14 Lithium 0.11 0.18 0.080 0.18 3.2E-05 1.32 0.25 0.65Magnesium 0.082 0.20 0.063 0.20 0.019 1.35 0.48 0.64Manganese 1.4E-04 0.0010 1.1E-04 0.0011 5.0E-05 0.0040 7.9E-04 0.0031Mercury 1.5E-05 1.8E-07 1.4E-05 1.8E-07 6.8E-08 1.2E-06 6.0E-07 5.4E-07Metal Ion (unspecified) 7.7E-04 2.63 8.3E-04 2.60 0.0036 19.0 0.0036 9.43
WATERBORNE EMISSIONS FOR SINGLE-SERVING WINE CONTAINER SYSTEMS FOR THE UNITED STATES(lb per delivery of 1,000 liters of wine)
(Page 1 of 2)
Table C-2b

FRANKLIN ASSOCIATES, A Division of ERG
CLIENTS\TETRAPAK\KC016757.doc 10.16.06 3560.00.003.002
C-9
Tetra Prisma (250 mL)
Tetra Prisma (200 mL)
Glass Bottle(187 mL)
PET Bottle (187 mL)
Process Fuel Process Fuel Process Fuel Process FuelMethanol 0.0037 0.0034 Methyl Chloride 5.3E-09 1.3E-08 4.0E-09 1.3E-08 1.2E-09 8.7E-08 3.1E-08 4.1E-08Methyl Ethyl Ketone 1.1E-08 2.5E-08 8.1E-09 2.5E-08 2.4E-09 1.7E-07 6.1E-08 8.1E-08Molybdenum 3.0E-06 7.2E-06 2.3E-06 7.2E-06 6.9E-07 4.9E-05 1.8E-05 2.3E-05m-Xylene 4.0E-06 3.0E-06 9.0E-07 2.3E-05 Naphthalene 2.4E-06 5.7E-06 1.8E-06 5.7E-06 5.4E-07 3.9E-05 1.4E-05 1.8E-05n-Decane 3.8E-06 2.9E-06 8.7E-07 2.2E-05 n-Docosane 1.4E-07 1.1E-07 3.2E-08 8.2E-07 n-Dodecane 7.2E-06 5.5E-06 1.6E-06 4.2E-05 n-Eicosane 2.0E-06 1.5E-06 4.5E-07 1.2E-05 n-Hexacosane 8.7E-08 6.7E-08 2.0E-08 5.1E-07 n-Hexadecane 7.9E-06 6.0E-06 1.8E-06 4.6E-05 Nickel 2.6E-05 7.0E-05 2.0E-05 6.9E-05 8.2E-06 4.7E-04 1.9E-04 2.2E-04Nitrates 1.6E-04 4.6E-05 1.8E-04 5.0E-05 4.2E-04 1.4E-04 4.2E-04 1.8E-04Nitrogen 0.0085 0.0084 0.0067 0.0067 n-Octadecane 1.9E-06 1.5E-06 4.4E-07 1.1E-05 n-Tetradecane 3.2E-06 2.4E-06 7.2E-07 1.9E-05 o + p-Xyxlene 2.9E-06 2.2E-06 6.6E-07 1.7E-05 o-Cresol 3.8E-06 2.9E-06 8.6E-07 2.2E-05 Oil 0.0098 0.0066 0.010 0.0066 0.014 0.045 0.030 0.021Other nitrogen 4.8E-08 1.6E-05 5.2E-08 1.7E-05 2.2E-07 4.8E-05 2.2E-07 6.1E-05p-Cresol 4.1E-06 3.1E-06 9.3E-07 2.4E-05 p-Cymene 1.3E-08 1.0E-08 3.0E-09 7.6E-08 Pentamethylbenzene 9.8E-09 2.4E-08 7.5E-09 2.3E-08 2.2E-09 1.6E-07 5.7E-08 7.6E-08Phenanthrene 2.2E-08 6.3E-08 1.7E-08 6.2E-08 8.5E-09 4.2E-07 1.8E-07 1.9E-07Phenol 1.5E-04 1.5E-04 1.4E-04 1.5E-04 1.8E-04 0.0010 5.4E-04 4.8E-04Phosphates 0.012 0.012 0.020 0.020 Phosphorus 0.0043 0.0048 0.011 0.011 Radionuclides (unspecified) 3.2E-08 3.5E-08 9.8E-08 1.2E-07Radium 226 4.7E-12 3.6E-12 1.1E-12 2.8E-11 Radium 228 2.4E-14 1.8E-14 5.5E-15 1.4E-13 Selenium 5.6E-07 8.4E-06 4.5E-07 9.0E-06 3.2E-07 3.2E-05 6.3E-06 3.0E-05Silver 2.7E-04 6.6E-04 2.1E-04 6.5E-04 6.3E-05 0.0045 0.0016 0.0021Sodium 1.35 3.21 1.04 3.17 0.39 21.9 7.86 10.3Sodium dichromate 1.2E-06 1.1E-06 Strontium 0.0071 0.017 0.0055 0.017 0.0016 0.12 0.042 0.055Styrene 2.4E-09 1.8E-09 4.7E-09 Sulfates 0.026 0.053 0.025 0.055 0.078 0.25 0.13 0.19Sulfides 0.0069 7.4E-06 0.0078 7.3E-06 0.013 4.7E-05 0.013 2.0E-05Sulfur 3.5E-04 8.3E-04 2.7E-04 8.2E-04 9.2E-05 0.0057 0.0020 0.0027Surfactants 1.3E-04 2.9E-04 9.5E-05 2.9E-04 2.5E-05 0.0020 6.7E-04 9.4E-04Suspended Solids 0.74 0.52 0.72 0.51 1.70 3.35 2.24 1.53Thallium 6.1E-07 2.1E-06 4.8E-07 2.1E-06 3.5E-07 1.4E-05 6.8E-06 6.2E-06Tin 1.8E-05 5.1E-05 1.4E-05 5.1E-05 6.7E-06 3.4E-04 1.4E-04 1.6E-04Titanium 4.4E-05 1.5E-04 3.5E-05 1.5E-04 2.6E-05 0.0010 5.0E-04 4.5E-04TOC 2.4E-05 8.6E-04 1.8E-05 8.5E-04 0.0062 0.010 0.0031Toluene 2.1E-04 5.0E-04 1.6E-04 4.9E-04 4.7E-05 0.0034 0.0012 0.0016Total biphenyls 1.6E-07 5.7E-07 1.3E-07 5.6E-07 9.5E-08 3.7E-06 1.8E-06 1.7E-06Total dibenzothiophenes 5.1E-10 1.8E-09 4.0E-10 1.7E-09 2.9E-10 1.1E-08 5.7E-09 5.2E-09Vanadium 3.6E-06 8.5E-06 2.7E-06 8.5E-06 8.1E-07 5.8E-05 2.1E-05 2.7E-05Xylene 1.3E-04 2.6E-04 9.8E-05 2.6E-04 2.4E-05 0.0018 6.6E-04 8.5E-04Yttrium 8.8E-07 2.1E-06 6.7E-07 2.1E-06 2.0E-07 1.4E-05 5.1E-06 6.8E-06Zinc 6.6E-04 3.9E-04 6.1E-04 3.9E-04 2.4E-04 0.0025 0.0027 0.0012
Source: Franklin Associates, a Division of ERG
(lb per delivery of 1,000 liters of wine)(Page 2 of 2)
Table C-2b (continued)
WATERBORNE EMISSIONS FOR SINGLE-SERVING WINE CONTAINER SYSTEMS FOR THE UNITED STATES

FRANKLIN ASSOCIATES, A Division of ERG
CLIENTS\TETRAPAK\KC016757.doc 10.16.06 3560.00.003.002
C-10
Tetra Brik(1 Liter)
Tetra Prisma(1 Liter)
Tetra Prisma(500 mL)
Glass Bottle(750 mL)
PET Bottle (750 mL)
Process Fuel Process Fuel Process Fuel Process Fuel Process FuelAcenaphthene 1.6E-08 1.8E-08 2.4E-08 4.2E-08 4.3E-08Acenaphthylene 8.0E-09 8.8E-09 1.2E-08 2.1E-08 2.1E-08Acetophenone 1.9E-07 2.0E-07 2.3E-07 4.2E-07 1.8E-07Acrolein 0.0034 0.0034 0.0040 0.0015 0.0015Aldehydes (Acetaldehyde) 7.2E-04 7.3E-04 8.6E-04 3.4E-04 3.3E-04Aldehydes (Formaldehyde) 0.0039 0.0039 0.0046 0.0024 0.0020Aldehydes (Propionaldehyde) 4.8E-06 5.0E-06 5.9E-06 1.1E-05 4.5E-06Aldehydes (unspecified) 0.0054 0.0010 0.0053 0.0012 0.0063 0.0014 4.1E-04 0.0082 0.025 0.0024Ammonia 0.0051 5.0E-04 0.0053 5.7E-04 0.0063 7.1E-04 0.0031 0.0041 0.75 0.0012Ammonia Chloride 1.4E-05 1.6E-05 2.2E-05 4.2E-05 5.1E-05Anthracene 6.7E-09 7.4E-09 9.7E-09 1.7E-08 1.8E-08Antimony 7.2E-06 7.3E-06 8.7E-06 4.4E-06 4.4E-06Arsenic 3.1E-05 3.3E-05 4.0E-05 4.7E-05 4.5E-05Benzene 0.0070 0.0075 0.0091 0.025 0.010Benzo(a)anthracene 2.6E-09 2.8E-09 3.7E-09 6.6E-09 6.8E-09Benzo(a)pyrene 1.2E-09 1.3E-09 1.8E-09 3.1E-09 3.2E-09Benzo(b,j,k)fluroanthene 3.5E-09 3.9E-09 5.1E-09 9.0E-09 9.3E-09Benzo(g,h,i) perylene 8.6E-10 9.6E-10 1.2E-09 2.2E-09 2.3E-09Benzyl Chloride 8.9E-06 9.3E-06 1.1E-05 2.0E-05 8.3E-06Beryllium 1.6E-06 1.7E-06 2.1E-06 3.5E-06 2.4E-06Biphenyl 5.4E-08 6.0E-08 7.8E-08 1.4E-07 1.4E-07Bis(2-ethylhexyl) Phthalate (DEHP) 9.2E-07 9.7E-07 1.1E-06 2.1E-06 8.7E-07Bromoform 4.9E-07 5.2E-07 6.1E-07 1.1E-06 4.6E-071,3 Butadiene 9.0E-07 9.6E-07 1.2E-06 1.1E-06 1.2E-06Cadmium 6.3E-06 6.7E-06 8.2E-06 1.5E-05 9.2E-06Carbon Disulfide 1.6E-06 1.7E-06 2.0E-06 3.7E-06 1.5E-06Carbon Monoxide 0.44 1.08 0.57 1.15 0.72 1.39 0.28 4.24 2.22 1.48Carbon Tetrachloride 5.5E-11 3.8E-05 8.0E-11 3.8E-05 1.2E-10 4.5E-05 1.6E-05 9.0E-10 1.6E-05CFC12 5.5E-10 2.7E-09 8.0E-10 3.1E-09 1.2E-09 3.9E-09 2.2E-08 9.0E-09 6.5E-09Chlorine 3.0E-04 6.6E-04 3.1E-04 6.7E-04 3.7E-04 7.8E-04 3.2E-08 2.9E-04 2.5E-04 2.9E-04Chlorobenzene 2.8E-07 2.9E-07 3.4E-07 6.2E-07 2.6E-07Chloroform 7.5E-07 7.8E-07 9.2E-07 1.7E-06 7.0E-07Chromium 2.6E-05 2.7E-05 3.4E-05 3.8E-05 3.3E-05Chromium (VI) 2.5E-06 2.8E-06 3.6E-06 6.5E-06 6.7E-06Chrysene 3.2E-09 3.5E-09 4.6E-09 8.2E-09 8.5E-09CO2 (fossil) 5.69 292 7.78 330 9.76 422 194 1,591 56.1 770CO2 (non-fossil) 13.8 164 13.1 165 15.5 194 97.8 71.3 0.92 70.7Cobalt 1.1E-05 1.2E-05 1.5E-05 3.4E-05 2.5E-05Copper 1.1E-07 1.3E-07 1.6E-07 2.7E-06 4.8E-07COS 0.0034 0.0047 0.0059 0.015 Cumene 6.7E-08 7.0E-08 8.3E-08 1.5E-07 6.3E-08Cyanide 3.2E-05 3.3E-05 3.9E-05 7.0E-05 3.0E-05Dimethyl Sulfate 6.1E-07 6.4E-07 7.5E-07 1.3E-06 5.7E-072,4-Dinitrotoluene 3.5E-09 3.7E-09 4.4E-09 7.9E-09 3.3E-09Dioxins (unspecified) 1.4E-06 1.4E-06 1.7E-06 6.1E-07 6.1E-07Ethyl Chloride 5.3E-07 5.6E-07 6.5E-07 1.2E-06 5.0E-07Ethylbenzene 2.7E-04 3.2E-04 4.1E-04 0.0024 8.7E-04Ethylene Dibromide 1.5E-08 1.6E-08 1.9E-08 3.4E-08 1.4E-08Ethylene Dichloride 5.1E-07 5.3E-07 6.2E-07 1.1E-06 4.7E-07Fluorine 5.8E-05 2.9E-08 8.0E-05 3.2E-08 1.0E-04 4.2E-08 7.5E-08 2.6E-04 7.7E-08Fluoranthene 2.3E-08 2.5E-08 3.3E-08 5.8E-08 6.0E-08Fluorides 5.7E-04 5.9E-04 7.0E-04 0.0013 5.3E-04Furans (unspecified) 9.0E-11 1.0E-10 1.4E-10 2.5E-10 3.4E-10
Table C-3a
ATMOSPHERIC EMISSIONS FOR MULTI-SERVING WINE CONTAINER SYSTEMS IN CANADA(lb per delivery of 1,000 liters of wine)
(Page 1 of 2)

FRANKLIN ASSOCIATES, A Division of ERG
CLIENTS\TETRAPAK\KC016757.doc 10.16.06 3560.00.003.002
C-11
Tetra Brik(1 Liter)
Tetra Prisma(1 Liter)
Tetra Prisma(500 mL)
Glass Bottle(750 mL)
PET Bottle (750 mL)
Process Fuel Process Fuel Process Fuel Process Fuel Process FuelHCFC/HFCs 3.8E-04 5.2E-04 6.5E-04 0.0016 HCl 0.0020 0.047 0.0027 0.051 0.0034 0.066 3.5E-09 0.094 0.0087 0.10Hexane 8.5E-07 8.9E-07 1.0E-06 1.9E-06 7.9E-07Hydrocarbons (unspecified) 0.042 0.048 0.054 0.055 0.070 0.068 0.0015 0.39 0.89 0.12Hydrogen 1.8E-05 2.6E-05 3.7E-05 2.9E-05 Hydrogen cyanide 1.1E-04 1.5E-04 1.9E-04 5.0E-04 Hydrogen Fluoride 0.0032 0.0042 0.0038 0.0047 0.0047 0.0062 0.011 0.0085 0.012Indeno(1,2,3-cd)pyrene 2.0E-09 2.2E-09 2.8E-09 5.0E-09 5.2E-09Isophorone (C9H14O) 7.3E-06 7.7E-06 9.0E-06 1.6E-05 6.9E-06Kerosene 2.5E-05 2.8E-05 3.9E-05 7.5E-05 9.2E-05Lead 3.3E-07 9.5E-05 4.6E-07 9.8E-05 5.7E-07 1.2E-04 9.6E-11 1.5E-04 1.5E-06 9.6E-05Magnesium 3.5E-04 3.9E-04 5.1E-04 9.0E-04 9.3E-04Manganese 0.0014 0.0014 0.0016 6.4E-04 6.3E-04Mercaptan 0.0027 0.0029 0.0034 0.0061 0.0026Mercury 3.3E-06 2.1E-05 3.7E-06 2.2E-05 4.3E-06 2.7E-05 3.4E-06 4.6E-05 4.5E-06 2.4E-05Metals 4.9E-06 0.036 6.8E-06 0.036 8.5E-06 0.042 0.016 2.2E-05 0.015Methane 0.23 0.69 0.34 0.79 0.49 1.01 4.36 0.84 1.94Methyl Bromide 2.0E-06 2.1E-06 2.5E-06 4.5E-06 1.9E-06Methyl Chloride 6.7E-06 7.0E-06 8.3E-06 1.5E-05 6.3E-065-Methyl Chrysene 7.0E-10 7.8E-10 1.0E-09 1.8E-09 1.9E-09Methyl Ethyl Ketone 4.9E-06 5.2E-06 6.1E-06 1.1E-05 4.6E-06Methyl Hydrazine 2.2E-06 2.3E-06 2.6E-06 4.8E-06 2.0E-06Methyl Methacrylate 2.5E-07 2.6E-07 3.1E-07 5.6E-07 2.4E-07Methyl Tert Butyl Ether (MTBE) 4.4E-07 4.6E-07 5.4E-07 9.8E-07 4.2E-07Methylene Chloride 2.6E-04 2.6E-04 3.1E-04 1.6E-04 1.4E-04Naphthalene 8.3E-05 8.3E-05 9.8E-05 4.4E-05 4.0E-05Nickel 7.5E-05 8.3E-05 1.0E-04 3.7E-04 2.4E-04Nitrogen Oxides 0.37 1.23 0.40 1.36 0.48 1.69 4.59 5.60 0.56 2.83Nitrous Oxide (N2O) 1.9E-04 0.025 2.8E-04 0.027 4.0E-04 0.032 0.054 2.9E-04 0.028Other Organics 0.0056 1.2E-04 0.0082 1.3E-04 0.012 1.9E-04 3.3E-04 0.17 4.4E-04Particulates (PM 2.5) 1.2E-04 1.6E-04 2.4E-04 2.6E-05 Particulates (PM 10) 0.0013 0.49 0.0018 0.50 0.0025 0.59 0.42 0.0013 0.29Particulates (unspecified) 0.32 0.11 0.35 0.12 0.42 0.16 23.1 0.32 0.45 0.29Perchloroethylene 1.4E-06 1.6E-06 2.0E-06 4.1E-06 3.9E-06PFC (perfluorocarbons) 0.0012 0.0016 0.0020 0.0051 Phenanthrene 8.6E-08 9.6E-08 1.2E-07 2.2E-07 2.3E-07Phenols 4.5E-05 4.6E-05 5.4E-05 4.5E-05 3.0E-05Particulates (PM 10) 0.0013 0.49 0.0018 0.50 0.0025 0.59 0.42 0.0013 0.29Polyaromatic hydrocarbons (PAH) 4.8E-04 4.5E-06 6.5E-04 4.9E-06 8.2E-04 6.0E-06 6.5E-06 0.0021 7.0E-06Propylene 5.9E-05 6.4E-05 7.7E-05 7.3E-05 8.1E-05Pyrene 1.1E-08 1.2E-08 1.5E-08 2.7E-08 2.8E-08Radionuclides (curies) 0.0014 0.0016 0.0022 0.0042 0.0052Selenium 4.5E-05 4.9E-05 6.4E-05 0.0062 1.2E-04 1.1E-04Styrene 3.2E-07 3.3E-07 3.9E-07 7.0E-07 3.0E-07Sulfur Dioxide 1.56 1.76 2.29 7.64 4.39Sulfur Oxides 0.97 0.14 1.18 0.15 1.54 0.19 1.18 0.85 1.55 0.37Sulfuric acid 6.1E-06 8.4E-06 1.0E-05 2.7E-05 TOC 0.0091 0.0096 0.012 0.015 0.010 0.013Toluene 0.0035 0.0041 0.0053 0.031 0.011Total reduced sulfur 0.017 0.017 0.020 0.0019 0.0019 Trichloroethane 2.6E-07 2.7E-07 3.1E-07 5.8E-07 2.4E-07Trichloroethylene 4.5E-10 6.5E-10 9.3E-10 7.3E-09 Vinyl Acetate 9.6E-08 1.0E-07 1.2E-07 2.1E-07 9.0E-08VOC 0.079 0.047 0.082 0.054 0.12 0.068 0.37 0.023 0.13Xylenes 0.0020 0.0024 0.0031 0.018 0.0065Zinc compounds 2.4E-09 7.1E-08 4.8E-09 8.4E-08 7.9E-09 1.1E-07 1.8E-06 3.2E-07
Source: Franklin Associates, a Division of ERG
Table C-3a (continued)
ATMOSPHERIC EMISSIONS FOR MULTI-SERVING WINE CONTAINER SYSTEMS IN CANADA(lb per delivery of 1,000 liters of wine)
(Page 2 of 2)

FRANKLIN ASSOCIATES, A Division of ERG
CLIENTS\TETRAPAK\KC016757.doc 10.16.06 3560.00.003.002
C-12
Tetra Prisma (250 mL)
Tetra Prisma (200 mL)
Glass Bottle(187 mL)
PET Bottle (187 mL)
Process Fuel Process Fuel Process Fuel Process FuelAcenaphthene 2.8E-08 3.0E-08 7.3E-08 8.0E-08Acenaphthylene 1.4E-08 1.5E-08 3.6E-08 3.9E-08Acetophenone 3.4E-07 3.5E-07 6.7E-07 5.1E-07Acrolein 0.0060 0.0061 0.0064 0.0064Aldehydes (Acetaldehyde) 0.0013 0.0013 0.0014 0.0014Aldehydes (Formaldehyde) 0.0069 0.0070 0.0081 0.0078Aldehydes (Propionaldehyde) 8.5E-06 8.8E-06 1.7E-05 1.3E-05Aldehydes (unspecified) 0.0078 0.0017 0.0073 0.0017 0.0023 0.011 0.043 0.0046Ammonia 0.010 8.3E-04 0.011 8.2E-04 0.015 0.0053 1.25 0.0023Ammonia Chloride 2.3E-05 2.5E-05 6.8E-05 8.7E-05Anthracene 1.2E-08 1.2E-08 3.0E-08 3.3E-08Antimony 1.3E-05 1.3E-05 1.5E-05 1.5E-05Arsenic 5.5E-05 5.6E-05 1.0E-04 1.0E-04Benzene 0.012 0.012 0.038 0.023Benzo(a)anthracene 4.4E-09 4.7E-09 1.1E-08 1.3E-08Benzo(a)pyrene 2.1E-09 2.2E-09 5.4E-09 6.0E-09Benzo(b,j,k)fluroanthene 6.0E-09 6.4E-09 1.6E-08 1.7E-08Benzo(g,h,i) perylene 1.5E-09 1.6E-09 3.9E-09 4.3E-09Benzyl Chloride 1.6E-05 1.6E-05 3.1E-05 2.4E-05Beryllium 2.8E-06 2.9E-06 6.5E-06 5.4E-06Biphenyl 9.3E-08 9.9E-08 2.4E-07 2.7E-07Bis(2-ethylhexyl) Phthalate (DEHP) 1.6E-06 1.7E-06 3.3E-06 2.5E-06Bromoform 8.8E-07 9.1E-07 1.7E-06 1.3E-061,3 Butadiene 1.6E-06 1.7E-06 2.7E-06 3.1E-06Cadmium 1.1E-05 1.1E-05 2.6E-05 2.1E-05Carbon Disulfide 2.9E-06 3.0E-06 5.8E-06 4.4E-06Carbon Monoxide 0.95 1.86 1.02 1.86 2.85 6.27 4.56 3.42Carbon Tetrachloride 7.4E-11 6.8E-05 5.5E-11 6.8E-05 7.2E-05 1.5E-09 7.2E-05CFC12 7.4E-10 4.5E-09 5.5E-10 4.5E-09 2.9E-08 1.5E-08 1.2E-08Chlorine 4.2E-04 0.0012 4.0E-04 0.0012 4.1E-04 0.0013 4.1E-04 0.0013Chlorobenzene 4.9E-07 5.1E-07 9.8E-07 7.4E-07Chloroform 1.3E-06 1.4E-06 2.6E-06 2.0E-06Chromium 4.6E-05 4.7E-05 8.3E-05 8.0E-05Chromium (VI) 4.3E-06 4.6E-06 1.1E-05 1.2E-05Chrysene 5.5E-09 5.9E-09 1.4E-08 1.6E-08CO2 (fossil) 9.16 492 9.89 507 264 2,241 94.0 1,431CO2 (non-fossil) 18.9 293 17.2 295 114 311 1.52 311Cobalt 2.0E-05 2.0E-05 5.8E-05 5.1E-05Copper 1.7E-07 1.8E-07 3.5E-06 8.3E-07COS 0.0053 0.0058 0.025 0.025 Cumene 1.2E-07 1.2E-07 2.4E-07 1.8E-07Cyanide 5.6E-05 5.8E-05 1.1E-04 8.4E-05Dimethyl Sulfate 1.1E-06 1.1E-06 2.1E-06 1.6E-062,4-Dinitrotoluene 6.3E-09 6.5E-09 1.2E-08 9.4E-09Dioxins (unspecified) 2.5E-06 2.5E-06 2.7E-06 2.7E-06Ethyl Chloride 9.4E-07 9.8E-07 1.9E-06 1.4E-06Ethylbenzene 4.4E-04 4.4E-04 0.0032 0.0015Ethylene Dibromide 2.7E-08 2.8E-08 5.3E-08 4.0E-08Ethylene Dichloride 9.0E-07 9.3E-07 1.8E-06 1.3E-06Fluorine 9.0E-05 5.0E-08 9.8E-05 5.3E-08 4.3E-04 1.3E-07 4.3E-04 1.4E-07Fluoranthene 3.9E-08 4.2E-08 1.0E-07 1.1E-07Fluorides 0.0010 0.0010 0.0020 0.0015Furans (unspecified) 1.5E-10 1.6E-10 4.6E-10 5.7E-10
Table C-3b
ATMOSPHERIC EMISSIONS FOR SINGLE-SERVING WINE CONTAINER SYSTEMS IN CANADA(lb per delivery of 1,000 liters of wine)
(Page 1 of 2)

FRANKLIN ASSOCIATES, A Division of ERG
CLIENTS\TETRAPAK\KC016757.doc 10.16.06 3560.00.003.002
C-13
Tetra Prisma (250 mL)
Tetra Prisma (200 mL)
Glass Bottle(187 mL)
PET Bottle (187 mL)
Process Fuel Process Fuel Process Fuel Process FuelHCFC/HFCs 5.9E-04 6.3E-04 0.0027 0.0027 HCl 0.0031 0.082 0.0033 0.086 0.014 0.18 0.014 0.20Hexane 1.5E-06 1.6E-06 3.0E-06 2.3E-06Hydrocarbons (unspecified) 0.061 0.080 0.054 0.079 0.072 0.51 1.49 0.22Hydrogen 2.4E-05 1.8E-05 4.8E-05 Hydrogen cyanide 1.8E-04 1.9E-04 8.3E-04 8.3E-04 Hydrogen Fluoride 0.0047 0.0072 0.0048 0.0077 0.014 0.019 0.014 0.022Indeno(1,2,3-cd)pyrene 3.3E-09 3.6E-09 8.7E-09 9.6E-09Isophorone (C9H14O) 1.3E-05 1.4E-05 2.6E-05 2.0E-05Kerosene 4.2E-05 4.5E-05 1.2E-04 1.6E-04Lead 5.2E-07 1.7E-04 5.6E-07 1.7E-04 2.4E-06 2.9E-04 2.4E-06 2.6E-04Magnesium 6.0E-04 6.4E-04 0.0016 0.0017Manganese 0.0024 0.0024 0.0026 0.0026Mercaptan 0.0049 0.0051 0.0097 0.0073Mercury 8.4E-06 3.8E-05 9.1E-06 3.9E-05 1.8E-05 7.6E-05 1.8E-05 6.2E-05Metals 7.7E-06 0.064 8.4E-06 0.065 3.6E-05 0.068 3.6E-05 0.068Methane 0.31 1.15 0.24 1.17 0.045 6.03 1.40 3.54Methyl Bromide 3.6E-06 3.7E-06 7.1E-06 5.4E-06Methyl Chloride 1.2E-05 1.2E-05 2.4E-05 1.8E-055-Methyl Chrysene 1.2E-09 1.3E-09 3.1E-09 3.5E-09Methyl Ethyl Ketone 8.8E-06 9.1E-06 1.7E-05 1.3E-05Methyl Hydrazine 3.8E-06 4.0E-06 7.6E-06 5.7E-06Methyl Methacrylate 4.5E-07 4.7E-07 8.9E-07 6.7E-07Methyl Tert Butyl Ether (MTBE) 7.9E-07 8.1E-07 1.6E-06 1.2E-06Methylene Chloride 4.6E-04 4.6E-04 5.5E-04 5.3E-04Naphthalene 1.5E-04 1.5E-04 1.7E-04 1.6E-04Nickel 1.3E-04 1.3E-04 5.7E-04 4.5E-04Nitrogen Oxides 0.78 2.08 0.82 2.13 6.60 8.19 1.68 5.53Nitrous Oxide (N2O) 2.6E-04 0.044 2.0E-04 0.045 4.8E-05 0.094 4.8E-04 0.072Other Organics 0.0077 2.0E-04 0.0058 2.1E-04 2.6E-04 6.0E-04 0.28 7.5E-04Particulates (PM 2.5) 1.2E-04 8.5E-05 3.2E-07 4.4E-05 Particulates (PM 10) 0.0016 0.88 0.0012 0.88 5.7E-05 1.15 0.0021 1.05Particulates (unspecified) 0.52 0.19 0.53 0.20 27.4 0.53 0.93 0.55Perchloroethylene 2.4E-06 2.6E-06 6.8E-06 7.1E-06PFC (perfluorocarbons) 0.0018 0.0020 0.0085 0.0085 Phenanthrene 1.5E-07 1.6E-07 3.9E-07 4.3E-07Phenols 8.1E-05 8.1E-05 1.2E-04 1.0E-04Particulates (PM 10) 0.0016 0.88 0.0012 0.88 5.7E-05 1.15 0.0021 1.05Polyaromatic hydrocarbons (PAH) 7.4E-04 8.1E-06 8.1E-04 8.3E-06 0.0035 1.5E-05 0.0035 1.7E-05Propylene 1.1E-04 1.1E-04 1.8E-04 2.1E-04Pyrene 1.8E-08 1.9E-08 4.7E-08 5.2E-08Radionuclides (curies) 0.0023 0.0026 0.0069 0.0088Selenium 7.6E-05 8.1E-05 0.0072 2.0E-04 2.1E-04Styrene 5.6E-07 5.8E-07 1.1E-06 8.4E-07Sulfur Dioxide 2.63 2.74 11.1 8.01Sulfur Oxides 1.77 0.23 1.72 0.23 3.26 1.17 3.85 0.69Sulfuric acid 9.5E-06 1.0E-05 4.5E-05 4.5E-05 TOC 0.016 0.017 0.030 0.017 0.029Toluene 0.0057 0.0056 0.041 0.020Total reduced sulfur 0.026 0.024 0.0094 0.0094 Trichloroethane 4.5E-07 4.7E-07 9.1E-07 6.8E-07Trichloroethylene 6.0E-10 4.5E-10 1.2E-08 Vinyl Acetate 1.7E-07 1.8E-07 3.4E-07 2.6E-07VOC 0.16 0.078 0.17 0.078 9.2E-05 0.49 0.038 0.24Xylenes 0.0033 0.0033 0.024 0.012Zinc compounds 4.0E-09 1.1E-07 3.7E-09 1.2E-07 2.3E-06 5.5E-07
Source: Franklin Associates, a Division of ERG
Table C-3b (continued)
ATMOSPHERIC EMISSIONS FOR SINGLE-SERVING WINE CONTAINER SYSTEMS IN CANADA(lb per delivery of 1,000 liters of wine)
(Page 2 of 2)

FRANKLIN ASSOCIATES, A Division of ERG
CLIENTS\TETRAPAK\KC016757.doc 10.16.06 3560.00.003.002
C-14
Tetra Brik(1 Liter)
Tetra Prisma(1 Liter)
Tetra Prisma(500 mL)
Glass Bottle(750 mL)
PET Bottle (750 mL)
Process Fuel Process Fuel Process Fuel Process Fuel Process FuelAcetone 8.7E-07 1.9E-06 1.3E-06 2.2E-06 1.8E-06 2.8E-06 1.6E-05 4.2E-06 5.4E-06Acid (benzoic) 8.8E-05 1.9E-04 1.3E-04 2.2E-04 1.8E-04 2.8E-04 0.0017 4.3E-04 5.5E-04Acid (hexanoic) 1.8E-05 4.0E-05 2.6E-05 4.6E-05 3.8E-05 5.9E-05 3.4E-04 8.9E-05 1.1E-04Acid (unspecified) 0.016 1.3E-04 0.015 1.5E-04 0.018 1.9E-04 9.9E-04 0.0011 0.0072 4.1E-04Alkalinity 0.0070 0.015 0.010 0.018 0.014 0.022 0.13 0.034 0.043Alkylated benzenes 1.7E-06 5.3E-06 2.4E-06 6.1E-06 3.4E-06 7.6E-06 4.4E-05 1.6E-05 1.3E-05Alkylated fluorenes 9.7E-08 3.1E-07 1.4E-07 3.5E-07 2.0E-07 4.4E-07 2.5E-06 9.1E-07 7.8E-07Alkylated naphthalenes 2.8E-08 8.7E-08 4.0E-08 9.9E-08 5.6E-08 1.2E-07 7.2E-07 2.6E-07 2.2E-07Alkylated phenanthrenes 1.1E-08 3.6E-08 1.6E-08 4.1E-08 2.3E-08 5.2E-08 3.0E-07 1.1E-07 9.1E-08Aluminum 0.0079 0.0098 0.010 0.011 0.013 0.014 0.013 0.081 0.037 0.025Ammonia 0.0022 0.0031 0.0029 0.0036 0.0039 0.0046 0.0019 0.027 0.023 0.0088Ammonium ion 3.1E-06 1.1E-05 4.2E-06 1.2E-05 5.2E-06 1.7E-05 3.4E-05 1.3E-05 4.1E-05Antimony 1.9E-06 6.0E-06 2.8E-06 6.9E-06 3.9E-06 8.6E-06 5.0E-05 1.8E-05 1.5E-05AOX 0.0015 0.0014 0.0016 Arsenic 2.0E-05 4.7E-05 2.9E-05 5.4E-05 4.2E-05 6.9E-05 4.0E-04 1.1E-04 1.3E-04Barium 0.045 0.14 0.064 0.16 0.091 0.20 1.14 0.40 0.35Benzene 1.5E-04 3.2E-04 2.1E-04 3.7E-04 3.0E-04 4.7E-04 0.0027 7.1E-04 9.0E-04Beryllium 9.9E-07 2.4E-06 1.4E-06 2.7E-06 2.0E-06 3.5E-06 2.0E-05 5.9E-06 6.5E-06BOD 0.36 1.65 0.39 1.66 0.46 1.96 0.39 0.88 0.41 0.76Boron 2.7E-04 5.9E-04 3.9E-04 6.9E-04 5.6E-04 8.8E-04 0.0051 0.0013 0.0017Bromide 0.019 0.041 0.027 0.047 0.039 0.060 0.35 0.091 0.12Cadmium 3.0E-06 7.0E-06 4.3E-06 8.1E-06 6.2E-06 1.0E-05 5.9E-05 1.6E-05 2.0E-05Calcium 0.28 0.61 0.40 0.71 0.58 0.90 5.26 1.36 1.73Chlorides 3.14 6.84 4.53 7.94 6.50 10.1 59.2 15.3 19.4Chromium (hexavalent) 1.7E-07 2.5E-07 3.6E-07 2.8E-06 Chromium (unspecified) 8.6E-05 2.7E-04 1.2E-04 3.1E-04 1.8E-04 3.9E-04 1.1E-09 0.0023 0.0016 6.9E-04Cobalt 1.9E-06 4.2E-06 2.8E-06 4.9E-06 4.0E-06 6.2E-06 3.6E-05 9.4E-06 1.2E-05COD 0.90 0.035 0.97 0.041 1.15 0.053 0.97 0.31 1.04 0.11Copper 1.5E-05 4.2E-05 2.2E-05 4.9E-05 3.2E-05 6.2E-05 3.5E-04 1.0E-04 1.2E-04Cresols 1.1E-05 1.3E-05 1.6E-05 9.6E-05 3.1E-05Cyanide 2.1E-06 1.4E-08 2.9E-06 1.6E-08 3.6E-06 2.0E-08 7.9E-09 1.2E-07 9.4E-06 3.9E-08Cymene 1.9E-08 2.2E-08 2.8E-08 1.6E-07 5.4E-08Detergents 1.9E-06 2.6E-06 3.3E-06 8.4E-06 Dibenzofuran 1.7E-08 3.6E-08 2.4E-08 4.2E-08 3.4E-08 5.3E-08 3.1E-07 8.1E-08 1.0E-07Dibenzothiophene 1.3E-08 2.9E-08 1.9E-08 3.4E-08 2.8E-08 4.3E-08 2.5E-07 6.5E-08 8.3E-08Dissolved organics 2.2E-04 3.0E-04 3.8E-04 9.7E-04 Dissolved Solids 8.41 8.43 9.90 9.79 13.1 12.4 0.032 73.0 19.0 24.0Ethylbenzene 8.4E-06 1.8E-05 1.2E-05 2.1E-05 1.7E-05 2.6E-05 1.5E-04 4.0E-05 5.1E-05Fluorides 1.8E-04 2.5E-04 3.1E-04 8.1E-04 Fluorine 4.7E-06 1.8E-04 6.5E-06 2.0E-04 8.1E-06 2.8E-04 5.4E-04 2.8E-05 6.6E-04Furans 4.8E-09 4.8E-09 9.7E-09 Hardness 0.86 1.87 1.24 2.18 1.78 2.77 16.2 4.20 5.33Heavy metals 1.0E-04 1.4E-04 1.7E-04 4.5E-04 HFC/HCFC 8.9E-07 1.4E-06 1.6E-06 Hydrocarbons 4.9E-06 3.8E-05 4.9E-06 4.4E-05 9.8E-06 5.6E-05 3.3E-04 1.9E-07 1.1E-04Iron 0.013 0.022 0.017 0.026 0.022 0.032 0.019 0.18 0.068 0.059Isopropyl Alcohol 8.9E-07 1.4E-06 1.6E-06 Lead 3.5E-05 8.4E-05 5.0E-05 9.7E-05 7.1E-05 1.2E-04 1.4E-10 7.1E-04 2.1E-04 2.3E-04Lead 210 9.0E-15 1.3E-14 1.9E-14 4.4E-14 Lithium 0.071 0.11 0.10 0.13 0.15 0.17 1.00 0.14 0.36Magnesium 0.055 0.12 0.079 0.14 0.11 0.18 1.03 0.27 0.34Manganese 9.1E-05 5.9E-04 1.3E-04 6.7E-04 1.9E-04 8.7E-04 0.0027 4.4E-04 0.0016Mercury 9.8E-06 1.1E-07 9.2E-06 1.3E-07 1.1E-05 1.6E-07 1.4E-10 8.9E-07 3.4E-07 2.8E-07Metal Ion (unspecified) 4.9E-04 1.59 6.7E-04 1.87 8.4E-04 2.43 5.6E-07 14.4 0.0021 5.15
(Page 1 of 2)
Table C-4a
WATERBORNE EMISSIONS FOR MULTI-SERVING WINE CONTAINER SYSTEMS FOR CANADA(lb per delivery of 1,000 liters of wine)

FRANKLIN ASSOCIATES, A Division of ERG
CLIENTS\TETRAPAK\KC016757.doc 10.16.06 3560.00.003.002
C-15
Tetra Brik(1 Liter)
Tetra Prisma(1 Liter)
Tetra Prisma(500 mL)
Glass Bottle(750 mL)
PET Bottle (750 mL)
Process Fuel Process Fuel Process Fuel Process Fuel Process FuelMethanol 0.0024 0.0023 0.0027 Methyl Chloride 3.5E-09 7.6E-09 5.1E-09 8.8E-09 7.2E-09 1.1E-08 6.6E-08 1.7E-08 2.2E-08Methyl Ethyl Ketone 7.0E-09 1.5E-08 1.0E-08 1.8E-08 1.4E-08 2.2E-08 1.3E-07 3.4E-08 4.3E-08Molybdenum 2.0E-06 4.4E-06 2.9E-06 5.1E-06 4.1E-06 6.4E-06 3.8E-05 9.8E-06 1.2E-05m-Xylene 2.6E-06 3.8E-06 5.4E-06 1.3E-05 Naphthalene 1.6E-06 3.4E-06 2.3E-06 4.0E-06 3.3E-06 5.1E-06 3.0E-05 7.7E-06 9.8E-06n-Decane 2.5E-06 3.7E-06 5.2E-06 1.2E-05 n-Docosane 9.3E-08 1.3E-07 1.9E-07 4.5E-07 n-Dodecane 4.8E-06 6.9E-06 9.9E-06 2.3E-05 n-Eicosane 1.3E-06 1.9E-06 2.7E-06 6.5E-06 n-Hexacosane 5.8E-08 8.4E-08 1.2E-07 2.8E-07 n-Hexadecane 5.2E-06 7.6E-06 1.1E-05 2.6E-05 Nickel 1.7E-05 4.2E-05 2.5E-05 4.8E-05 3.6E-05 6.1E-05 9.8E-11 3.6E-04 1.0E-04 1.1E-04Nitrates 5.3E-05 2.8E-05 6.2E-05 3.1E-05 7.3E-05 4.3E-05 8.0E-05 8.4E-05 9.7E-05 1.0E-04Nitrogen 0.0051 0.0052 0.0061 0.0027 0.0027 n-Octadecane 1.3E-06 1.9E-06 2.7E-06 6.3E-06 n-Tetradecane 2.1E-06 3.0E-06 4.4E-06 1.0E-05 o + p-Xyxlene 1.9E-06 2.8E-06 4.0E-06 9.4E-06 o-Cresol 2.5E-06 3.6E-06 5.2E-06 1.2E-05 Oil 0.0070 0.0040 0.0087 0.0046 0.011 0.0059 0.019 0.034 0.018 0.011Other nitrogen 3.1E-08 9.6E-06 4.2E-08 1.1E-05 5.2E-08 1.5E-05 2.9E-05 1.4E-07 3.6E-05p-Cresol 2.7E-06 3.9E-06 5.6E-06 1.3E-05 p-Cymene 8.7E-09 1.3E-08 1.8E-08 4.2E-08 Pentamethylbenzene 6.5E-09 1.4E-08 9.4E-09 1.6E-08 1.3E-08 2.1E-08 1.2E-07 3.2E-08 4.0E-08Phenanthrene 1.4E-08 3.8E-08 2.1E-08 4.4E-08 3.0E-08 5.5E-08 3.2E-07 1.0E-07 1.0E-07Phenol 1.0E-04 9.0E-05 1.3E-04 1.0E-04 1.7E-04 1.3E-04 2.3E-04 7.8E-04 3.2E-04 2.5E-04Phosphates 0.0056 0.0062 0.0072 0.010 0.0064 Phosphorus 0.0013 0.0015 0.0018 0.0022 0.0022 Radionuclides (unspecified) 2.0E-08 2.2E-08 3.1E-08 5.9E-08 7.2E-08Radium 226 3.1E-12 4.5E-12 6.5E-12 1.5E-11 Radium 228 1.6E-14 2.3E-14 3.3E-14 7.8E-14 Selenium 3.7E-07 5.0E-06 5.4E-07 5.7E-06 7.7E-07 7.7E-06 2.2E-05 3.5E-06 1.7E-05Silver 1.8E-04 4.0E-04 2.6E-04 4.6E-04 3.8E-04 5.9E-04 0.0034 8.9E-04 0.0011Sodium 0.90 1.93 1.29 2.24 1.85 2.85 16.7 4.37 5.48Sodium dichromate 7.5E-07 7.1E-07 8.4E-07 Strontium 0.0047 0.010 0.0068 0.012 0.0098 0.015 0.089 0.023 0.029Styrene 1.6E-09 2.3E-09 3.4E-09 2.6E-09 Sulfates 0.017 0.032 0.023 0.036 0.031 0.049 0.17 0.077 0.11Sulfides 0.0051 4.4E-06 0.0059 5.0E-06 0.0069 6.2E-06 0.019 3.6E-05 0.0084 1.0E-05Sulfur 2.3E-04 5.0E-04 3.3E-04 5.8E-04 4.8E-04 7.4E-04 0.0043 0.0011 0.0014Surfactants 8.3E-05 1.7E-04 1.2E-04 2.0E-04 1.7E-04 2.6E-04 0.0015 3.7E-04 5.0E-04Suspended Solids 0.54 0.31 0.61 0.36 0.75 0.45 1.29 2.56 1.17 0.80Thallium 4.0E-07 1.3E-06 5.8E-07 1.5E-06 8.3E-07 1.8E-06 1.1E-05 3.8E-06 3.2E-06Tin 1.2E-05 3.1E-05 1.7E-05 3.6E-05 2.5E-05 4.5E-05 2.6E-04 8.0E-05 8.3E-05Titanium 2.9E-05 9.3E-05 4.2E-05 1.1E-04 6.0E-05 1.3E-04 7.7E-04 2.8E-04 2.4E-04TOC 1.6E-05 5.2E-04 2.3E-05 6.1E-04 3.4E-05 7.9E-04 0.0047 0.0057 0.0017Toluene 1.4E-04 3.0E-04 2.0E-04 3.5E-04 2.9E-04 4.4E-04 0.0026 6.7E-04 8.5E-04Total biphenyls 1.1E-07 3.4E-07 1.6E-07 3.9E-07 2.2E-07 4.9E-07 2.8E-06 1.0E-06 8.7E-07Total dibenzothiophenes 3.4E-10 1.1E-09 4.8E-10 1.2E-09 6.9E-10 1.5E-09 8.8E-09 3.1E-09 2.7E-09Vanadium 2.4E-06 5.1E-06 3.4E-06 6.0E-06 4.9E-06 7.6E-06 4.4E-05 1.2E-05 1.5E-05Xylene 8.6E-05 1.6E-04 1.2E-04 1.8E-04 1.8E-04 2.4E-04 0.0014 3.7E-04 4.5E-04Yttrium 5.9E-07 1.3E-06 8.5E-07 1.5E-06 1.2E-06 1.9E-06 1.1E-05 2.9E-06 3.6E-06Zinc 4.4E-04 2.4E-04 4.7E-04 2.7E-04 5.8E-04 3.4E-04 2.7E-04 0.0019 0.0015 6.1E-04
Source: Franklin Associates, a Division of ERG
(lb per delivery of 1,000 liters of wine)(Page 2 of 2)
Table C-4a (continued)
WATERBORNE EMISSIONS FOR MULTI-SERVING WINE CONTAINER SYSTEMS FOR CANADA

FRANKLIN ASSOCIATES, A Division of ERG
CLIENTS\TETRAPAK\KC016757.doc 10.16.06 3560.00.003.002
C-16
Tetra Prisma (250 mL)
Tetra Prisma (200 mL)
Glass Bottle(187 mL)
PET Bottle (187 mL)
Process Fuel Process Fuel Process Fuel Process FuelAcetone 1.2E-06 3.1E-06 9.0E-07 3.1E-06 3.0E-07 2.1E-05 7.1E-06 9.8E-06Acid (benzoic) 1.2E-04 3.2E-04 9.1E-05 3.1E-04 3.0E-05 0.0022 7.2E-04 0.0010Acid (hexanoic) 2.5E-05 6.5E-05 1.9E-05 6.5E-05 6.3E-06 4.5E-04 1.5E-04 2.1E-04Acid (unspecified) 0.022 2.1E-04 0.021 2.0E-04 0.0069 0.0015 0.015 7.1E-04Alkalinity 0.0093 0.025 0.0072 0.025 0.0023 0.17 0.056 0.078Alkylated benzenes 2.3E-06 8.7E-06 1.8E-06 8.6E-06 1.5E-06 5.7E-05 2.6E-05 2.5E-05Alkylated fluorenes 1.3E-07 5.0E-07 1.1E-07 5.0E-07 8.5E-08 3.3E-06 1.5E-06 1.5E-06Alkylated naphthalenes 3.7E-08 1.4E-07 3.0E-08 1.4E-07 2.4E-08 9.4E-07 4.3E-07 4.1E-07Alkylated phenanthrenes 1.6E-08 5.9E-08 1.2E-08 5.9E-08 1.0E-08 3.9E-07 1.8E-07 1.7E-07Aluminum 0.015 0.016 0.015 0.016 0.027 0.11 0.072 0.047Ammonia 0.0046 0.0051 0.0046 0.0051 0.0078 0.035 0.043 0.016Ammonium ion 4.7E-06 1.9E-05 5.2E-06 2.0E-05 2.2E-05 5.4E-05 2.2E-05 7.0E-05Antimony 2.6E-06 9.9E-06 2.1E-06 9.8E-06 1.7E-06 6.5E-05 3.0E-05 2.9E-05AOX 0.0020 0.0018 Arsenic 2.7E-05 7.7E-05 2.1E-05 7.7E-05 8.3E-06 5.3E-04 1.8E-04 2.4E-04Barium 0.060 0.22 0.048 0.22 0.037 1.48 0.66 0.65Benzene 2.0E-04 5.2E-04 1.5E-04 5.2E-04 5.0E-05 0.0036 0.0012 0.0016Beryllium 1.3E-06 3.9E-06 1.0E-06 3.9E-06 4.6E-07 2.7E-05 9.8E-06 1.2E-05BOD 0.55 2.95 0.54 2.97 0.49 3.33 0.80 3.21Boron 3.7E-04 9.8E-04 2.8E-04 9.7E-04 9.4E-05 0.0067 0.0022 0.0031Bromide 0.025 0.067 0.019 0.066 0.0064 0.46 0.15 0.21Cadmium 4.0E-06 1.2E-05 3.1E-06 1.1E-05 1.2E-06 7.8E-05 2.7E-05 3.6E-05Calcium 0.38 1.00 0.29 0.99 0.096 6.88 2.27 3.14Chlorides 4.22 11.2 3.23 11.1 1.08 77.3 25.5 35.3Chromium (hexavalent) 2.3E-07 1.7E-07 4.6E-06 Chromium (unspecified) 1.2E-04 4.5E-04 9.3E-05 4.5E-04 7.1E-05 0.0030 0.0027 0.0013Cobalt 2.6E-06 6.9E-06 2.0E-06 6.8E-06 6.6E-07 4.7E-05 1.6E-05 2.2E-05COD 1.73 0.057 1.80 0.057 2.54 0.41 3.08 0.19Copper 2.1E-05 7.0E-05 1.6E-05 7.0E-05 8.6E-06 4.5E-04 1.7E-04 2.1E-04Cresols 1.8E-05 1.8E-05 1.3E-04 5.7E-05Cyanide 3.3E-06 2.2E-08 3.6E-06 2.2E-08 1.5E-05 1.5E-07 1.6E-05 7.1E-08Cymene 3.1E-08 3.1E-08 2.1E-07 9.8E-08Detergents 3.0E-06 3.2E-06 1.4E-05 1.4E-05 Dibenzofuran 2.2E-08 5.9E-08 1.7E-08 5.9E-08 5.7E-09 4.1E-07 1.3E-07 1.9E-07Dibenzothiophene 1.8E-08 4.8E-08 1.4E-08 4.8E-08 4.6E-09 3.3E-07 1.1E-07 1.5E-07Dissolved organics 3.4E-04 3.7E-04 0.0016 0.0016 Dissolved Solids 11.4 13.9 9.65 13.8 1.50 95.4 31.6 43.5Ethylbenzene 1.1E-05 2.9E-05 8.6E-06 2.9E-05 2.8E-06 2.0E-04 6.7E-05 9.2E-05Fluorides 2.8E-04 3.1E-04 0.0013 0.0013 Fluorine 7.3E-06 3.0E-04 7.9E-06 3.3E-04 3.4E-05 8.8E-04 4.6E-05 0.0011Furans Hardness 1.16 3.08 0.89 3.06 0.30 21.2 6.98 9.67Heavy metals 1.6E-04 1.7E-04 7.4E-04 7.4E-04 HFC/HCFC 1.8E-06 1.2E-06 Hydrocarbons 6.6E-08 6.2E-05 7.2E-08 6.2E-05 3.1E-07 4.3E-04 3.1E-07 2.0E-04Iron 0.017 0.037 0.016 0.037 0.018 0.24 0.11 0.11Isopropyl Alcohol 1.8E-06 1.2E-06 Lead 4.8E-05 1.4E-04 3.7E-05 1.4E-04 1.8E-05 9.3E-04 3.6E-04 4.2E-04Lead 210 1.2E-14 9.3E-15 3.1E-15 7.3E-14 Lithium 0.094 0.18 0.071 0.18 3.2E-05 1.31 0.23 0.63Magnesium 0.073 0.20 0.056 0.19 0.019 1.35 0.44 0.61Manganese 1.2E-04 0.0010 9.5E-05 0.0010 5.0E-05 0.0040 7.3E-04 0.0030Mercury 1.3E-05 1.8E-07 1.2E-05 1.8E-07 6.8E-08 1.2E-06 5.6E-07 5.3E-07Metal Ion (unspecified) 7.7E-04 2.60 8.3E-04 2.59 0.0036 19.0 0.0036 9.06
(lb per delivery of 1,000 liters of wine)(Page 1 of 2)
Table C-4b
WATERBORNE EMISSIONS FOR SINGLE-SERVING WINE CONTAINER SYSTEMS FOR CANADA

FRANKLIN ASSOCIATES, A Division of ERG
CLIENTS\TETRAPAK\KC016757.doc 10.16.06 3560.00.003.002
C-17
Tetra Prisma (250 mL)
Tetra Prisma (200 mL)
Glass Bottle(187 mL)
PET Bottle (187 mL)
Process Fuel Process Fuel Process Fuel Process FuelMethanol 0.0033 0.0030 Methyl Chloride 4.7E-09 1.3E-08 3.6E-09 1.2E-08 1.2E-09 8.6E-08 2.8E-08 3.9E-08Methyl Ethyl Ketone 9.4E-09 2.5E-08 7.2E-09 2.5E-08 2.4E-09 1.7E-07 5.7E-08 7.9E-08Molybdenum 2.7E-06 7.1E-06 2.1E-06 7.1E-06 6.9E-07 4.9E-05 1.6E-05 2.2E-05m-Xylene 3.5E-06 2.7E-06 9.0E-07 2.1E-05 Naphthalene 2.1E-06 5.7E-06 1.6E-06 5.6E-06 5.4E-07 3.9E-05 1.3E-05 1.8E-05n-Decane 3.4E-06 2.6E-06 8.7E-07 2.1E-05 n-Docosane 1.2E-07 9.6E-08 3.2E-08 7.6E-07 n-Dodecane 6.5E-06 5.0E-06 1.6E-06 3.9E-05 n-Eicosane 1.8E-06 1.4E-06 4.5E-07 1.1E-05 n-Hexacosane 7.8E-08 6.0E-08 2.0E-08 4.7E-07 n-Hexadecane 7.0E-06 5.4E-06 1.8E-06 4.3E-05 Nickel 2.3E-05 6.9E-05 1.8E-05 6.8E-05 8.2E-06 4.7E-04 1.7E-04 2.1E-04Nitrates 1.6E-04 4.6E-05 1.8E-04 5.0E-05 4.2E-04 1.3E-04 4.2E-04 1.7E-04Nitrogen 0.0079 0.0078 0.0067 0.0067 n-Octadecane 1.7E-06 1.3E-06 4.4E-07 1.1E-05 n-Tetradecane 2.8E-06 2.2E-06 7.2E-07 1.7E-05 o + p-Xyxlene 2.6E-06 2.0E-06 6.6E-07 1.6E-05 o-Cresol 3.4E-06 2.6E-06 8.6E-07 2.0E-05 Oil 0.0095 0.0066 0.0099 0.0065 0.014 0.045 0.029 0.020Other nitrogen 4.8E-08 1.6E-05 5.2E-08 1.8E-05 2.2E-07 4.7E-05 2.2E-07 6.1E-05p-Cresol 3.6E-06 2.8E-06 9.3E-07 2.2E-05 p-Cymene 1.2E-08 8.9E-09 3.0E-09 7.1E-08 Pentamethylbenzene 8.7E-09 2.3E-08 6.7E-09 2.3E-08 2.2E-09 1.6E-07 5.3E-08 7.3E-08Phenanthrene 1.9E-08 6.2E-08 1.5E-08 6.2E-08 8.5E-09 4.2E-07 1.7E-07 1.9E-07Phenol 1.4E-04 1.5E-04 1.4E-04 1.5E-04 1.8E-04 0.0010 5.1E-04 4.6E-04Phosphates 0.011 0.012 0.020 0.020 Phosphorus 0.0043 0.0048 0.011 0.011 Radionuclides (unspecified) 3.3E-08 3.6E-08 9.6E-08 1.2E-07Radium 226 4.2E-12 3.2E-12 1.1E-12 2.6E-11 Radium 228 2.2E-14 1.7E-14 5.5E-15 1.3E-13 Selenium 5.1E-07 8.4E-06 4.0E-07 9.0E-06 3.2E-07 3.2E-05 5.8E-06 3.0E-05Silver 2.4E-04 6.5E-04 1.9E-04 6.5E-04 6.3E-05 0.0045 0.0015 0.0020Sodium 1.21 3.17 0.93 3.14 0.39 21.8 7.27 9.95Sodium dichromate 1.0E-06 9.3E-07 Strontium 0.0064 0.017 0.0049 0.017 0.0016 0.12 0.038 0.053Styrene 2.2E-09 1.6E-09 4.3E-09 Sulfates 0.025 0.053 0.024 0.055 0.078 0.24 0.13 0.18Sulfides 0.0069 7.3E-06 0.0078 7.2E-06 0.013 4.7E-05 0.013 2.0E-05Sulfur 3.1E-04 8.2E-04 2.4E-04 8.2E-04 9.2E-05 0.0057 0.0019 0.0026Surfactants 1.1E-04 2.9E-04 8.5E-05 2.8E-04 2.5E-05 0.0020 6.2E-04 9.1E-04Suspended Solids 0.82 0.51 0.79 0.51 1.70 3.34 2.12 1.49Thallium 5.5E-07 2.1E-06 4.4E-07 2.1E-06 3.5E-07 1.4E-05 6.3E-06 6.0E-06Tin 1.6E-05 5.1E-05 1.3E-05 5.0E-05 6.7E-06 3.4E-04 1.3E-04 1.5E-04Titanium 4.0E-05 1.5E-04 3.2E-05 1.5E-04 2.6E-05 0.0010 4.6E-04 4.4E-04TOC 2.2E-05 8.5E-04 1.6E-05 8.4E-04 0.0062 0.0096 0.0029Toluene 1.9E-04 4.9E-04 1.4E-04 4.9E-04 4.7E-05 0.0034 0.0011 0.0015Total biphenyls 1.5E-07 5.6E-07 1.2E-07 5.6E-07 9.5E-08 3.7E-06 1.7E-06 1.6E-06Total dibenzothiophenes 4.6E-10 1.7E-09 3.6E-10 1.7E-09 2.9E-10 1.1E-08 5.2E-09 5.0E-09Vanadium 3.2E-06 8.4E-06 2.4E-06 8.4E-06 8.1E-07 5.8E-05 1.9E-05 2.7E-05Xylene 1.2E-04 2.6E-04 8.8E-05 2.6E-04 2.4E-05 0.0018 6.1E-04 8.2E-04Yttrium 7.9E-07 2.1E-06 6.0E-07 2.1E-06 2.0E-07 1.4E-05 4.8E-06 6.6E-06Zinc 6.0E-04 3.9E-04 5.5E-04 3.9E-04 2.4E-04 0.0025 0.0025 0.0011
Source: Franklin Associates, a Division of ERG
(lb per delivery of 1,000 liters of wine)(Page 2 of 2)
Table C-4b (continued)
WATERBORNE EMISSIONS FOR SINGLE-SERVING WINE CONTAINER SYSTEMS FOR CANADA

FRANKLIN ASSOCIATES, A Division of ERG
CLIENTS\TETRAPAK\KC016757.doc 10.16.06 3560.00.003.002
D-1
APPENDIX D
RECYCLING THEORY AND METHODOLOGY INTRODUCTION In this report, the term “recycling” refers exclusively to the diversion of “postconsumer” materials away from the landfill by reprocessing these postconsumer materials into raw materials for products. Materials are considered to be “postconsumer” if they have been made into finished products that have been used as intended and then discarded. Materials that are not classified as postconsumer are considered to be coproducts if they meet the criteria for consideration as coproducts. Industrial scrap such as trim scrap, off-spec materials, and box cuttings cannot be classified as postconsumer because they have not been fabricated into finished products and subsequently used or consumed. Recycling Theory. Methodology for performing recycling calculations in LCI studies has recently been published in literature.10 In the concept of recycling, it is important to remember that recycling involves the linking of multiple product systems that were previously all independent systems produced from virgin materials into a linear series. Each independent virgin system can be described by the following equation: IO = VM + F +U + D for M pounds of product where: IO = total of all inputs and outputs VM = all inputs and outputs associated with the production of virgin
material. F = all inputs and outputs associated with the fabrication of virgin product. U = all inputs and outputs associated with the use of virgin product by
consumers. D = all inputs and outputs associated with the disposal of virgin product by
consumers. Thus, for a system in which no recycling occurs, the total of all inputs and outputs (IOT) for the entire LCI system is given by:
IOT = IOi
i=1
n∑ for Mi
i=1
n∑ = MT pounds of total products.
10 Boguski, Terrie K., Hunt, Robert G., and Franklin, William E. General Mathematical Models for LCI
Recycling. Resources, Conservation and Recycling. 12 (1994) 147-163.

FRANKLIN ASSOCIATES, A Division of ERG
CLIENTS\TETRAPAK\KC016757.doc 10.16.06 3560.00.003.002
D-2
Figure D-1 presents a two-product system with no recycling. If these systems are linked together by recycling, as presented in Figure D-2, postconsumer material from Product 1 is diverted from disposal and made into Product 2. Consequently, some of the virgin raw materials into Product 2 are replaced by the reprocessed postconsumer material from Product 1. The total inputs and outputs for the two-product open-loop recycling systems shown in Figure D-2 is defined by: IOT = VS1 + VS2 + R1(r1) − VM2(RC2) − D1(r1) + ∆2 for M1 + M2 = MT pounds of product where:
VSi = all inputs and outputs associated with the system in which Mi pounds
of Product i is made from virgin raw materials Ri = all inputs and outputs associated with recycling Mi pounds of Product
i for use as a raw material to Product i+1 ri = the fraction of Product i recovered for recycling. VMi = all inputs and outputs associated with the production of virgin
materials of product i RCi = the fraction of Product i that is made from recycled material, e.g. the
recycled material content of Product i. Di = all inputs and outputs associated with the disposal of virgin Product i
by consumers ∆ i = any differences in converting or fabrication inputs and outputs
incurred as a result of Mi pounds of Product i containing recycled materials instead of virgin materials.
If a recycling system is extended from 2 product systems to n product systems, the equation describing the total system is given by:
IOT = VSi
i=1
n∑ − Di
i=1
n∑ ri + Ri
i=1
n∑ ri − VMi
i=1
n∑ RCi + ∆i
i−1
n∑
for Mi
i =1
n
∑ = MT pounds of product.
By this methodology, the total change to the environment by recycling is given by the difference in IOT for the virgin system and IOT for the recycled system. Most often, however, it is requested that this total change to the environment as a result of recycling be attributed or allocated among each affected product in this multiple-product recycling system. Therefore, the total inputs and outputs assigned to each product in a recycling system is given by:
IOi = VMi + Fi + ∆i + Ui + Di + [ Riri − VMiRCi − Diri] × [Mi
MT]
i=1
n∑
i=1
n∑
i=1
n∑
for Mi pounds of Product i.

FRANKLIN ASSOCIATES, A Division of ERG
CLIENTS\TETRAPAK\KC016757.doc 10.16.06 3560.00.003.002
D-3
VS1 = all inputs and outputsassociated with Product 1
made from virgin material= VM1 + F1 + U1 + D1
RawMaterials
Fabrication ofProduct 1 Consumer Disposal
VM1 F1 U1
M1
D1
VS2 = all inputs and outputsassociated with Product 2
made from virgin material= VM2 + F2 + U2 + D2
RawMaterials
Fabrication ofProduct 2 Consumer Disposal
VM2 F2 U2
M2
D2
Figure D-1. A two product system with no recycling of either product.
VS1 = all inputs and outputsassociated with Product 1
made from virgin material= VM1 + F1 + U1 + D1
RawMaterials
Fabrication ofProduct 1 Consumer Disposal
VM1 F1 U1
M1
D1-D1(r1)
VS2 = all inputs and outputsassociated with Product 2
made from virgin material= VM2 + F2 + U2 + D2
RawMaterials
Fabrication ofProduct 2 Consumer Disposal
VM2-VM2(RC2) F2 + ∆2 U2
M2
D2
Figure D-2. A two product system with recovery of product 1 to become recycled content in product 2.
Recycling
R1(r1)
MR

FRANKLIN ASSOCIATES, A Division of ERG
CLIENTS\TETRAPAK\KC016757.doc 10.16.06 3560.00.003.002
D-4
It is necessary in this equation that n, the total number of products, is known. Often in practice, only a section of the entire linear recycling system is known. It is often necessary to assume both the number of products (the value of n), and also the types of products being made from recovered materials. Therefore, some additional simplifying assumptions are necessary. Since it is often not known what product is being produced at each step, it is assumed that VMi , Ri , Ui , and Di are the same for all products. It is also assumed that fabrication is not affected if recycled raw materials are substituted for virgin raw materials; thus ∆i = 0 . It is further assumed that the recycling rate (ri ) is the same for all products within the recycling system (except for the first product produced entirely from virgin materials), and that the recycled content ( RCi ) of all products (after the first virgin product) is the same. The combination of these assumptions makes recycling a linear function of the recycling rate (r). In practice, this means that the inputs and outputs at a particular recycling rate can be interpolated from endpoints at 0 percent recycling and 100 percent recycling. At a recycling rate of 100 percent, ri = 1 (except r1 = 0 ), and RCi =1 (except RC1 = 0 ). Since R, VM, and D are assumed to be constant, the summations in the above equation can now be simplified:
Riri =i=1
n∑ R ri
i=1
n∑ , Diri
i=1
n∑ = D ri
i=1
n∑ , VMiRCi
i=1
n∑ = VM RCi
i=1
n∑
At 100 percent recycling rate, r1 = 0 , ri = 1 (for i > 1), RC1 = 0 , and RCi =1 (for i > 1); therefore:
ri
i=1
n∑ = n −1 and RCi
i=1
n∑ = n −1
Also, if the output of all products is equal, then MT = n × Mi so: Mi
MT=
Mi
nMi=
1n
Therefore, the total inputs and outputs assigned to each product in a recycling system given by:
IOi = VMi + Fi + ∆i + Ui + Di + [ Riri − VMiRCi − Diri] × [Mi
MT]
i=1
n∑
i=1
n∑
i=1
n∑
can be simplified to the working equation of:
IOi =VMn
+ F +U +R(n −1)
n+
Dn

FRANKLIN ASSOCIATES, A Division of ERG
CLIENTS\TETRAPAK\KC016757.doc 10.16.06 3560.00.003.002
D-5
Application of Recycling Theory. In this study, postconsumer recycled material is used in corrugated boxes for shipping. If the original source of the recycled fiber in a box is bleached kraft paper, and the boxes are the second use of that fiber. If the fiber is not recycled further, n=2. The postconsumer recycled fiber in corrugated containers is complex. Because of the well-developed infrastructure of corrugated box recycling, it is assumed that the postconsumer fiber in corrugated containers comes from old corrugated containers. Therefore, it is assumed that postconsumer corrugated boxes are continuously recycled at a rate equivalent to the postconsumer recycled content of the box. If recycling is continuous, the effective result to the mathematical recycling equation is that n = ∞ . Therefore, for the postconsumer recycled content of corrugated containers, the working equation for recycling becomes:
IO =n→ ∞
Lim VMn
+ F +U +R(n −1)
n+
Dn
⎛ ⎝
⎞ ⎠ = F + U + R
In the above simplification of the recycling working equation, the value of n cannot actually reach infinity. However, the number of recycling “loops” is assumed to be sufficiently large so as to make the terms of the working equation for virgin inputs and outputs (VM) and disposal (D) negligible to the study.

FRANKLIN ASSOCIATES, A Division of ERG
CLIENTS\TETRAPAK\KC016757.doc 10.16.06 3560.00.003.002
E-1
APPENDIX E
GREENHOUSE GAS EMISSIONS FROM LANDFILLED PRODUCTS INTRODUCTION Historically, LCI studies have not included emissions from landfilled materials because of a lack of data of suitable quality. The primary greenhouse gas emissions are CO2 and methane (CH4). Until a few years ago, these emissions to the air were not of great interest, partly because they do not appear to create a significant threat to human health. Today they are of interest because of the rising concern about global warming. The purpose of this appendix is to examine important LCI issues of landfill emissions in order to determine if LCI calculations would assist in making comparative decisions between product or process systems. A review of current data is presented, along with an analysis of the data quality. Some example calculations are presented. While a number of references are cited, the first version of this analysis (Reference E-1) and two comprehensive summary documents play a key role in this analysis (References E-2 and E-3). These latter two references are thorough and well documented analyses of these issues prepared by ICF, Incorporated for the U.S. Environmental Protection Agency, and by researchers at the U.S. Department of Agriculture Forest Products Laboratory. (The ICF document is a draft working paper and should not be construed as official EPA policy.) The reader is encouraged to examine both of these documents. This appendix was recently reviewed by an expert in landfill gas emissions (Reference E-17) who verified that the references and conclusions of this appendix are still valid. GREENHOUSE GAS EMISSIONS FROM LANDFILLS The disposal of solid waste in a landfill is not the true boundary for a life cycle analysis. Solid wastes placed in a landfill undergo a number of simultaneous biological, chemical, and physical changes. These changes result in the production of landfill gas and leachate. An individual landfill site can generate 100 to 200 different compounds, and at least 350 compounds have been identified at the part-per-billion level in the trace contaminant portion of landfill gas (Reference E-4). However, the dominant components of landfill gas are carbon dioxide (CO2) and methane (CH4). The degradation processes that give rise to emissions from landfills are very similar to natural processes outside landfills. These are primarily caused by aerobic and anaerobic microorganisms that are found over most of the earth. However, as opposed to natural degradation, placing degradable wastes in landfills will result in degradation by anaerobic processes. This shift may cause differences in the global warming and leachate generation for different waste management scenarios. A key issue is that if biomass is left to degrade in nature, the predominant mechanism may result primarily in the aerobic

FRANKLIN ASSOCIATES, A Division of ERG
CLIENTS\TETRAPAK\KC016757.doc 10.16.06 3560.00.003.002
E-2
conversion of carbon to CO2. If the biomass degrades in a landfill, the anaerobic conversion of carbon to CH4 will dominate. Methane is considered to be many times more effective at causing global warming than CO2. The fate of degradable materials in a landfill is a very complex subject (References E-5 and E-6). A large number of variables come into play, such as moisture, permeability of cover, temperature, pH of surroundings and time, to name some of the important ones. The degradable material in landfills is very diverse (Reference E-2), but for LCI purposes we are mostly interested in paper or other cellulose-based products. This analysis assumes that the degradable portions of paper or similar products are primarily cellulose and hemicellulose (Reference E-3), or other biomass materials comprised principally of simple sugar molecular units. We assume that the degradable materials first break down into glucose or glucose-like compounds. These compounds have a generic formula of CnH2nOn, such as C6H12 O6. However, this should be viewed as a highly idealized assumption. When products decay under aerobic conditions, a major product is CO2. The expected overall reaction in an ideal case for aerobic decomposition of glucose would be (References E-5, E-7, E-8, and E-9): C6H12 O6 + 6O2 → 6CO2 +6H2O. Thus, for aerobic decomposition of each mole of degradable material (as represented by the equation), which is 180 g, there are 264 g of CO2 produced. Using a standard product mass of 1,000 kg as a basis for comparison in this analysis, this would result in about 1,470 kg of CO2. However, if these same products are landfilled and anaerobic digestion takes place, a portion of the carbon is released as methane, which has much greater greenhouse potential than CO2. If anaerobic digestion takes place, the results are quite variable, but a commonly accepted result is that glucose or similar compounds decompose (in multiple steps) into carbon dioxide and methane (References E-10, E-11, and E-12): C6H12 O6 → 3CO2 + 3CH4. Thus, for one mole of degradable material, 180 g, there are 132 g of carbon dioxide and 48 g of methane produced. For 1,000 kg of degradable material, 730 kg of CO2 and 270 kg of CH4 are produced by anaerobic decomposition. Thus, only about one-half as much CO2 is generated by the anaerobic process, but methane is produced. While the comparison of methane to CO2 is a highly controversial subject in the scientific community, U.S. policy is to adopt the subjective recommendation by the Intergovernmental Panel on Climate Change (References E-13, E-14, and E-15). They

FRANKLIN ASSOCIATES, A Division of ERG
CLIENTS\TETRAPAK\KC016757.doc 10.16.06 3560.00.003.002
E-3
suggest using “100 year global warming potentials” and multiply the kilograms of methane by 23 to obtain a “CO2 - equivalent” basis. Using that factor, the methane generated from 1,000 kg of degradable material translates into 270 kg X 23 = 6,210 kg of CO2 global warming equivalents. The purpose of these calculations is to determine if landfill emissions are potentially important in LCI. The primary greenhouse gas emissions in an LCI are from burning fuels and producing CO2. In a typical paper product system, those fossil fuel emissions range from 3,000 to 4,000 kg of CO2 for 1,000 kg of product. It is clear from this that landfill emissions are potentially important, and may even create more global warming concerns than the manufacturing and related processes for a product. REFINEMENT OF GLOBAL WARMING CALCULATIONS The preliminary calculations above are based upon a stoichiometric chemical conversion of cellulose and hemicellulose to gases. The Forest Products Laboratory
(Reference E-3) points out that actual methane emissions from landfills are, at most, 50% of stoichiometric calculations. This lowers the calculation above to 135 kg methane, and 365 kg CO2. This is assumed to be an upper bound on the range of possible values. Many reasons exist for this. Landfill decomposition generally is strongly affected by moisture content, which is highly variable from landfill to landfill, and even more so from place to place within a landfill. Anaerobic decomposition proceeds only under a narrow range of environmental conditions, including appropriate temperature, pH and moisture level. The coated and laminated paperboard considered in this study presents even greater resistance to degradation. The paperboard fiber must come into contact with the moisture and chemicals present in the landfill. The coatings and laminates are designed to prevent that, so the products must be broken open or torn during the landfilling action to expose the fiber. Even at that, fiber will be exposed only at the edges of the tear, with most of the fiber remaining protected. The only way of generating accurate data would be to conduct realistic experiments on the products in question. Decomposition in a landfill proceeds predominantly by anaerobic processes. At first, air is entrapped in the landfill, and aerobic decay occurs; within weeks the conditions become anaerobic (References E-2, E-3, and E-7). It may take decades for degradable material to decompose completely in a landfill, although many products are suspected to partially decompose rapidly at first. Not all gas produced by the decomposition of degradable materials enters the atmosphere. Minor amounts of methane react with other chemicals in a landfill, some is oxidized in the soil, and some is recovered and flared or burned as a fuel (References E-2 and E-3). The amount of methane recovered and burned as fuel has increased due to an increasing focus on the reduction of methane emissions. Some of the waste never even degrades by processes that produce landfill gases (References E-2 and E-3). A substantial amount of the carbon in landfilled material

FRANKLIN ASSOCIATES, A Division of ERG
CLIENTS\TETRAPAK\KC016757.doc 10.16.06 3560.00.003.002
E-4
becomes permanently sequestered in one of several forms of solid or semi-solid residue that does not further degrade into global warming gases. In fact, Micales (Reference E-3) notes that actual sampling at landfill sites results in measurements in the range of 1% to 50% of theoretical estimates of landfill gas evolution. He concludes that only 0 to 3% of the carbon from wood and 26% of the carbon from paper products is potentially released to the atmosphere after having been landfilled. These are maximum values, and actual degradation occurs to a lesser extent. Micales recommends use of methane potential generation factors for the decomposition of paper products in landfills. As an example, Micales presents data on a category called “coated boxboard.” The methane potential generation factor is 0.060 g methane per g dry weight. In addition, Micales assumes that the landfill gas is 60% methane and 40% CO2 (on a volume basis), or the volume ratio of CO2 to methane is 2/3. Because the molecular weight of CO2 is 44 and that of methane is 16, the weight
ratio of CO2 to methane is 2 x 443 x 16 = 1.83. Thus, the generation factor for CO2 to 0.110
g/g for coated paper, with the value for 1,000 kg of paper product becomes 60 lb methane and 110 lb of CO2. This is only 15% of the theoretical values calculated above for CO2, and 27% of the methane values. ADDITIONAL ISSUES WITH LANDFILL GAS EMISSIONS ICF suggests (References E-2 and E-16) that there are even more complexities to consider when translating gas emission data into greenhouse gas concerns. Wood is composed of carbon that trees absorb from the atmosphere. If wood is left in nature and not used for paper, it will decay and produce CO2 by primarily aerobic processes. They view the CO2 emitted from landfills as part of this natural (biogenic) cycle. They suggest that this CO2 is not an anthropogenic addition to greenhouse gases and should not be considered in studies such as LCIs as having an undesirable impact under control of humans. More importantly, they consider the residual carbon sequestered in a landfill as carbon removed from greenhouse processes. They subtract that carbon from greenhouse processes, thus giving a credit to processes that result in landfilling paper products against the actual greenhouse emissions of the system. For example, if a process emits x lb of carbon as CO2 to the atmosphere as a result of burning fossil fuels to manufacture the product, but y lb carbon in the product ends up as a carbon residual in a landfill, the net carbon contributing to greenhouse effects is x-y lb. In examples shown in the draft working paper (Reference E-2), some paper products (as well as other organic refuse components) actually have a negative carbon contribution, thus reducing the greenhouse burdens. Another important factor is the recovery of methane at landfills and either flaring it or burning it in energy recovery facilities. This converts the carbon in the methane to CO2, which ICF assumes should not be counted as an anthropogenic contributor to global

FRANKLIN ASSOCIATES, A Division of ERG
CLIENTS\TETRAPAK\KC016757.doc 10.16.06 3560.00.003.002
E-5
warming because it is considered to be an extension of the biogenic cycle where biomass carbon would be converted to CO2 naturally. In 1995, ICF estimates that in the U.S., 17% of landfill methane was recovered, but by 2000 they estimate the recovery will be at 58%. If all of these assumptions are adopted, the landfill issue is greatly reduced in importance, and may even become insignificant for LCIs. In fact, manufacture and use of some products might even appear to result in a reduction of greenhouse gases. DATA QUALITY ISSUES The previous discussion raises many complex issues with emissions from landfilling products. However, it is critical to consider the uncertainties in any calculations in this area. Micales presents an excellent review of the literature on this subject. For example, as already mentioned, sampling at landfills shows actual emissions may be in the range of 1% to 50% of theoretical calculations. Thus the highest value is a factor of 50 times the lowest value. He also sites ranges in other key factors. EPA linear model methane generation factors range from 0.02 to 0.06 g methane per gram wet mixed refuse, with the highest value being 3 times the low end of the range. One comprehensive summary of published methane generation factors ranges from 0.003 to 0.193 g per g wet mixed refuse, so that the high end of the range is 64 times the low end. Put another way, the range is about 200% of the average value. The uncertainty of any value chosen is going to be high. A slightly older summary of methane generation factors for mixed refuse showed such a large range that the highest value was 1 million times the lowest value. In order to analyze different grades of paper, both Micales and ICF cite experiments by Dr. Morton Barlaz to determine methane generation and residual carbon factors. In the ICF report, the methodology is described as putting different grades of paper in 2 liter digesters, seeding with bacteria and supplying ample water for complete digestion. While the aggregate data is reported to be consistent with other experiments on mixed wastes, there appears to be no validation that the data for a particular waste component, such as a specific grade of paper, is reasonable or gives results similar to other comparable experiments. This is important, because LCI data must be specific to products. This method is not representative of actual landfill conditions. Its purpose was to establish accelerated results that mimic possible methane generation and carbon residue data. Although the results of these experiments were used by ICF and by Micales, the data should not be construed as measures of typical or average landfill decomposition for the reasons cited in the previous section. Thus, while these factors may be useful in policy analysis, they are not representative of typical conditions and are not suitable for LCI applications.

FRANKLIN ASSOCIATES, A Division of ERG
CLIENTS\TETRAPAK\KC016757.doc 10.16.06 3560.00.003.002
E-6
The uncertainty in calculations of emissions of greenhouse gases from landfills attributable to specific products seems very high. Ranges in values used by experts are large, differing by an order of magnitude among different experts. We find high levels of subjectivity in greenhouse gas methodologies. By comparison, the CO2 generated by combustion of fossil fuels is known to +/- 10% or better. We find making similar estimates for the landfilling step would result in uncertainties far greater than +/- 10%. We conclude that the consideration of greenhouse gas emission data for landfilling in an LCI does not meet reasonable standards of data quality, when compared to the much better quality of data used elsewhere in an LCI. The values are potentially important in LCI calculations, but it is premature to develop them at this time until there is general agreement among experts on an acceptable methodology. This is particularly true in an LCI analysis where specific products are evaluated. However, it may be useful to carry out calculations using the factors derived above. They represent maximum values, and can be compared to total product system greenhouse gas emissions to ascertain whether it is likely or not that the landfilling emissions are potentially significant.

FRANKLIN ASSOCIATES, A Division of ERG
CLIENTS\TETRAPAK\KC016757.doc 10.16.06 3560.00.003.002
E-7
APPENDIX E
REFERENCES E-1 Hunt, R.G. “LCA Considerations of Solid Waste Management Alternatives for
Paper and Plastics.” Resources, Conservation, and Recycling. Vol. 14. 1995. pp. 225-231.
E-2 ICF, Incorporated. Greenhouse Gas Emissions from Municipal Waste
Management, Draft Working Paper. Prepared for the Office of Solid Waste and Office of Policy, Planning and Evaluation, U.S. Environmental Protection Agency. March 1997. Chapter 7.
E-3 Micales, J.A. and K.E. Skog. The Decomposition of Forest Products in Landfills. Accepted for publication by the Journal of International Biodeterioration and Biodegradation. 1997. E-4 SRI International. Data Summary of Municipal Solid Waste Management
Alternatives: Executive Summary. Prepared for National Renewable Energy Laboratory. NREL/TP-431-4988. August, 1992.
E-5 Senior, Eric, editor. Microbiology of Landfill Sites—Major Organic Carbon Sources. CRC Press. Boca Raton, Florida. 1995. pp. 18-34. E-6 Ham, R. K., and M.A. Barlaz. “Measurement and Prediction of Landfill Gas
Quality.” Sanitary Landfilling: Process, Technology and Environmental Impact. T.H. Christensen, R. Cossu, and R. Stegmann, editors. Academic Press. 1989. pp. 155-166.
E-7 Barlaz, Morton A., R. K. Ham and D.M. Schaefer. “Mass-Balance Analysis of Anaerobically Decomposed Refuse.” Journal of Environmental Engineering. December 1989. 115, no. 6. pp. 1088-1101. E-8 Christensen, T.H. and P. Kjeldsen. “Basic Biological Processes in Landfills.”
Sanitary Landfilling: Process, Technology and Environmental Impact. T.H. Christensen, R. Cossu, and R. Stegmann, editors. Academic Press. 1989. pp. 29-50.
E-9 Ehrig, Hans-Jurgen. “Water and Element Balances of Landfills.” The Landfill as
a Reactor. Peter Baccini, editor. Springer-Verlag. 1988. pp. 83-116. E-10 Finnveden, Goran. “Landfilling—A Forgotten Part of Life Cycle Assessments.”
Product Life Cycle Assessment, Principles and Methodology. The Nordic Council. 1992. pp. 263-277.

FRANKLIN ASSOCIATES, A Division of ERG
CLIENTS\TETRAPAK\KC016757.doc 10.16.06 3560.00.003.002
E-8
E-11 Taylor, Hunter F. “Potential Greenhouse Gas Emissions from Disposal of MSW in Sanitary Landfills vs. Waste-to-Energy facilities.” Paper presented at Air and Waste Management Association Meeting, Kansas City. June, 1992. Paper 92-16.05p.
E-12 Augenstein, Don. Greenhouse Effect Contributions of United States Landfill
Methane. EMCON Associates. San Jose, California. 1992. E-13 Hunt, Robert G., personal communication with Wiley Barbour PE, USEPA,
Office of Planning and Evaluation, Climate policies and Programs Division, June, 1997.
E-14 Barbour, Wiley and Meredith Bauer. “Summary of Greenhouse Gas Emission
Trends in the United States: 1990-1994.” The Emission Inventory: Programs and Progress. Proceedings of Specialty Conference, Air & Waste Management Association, Research Triangle Park, NC. October, 1995. pp. 83-97.
E-15 Houghton, J.T. et al., eds. Climate Change 1995; The Science of Climate
Change. Contribution of Working Group I to the Second Assessment Report of the Intergovernmental Panel on Climate Change. Cambridge University Press, New York, NY. 1996.
E-16 Hunt, Robert G, personal communication with Randy Freed, ICF, June 1997. E-17 Personal communication with Clint Burklin, ERG, September 19, 2006.

FRANKLIN ASSOCIATES, A Division of ERG
CLIENTS\TETRAPAK\KC016757.doc 10.16.06 3560.00.003.002
PR-1
PEER REVIEW REPORT AND
FRANKLIN ASSOCIATES RESPONSES

FRANKLIN ASSOCIATES, A Division of ERG
CLIENTS\TETRAPAK\KC016757.doc 10.16.06 3560.00.003.002
PR-2
FINAL PEER REVIEW
LIFE CYCLE INVENTORY OF CONTAINER SYSTEMS FOR WINE
(Report and Appendices)
Prepared for
TETRA PAK, INC. and
FRANKLIN ASSOCIATES, A Division of ERG
by
Dr. David Allen University of Texas
Dr. Greg Keoleian
Center for Sustainable Systems University of Michigan
Beth Quay (Chair) Private Consultant
October 2, 2006

FRANKLIN ASSOCIATES, A Division of ERG
CLIENTS\TETRAPAK\KC016757.doc 10.16.06 3560.00.003.002
PR-3
INTRODUCTION
At the request of Tetra Pak, Inc. and the consulting firm of Franklin Associates, a Division of Eastern Research Group, the peer review panel reviewed the report and appendices of “LCI of Container Systems for Wine”. The panel was charged with reviewing the study against the following six criteria:
• Is the methodology consistent with ISO 14040/14041? • Are the objectives, scope, and boundaries of the study clearly defined? • Are the assumptions used clearly identified and reasonable? • Are the sources of data clearly identified and representative? • Is the report complete, consistent, and transparent? • Are the conclusions appropriate based on the data and analysis?
As with Franklin Associates’ previous life cycle inventory (LCI) studies, the
panel found the approach used to perform this LCI to be technically sound and in accordance with ISO 14040 series documents.
The study scope and boundaries were explicitly stated. The components and functional unit of the container systems studied were
well defined. The data sources used were appropriate, well documented, and appeared to
be generally reliable. The study draws upon the Franklin Associates’ US LCI database, which is the most extensive US LCI database available. And, the study is supported by a comprehensive set of Appendices.
The calculations and assumptions employed were clearly and carefully described. Although the panel did not replicate all of the calculations, the analysis yielded results that seemed reasonable.
The conclusions drawn from this study are consistent with the results for the packaging systems.
Overall, the report met the high professional standards that life cycle assessment practitioners have come to expect from Franklin Associates. However, the panel does have some concerns and recommendations for improving the study, which it outlines in this report of its findings. The panel’s review has been completed in accordance with ISO 14040:1997, 7.

FRANKLIN ASSOCIATES, A Division of ERG
CLIENTS\TETRAPAK\KC016757.doc 10.16.06 3560.00.003.002
PR-4
COMMENTS Report
• ISO 14040:1997, 5.1.1 and ISO 14041:1998, 5.2 require a study to define its goal (5.1 in both standards) and “…unambiguously state the intended application, the reasons for carrying out the study, and the intended audience…” The goal, intended application, and reasons for carrying out the study are stated in the “Introduction” of the “Executive Summary”. From the “Introduction” it would also appear that Tetra Pak personnel are the only intended audience; however, this fact needs to explicitly stated.
The Executive Summary has been revised so that the audience (Tetra Pak) is clearly stated.
• As stated on ES-1, the scope of the study is to conduct an inventory
analysis of each container system, but later in the report greenhouse gas emissions are characterized in terms of CO2 equivalents. The calculation of the CO2 equivalents using GWP values is one of the most standardized and accepted methods of Life Cycle Impact Assessment (LCIA). While the panel supports including this result in the report, it recommends the authors state this intention in the “Executive Summary.”
We understand that the use of CO2 equivalents is an LCIA practice. The report has been revised so that this departure from LCI is clearly acknowledged; a statement has been added to the report that emphasizes that use of GWP values is an impact assessment method, not an LCI method.
• Page ES-1, last paragraph: The authors state “By showing the weights of
all systems per delivery of the same volume of product (one liter of wine), the packaging efficiency of each system is demonstrated.” If this were strictly true, there would be no need to do a life cycle inventory. The authors should reword this statement to indicate that mass per volume delivered is just one measure of product efficiency.
The Executive Summary has been revised so that the weight of packaging per volume of delivered wine is not presented as the only metric of packaging efficiency.
• In Table ES-1 container weights used in the study are listed and “were
based on data provided by Tetra Pak as well as measurements of containers purchased from retailers.” (Page 1-1) Appendix B, “System Descriptions,” makes the same statement but provides no further explanation of how weights were determined. Container weights chosen for study are the single most important inputs to an LCI. Yet no

FRANKLIN ASSOCIATES, A Division of ERG
CLIENTS\TETRAPAK\KC016757.doc 10.16.06 3560.00.003.002
PR-5
information is provided about data collection methods, sample sizes analyzed, or technology evaluated for the glass and PET containers measured to establish weights for this LCI. This lack of information raises many questions:
Container manufacturing plants tend to be regional, with the
current level of technology at a specific plant influencing container weights in that area. From what areas of the US and Canada were containers sampled?
Were packages from a range of manufacturers chosen for analysis? Was manufacturer market share considered in deciding what
weights to use in the LCI? Were container manufacturers contacted to get their response to
the weights chosen? What technology levels were assumed in determining container
weights? It appears the Tetra Pak plants would be new facilities, with probably the latest equipment and processes. Are Tetra Brik and Tetra Prisma containers with weights based on state-of-the-art technology being compared against off-the-shelf glass and PET units?
The Executive Summary has been revised so that the data sources and measurement methods for the container systems are presented. While the weight of a type of container may vary by manufacturer or region, the differences among the results of the Tetra Pak, glass, and PET systems of this analysis are large, and a small change in system weights would not affect the conclusions of the analysis. For the Tetra Pak containers, weight data were provided by Tetra Pak, and Franklin Associates verified these weights by weighing product samples provided by Tetra Pak and collected from local retailers. The glass containers had the widest weight variability; Franklin Associates and Tetra Pak staff collected glass bottles (both single- and multi-serving sizes), weighed them, and used the average weights in the LCI models. Only two manufacturers were identified for the single- and multi-serving PET wine bottles. Franklin Associates weighed product samples of PET bottles and also found weight data in a manufacturers press release; these two data sources agreed closely.
• The slightly larger volume of the Tetra Brik and Tetra Prisma containers
give them a slight advantage over the smaller glass and PET bottle alternatives. Generally larger volumes achieve a lower surface area/volume ratio. This is true in both the single-serving and multi-serving categories. No changes to the analysis are suggested, but the size differential and advantages should be noted.

FRANKLIN ASSOCIATES, A Division of ERG
CLIENTS\TETRAPAK\KC016757.doc 10.16.06 3560.00.003.002
PR-6
No changes have been made to the analysis. The Executive Summary discussion on packaging efficiency has been revised to include a statement on the lower surface area to volume ratio of larger containers.
• Assumed recycling rates can significantly influence study results. Table
ES-2 lists a 5% US recycling rate and a 27% Canadian recycling rate for Tetra Brik and Tetra Prisma containers. According to the report these numbers were provided by Tetra Pak in 2006, based on its observations. However, glass and PET container recycling rates are based on 1999 data, according to Appendix M. Are more current recycling estimates available for glass and PET? Other recycling questions also need to be considered:
In what type recycling programs are these Tetra Brik and Tetra
Prisma rates currently being achieved—curbside recycling or more “captive” programs, such as schools?
From what type recycling programs would Tetra Brik and Tetra Prisma wine containers be coming?
A single recycling rate was used for each container. How would differences in use profiles affect single-serving versus multi-serving container recycling? Would single-serving containers tend to be used away from home, where curbside programs might not be available, such as at convenience stores?
How do differences in use profiles affect glass bottle recycling? Do multi-serving glass bottles achieve a higher than average recycling rate from restaurants and bars?
No changes have been made to the analysis. The recycling rates were based on the best data available, including government and industry organizations in the U.S. and Canada. Further, the difference in the U.S. and Canadian recycling rates were significantly different, but the LCI results for U.S. and Canada were similar. This indicates that the LCI results in this case are not significantly affected by changes in recycling rates.
• Page ES-10, last paragraph: The statement “This LCI evaluated three
types of container systems and found three types of environmental burdens were noteworthy:” should be reworded. The three burdens that are discussed are those that could be compared to other packaging products. This does not imply that these are the only noteworthy burdens.
The above statement has been revised in the Executive Summary. The word “noteworthy” has been removed. Energy, greenhouse gases, and solid wastes are still highlighted as environmental burdens that merit further attention.
• Page ES-11, Bullet 5: The first sentence is incomplete.
FRANKLIN ASSOCIATES, A Division of ERG
CLIENTS\TETRAPAK\KC016757.doc 10.16.06 3560.00.003.002
PR-7
This sentence has been corrected.
• On page ES-11, Bullet 7, the authors state, “…the paperboard and PET
container systems have a higher percentage of combustible material than the glass container systems.” Since the secondary/tertiary packaging for the glass system is combustible, was it modeled?
Secondary packaging was included in the model for combustion with energy recovery. A statement on the inclusion of secondary packaging in the waste combustion calculations has been added to the Executive Summary.
• Page ES-12: A brief paragraph describing how biogenic fuel sources were
accounted for in greenhouse gas emissions should appear in the Executive Summary. Similar paragraphs are found elsewhere in the report, e.g., page 2-15.
The Executive Summary has been revised to include a paragraph on wood combustion and carbon neutral CO2.
• Results for air pollutant and waterborne pollutant emissions are not
reported in the “Executive Summary.” While large uncertainties can be associated with these data, the reader can still find it useful to examine the results.
The Executive Summary was written with the goal of discussing the environmental burdens that yielded the most significant results in Franklin Associates’ LCI model and are pertinent to Tetra Pak’s current operating environment. Comprehensive tables of atmospheric and waterborne emissions are provided in Appendix C of the report.
• Table 1-1a provides a detailed breakdown of system components, but does
not list any materials for the Tetra Prisma (200mL and 250 mL) and glass bottle (750mL) closures. Bullet 3 of “Limitations and Assumptions” on page 1-3 states that the Tetra Prisma containers uses foil strip closures, which account for less than 0.8 percent of the container weight. Omission of these closures is consistent with the 1 percent cut off rule. However, since the foil is aluminum, its energy contribution could be significant, and the panel recommends inventorying such components. At least a note, such as Note 3 in Table ES-1, should be added to Table1–1a to explain that Tetra Prisma closures were neglected because they “account for a negligible percentage of the total system weight.” Further, the note should state the glass bottle uses cork or plastic stoppers and aluminum closures, but they were omitted for time and budgetary concerns.

FRANKLIN ASSOCIATES, A Division of ERG
CLIENTS\TETRAPAK\KC016757.doc 10.16.06 3560.00.003.002
PR-8
The Tetra Prisma container itself includes an aluminum layer. The closure of the Tetra Prisma was excluded from the LCI, but the aluminum that comprises the Tetra Prisma far outweighs the aluminum used for the closure. The assumptions presented in Chapter 1 have been revised so that the exclusion of closures for the Tetra Prisma 200 and 250 milliliter systems is justified.
• In Table 1-1a zeroes imply zero mass, but in some cases this mass was
assumed to be negligible rather than zero. The panel recommends designating these table entries with a symbol rather than a zero, and the symbol should be defined below the table.
Table 1-1a has been revised in order to distinguish negligible and zero values.
• Historically, Tetra Pak laminated paperboard has been manufactured in
Sweden. From the transportation information provided on page 1-5 and in Appendix B, the reader can infer the paperboard laminate materials are manufactured in the US, but this fact is not explicitly stated. The country of manufacture is very important in defining the electricity grid used in the calculation of process energy demands, material demands and wastes, and should be more clearly identified in the report.
The Tetra Prisma and Tetra Brik for wine are manufactured in Denton, Texas. This has been clarified in the Executive Summary.
• Transportation from the distribution center to the retailer is neglected. It
would be useful to conduct sensitivity on this step. Trucks for such delivery are not fully loaded and the burden for this step could be significant, depending on typical distances traveled.
We expect the distance from the distribution center to the retailer to be much shorter than the preceding transportation step from the winery to the distribution center. Thus, the environmental burdens for transporting wine from the filler to the distribution center are significantly greater than those for transporting wine from the distribution center to the retailer.
• Page 2-3: Energy of Material Resource – “No fuel-energy equivalent is
assigned to combustible materials such as wood that are not major fuel sources in this country.” This convention was recommended in the US EPA LCI Guidance Manual. However, in this study wood energy is included as process energy, and a credit is also given for wood combustion at end of life. This approach is not consistent. If wood energy inputs and credits are counted, then the energy of material resource should also be counted. One approach for modeling wood and other renewable sources is to track them separately and report non-renewable and renewable energy

FRANKLIN ASSOCIATES, A Division of ERG
CLIENTS\TETRAPAK\KC016757.doc 10.16.06 3560.00.003.002
PR-9
results separately. Even adding a sensitivity analysis to show the impact of including wood’s energy of material resource on the overall study results would strengthen the report.
The way wood energy is treated in this study is not inconsistent with our defined energy of material resource (EMR) accounting convention. Our choice of the EMR convention used in this study is to quantify the depletion of resources that would otherwise be extracted and used as energy resources. On this basis, it is not inconsistent to report actual energy derived from wood (or its products) yet not assign EMR to the energy content of the wood that becomes part of the product. Within the geographic boundaries for this study, forest resources are harvested for use as a material. If not used to produce paperboard, lumber, etc., the trees would be left standing and would not be harvested for fuel; thus, while wood wastes or products are usually utilized as an energy source, material use of wood in a product is not considered a diversion from its use as an energy resource.
• Page 2-7, paragraph 2: The heating value for PET bottles of 9,900 Btu/lb
seems low. What was the source for this figure? The feedstock energy (energy of material resource) was not reported in the summary Table J-8. The heating value would seem to be much higher than 8947 Btu/lb for corrugated boxes.
The heating value for PET and other materials in this analysis are from Combustibility of Plastics, Fire, F.L., Van Nostrand Reinhold, New York, 1991. This source shows a higher heating value ranging from 9,250 to 11,600 Btu/lb for PET. The energy of material resource of PET is shown in Table J-1 of the Peer Review Appendices (a set of appendices separate from the Report Appendices); Table J-8 is a unit process table for which energy of material resource does not apply.
• On page 3-8 the assumption about the credit that might be given for
energy recovery from post-consumer waste is puzzling. In the first paragraph, the authors state: “Combustion with energy recovery usually converts thermal energy to electrical energy. At a thermal to electrical conversion efficiency of 33 percent, a 3.9 percent thermal recovery translates to a recovery of 1.3 percent of usable energy”. While these statements are true, this approach to valuing energy is inconsistent with a life cycle approach. LCI always evaluates the energy associated with fuels used to generate electricity. So, if the waste product is being used to generate electricity, that electricity will displace other electricity use, which was itself generated with about 33% efficiency. The argument made by the authors seems an attempt to convert a potential 3.9% thermal recovery into a number closer to 1%, so that different scenarios for managing post-consumer wastes will be within 1% of each other. This

FRANKLIN ASSOCIATES, A Division of ERG
CLIENTS\TETRAPAK\KC016757.doc 10.16.06 3560.00.003.002
PR-10
argument should be eliminated from the report, and the finding concerning post-consumer waste management revised accordingly.
The report has been revised so that the heat recovery from combustion of solid waste is expressed as potential recovery of thermal energy, not potential generation of electricity.
• In Tables 4-3a and 4-3b, Footnote 1 needs to be read, “From Table ES-3
and Table ES-4.”
The footnote in Tables 4-3a and 4-3b have been revised.
• Page A-14, “Recycling”: “This analysis allocates the burdens for virgin material production and end-of-life disposal among all systems that use the material, whether it is the first system using the virgin material or the last system using postconsumer material recovered from a previous useful life.” Where was this approach used and what values for n where used? It should be noted that some panel members do not support the allocation method described here, but prefer use of the EPA LCI Guidance Manual (1993) Allocation Method 2. Under Method 2, if the original product is recycled, the solid waste burden for that product is reduced by the amount of waste diverted from the disposal phase. The product system that uses the recycled material picks up the burdens for processing of the secondary material, but avoids virgin material production burdens. In this way burdens are not allocated equally to a material that has been downcycled.
The Franklin Associates recycling methodology is described in Appendix D of the report. It was assumed that the Tetra Pak containers and plastic bottles are recycled in an open loop and have two useful lives (n=2). Closed loop recycling was assumed for the glass bottles.
• The report contains several statements about not including “greenhouse
gas emissions from decomposition of materials in landfills,” such as at the bottom of page A-14. In light of the addition of Chapter 4 and Appendix E, this language needs to be revisited.
No revisions were made to the report. Appendix E was written to supplement the landfill gas assumption of the report, and we believe that the language is consistent throughout the report.
• Page A-15, paragraph 3: “Emissions data for oil production include U.S.
data for unflared methane emissions but do not include fossil carbon dioxide emissions from flaring of natural gas. In the U.S. flaring is usually done as a last resort to minimize the global warming impact of methane releases that are unavoidable or are too small to capture economically.” Why wouldn’t the carbon dioxide emissions from flaring also be counted?

FRANKLIN ASSOCIATES, A Division of ERG
CLIENTS\TETRAPAK\KC016757.doc 10.16.06 3560.00.003.002
PR-11
Although we recognize that natural gas flaring may occur at onshore oil extraction sites, no data were available to quantify the amount of natural gas flared, and no emission factors were available for flaring operations. Further research in this area might improve the data quality.
• In Appendix A, page A-17, the first full paragraph, the authors state:
“Theoretical carbon dioxide emissions from incinerated packaging could be calculated based on their carbon content and assuming complete oxidation; however, this may not be an accurate representation of the results of mixed MSW combustion. Therefore, emissions from incineration of packaging components in mixed MSW are not included in the analysis”. Similar language appears on page A-14. The panel does not disagree that the full range of combustion products from mixed MSW can be difficult to estimate. However, while it is certainly true that trace products of incomplete combustion (such as carbon monoxide and VOCs) would be difficult to estimate, total combustion efficiency in an incinerator does not vary substantially based on typical waste compositions; therefore, carbon dioxide emissions can be reliably estimated. These carbon dioxide estimates should be included in the analysis.
It is recognized that the combustion of postconsumer products in waste-to-energy facilities produces atmospheric and waterborne emissions; however, these emissions are not included in this study. Allocating atmospheric and waterborne wastes from municipal combustion facilities to specific product systems is not feasible, due to the variety of materials present in combusted municipal solid waste. Theoretical carbon dioxide emissions from incinerated containers could be calculated based on their carbon content and assuming complete oxidation; however, this may not be an accurate representation of the results of mixed MSW combustion.
• On page A-17, it was concluded that the consideration of greenhouse gas
emission data from landfilling does not meet reasonable standards of data quality. The end of life model for greenhouse gas emissions from landfill disposal is based on an older set of references. (See Appendix E, “Greenhouse Gas Emissions from Landfilled Products”). More recent studies have been conducted, including “Solid Waste Management and Greenhouse Gases: A Life-Cycle Assessment of Emissions and Sinks”, 2nd Edition, EPA530-R-02-006, May 2002. An integrated solid waste management model was developed for US EPA by RTI and North Carolina State University. (See Journal of Environmental Engineering, October 2002, p. 981.) On page A-18 the report further states, “It is beyond the scope of this study to attempt to evaluate the applicability of the EPA GHG methodology and models to the specific packaging components studied in this analysis.” Was this attempted?
FRANKLIN ASSOCIATES, A Division of ERG
CLIENTS\TETRAPAK\KC016757.doc 10.16.06 3560.00.003.002
PR-12
Appendix E was reviewed in September 2006 by an internal expert in landfill gas emissions. While the references of Appendix E are approximately 10 year old, it was concluded that their conclusions on the uncertainty of chemical activity in landfills and the fate of products of waste decomposition are still valid. However, the language in Appendix E was revised slightly, emphasizing that anaerobic decomposition is indeed the predominant mechanism for landfill decay and that biomass materials (included paper) decay in a matter of decades, not centuries.
• The formula subscripts in Appendix D appear to need revisiting. For
example, in the definition of variables included in the first formula on page D-2, shouldn’t “VMi” be “VMi+1”, and “RCi” be “RCi+1”?
VMi and RCi are the generic variables for the recycling systems. The first formula on page D-2 uses specific forms of these variables to describe an open loop recycling scenario with two products, as illustrated in Figure D-2.
Appendices
The following comments apply to the appendices submitted to the peer review panel in order to provide transparent documentation of all unit processes modeled in this analysis. These appendices are different than the appendices that appear in the report itself. In the future, a more distinct numbering convention will be used to distinguish between these two types of appendices.
• Appendices need to be renumbered to accommodate Appendix E “Greenhouse Gas Emissions from Landfilled Products,” provided as a separate document to the panel.
Appendix E “Greenhouse Gas Emissions from Landfilled Products” is intended to be a part of the report appendices, not the appendices that document the LCI data for the unit processes included in this analysis. In the future, a more distinct numbering convention will be used to help distinguish between these two types of appendices. (The unit processes appendices were compiled solely for peer review purposes.)
• Appendix K indicates that “the secondary packaging used to transport
empty containers from the container manufacturer to the filler (winery) is not included in this analysis”. The actual packaging is not explicitly stated, but is inferred to be polyethylene film and pallets. Tier sheets to separate primary packaging layers are not mentioned. Franklin Associates justify their assumption to exclude this material from the analysis by stating polyethylene film has negligible mass, and pallets are used many times. The remainder of Appendix K provides background data for filled

FRANKLIN ASSOCIATES, A Division of ERG
CLIENTS\TETRAPAK\KC016757.doc 10.16.06 3560.00.003.002
PR-13
container corrugated boxes, but no calculations are included to support this assumption for polyethylene and pallets. What is a typical mass of polyethylene film used in secondary packaging? What is the mass of a pallet, and how many times is each pallet used? How do these inventory elements compare, quantitatively, to the mass of the primary packages? The assumption of negligible contributions from secondary packaging should also be listed among the key assumptions in the “Executive Summary.”
A discussion has been provided in Appendix K (of the peer review appendices) and a sentence has been added to the Executive Summary to support the exclusion of the secondary packaging used for transportation of empty containers.
• In Appendix L, page L-1, paragraph 4, the authors state: “Tetra Pak
provided energy and emissions data per the production of one million containers; these data were not specific to one size of Tetra Brik or Tetra Prisma, but represent an ‘average’ Tetra Brik or Tetra Prisma. These data likely overstate the energy requirements for the small (less than 500 milliliters) containers and understate the energy requirements for the large (greater than 500 milliliters) containers.” It would be useful for the authors to estimate this uncertainty as a percentage of total embedded energy of material resource, to demonstrate that it is negligible.
The life cycle phase of “container production” is shown in the results tables in Chapters 2 and 3 of the report. In the case of energy, the results for the life cycle phase of container production of (shown in Tables 2-a, 2-2b, 3-2a, and 3-2b) the energy of container production is approximately 8 percent for the multi-serving containers (those that are 500 mL or greater) and approximately 10 percent for the single serving containers (those that are 200 or 250 mL). We expect these percentages to reflect the range of uncertainty introduced by the average data provided by Tetra Pak; the production energy of the Tetra Pak Prisma containers represents between 8 and 10 percent of total system energy.
• There should be a scrap rate for packaging containers during
manufacturing and at the point of filling. Was this assumed to be zero? If so, it should be stated.
The container systems of this analysis produced negligible scrap. The Tetra Brik and Tetra Prisma containers have a rectangular geometry and thus produce negligible scrap for stamping operations. The production of PET containers can recover, grind, and melt any scrap produced during the molding of PET bottles. Broken glass (cullet) produced during glass bottle formation can be easily returned to a glass furnace. A statement has

FRANKLIN ASSOCIATES, A Division of ERG
CLIENTS\TETRAPAK\KC016757.doc 10.16.06 3560.00.003.002
PR-14
been added to the report (including the Executive Summary) to support this assumption.
• Fabrication scrap losses were not accounted for. This assumption needs to be
stated in the “Executive Summary.”
See response to above bullet.
• Page M-7, paragraph 3: The two sentences seem contradictory. “The Tetra Pak containers contain no postconsumer content…The material in the Tetra Pak containers is assumed to be used in two products: the Tetra Pak containers and…”
These two sentences have been clarified. They refer to the recycling scenario: the virgin paperboard is used in the Tetra Pak container which, after postconsumer recovery, it is recycled into another paper product. This scenario is an example of open loop recycling in which the material has two generations (n=2).
• Including pictures of the containers and closures examined would
facilitate the readers’ understanding of the systems involved, if the study were ever released beyond Tetra Pak.
As Tetra Pak will be using the reports as a basis for marketing the Tetra Recart, we encourage Tetra Pak to supplement the report with graphics or other materials that are helpful in comparing and contrasting the Tetra Recart with competing container systems.

FRANKLIN ASSOCIATES, A Division of ERG
CLIENTS\TETRAPAK\KC016757.doc 10.16.06 3560.00.003.002
PR-15
PEER REVIEW PANEL QUALIFICATIONS The panel who performed the peer review of the report Life Cycle Inventory of Container Systems for Tomatoes consisted of the following members: Beth Quay, chair, Dr. David T. Allen, and Dr. Greg Keoleian. Their educational backgrounds and professional experience and qualifications are summarized below. Beth H. Quay Ms. Quay, formerly Director of Environmental Technical Affairs for The Coca-Cola Company in Atlanta, Georgia is an owner/manager of a family business, Antique & Surplus Auto Parts.
She is also an independent consultant to industry and has chaired six Life Cycle Inventory peer review teams. As chair of peer review teams she reviewed the draft LCI reports and appendices, developed a consensus report for the team, and represented the peer review team on issues raised during the peer review. Ms. Quay’s LCA experience at The Coca-Cola Company included managing and coordinating LCAs of beverage packaging and delivery systems. She participated in the SETAC “Code of Practice” Workshop in Sesimbra, Portugal in 1993, where she chaired the team that developed Chapter 6, “Presentations and Communications.” She also served as a member of the U.S. EPA LCA Peer Review Groups on Impact Analysis and Data Quality and participated in the SETAC Workshop, “A Technical Framework for Life Cycle Assessment,” in Smuggler’s Notch, Vermont in 1990. Ms. Quay’s background at The Coca-Cola Company also included management of environmental issues in company operations worldwide, including evaluation of environmental impacts of proposed packaging designs and development of recycling programs and comprehensive waste management solutions. She represented The Coca-Cola Company at environmental conferences and with industry environmental groups. Ms. Quay has a Bachelor’s Degree in Industrial Engineering (Summa Cum Laude) from Georgia Institute of Technology and has done graduate work in Applied Statistics. David T. Allen Dr. David Allen is the Gertz Regents Professor of Chemical Engineering and the Director of the Center for Energy and Environmental Resources at the University of Texas at Austin. His research interests lie in air quality and pollution prevention. He is the author of six books and over 150 papers in these areas. The quality of his research has been recognized by the National Science Foundation (through the Presidential Young Investigator Award), the AT&T Foundation (through an Industrial Ecology Fellowship), the American Institute of Chemical Engineers (through the Cecil Award for contributions to environmental engineering), and the State of Texas (through the Governor’s

FRANKLIN ASSOCIATES, A Division of ERG
CLIENTS\TETRAPAK\KC016757.doc 10.16.06 3560.00.003.002
PR-16
Environmental Excellence Award). Dr. Allen was a lead investigator in one of the largest and most successful air quality studies ever undertaken: the Texas Air Quality Study (www.utexas.edu/research/ceer/texaqs). His current research is focused on using the results from that study to provide a sound scientific basis for air quality management in Texas. In addition, Dr. Allen is actively involved in developing Green Engineering educational materials for the chemical engineering curriculum. His most recent effort is a textbook on design of chemical processes and products, jointly developed with the U.S. EPA. Dr. Allen has extensive experience in LCA and has served on a number of peer review panels of LCIs. He has taught short courses on LCA for government agencies, private companies and in continuing education programs. Dr. Allen received his B.S. degree in Chemical Engineering, with distinction, from Cornell University in 1979. His M.S. and Ph.D. degrees in Chemical Engineering were awarded by the California Institute of Technology in 1981 and 1983. He has held visiting faculty appointments at the California Institute of Technology, the University of California, Santa Barbara, and the Department of Energy. Gregory A. Keoleian, PhD Dr. Keoleian as Co-Director of the Center for Sustainable Systems is directly involved in the primary mission of the Center which is to organize and lead interdisciplinary research and education on the application of life cycle based models and sustainability metrics. He has been involved in teaching and research at the University of Michigan for over 20 years, and has an impressive list of accomplishments in Life Cycle Inventory (LCI)/Life Cycle Assessment (LCA) and related fields. He has been principal investigator on 29 funded research projects totaling over $3 million since 1989. Nine of these projects involved LCI/LCA projects, and the balance are in related areas such as design for the environment, pollution prevention, and industrial ecology. In addition, Dr. Keoleian has authored or co-authored more than 100 articles and papers for professional journals, peer reviewed technical reports, technical papers, plus presentations at conferences and workshops. Finally, he has authored or co-authored books or chapters in books on the subject of Life Cycle Assessment, industrial ecology, and pollution prevention. In short, he has been a leader in the fields of LCA, pollution prevention, and industrial technology. Dr. Keoleian has also been a peer reviewer for a number of LCI/LCA reports. Dr. Keoleian has BS degrees in Chemical Engineering and Chemistry (1980), a MS degree in chemical engineering (1982), and a PhD in Chemical Engineering (1987) all from the University of Michigan.