kaveri seed company limited - bombay stock exchange value creation through transformation sowing the...
TRANSCRIPT

kaveri seed company limited
kaveri seeds" 27th September 2017
Bombay Stock Exchange Ltd., 1" Floor New Trading Ring Rotimda Building P.J.Towers, Dalal Street, Fort, MUMBAI - 400 001
National Stock Exchange of India Ltd. Exchange Plaza, 5th Floor, Plot No.C/l, G Block, Bandra Kurla Complex, Bandra (E) MUNIBAI - 400 0051
Scrip Code: 532899 Scrip Code : KSCL
Dear Sir,
Sub:- Annual Report for the Financial Year 2016-17 - Reg.,
Pursuant to Regulation 34 of SEBI (Listing Obligation and Disclosure Requirements) Regulations, 2015, please find enclosed herewith the Annual Report for the Financial year 2016-17. This Annual Report was approved and adopted by the shareholders at the 30th Annual General Meeting of the Company held on 25th September, 2017
This is for your information and record.
Thanking you,
Yours faithfully, For KAVERI SEED COMPANY LIMITED
Encl: As above

Annual Report 2016-17
TransformationValue Creation Through
1C H A P T E R
3C H A P T E R
02 Transforming with Changing Times04 Sowing the Seeds for Growth08 Business Model10 Key Performance12 Chairman's Insight16 Innovation is the Engine of Our Progress18 Efficient Supply Chain Drives Seamless Operations20 Reaching Out Aggressively24 Excellence Driven by Teamwork25 Sowing Seeds of Community Welfare26 Board of Directors
Equity share information
• Market capitalisation: ` 3,854.66 cr (31st March, 2017)
• Promoters holding: 54.43%• National Stock Exchange (NSE): KSCL• Bombay Stock Exchange (BSE): 532899
90 Standalone Financial Statements 139 Consolidated Financial Statements
Proxy FormAttendance Slip
30 Five Years at a Glance31 Management Discussion & Analysis38 Notice of AGM 43 Directors’ Report 71 Business Responsibility Report77 Report on Corporate Governance
Corporate Overview
Statutory Reports
Financial Statements
2C H A P T E R
Contents
India’s agriculture sector commands the largest share of the country’s total land area at about 48%, compared to USA’s 18% and China’s 15%. However, farmers in India continue to suffer from low productivity. The reasons are not difficult to analyse: low usage of high-quality seeds, fertilisers, pesticides, lower farm mechanisation, weak credit facilities, shortage of water and energy.
At Kaveri Seeds, our mandate is to help change the scenario by partnering with the country’s farming community, who shoulder the responsibility of feeding the nation’s growing population.
We have sowed and nurtured the seeds of trust and loyalty among farmers for decades. The result is that we have now emerged as the preferred choice of the farming fraternity across India.
During the year, we continued to innovate with focus on enhancing productivity of farms. We also bolstered our marketing initiatives to reach out to more farmers and channel partners.
We further reinforced our position by foraying into various markets, relying on the performance of our products and catering to the changing requirements of customers.
We are also initiating several farmer engagement initiatives to grow our brand salience.
Across decades, we have steadily transformed our products, processes and innovation techniques to deliver the best of science to enhance farm productivity and ensure food and nutritional security for millions of people.
This is our roadmap of growth and value creation for all stakeholders.

2
Value Creation Through Transformation
Transforming with Changing Times
Seed production unit started by Shri G. V. Bhaskar Rao
Public offer and listing on the stock exchange
Launched premier cotton hybrid Jaadoo
Conferred the Bio-Excellence Asia Award by the Department of IT, BT and S&T, Government of Karnataka. Listed among the Forbes 'Best under a Billion' in Asia Pacific
Kaveri Seeds completed 30 years of journey
Kaveri Seeds was incorporated
Commissioned seed conditioning plants at Gundla Pochampally and Eluru
Commissioned seed conditioning plant at Pamulaparthi, Andhra Pradesh
The Company achieved significant benchmark turnover of over ` 1,100 Crores. Won the ‘Best CEO’ award by Business Today
1976
2007
2008
2015
2016
1986
2004
2009
2014

Annual Report 2016-17
Statutory reports 30-89
Financial statements 90-188
Company overview 01-29
3
Initiated R&D programme
Received recognition from the Department of Scientific and Industrial Research for our R&D initiatives
Listed among the Forbes 'Best under a Billion' in Asia Pacific
Listed among the Forbes 'Best under a Billion' in Asia Pacific Listed among 'Fastest Growing Companies' by Outlook Business
Launched first hybrid maize
Seed conditioning plant launched at Kandlakoi, Telangana
Launched Kexveg, a new initiative for premium vegetables Listed among the Forbes 'Best under a Billion' in Asia Pacific
Listed among the Forbes Best under a Billion in Asia Pacific
1991
2001
2010
2013
1997
2000
2011
2012
4
Value Creation Through Transformation
Sowing the Seeds for Growth
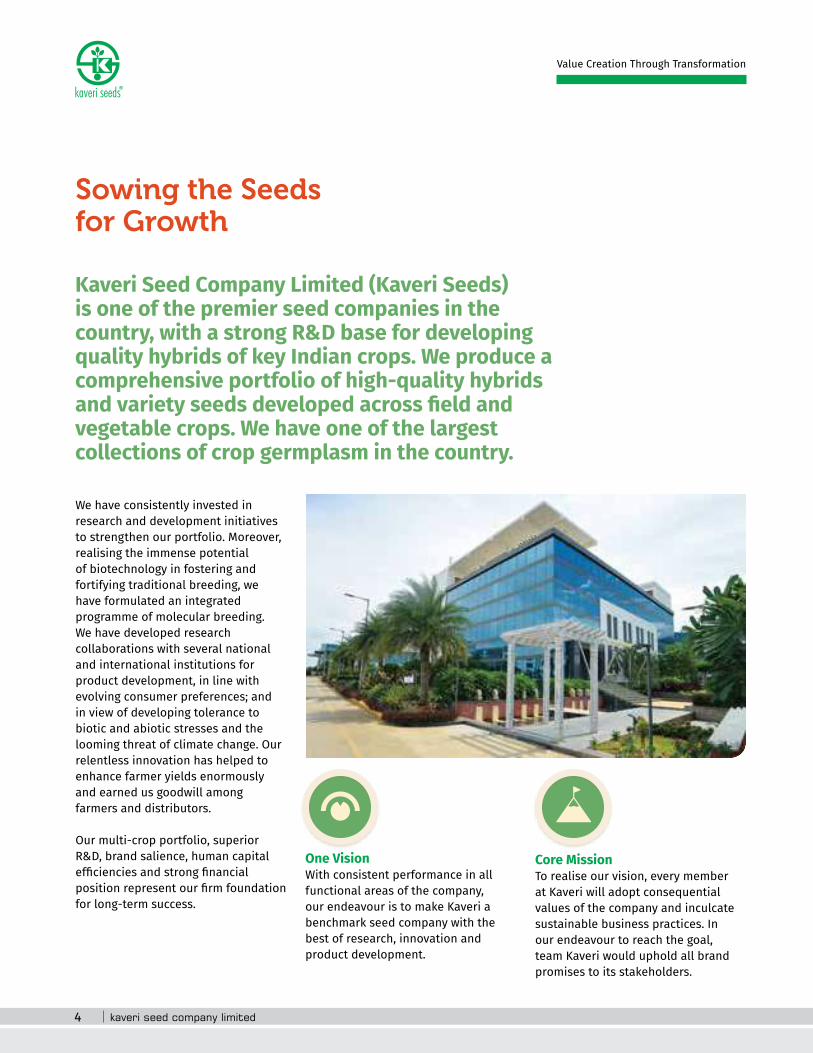
Kaveri Seed Company Limited (Kaveri Seeds) is one of the premier seed companies in the country, with a strong R&D base for developing quality hybrids of key Indian crops. We produce a comprehensive portfolio of high-quality hybrids and variety seeds developed across field and vegetable crops. We have one of the largest collections of crop germplasm in the country.
We have consistently invested in research and development initiatives to strengthen our portfolio. Moreover, realising the immense potential of biotechnology in fostering and fortifying traditional breeding, we have formulated an integrated programme of molecular breeding. We have developed research collaborations with several national and international institutions for product development, in line with evolving consumer preferences; and in view of developing tolerance to biotic and abiotic stresses and the looming threat of climate change. Our relentless innovation has helped to enhance farmer yields enormously and earned us goodwill among farmers and distributors.
Our multi-crop portfolio, superior R&D, brand salience, human capital efficiencies and strong financial position represent our firm foundation for long-term success.
One VisionWith consistent performance in all functional areas of the company, our endeavour is to make Kaveri a benchmark seed company with the best of research, innovation and product development.
Core MissionTo realise our vision, every member at Kaveri will adopt consequential values of the company and inculcate sustainable business practices. In our endeavour to reach the goal, team Kaveri would uphold all brand promises to its stakeholders.

Annual Report 2016-17
Statutory reports 30-89
Financial statements 90-188
Company overview 01-29
5
Strong reputationWe are serving Indian farmers consistently to improve their crop yields ever since inception. We have developed enduring relationships with farmers across India; and our ‘Kaveri Seeds’ brand enjoys wide reputation and loyalty, owing to our product range and quality commitment.
Proven expertiseWe have over three decades of experience in the application of the science of genetics and principles of plant breeding in the evolution of crop hybrids, quality seed production, conditioning and processing; and in building extensive distribution network with strong farmer relationship.
Seed portfolio We have the capability to produce over 100 high-quality hybrid seeds across field and vegetable crops.
Our portfolio of seed is aligned to Wider acceptance of key products
in the marketplace, leading to a significant increase in revenue
Market-oriented and need-focused breeding programmes, resulting in highly successful product portfolio
Access to a wide range of products owing to the well-established R&D set-up
High-value premium hybrids of field and vegetable crops
High brand recall across product segments in farming community
Field Crops
Vegetables
Cotton
Sunflower
Wheat
Tomato
Gourd
Maize
Mustard
Okra
Eggplant
Rice
Sorghum
Hot pepper
Bajra
Pulses
Watermelon
Crop Kaveri Market Share (%) in FY17Cotton 14.4Maize 10.8Bajra 9.2Rice 4.1
TOP 5
Rank in key crop segments

6
Value Creation Through Transformation
Reliable track record, growing free cash flow and consistent dividend payout
Diverse product portfolio, addressing crop rotation and shift
Preferred brand for farmers, growers and distributors
Farmer-centric product pipeline with superior agronomic features
Nurturing farmer relationships since decades Leadership in key crops - top 5 rank
Comprehensive germplasm repository
Pan-India operations with a comprehensive distribution network; unmatched processing and storage capabilities
Best placed to scale-up production, aligned to demand
Our competitive advantage
30,000+Loyal production growers, across 12 different agro-climatic zone
1,000+Field promoters, who work with farmers all the time
3rdLargest producer of hybrid cotton seeds in India
170+Outreach trial centres
15,000+Customer touchpoints across India’s 15 key states
16Notified hybrids under CVRC- GoI
7State-of-the-art seed technology, processing and storage plants
6,00,000 sq. ft Cumulative warehouse space at multiple strategic locations across India
50,000 acres+Land under seed production across different agro-climatic zones
214Product filings with PPV to date
94Product registrations with PPV to date
750+Motivated team members

Annual Report 2016-17
Statutory reports 30-89
Financial statements 90-188
Company overview 01-29
7
Pan- India operations
Key accreditationsOur rich germplasm/parental lines and hybrids are registered with Protection of Plant Varieties and Farmers’ Rights Authority (PPV&FRA). During this year, 21 different crop hybrids/varieties received PPVFRA Registration Certificates. So far, a total 94 hybrids/varieties have been registered with PPV by the Company.
Two rice hybrids and one hybrid each in bajra, sunflower and maize, were released through Central Varietal Release Committee (CVRC) for this year.
Our promising notified corn hybrid KMH 25K45 (Bumper) has been identified as a national check in the coordinated trials.
1
2
10
11 12
1315
14
16
3
59
67
8
4
Bellary
Pamulaparthy
Medchal
Secunderabad
Gowraram
Gundla Pochampally
Gatla Narsingapur
Pamulaparthi
Distribution presence 1. Telangana2. Andhra Pradesh3. Maharashtra4. Karnataka5. Uttar Pradesh6. Madhya Pradesh7. Gujarat8. Rajasthan9. Bihar10. Tamil Nadu11. Chhattisgarh12. Odisha13. West Bengal14. Punjab15. Jharkhand 16. Haryana
Plants
Head office
Research and Development Laboratory
Global recognition We have been globally recognised for our initiatives in India’s agribusiness landscape. We have figured on the Forbes 'Asia’s 200 Best Under a Billion List' from 2010 to 2013 and in 2015.

8
Value Creation Through Transformation
Business Model
Inputs Natural Resources
Strong Brand Equity among farming community
Assets
Comprehensive pan-India operations
Outcomes
Key Elements Creating Value
• Soil• Water• Biodiversity and ecosystem
• Large production area across India with a loyal ‘producer farmer’ network
• High credibility with the farmers• Focused programmes to spread
awareness among the farming community on new products in the market
• State-of-the-art manufacturing plants• Employees• Know-how and skills• Experience
• Network of over 15,000 direct/indirect distributors across the country
• Over 200 highly motivated marketing professionals on a pan- India basis
• Utilise more than 8,000 man-months of Promoters to communicate about best farming practices to farmers
Sustainable intensification of agriculture to provide food security
2Return on investment for growers and shareholders
1

Annual Report 2016-17
Statutory reports 30-89
Financial statements 90-188
Company overview 01-29
9
Operational Efficiency
Among the largest processing capacities
State-of-the-art warehouse capabilities
Financial Capital Governance structure
• 7 company-owned plants across key locations in India with a combined processing capacity of approx. 130 tonnes per hour
• Modern equipment for pre-cleaning, grading, cob drying, storage, packing
• Maize cob drying facility with a capacity of 2,900 tonnes per cycle
• Greenhouses for screening, uniform blast nursery for disease/pest screening
• Cotton delinting facility
• Warehouses across India with combined storage space of around 6,00,000 square feet
• Dehumidified, climate-controlled storage facilities
• Storage godowns of ~1,35,000 square feet (cold) and ~2,80,000 square feet (ambient) with holding capacity of ~25,000 MT
• Financial structure• Robust balance sheet
• Strong corporate governance system and risk management framework
• Proper internal management and control systems
Grower and customer satisfaction
Economic value shared with employees, suppliers and governments
3 4
Total average throughput~130 MT/hour
Total cold storage capacity14,000 MT
Maize cob drying facility2,900 MT/cycle
Ginning capacity8 MT/day
Environment-friendly cotton delinting capacity
16 MT/day

10
Value Creation Through Transformation
Key Performance Indicators
Revenue from Operations (` In Lakhs)
2015
-16
2014
-15
2013
-14
2012
-13
2016
-17
28,6
49.5
1
43,4
43.8
8
55,6
66.8
7
33,10
6.77
27,2
40.2
2
2015
-16
2014
-15
2013
-14
2012
-13
2016
-17
14,4
42.9
8
22,9
89.8
7 32,2
20.5
6
20,2
50.9
0
17,2
22.5
7
2015
-16
2014
-15
2013
-14
2012
-13
2016
-17
12,9
87.11 21
,056
.24 30
,184.
31
17,2
27.9
6
7,847
.12
2015
-16
2014
-15
2013
-14
2012
-13
2016
-17
60,13
9.13
80,9
11.8
6
98,5
39.5
2
71,6
52.9
5
66,9
89.10
Operating Profit (` In Lakhs)
EBIDTA Net Profit (` In Lakhs) (` In Lakhs)
(` In Lakhs)

Annual Report 2016-17
Statutory reports 30-89
Financial statements 90-188
Company overview 01-29
11
2015
-16
2014
-15
2013
-14
2012
-13
2016
-17
18.9
6
30.6
3
43.8
1
24.9
5
11.3
6
2015
-16
2014
-15
2013
-14
2012
-13
2016
-17
17,9
08.8
6
20,3
10.15
28,0
26.71
30,5
06.2
0
34,0
56.4
0
Gross Block (` In Lakhs)
2012-13 2013-14 2014-15 2015-16 2016-17
Liquidity
Current ratio 1.39 1.71 2.38 2.71 2.58
Quick ratio 0.44 0.71 1.10 1.45 1.56
Asset management
Inventory turnover 0.79 0.76 0.87 0.73 0.79
Fixed asset turnover 3.77 4.23 4.11 2.45 2.08
Receivable days 29.33 29.57 29.82 41.05 36.22
Profitability
Return on assets 0.18 0.14 0.28 0.13 0.05
Return on Equity 9.48 15.34 21.93 12.49 5.68
Return on sales 0.48 0.54 0.56 0.46 0.41
Operating margin 0.46 0.52 0.55 0.43 0.36
Leverage
Debt to equity 0.01 0.01 0.01 0.01 0.01
Debt ratio 0.60 0.49 0.34 0.31 0.33
Key Ratios
Earnings Per Share (`)

12
Value Creation Through Transformation
Chairman’s Insight
Dear ShareholdersOur planet is home to 7.2 billion people; and the population is expected to touch 9.3 billion by 2050. The result is a growing demand for food. However, the constant depletion of arable land across the world will put added pressure on countries to raise their production of food crops.
On the other hand, farm acreage remains stagnant as expanding farmlands carry high environmental risks, posed by the conversion of forests into agricultural lands. Therefore, the critical need for India is to enhance the use of high-yielding quality seeds to increase productivity.
Global crop output per acre is declining significantly owing to the disproportionate use of resources.
At the same time, water scarcity is driving enhanced research efforts to develop abiotic stress-tolerant crops that consume less water in the fields. In India, the demand for high-quality seeds is expected to grow to enhance farm yield at a time, when erratic rainfall patterns are becoming a concern for farmers.
Our performanceAt Kaveri Seeds, we are committed to strengthen India’s food and nutritional security by consolidating our fundamental strengths. During the year, we made significant progress in developing a clear framework for measuring and tracking our various operations. Initiatives, such as better and timely production planning and focus on geographic diversity for
production have enabled us to minimise the production-related risk.
A prolonged period of volatility was created in the market in 2015, following severe drought across large parts of India. However, a relatively better monsoon in 2016 enabled us to gain a favourable position, backed by several effective interventions.
We reported a lower net sales of ` 669.89 Crores in 2016-17, compared to ` 716.52 Crores 2015-16. Simultaneously, our EBIDTA decreased to ` 172.23 Crores in 2016-17 vis-à-vis ` 202.51 Crores in 2015-16. Our net profit stood at ` 78.47 Crores in 2016-17 against ` 172.28 Crores in 2015-16 and our earnings per share stood at to ` 11.36 in 2016-17, compared to ` 24.95 in 2015-16. Holistic excellence Our steady investments to bolster R&D initiatives have translated into encouraging outcomes. We have launched new hybrids in our mandate crops. We have witnessed remarkable success in major crops, such as cotton, maize, rice, bajra and vegetables. Our new breeding strategies will enable us to strengthen our R&D efforts further. We will continue to excel in innovation and development of new products.
During the year, we further fortified our position by penetrating into various markets, relying on the performance of our products and catering to the requirements of customers. We are focusing on

Annual Report 2016-17
Statutory reports 30-89
Financial statements 90-188
Company overview 01-29
13
India’s predominantly agricultural belts to enhance our business opportunities.
At the same time, we are engaging with farmers and providing them with critical information to increase their farm productivity. We are also making them aware of the quality of our products. More initiatives like farmer incentive programmes, merchandise distribution, decorated vans to educate farmers are waiting to be rolled out. These initiatives will progressively strengthen our brand recall.
Our key crops comprise cotton, rice, maize, and bajra. Despite the temporary market slowdown due to demonetisation, our market share in most of the crops grew significantly.
Our market share for cotton grew encouragingly owing to proactive initiatives, such as engaging more with farmers and making them aware of our products and their advantages. We reached out to the retailers extensively, especially in the state of Maharashtra.
Maize showed promising growth in terms of volumes and market share. This was particularly because of identifying new markets in the western, central and northern regions of India.
Although the hybrid rice didn’t perform as we had expected, we saw significant growth in our selection rice. The market for bajra remained stable; and we could introduce two new products this year.
We strengthened our vegetable seed business with increasing investment in R&D, supply chain, marketing and the launch of new products. Vegetable seeds are low-volume and high-value crops and provide a new opportunity for Kaveri. In the coming years, this portfolio will help to diversify our risk and contribute to our growth.
Team and the communityIn our drive to achieve holistic excellence on all fronts, our team has always played a pivotal role. The management has also adopted best-in-class employee engagement practices to motivate team members and strengthen their capabilities.
I am sure that Kaveri Seeds has innovative skills, creativity, good expertise and experience, as well as the right product portfolio in different crops to fulfil the aspirations of farmers and consumers of India.
Our business initiatives primarily empower farmers and our community efforts are an extension of this corporate philosophy. Kaveri acts as a vehicle of social transformation.
We undertake several community outreach programmes in some of the most remote villages of Telangana. Our area of operations includes education, community development and farmer welfare.
Our future priorities comprise Improving customer experience and
to grow market share
Increasing investment in R&D to develop products as per the changing needs of farmers
Enhancing footprint in markets where our presence is low currently
Diversifying our risk by developing vegetable business and foraying into international market
Creating appropriate framework to achieve targeted goal in all the areas
Developing talent in the organisation to support growth
On behalf of my colleagues on the Board, I would like to express my sincere gratitude to all our customer, employees, suppliers, business partners, shareholders for being with us throughout this transformational journey. I would particularly like to thank all the employees of Kaveri Seeds for their dedication, hard work and commitment towards the Company. We look forward to another successful year ahead with several new initiatives planned.
Sincerely,
G.V.Bhaskar RaoChairman and Managing Director
14
Value Creation Through Transformation
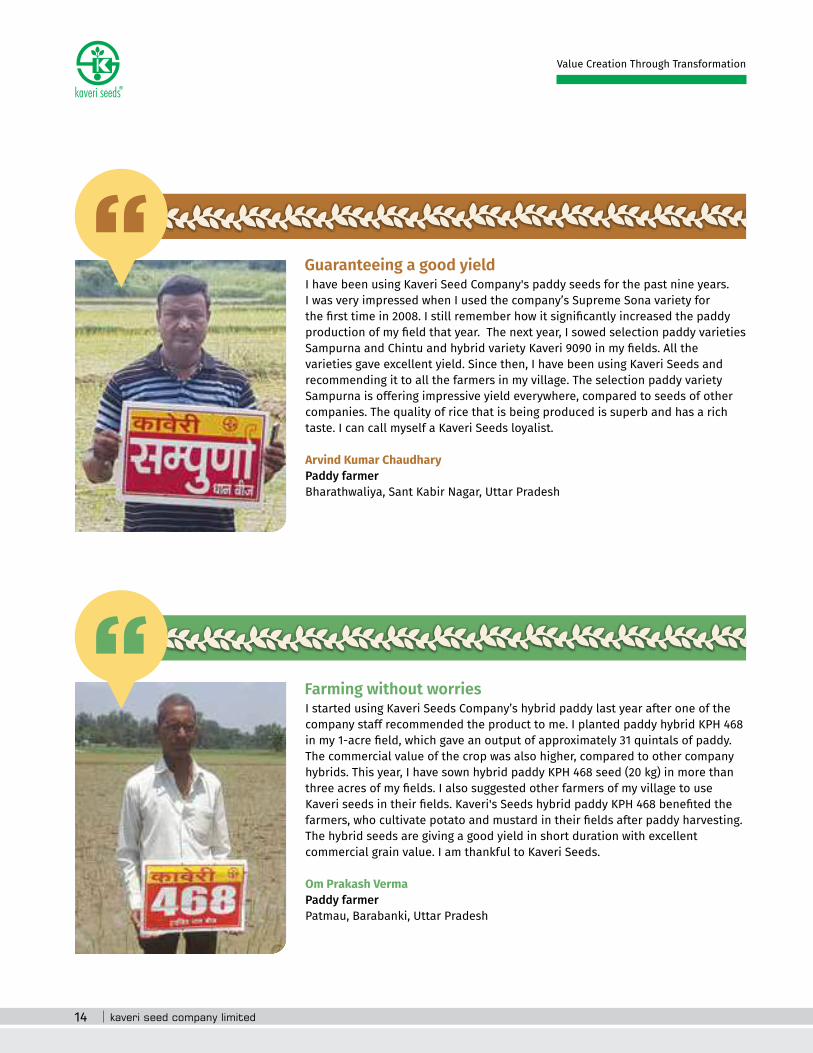
I have been using Kaveri Seed Company's paddy seeds for the past nine years. I was very impressed when I used the company’s Supreme Sona variety for the first time in 2008. I still remember how it significantly increased the paddy production of my field that year. The next year, I sowed selection paddy varieties Sampurna and Chintu and hybrid variety Kaveri 9090 in my fields. All the varieties gave excellent yield. Since then, I have been using Kaveri Seeds and recommending it to all the farmers in my village. The selection paddy variety Sampurna is offering impressive yield everywhere, compared to seeds of other companies. The quality of rice that is being produced is superb and has a rich taste. I can call myself a Kaveri Seeds loyalist.
Arvind Kumar Chaudhary Paddy farmer Bharathwaliya, Sant Kabir Nagar, Uttar Pradesh
Guaranteeing a good yield
I started using Kaveri Seeds Company’s hybrid paddy last year after one of the company staff recommended the product to me. I planted paddy hybrid KPH 468 in my 1-acre field, which gave an output of approximately 31 quintals of paddy. The commercial value of the crop was also higher, compared to other company hybrids. This year, I have sown hybrid paddy KPH 468 seed (20 kg) in more than three acres of my fields. I also suggested other farmers of my village to use Kaveri seeds in their fields. Kaveri's Seeds hybrid paddy KPH 468 benefited the farmers, who cultivate potato and mustard in their fields after paddy harvesting. The hybrid seeds are giving a good yield in short duration with excellent commercial grain value. I am thankful to Kaveri Seeds.
Om Prakash Verma Paddy farmer Patmau, Barabanki, Uttar Pradesh
Farming without worries

Annual Report 2016-17
Statutory reports 30-89
Financial statements 90-188
Company overview 01-29
15
Earlier we used to sow maize without fear. We were getting good harvest every year. However, I really don’t know from where did this menace called post-flowering stalk rot (PFSR) come. I tried almost every variety of seeds available in the market. But none of the hybrids could survive the onslaught of PFSR disease and I incurred a huge loss. It is when I came to know about Kaveri Seeds Company’s Drona hybrid. Drona came as a saviour to me when I had almost decided to give up maize cultivation. The tight husk doesn’t allow rainwater to enter the cob and the plants remain green till maturity. It is a brilliant green fodder for my cattle. Drona is highly input responsive and gives higher yields. The cobs after harvest can be stored for a long time without getting deteriorated. I am thankful to Kaveri Seeds for producing uncompromising quality seeds.
Hanumantappa Pujar Maize farmer Medur, Haveri, Karnataka
Unmatched endurance
I have been cultivating Kaveri hybrid cotton in my fields for the past many years. I use two variants of cotton -- Jaadoo and ATM. I also follow the management practices recommended by Kaveri’s sales team. The Company has benefited me every time giving satisfactory yields. I am recognised in my village as a loyal Kaveri farmer. Other farmers in my village have also adopted Kaveri Seeds hybrids after they observed that my fields were giving better yields. Kaveri Hybrid Cotton seeds Jaadoo and ATM helped me grow financially and live respectfully in my village. I convey my gratitude, as well as on behalf of my fellow farmers to Kaveri Seeds for producing such promising seeds.
Ammireddy Jaya Kumar Cotton farmer Lingapuram, Warangal, Telangana
Trust built over years

Our focus is on achieving higher profitability and outperforming the market, based on the strength of our innovation. We also engage with farmers to integrate their insights into the products that we make. Our objective is to create value for our customers through higher yields and optimal use of resources.
Innovation is The Engine of Our Progress
We have a reliable track record of launching many new products and we have a strong pipeline tailored to specific needs of the farming community. We are well placed in the emerging markets, having completed a period of extensive investments; and our long experience of managing risk is enabling us to navigate the current volatility.
Our smart breeding approach produces results with a consistent focus on producing more from less. We look at each crop through the eyes of the grower, and

Annual Report 2016-17 17
we understand the grower’s concerns and grievances. We have integrated our business, so that we can combine a broad range of technologies that will have the greatest impact on yields, quality and resource efficiency. We are making significant progress by developing suitable high yielding products for different segments of our country.
We are blending traditional breeding with advanced biotechnology, Candidate Gene Strategy and Association Mapping, among others. This will enable us to develop superior hybrids and inbred varieties that are high-yielding under optimum input use and stress environments.
Our best-in-class infrastructure and scientists are driving a breeding strategy for the development of variety of crops, especially in cotton, maize, rice and bajra, in different agronomic conditions of our country.
Our Company is uniquely equipped with infrastructure and people to have an edge over our competitors. Our strong and highly enthusiastic R&D team comprises about 100 personnel, including more than 20 scientists.
R&D developmentsOur new hybrids in cotton, maize, rice, bajra and vegetables made significant impact on the farm yield. Besides, a strong pipeline of hybrids is ready to be launched, which are tailored to yield in different environmental conditions.
We have developed over 600 acres of dedicated research farms with varying agro-climatic conditions in and around Hyderabad.
We have developed a satellite centre for rice in Lucknow and for vegetables in Guntur.
We have invested in state-of-the-art biotechnological interventions to enable efficient quality check measures. Besides, our biotechnology lab (enabling smart breeding) has made us the most productive and innovative in the industry; and we continue to strengthen returns, while accelerating the pace of innovation.
Product testing was conducted in over 170 trial centres situated in different locations across India.
We invest in the blending of traditional breeding with cutting-edge biotechnology. We have adopted candidate gene strategy, association mapping, and other such procedures to develop superior hybrids and inbred varieties that are high-yielding under optimum input use and stress environments.
Products development for the year Crop Commercial hybrids developed
& releasedHybrids under demonstration
Cotton - KCH 108, Money maker
Maize KMH 2852, KMH 5510 and Drona, KMH 1311
KMH 463, KMH 5332
Rice Shireen, KPH 468 KPH 475, Coastal King, Elito, Tino, Atom, Prize
Bajra KBH 6080, Maximo, KBH 3580 (Singham)
KBH 5424, KBH 4252
Crop Accessions availableMaize 1,000+Paddy 1,000+Bajra 1,000+Vegetables 1,000+Cotton 2,000+Others 1,000+Total 8,000+
Some of the new technologies we have deployed, include Doubled haploid breeding, MAS (Marker Aided Selection), MARS (Marker Assisted Recurrent Selection), RGA (Rapid Generation Advance), Inbred pool-heterotic bins, MPS (Multi-parent synthetics) and MAGIC (Multi-parent Advanced Generation Inter-cross populations).
Germplasm progress We have developed varieties of new germplasm. Our gene bank maintains over 8,000 propriety germplasm accessions in field crops and vegetables, which facilitates genetic enhancement and multidisciplinary crop improvement research programmes.
Summary of germplasm available in different crops
Statutory reports 30-89
Financial statements 90-188
Company overview 01-29
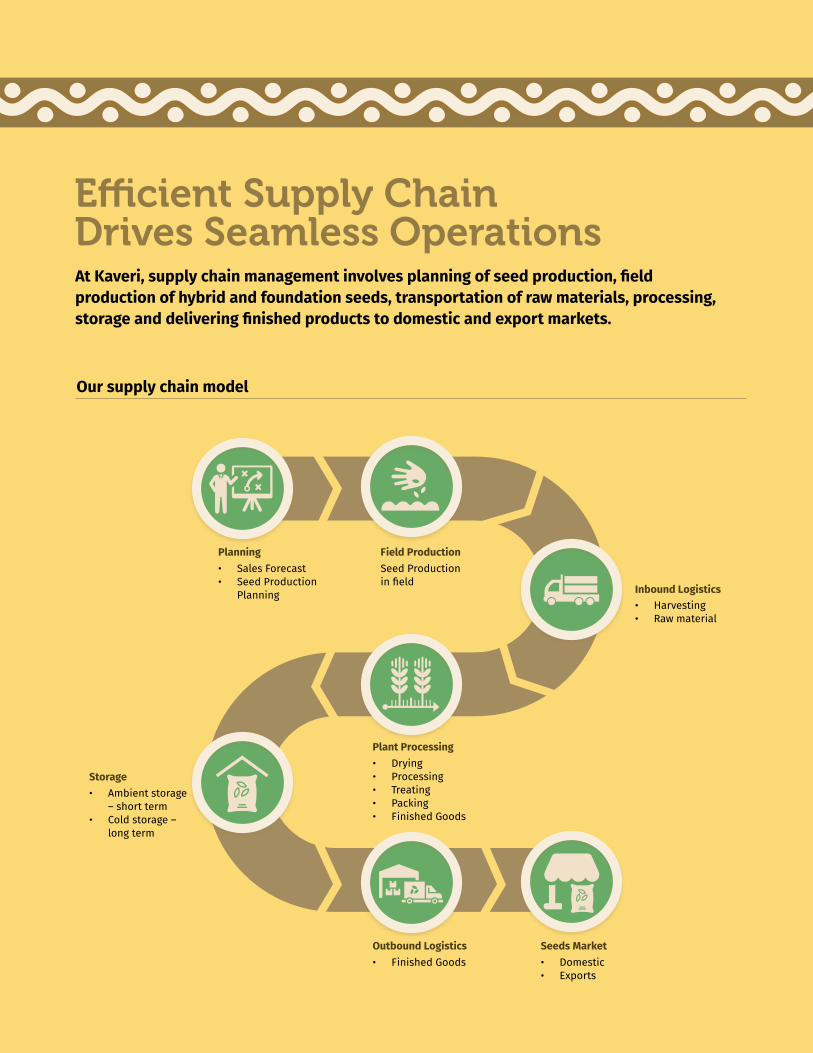
• Sales Forecast• Seed Production
Planning
• Finished Goods • Domestic • Exports
Seed Production in field
• Drying• Processing• Treating• Packing• Finished Goods
• Ambient storage – short term
• Cold storage – long term
Planning
• Harvesting • Raw material
Inbound Logistics
Seeds Market
Field Production
Plant Processing
Storage
Outbound Logistics
At Kaveri, supply chain management involves planning of seed production, field production of hybrid and foundation seeds, transportation of raw materials, processing, storage and delivering finished products to domestic and export markets.
Our supply chain model
Efficient Supply Chain Drives Seamless Operations

Annual Report 2016-17 19
In FY 2016-17, we undertook the following initiatives to strengthen our supply chain management
Implemented a comprehensive seed production planning process to accomplish delivery of target production volumes, despite challenging seed production scenario
Organised seed production in multiple geographies
Introduced direct seed grower payment-based production model in a few villages to optimise costs and fortify grower loyalty
Established new vegetable seed production locations and successfully produced vegetable seeds in Kharif and Rabi season
Strengthened seed production research (SPR) process by multi-location testing of parents of new hybrids; and conducted productivity trials of newly introduced products
Organised seed production technical training sessions for different crops at multiple production geographies to enhance the capability of field production personnel
Implemented field quality maintenance, followed by improved drying operational excellence in maize. Special effort was made in Cotton to further improve quality of seeds
Conducted pilot seed production using GMS technology in Cotton that is likely to help improve genetic purity, minimise labour intensity, reduce production costs and increase profitability in the future
Registered substantial improvement in cotton good seed recovery
Completed the first season intake, storage and processing of research paddy varieties at the newly commissioned processing plant at Molangoor, successfully
Inaugurated a dedicated storage warehouse for non-seed inventory to facilitate physical verification and control
Future InitiativesGoing forward, we are planning to implement the following
Maximise seed yields through an improved production strategy by applying several measures that include anticipating seasonal
challenges, leveraging different locations, grower base and accurately forecasting production volumes through scientific yield estimations
Sustain established vegetable seed production locations through capable co-operative organisers and skilled seed growers; explore alternative vegetable seed production geographies to reduce risk on dependence of few location
Enrich quality by implementing field quality metrics
Operational efficiency by optimising procurement, minimising seed-quality failures, inventory write-offs, seed compensations; maximising plant and cold storage capacity; efficient sales return seed management; implementing cost-effective completion of projects and maintenance of plants
Improve logistics planning and execution to deliver products in time to meet customer requirement.
Statutory reports 30-89
Financial statements 90-188
Company overview 01-29

We are expanding our marketing initiatives to reach out to more dealers and farmers. We have over 15,000 direct and indirect distributors in our network across the country. More than 200 highly motivated marketing professionals on a pan- India basis drive our marketing momentum across India.
Reaching out Aggressively

Annual Report 2016-17 21
Initiatives to engage our distributors Meetings with distributorsDistributor meetings at regional levels are organised every year, where we share our business plans with distributors. Additionally, we discuss about ways and means to strengthen the demand of our products and reach a larger consumer segment.
Key performersSpecial family trips are organised for our ‘high-performing’ distributors, every alternate year. These trips are small token of appreciation and recognition for those distributors,
who significantly contribute to our growth.
Engaging the farming communityOn-farm technology demonstrationTo strengthen the confidence and trust of farmers on our brand, we conduct farmer education programmes across geographies and make them aware of our new and high-yielding products. We engage with them and introduce them to our wide product portfolio. We impart them knowledge on best-in-class farming techniques.
Krishi melasOur team sponsors and participates in various agricultural festivals at district and state levels. These festivals are organised in collaboration with the State Department of Agriculture, State Agricultural Universities and ICAR institutions. Through these initiatives, we provide knowledge on new technologies and better farming techniques among farmers.
Other initiatives Our promoters educate farmers
about our products and agronomy practices to be followed in specific geographies
We engage in several BTL and ATL branding initiatives for targeted audiences
We are expanding our footprint in under-represented market like Jharkhand
Statutory reports 30-89
Financial statements 90-188
Company overview 01-29
22
Value Creation Through Transformation
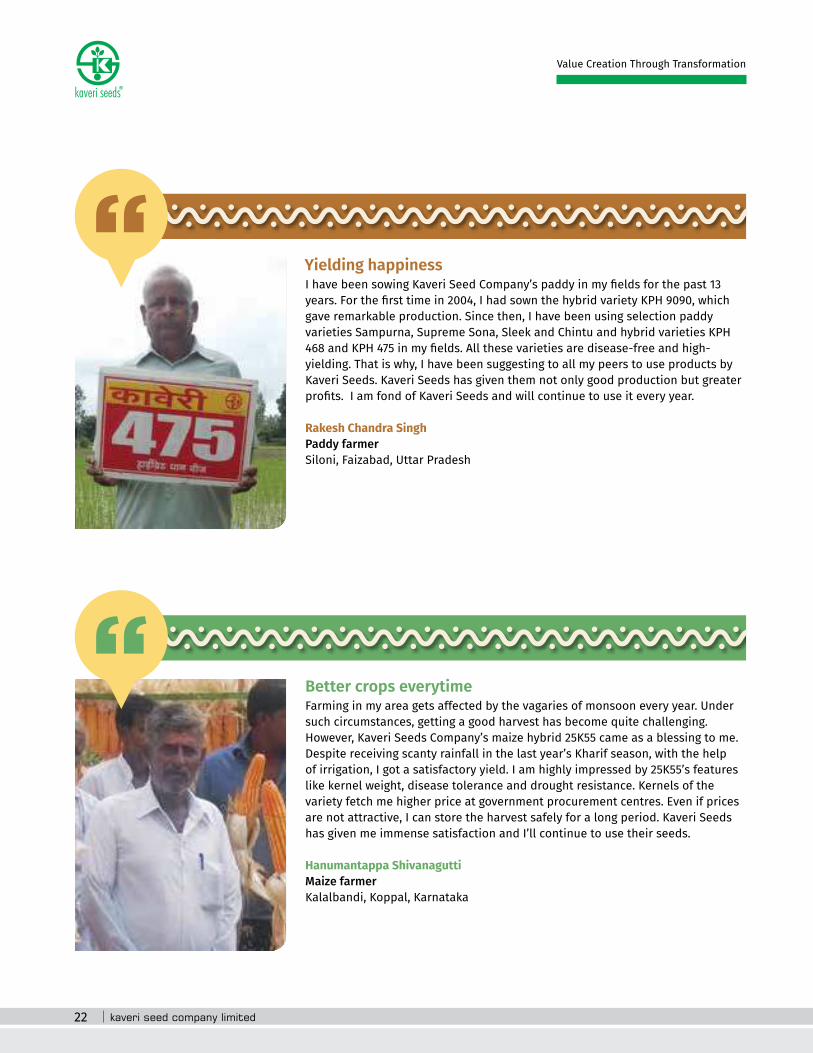
I have been sowing Kaveri Seed Company’s paddy in my fields for the past 13 years. For the first time in 2004, I had sown the hybrid variety KPH 9090, which gave remarkable production. Since then, I have been using selection paddy varieties Sampurna, Supreme Sona, Sleek and Chintu and hybrid varieties KPH 468 and KPH 475 in my fields. All these varieties are disease-free and high-yielding. That is why, I have been suggesting to all my peers to use products by Kaveri Seeds. Kaveri Seeds has given them not only good production but greater profits. I am fond of Kaveri Seeds and will continue to use it every year.
Rakesh Chandra Singh Paddy farmer Siloni, Faizabad, Uttar Pradesh
Yielding happiness
Farming in my area gets affected by the vagaries of monsoon every year. Under such circumstances, getting a good harvest has become quite challenging. However, Kaveri Seeds Company’s maize hybrid 25K55 came as a blessing to me. Despite receiving scanty rainfall in the last year’s Kharif season, with the help of irrigation, I got a satisfactory yield. I am highly impressed by 25K55’s features like kernel weight, disease tolerance and drought resistance. Kernels of the variety fetch me higher price at government procurement centres. Even if prices are not attractive, I can store the harvest safely for a long period. Kaveri Seeds has given me immense satisfaction and I’ll continue to use their seeds.
Hanumantappa Shivanagutti Maize farmer Kalalbandi, Koppal, Karnataka
Better crops everytime

Annual Report 2016-17
Statutory reports 30-89
Financial statements 90-188
Company overview 01-29
23
I have been a distributor of Kaveri Seeds for the past 12 years, and I am selling the company’s seeds in my district. All the variety of seeds produced by Kaveri are of excellent quality, and farmers also prefer these seeds every year for their yield. Both the product quality and produce quality are better than any other seeds available in the market. I feel extremely proud for being a distributor of Kaveri Seeds Company Limited. Over the years, the company has become a trusted name, consistently producing high-quality seeds.
Ramesh Kumar Maurya Distributor, Proprietor of Ramesh Beej Bhandar, Gola Bazar, Sant Kabir Nagar, Uttar Pradesh
Partnering growth
I have a friendly and conducive association with Kaveri Seeds for over 25 years. I am particularly happy with their consistency in quality of supplies and customer-friendly policies. Every year, the company embraces newer strategies to keep the brand abreast with better products and excellent field support in a highly-competitive business scenario. Because of their high-quality products, we never had to face any serious complaints from our customers. Kaveri is the brand leader in field crops in our territory. Their products have value added features like disease and drought tolerance, early maturity, higher yields and wider acceptability across geographies. Also, the Company takes immediate steps to resolve any problem. It's a win-win situation for all of us.
B.V. Basavaraj Channel Partner, Proprietor of Karnataka Hybrid Seeds Corporation K.C. Road, Bellary, Karnataka
Delivering excellence

24
Value Creation Through Transformation
Excellence Driven by TeamworkWe consistently try to attract industry relevant talent, sharpen their skill sets, and align their career objectives with the larger organisational goals.
Our aim is to create an ecosystem that allows our teams to excel, despite challenges. We provide various opportunities to our people to build their strengths and efficiency. Today, our workforce comprises over 750 strong members.
Training initiativesWe train our employees on several developmental programmes to enhance their managerial and behavioural skills. We engage with our people through various communication meetings.
We motivate our people, provide them challenges and groom their inter-personal skills. We invest in providing quality training to our scientists, who are offered knowledge sessions by consultants having vast experience in plant breeding, seed science, technology, agronomy and allied fields.
Faculty improvement programmes are organised for our field members to impart them knowledge on production, quality control, agronomy, and plant protection, among others. Line managers conduct interactive sessions with new employees.
We underwent a significant restructuring to manage the span of control, which is now more streamlined and structured. Every employee is assigned a reporting authority, who reviews their performance regularly and provides need-based feedback and support for future improvement.
Employee engagementOur HR department engages employees through a variety of programmes, which involves sports and games, and celebration of different festivals around the year. Besides, we dedicate the last Saturday of every month for recreational activities.
Employee benefitsOur HR team ensures that we provide the right benefits to our people, who work relentlessly towards achieving our shared goals. We have put in place dedicated insurance schemes for them. Moreover, mediclaims and gratuities are linked with their life insurance policies.
AwardsTo keep our people motivated and focused on organisational goals, we have introduced an award programme. The awards recognise top performers from various departments, including research and development (R&D), seed production, sales and marketing, among others.

Annual Report 2016-17
Statutory reports 30-89
Financial statements 90-188
Company overview 01-29
25
Sowing Seeds of Community WelfareAs a responsible corporate citizen, we undertake several sustainability initiatives for the well-being of communities. Our interventions help farmers improve their lives and be a part of India’s socio-economic progress.
We adopted three villages in Telangana – Gatla Narsingapur, Ramnagar and Bollena Pally, where we conducted several programmes during the year:
Constructed new school buildings at Siddipet town and Gatla Narsingapur village in Karimnagar district
Disbursed salaries of Vidya volunteers of Upper Primary School (UPS) and Zilla Parishad High School (ZPHS) at Gatla Narsingapur village,
Built a mineral water plant at Gatla Narsingapur to supply potable water
Distributed books and school bags among students of several UPS and ZPHS in Bheemdevarpally Mandal, Karimnagar district, for the academic year 2016-17
Made furniture for a school at Gatla Narsingapur village and several colleges in Karimnagar district
Funded school maintenance expenses like electricity charges of school buildings, upkeeping of canteens and arranged sports and cultural activities at UPS and ZPHS in Gatla Narsingapur village
Built new roads and improved the existing road and drainage facilities in the three villages
De-silted a tank at Gatla Narsingapur to ensure better water storage facility
Provided a school bus to Gatla Narsingapur village to facilitate smooth journey of the village children from home to school and back
Installed computers at the Gatla Narsingapur village school for students to learn the nuances of technology
Donated funds to ‘Swarna Bharath Trust’ for rural development activities
Constructed a community hall
Led massive plantation drives in three villages under the ‘Haritha Haram’ programme
Adopted three schools in three villages to ensure education and empowerment of school-going children
Provided scholarships to school and college students from socially backward communities, encouraging them to pursue higher studies

26
Value Creation Through Transformation
Board of Directors
Mr. G. V. Bhaskar Rao Chairman & Managing Director Mr. Rao has a bachelor’s degree in Science (Agriculture) from Andhra Pradesh Agriculture University. He is our founder promoter and has built this organisation from scratch. He has been the Chairman-cum-Managing Director of the Company since its inception. He spearheaded the Company’s growth to its current stature and recognition levels with his vision and rich experience. His vision to bring about a change in farming communities by developing high-yielding varieties of hybrid seeds in crops like cotton, corn, sunflower, paddy, grain, sorghum, bajra and other vegetable seeds has positively influenced millions of farmers and generated employment for many. Under his leadership, Kaveri Seeds has become a pioneer and a trendsetter in India’s seed industry. He continues to steer the Company by guiding the team to explore new opportunities. He is actively involved in giving back to the rural community by various community development initiatives.
Mrs. G. Vanaja Devi Whole Time Director
Mrs. Devi has been associated with the Company since its incorporation. She is the founder Director, who has immense knowledge in production and processing. She oversees the corporate social responsibility (CSR) initiatives and the processing plants. Besides, she has been assisting the MD on development of various aspects of the business. With her instinct to bring innovative ideas on table, she is the ideal foil and support to the MD in managing the Company. She is also a guiding force to take up various social works in the Karimnagar district.
Dr. G. Pawan Vice Chairman - Non Executive
For over a decade, Dr. G. Pawan has contributed immensely to the Company's growth and sustainability. He has served as a Director for the preceding 12 years and has recently been appointed as Vice Chairman (Non-Executive) of the Company. Dr. Pawan is an MBBS from Jawaharlal Nehru University, Belgaum, Karnataka and he has completed Doctor of Medicine (MD) from Illinois State University, Chicago, USA. His consistent focus on strategic issues and long-term business plans and operations of the Company will help it elevate to a new orbit of competitiveness and value creation. Dr. Pawan has been instrumental in formulating strategic and long-term business plans, assisting the Chairman and Managing Director to do justice to his role and take vital decisions for sustainable value creation for all stakeholders.

Annual Report 2016-17
Statutory reports 30-89
Financial statements 90-188
Company overview 01-29
27
Mr. C. Vamsheedhar Whole Time Director
Mr. Vamsheedhar is associated with the Company for the past decade. He is an Executive Director, as well a key player and growth driver in ‘Team Kaveri’. He has a rich experience in marketing; and also advises in the general management of the Company. He has been instrumental in the exceptional growth of the Company’s sales and marketing. He looks after the overall marketing activities, product development and quality management of the Company.
Mr. C. Mithun Chand Whole Time Director
Mr. Chand is associated with Kaveri Seeds for the past ten years as an Executive Director. He has significantly contributed in sales and marketing of Kaveri Microteck and Kexveg India Private Limited, which are the subsidiaries of the Company. Besides, he looks after the day-to-day activities of administration, finance and accounts departments. Mr. Chand has a wealth of experience in marketing and finance; and advises the management about financial issues of the Company. He envisioned new business platforms and is dedicated towards growing the business with innovations.
Mr. M. Srikanth Reddy Independent Director
Mr. Reddy holds a bachelor’s degree in Science (Agriculture), from Andhra Pradesh Agricultural University. He has vast experience in various agricultural and business fields. He actively participates and advises on various policies and functions of the Company. His contribution to the organisation is invaluable.

28
Value Creation Through Transformation
Dr. Y. L. Nene Independent Director
Dr. Nene is a renowned agriculture scientist and science administrator. He pursued his PhD from the University of Illinois, Urbana, USA. Soon after his return to India,he taught at a College of Agriculture at Pantnagar. He is an outstanding researcher, who published many scientific papers in peer-reviewed journals and guided several students on their PhDs. He is one of the Company’s well-respected and honoured scientist. Dr. Nene has worked as a professor and Head of the Department of Plant Pathology at GB Pant University of Agriculture, Pantnagar. He served as a member of the governing body of ICAR.
Dr. S. Raghuvardhan Reddy Independent Director
Dr. Reddy is a PhD (Agriculture) and Ex-Vice-Chancellor of Acharya N. G. Ranga Agricultural University, with a vast experience in agriculture and research activities. He has won several awards, including the ‘Jawaharlal Nehru Birth Centenary Award’ for his lifetime contribution towards the development of science and technology, especially in agricultural sciences.
Mr. P. Vara Prasad Rao Independent Director
Mr. Rao is a science graduate with over three-and-a-half decades of experience in general management and finance. He is an expert in business transactions and negotiations and advises the Company from time to time.
Annual Report 2016-17
Statutory reports 30-89
Financial statements 90-188
Company overview 01-29
29
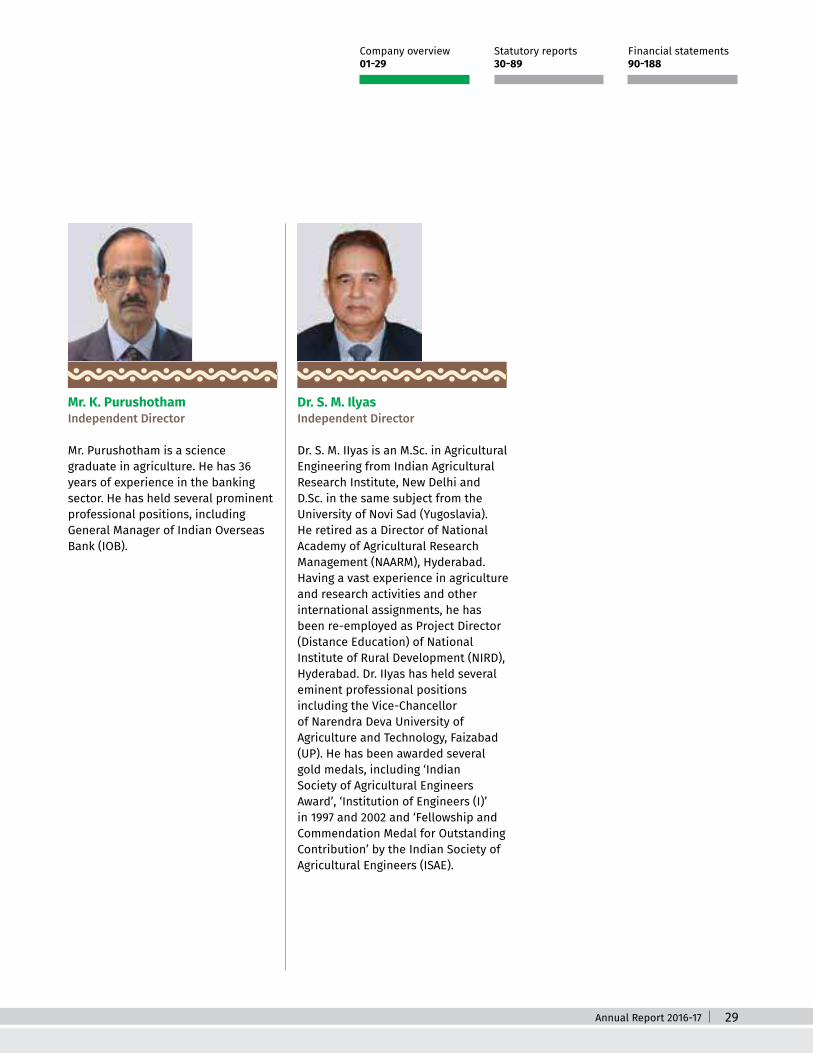
Dr. S. M. Ilyas Independent Director
Dr. S. M. IIyas is an M.Sc. in Agricultural Engineering from Indian Agricultural Research Institute, New Delhi and D.Sc. in the same subject from the University of Novi Sad (Yugoslavia). He retired as a Director of National Academy of Agricultural Research Management (NAARM), Hyderabad. Having a vast experience in agriculture and research activities and other international assignments, he has been re-employed as Project Director (Distance Education) of National Institute of Rural Development (NIRD), Hyderabad. Dr. IIyas has held several eminent professional positions including the Vice-Chancellor of Narendra Deva University of Agriculture and Technology, Faizabad (UP). He has been awarded several gold medals, including ‘Indian Society of Agricultural Engineers Award’, ‘Institution of Engineers (I)’ in 1997 and 2002 and ‘Fellowship and Commendation Medal for Outstanding Contribution’ by the Indian Society of Agricultural Engineers (ISAE).
Mr. K. Purushotham Independent Director
Mr. Purushotham is a science graduate in agriculture. He has 36 years of experience in the banking sector. He has held several prominent professional positions, including General Manager of Indian Overseas Bank (IOB).
30
Value Creation Through Transformation
Five years at a glance
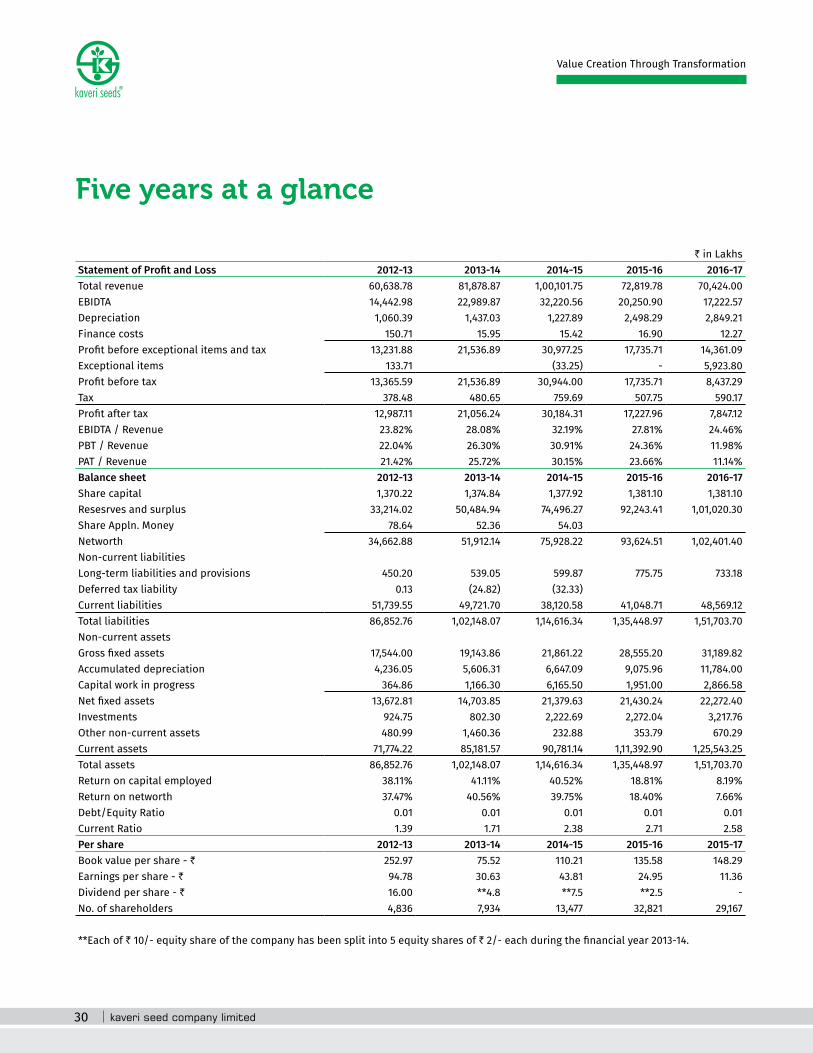
` in LakhsStatement of Profit and Loss 2012-13 2013-14 2014-15 2015-16 2016-17Total revenue 60,638.78 81,878.87 1,00,101.75 72,819.78 70,424.00 EBIDTA 14,442.98 22,989.87 32,220.56 20,250.90 17,222.57 Depreciation 1,060.39 1,437.03 1,227.89 2,498.29 2,849.21 Finance costs 150.71 15.95 15.42 16.90 12.27 Profit before exceptional items and tax 13,231.88 21,536.89 30,977.25 17,735.71 14,361.09 Exceptional items 133.71 (33.25) - 5,923.80 Profit before tax 13,365.59 21,536.89 30,944.00 17,735.71 8,437.29 Tax 378.48 480.65 759.69 507.75 590.17 Profit after tax 12,987.11 21,056.24 30,184.31 17,227.96 7,847.12 EBIDTA / Revenue 23.82% 28.08% 32.19% 27.81% 24.46%PBT / Revenue 22.04% 26.30% 30.91% 24.36% 11.98%PAT / Revenue 21.42% 25.72% 30.15% 23.66% 11.14%Balance sheet 2012-13 2013-14 2014-15 2015-16 2016-17Share capital 1,370.22 1,374.84 1,377.92 1,381.10 1,381.10 Resesrves and surplus 33,214.02 50,484.94 74,496.27 92,243.41 1,01,020.30 Share Appln. Money 78.64 52.36 54.03 Networth 34,662.88 51,912.14 75,928.22 93,624.51 1,02,401.40 Non-current liabilitiesLong-term liabilities and provisions 450.20 539.05 599.87 775.75 733.18Deferred tax liability 0.13 (24.82) (32.33) Current liabilities 51,739.55 49,721.70 38,120.58 41,048.71 48,569.12Total liabilities 86,852.76 1,02,148.07 1,14,616.34 1,35,448.97 1,51,703.70 Non-current assetsGross fixed assets 17,544.00 19,143.86 21,861.22 28,555.20 31,189.82Accumulated depreciation 4,236.05 5,606.31 6,647.09 9,075.96 11,784.00Capital work in progress 364.86 1,166.30 6,165.50 1,951.00 2,866.58Net fixed assets 13,672.81 14,703.85 21,379.63 21,430.24 22,272.40 Investments 924.75 802.30 2,222.69 2,272.04 3,217.76Other non-current assets 480.99 1,460.36 232.88 353.79 670.29Current assets 71,774.22 85,181.57 90,781.14 1,11,392.90 1,25,543.25 Total assets 86,852.76 1,02,148.07 1,14,616.34 1,35,448.97 1,51,703.70 Return on capital employed 38.11% 41.11% 40.52% 18.81% 8.19%Return on networth 37.47% 40.56% 39.75% 18.40% 7.66%Debt/Equity Ratio 0.01 0.01 0.01 0.01 0.01 Current Ratio 1.39 1.71 2.38 2.71 2.58Per share 2012-13 2013-14 2014-15 2015-16 2015-17Book value per share - ` 252.97 75.52 110.21 135.58 148.29 Earnings per share - ` 94.78 30.63 43.81 24.95 11.36Dividend per share - ` 16.00 **4.8 **7.5 **2.5 - No. of shareholders 4,836 7,934 13,477 32,821 29,167
**Each of ` 10/- equity share of the company has been split into 5 equity shares of ` 2/- each during the financial year 2013-14.

Annual Report 2016-17 31
Statutory reports 30-89
Financial statements 90-188
Company overview 01-29
Management Discussion and Analysis
Indian economyIndia’s GDP grew at 7.1% in FY 2016-17, led by growth in private consumption and robust policy initiatives by the Government. The agriculture GDP is expected to grow above trend at 4.1% to ` 1.11 trillion (US$ 1,640 billion), according to Central Statistics Office (CSO).
India’s GDP growth(%)
2013-14 2014-15 2015-16 2016-17 6.9 7.3 7.6 7.1
FY 2016-17 will remain a significant year for India’s economy owing to several bold policy reforms implemented by the Government. The reforms include the creation of Insolvency and Bankruptcy Code (IBC), Monetary Policy Committee (MPC), the incorporation of Goods and Services Tax (GST) Act; redesigning of the Fiscal Responsibility and Budget Management (FRMB) framework and demonetisation.
GST is anticipated to be a significant reform in India, as it will bring greater transparency in India’s indirect tax structure. Due to demonetisation and non-availability of cash, farmers failed to purchase hybrid seeds in required quantity from the market and used farm saved seeds. Despite causing some temporary hardship, the demonetisation of high denomination notes is expected to yield long-term benefits for the country. It would bring formalisation and digitalisation of the economy.
Moreover,several other reforms announced by the government is set to increase the consumer demand across India. Factors like higher agricultural credit, increased allocation for irrigation projects, power projects, minor irrigation schemes, crop insurance schemes and enhanced allocations for MGNREGA in the Union Budget will help to augment rural income. Moreover, implementation of the Seventh Pay Commission will further increase consumer demand across semi-urban and rural India.
India is expected to grow sustainably in days to come, owing to macroeconomic stability, increase in domestic demand, a growing consumption and consistent government impetus towards reforms.
Particularly, rural India is undergoing a rapid transformation. Consumption patterns are experiencing a change, which is facilitated by improved networking. People in rural India are seeking information proactively from multiple conventional and digital sources.
Sector-wise GDP growth
Sectors 2014-15 2015-16 2016-17Agriculture and food management
1.1 1.1 4.1
Industry 5.9 7.4 5.2Services 9.1 8.9 8.8
Source: CSO
Agricultural Sector of IndiaThe agricultural sector plays a critical role in India’s economy. Over 58% of rural households depend on agriculture as their principal means of livelihood. India holds the 2nd largest agricultural land in the world with 157.35 million hectares under cultivation. In FY 2016-17, total food grain production in India was recorded at 273.83 million tonnes, which increased from 253.16 million tonnes in FY 2015-16. India is the largest producer of cotton, spices, pulses, milk, tea, cashew and jute; and the 2nd largest producer of wheat, rice, sugarcane, oilseeds, fruits and vegetables.
Production of food grains in Kharif and Rabi season (million tonnes)
FY08
147.5
1
125.
09
126.
31129
132131
121
104
118
121
134.
47
126.
47
126.
38
128
124
128
124
114
116
110
FY09 FY10 FY11 FY12
Rabi Kharif
FY13 FY14 FY15 FY16 FY171
Source: Finance Ministry, Ministry of Agriculture, Tech.Sci. Research 1 - Data is 2nd Advance Estimate

32
Value Creation Through Transformation
Agricultural sector - Union Budget 2017-18The Union Budget 2017-18 provided impetus to agricultural reforms by increasing funding for crop insurance and rising farm credits. The moves were aimed to tackle distress in rural India. The Budget further urged the National Bank for Agriculture and Rural Development (NABARD), the apex rural bank, to implement schemes to improve access to irrigation and develop the dairy sector. The Government further stressed on working closely with states to delist perishables, such as vegetables and fruits from Agriculture Produce Marketing Committees. This will enable farmers to sell their produce directly to consumers to get a better price. The significant announcements made in the Union Budget for agricultural sector, include:
• Allocation of ` 187,223 crore, which is 24% higher than last year
• Target for agriculture credit to be fixed at 10 lakh crore
• Extension of tenure of loans under Credit Linked Subsidy Scheme of the Pradhan Mantri Awas Yojana from 15 to 20 years
• Issuance of soil health cards and establishing mini-labs in Krishi Vigyan Kendras
• Increase funding for Pradhan Mantri Fasal Bima Yojana to USD1.96 billion (Source:IBEF)
• Invest ` 5,000 crore in micro irrigation fund for village water provisions for farming
• Establish dairy processing infrastructure fund under NABARD, with fund of ` 8,000 crore
Key drivers of agricultural growthExponential demandThe vast population of India serves as a key driver of demand for agricultural products in the country. Additionally, the rising levels of income among the urban and rural population have further aided the demand growth. Also, the export demand for the country’s agricultural produce is growing, especially in other emerging markets.
Widening opportunitiesIn recent years, there has been a steady rise in demand for agricultural inputs, such as hybrid seeds and fertilisers. Besides, the Government is expanding the potential storage capacity of agricultural produce under its 12th Five Year Plan.
Policy support• Agricultural Technology Management Agency (ATMA):
This technique facilitates retrieval of data and data entry from the internet-based web portals, without actually having internet by using a simple mobile phone. More than a dozen services of innovative technology like USSD are being operationalised for farmers and other stakeholders.
• Pradhan Mantri Krishi Sinchayee Yojana (PMKSY): Under the scheme, allocation of USD7.64 billion has been made for investment in irrigation, expanding cultivable area, improve efficiency of on-farm water to reduce wastage, and enhance adoption of precision irrigation, among others. Most of the state Governments are funding agriculture sector and taking appropriate measures to achieve the targeted growth rate and address the issues being faced by farmers.
• Pradhan Mantri Fasal Bima Yojana (PMFBY): In 2016, Central Government launched PM Mantri Fasal Bima Yojana for providing financial support to farmers and cover their crop losses. PMFBY is a crop insurance policy scheme, covering commercial crops as well as annual horticultural crops.
• Paramparagat Krishi Vikas Yojana (PKVY): This scheme ensures the promotion of organic farming. Adoption of farming will promote the balanced use of chemical fertilisers and enhance the quality of farm produce.
OutlookIndia’s agricultural sector is likely to gain better momentum in the coming days, owing to further investments in agricultural infrastructure such as irrigation facilities, warehousing and cold storages. Further, the enhanced usage of genetically modified crops will significantly improve the yields.
Seed industry insightSeed is a medium to deliver improved technologies to farms. Cost-effectively, seed integrates production, protection and quality enhancement technologies in a single entity. At present, the global seed market is estimated to be around US$ 43 billion and is expected to grow to ~ US$ 92 billion by 2020. In India, with the rising preference for branded seeds among farmers, the seed industry is growing. Today, farmers prefer branded seeds that enhance yield and are resilient to harsh climates and diseases, instead of relying on seeds saved from the previous harvest. Moreover, the commercialisation of genetically modified (GM) cotton

Annual Report 2016-17 33
Statutory reports 30-89
Financial statements 90-188
Company overview 01-29
changed the scenario of the India’s seed industry. According to ICRA, the Indian seed industry is the sixth largest in the world, accounting for about 4.5% of global industry preceded by the US (27%), China (22%), France (6%), Brazil (6%) and Canada (4.8%). Despite being one of the largest seed markets, India’s seed exports continue to remain low. India imports seeds of field and vegetable crops worth approximately US$23 million and US$52 million, respectively. However, the industry is predicted to grow twice the average of the world’s seed industry, going forward.
India’s agriculture sector has the largest share of a country’s total land area and it is far more than the US or China. Yet India’s global agricultural output is significantly low in terms of food grains and oilseeds, compared to USA and China, and trails behind China in terms of fruits and vegetables production. The reasons for lower productivity include low usage of high-quality seeds; inadequate and unbalanced use of fertilisers; low usage of plant protection chemicals; lower farm mechanisation; small holders, fragmented cultivation, resource poor farmers, weak credit facilities; market linkages and a shortage of water. Over the last four decades, enhanced seeds have played a crucial role in supporting India’s agricultural growth, with productivity gains and the expansion of the domestic seed industry moving in tandem.
There is a paramount importance of improved quality seeds in the livelihood of millions of farming families, the quality in terms of yield and consistency in performance.
Strength of Indian Seed SectorIndia has varied climatic conditions including tropical, sub-tropical and temperate climates, wherein all kinds of crops can be grown. This has allowed India’s seed industry to flourish. All India Coordinated Research Projects (AICRPs) has so far released 8187 varieties and hybrids of different crops. India is also rich in Plant Genetic Resources (PGR) in all crop species, which could be used for crop development. India has a well-established seed regulation legislative framework, and a research base with a network of public and private stakeholders. India has several private seed companies with good quality research and development facilities. In addition, the country has 14 dedicated state seed corporations and a National Seed Corporation (NSC) promoted by the Government. For quality assurance, there exists fairly a good network of seed certification agencies and 126 seed testing laboratories that support a robust Quality Certification System. Certification centres are present in both public and private sectors, which will help quality control for the supply of quality seed for domestic and export of seeds.
Entry BarriersEntry into India’s seed industry can be quite challenging with quite a few obstructions. High investments in R&D are required in the industry, where the average lead time taken from R&D to commercial introduction of products is seven to eight years. Developing an effective hybrid involves a complicated procedure and various high-value skills are required to choose the right kind of lines. Also, a diverse portfolio of seeds requires a wide distribution network across India to reach various markets in the country. Further, any new entrant to the market must first establish its credibility with farmers because farmers will not risk their years of income on un-established company seeds.
OutlookGoing forward, India’s seed industry is projected to grow robustly. The growth of modern retail channels with the foraying of prominent national and multinational brands is likely to support the market growth. Additionally, growing demand due to increased subsidies and renewed government focus on the use of high yielding varieties is also expected to provide impetus to the overall seed market in India. Improvement in seed replacement rate (SRR) and farmers opting for hybrid seeds are further expected to fuel the growth. The demand for crops is rising, whereas the area of arable land available in the country remains limited; thus, quality seeds have become an essential component to increase the agricultural production and productivity.
World of Kaveri SeedsKaveri Seed Company Ltd. is one of the fastest-growing and premier seed companies in the country. Kaveri Seed was started in 1976, after Sri G. V. Bhaskar Rao, an agriculture graduate, ventured into the seed business. Today, it has grown to be India’s largest seed company. The Company is backed by a strong research and development base for developing quality hybrids in key Indian crops. It has a huge network of over 15,000 distributors and dealers spread across the country with a strong product line of hybrids. Kaveri has a comprehensive portfolio of high yield hybrid and varietal seeds. The Company’s presence in a broad spectrum of crops helps to meet different requirements of farmers, which has earned it a tremendous goodwill.
Core strengthsPowered by Research and Development (R&D)Seed business requires continuous product development. Thus, Kaveri’s R&D is critical for the success of the Company. Over the years, Kaveri has systematically built its robust R&D programme and now has an organised R&D system, dedicated research farms and technically competent personnel.

34
Value Creation Through Transformation
Focused on market and Pan-India operationsKaveri is focused on its end-user, the farmer. The Company takes a need-based approach to reach farmers directly with its field force and indirectly through its channel partners. Over the years, Kaveri has strengthened its relationship with farmers by offering them cutting-edge products and imparting agronomic knowledge to them so that they can increase their income. The Company’s dedicated network of loyal channel partners help it to tap unreached markets. It has a strong presence in Telangana, Andhra Pradesh, Karnataka, Maharashtra and Tamil Nadu.
Dedicated network of grower farmers• Large production area across India with a loyal seed
growers network
• 33,000 production growers across multiple agro-climatic zones
• Over 50,000 acres of land under seed production.
• High credibility with the farmers (about 70 % year-on-year grower retention).
State-of-the-art storage facilities, among the largest capacities• Seven state-of-the-art plants across major locations
in India with a total average throughput of 100 MT per hour
• Seamless equipment for grading, pre-cleaning, cob drying, storage and packing
• Maize cob drying facility with a capacity of 2,900 MT per cycle of drying
• Dehumidified, climate-controlled cold storage facilities with a long-term capacity storage for about 12,000 tons
• 6,00,000 sq.ft of cumulative warehouse space at multiple strategic locations across India
Growth opportunitiesSurging demandWith a rise in world population, agricultural produce needs to grow proportionately to feed its teeming millions. This will lead to higher demand for agricultural raw materials. An increase in disposable income will enhance the demand for better quality food like protein, fruits and vegetables. According to United Nations Food and Agriculture Organisation, food production needs to be increased by 70%
by 2050 to meet the demands of 9 billion and growing world population.
Seed Replacement Rate (SRR)Seed Replacement Rate is the percentage of area sown out of total area of crop planted in the season using certified or quality seeds as against the farm saved seed. There is a need for higher SRR because the quality of farm-saved seed deteriorates in successive generations. Hybrid seed, however, has to be replaced every year, on the other hand, varieties/Open Pollinated Varieties every three to four years. In India, SRR has sufficient ground for improvement. Today, farmers and vegetable producers are using branded seed because of its proven efficiency and higher yields over farm saved. Moreover, there is a growing prominence of producing more, while using fewer inputs in India
Widespread geographyKaveri Seeds is continuously expanding its geographical presence beyond India and it has targeted Asia-Pacific region and Africa as places where it can gain a significant traction.
Prospects for increased cotton market shareJaadoo, the Company’s exclusive variety of cotton is performing relatively much better than its competitors. On the other hand, the ATM hybrid is gaining popularity in Maharashtra and Gujarat.
CropsRice: In India, rice is the staple food for a large population and occupies the largest area under any crop. Traditionally, farmers use their own seed for planting, but there is a rapid shift towards using packed seeds. The farming community is moving to hybrid seeds in some markets and upgrading to packed selection variety seeds in other markets, which are made available by private players. The Government’s initiatives to promote the usage of hybrids and effort by industry to educate farmers on the benefit of hybrid paddy have helped to enhance the usage of hybrid rice. Currently, paddy hybrid products available in the market do not address the needs of all the markets. The market for selection variety rice is growing rapidly. Kaveri Seeds is addressing both segments of paddy market and it has an extensive portfolio of products in hybrid rice and selection rice to take advantage of this opportunity. The Company commercially released rice hybrid –KPH 468 in Medium early segment.
While two rice hybrids -KPH 272, first aerobic hybrid and KPH 467 in medium duration segment were released and notified under Central Variety Release Committee Government of India (CVRC-GOI).

Annual Report 2016-17 35
Statutory reports 30-89
Financial statements 90-188
Company overview 01-29
Kaveri possesses a wide range of products in selection rice. Shireen, a fine grain premium rice was commercially released. Other promising rice variants in the pipeline include Coastal King, Elito, Glory and Tino.
Maize: Maize in India is emerging as one of the important crops due to its increasing trend in area, production and productivity in recent years. Kaveri Seed Company is focusing on important aspects of maize improvement namely germplasm characterisation, diversification and enhancement; development of new hybrids of different maturity to suit varied agro-climatic conditions of the country. Genetic improvement of maize germplasm continued to be the primary focus of the maize research at Kaveri Seeds. The crop improvement programme mainly focused on germplasm acquisition and characterisation; germplasm development for resistance to various biotic and abiotic stresses; enhancement of quality traits; and development of new hybrids of different maturity to suit varied agro-climatic conditions of the country. Induction of new germplasm is one of the important processes to diversify the existing germplasm base to support the inbred-hybrid development programme of maize continuously.
Kaveri is able to design, develop and deliver specific hybrids of maize to suit different climatic conditions of India. This helped Kaveri significantly increase sales of hybrid maize seeds.
In kharif 2016, four hybrids were identified namely, KMH 1311, KMH 463, KMH 3981 and KMH 5332. The Company decided to commercially launch KMH 1311 in Bihar. Moreover, KMH 1411 was identified in varietal identification committee (VIC).
Bajra: Bajra remains an attractive segment in the market. Owing to concerted research efforts, the Company could launch three commercial hybrids -- Maximo, KBH 6080 and KBH 3580 (Singham). These new hybrids are expected to contribute to significant growth in the future.
Sunflower: In sunflower, the area of production and productivity is on a declining trend due to various reasons. Though the Company developed certain promising hybrids, the market of sunflower is not so attractive. It was decided to redeploy Sunflower research resource to other crops.
Vegetables: The building blocks for vegetables business were established in the year. Resourcing in R&D, supply
chain and marketing was increased to address this new growth segment.
Cotton: In certain states, governments had advised farmers to grow other crops, rather than cotton in FY 2016-17. Hence, farmers switched to alternative crops. Thus, the area under cotton cultivation drastically declined in few states, thereby affecting sales of cotton seeds. BG II conversion is progress in the elite lines. Kaveri diversified its cotton portfolio to meet the demand according to different zones. Jadoo and ATM variants of cotton are still contributing large part of revenue to the Company but the effort is being made to introduce new products in Cotton.
Molecular breeding: Smart breeding or marker assisted selection (MAS) or marker assisted breeding (MAB) is done by using genetic markers that are linked to the desired trait(s). Because of the speed and accuracy of MAS, smart breeding can dramatically fast-track conventional breeding efforts. Resistance breeding by MAS is highly efficient and precise, compared to conventional approaches. It not only offers the opportunity to speed up variety development, but also provides a unique method for pyramiding (or combining traits) and thus to achieve durable resistance to both diseases and pest. MAS is seen as having potential to facilitate the development of crops tolerant to biotic and abiotic stresses. The Company is progressing in this direction, to incorporate the resistant genes for BLB, BLAST, and BPH diseases through MAS approach in rice. Introgression of Bt genes (Cry Ac, Cry Ab) in cotton is being done using conjunct use of biotech and conventional breeding approaches. It is also used for assessing genetic diversity of germplasm for the development of commercial hybrids through molecular marker applications. We are incorporating desired genes for grain yield and drought tolerance using marker-assisted recurrent selection (MARS). Further we are tagging genes/QTL for resistance to post-flowering stalk rot disease complex in maize.
Risk ManagementProductionEver changing climatic conditions -- continuous dry spell, high temperature, erratic rainfall, and excess rainfall -- can impact the Company’s commercial seed production.
Mitigation: To mitigate this risk, the Company grows its seeds in multiple locations and try to select favourable seed production areas to achieve targeted seed.
36
Value Creation Through Transformation
ClimateChange in rainfall patterns urge farmers to move from one crop to another to suit growing conditions.
Mitigation: This risk is mitigated by Kaveri’s diverse crop portfolio and having robust products, which can withstand under harsh weather conditions to a greater extent.
CompetitionCompetition from business peers can impact the Company’s trade.
Mitigation: The Company heavily invests in R&D for cutting-edge products, supply chain capability, and aggressive marketing, which helps it to be one step ahead of the competition.
DependencyReliance on a particular product may affect the Company’s growth prospects.
Mitigation: The Company’s wide array of products minimises its dependence on any single hybrid or crop. Besides, the Company is expanding its product portfolio by phasing out old products time to time and rapidly introducing promising products.
Product life cycleIncreased product innovation and development through technology advances impact the life of a product.
Mitigation: The Company monitors and seeks regular feedback on product performance and replaces products on regular basis to manage product life cycle.
OutlookAfter sluggish growth of agricultural production due to consecutive weak monsoon, optimism returned in FY 2016-17 with a good monsoon. This led to strong recovery for the overall agri-input space. According to India Meteorological Department (IMD), the kharif season is likely to receive normal or above normal level rainfall in FY 2017-18. Historically, improved monsoons drive higher demand for premium seeds. There is likely to be an increase in demand for food and agricultural products.. The Central Government’s regulation of seed prices reduces uncertainty and improves business viability for all seed companies. From the perspective of Kaveri, FY 2017-18 is expected to
post robust growth. The Company expects to capture a higher market share driven by its diverse portfolio, well-established national footprint and availability of adequate quantity of seeds, despite difficult growing conditions in the previous year.
The Company is reinforcing its sales effort in Cotton by engaging in field promotion activities to retain share in markets of Andhra Pradesh, Telangana and Karnataka. It expects to gain further market share in Maharashtra and Gujarat. Simultaneously, the Company is focused on strengthening its network beyond South and Central India, to northern, eastern and western geographies. The Company expects strong momentum in markets of Chhattisgarh, Jharkhand, West Bengal and Odisha will help it to set its foothold in these markets. Rising demand for Maize and higher seed penetration of hybrid paddy remain the key drivers for Kaveri. The Company has developed a sizeable and well-diversified farmer-centric portfolio, which has been progressively gaining prominence in the marketplace and has served us well against crop shifts. In the next three to five years, Kaveri expects to introduce new products in cotton, maize, pearl millet, paddy and vegetables. Going forward, it is developing farmer-centric product pipeline for future to suit under different segments of Indian situations.
Human ResourcesKaveri consistently focuses on bringing talent on-board. The Company provides its people with relevant training to drive its long-term growth. The Company trains employees on several developmental programmes to enhance their managerial and behavioural skills. The Company is strengthening employee involvement through communication meetings.
The Company organises regular training programmes for its field staffs to impart them knowledge on crop production, quality control, agronomy, and plant protection, among others. New employees go through formal induction programme and given interactive sessions with their line managers. Besides, specialised training programmes are conducted for R&D and marketing staff, as well as other departments. The Company has introduced a reward programme to recognise top performers from various departments.
The leadership team of the Company has wealth of experience in seed and crop production industry. It has a team of more than 50 dedicated scientists comprising breeders, agronomists, biotechnologists and seed technologists, along
Annual Report 2016-17 37
Statutory reports 30-89
Financial statements 90-188
Company overview 01-29
with dynamic sales and marketing professionals. Currently, the workforce includes over 793 members, who are driving the levers of growth.
Indian Accounting Standards – IFRS Converge StandardsThe Ministry of Corporate Affairs vide its notification dated 16th February 2015 notified the Companies (Indian Accounting Standards) Rules, 2015. In pursuance of the said notification, the Company adopted Indian Accounting Standards with effect from 1st April 2016 with the comparatives for the period ending 31st March 2016. The implementation of Indian Accounting Standards (IAS) was a significant change for which the Company set up a dedicated team and provided desired resources for its completion within the time frame.
Internal Control Systems and Their AdequacyThe Company has laid down set of standards which enables to implement internal financial control across the organisation and ensure that the same are adequate and operating effectively. The Audit Committee of the Board of Directors actively reviews the adequacy and effectiveness of the internal control systems and suggests improvements to strengthen the same. The Audit Committee of the Board of Directors, Statutory Auditors and Finance Heads are periodically apprised of the internal audit findings and corrective actions taken. Audit plays a key role in providing assurance to the Board of Directors. Significant audit observations and corrective actions taken by the management are presented to the Audit Committee of the Board. To maintain its objectivity and independence, the internal Audit function reports to the Chairman of the Audit Committee.
Internal Financial ControlsThe internal financial controls (IFC) framework at Kaveri Seeds encompasses internal controls over financial reporting (ICOFR) as well as operational controls that have been put in place across all key business processes of the Company. The internal controls are designed to facilitate and support the achievement of the Company’s business objectives and such controls do enable the Company to adapt to changing and operating environment, to mitigate risks to acceptable levels and to support sound decision making and good governance. Details in respect of adequacy of internal financial controls with reference to the financial statements are briefly iterated below:
a. The Company maintains all its major records in ERP System.
b. The Company has appointed internal auditors to examine the internal controls, whether the workflow of the organisation is being done through the approved policies of the Company. In every quarter, during the approval of financial statements, internal auditors present the internal audit report and the management comments on the internal audit observations; and
c. The Board of Directors of the Company has adopted various policies such as related party transactions policy, whistle blower policy, policy to determine material subsidiaries and such other procedures for ensuring the orderly and efficient conduct of its business for safeguarding of its assets, the prevention and detection of frauds and errors, the accuracy and completeness of the accounting records, and the timely preparation of reliable financial information.

38
Value Creation Through Transformation
NOTICENotice is hereby given that the 30th Annual General Meeting of the members of Kaveri Seed Company Limited will be held on Monday the 25th day of September 2017 at 12.15 PM at FTAPCCI Auditorium, Federation of Telangana and Andhra Pradesh Chambers of Commerce and Industry, Federation House, 11-6-841, FTAPCCI Marg, Red Hills, Hyderabad – 500 004, Telangana, to transact the following business:
ORDINARY BUSINESS:
1. To receive, consider and adopt the Audited Standalone & Consolidated Balance Sheet as at 31st March 2017, Statement of Profit & Loss and Cash Flow Statement for the year ended on 31st March 2017 along with the reports of the Directors and Auditors thereon.
2. To appoint a Director in place of Mr. C.Vamsheedhar (DIN :01458939) who retires by rotation in terms of Section 152(6) of the Companies Act, 2013 and being eligible offers himself for reappointment.
3. To appoint Statutory Auditors of the Company and fix their remuneration and in this regard to consider and if thought fit, to pass with or without modification(s), the following resolution as an Ordinary Resolution:
“RESOLVED THAT pursuant to the provisions of Section 139 & 142 and other applicable provisions of the Companies Act, 2013 if any, read with the Companies (Audit & Auditors) Rules, 2014, including any statutory enactment or modification thereof, and based on the recommendations of the Audit Committee, M/s. M. Bhaskar Rao & Co., Chartered Accountants (ICAI Firm Registration No. 000459S) be and are hereby appointed as Statutory Auditors of the Company in place of M/s. P.R.Reddy & Co., Chartered Accountants (Firm Registration No.0003268S) the retiring Auditors , to hold office from the conclusion of this 30th Annual General Meeting until the conclusion of 35th Annual General Meeting of the Company, subject to ratification as to the said appointment at every Annual General Meeting, at such remuneration as may be decided by the Board of Directors of the Company.
By Order of the Board of Directors For KAVERI SEED COMPANY LIMITED Sd/-Date: 24.05.2017 G V BHASKAR RAOSecunderabad MANAGING DIRECTOR
NOTES:
1. A MEMBER ENTITLED TO ATTEND AND VOTE AT THE MEETING IS ENTITLED TO APPOINT A PROXY/ PROXIES TO ATTEND AND VOTE ON A POLL INSTEAD OF HIMSELF/ HERSELF AND SUCH A PROXY/PROXIES NEED NOT BE A MEMBER OF THE COMPANY.
A person can act as proxy on behalf of Members not exceeding fifty (50) and holding in the aggregate not more than ten percent of the total share capital of the Company. In case a proxy is proposed to be appointed by a Member holding more than ten percent of the total share capital of the Company carrying voting rights, then such proxy shall not act as a proxy for any other person or shareholder. A proxy form is sent herewith. Proxies submitted on behalf of the Companies, Societies, etc., must be supported by an appropriate resolution/authority as applicable. In order to become valid, the proxy forms should be deposited at the Registered Office of the Company not less than 48 hours before the commencement of the meeting.
2. The Register of Members and Share Transfer Books of the Company will remain closed from 23rd September 2017 to 25th September 2017 (both days inclusive).
3. Shareholders who have not claimed their dividend for the years 2009-10 are requested to claim before the due date otherwise the same has been transfer to the Investor Education and Protection Fund Pursuant to Section 124 and 125 of the Companies Act, 2013. The Company has uploaded the details of the unpaid and unclaimed dividend amounts of the previous years’ on the website of the Company (www.kaveriseeds.in) and also on the website of Ministry of Corporate Affairs. The unpaid/unclaimed dividend for the year 2009-10 will be transferred to the Investor Education and Protection Fund of the Central Government on the due date. The shares on which dividend remains unclaimed for seven consecutive years will be transferred to the IEPF as per Section 124(6) of the Companies Act, 2013, and the applicable rules.
4. The annual report for the financial year 2016-17 has been sent through email to those members who have opted to receive electronic communication or who have registered their email addresses with the Company/depository participants. The annual report is also available on our website, i.e. www.kaveriseeds.in The physical copy of the annual report has been sent to those members who have either opted for the same
Annual Report 2016-17 39
Statutory reports 30-89
Financial statements 90-188
Company overview 01-29
or have not registered their email addresses with the Company/depository participant. The members will be entitled to a physical copy of the annual report for the financial year 2016-17, free of cost, upon sending a request to the Company Secretary at 513-B, 5th Floor, Minerva Complex, S.D. Road, Secunderabad – 500 003.
5. The company is concerned about the environment and utilizes natural resources in a sustainable way. We request you to update your email address with your Depository Participant to enable us to send you the financials and other communication via email.
6. Members are requested to kindly bring their copy of the Annual Report with them at the Annual General Meeting, as no extra copy of Annual Report would be made available at the Annual General Meeting. Members/proxies should also bring the attached Attendance Slip, duly filled and hand it over at the entrance to the venue.
7. Members are requested to intimate immediately, any change in their address or bank mandates to their depository participants with whom they are maintaining their demat accounts or to the Company’s Registrar & Share Transfer Agent, M/s. Bigshare Services Private Limited, if the shares are held by them in certificate form.
8. In terms of the Circular No. CIR/MRD/DP/10/2013 dated 21 March 2013 issued by the Securities and Exchange Board of India, listed companies are required to use the Reserve Bank of India’s approved electronic mode of payment such as Electronic Clearance Service (ECS), LECS (Local ECS)/RECS (Regional ECS)/NECS (National ECS), NEFT, etc. for making cash payments like dividend etc., to the members. Accordingly, members holding securities in demat mode are requested to update their bank details with their depository participants. Members holding securities in physical form may send a request updating their bank details, to the Company Secretary at 513-B, 5th Floor, Minerva Complex, S.D. Road, Secunderabad – 500 003.
9. The Register of Directors and Key Managerial Personnel and their shareholding, maintained under Section 170 of the Companies Act, 2013 and the Register of Contracts or Arrangements in which directors are interested, maintained under Section 189 of the Companies Act, 2013, will be available for inspection by the members at the AGM.
10. Brief resume of Director(s) of those proposed to be re-appointed, nature of their expertise in specific functional areas, names of companies in which they hold directorships and membership/chairmanships of Board Committees and shareholding in the Company as stipulated under Securities and Exchange Board of India (Listing Obligations and Disclosure Requirements) Regulations, 2015 with the stock Exchanges, are provided in the Corporate Governance Report forming part of the Annual Report.
11. Pursuant to Section 108 of the Companies Act, 2013 and the rules framed there under and Regulation 44 of the SEBI (Listing Obligations and Disclosure Requirements) Regulations 2015, the Company is provided the facility to its members holding shares in physical or dematerialized form as on the cut-off date, i.e., 18th September 2017, to exercise their right to vote by electronic means on any or all of the agenda items specified in the accompanying Notice of Annual General Meeting. The E-voting period commences on Friday the 22nd day of September 2017 at 9.00 A.M. and ends on Sunday the 24th day of September 2017 at 5.00 P.M. The detailed instructions for E-voting are given as a separate attachment to this notice.
12. The route map showing directions to reach the venue of the 30th AGM is available on the reverse of the attendance slip.
By Order of the Board of Directors For KAVERI SEED COMPANY LIMITED Sd/-24.05.2017 G V BHASKAR RAOSecunderabad MANAGING DIRECTOR

40
Value Creation Through Transformation
SHAREHOLDER INSTRUCTIONS FOR E-VOTINGPursuant to provisions of Section 108 of the Companies Act, 2013, Rule 20 of the Companies (Management and Administration) Rules, 2014 as amended by the Companies (Management and Administration) Rules, 2015 and Regulation 44 of SEBI (LODR) Regulations 2015, the Company is pleased to offer e-voting facility to the members to cast their votes electronically on all resolutions set forth in the Notice convening the 30th Annual General Meeting to be held on 25th September, 2017. The Company has engaged the services of Central Depository Services Limited (CDSL) to provide the E-Voting facility.
The E-Voting facility is available at the link : EVEN (E-VOTING, EVENT NUMBER)
COMMENCEMENT OF E-VOTING END OF E-VOTING
170819050 22.09.2017 24.09.2017
These details and instructions form an integral part of the notice for the Annual General Meeting to be held on 25th September 2017.
The instructions for shareholders voting electronically are as under:
(i) The voting period begins from Friday the 22nd day of September 2017 at 9.00 A.M. and ends on Sunday the 24th day of September 2017 at 5.00 P.M. During this period shareholders’ of the Company, holding shares either in physical form or in dematerialized form, as on the cut-off date 18.09.2017, may cast their vote electronically. The e-voting module shall be disabled by CDSL for voting thereafter.
(ii) The shareholders should log on to the e-voting website www.evotingindia.com.
(iii) Click on Shareholders.
(iv) Now Enter your User ID
a. For CDSL: 16 digits beneficiary ID,
b. For NSDL: 8 Character DP ID followed by 8 Digits Client ID,
c. Members holding shares in Physical Form should enter Folio Number registered with the Company.
(v) Next enter the Image Verification as displayed and Click on Login.
(vi) If you are holding shares in demat form and had logged on to www.evotingindia.com and voted on an earlier voting of any company, then your existing password is to be used.
(vii) If you are a first time user follow the steps given below:
For Members holding shares in Demat Form and Physical Form
PAN Enter your 10 digit alpha-numeric *PAN issued by Income Tax Department (Applicable for both demat shareholders as well as physical shareholders)• Members who have not updated their PAN with the
Company/Depository Participant are requested to use the first two letters of their name and the 8 digits of the folio/client id number in the PAN field.
• In case the folio number is less than 8 digits enter the applicable number of 0’s before the number after the first two characters of the name in CAPITAL letters. Eg. If your name is Ramesh Kumar with folio number 1 then enter RA00000001 in the PAN field.
Dividend Bank DetailsOR Date of Birth (DOB)
Enter the Dividend Bank Details or Date of Birth (in dd/mm/yyyy format) as recorded in your demat account or in the company records in order to login.• If both the details are not recorded with the
depository or company please enter the member id / folio number in the Dividend Bank details field as mentioned in instruction (iv).
(viii) After entering these details appropriately, click on “SUBMIT” tab.
(ix) Members holding shares in physical form will then directly reach the Company selection screen. However, members holding shares in demat form will now reach ‘Password Creation’ menu wherein they are required to mandatorily enter their login password in the new password field. Kindly note that this password is to be also used by the demat holders for voting for resolutions of any other company on which they are eligible to vote, provided that company opts for e-voting through CDSL platform. It is strongly recommended not to share your password with any other person and take utmost care to keep your password confidential.
(x) For Members holding shares in physical form, the details can be used only for e-voting on the resolutions contained in this Notice.
Annual Report 2016-17 41
Statutory reports 30-89
Financial statements 90-188
Company overview 01-29
(xi) Click on the EVSN for the relevant <Kaveri Seed Company Limited > on which you choose to vote.
(xii) On the voting page, you will see “RESOLUTION DESCRIPTION” and against the same the option “YES/NO” for voting. Select the option YES or NO as desired. The option YES implies that you assent to the Resolution and option NO implies that you dissent to the Resolution.
(xiii) Click on the “RESOLUTIONS FILE LINK” if you wish to view the entire Resolution details.
(xiv) After selecting the resolution you have decided to vote on, click on “SUBMIT”. A confirmation box will be displayed. If you wish to confirm your vote, click on “OK”, else to change your vote, click on “CANCEL” and accordingly modify your vote.
(xv) Once you “CONFIRM” your vote on the resolution, you will not be allowed to modify your vote.
(xvi) You can also take out print of the voting done by you by clicking on “Click here to print” option on the Voting page.
(xvii) If Demat account holder has forgotten the same password then enter the User ID and the image verification code and click on Forgot Password & enter the details as prompted by the system.
(xviii) Shareholders can also cast their vote using CDSL’s mobile app m-Voting available for android based mobiles. The m-Voting app can be downloaded from Google Play Store. Please follow the instructions as prompted by the mobile app while voting on your mobile.
(xix) Note for Non – Individual Shareholders and Custodians • Non-Individual shareholders (i.e. other than
Individuals, HUF, NRI etc.) and Custodian are required to log on to www.evotingindia.com and register themselves as Corporate.
• A scanned copy of the Registration Form bearing the stamp and sign of the entity should be emailed to [email protected].
• After receiving the login details they have to create a compliance user should be created using the admin login and password. The Compliance user would be able to link the account(s) for which they wish to vote on.
• The list of accounts should be mailed to [email protected] and on approval of the accounts they would be able to cast their vote.
• A scanned copy of the Board Resolution and Power of Attorney (POA) which they have issued in favour of the Custodian, if any, should be uploaded in PDF format in the system for the scrutinizer to verify the same.
(xx) In case you have any queries or issues regarding e-voting, you may refer the Frequently Asked Questions (“FAQs”) and e-voting manual available at www.evotingindia.com under help section or write an email to [email protected].
(xxi) You are advised to cast your vote only through E-voting or through Poll at the AGM. In case you cast your votes through both the modes, votes cast through e-voting shall only be considered and votes cast at the meeting through Poll would be rejected.
(xxii) GENERAL INSTRUCTIONS a. The e-voting period commences on Friday the
22nd day of September 2017 at 9.00 A.M. and ends on Sunday the 24th day of September 2017 at 5.00 P.M. During this period, shareholders of the Company holding shares either in physical form or in dematerialized form, as on the cut-off date of 18.09.2017, may cast their votes electronically. The E-Voting module shall be disabled by CDSL for voting thereafter. Once the vote on a resolution is cast by the shareholder, the shareholder shall not be allowed to change it subsequently.
b. Shareholders of the Company, holding shares either in physical form or in dematerialized form, as on the cut-off date 18.09.2017 they not casting their vote electronically, may only cast their vote at the Annual General Meeting.

42
Value Creation Through Transformation
c. Mr. L.Dhanamjai Reddy, Practicing Company Secretary, Hyderabad (Membership No.13104), has been appointed as the Scrutinizer to scrutinize the E-Voting process in a fair and transparent manner.
d. The Scrutinizer shall, within a period of not exceeding three days from the conclusion of the E-Voting period, unlock the votes in the presence of at least two witnesses, not in employment of the Company and make a Scrutinizer’s Report of the votes cast in favour of or against, if any, forthwith to the Chairman of the Company.
e. The voting rights of the shareholders shall be in proportion to the shares held by them, of the paid-up equity share capital of the company as on the cut-off date of 18.09.2017.
f. The results declared along with the Scrutinizer’s Report shall be placed on the Company’s website www.kaveriseeds.in and on the website of CDSL
within two days of passing of the resolutions at the 30th Annual General Meeting of the Company on 25th September 2017 and shall be communicated to BSE Ltd., and National Stock Exchange of India Ltd.
All documents referred to in the accompanying Notice and Statement pursuant to Schedule IV and Section 102(1) of the Companies Act 2013 will be available for inspection at the Registered Office of the Company during business hours on all working days up to the date of declaration of the results of the 30th Annual General Meeting of the Company.
By Order of the Board of Directors For KAVERI SEED COMPANY LIMITED Sd/-24.05.2017 G V BHASKAR RAOSecunderabad MANAGING DIRECTOR

Annual Report 2016-17 43
Statutory reports 30-89
Financial statements 90-188
Company overview 01-29
DIRECTORS’ REPORT
Dear Members,Kaveri Seed Company Limited
The Directors have pleasure to present their 30th Annual Report and the audited Annual Accounts for the Year ended 31st March 2017.
FINANCIAL RESULTS: Rs. in Lakhs
Particulars Year ended 31st March 2017
Year ended 31st March 2016
Total Income 70424.00 72819.78
Profit before Depreciation 11286.50 20234.00
Profit before Tax 8437.29 17735.71
Profit After Tax 7847.12 17227.96
Transfer to General Reserve - 1000.00
PERFORMANCE REVIEW A prolonged period of volatility was created in the market in 2015 following severe drought across large parts of India. However, a relatively better monsoon in 2016 enabled us to gain a favourable position, backed by several effective interventions. During the financial year, your Company posted a net profit after tax of Rs.7847.12 Lakhs as compared to previous year PAT of Rs.17227.96 Lakhs (54.45% decline). An overall deficit monsoon in the Kharif season 2016 resulted in the Company’s turnover of Rs.66989.10 Lakhs compared to Rs.71652.95 Lakhs for the previous year (decline 6.50%)
During the financial year, the consolidated revenue from operations of Rs.70635.76 Lakhs against the previous year Rs.74530.27 Lakhs (5.23% decline) and the Consolidated net profit of Rs.7783.34 Lakhs compared to previous year PAT of Rs.16788.41Lakhs (decline by 53.64%). As per the agreement with M/s. Mahyco Monsanto Biotech India Limited, during the financial year the company has made a provision of Rs.5923.80 Lakhs for payment of royalty against the short provided royalty in the previous years. In this regard, the issue has been settled in arbitration with the above said technical provider.
FUTURE PROSPECTS & OUT LOOK:India’s economy is largely dependent on the country’s agricultural sector. After sluggish growth of agricultural production due to the consecutive weak monsoon, optimism has returned in FY 2016-17 with a good monsoon. It led to substantial recovery for the overall agri-input space.
According to Indian Meteorological Department (IMD), the Kharif season is likely to receive normal or above average level rainfall in FY 2017-18. Besides, the sector is likely to gain better momentum, owing to further investments in agricultural infrastructure such as irrigation facilities, warehousing and cold storages. The demand for food and agricultural products is anticipated to increase. It would invariably lead to a surge in production of commercial seeds.
India’s seed industry is projected to thrive in the coming days. Market growth will be facilitated by the growth of modern retail channels -- the foraying of prominent national and multinational brands. Moreover, amplifying demand due to increased subsidies and the Government’s focus on the use of high yielding varieties is likely to provide impetus to the overall seed market in India. Enhancement in seed replacement rate (SRR) and farmers opting for hybrid seeds are further expected to bolster the growth. On the one hand, the demand for crops is rising, whereas on the contrary, the area of arable land available in the country remains limited. Hence, today, quality seeds have become a crucial component to augment the agricultural production and productivity.
DIVIDEND:Your Directors have not recommended dividend during the year 2016-17.
BUYBACK OF EQUITY SHARES:The Board of Directors of the Company at its meeting held on 27th March 2017 has approved buyback up to 29,62,963 Equity Shares of Rs.2/- each, on a proportionate basis, at a price of Rs.675/- per equity share payable in cash for an aggregate consideration not exceeding Rs.200.00 Crores, excluding transaction costs viz. brokerage, applicable taxes such as securities transaction tax, service tax, stamp duty etc., by way of a Tender offer route through Stock Exchange Mechanism. This is in accordance with the provisions of the Companies Act, 2013 and the Securities and Exchange Board of India (Buy Back of Securitas) Regulations, 1998, and other applicable laws and regulations.
The buyback is a capital allocation decision taken with the objective of seeking a fairer valuation of the company’s stock while improving the company’s Return on Equity and increasing shareholder value in the longer term. The offer

44
Value Creation Through Transformation
size of the buyback is within the prescribed limit of 25% of the aggregate of paid up capital and free reserves of the company and represents 4.29% of the total issued and paid up equity share capital of the company as on 31st March 2016.
RESEARCH AND DEVELOPMENTYour Company has consistently invested in R&D initiatives to strengthen our portfolio. Moreover, realising the immense potential of biotechnology in fostering and fortifying traditional breeding, we have formulated an integrated programme of molecular breeding. We have developed research collaborations with several national and international institutions for product development in line with evolving consumer preferences; and in view of developing tolerance to biotic and abiotic stresses and the looming threat of climate change. Our relentless innovation has helped to enhance farmer yields enormously and earned us goodwill among farmers and distributors. Our multi-crop portfolio, superior R&D, brand salience, human capital efficiencies laid firm foundation for long-term success.
Your Company has equipped with the state - of - the - art Seed Technology laboratory at Pamulaparthy plants. Our supply chain management involves meticulous planning and execution of maintenance breeding of basic seed, seed production, field production of hybrid seed, transportation of inbound raw materials, plant processing of the products, sending it to storage, and delivering finished quality products to domestic and export markets. We are producing high-quality seeds with focus on time to market to enhance productivity of farms.
STATUTORY AUDITORS & AUDITORS’ REPORTThe statutory auditors report is annexed to this annual report. There are no adverse remarks on disclosure by the statutory auditors in their report. They have not reported any incident of fraud to the Audit Committee of the Company during the year under review. Pursuant to Section 139(2) of the Companies Act, 2013, read with Companies (Audit and Auditors) Rules, 2014, the Company at its 27th Annual General Meeting (AGM) held on 18th September 2014, had appointed M/s. P.R. Reddy & Co., Chartered Accountants as Statutory Auditors for a period of 3 years i.e. up to the conclusion of the 30th AGM to be held in the year 2017. The present term of M/s. P.R.Reddy & Co.,Statutory Auditors would expire at the conclusion of the ensuing AGM.
The Board of Directors of the Company has proposed the appointment of M/s. M. Bhaskar Rao & Co. Chartered Accountants (Firm Registration No. 000459S) are proposed to
appoint as Statutory Auditors of the Company to hold office from the conclusion of 30th AGM until the conclusion of 35th AGM of the Company, based on the recommendation of Audit Committee. The Company has received written confirmation from M/s. M. Bhaskar Rao & Co., Chartered Accountants, confirming that they are eligible for appointment, if made, would be in conformity with the limits specified in the said section and subject to the approval of the Members of the Company.
INTERNAL AUDITORSThe Board of Directors of the Company has appointed a professional firm of M/s. M. Anandam & Co., Chartered Accountants to conduct internal audit of the Company for the financial year ended 31st March 2018. The Internal Audit Reports are being reviewed by the Audit Committee of the Company.
TRANSFER TO RESERVE:The Company has not transferred any amount to general reserve out of the profits of the year.
SUBSIDIARY COMPANIESThe Company has 4 subsidiaries as of March 31, 2017. There was no material change in the nature of the business carried on by the subsidiaries. As per the provisions of Section 129 of the Companies Act, 2013 read with Companies (Accounts) Rules, 2014, a separate statement containing the salient features of the financial statements of the subsidiary Companies is prepared in Form AOC-1 and is attached to the Financial Statements of the Company.
In accordance with the provisions of the Companies Act, 2013, the Balance Sheet, Statement of Profit and Loss and other documents of the subsidiary companies are being made available on the website of the Company and are not attached with the Annual Accounts of the Company. The Company will make available the Annual Accounts of the subsidiary companies and the related information to any member of the Company who may be interested in obtaining the same. The annual accounts of the subsidiary companies will also be kept open for inspection by any member at the Registered Office of the Company and that of the respective subsidiary companies.
CONSOLIDATED FINANCIAL STATEMENTSIn compliance with the provisions of the Companies Act, 2013 and the Accounting Standards AS-21 and AS-27 on consolidated financial statements, read with the Accounting Standard AS-23 on Accounting for Investments in Associates, your Directors have pleasure in attaching the consolidated

Annual Report 2016-17 45
Statutory reports 30-89
Financial statements 90-188
Company overview 01-29
financial statements for the financial year ended March 31, 2017, which forms part of the Annual Report. The company has placed separately, the audited accounts of its subsidiaries on its website www.kaveriseeds.in in compliance with the provisions of Section 136 of the Companies Act, 2013.
INTERNAL CONTROL SYSTEMS AND THEIR ADEQUACYThe Company has laid down set of standards which enables to implement internal financial control across the organization and ensure that the same are adequate and operating effectively. The Audit Committee of the Board of Directors actively reviews the adequacy and effectiveness of the internal control systems and suggests improvements to strengthen the same. The Audit Committee of the Board of Directors, Statutory Auditors and Finance Heads are periodically apprised of the internal audit findings and corrective actions taken. Audit plays a key role in providing assurance to the Board of Directors. Significant audit observations and corrective actions taken by the management are presented to the Audit Committee of the Board. To maintain its objectivity and independence, the internal Audit function reports to the Chairman of the Audit Committee.
INDIAN ACCOUNTING STANDARDS – IFRS CONVERGE STANDARDSThe Ministry of Corporate Affairs vide its notification dated 16th February 2015 notified under Section 133 of the Companies Act 2013 read with Companies (Indian Accounting Standards) Rules, 2015. In pursuance of the said notification your Company has prepared the financial statements to comply in all material respects in accordance with the applicability of Indian Accounting Standards.
INTERNAL FINANCIAL CONTROLS The internal financial controls (IFC) framework at Kaveri Seeds encompasses internal controls over financial reporting (ICOFR) as well as operational controls that have been put in place across all key business processes of the Company. The internal controls are designed to facilitate and support the achievement of the Company’s business objectives and such controls do enable the Company to adapt to changing and operating environment, to mitigate risks to acceptable levels and to support sound decision making and good governance. Details in respect of adequacy of internal financial controls with reference to the financial statements are briefly iterated below:
a. The Company maintains all its major records in ERP System.
b. The Company has appointed internal auditors to examine the internal controls, whether the workflow of the organisation is being done through the approved policies of the Company. In every quarter, during the approval of financial statements, internal auditors present the internal audit report and the management comments on the internal audit observations; and
c. The Board of Directors of the Company has adopted various policies such as related party transactions policy, whistle blower policy, policy to determine material subsidiaries and such other procedures for ensuring the orderly and efficient conduct of its business for safeguarding of its assets, the prevention and detection of frauds and errors, the accuracy and completeness of the accounting records, and the timely preparation of reliable financial information.
DIRECTORS’ RESPONSIBILITY STATEMENT:Pursuant to Section 134(3)(C) of the Companies Act, 2013 your Directors confirm that:
i) The applicable accounting standards have been followed in the preparation of the Annual Accounts.
ii) Such Accounting policies have been selected and applied consistently and judgments and estimates made when required that are reasonable and prudent so as to give a true and fair view of the state of affairs of the Company at the end of the financial year and of the profit of the Company for that period.
iii) Proper and sufficient care has been taken for the maintenance of adequate accounting records in accordance with the provisions of the companies Act, 2013 for safeguarding the assets of the company and for preventing and detecting fraud and other irregularities.
iv) The Directors have prepared the annual accounts on a going concern basis.
v) Proper Internal Financial Controls were in place to be followed by the Company and that the financial controls were adequate and were operating effectively.
vi) Proper systems devised to ensure compliance with the provisions of all applicable laws and that such systems are adequate and operating effectively.

46
Value Creation Through Transformation
DIRECTORSChanges in Directors and Key Managerial Personnel:During the year under review there was no change in the Directors or Key Managerial Personnel.
Appointment of Dr. G.Pawan, Director as Vice Chairman of the Company:Dr. G. Pawan, Director has been appointed as Vice Chairman (Non-Executive) of the Company with effect from 24th May 2017. He has completed Doctor of Medicine (MD) from Illinois State University, Chicago, USA. His services are very much needed to assist the Chairman & Managing Director in strategic issues and long term business plans of the Company and to repose confidence with investors, employees and all other stake holders for further betterment of the company. His active involvement on strategic issues and long term business plans and operations of the company will surely bring in to the Company a new blend of flavor to promote to further level.
Director(s) retiring by rotation:In accordance with the provisions of Section 152 of the Companies Act, 2013 and the Company’s Articles of Association, Mr. C. Vamsheedhar, retires by rotation at the ensuring Annual General Meeting and being eligible, offers himself for re-appointment.
DECLARATION FROM INDEPENDENT DIRECTORSThe independent directors have submitted the declaration of independence, as required pursuant to section 149(6) &(7) of the Companies Act, 2013 stating that they meet the criteria of independence as provided in subsection.
BOARD DIVERSITYThe Company recognizes and embraces the importance of a diverse board in its success. The Board has adopted the Board Diversity Policy which sets out the approach to diversify of the Board of Directors. The Board Diversity Policy is available on the Company’s website www.kaveriseeds.in
NOMINATION AND REMUNERATION COMMITTEE:Your Company has a Nomination and Remuneration Committee and further details are set out in the Corporate Governance Report forming part of the Directors’ Report. The Board has, on the recommendation of the Nomination & Remuneration Committee framed a policy for selection and appointment of Directors, Key Managerial Persons (KMP), Senior Management and their remuneration. The Nomination and Remuneration Policy as adopted by the Board is placed on the Company’s website: www.kaveriseeds.in
CORPORATE GOVERNANCE:A detailed Report on Corporate Governance prepared in substantial compliance with the provisions of Schedule V (C) of the SEBI (Listing Obligations and Disclosure Requirements) Regulations, 2015 is enclosed as a separate section forming part of this report.
The Certificate issued by M/s. P.R.Reddy & Co., Chartered Accountants, Hyderabad, with regard to compliance of conditions of Corporate Governance as stipulated under Schedule V (E) of the SEBI (Listing Obligations and Disclosure Requirements) Regulations, 2015 is annexed to the Report on Corporate Governance.
MANAGEMENT DISCUSSION AND ANALYSIS:Management’s Discussion and analysis Report for the year under review, as stipulated under Regulation 34(2)(e)of the Securities and Exchange Board of India (Listing Obligations and Disclosure Requirements) Regulations, 2015 is presented in a separate section forming part of the Annual Report.
PARTICULARS OF CONTRACTS OR ARRANGEMENTS WITH RELATED PARTIESAll transactions entered with Related Parties for the year under review were on arm’s length basis and in the ordinary course of business. There are no material related party transactions during the year under review with the Promoters, Directors or Key Managerial Personnel. The company has developed a Related Party Transactions frame work through standard operation procedures for the purpose of identification and monitoring of such transactions.
All Related Party Transactions are placed before the Audit Committee as also to be Board for approval. The particulars of contracts or arrangements entered into by the company with related parties referred to in sub-section (1) of section 188 of the Companies Act, 2013 disclosed in Form No. AOC – 2 and is set out as Annexure and forms part of this report.
EXTRACT OF ANNUAL RETURNThe details forming part of the extract of the Annual Return in Form MGT – 9, as required under Section 92 of the Companies Act, 2013, is included in this Report as Annexure – A and forms on integral part of this report.
SECRETARIAL AUDITPursuant to the provisions of Section 204 of the Companies Act, 2013 and rules made there under, the Company has appointed M/s. L.D.Reddy & Co., a firm of Company Secretaries in Practice (C.P.No.3725) to undertake the Secretarial Audit of the Company. The Secretarial Audit Report is included as
Annual Report 2016-17 47
Statutory reports 30-89
Financial statements 90-188
Company overview 01-29
Annexure – B and forms on integral part of this Report.
CORPORATE SOCIAL RESPONSIBILITYIn compliance with Section 135 of the Companies Act, 2013, read with the Companies (Corporate Social Responsibility Policy) Rules 2014, the Company has established Corporate Social Responsibility (CSR) committee composed of Mr. G.V.Bhaskar Rao as Chairman, Mrs. G.Vanaja Devi and Mr. M. Srikanth Reddy as members. The Committee is responsible for formulating and monitoring the CSR Policy of the Company, the Report on CSR Activities forms part of this Report as ”Annexure - C.”
During the year, the Board has approved and incorporated a separate company in the name of ‘Kaveri Bhaskar Rao Charitable Trust’ under Section 8 of the Companies Act, 2013 to undertake charitable activities under Corporate Social Responsibility policy and other related activities.
ENERGY CONSERVATION, TECHNOLOGY ABSORPTION AND FOREIGN EXCHANGE EARNINGS AND OUTGO:The Information on conservation of energy, technology absorption, foreign exchange earnings and outgo stipulated under Section 134(3)(m) of the Companies Act, 2013 read with Rule 8 of the Companies (Accounts) Rules, 2014, forms part of this report as Annexure D.
PARTICULARS OF EMPLOYEES:Details in respect of remuneration paid to employees as required under Section 197 (12) of the Companies Act, 2013 , read with Rule5(2) & (3) of the Companies (Appointment and Remuneration of Managerial Personnel) Rules, 2014, as amended forms part of this report. In terms of Section 136 of the Companies Act, 2013 the same is open for inspection at the Registered Office of the Company. Copies of this statement may be obtained by the members by writing to the Company Secretary at the Registered Office of the Company. The ratio of the remuneration of each Director to the median employee’s remuneration and other details in terms of Section197(12) of the Companies Act, 2013 read with Rule 5(1) of the Companies (Appointment and Remuneration of Managerial Personnel) Rules, 2014, are enclosed in Annexure – E and forms part of this Report.
BUSINESS RESPONSIBILITY REPORTA detailed Business Responsibility Report in terms of the provisions of Regulation 34 of SEBI (Listing Obligations and Disclosure Requirements) Regulations, 2015 is available as a separate section in this Annual Report.
PERFORMANCE EVALUATION OF THE BOARD Pursuant to the provisions of the Companies Act, 2013 and Securities and Exchange Board of India (Listing Obligations and Disclosure Requirements) Regulations, 2015, the Board has carried out an annual performance evaluation of its own performance, the directors individually as well as the evaluation of the working of its committees.
The performance evaluation of the Independent Directors was completed. The performance evaluation of the Chairman and the Non-Independent Directors was carried out by the Independent Directors. The Board of Directors expressed their satisfaction with the evaluation process.
MATERIAL CHANGES AND COMMITMENTSThere are no material changes and commitments in the business operations of the Company from the financial year ended March 31, 2017 to the date of signing of the Director’s Report.
NUMBER OF MEETINGS OF THE BOARDThe details of the number of meeting of the Board and Committees held during the Financial Year 2016-17 forms part of the Corporate Governance Report.
PARTICULARS OF LOANS, GURANTEES OR INVESTMENTS BY COMPANYDetails of Loans, Guarantees and Investments covered under the provisions of Section 186 of the Companies Act, 2013 are given in the notes to Financial Statements.
WHISTLE BLOWER POLICYThe Board of Directors has adopted the Whistle Blower Policy, which is in compliance with Section 177(10) of the Companies Act, 2013 and Regulation 22 of the SEBI (LODR) Regulations 2015 to report genuine concerns or grievances. The Whistle Blower Policy has been posted on the website of the company. (www.kaveriseeds.in)
SIGNIFICANT AND MATERIAL ORDERS PASSED BY THE REGULATORS OR COURTSThere are no significant and material orders passed by the Regulators/Courts that would impact the going concern status of the company and its future operations.
SHARE CAPITALDuring the year, there was no change in the Paid-up Share Capital of your Company.
TRANSFER OF UN-PAID AND UN-CLAIMED AMOUNT TO IEPFThe dividends which remain un-paid/un-claimed for a period of seven years, have been transferred on due dates

48
Value Creation Through Transformation
by the company to the Investor Education and Protection Fund (IEPF) established by the Central Government.
Pursuant to Section 124 of the Companies Act, 2013 read with Investor Education and Protection Fund Authority (Accounting, Audit, Transfer and Refund) Rules, 2016 (‘the Rules’) mandates that companies shall apart from transfer of dividend that has remained unclaimed for a period of seven years from the unpaid dividend account to the Investor Education and Protection Fund (IEPF), also transfer the corresponding shares with respect to the dividend, which has not been claimed for seven consecutive years or more to IEPF. Accordingly, the dividends that remain unclaimed for seven years and also the corresponding shares would be transferred to IEPF account on due dates.
PUBLIC DEPOSITS:Your Company has not accepted any public deposits and as such, no amount on account of principal or interest on public deposits was outstanding as on the date of the balance sheet.
RISK MANAGEMENT POLICYIn today’s economic environment, Risk Management is a very important part of business. The main aim of risk management is to identify, monitor and take precautionary measures in respect of the events that may pose risk for the business. Your Company’s risk management is embedded in the business process. The Company has established Enterprise Risk Management process to manage risks with the objective of maximizing shareholders value.
ENVIRONMENTAND SAFETYThe Company is conscious of the importance of environmentally clean and safe operations. The Company’s policy requires conduct of operations in such a manner, so as to ensure safety of all concerned, compliances environmental regulations and preservation of natural resources.
HUMAN RESOURCESKaveri consistently focuses on bringing talent on-board. The Company provides its people with relevant training to drive its long-term growth. The Company trains employees on several developmental programmes to enhance their managerial and behavioural skills. The Company is strengthening employee involvement through communication meetings.
The Company organises regular training programmes for its field staffs to impart them knowledge on crop production, quality control, agronomy, and plant protection, among
others. New employees go through formal induction programme and given interactive sessions with their line managers. Besides, specialised training programmes are conducted for R&D and marketing staff, as well as other departments. The Company has introduced a reward programme to recognise top performers from various departments.
The leadership team of the Company has wealth of experience in seed and crop production industry. It has a team of more than 50 dedicated scientists comprising breeders, agronomists, biotechnologists and seed technologists, along with dynamic sales and marketing professionals. Currently, the workforce includes over 793 members, who are driving the levers of growth.
POLICY ON SEXUAL HARASSMENTYour Company has constituted an internal committee as per the Sexual Harassment of Women at Workplace (Prevention, Prohibition & Redressal) Act, 2013 and Rules there under. The Company has a policy on prevention of Sexual Harassment at work place with a mechanism of lodging complaints. The policy provides for protection against sexual harassment of women at workplace and for prevention and redressal of such complaints. During the year under review, no complaints have been received under the policy.
INDUSTRIAL RELATIONS:The Company enjoyed cordial relations with its employees at all levels. Your Directors record their appreciation of the support and co-operation of all employees and counts on them for the accelerated growth of the Company.
ACKNOWLEDGEMENTS:Your Directors place on record their sincere appreciation for the dedication, hard work and commitment of the employees at all levels and their significant contribution to your Company’s growth. Your Company is grateful to the Distributors, Dealers, and Customers for their support and encouragement. Your Directors thank the Banks, Financial Institutions, Government Departments and Shareholders and look forward to having the same support in all our future endeavors.
By Order of the Board of Directors For KAVERI SEED COMPANY LIMITED
Sd/- Sd/-Secunderabad, G.V.BHASKAR RAO G.VANAJA DEVI24th May 2017 Managing Director Whole time Director

Annual Report 2016-17 49
Statutory reports 30-89
Financial statements 90-188
Company overview 01-29
Form AOC – 1Statement containing salient features of the financial statement of subsidiaries/associate companies/joint ventures
(Pursuant to first proviso to sub-section (3) of Section 129 read with Rule 5 of the companies (Accounts) Rules, 2014)
Part ‘A’ Subsidiaries ` in LakhsSl. No. Particulars Details Details Details Details1 Name of the Subsidiary Aditya Agritech
Pvt. LtdKaveri
Microteck Pvt. Ltd
Genome Agri Tech Pvt. Ltd
Kexveg India Pvt. Ltd
2. Reporting period for the subsidiary concerned, if different from the holding company’s reporting period
NA NA NA NA
3. Reporting currency and Exchange rate as on the last date of the relevant Financial Year in the case of foreign subsidiaries
INR INR INR INR
4. Share capital 110.00 1,453.64 18.00 1,415.00 5. Reserves & Surplus 190.23 162.60 (353.16) (1,089.02)6. Total Assets 1,884.48 2,607.42 387.63 394.32 7. Total Liabilities 1,584.25 991.19 722.79 68.35 8. Investments - - 0.06 0.01 9. Turnover 3,781.17 2,237.47 753.42 269.10 10 Profit before taxation 75.54 251.21 (161.49) (177.29)11. Profit for taxation 17.33 103.70 (14.86) - 12. Profit after taxation 58.21 147.51 (146.63) (177.29)13. Proposed Dividend - - - - 14. % of shareholding 70 100 51 100Note:i) Names of subsidiaries which are yet to commence operations : NILii) Names of subsidiaries which have been liquidated or sold during the year : NIL
For and on behalf of the Board of Directors Sd/- Sd/-Place: Secunderabad, G.V.BHASKAR RAO G.VANAJA DEVIDate: 24.05.2017 MANAGING DIRECTOR WHOLE TIME DIRECTOR

50
Value Creation Through Transformation
Form No. AOC –2
Particulars of contracts/arrangements entered into by the Company with Related Parties
(Pursuant to clause (h) of sub-section (3) of section 134 of the Act and Rule 8(2) of the Companies (Accounts) Rules, 2014.
Form for Disclosure of particulars of contracts/arrangements entered into by the Company with related parties referred to in sub section (1) of section 188 of the Companies Act, 2013 including certain arm’s length transaction under third proviso thereto)
1. Details of contracts or arrangements or transactions not at arm’s length basis:
All contracts/arrangements entered into by the Company with related parties referred to in sub-section (1) of Section 188 of the Companies Act, 2013 are at arm’s length basis
2. Details of contracts or arrangements or transactions at Arm’s length basis:
Sl.No. Particulars Detailsa) Name(s) of the related party &
nature of relationshipG.V. BhaskarRao (Ind.) Chairman & MD of the Company
b) Nature of contracts/ Land lease paid/ arrangements/transaction
Land lease paid
c) Duration of the contracts/arrangements/transaction
Two years w.e.f.01.04.2015 respective agreements.
d) Salient terms of the contracts or arrangements or transaction including the value, if any
1.20 Acres Land on Lease for a period of 2 years at Rs.0.60 Lakhs p.a.,
Note: Appropriate approvals have been taken for related party transactions. No amount was paid as advance.
Sl.No. Particulars Detailsa) Name(s) of the related party &
nature of relationshipG. Vanaja Devi Executive Director of the Company
b) Nature of contracts/arrangements/transaction
Land Lease Paid
c) Duration of the contracts/arrangements/transaction
Two years w.e.f.01.04.2015 respective agreements.
d) Salient terms of the contracts or arrangements or transaction including the value, if any
37.30 Acres Land on Lease for a period of 2 years at Rs. 8.49Lakhs p.a.,
Sl.No. Particulars Detailsa) Name(s) of the related party &
nature of relationshipG. Pawan Director of the Company
b) Nature of contracts/arrangements/transaction
Land Lease Paid
c) Duration of the contracts/arrangements/transaction
Two years w.e.f.01.04.2015 respective agreements.
d) Salient terms of the contracts or arrangements or transaction including the value, if any
51.22 Acres Land on Lease for a period of 2 years at Rs.12.31Lakhs p.a.,
Sl.No. Particulars Detailsa) Name(s) of the related party &
nature of relationshipG. Madhushree Daughter of Managing Director of the Company
b) Nature of contracts/arrangements/transaction
Land Lease Paid
c) Duration of the contracts/arrangements/transaction
Two years w.e.f.01.04.2015 respective agreements.
d) Salient terms of the contracts or arrangements or transaction including the value, if any
49.38Acres Land on Lease for a period of 2 years at Rs.10.80Lakhs p.a.,
Sl.No. Particulars Detailsa) Name(s) of the related party &
nature of relationshipC. Vamsheedhar Executive Director of the Company
b) Nature of contracts/arrangements/transaction
Land Lease Paid
c) Duration of the contracts/arrangements/transaction
Two years w.e.f.01.04.2015 respective agreements.
d) Salient terms of the contracts or arrangements or transaction including the value, if any
20.23Acres Land on Lease for a period of 2 years at Rs.4.48Lakhs p.a.,
Sl.No. Particulars Detailsa) Name(s) of the related party &
nature of relationshipG.V. BhaskarRao.HUF Chairman & MD of the Company
b) Nature of contracts/arrangements/transaction
Land and Godown Lease Paid
c) Duration of the contracts/arrangements/transaction
a. Land lease Agreement for Two years w.e.f.01.04.2015.
b. Godown Lease Agreement for 5 years w.e.f.01.04.2012
d) Salient terms of the contracts or arrangements or transaction including the value, if any
a. 31.19 Acres Land on Lease for a period of 2 years at Rs.7.71Lakhs p.a.,
b. 33000SftGodown on Lease for a period of 5 years at Rs.33.87 Lakhs p.a.,
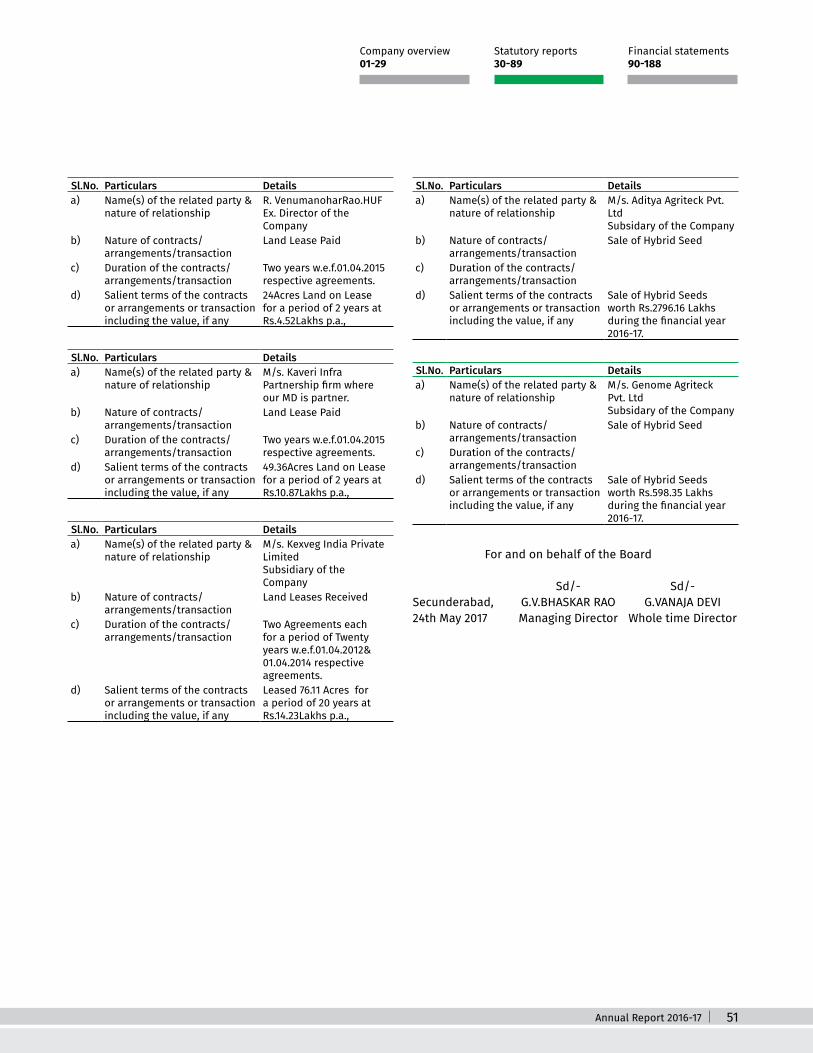
Annual Report 2016-17 51
Statutory reports 30-89
Financial statements 90-188
Company overview 01-29
Sl.No. Particulars Detailsa) Name(s) of the related party &
nature of relationshipR. VenumanoharRao.HUF Ex. Director of the Company
b) Nature of contracts/arrangements/transaction
Land Lease Paid
c) Duration of the contracts/arrangements/transaction
Two years w.e.f.01.04.2015 respective agreements.
d) Salient terms of the contracts or arrangements or transaction including the value, if any
24Acres Land on Lease for a period of 2 years at Rs.4.52Lakhs p.a.,
Sl.No. Particulars Detailsa) Name(s) of the related party &
nature of relationshipM/s. Kaveri Infra Partnership firm where our MD is partner.
b) Nature of contracts/arrangements/transaction
Land Lease Paid
c) Duration of the contracts/arrangements/transaction
Two years w.e.f.01.04.2015 respective agreements.
d) Salient terms of the contracts or arrangements or transaction including the value, if any
49.36Acres Land on Lease for a period of 2 years at Rs.10.87Lakhs p.a.,
Sl.No. Particulars Detailsa) Name(s) of the related party &
nature of relationshipM/s. Kexveg India Private Limited Subsidiary of the Company
b) Nature of contracts/arrangements/transaction
Land Leases Received
c) Duration of the contracts/arrangements/transaction
Two Agreements each for a period of Twenty years w.e.f.01.04.2012& 01.04.2014 respective agreements.
d) Salient terms of the contracts or arrangements or transaction including the value, if any
Leased 76.11 Acres for a period of 20 years at Rs.14.23Lakhs p.a.,
Sl.No. Particulars Detailsa) Name(s) of the related party &
nature of relationshipM/s. Aditya Agriteck Pvt. Ltd Subsidary of the Company
b) Nature of contracts/arrangements/transaction
Sale of Hybrid Seed
c) Duration of the contracts/arrangements/transaction
d) Salient terms of the contracts or arrangements or transaction including the value, if any
Sale of Hybrid Seeds worth Rs.2796.16 Lakhs during the financial year 2016-17.
Sl.No. Particulars Detailsa) Name(s) of the related party &
nature of relationshipM/s. Genome Agriteck Pvt. Ltd Subsidary of the Company
b) Nature of contracts/arrangements/transaction
Sale of Hybrid Seed
c) Duration of the contracts/arrangements/transaction
d) Salient terms of the contracts or arrangements or transaction including the value, if any
Sale of Hybrid Seeds worth Rs.598.35 Lakhs during the financial year 2016-17.
For and on behalf of the Board
Sd/- Sd/-Secunderabad, G.V.BHASKAR RAO G.VANAJA DEVI24th May 2017 Managing Director Whole time Director
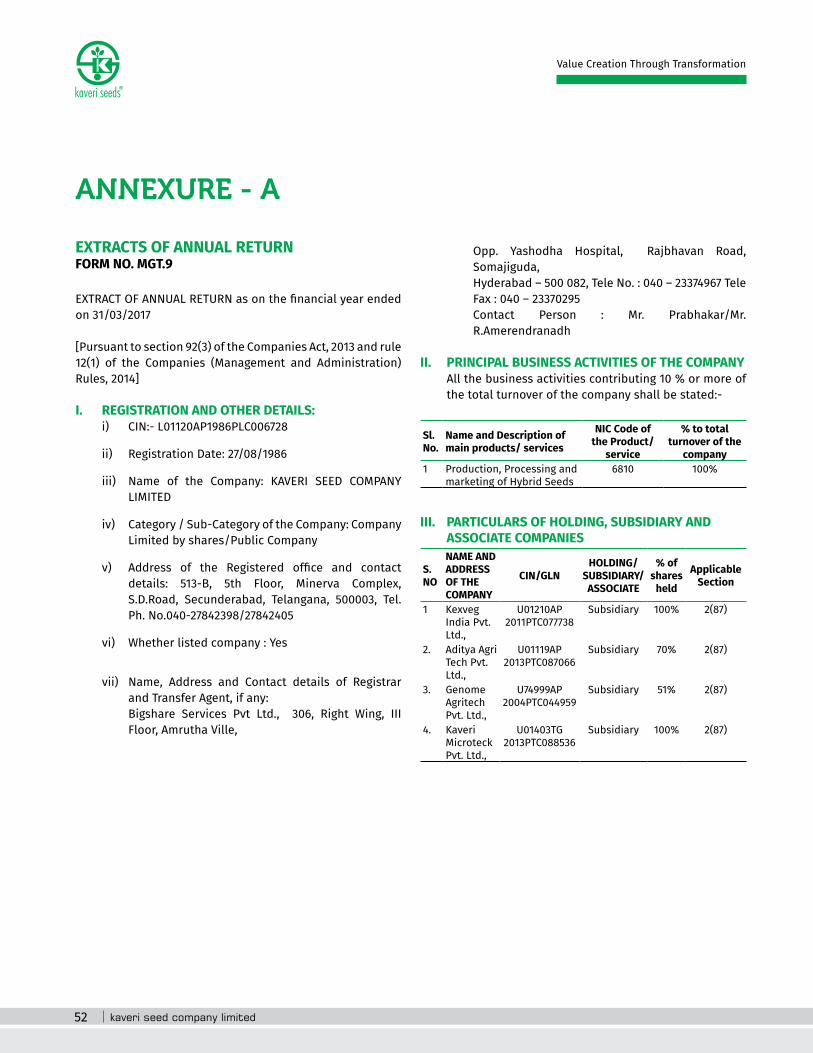
52
Value Creation Through Transformation
EXTRACTS OF ANNUAL RETURNFORM NO. MGT.9
EXTRACT OF ANNUAL RETURN as on the financial year ended on 31/03/2017
[Pursuant to section 92(3) of the Companies Act, 2013 and rule 12(1) of the Companies (Management and Administration) Rules, 2014]
I. REGISTRATION AND OTHER DETAILS: i) CIN:- L01120AP1986PLC006728
ii) Registration Date: 27/08/1986
iii) Name of the Company: KAVERI SEED COMPANY LIMITED
iv) Category / Sub-Category of the Company: Company Limited by shares/Public Company
v) Address of the Registered office and contact details: 513-B, 5th Floor, Minerva Complex, S.D.Road, Secunderabad, Telangana, 500003, Tel. Ph. No.040-27842398/27842405
vi) Whether listed company : Yes
vii) Name, Address and Contact details of Registrar and Transfer Agent, if any:
Bigshare Services Pvt Ltd., 306, Right Wing, III Floor, Amrutha Ville,
Opp. Yashodha Hospital, Rajbhavan Road, Somajiguda,
Hyderabad – 500 082, Tele No. : 040 – 23374967 Tele Fax : 040 – 23370295
Contact Person : Mr. Prabhakar/Mr. R.Amerendranadh
II. PRINCIPAL BUSINESS ACTIVITIES OF THE COMPANY All the business activities contributing 10 % or more of
the total turnover of the company shall be stated:-
Sl. No.
Name and Description of main products/ services
NIC Code of the Product/
service
% to total turnover of the
company1 Production, Processing and
marketing of Hybrid Seeds6810 100%
III. PARTICULARS OF HOLDING, SUBSIDIARY AND ASSOCIATE COMPANIES
S. NO
NAME AND ADDRESS OF THE COMPANY
CIN/GLNHOLDING/
SUBSIDIARY/ASSOCIATE
% of shares
held
Applicable Section
1 Kexveg India Pvt. Ltd.,
U01210AP 2011PTC077738
Subsidiary 100% 2(87)
2. Aditya Agri Tech Pvt. Ltd.,
U01119AP 2013PTC087066
Subsidiary 70% 2(87)
3. Genome Agritech Pvt. Ltd.,
U74999AP 2004PTC044959
Subsidiary 51% 2(87)
4. Kaveri Microteck Pvt. Ltd.,
U01403TG 2013PTC088536
Subsidiary 100% 2(87)
ANNEXURE - A
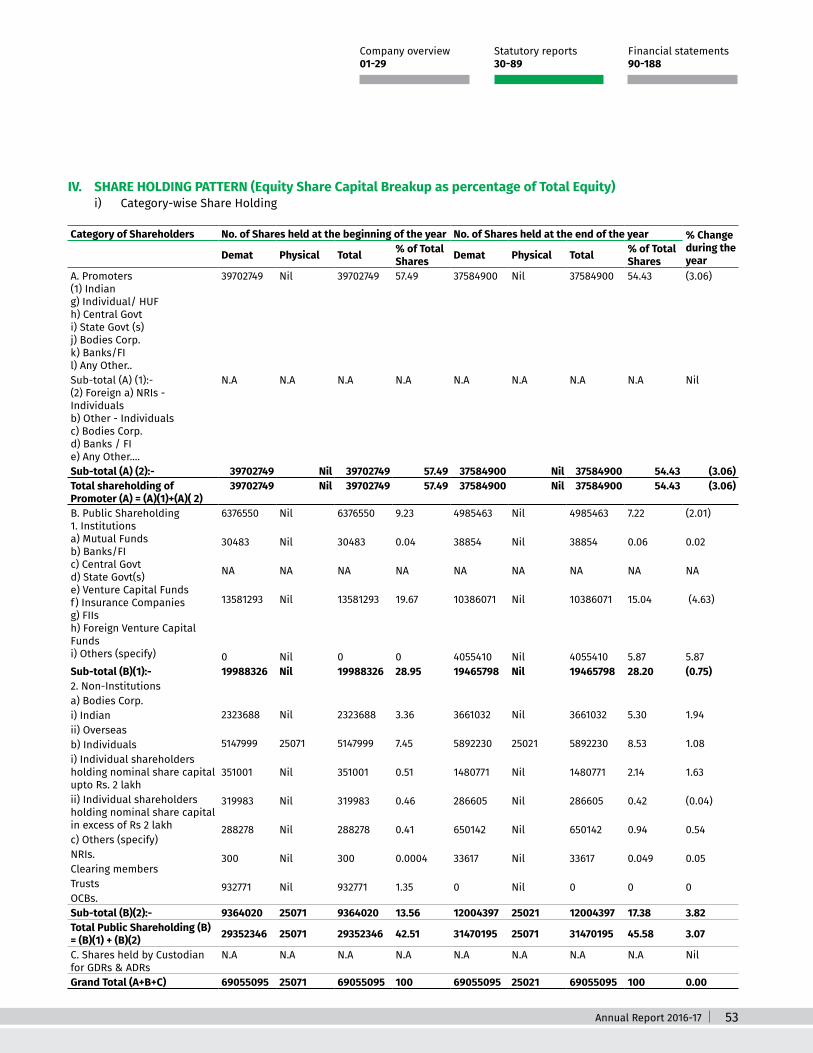
Annual Report 2016-17 53
Statutory reports 30-89
Financial statements 90-188
Company overview 01-29
IV. SHARE HOLDING PATTERN (Equity Share Capital Breakup as percentage of Total Equity) i) Category-wise Share Holding
Category of Shareholders No. of Shares held at the beginning of the year No. of Shares held at the end of the year % Change during the yearDemat Physical Total % of Total
Shares Demat Physical Total % of Total Shares
A. Promoters(1) Indiang) Individual/ HUFh) Central Govti) State Govt (s)j) Bodies Corp. k) Banks/FIl) Any Other..
39702749 Nil 39702749 57.49 37584900 Nil 37584900 54.43 (3.06)
Sub-total (A) (1):-(2) Foreign a) NRIs - Individualsb) Other - Individualsc) Bodies Corp.d) Banks / FIe) Any Other....
N.A N.A N.A N.A N.A N.A N.A N.A Nil
Sub-total (A) (2):- 39702749 Nil 39702749 57.49 37584900 Nil 37584900 54.43 (3.06)Total shareholding of Promoter (A) = (A)(1)+(A)( 2)
39702749 Nil 39702749 57.49 37584900 Nil 37584900 54.43 (3.06)
B. Public Shareholding1. Institutionsa) Mutual Fundsb) Banks/FIc) Central Govtd) State Govt(s)e) Venture Capital Fundsf) Insurance Companiesg) FIIsh) Foreign Venture Capital Fundsi) Others (specify)
6376550
30483
NA
13581293
0
Nil
Nil
NA
Nil
Nil
6376550
30483
NA
13581293
0
9.23
0.04
NA
19.67
0
4985463
38854
NA
10386071
4055410
Nil
Nil
NA
Nil
Nil
4985463
38854
NA
10386071
4055410
7.22
0.06
NA
15.04
5.87
(2.01)
0.02
NA
(4.63)
5.87Sub-total (B)(1):- 19988326 Nil 19988326 28.95 19465798 Nil 19465798 28.20 (0.75)2. Non-Institutionsa) Bodies Corp.i) Indianii) Overseasb) Individualsi) Individual shareholders holding nominal share capital upto Rs. 2 lakhii) Individual shareholders holding nominal share capital in excess of Rs 2 lakhc) Others (specify)NRIs.Clearing membersTrustsOCBs.
2323688
5147999
351001
319983
288278
300
932771
Nil
25071
Nil
Nil
Nil
Nil
Nil
2323688
5147999
351001
319983
288278
300
932771
3.36
7.45
0.51
0.46
0.41
0.0004
1.35
3661032
5892230
1480771
286605
650142
33617
0
Nil
25021
Nil
Nil
Nil
Nil
Nil
3661032
5892230
1480771
286605
650142
33617
0
5.30
8.53
2.14
0.42
0.94
0.049
0
1.94
1.08
1.63
(0.04)
0.54
0.05
0
Sub-total (B)(2):- 9364020 25071 9364020 13.56 12004397 25021 12004397 17.38 3.82Total Public Shareholding (B) = (B)(1) + (B)(2) 29352346 25071 29352346 42.51 31470195 25071 31470195 45.58 3.07
C. Shares held by Custodian for GDRs & ADRs
N.A N.A N.A N.A N.A N.A N.A N.A Nil
Grand Total (A+B+C) 69055095 25071 69055095 100 69055095 25021 69055095 100 0.00
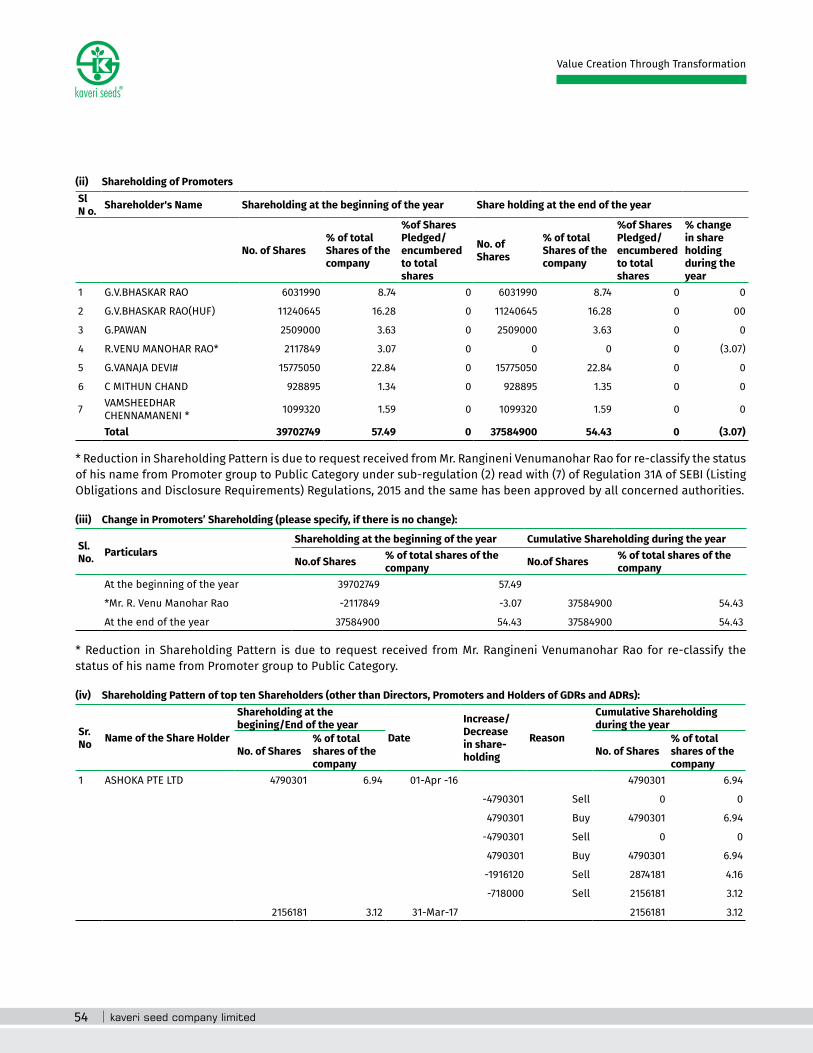
54
Value Creation Through Transformation
(ii) Shareholding of PromotersSl N o. Shareholder's Name Shareholding at the beginning of the year Share holding at the end of the year
No. of Shares% of total Shares of the company
%of Shares Pledged/ encumbered to total shares
No. of Shares
% of total Shares of the company
%of Shares Pledged/ encumbered to total shares
% change in share holding during the year
1 G.V.BHASKAR RAO 6031990 8.74 0 6031990 8.74 0 0
2 G.V.BHASKAR RAO(HUF) 11240645 16.28 0 11240645 16.28 0 00
3 G.PAWAN 2509000 3.63 0 2509000 3.63 0 0
4 R.VENU MANOHAR RAO* 2117849 3.07 0 0 0 0 (3.07)
5 G.VANAJA DEVI# 15775050 22.84 0 15775050 22.84 0 0
6 C MITHUN CHAND 928895 1.34 0 928895 1.35 0 0
7 VAMSHEEDHAR CHENNAMANENI * 1099320 1.59 0 1099320 1.59 0 0
Total 39702749 57.49 0 37584900 54.43 0 (3.07)
* Reduction in Shareholding Pattern is due to request received from Mr. Rangineni Venumanohar Rao for re-classify the status of his name from Promoter group to Public Category under sub-regulation (2) read with (7) of Regulation 31A of SEBI (Listing Obligations and Disclosure Requirements) Regulations, 2015 and the same has been approved by all concerned authorities.
(iii) Change in Promoters’ Shareholding (please specify, if there is no change):
Sl. No. Particulars
Shareholding at the beginning of the year Cumulative Shareholding during the year
No.of Shares % of total shares of the company No.of Shares % of total shares of the
company At the beginning of the year 39702749 57.49
*Mr. R. Venu Manohar Rao -2117849 -3.07 37584900 54.43
At the end of the year 37584900 54.43 37584900 54.43
* Reduction in Shareholding Pattern is due to request received from Mr. Rangineni Venumanohar Rao for re-classify the status of his name from Promoter group to Public Category.
(iv) Shareholding Pattern of top ten Shareholders (other than Directors, Promoters and Holders of GDRs and ADRs):
Sr. No Name of the Share Holder
Shareholding at the begining/End of the year
Date
Increase/Decrease in share-holding
Reason
Cumulative Shareholding during the year
No. of Shares% of total shares of the company
No. of Shares% of total shares of the company
1 ASHOKA PTE LTD 4790301 6.94 01-Apr -16 4790301 6.94
-4790301 Sell 0 0
4790301 Buy 4790301 6.94
-4790301 Sell 0 0
4790301 Buy 4790301 6.94
-1916120 Sell 2874181 4.16
-718000 Sell 2156181 3.12
2156181 3.12 31-Mar-17 2156181 3.12

Annual Report 2016-17 55
Statutory reports 30-89
Financial statements 90-188
Company overview 01-29
Sr. No Name of the Share Holder
Shareholding at the begining/End of the year
Date
Increase/Decrease in share-holding
Reason
Cumulative Shareholding during the year
No. of Shares% of total shares of the company
No. of Shares% of total shares of the company
2MACQUARIE EMERGING MARKETS ASIAN TRADING PTE. LTD.
18000 0.03 01-Apr -16 18000 0.03
10500 Buy 28,500 0.04
-28500 Sell 0 0.00
9750 Buy 9,750 0.01
57000 Buy 66,750 0.10
-60000 Sell 6,750 0.01
-6750 Sell 0 0.00
118500 Buy 1,18,500 0.17
7500 Buy 1,26,000 0.18
1500 Buy 1,27,500 0.18
69030 Buy 1,96,530 0.28
114750 Buy 3,11,280 0.45
186750 Buy 4,98,030 0.72
195000 Buy 6,93,030 1.00
141750 Buy 8,34,780 1.21
52500 Buy 8,87,280 1.28
-4500 Sell 8,82,780 1.28
-51000 Sell 8,31,780 1.20
-55500 Sell 7,76,280 1.12
-37500 Sell 7,38,780 1.07
-223504 Sell 5,15,276 0.75
-112500 Sell 4,02,776 0.58
-7500 Sell 3,95,276 0.57
-55500 Sell 3,39,776 0.49
96000 Buy 4,35,776 0.63
-435776 Sell 0 0.00
426776 Buy 4,26,776 0.62
-426776 Sell 0 0.00
401276 Buy 4,01,276 0.58
-282000 Sell 1,19,276 0.17
-40500 Sell 78,776 0.11
-30000 Sell 48,776 0.07
-46500 Sell 2,276 0.00
6000 Buy 8,276 0.01
9000 Buy 17,276 0.03
1500 Buy 18,776 0.03
-1500 Sell 17,276 0.03
-16500 Sell 776 0.00
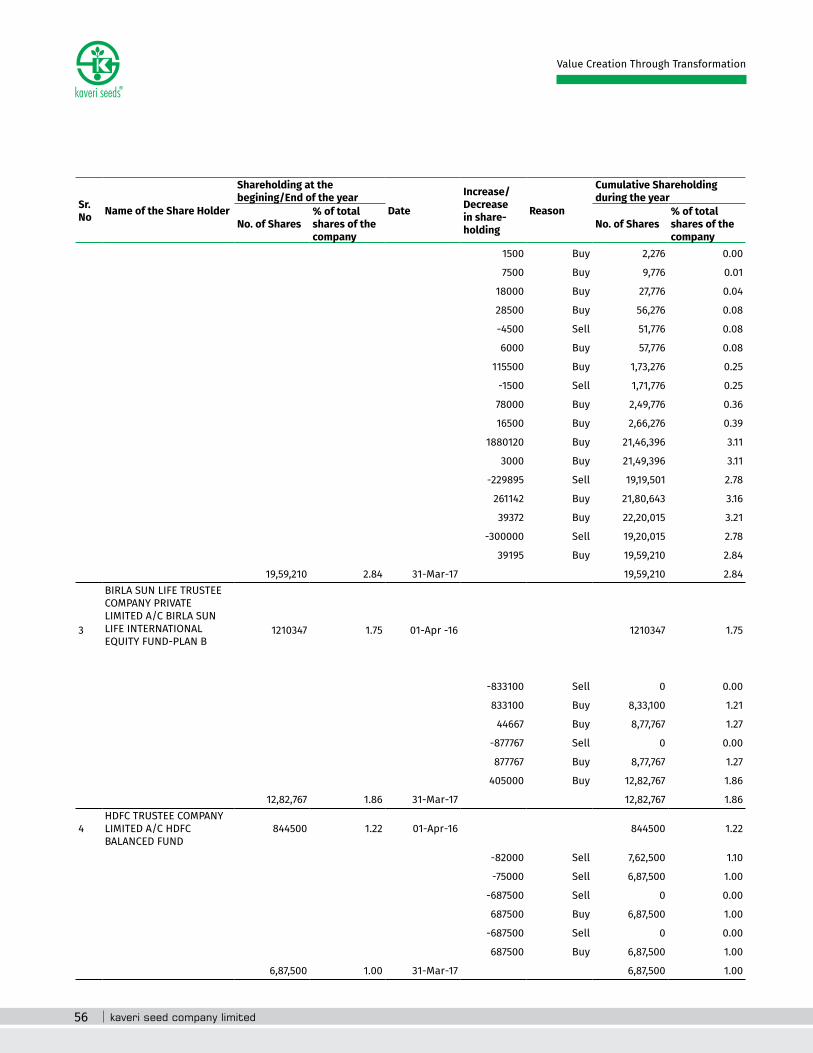
56
Value Creation Through Transformation
Sr. No Name of the Share Holder
Shareholding at the begining/End of the year
Date
Increase/Decrease in share-holding
Reason
Cumulative Shareholding during the year
No. of Shares% of total shares of the company
No. of Shares% of total shares of the company
1500 Buy 2,276 0.00
7500 Buy 9,776 0.01
18000 Buy 27,776 0.04
28500 Buy 56,276 0.08
-4500 Sell 51,776 0.08
6000 Buy 57,776 0.08
115500 Buy 1,73,276 0.25
-1500 Sell 1,71,776 0.25
78000 Buy 2,49,776 0.36
16500 Buy 2,66,276 0.39
1880120 Buy 21,46,396 3.11
3000 Buy 21,49,396 3.11
-229895 Sell 19,19,501 2.78
261142 Buy 21,80,643 3.16
39372 Buy 22,20,015 3.21
-300000 Sell 19,20,015 2.78
39195 Buy 19,59,210 2.84
19,59,210 2.84 31-Mar-17 19,59,210 2.84
3
BIRLA SUN LIFE TRUSTEE COMPANY PRIVATE LIMITED A/C BIRLA SUN LIFE INTERNATIONAL EQUITY FUND-PLAN B
1210347 1.75 01-Apr -16 1210347 1.75
-833100 Sell 0 0.00
833100 Buy 8,33,100 1.21
44667 Buy 8,77,767 1.27
-877767 Sell 0 0.00
877767 Buy 8,77,767 1.27
405000 Buy 12,82,767 1.86
12,82,767 1.86 31-Mar-17 12,82,767 1.86
4HDFC TRUSTEE COMPANY LIMITED A/C HDFC BALANCED FUND
844500 1.22 01-Apr-16 844500 1.22
-82000 Sell 7,62,500 1.10
-75000 Sell 6,87,500 1.00
-687500 Sell 0 0.00
687500 Buy 6,87,500 1.00
-687500 Sell 0 0.00
687500 Buy 6,87,500 1.00
6,87,500 1.00 31-Mar-17 6,87,500 1.00

Annual Report 2016-17 57
Statutory reports 30-89
Financial statements 90-188
Company overview 01-29
Sr. No Name of the Share Holder
Shareholding at the begining/End of the year
Date
Increase/Decrease in share-holding
Reason
Cumulative Shareholding during the year
No. of Shares% of total shares of the company
No. of Shares% of total shares of the company
5 FIDELITY NORTHSTAR FUND 650000 0.94 01-Apr-16 650000 0.94
-650000 Sell 0 0.00
650000 Buy 6,50,000 0.94
-650000 Sell 0 0.00
650000 Buy 6,50,000 0.94
6,50,000 0.94 31-Mar-17 6,50,000 0.94
6 SURYATEJ ADVISORS LLP 450000 0.65 01-Apr-16 450000 0.65
-450000 Sell 0 0.00
450000 Buy 4,50,000 0.65
-450000 Sell 0 0.00
450000 Buy 4,50,000 0.65
170000 Buy 6,20,000 0.90
6,20,000 0.90 31-Mar-17 6,20,000 0.90
7NATIONAL WESTMINSTER BANK PLC AS TRUSTEE OF THE JUPITER INDIA FUND
0 0 01-Apr-16 0 0
580000 Buy 580000 0.84
580000 0.84 31-Mar-17 580000 0.84
8
BIRLA SUN LIFE TRUSTEE COMPANY PRIVATE LIMITED A/C BIRLA SUN LIFE DIVIDEND YIELD PLUS
570300 0.83 01-Apr-16 570300 0.83
5,70,300 0.83 31-Mar-17 5,70,300 0.83
9 FIDELITY PURITAN TRUST FIDELITY SERIES INTRINSIC OPPORTUNITIES FUND
550000 0.80 01-Apr-16 550000 0.80
-550000 Sell 0 0.00
550000 Buy 5,50,000 0.80
-550000 Sell 0 0.00
550000 Buy 5,50,000 0.80
550000 0.80 31-Mar-17 5,50,000 0.80
10 ASHISH KACHOLIA 200000 0.29 01-Apr-16 200000 0.29
200000 Buy 400000 0.58
35000 Buy 435000 0.63
103194 Buy 538194 0.78
538194 0.78 31-Mar-17 5,38,194 0.78
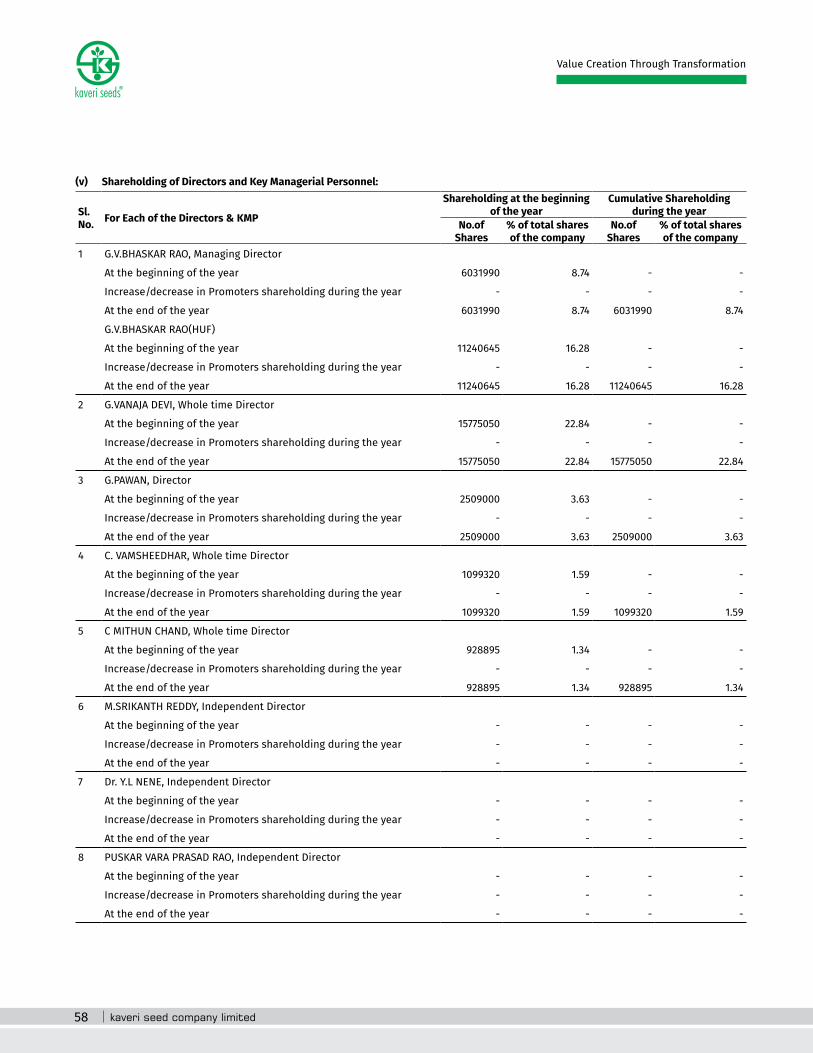
58
Value Creation Through Transformation
(v) Shareholding of Directors and Key Managerial Personnel:
Sl. No. For Each of the Directors & KMP
Shareholding at the beginning of the year
Cumulative Shareholding during the year
No.of Shares
% of total shares of the company
No.of Shares
% of total shares of the company
1 G.V.BHASKAR RAO, Managing Director
At the beginning of the year 6031990 8.74 - -
Increase/decrease in Promoters shareholding during the year - - - -
At the end of the year 6031990 8.74 6031990 8.74
G.V.BHASKAR RAO(HUF)
At the beginning of the year 11240645 16.28 - -
Increase/decrease in Promoters shareholding during the year - - - -
At the end of the year 11240645 16.28 11240645 16.28
2 G.VANAJA DEVI, Whole time Director
At the beginning of the year 15775050 22.84 - -
Increase/decrease in Promoters shareholding during the year - - - -
At the end of the year 15775050 22.84 15775050 22.84
3 G.PAWAN, Director
At the beginning of the year 2509000 3.63 - -
Increase/decrease in Promoters shareholding during the year - - - -
At the end of the year 2509000 3.63 2509000 3.63
4 C. VAMSHEEDHAR, Whole time Director
At the beginning of the year 1099320 1.59 - -
Increase/decrease in Promoters shareholding during the year - - - -
At the end of the year 1099320 1.59 1099320 1.59
5 C MITHUN CHAND, Whole time Director
At the beginning of the year 928895 1.34 - -
Increase/decrease in Promoters shareholding during the year - - - -
At the end of the year 928895 1.34 928895 1.34
6 M.SRIKANTH REDDY, Independent Director
At the beginning of the year - - - -
Increase/decrease in Promoters shareholding during the year - - - -
At the end of the year - - - -
7 Dr. Y.L NENE, Independent Director
At the beginning of the year - - - -
Increase/decrease in Promoters shareholding during the year - - - -
At the end of the year - - - -
8 PUSKAR VARA PRASAD RAO, Independent Director
At the beginning of the year - - - -
Increase/decrease in Promoters shareholding during the year - - - -
At the end of the year - - - -

Annual Report 2016-17 59
Statutory reports 30-89
Financial statements 90-188
Company overview 01-29
Sl. No. For Each of the Directors & KMP
Shareholding at the beginning of the year
Cumulative Shareholding during the year
No.of Shares
% of total shares of the company
No.of Shares
% of total shares of the company
9 Dr. S. RAGHUVARDHAN REDDY, Independent Director
At the beginning of the year - - - -
Increase/decrease in Promoters shareholding during the year - - - -
At the end of the year - - - -
10 Dr. S.M.ILYAS, Independent Director
At the beginning of the year - - - -
Increase/decrease in Promoters shareholding during the year - - - -
At the end of the year - - - -
11 K.PURUSHOTHAM, Independent Director
At the beginning of the year - - - -
Increase/decrease in Promoters shareholding during the year - - - -
At the end of the year - - - -
12 G. VIJAY KUMAR, Chief Financial Officer
At the beginning of the year - - - -
Increase/decrease in Promoters shareholding during the year - - - -
At the end of the year - - - -
13 G. SATISH, Chief Operating Officer
At the beginning of the year - - - -
Increase/decrease in Promoters shareholding during the year - - - -
At the end of the year - - - -
14 V.R.S.Murti, Company Secretary - - - -
At the beginning of the year - - - -
Increase/decrease in Promoters shareholding during the year - - - -
At the end of the year - - - -
V. INDEBTEDNESS
Indebtedness of the Company including interest outstanding/accrued but not due for payment
Secured Loans excluding deposits
Unsecured Loans Deposits Total Indebtedness
Indebtedness at the beginning of the financial year
i) Principal Amount
ii) Interest due but not paid
iii) Interest accrued but not due
163.86
-
8.67- -
163.86
-
8.67Total (i+ii+iii) 172.53 - - 172.53
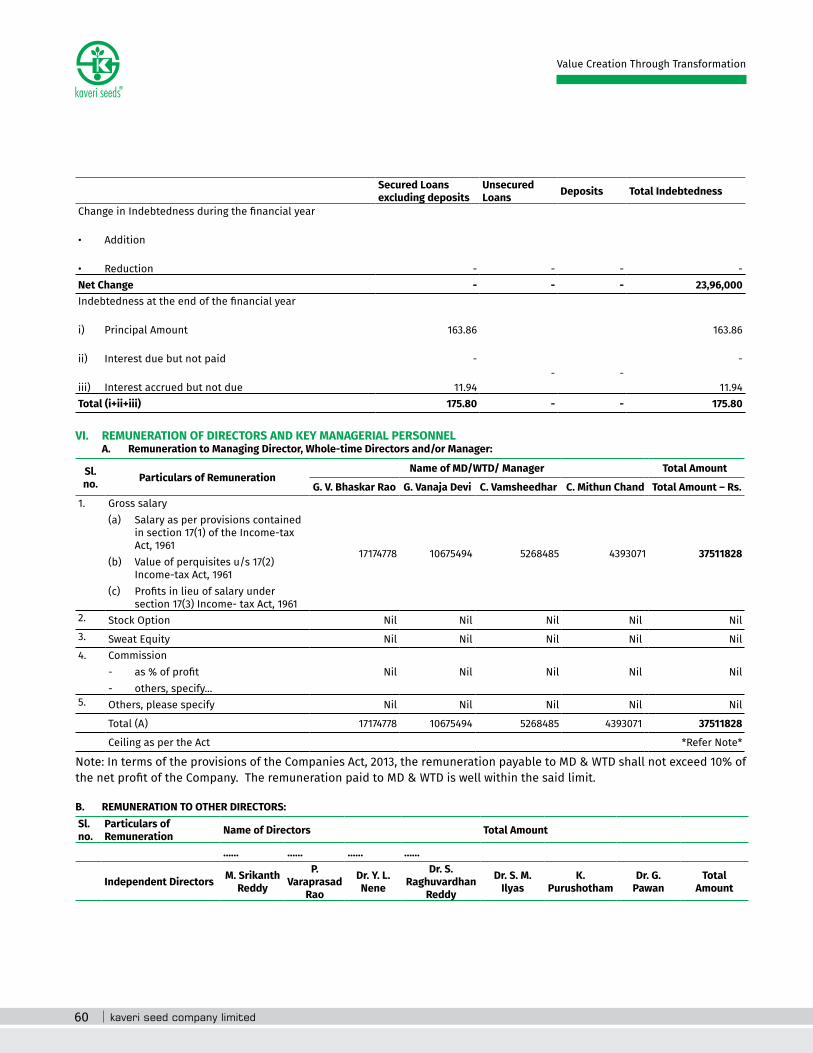
60
Value Creation Through Transformation
Secured Loans excluding deposits
Unsecured Loans Deposits Total Indebtedness
Change in Indebtedness during the financial year
• Addition
• Reduction - - - -Net Change - - - 23,96,000Indebtedness at the end of the financial year
i) Principal Amount
ii) Interest due but not paid
iii) Interest accrued but not due
163.86
-
11.94- -
163.86
-
11.94Total (i+ii+iii) 175.80 - - 175.80
VI. REMUNERATION OF DIRECTORS AND KEY MANAGERIAL PERSONNEL A. Remuneration to Managing Director, Whole-time Directors and/or Manager:
Sl. no. Particulars of Remuneration
Name of MD/WTD/ Manager Total Amount
G. V. Bhaskar Rao G. Vanaja Devi C. Vamsheedhar C. Mithun Chand Total Amount – Rs.1. Gross salary
(a) Salary as per provisions contained in section 17(1) of the Income-tax Act, 1961
(b) Value of perquisites u/s 17(2) Income-tax Act, 1961
(c) Profits in lieu of salary under section 17(3) Income- tax Act, 1961
17174778 10675494 5268485 4393071 37511828
2. Stock Option Nil Nil Nil Nil Nil3. Sweat Equity Nil Nil Nil Nil Nil4. Commission
- as % of profit- others, specify...
Nil Nil Nil Nil Nil
5. Others, please specify Nil Nil Nil Nil Nil
Total (A) 17174778 10675494 5268485 4393071 37511828
Ceiling as per the Act *Refer Note*
Note: In terms of the provisions of the Companies Act, 2013, the remuneration payable to MD & WTD shall not exceed 10% of the net profit of the Company. The remuneration paid to MD & WTD is well within the said limit.
B. REMUNERATION TO OTHER DIRECTORS:Sl. no.
Particulars of Remuneration Name of Directors Total Amount
…… …… …… ……
Independent Directors M. Srikanth Reddy
P. Varaprasad
Rao
Dr. Y. L. Nene
Dr. S. Raghuvardhan
Reddy
Dr. S. M. Ilyas
K. Purushotham
Dr. G. Pawan
Total Amount

Annual Report 2016-17 61
Statutory reports 30-89
Financial statements 90-188
Company overview 01-29
• Fee for attending board committee meetings
• Commission
• Others, please specify
130,000 110,000 90,000 110,000 110,000 130,000 40,000 720,000
Total (1) 130,000 110,000 90,000 110,000 110,000 130,000 40,000 720,0004. Other Non-
Executive Directors
• Fee for attending board committee meetings
• Commission
• Others, please specify
- - - - - - - -
Total (2) - - - - - - -
Total (B) = (1 + 2) 130,000 110,000 90,000 110,000 110,000 130,000 40,000 720,000Total Managerial Remuneration 130,000 110,000 90,000 110,000 110,000 130,000 40,000 720,000
Overall Ceiling as per the Act *Refer Note*
Note: In terms of the provisions of the Companies Act, 2013, the remuneration payable to Non-executive and Independent Directors shall not exceed 1% of the net profit of the Company. The company is paying only sitting fee to all Non-Executive and Independent Directors for attending Board/Committee meetings.
C. Remuneration To Key Managerial Personnel Other Than MD/Manager/WTD.Sl. no. Particulars of Remuneration Key Managerial Personnel
G. Vijay Kumar, CFO G. Satish, COO Total
1.
Gross salary
(a) Salary as per provisions contained in section 17(1) of the Income-tax Act, 1961
(b) Value of perquisites u/s 17(2) Income-tax Act, 1961
(c) Profits in lieu of salary under section 17(3) Income-tax Act, 1961
6849992 13910016 20760008
2. Stock Option Nil Nil Nil
3. Sweat Equity Nil Nil Nil
4.
Commission
- as % of profit
- others, specify...
Nil Nil Nil
5. Others, please specify Nil Nil Nil
Total 6849992 13910016 20760008
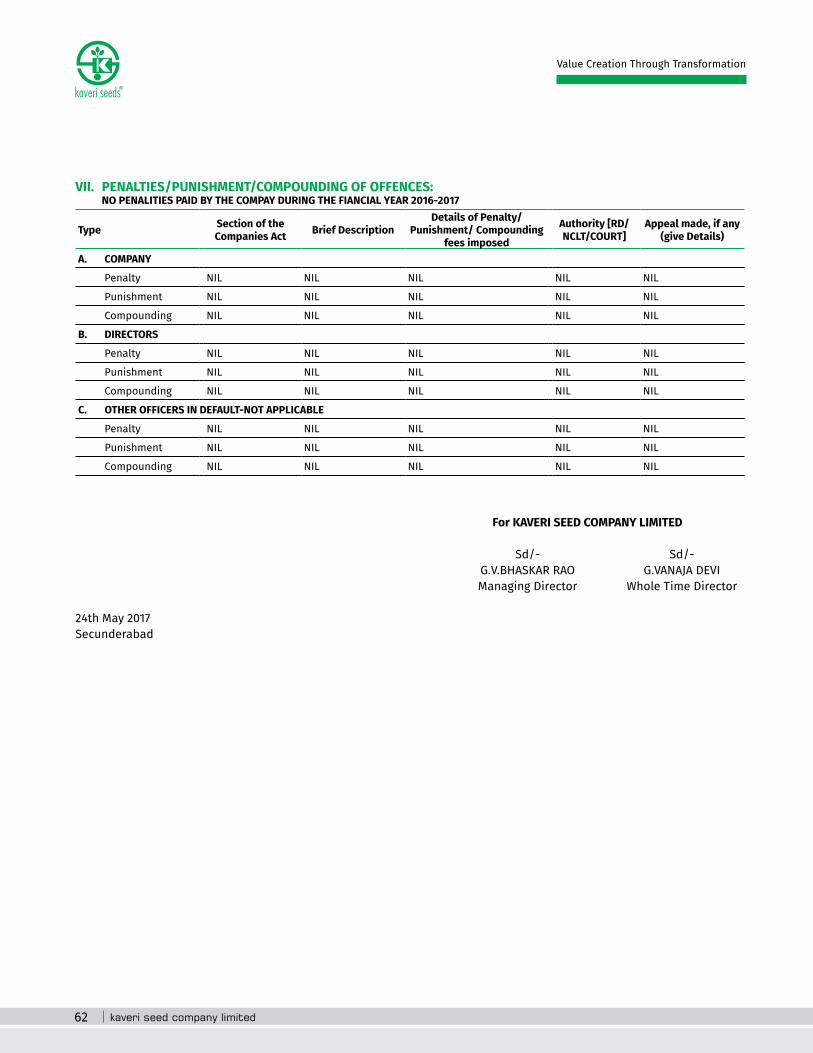
62
Value Creation Through Transformation
VII. PENALTIES/PUNISHMENT/COMPOUNDING OF OFFENCES: NO PENALITIES PAID BY THE COMPAY DURING THE FIANCIAL YEAR 2016-2017
Type Section of the Companies Act Brief Description
Details of Penalty/ Punishment/ Compounding
fees imposed
Authority [RD/NCLT/COURT]
Appeal made, if any (give Details)
A. COMPANY
Penalty NIL NIL NIL NIL NIL
Punishment NIL NIL NIL NIL NIL
Compounding NIL NIL NIL NIL NIL
B. DIRECTORS
Penalty NIL NIL NIL NIL NIL
Punishment NIL NIL NIL NIL NIL
Compounding NIL NIL NIL NIL NIL
C. OTHER OFFICERS IN DEFAULT-NOT APPLICABLE
Penalty NIL NIL NIL NIL NIL
Punishment NIL NIL NIL NIL NIL
Compounding NIL NIL NIL NIL NIL
For KAVERI SEED COMPANY LIMITED
Sd/- Sd/- G.V.BHASKAR RAO G.VANAJA DEVI Managing Director Whole Time Director
24th May 2017Secunderabad

Annual Report 2016-17 63
Statutory reports 30-89
Financial statements 90-188
Company overview 01-29
Secretarial Audit ReportFor the Financial Year Ended31-03-2016[Pursuant to Section 204(1) of the Companies Act, 2013 and Rule No. 9 of the Companies (Appointment and Remuneration of Managerial Personnel) Rules, 2014]
To,The Board of DirectorsM/s. Kaveri Seed Company Ltd.513B, 5th Floor, Minerva Complex, Secunderabad- 500003
We have conducted the secretarial audit on the compliance of applicable statutory provisions and the adherence to good corporate practices by M/s. Kaveri Seed Company Ltd (hereinafter called the Company). Secretarial Audit was conducted in a manner that provided us a reasonable basis for evaluating the corporate conducts/statutory compliances and expressing our opinion thereon.
Based on our verification of books, papers, minute books, forms and returns filed and other records maintained by the Company and also the information provided by the Company, its officers, agents and authorized representatives during the conduct of secretarial audit, We hereby report that in our opinion, the Company has, during the audit period ended on 31-03-2017, complied with the statutory provisions listed hereunder and also that the Company has proper Board-processes and compliance-mechanism in place to the extent, in the manner and subject to the reporting made hereinafter:
1. We have examined the books, papers, minute books, forms and returns filed and other records maintained by M/s. Kaveri Seed Company Ltd (“The Company”) for the financial year ended on 31-03-2017 according to the provisions of:
i) The Companies Act, 2013 (the Act) and the Rules made there under;
ii) The Securities Contracts (Regulation) Act, 1956 (‘SCRA’) and the Rules made thereunder;
iii) The Depositories Act, 1996 and the Regulations and Bye-laws framed thereunder;
iv) Foreign Exchange Management Act, 1999 and the Rules and Regulations made thereunder to the extent of Foreign Direct Investment, Overseas Direct Investment and External Commercial Borrowings;
v) The following Regulations and Guidelines prescribed under the Securities and Exchange Board of India Act, 1992 (‘SEBI Act’) :
a. The Securities and Exchange Board of India (Substantial Acquisition of Shares and Takeovers) Regulations, 2011;
b. The Securities and Exchange Board of India (Prohibition of Insider Trading) Regulations, 2015;
c. The Securities and Exchange Board of India (Issue of capital and Disclosure Requirements) Regulations, 2009;
d. The Securities and Exchange Board of India (Employee Stock Option Scheme and Employee Stock Purchase Scheme) Guidelines , 1999;
e. The Securities and Exchange Board of India (Issue and Listing of Debt Securities) Regulations, 2008;
f. The Securities and Exchange Board of India (Registrars to an Issue and Share Transfer Agents) Regulations, 1993 regarding the Companies Act and dealing with client;
g. The Securities and Exchange Board of India (Delisting of Equity Shares) Regulations, 2008;
h. The Securities and Exchange Board of India (Buyback of Securities) Regulations, 2008;
i. Securities and Exchange Board of India (Listing Obligations and Disclosure Requirements) Regulations, 2015.
ANNEXURE - B
64
Value Creation Through Transformation
vi) The Factories Act, 1948
vii) The Payment of Wages Act, 1936
viii) The Minimum Wages Act, 1948
ix) Employees Provident Fund And Misc. Provisions Act, 1952
x) Employers State Insurance Act,1948
xi) The Environment (Protection) Act, 1986
xii) Electricity Act, 2003
xiii) Income Tax Act 1961 and Indirect Tax Law
xiv) The Payment of Gratuity Act,1972
xv) Service tax
xvi) Value Added Tax Act, 2005
xvii) Water (Prevention & Control of Pollution) Act 1974 and rules there under
xviii) Air (Prevention & Control of Pollution) Act 1981 and rules there under
xix) Hazardous Wastes (Management, Handling and Transboundary Movement) Rules, 2008.
xx) Newspaper Publications
xxi) The Seed Act, 1996 and Seed (Control) Order 1983
xxii) Trade Mark Act 1999
2. We have also examined compliance with the applicable clauses of the Listing Agreements entered into by the Company with the BSE Limited, National Stock Exchange of India Limited.
3. We further report that the Company has, in my opinion, complied with the provisions of the Companies Act, 2013 and the Rules made under that Act as notified by Ministry of Corporate Affairs and the Memorandum and Articles of Association of the Company, with regard to:
Closure of the Register of Members.
Forms, returns, documents and resolutions required to be filed with the Registrar of Companies and the Central Government;
Service of documents by the Company on its Members, Auditors and the Registrar of Companies;
Adequate notice is given to all directors to schedule the Board Meetings, agenda and detailed notes on agenda were sent at least seven days in advance, and a system exists for seeking and obtaining further information and clarifications on the agenda items before the meeting and for meaningful participation at the meeting.
The Board of Directors of the Company is duly constituted with proper balance of Executive Directors, Non-Executive Directors and Independent Directors. The changes in the composition of the Board of Directors that took place during the period under review were carried out in compliance with the provisions of the Act;
Minutes of proceedings of General Meetings and of the Board and its Committee meetings;
Approvals of the Members, the Board of Directors, the Committees of Directors and the government authorities, wherever required;
Constitution of the Board of Directors / Committee(s) of Directors, appointment, retirement and reappointment of Directors including the Managing Director and Whole-time Directors;
Payment of remuneration to Directors including the Managing Director and Whole-time Directors,
Appointment and remuneration of Statutory Auditors;
uploading of details of unpaid and unclaimed dividends on the websites of the Company and the Ministry of Corporate Affairs;
Investment of the Company’s funds including investments and loans to others;
Annual Report 2016-17 65
Statutory reports 30-89
Financial statements 90-188
Company overview 01-29
Format of Balance Sheet and statement of profit and loss is as per Schedule III of the Companies Act 2013
Report of the Board of Directors;
The Directors have complied with the disclosure requirements in respect of their eligibility of appointment, their being independent and compliance with the Code of Business Conduct & Ethics for Directors and Management Personnel;
4. We further report that:
The Company has complied with the requirements under the Equity Listing Agreements entered into with BSE Limited, National Stock Exchange of India Limited;
The Securities and Exchange Board of India (Substantial Acquisition of Shares and Takeovers) (Amendment) Regulations, 2013; including the provisions with regard to disclosures and maintenance of records required under the said Regulations;
The Company has complied with the provisions of the Securities and Exchange Board of India(Prohibition of Insider Trading) Regulations, 1992 including the provisions with regard to disclosures and maintenance of records required under the said Regulations;
The Company has complied with the provisions of the Securities Contracts (Regulation) Act, 1956 and the Rules made under that Act, with regard to maintenance of minimum public shareholding.
There was no prosecution initiated and no fines or penalties were imposed during the year under review under the Companies Act, SEBI Act, SCRA, Depositories Act, Listing Agreement and Rules, Regulations and Guidelines framed under these Acts against / on the Company, its Directors and Officers.
5. We Further Report That:
The Company is paying wages to all employees as per the provisions of The Payment of Wages Act, 1936
The Company has obtained consent of Telangana State Pollution Control Board, as per the provision
of Water (Prevention & Control of Pollution) Act, 1974 and;
The Company is regular in paying all statutory dues like PF, ESI, Service tax, etc.
The company is regular in payment of gratuity as per the rules of the Payment of Gratuity Act, 1972 and has provided 100% provision in the books of accounts.
The company is regular in publishing Audited and Unaudited Financial Result.
The Company has renewed the Insurance Policy under Employees State Insurance Act,1948
The Company has renewed the Policy with LIC for Gratuity under Payment of Gratuity Act,1972
The Company Website is well acquainted with all statutory required information.
6. We further report that based on the information received and records maintained there are adequate systems and processes in the Company commensurate with the size and operations of the Company to monitor and ensure compliance with applicable laws, rules, regulations and guidelines.
7. We further Report that during the audit Period the Company has
No Public /Right/Preferential Issue of Shares/Debentures/Sweat Equity etc.,
No Redemption/Buy-back of Securities
No major Decision taken by the members in pursuance of Section 180 of the companies Act, 2013
No Merger/Amalgamation/Reconstruction, etc.,
No Foreign Technical Collaborations
Date: 24.05.2017 For L.D.Reddy & C o.,Place: Hyderabad Company Secretaries Sd/- L. Dhanamjay Reddy (Proprietor) CP. No.3752

66
Value Creation Through Transformation
Annexure – CReport on Corporate Social Responsibility (CSR) Policy and Activities as per Rule 8 of Companies (Corporate Social Responsibility Policy) Rules, 2014
1. A brief outline of the Company’s CSR Policy, including overview of projects or programmes proposed to be undertaken and a reference to the web-link to the CSR Policy and projects or programmes.
Promoting education, promoting preventive healthcare, eradicating hunger, poverty and malnutrition, making available safe drinking water, environmental sustainability, ecological balance and rural development etc.
The CSR policy has been placed on the company’s website at www.kaveriseeds.in
2. Composition of the CSR Committee Sri G.V.BhaskarRao, ChairmanSmt. G.Vanaja Devi, MemberSri M. Srikanth Reddy, Member
3. Average net profit of the Company for last three financial years Rs. 22,373.14 Lakhs4. Prescribed CSR expenditure 2% of the amount in item no. 3 above Rs. 447.46 Lakhs5. Details of CSR Spend for the financial year
(a) Unspent Amount at the beginning of the financial year: Rs. 393.24 Lakhs(b) Total amount spent during the financial year: Rs. 839.94 Lakhs(c) Amount unspent at the end of the year, if any: Rs. 0.76 Lakhs
Manner in which the amount spent during the financial year is detailed below:
Statement of CSR Expenditure for the Period 01.04.2016-31.03.2017
S. No CSR Project or activity identified
Sector in which the Project is Covered
Projects or programes (1) Local area or other (2) Specify the State and district where projects or programs was undertaken
Amount outlay
(budget) project or programs
wise
Amount spent on the projects
Sub heads: (1) Direct on projects or
programs (2) Overheads
Accumulative expenditure
upto the reporting period i. e March 31,
2017 I. Spent Through Kaveri Seed Company Limited (Direct)A. Education and Related Expenditure 11 Construction of School
Building Education GNPoor Village, Bheemdevarapally Mandal,
Warangal Urban District, Telangana4.00 3.41 162.12
2 Scholorships to the Students
Education GNPoor Village, Bheemdevarapally Mandal, Warangal Urban District, Telangana
6.00 4.50 4.50
3 Providing Books & School Bags to the Students
Education GNPoor Village, Bheemdevarapally Mandal, Warangal Urban District, Telangana
8.00 7.67 7.67
4 Providing Furniture to the School
Education GNPoor Village, Bheemdevarapally Mandal, Warangal Urban District, Telangana
5.00 3.97 52.38
5 Providing Computer Lab to the School
Education GNPoor Village, Bheemdevarapally Mandal, Warangal Urban District, Telangana
12.00 9.18 9.18
6 Providing New School Bus to the School
Education GNPoor Village, Bheemdevarapally Mandal, Warangal Urban District, Telangana
16.00 17.14 17.14
7 School Maintenance Expenses, Electricity Charges of School Building, Maintenance of School Canteen and Arranging Sports & Cultural activities of UPS & ZPHS Schools
Education GNPoor Village, Bheemdevarapally Mandal, Warangal Urban District, Telangana
5.00 2.98 2.98
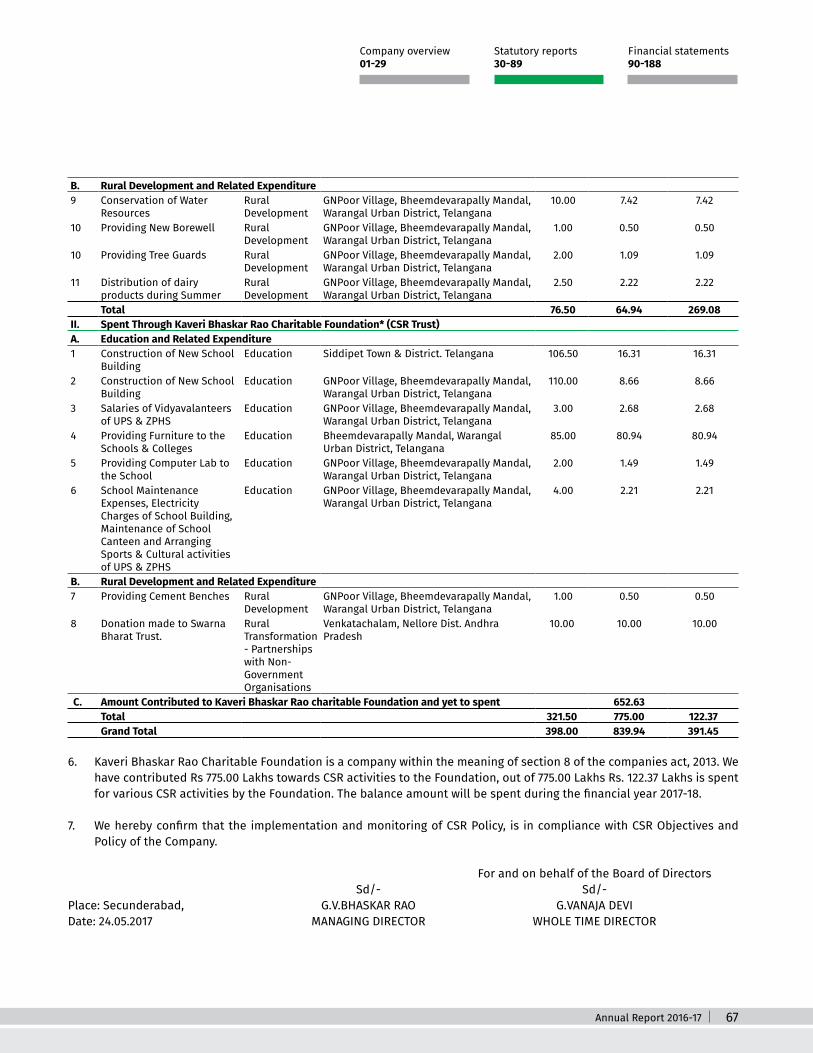
Annual Report 2016-17 67
Statutory reports 30-89
Financial statements 90-188
Company overview 01-29
B. Rural Development and Related Expenditure9 Conservation of Water
ResourcesRural Development
GNPoor Village, Bheemdevarapally Mandal, Warangal Urban District, Telangana
10.00 7.42 7.42
10 Providing New Borewell Rural Development
GNPoor Village, Bheemdevarapally Mandal, Warangal Urban District, Telangana
1.00 0.50 0.50
10 Providing Tree Guards Rural Development
GNPoor Village, Bheemdevarapally Mandal, Warangal Urban District, Telangana
2.00 1.09 1.09
11 Distribution of dairy products during Summer
Rural Development
GNPoor Village, Bheemdevarapally Mandal, Warangal Urban District, Telangana
2.50 2.22 2.22
Total 76.50 64.94 269.08 II. Spent Through Kaveri Bhaskar Rao Charitable Foundation* (CSR Trust)A. Education and Related Expenditure1 Construction of New School
Building Education Siddipet Town & District. Telangana 106.50 16.31 16.31
2 Construction of New School Building
Education GNPoor Village, Bheemdevarapally Mandal, Warangal Urban District, Telangana
110.00 8.66 8.66
3 Salaries of Vidyavalanteers of UPS & ZPHS
Education GNPoor Village, Bheemdevarapally Mandal, Warangal Urban District, Telangana
3.00 2.68 2.68
4 Providing Furniture to the Schools & Colleges
Education Bheemdevarapally Mandal, Warangal Urban District, Telangana
85.00 80.94 80.94
5 Providing Computer Lab to the School
Education GNPoor Village, Bheemdevarapally Mandal, Warangal Urban District, Telangana
2.00 1.49 1.49
6 School Maintenance Expenses, Electricity Charges of School Building, Maintenance of School Canteen and Arranging Sports & Cultural activities of UPS & ZPHS
Education GNPoor Village, Bheemdevarapally Mandal, Warangal Urban District, Telangana
4.00 2.21 2.21
B. Rural Development and Related Expenditure7 Providing Cement Benches Rural
DevelopmentGNPoor Village, Bheemdevarapally Mandal, Warangal Urban District, Telangana
1.00 0.50 0.50
8 Donation made to Swarna Bharat Trust.
Rural Transformation - Partnerships with Non- Government Organisations
Venkatachalam, Nellore Dist. Andhra Pradesh
10.00 10.00 10.00
C. Amount Contributed to Kaveri Bhaskar Rao charitable Foundation and yet to spent 652.63 Total 321.50 775.00 122.37 Grand Total 398.00 839.94 391.45
6. Kaveri Bhaskar Rao Charitable Foundation is a company within the meaning of section 8 of the companies act, 2013. We have contributed Rs 775.00 Lakhs towards CSR activities to the Foundation, out of 775.00 Lakhs Rs. 122.37 Lakhs is spent for various CSR activities by the Foundation. The balance amount will be spent during the financial year 2017-18.
7. We hereby confirm that the implementation and monitoring of CSR Policy, is in compliance with CSR Objectives and Policy of the Company.
For and on behalf of the Board of Directors Sd/- Sd/-Place: Secunderabad, G.V.BHASKAR RAO G.VANAJA DEVIDate: 24.05.2017 MANAGING DIRECTOR WHOLE TIME DIRECTOR

68
Value Creation Through Transformation
Annexure – DCONSERVATION OF ENERGY, TECHNOLOGY ABSORPTION, FOREIGN EXCHANGE EARNINGS AND OUTGO(Section 134(3)(m) of the Companies Act, 2013 read with Rule 8(3) of the Companies (Accounts) Rules, 2014 and forming part of Directors Report
(A) CONSERVATION OF ENERGY
(i) The steps taken or impact on conservation of energy - Nil The Company has taken adequate measures to conserve and reduce the energy consumption.
(ii) The steps taken by the company for utilizing alternate sources of energy - Nil
(iii) The capital investment on energy conservation equipments - Nil
(B) TECHNOLOGY ABSORPTION
(i) The efforts made towards technology absorption Technology/ Absorption is not involved as the processing of seeds is being developed in house by the company and
improvements in existing seed process systems.
(ii) The benefits derived like product improvement, cost reduction, product development or import substitution: Benefits derived as a result of the above efforts i.e., product development, cost reduction, research development
etc., the seed processing was simplified and mechanized and there by reduction in cost and product improvement. Continuous improvements in seed process mainly resulted in reduction of environmental loads and new
technologies brought in new business opportunities.
(iii) In case of imported technology (imported during the last three years reckoned from the beginning of the financial year): a) Technology imported - Nil b) Year of import - Nil c) Whether the technology been fully absorbed - NA d) If not fully absorbed, areas where absorption has not taken place, and the reasons thereof - NA
(iv) The expenditure incurred on Research and Development:
Rs. In Lakhs
Particulars 2016-17 2015-16
Capital 79.02 88.36Recurring 1166.36 1087.99Total 1245.38 1176.35Total R&D expenditure as percentage of total turnover 1.86% 1.39%
(C) FOREIGN EXCHANGE EARNINGS AND OUTGO: a) Earnings: Rs.1457.49 (994.18) Lakhs
b) Out go : Rs.136.66 (150.07) Lakhs
For and on behalf of the Board Sd/- Sd/-Secunderabad, G.V.BHASKAR RAO G.VANAJA DEVI24th May 2017 Managing Director Whole time Director
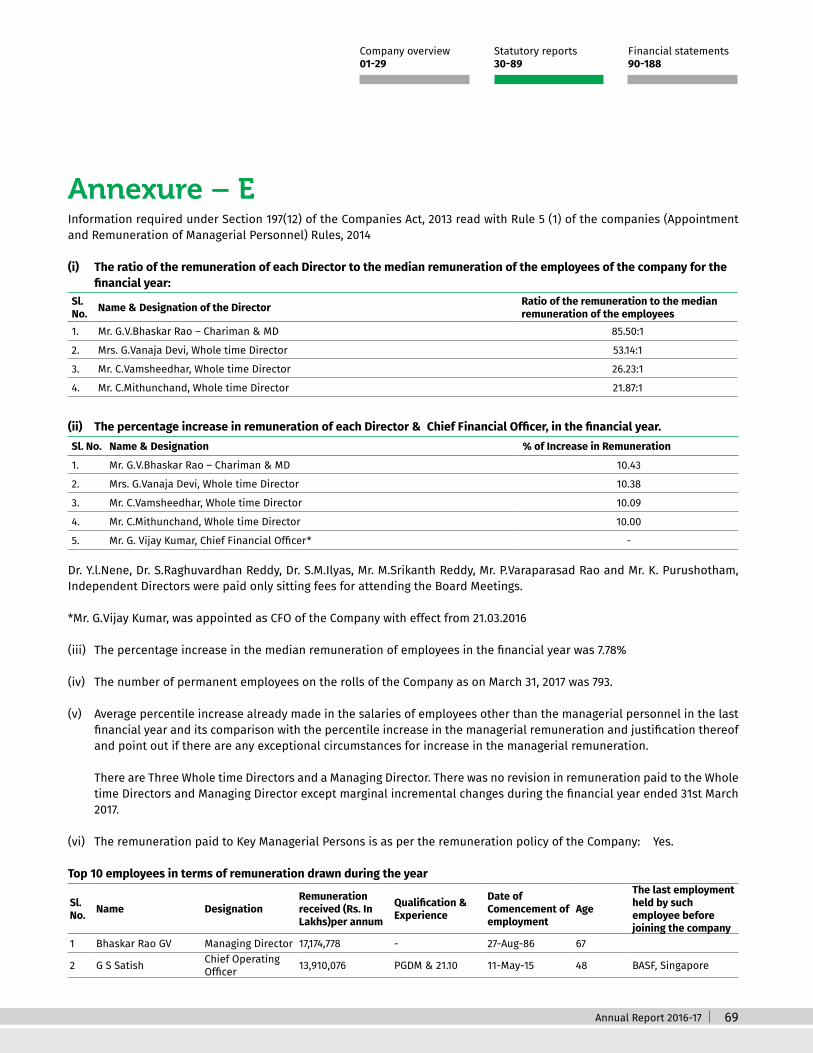
Annual Report 2016-17 69
Statutory reports 30-89
Financial statements 90-188
Company overview 01-29
Annexure – EInformation required under Section 197(12) of the Companies Act, 2013 read with Rule 5 (1) of the companies (Appointment and Remuneration of Managerial Personnel) Rules, 2014
(i) The ratio of the remuneration of each Director to the median remuneration of the employees of the company for the financial year:
Sl. No. Name & Designation of the Director Ratio of the remuneration to the median
remuneration of the employees1. Mr. G.V.Bhaskar Rao – Chariman & MD 85.50:1
2. Mrs. G.Vanaja Devi, Whole time Director 53.14:1
3. Mr. C.Vamsheedhar, Whole time Director 26.23:1
4. Mr. C.Mithunchand, Whole time Director 21.87:1
(ii) The percentage increase in remuneration of each Director & Chief Financial Officer, in the financial year.Sl. No. Name & Designation % of Increase in Remuneration
1. Mr. G.V.Bhaskar Rao – Chariman & MD 10.43
2. Mrs. G.Vanaja Devi, Whole time Director 10.38
3. Mr. C.Vamsheedhar, Whole time Director 10.09
4. Mr. C.Mithunchand, Whole time Director 10.00
5. Mr. G. Vijay Kumar, Chief Financial Officer* -
Dr. Y.l.Nene, Dr. S.Raghuvardhan Reddy, Dr. S.M.Ilyas, Mr. M.Srikanth Reddy, Mr. P.Varaparasad Rao and Mr. K. Purushotham, Independent Directors were paid only sitting fees for attending the Board Meetings.
*Mr. G.Vijay Kumar, was appointed as CFO of the Company with effect from 21.03.2016
(iii) The percentage increase in the median remuneration of employees in the financial year was 7.78%
(iv) The number of permanent employees on the rolls of the Company as on March 31, 2017 was 793.
(v) Average percentile increase already made in the salaries of employees other than the managerial personnel in the last financial year and its comparison with the percentile increase in the managerial remuneration and justification thereof and point out if there are any exceptional circumstances for increase in the managerial remuneration.
There are Three Whole time Directors and a Managing Director. There was no revision in remuneration paid to the Whole time Directors and Managing Director except marginal incremental changes during the financial year ended 31st March 2017.
(vi) The remuneration paid to Key Managerial Persons is as per the remuneration policy of the Company: Yes.
Top 10 employees in terms of remuneration drawn during the year
Sl. No. Name Designation
Remuneration received (Rs. In Lakhs)per annum
Qualification & Experience
Date of Comencement of employment
Age
The last employment held by such employee before joining the company
1 Bhaskar Rao GV Managing Director 17,174,778 - 27-Aug-86 67
2 G S Satish Chief Operating Officer 13,910,076 PGDM & 21.10 11-May-15 48 BASF, Singapore

70
Value Creation Through Transformation
Sl. No. Name Designation
Remuneration received (Rs. In Lakhs)per annum
Qualification & Experience
Date of Comencement of employment
Age
The last employment held by such employee before joining the company
3 Vanaja Devi G Director 10,675,494 - 27-Aug-86 64
4 Vijayasankara Nagesh Kumar Gudla
Chief Financial Officer 6,849,992 ICAI, ICWAI & 20.1 21-Mar-16 47 Pitti Lamination
Limited, Hyderabad5 Vamsheedhar C Executive Director 5,268,485 - 1-Apr-00 46
6 Vasudeva Rao K Head-Supply chain 5,350,080 M.Sc & 33 8-Jun-15 59 Syngenta India,
Hyderabad
7 Hari Singh Chauhan Head-Sales & Marketing 5,002,920 B.Sc(Horti) & 19 10-Feb-15 48 Savannah Seeds,
Hyderabad8 Chandrasekhar J General Manager 4,408,320 M.Sc (Ag) & 33 6-May-04 40 Tulasi Seeds, Guntur
9 Mithun Chand C Executive Director 4,393,071 - 15-Nov-06 41
10 Rajesh Varma Head-Sales & Marketing 3,500,004 B.Sc (Ag),AGMP
& 22 6-Feb-16 47 Nunhems Vegetable Seeds, Hyderabad
Employees drawing a remuneration of Rs.1.02 crore or above per annum
Sl. No.
Emp. ID No.
Employee Name Designation Head Quarter State Department
Remuneration received (Rs. In Lakhs)
Qualification & Experience
Date of Comencement of employment
Age
The last employment held by such employee before joining the company
1 100001 Bhaskar Rao GV
Managing Director Secunderabad Telangana Director 17,174,778 67
2 101398 G S SatishChief Operating Officer
Secunderabad Telangana HR&Admin. 13,910,016 PGDM & 21.10 11-May-15 48 BASF, Singapore
3 100002 Vanaja Devi G Director Secunderabad Telangana Director 10,675,494 64
Employed for part of the year with a average salary of Rs.8.5 Lakhs per month
Sl.No. Name DesignationRemuneration received (Rs. In lakhs)
Qualification & experience
Date of Commencement of employment
AgeThe last employment held by such employee before joining the Company
NIL
Note: 1. Gross remuneration includes salary, taxable allowances, value of perquisites as per the Income Tax Rules, 1962 and
company contribution to provident fund.
2. Nature of employment and duties: Contractual and in accordance with terms and conditions as per company’s rules.
3. No employee is a relative of any director or Key Managerial Personnel of the Company except Mr.G.V.Bhaskar Rao, who is relative of Smt. G.Vanaja Devi and Mr. C.Mithunchand who is relative of Mr. C.Vamsheedhar.
4. The percentage of equity shares held by each of the employee in the company within the meaning of clause (iii) of sub-rule (2) of Rule 5 is not applicable.
For and on behalf of the Board Sd/- Sd/-Secunderabad, G.V.BHASKAR RAO G.VANAJA DEVI24th May 2017 Managing Director Whole time Director

Annual Report 2016-17 71
Statutory reports 30-89
Financial statements 90-188
Company overview 01-29
Kaveri Seed Company Limited (www.kaveriseeds.in) headquartered at Secunderabad, Telangana, India, is one of India’s premier quality seed-producing companies. High yielding hybrid crops such as cotton, corn, paddy, bajra and sunflower are the major crops for which the company enjoys a strong leadership position in the seed production and marketing. The Company’s R&D activities are recognized by the Department of Scientific and Industrial Research (DSIR), Govt., of India. The main thrust of R&D is to blend traditional breeding with frontier technologies like Biotechnology to be on the forefront of developing new generation hybrids that excel in the home and markets abroad. The Company has built seven state-of-the-art processing facilities, spread over in the states of Telangana, Andhra Pradesh and Karnataka. A nationwide marketing and distribution network manned by technically competent and commercially skilled marketing team is an important asset of the company.
Section A : General Information about the Company1. Corporate Identity Number (CIN) of the Company LO1120AP1986PLC0067282. Name of the Company Kaveri Seed Company Limited3. Registered Office address #513-B, 5th Floor, Minerva Complex, S.D. Road, Secunderabad-500003,
Telangana, India4. Website www.kaveriseeds.in5. e-mail id [email protected]. Financial Year reported 1st April 2016 to 31st March 20177. Sector(s) that the Company is engaged in (industrial activity
code-wise)NIC code Description011 Seed production
8. List three key products/services that the Company manufactures/provides (as in balance sheet)
Produce the Cotton, Maize and Paddy
9. Total number of locations where business activity is undertaken by the Company
i. Number of International Locations Nil ii. Number of National Locations The Company has 9 processing and storage plants including R&D
Center10. Markets served by the Company – Local/State/National/
InternationalThe Company operations are mainly carried out from Hyderabad with manufacturing divisions in Pamulparthy Plant and exports its seed to Bangaladesh.
Section B: Financial details of the Company1. Paid up Capital (INR) Rs.1381.10 Lakhs2. Total Turnover (INR) Rs.66989.10 Lakhs on standalone basis3. Total profit after taxes (INR): Rs.7847.12 Lakhs on standalone basis4. Total Spending on Corporate Social Responsibility (CSR) as
percentage of profit after tax (%):CSR spent during the financial year 2016-17 was Rs.839.94 Lakhs(10.70% of standalone profit after tax)
5. List the activities in which expenditure in 4 above has been incurred.
EducationRural DevelopmentSupport to charitable for social causes
Business Responsibility Report(As per Regulation 34 (2) (f) of the SEBI (Listing Obligations and Disclosure Requirements) Regulations, 2015)
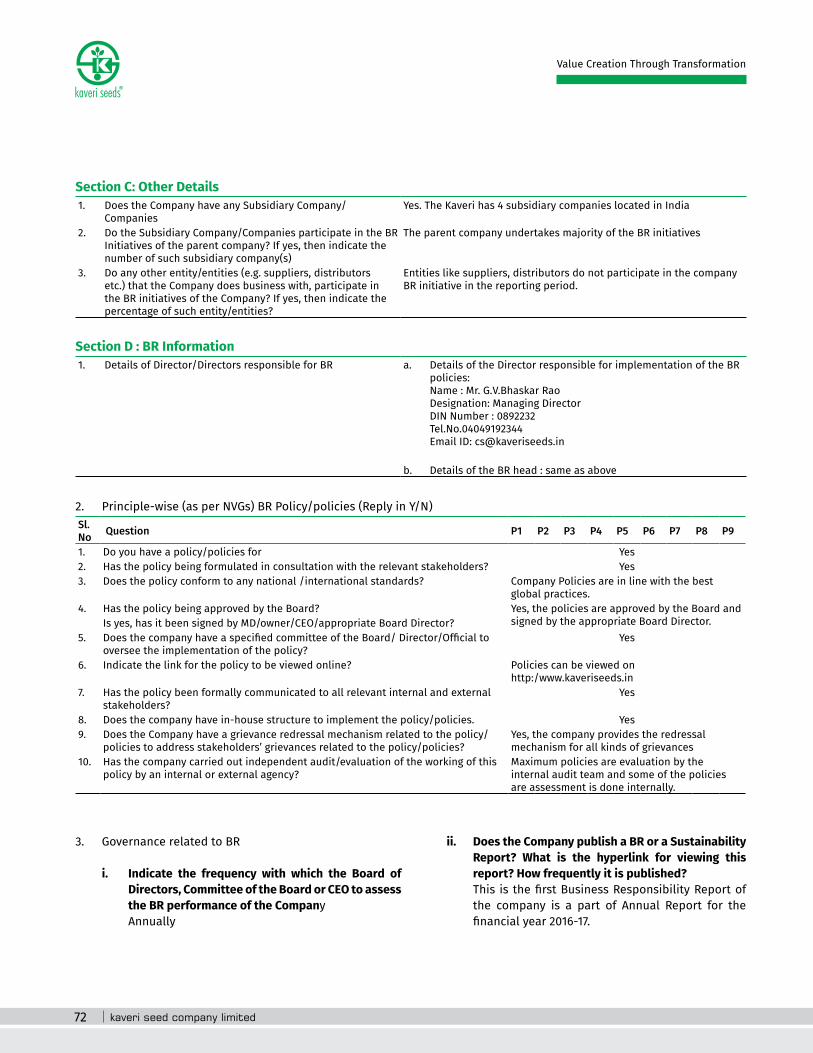
72
Value Creation Through Transformation
Section C: Other Details1. Does the Company have any Subsidiary Company/
CompaniesYes. The Kaveri has 4 subsidiary companies located in India
2. Do the Subsidiary Company/Companies participate in the BR Initiatives of the parent company? If yes, then indicate the number of such subsidiary company(s)
The parent company undertakes majority of the BR initiatives
3. Do any other entity/entities (e.g. suppliers, distributors etc.) that the Company does business with, participate in the BR initiatives of the Company? If yes, then indicate the percentage of such entity/entities?
Entities like suppliers, distributors do not participate in the company BR initiative in the reporting period.
Section D : BR Information1. Details of Director/Directors responsible for BR a. Details of the Director responsible for implementation of the BR
policies: Name : Mr. G.V.Bhaskar Rao Designation: Managing Director DIN Number : 0892232 Tel.No.04049192344 Email ID: [email protected]
b. Details of the BR head : same as above
2. Principle-wise (as per NVGs) BR Policy/policies (Reply in Y/N)Sl. No Question P1 P2 P3 P4 P5 P6 P7 P8 P9
1. Do you have a policy/policies for Yes2. Has the policy being formulated in consultation with the relevant stakeholders? Yes3. Does the policy conform to any national /international standards? Company Policies are in line with the best
global practices.4. Has the policy being approved by the Board? Yes, the policies are approved by the Board and
signed by the appropriate Board Director.Is yes, has it been signed by MD/owner/CEO/appropriate Board Director? 5. Does the company have a specified committee of the Board/ Director/Official to
oversee the implementation of the policy? Yes
6. Indicate the link for the policy to be viewed online? Policies can be viewed on http:/www.kaveriseeds.in
7. Has the policy been formally communicated to all relevant internal and external stakeholders?
Yes
8. Does the company have in-house structure to implement the policy/policies. Yes9. Does the Company have a grievance redressal mechanism related to the policy/
policies to address stakeholders’ grievances related to the policy/policies?Yes, the company provides the redressal mechanism for all kinds of grievances
10. Has the company carried out independent audit/evaluation of the working of this policy by an internal or external agency?
Maximum policies are evaluation by the internal audit team and some of the policies are assessment is done internally.
3. Governance related to BR
i. Indicate the frequency with which the Board of Directors, Committee of the Board or CEO to assess the BR performance of the Company
Annually
ii. Does the Company publish a BR or a Sustainability Report? What is the hyperlink for viewing this report? How frequently it is published?
This is the first Business Responsibility Report of the company is a part of Annual Report for the financial year 2016-17.

Annual Report 2016-17 73
Statutory reports 30-89
Financial statements 90-188
Company overview 01-29
Section E: Principle-Wise PerformancePrinciple 1 - Ethics1. Does the policy relating to ethics, bribery and
corruption cover only the Company? Does it extend to the Group/Joint Ventures/Suppliers/
Contractors/NGOs/Others?
The Company is committed to build a strong ethical organization. As a result, the Company has adopted a Code of Conduct policy which is applicable to all the employees of the Company including the board members. The policy lays emphasis on the honesty, integrity and ethical conduct of the employees and has been communicated to the employees, across all the locations.
2. How many stakeholder complaints have been received in the past financial year and what percentage was satisfactorily resolved by the management?
We did not receive any significant stakeholder complaints during the financial year
Principle 2 - Product Life Cycle Sustainability.1. List up to 3 of your products or services whose design
has incorporated social or environmental concerns, risks and/or opportunities.
i. Kaveri plant operations team has installed & commissioned 30 mechanical conveyers to replace manual hand grading of delinted processed seed to enhance recovery & the per day output of the ready-to-pack cotton seed.
ii. A centralized & dedicated stores warehouse was created for non-seed inventory ( primary & secondary packing material & seed treatment chemicals ) which helped in systematic stacking of the products, proper tagging of the stacked products & correct physical verification of the inventory on periodical basis.
iii. Provided field safety shoes to entire field production team to mitigate the risk of foot injuries & snake bites during the course of their regular production field visits.
iv. Provided cost-free plant protection chemical ( Cobalt Chloride ) to several hundreds of cotton seed farmers to ward-off the leaf reddening impact caused by physiological disorders influenced by the adverse climatic conditions.
2. For each such product, provide the following details in respect of resource use (energy, water, raw material etc.) per unit of product (optional):
i. Reduction during sourcing/production/ distribution achieved since the previous year throughout the value chain?
Reduction of manpower requirement by about 40% in mechanical grading of the delinted processed cotton seed & time reduction in terms of making seed available for timely blending, treating & packing.
ii. Reduction during usage by consumers (energy, water) has been achieved since the previous year?
Market sales return quantities were reduced by about 25 % over previous year through efficient liquidation tracking procedures.
Reduced un-dispatched packed finished goods volume from over 2000 tons to 700 tons through improved sales forecast planning, regular tracking of indents vs. dispatches & focused logistics.
3. Does the company have procedures in place for sustainable sourcing (including transportation) ?
We, as an organization, have made persistent efforts to retain our sourced seed suppliers by ensuring their continuous engagement in two seasons of seed production & by providing multiple crop seed production opportunities in multiple geographies. Resultantly, the grower base retention & loyalty, production reliability & sustainability have been ensured.
Similar procedural efforts were made with respect to sourcing non-seed products from our reliable repeated vendors at a reasonable cost, high quality & timely supply.
4. Has the company taken any steps to procure goods and services from local & small producers, including communities surrounding their place of work?
The company introduced direct grower procurement model in the proximity of our seed conditioning & drying facilities to effectively engage the small land holders & the neighborhood farming societies to produce quality seed for us. This initiative of ours has yielded in complete retention of these small land holders bringing hundreds of acres under seed production & we becoming their continued & most preferred seed company.

74
Value Creation Through Transformation
5. Does the company have a mechanism to recycle products and waste? Also, provide details thereof,
The company has established systems to recycle a) the seed treated chemical wash water back in to the treatment process which helps overcome hazardous waste disposal challenges, b) the maize shanks generated following dry cob shelling, back in to the heat generation process that helps heat up air to a desired critical temperature to dry the harvested wet cobs delivered from the production field , minimizing the energy source requirements & c) the used chemical containers to minimize the chemical waste and help protect the environment around.
Principle 3 - Employee well being1. Please indicate the Total number of employees. The company has 793 employees as on 31.03.2017
2. Please indicate the Total number of employees hired on temporary/ contractual/casual basis.
The company has 400 contractual employees as on 31.03.2017
3. Please indicate the Number of permanent women employees.
The company has 32 women employees as on 31.03.2017
4. Please indicate the Number of permanent employees with disabilities
Nil
5. Do you have an employee association that is recognized by management.
Nil
6. What percentage of your permanent employees is members of this recognized employee association?
Not Applicable
7. Please indicate the Number of complaints relating to child labour, forced labour, involuntary labour, sexual harassment in the last financial year and pending, as on the end of the financial year.
S.No. Category No of complaints filed during the financial year
No of complaints pending as on end of the financial year
Child labour/forced labour/involuntary labour
Nil Nil Nil
Sexual harassment Nil Nil NilDiscriminatory employment
Nil Nil Nil
8. What percentage of your under mentioned employees were given safety & skill up-gradation training in the last year?
Permanent employees: Employee training is a continuous process in the organization and all the employees are given mandatory safety training at the time of joining the organization. Further, there is continuous skill based trainings imparted to over 70% of our employees.
Permanent women employees: No separate record is maintained.
Casual/temporary/contractual employees: All our contractual employees are imparted with trainings.
Employees with disabilities: -NA-
Principle 4 - Stakeholders Engagement1. Has the company mapped its internal and external
stakeholders? Yes
2. Out of the above, has the company identified the disadvantaged, vulnerable & marginalized stakeholders?
Yes
3. Are there any special initiatives taken by the company to engage with the disadvantaged, vulnerable and marginalized stakeholders?
The Company believes in greater engagement with its stakeholders and being sensitive towards their needs and expectations. This is one of the corporate values that focuses on being responsive, listening to stakeholders, being proactive and transparent.
The Company has a whistle blower policy that provides support to employees, channel partners and vendors to report significant deviations from key management policies and report any noncompliance and wrong practices. The Company also has an investor grievance cell where the investors can raise their concerns and are resolved appropriately.
Principle 5 - Human Rights1. Does the policy of the company on human rights
cover only the company or extend to the Group/Joint Ventures/Suppliers/Contractors/NGOs/Others?
The policy covers the employees of the company

Annual Report 2016-17 75
Statutory reports 30-89
Financial statements 90-188
Company overview 01-29
2. How many stakeholder complaints have been received in the past financial year and what percent was satisfactorily resolved by the management?
Non was received
Principle 6 - Environment1. Does the policy related to Principle 6 cover only the
company or extends to the Group/Joint Ventures/Suppliers/Contractors/NGOs/others.
The company is committed to operate all its plants in an environmentally friendly manner while protecting health and safety of its employees..
2. Does the company have strategies/ initiatives to address global environmental issues such as climate change, global warming, etc?
Nil
3. Does the company identify and assess potential environmental risks?
Yes
4. Does the company have any project related to Clean Development Mechanism?
At present the company does not have any project related to clean development mechanism.
5. Has the company undertaken any other initiatives on – clean technology, energy efficiency, renewable energy, etc.
No
6. Are the Emissions/Waste generated by the company within the permissible limits given by CPCB/SPCB for the financial year being reported?
Yes, all the processing plants comply with the prescribed permissible limits for air emissions, effluent quality and discharge, solid and hazard waste generation and disposal as per their regulatory authorities.
No pending notices as on 31.03.2017
Principle 7 - Policy Advocacy1. Is your company a member of any trade and chamber
or association? If Yes, Name only those major ones that your business deals with:
The Company is associated with various trade organizations, chambers etc., as follows:
The Company is a member of various trade bodies and chamber associations in India such as,
1. Seed men Association 2. Confederation of Indian Industry 3. The Federation TG and AP Chambers of Commerce
& Industry (FAPCCI) 4. National Seed Association of India 5. The Asia & Pacific Seed of Association, Bangkok 6. Seed Association of Madhya Pradesh 7. Seed Association of Maharashtra
2. Have you advocated/lobbied through above associations for the advancement or improvement of public good?
Yes, we do from time to time take up issues through the associations on matter of public interest.
Principle 8 - Community Development (CSR)1. Does the company have specified programmes/
initiatives/projects in pursuit of the policy related to Principle 8? If yes details thereof.
Kaveri Seed Company Limited is committed to continuously improving its social responsibilities, environment and economic practices to make positive impact on the society. The CSR Policy focuses on addressing critical social, environmental and economic needs of the marginalized/underprivileged/downtrodden sections of the society.
2. Are the programmes/projects undertaken through in-house team/own foundation/external NGO/government structures/any other organization?
Kaveri Seed Company Limited has a team for the implementation and monitoring of various CSR projects. Wherever required services of external agencies will be utilized based on project requirement. Further, the Company has established a Foundation viz. Kaveri Bhaskar Rao Charitable Foundation primarily for undertaking CSR activities. The company has started CSR activities under the said Foundation. For, projects in villages, the Company engages persons/representatives from Villages/Gram Sabah’s / Ward members. This helps in achieving the target as well as participation of the local representatives in formulating the various activities to obtain maximum benefit by community.
3. Have you done any impact assessment of your initiative?
We review our projects time to time. Each project has specific deliverables to be met.
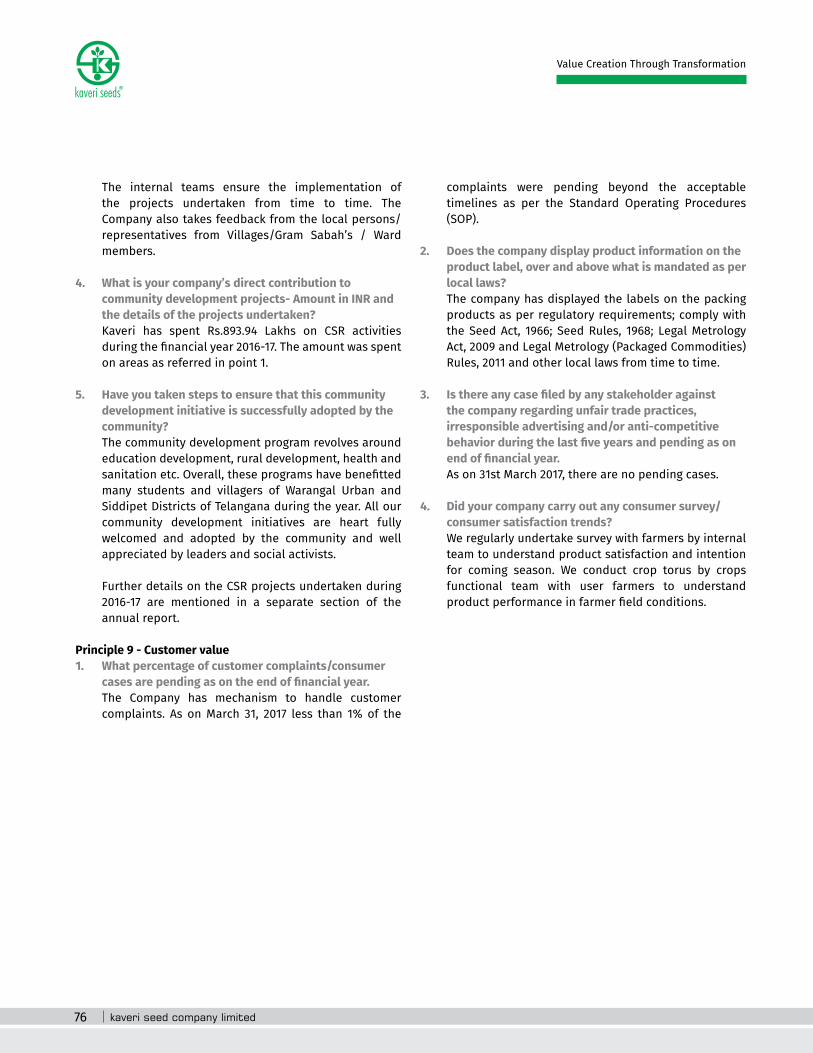
76
Value Creation Through Transformation
The internal teams ensure the implementation of the projects undertaken from time to time. The Company also takes feedback from the local persons/representatives from Villages/Gram Sabah’s / Ward members.
4. What is your company’s direct contribution to community development projects- Amount in INR and the details of the projects undertaken?
Kaveri has spent Rs.893.94 Lakhs on CSR activities during the financial year 2016-17. The amount was spent on areas as referred in point 1.
5. Have you taken steps to ensure that this community development initiative is successfully adopted by the community?
The community development program revolves around education development, rural development, health and sanitation etc. Overall, these programs have benefitted many students and villagers of Warangal Urban and Siddipet Districts of Telangana during the year. All our community development initiatives are heart fully welcomed and adopted by the community and well appreciated by leaders and social activists.
Further details on the CSR projects undertaken during 2016-17 are mentioned in a separate section of the annual report.
Principle 9 - Customer value1. What percentage of customer complaints/consumer
cases are pending as on the end of financial year. The Company has mechanism to handle customer
complaints. As on March 31, 2017 less than 1% of the
complaints were pending beyond the acceptable timelines as per the Standard Operating Procedures (SOP).
2. Does the company display product information on the product label, over and above what is mandated as per local laws?
The company has displayed the labels on the packing products as per regulatory requirements; comply with the Seed Act, 1966; Seed Rules, 1968; Legal Metrology Act, 2009 and Legal Metrology (Packaged Commodities) Rules, 2011 and other local laws from time to time.
3. Is there any case filed by any stakeholder against the company regarding unfair trade practices, irresponsible advertising and/or anti-competitive behavior during the last five years and pending as on end of financial year.
As on 31st March 2017, there are no pending cases.
4. Did your company carry out any consumer survey/ consumer satisfaction trends?
We regularly undertake survey with farmers by internal team to understand product satisfaction and intention for coming season. We conduct crop torus by crops functional team with user farmers to understand product performance in farmer field conditions.
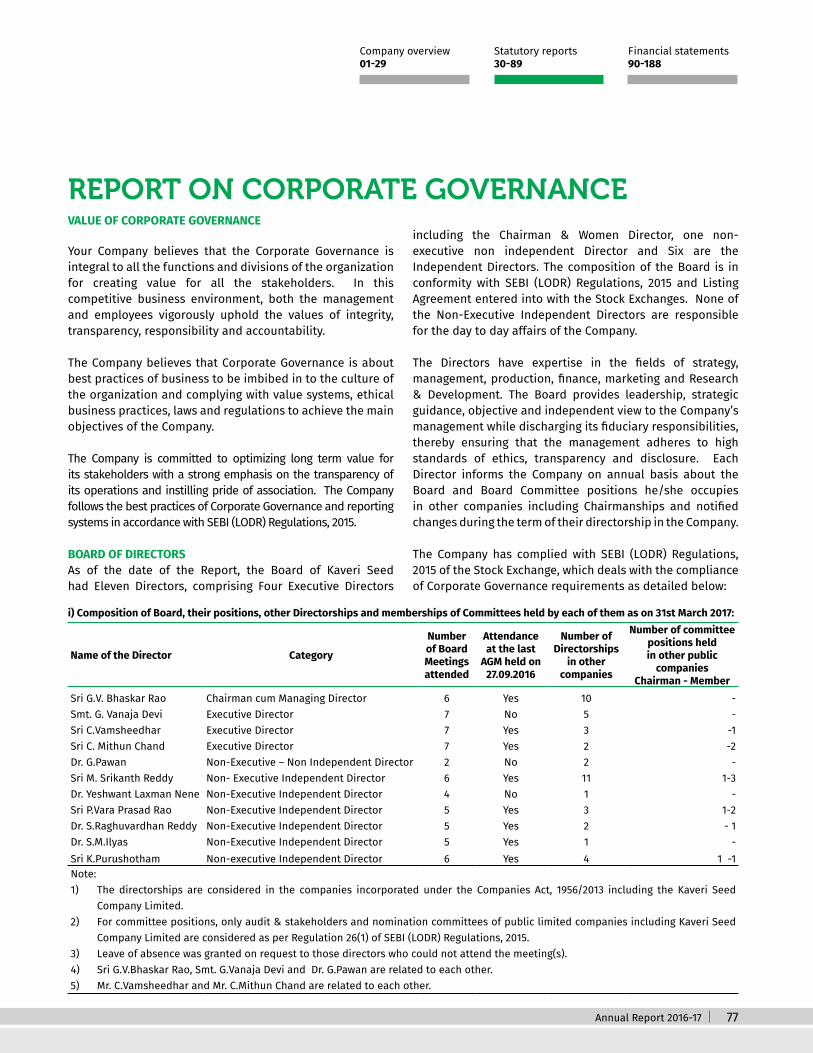
Annual Report 2016-17 77
Statutory reports 30-89
Financial statements 90-188
Company overview 01-29
REPORT ON CORPORATE GOVERNANCEVALUE OF CORPORATE GOVERNANCE
Your Company believes that the Corporate Governance is integral to all the functions and divisions of the organization for creating value for all the stakeholders. In this competitive business environment, both the management and employees vigorously uphold the values of integrity, transparency, responsibility and accountability.
The Company believes that Corporate Governance is about best practices of business to be imbibed in to the culture of the organization and complying with value systems, ethical business practices, laws and regulations to achieve the main objectives of the Company.
The Company is committed to optimizing long term value for its stakeholders with a strong emphasis on the transparency of its operations and instilling pride of association. The Company follows the best practices of Corporate Governance and reporting systems in accordance with SEBI (LODR) Regulations, 2015.
BOARD OF DIRECTORSAs of the date of the Report, the Board of Kaveri Seed had Eleven Directors, comprising Four Executive Directors
including the Chairman & Women Director, one non-executive non independent Director and Six are the Independent Directors. The composition of the Board is in conformity with SEBI (LODR) Regulations, 2015 and Listing Agreement entered into with the Stock Exchanges. None of the Non-Executive Independent Directors are responsible for the day to day affairs of the Company.
The Directors have expertise in the fields of strategy, management, production, finance, marketing and Research & Development. The Board provides leadership, strategic guidance, objective and independent view to the Company’s management while discharging its fiduciary responsibilities, thereby ensuring that the management adheres to high standards of ethics, transparency and disclosure. Each Director informs the Company on annual basis about the Board and Board Committee positions he/she occupies in other companies including Chairmanships and notified changes during the term of their directorship in the Company.
The Company has complied with SEBI (LODR) Regulations, 2015 of the Stock Exchange, which deals with the compliance of Corporate Governance requirements as detailed below:
i) Composition of Board, their positions, other Directorships and memberships of Committees held by each of them as on 31st March 2017:
Name of the Director Category
Number of Board Meetings attended
Attendance at the last
AGM held on 27.09.2016
Number of Directorships
in other companies
Number of committee positions held in other public
companiesChairman - Member
Sri G.V. Bhaskar Rao Chairman cum Managing Director 6 Yes 10 -Smt. G. Vanaja Devi Executive Director 7 No 5 -Sri C.Vamsheedhar Executive Director 7 Yes 3 -1Sri C. Mithun Chand Executive Director 7 Yes 2 -2Dr. G.Pawan Non-Executive – Non Independent Director 2 No 2 -Sri M. Srikanth Reddy Non- Executive Independent Director 6 Yes 11 1-3Dr. Yeshwant Laxman Nene Non-Executive Independent Director 4 No 1 -Sri P.Vara Prasad Rao Non-Executive Independent Director 5 Yes 3 1-2Dr. S.Raghuvardhan Reddy Non-Executive Independent Director 5 Yes 2 - 1Dr. S.M.Ilyas Non-Executive Independent Director 5 Yes 1 -Sri K.Purushotham Non-executive Independent Director 6 Yes 4 1 -1Note: 1) The directorships are considered in the companies incorporated under the Companies Act, 1956/2013 including the Kaveri Seed
Company Limited.2) For committee positions, only audit & stakeholders and nomination committees of public limited companies including Kaveri Seed
Company Limited are considered as per Regulation 26(1) of SEBI (LODR) Regulations, 2015.3) Leave of absence was granted on request to those directors who could not attend the meeting(s).4) Sri G.V.Bhaskar Rao, Smt. G.Vanaja Devi and Dr. G.Pawan are related to each other. 5) Mr. C.Vamsheedhar and Mr. C.Mithun Chand are related to each other.

78
Value Creation Through Transformation
None of the Directors on the Board is a member in more than ten committees and they do not act as Chairman of more than five committees across all companies in which they are Directors.
The Board meets at regular intervals to discuss and decide on company/ business policy and strategy apart from other Board business. However, in case of special and urgent business need, the Board’s approval is taken by passing resolution by circulation, as permitted by law, which is confirmed in the subsequent Board meeting. The Chairman & Managing Director is assisted by the Executive Director/Senior Managerial Personnel in overseeing the functional matters of the Company.
Details of Director(s) reappointment by retirement by rotation: Mr. C. Vamsheedhar, retire by rotation and being eligible offer himself for re-appointment as Director of the Company:
Mr. C.Vamsheedhar aged about 45 years is a Graduate. He is experienced in marketing and advises in general management of the company. He has been associated with our Company for the past eleven years. He has been instrumental in the exceptional growth of sale and marketing of the company. He looks after overall the marketing and product development & quality management of the company. He is a director on the Board of subsidiaries of Aditya Agri Teck Private Limited and Genome Agritech Private Limited and he holds 10,99,320 Equity Shares of Rs.2/- each of the Company. He is related to Mr. C. Mithunchand, Whole time Director of the Company.
ii) Board Committees:
The Board has constituted Six Standing committees, namely Audit Committee, Borrowing Committee, Stakeholders Relationship Committee, Nomination and Remuneration Committee, Corporate Social Responsibility Committee and Risk Management Committee. The Board constitutes additional functional committees, from time to time, depending on the business needs.
iii) Meetings of the Board:
The Board of Directors must meet at least four time a year, with a maximum time gap of four months between two Board meetings. Dates for the Board Meetings in the ensuring quarter are decided well in advance and communicated to the Directors. Notices of Board Meetings were sent to the Directors as required under Section 173 of the Companies Act, 2013 well in advance. The Agenda along with the explanatory notes are sent in advance to the Directors. In special and exceptional circumstances, additional or supplementary
items(s) on the agenda are permitted. Additional meetings of the Board are held when deemed necessary to address the specific needs of the Company. The Company’s Board met Seven times during the financial year under review on 10th May 2016, 14th July 2016, 14th September 2016, 13th December 2016, 9th January 2017, 31st January 2017 and 27th March 2017.
Details of Directors and their attendance in Board Meetings are given under:
Date of Meeting Board Strength No. of Directors Present
10.05.2016 11 914.07.2016 11 414.09.2016 11 1013.12.2016 11 909.01.2017 11 831.01.2017 11 1027.03.2017 11 10
iv) Information given to the Board:
The Company provides the following information to the Board and the Board Committees as and when required. Such information is submitted either as part of the agenda papers in advance of the meetings or discussion material during the meetings.
• Annual operating plans and budgets, capital budgets, updates and all variances;
• Quarterly, half yearly and annual results of the Company and its business segments;
• Minutes of meetings of Audit Committee and other committees;
• Information on recruitment and remuneration of key executive below the Board level;
• Contracts in which Director(s) are deemed to be interested;
• Significant labour problems and their proposed solutions;
• Materially relevant default in financial obligations to and by the Company or substantial non-payment for goods sold by the Company;
• Non-compliance of any regulatory or statutory nature

Annual Report 2016-17 79
Statutory reports 30-89
Financial statements 90-188
Company overview 01-29
or listing requirements as well as shareholder services such as shareholder’s grievances and transfers etc.,
• Materially important show cause, demand, prosecution and penalty notices.
• Fatal or serious accidents or dangerous occurrences;
• Significant development in the human resources and industrial relations fronts.
The Secretarial Department, while preparing the agenda, notes on agenda and minutes of the meeting(s), is responsible for and is required to ensure adherence to all applicable laws and regulations, including the Companies Act, 2013 read with rules issued there under, as applicable and the Secretarial Standards recommended by the Institute of Company Secretaries of India. The company Secretary record minutes of proceedings of each Board and Committee meeting. Draft minutes are circulated to Board/Board committee members for their comments. The minutes are entered in the minutes book within 30 days from the conclusion of the meeting. The Company Secretary/Manager of Secretarial department attends all the meetings of the Board and its Committees, advises/assures the Board on compliance and governance principles and ensures appropriate recording of minutes of the meetings.
v) Details about familiarization program
Senior management personnel of the Company make presentations to the Board Members on periodical basis, briefing them on the operations of the Company, plans, strategy, risks involved, new initiatives etc., and seek their opinions and suggestions on the same. Also, the Directors are briefed on their specific responsibilities and duties that may arise from time to time. Any new Director who joins the Board is presented with a brief background of the Company, its operations and is informed of the important policies of the Company including the Code of Conduct for Directors and senior management personnel and the Code of Conduct for Prevention of Insider Trading, Policy on Related Party Transactions, Policy on Remuneration, Policy on Material Subsidiaries, Whistle Blower Policy, Corporate Social Responsibility Policy etc.,
The details of the familiarization program are placed on the Company’s website at: http://www.kaveriseeds.in
AUDIT COMMITTEE:The management is responsible for the Company’s internal controls and the financial reporting process while the statutory
auditors are responsible for performing independent audits of the Company’s Financial Statements in accordance with generally accepted auditing practices and for issuing reports based on such audits. The Board of Directors has entrusted the Audit Committee to supervise these process and thus ensure accurate and timely disclosures that maintain the transparency, integrity and quality of financial control and reporting. The composition, procedures, powers and role/functions of the Audit Committee constituted by the Company comply with the requirements of Regulation 18 of the SEBI (LODR) Regulations, 2015.
The primary objective is to monitor and provide effective supervision of the management’s financial reporting process with a view to ensure accurate timely and proper disclosures and transparency integrity and quality financial reporting.
i) Role of Audit Committee:
• Overseeing the Company’s financial reporting process and disclosure of financial information to ensure that the financial statement is correct, sufficient and credible information is disclosed.
• Recommendation for appointment, remuneration and terms of appointment of auditors of the company;
• Approval of payment to statutory auditors for any other services rendered by the statutory auditors;
• Review, with the management, the annual financial statements and auditor’s report thereon before submission to the board for approval, with particular reference to;
• Matters required to be included in the Director’s Responsibility Statement to be included in the Board’s report in terms of clause (c) of sub-section 3 of Section 134 of the Companies Act, 2013;
• Changes, if any, in accounting policies and practices and reasons for the same;
• Major accounting entries involving estimates based on the exercise of judgment by management;
• Significant adjustments made in the financial statements arising out of audit findings;
• Compliance with listing and other legal requirements relating to financial statements;
80
Value Creation Through Transformation
• Disclosure of any related party transactions;
• Modified Opinion(s) the draft audit report;
• Review, with the management, the quarterly financial statements before submission to the Board for approval;
• Review, with the management, the statement of uses/application of funds raised through an issue (public issue, rights issue, preferential issue, etc.), the statement of funds utilized for purposes other than those stated in the offer document/prospectus/notice and the report submitted by the monitoring agency monitoring the utilization of proceeds of a public or rights issue, and making appropriate recommendations to the Board to take up steps in this matter;
• Review and monitor the auditor’s independence and performance, and effectiveness of audit process;
• Approval or any subsequent modification of transactions of the company with related parties;
• Scrutiny of inter-corporate loans and investments;
• Valuation of undertakings or assets of the company, wherever it is necessary;
• Evaluation of internal financial controls and risk management systems;
• Review, with the management, performance of statutory and internal auditors, adequacy of the internal financial control systems;
• Review the adequacy of internal audit function, if any, including the structure of the internal audit department, staffing and seniority of the official heading the department, reporting structure coverage and frequency of internal audit;
• Discussion with internal auditors of any significant findings and follow up there on;
• Review the findings of any internal investigations by the internal auditors into matters where there is suspected fraud or irregularity or a failure of internal control systems of a material nature and reporting the matter to the board;
• Discussion with statutory auditors before the audit commences, about the nature and scope of audit as well as post-audit discussion to ascertain any area of concern;
• Examine into the reasons for substantial defaults in the payment to the depositors, debenture holders, shareholders (in case of non-payment of declared dividends) and creditors;
• Review the functioning of the Whistle Blower mechanism;
• Approval of appointment of Chief Financial Officer after assessing the qualifications, experience and background etc., of the Candidate.
• Carry out any other function as is mentioned in the terms of reference of the Audit Committee under the Listing Agreement and Companies Act, 2013.
ii) Composition and other details of Audit Committee
The Audit Committee comprises of four members, out of four, three members are Independent Non - Executive Directors.
Mr. K. Purushotham, Chairman of Audit Committee, is a Non-Executive, Independent Director having expertise in accounting and financial management. Mr. M. Srikanth Reddy, Mr. P. Varaprasad Rao and Mr. C. Mithun Chand are the members of the Committee.
The Audit Committee Meetings are usually held at the Registered Office of the Company and are usually attended by the Independent Directors, one Executive Director, Chief Financial Officer, Statutory Auditors and Internal Auditor of the Company. The Company Secretary acts as Secretary of the Audit Committee.
The heads of departments of Finance & Accounts, Internal Auditor and the Statutory Auditors are the permanent invitees to the Audit Committee.
During the year under report the Audit Committee has met five times on 10th May 2016, 14th July 2016, 14th September, 2016, 13th December 2016 and 31st January 2017.
The attendance at the Audit Committee meetings during the financial year 2016-17 is as under:

Annual Report 2016-17 81
Statutory reports 30-89
Financial statements 90-188
Company overview 01-29
Member No. of Meetings AttendanceMr. K. Purushotham 5 5Mr. P. Varaprasad Rao 5 4Mr. M. Srikanth Reddy 5 5Mr. C. Mithun Chand 5 5
NOMINATION AND REMUNERATION COMMITTEE/COMPENSATION COMMITTEE:The Committee specifically looks into the remuneration payable to Executive Directors, Key Managerial Personnel (KMP) of the Company.
Identifying persons who are qualified to become directors and who may be appointed in senior management in accordance with the criteria laid down and recommend to the Board their appointment and removal;
Carry out evaluation of every director’s performance;
Formulation of the criteria for determining qualifications, positive attributes and independence of a director; and recommend to the Board a policy, relating to the remuneration for the directors, key managerial personnel and other employees;
Formulation of the criteria for evaluation of Independent Directors and the Board;
Devising a policy on Board diversity;
To grant, issue and allot of options to eligible employees and administering the employee stock option scheme from time to time.
Any other matter as the Board may decide from time to time.
The composition of the Nomination and Remuneration/Compensation Committee comprises of three Non-Executive Independent Directors and two members. The Chairman of the Committee is a Non-Executive Independent Director.
Mr. P. Varaprasad Rao, Chairman of the Committee and Mr. M. Srikanth Reddy and Dr. S.Raghuvardhan Reddy are the members of the Committee. During the year, the Nomination and Remuneration/ Compensation Committee met two times.
The attendance at the Nomination and Remuneration/Compensation Committee meetings during the financial year 2016-17 is as under:
Member No. of Meetings AttendanceMr. P. Varaprasad Rao 2 2Mr. M. Srikanth Reddy 2 2*Dr. S.Raghuvardhan Reddy 2 1#Mr. C.Vamsheedhar 2 1#Mr. K. Purushotham* 2 1* Dr. S.Raghuvardhan Reddy was appointed as member with effect from 14.09.2016. He attended one meeting after his appointment.# Mr. C.Vamsheedhar and Mr. K. Purushotham are ceased to be a member with effect from 14.09.2016. Hence, they are attended one meeting during their tenure.
i) Remuneration Policy:
The remuneration committee of Board of Directors of the Company generally decides and makes recommendations to the Board of Directors about the remuneration to be paid to the Directors and other Key Managerial Persons of the Company. The remuneration recommendations about the remuneration of Directors are subject to the approval of the Members of the company and the remuneration of the Key Managerial Persons is to be recommended by the remuneration committee to the Board. The Non- Executive Directors are paid sitting fees for attending meetings of Board/Committee.
The nomination and remuneration policy as adopted by the Board is placed on the Company’s website at www.kaveriseeds.in
REMUNERATION OF DIRECTORS:a. Executive Directors:
(Amount in Rs.)Name of the Director
Salary per annum
Contribution to PF & Gratuity Total
Sri G.V. Bhaskar Rao 17030778 144000 17174778Smt. G. Vanaja Devi 10531494 144000 10675494Sri C. Vamsheedar 5066789 201696 5268485Sri C. Mithun Chand 4191375 201696 4393071TOTAL 36820436 691392 37511828
b. Non-Executive Independent Directors:
(Amount in Rs.)Name Designation Sitting Fee Sri M.Srikanth Reddy Non-Executive Independent
Director130000
Dr. Yeshwant Laxman Nene
Non-Executive Independent Director
90000
Sri P.Vara Prasad Rao Non-Executive Independent Director
110000
Dr. S.Raghuvardhan Reddy
Non-Executive Independent Director
110000
Dr. S.M.Ilyas Non-Executive Independent Director
110000
Sri K. Purushotham Non-Executive Independent Director
130000
Dr. G.Pawan Non-Executive and Non Independent Director
40000
82
Value Creation Through Transformation
ii) Independent Directors Meeting:
Pursuant to Schedule IV of the companies Act, 2013 and the rules made there under, the Independent Directors of the company shall hold at least one meeting in a year, without the attendance of non-independent directors and members of the management.
All the independent directors of the Company shall strive to be present at such meetings. The meeting shall review the performance of non-independent directors and the Board as a whole; review the performance of the chairman of the board, taking into account the views of the executive directors and non-executive directors; assess the quality, quantity and timeliness of flow of information between the management and the board that is necessary for it to effectively and reasonably perform its duties. A meeting of the independent directors was held on 31st day of January 2017 wherein all the independent directors as on that date have attended the meeting.
STAKEHOLDERS RELATIONSHIP COMMITTEE:The main functions of the Shareholders Relationship Committee are to review and redress shareholders’/investors’ grievance pertaining to:
a. Transfer, transmission, split and consolidation of investors holding
b. Dematerialisation/rematerialisation of shares
c. Non-receipt of dividends and other corporate benefits
d. Replacement of lost/mutilated/stolen share certificates
e. Non-receipt of Annual Reports and change of addresses, etc.,
Constitution of the Committee:Name DesignationMr. M.Srikanth Reddy ChairmanMr. C.Vamsheedhar MemberMr. C.Mithun Chand Member
Name and designation of Compliance Officer:
Mr. V.R.S.Murti, Company Secretary & Compliance Officer
Email ID for investor grievances: [email protected]
The Committee meets every fortnight for effecting transfers, transmissions, split, consolidation, etc and also for review of the redressal of investor complaints. The Committee
expresses its satisfaction with the Company’s performance in dealing with investor grievances and its share transfer system.
During the year the Company has received 1+1+1+0 grievances from the investors and the same were resolved. As on 31st March 2017 there were no investor grievances pending and no transfers were pending for approval.
CORPORATE SOCIAL RESPONSIBILITY COMMITTEE:As per the Companies Act, 2013, the Company is required to constitute a Corporate Social Responsibility (CSR) Committee of the Board consisting of three or more directors, at least one of whom will be an independent director. The constitution of CSR Committee is as under:
Mr. G.V.Bhaskar Rao, Chairman
Mrs. G.Vanaja Devi, Member
Mr. M. Srikanth Reddy, Member
The purpose of the Committee is to formulate CSR Policy of the Company and monitor its implementation. In this regard, the Company has incorporated a separate Company on 29th July 2016 under Section 8 of the Companies Act, 2013 in the name and style of “Kaveri Bhaskar Rao Charitable Foundation” to undertake CSR and other charitable activities. The CSR Policy has been placed on the Company’s website at: http://www.kaveriseeds.in
GENERAL BODY MEETINGS: Details of the last three AGMs are given as follows:
Year Date of Meeting
Time of Meeting
Venue of Meeting
No. of Special Resolutions
passed27th Annual General Meeting 2013-14
September 18, 2014
11.15 AM Surana Udyog Hall. FTAPCCI
House, Red Hills, Hyderabad – 500 004., Telangana
15
28th Annual General Meeting 2014-15
September 29, 2015
11.15 AM Surana Udyog Hall. FTAPCCI
House, Red Hills, Hyderabad – 500 004., Telangana
1
29th Annual General Meeting 2015-16
September 27, 2016
11.15 AM Surana Udyog Hall. FTAPCCI
House, Red Hills, Hyderabad – 500 004., Telangana
5
i. Extraordinary General Meeting:
No Extraordinary General Meeting of the Members was held during the year 2016-17.

Annual Report 2016-17 83
Statutory reports 30-89
Financial statements 90-188
Company overview 01-29
MEANS OF COMMUNICATION:
The Company has a website viz., www.kaveriseeds.in. The quarterly and half yearly financial statements are not sent to the individual households of the shareholders, however the same are placed on the Company’s website for the information of shareholders and general public and also published in leading news papers in English and Telugu (Regional Language). Further all material information which will have some bearing on the operation of the Company is sent to all Stock Exchanges concerned and also placed on the Company’s website. A Management Discussion and Analysis Statement is a part of the Company’s Annual Report.
i) NSE Electronic Application Processing System (NEAPS) and BSE Listing Centre
The Company also filed information through NEAPS and BSE Listing Centre – a web based application provided by NSE & BSE which facilitates online filing of Financial Results, Announcements, Corporate Governance Reports and Shareholding Pattern etc., by the company.
ii) Extensive Business Reporting Language (XBRL)
XBRL is a language for electronic communication of business and financial data. If offers major benefits to all those who have to create, transmit, use or analyze such information which aids better analysis and decision making. Ministry of Corporate Affairs (MCA) Vide its Circular No.37/2011 dated June 7, 2011, had mandated certain companies to file their Annual Accounts vide this mode. The Company has filed its Annual Accounts on MCA through XBRL.
iii) Ministry of Corporate Affairs (MCA)
The company has periodically filed all the necessary documents with the MCA.
iv) SEBI Complaints Redress System (SCORES)
A centralized web based complaints redress system which serves as a centralized database of all complaints received, enables uploading of Action Taken Reports (ATRs) by the concerned companies and online viewing by the investors of actions taken on the complaint and its current status.
v) Letters
Letters reminding the investors to claim their pending/unclaimed dividends are regularly dispatched to the investors.
vi) The Management Discussion and Analysis Report forms part of the Directors’ Report:
The Management discussion and analysis forms part of
this Report and is provided separately elsewhere in this report.
vii) The Annual Report
The Annual Report containing inter alia the Audited Accounts, Directors Report, Auditors’ Report and other important information is circulated to the investors. Management Discussion and analysis forms part of the Annual Report. Pursuant to the Green initiative launched by the MCA, the Company also sends e-copies of the Annual Report to Members who have registered for the same.
Your Company’s Annual Reports are also available on the Company’s web site www.kaveriseeds.in
GENERAL SHAREHOLDERS INFORMATION:i. 30th Annual General
Meeting- Date and Time- Venue
25.09.2017 at 12.15 PMFTAPCCI Auditorium,The Federation of Telangana and Andhra Pradesh Chambers of Commerce and Industry (FTAPCCI House), 11-6-841, Red Hills, Hyderabad – 500 004, Telangana.
ii. Quarterly Results:Financial Year of the Company :Financial calendar (tentative and subject to change) of the financial year 2017-18
1st Quarter2nd Quarter3rd Quarter4th Quarter
April to March
14th August 201714th November 201714th February 201830th May 2018 (Audited)
iii. Date of Book Closure 23.09.2017 to 25.09.2017 (both days inclusive)
iv.. Payment of Dividend The company has not paid Dividend during the year 2016-17.
v. Listing on Stock Exchanges:
Bombay Stock Exchange Limited, Phiroze Jeejeebhoy Towers, Dalal Street, Mumbai – 400 023.National Stock Exchange of India Ltd., Exchange Plaza, 5th floor, Plot No.C/1, G-Block, Bandra-Kurla Complex, Bandra (East), Mumbai – 400 051.
vi. Listing Fees Listing fee of both the stock Exchanges has already been paid for the year 2017-2018
vii. Stock Code:Bombay Stock Exchange LimitedNational Stock Exchange of India Ltd
532899KSCL

84
Value Creation Through Transformation
ix. There was no suspension of trading in securities of the Company during the year under review.
x. Registrar to an issue and Share Transfer Agents:M/s. Bigshare Services Pvt. Ltd., is the Registrars and Share Transfer Agents and Depository Transfer Agents of the Company. Any request pertaining to investor relations may be forwarded to the following address:
Mr. T. Prabhakar,Bigshare Services Pvt. Ltd.,306, 3rd Floor, Right Wing, Amrutha Ville,Opp.Yashodha HospitalSomajiguda, Rajbhavan Road, Hyderabad – 500 082Telangana.Tel.Nos. + 91- 40– 40144967/ 23374967Fax No. + 91-40 - 23370295E-mail: [email protected]
xi. Share Transfer System and Dematerialization of shares and liquidity:
The Company’s shares are compulsorily traded in dematerialized form and are available for trading on both the depositories in India viz., National Securities Depository Limited (NSDL) and Central Depository Services (India) Limited (CDSL). Equity shares of the Company representing 99.96% of the Company’s share capital are dematerialized as on 31st March 2017.
The Company’s shares are regularly traded on The National Stock Exchange of India Limited and the Bombay Stock Exchange Limited, in electronic form. Under the Depository System, the ISIN allotted to the Company’s Shares is INE 455I01029
viii. Monthly High & Low quotations and volume of shares traded on NSE & BSE during the year:National Stock Exchange Bombay Stock Exchange
Month High Low Close Volume High Low Close VolumeApr-16 404.70 393.65 395.45 385807 428.00 350.40 396.25 1459660May-16 452.00 434.25 436.10 507079 454.90 379.30 437.15 2211246Jun-16 445.50 440.00 444.30 828133 472.00 425.00 444.35 1064404Jul-16 398.00 387.50 390.95 536579 452.90 370.35 390.85 1414232Aug-16 373.75 357.55 359.70 592034 393.60 354.50 359.50 1173410Sep-16 361.85 345.80 358.15 247640 374.85 325.25 359.70 1707779Oct-16 434.90 424.00 432.85 44583 450.70 355.55 432.15 1475395Nov-16 418.80 412.45 415.30 197910 440.00 358.40 415.10 1148351Dec-16 414.45 406.60 409.70 259951 446.00 381.00 410.55 1203535Jan-17 478.00 447.40 458.90 1219853 499.00 401.00 458.80 1609169Feb-17 499.15 468.95 496.60 2114969 498.65 449.10 495.60 2878981Mar-17 572.00 537.10 558.20 1092733 568.00 482.50 552.35 2512992
STOCK PERFORMANCE OF KAVERI SEED COMPANY LIMITED Vs. BOMBAY STOCK EXCHANGE SENSEX
STOCK PERFORMANCE OF KAVERI SEED COMPANY LIMITED Vs. NATIONAL STOCK EXCHANGE CNXNIFTY9500
NSE.NIFTY 50
KSCL SHARE
APR.
16
MAY
.16
JUN.
16
JULY
.16
AUG.
16
SEP.1
6
OCT
.16
NOV.1
6
DEC.1
6
JAN.
17
FEB.
17
MAR
.17
900
500
400
300
200
100
0
9000
8500
8000
7500
7000
APR.
16
MAY
.16
JUN.
16
JULY
.16
AUG.
16
SEP.1
6
OCT
.16
NOV.1
6
DEC.1
6
JAN.
17
FEB.
17
MAR
.17
S&P BSESENSEX
30000 600
500
400
300
200
100
0
29000
28000
27000
26000
25000
24000
23000
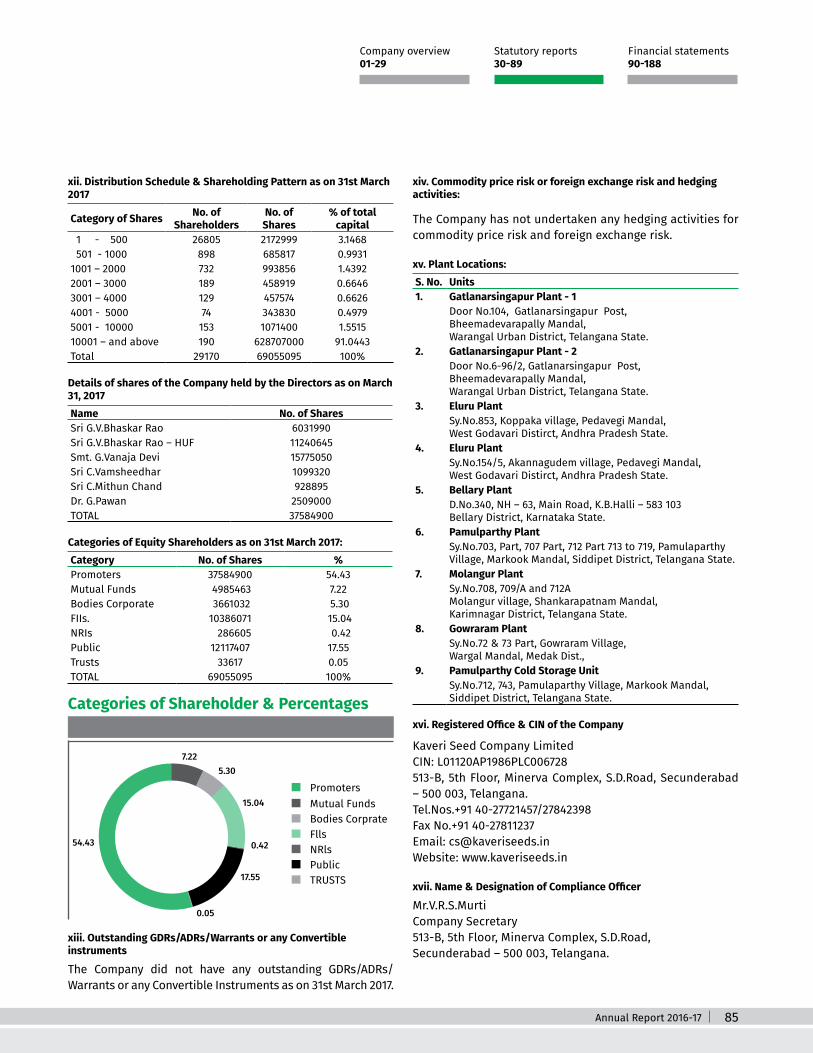
Annual Report 2016-17 85
Statutory reports 30-89
Financial statements 90-188
Company overview 01-29
xii. Distribution Schedule & Shareholding Pattern as on 31st March 2017
Category of Shares No. of Shareholders
No. of Shares
% of total capital
1 - 500 26805 2172999 3.1468 501 - 1000 898 685817 0.99311001 – 2000 732 993856 1.43922001 – 3000 189 458919 0.66463001 – 4000 129 457574 0.66264001 - 5000 74 343830 0.49795001 - 10000 153 1071400 1.551510001 – and above 190 628707000 91.0443Total 29170 69055095 100%
Details of shares of the Company held by the Directors as on March 31, 2017Name No. of SharesSri G.V.Bhaskar Rao 6031990Sri G.V.Bhaskar Rao – HUF 11240645Smt. G.Vanaja Devi 15775050Sri C.Vamsheedhar 1099320Sri C.Mithun Chand 928895Dr. G.Pawan 2509000TOTAL 37584900
Categories of Equity Shareholders as on 31st March 2017:Category No. of Shares %Promoters 37584900 54.43Mutual Funds 4985463 7.22Bodies Corporate 3661032 5.30FIIs. 10386071 15.04NRIs 286605 0.42Public 12117407 17.55Trusts 33617 0.05TOTAL 69055095 100%
xiii. Outstanding GDRs/ADRs/Warrants or any Convertible instruments
The Company did not have any outstanding GDRs/ADRs/Warrants or any Convertible Instruments as on 31st March 2017.
xiv. Commodity price risk or foreign exchange risk and hedging activities:
The Company has not undertaken any hedging activities for commodity price risk and foreign exchange risk.
xv. Plant Locations:S. No. Units1. Gatlanarsingapur Plant - 1
Door No.104, Gatlanarsingapur Post, Bheemadevarapally Mandal,Warangal Urban District, Telangana State.
2. Gatlanarsingapur Plant - 2Door No.6-96/2, Gatlanarsingapur Post, Bheemadevarapally Mandal,Warangal Urban District, Telangana State.
3. Eluru PlantSy.No.853, Koppaka village, Pedavegi Mandal,West Godavari Distirct, Andhra Pradesh State.
4. Eluru PlantSy.No.154/5, Akannagudem village, Pedavegi Mandal,West Godavari Distirct, Andhra Pradesh State.
5. Bellary Plant D.No.340, NH – 63, Main Road, K.B.Halli – 583 103Bellary District, Karnataka State.
6. Pamulparthy PlantSy.No.703, Part, 707 Part, 712 Part 713 to 719, Pamulaparthy Village, Markook Mandal, Siddipet District, Telangana State.
7. Molangur PlantSy.No.708, 709/A and 712AMolangur village, Shankarapatnam Mandal, Karimnagar District, Telangana State.
8. Gowraram PlantSy.No.72 & 73 Part, Gowraram Village,Wargal Mandal, Medak Dist.,
9. Pamulparthy Cold Storage UnitSy.No.712, 743, Pamulaparthy Village, Markook Mandal, Siddipet District, Telangana State.
xvi. Registered Office & CIN of the Company
Kaveri Seed Company LimitedCIN: L01120AP1986PLC006728513-B, 5th Floor, Minerva Complex, S.D.Road, Secunderabad – 500 003, Telangana.Tel.Nos.+91 40-27721457/27842398Fax No.+91 40-27811237Email: [email protected] Website: www.kaveriseeds.in
xvii. Name & Designation of Compliance Officer
Mr.V.R.S.MurtiCompany Secretary513-B, 5th Floor, Minerva Complex, S.D.Road, Secunderabad – 500 003, Telangana.
Categories of Shareholder & Percentages (` In Lakhs)
PromotersMutual FundsBodies CorprateFllsNRlsPublicTRUSTS
54.43
7.225.30
15.04
0.42
17.55
0.05
86
Value Creation Through Transformation
v) Policy on Material Subsidiaries
In terms of Regulation 34(3) of the SEBI (LODR) Regulations, 2015 the Board of Directors of the Company has adopted a policy with regard to determination of material subsidiaries. The policy is placed on the Company’s website: http://www.kaveriseeds.in
vi) Non compliance of any requirement of Corporate Governance Report of sub-paras (2) to (10) of Schedule-V:
The company has complied with the requirement of Corporate Governance Report of sub-paras (2) to (10) of Schedule-V of the Securities Exchange Board of India (LODR) Regulations, 2015.
vii) Adoption of discretionary requirements as specified in Part E of Schedule II of the Securities and Exchange Board of India (Listing Obligations and Disclosure Requirements) Regulations, 2015
With regard to discretionary requirements, the Company has adopted clauses relating to the following:
Internal auditor reports directly to the Audit Committee.
viii) The Disclosures of the compliance with Corporate Governance requirements specified in Regulation 17 to 27 and clauses (b) to (i) of sub-regulation (2) of Regulation 46 are as follows:
Regulation Particulars of RegulationsCompliance status (Yes/
No)17 Board of Directors Yes18 Audit Committee Yes19 Nomination and Remuneration
Committee Yes
20 Stakeholders Relationship Committee Yes21 Risk Management Committee Yes22 Vigil mechanism Yes23 Related Party Transactions Yes24 Corporate Governance requirements
with respect to subsidiary of listed entity
Yes
25 Obligations with respect to Independent Directors
Yes
26 Obligation with respect to Directors and senior management
Yes
27 Other Corporate Governance requirements
Yes
46(2) (b) to (i)
Functional Website yes
ix) Compliance Certificate of the Auditors:
Certificate from the Auditors of the Company M/s. P.R.Reddy & Co., Chartered Accountants, confirming compliance with the conditions of Corporate Governance as stipulated under Schedule V - E of SEBI (LODR) Regulations, 2015 is attached to this report forming part of the Annual Report.
Tel.Nos. +91 40-27721457/27842398 Fax No. +91 40-27811237 Email: [email protected] : www.kaveriseeds.in
OTHER DISCLOSURES:i) Related Party Transactions
No transaction of material nature has been entered into by the Company with its Directors/management and their relatives, etc. that may have a potential conflict with the interests of the Company. The Register of Contracts containing transactions, in which Directors are interested, is placed before the Audit Committee and Board regularly. Transactions with related parties are disclosed in the Notes to Accounts in the Annual Report. In terms of SEBI (LODR) Regulations, 2015, the Audit Committee and Board of Directors of the Company have adopted a policy to determine Related Party Transactions. The policy is placed on the Company’s website at www.kaveriseeds.in
ii) Details of Non Compliance and Penalties
No penalties have been imposed on the Company by the Stock Exchanges where the Company’s shares are listed or SEBI or any other statutory authority on any matter during the last three years.
iii) Whistle Blower Policy
The Board of Directors of the Company had adopted the Whistle Blower policy. The Company has established a mechanism for employees to report to the management, concerns about unethical behavior, actual or suspected fraud or violation of the Company’s code of conduct or ethics. The employees have been appropriately communicated within the organization about the mechanism and have been provided direct access to the Chairman of the Audit Committee. The mechanism also lays emphasis on making enquiry into whistle blower complaint received by the Company. The Audit Committee reviews periodically the functioning of whistle blower mechanism. No employee has been denied access to the Audit Committee. A copy of the Whistle Blower Policy is hosted on the Company’s website at http://www.kaveriseeds.in.
iv) Details of compliance with mandatory requirements and adoption of the non-mandatory requirements:
The Company has complied with the mandatory requirements of SEBI (LODR) Regulations, 2015 of the listing agreement and is in the process of implementation of non-mandatory requirements.

Annual Report 2016-17 87
Statutory reports 30-89
Financial statements 90-188
Company overview 01-29
x) Code of Conduct
The Board of Directors has laid down a ‘Code of Conduct’ (code) for all the Board members and the Senior Management of the Company and this code is posted on the website of the company. Annual declaration is obtained from every person covered by the code.
The Company has a comprehensive Code of Conduct for prevention of insider trading in accordance with the requirements of SEBI (Prohibition of Insider Trading) Regulations, 2015. The Board has formulated a Code of Conduct to regulate, monitor and report trading by insiders and the Board has also adopted a code of practices and procedures for fair disclosure of un-published price sensitive information.
xi) CEO and CFO Certification
The Chairman and Managing Director and the Chief Financial
Officer of the Company have given the annual certification on financial reporting and internal controls to the Board in terms of Regulation 17(8) of SEBI (LODR) Regulations, 2015.
DECLARATIONI, G.V.Bhaskar Rao, Managing Director, hereby declare that as provided under the SEBI (Listing Obligations and Disclosure Requirements) Regulations, 2015, the Board Members and the Senior Management Personnel have confirmed compliance with the Code of Conduct and Ethics for the year ended 31st March 2017.
For KAVERI SEED COMPANY LTD. Sd/-Secunderabad, G.V.BHASKAR RAO24th May 2017 Managing Director
88
Value Creation Through Transformation
Certificate on compliance with the conditions of Corporate Governance
under Regulation 34(3) read with Schedule V of Securities and Exchange Board of
India (Listing Obligations and Disclosure Requirements) Regulations, 2015
To
The Members ofM/s. KAVERI SEED COMPANY LIMITED
We have examined the compliance of conditions of Corporate Governance by Kaveri Seed Company Limited, (the Company) for the financial year ended March 31, 2017, as stipulated in Securities and Exchange Board of India (Listing Obligations and Disclosure Requirements) Regulations, 2015.
The compliance of conditions of Corporate Governance is the responsibility of the Management. Our examination was limited to review the procedures and implementation thereof, adopted by the Company, for ensuring the compliance of the conditions of Corporate Governance. It is neither an audit nor an expression of opinion on Financial Statements of the Company.
In our opinion and to the best of our information and according to the explanations given to us, we certify that the Company has complied with the conditions of Corporate Governance as stipulated in the above Securities and Exchange Board of India (Listing Obligations and Disclosure Requirements) Regulations, 2015.
We further state that such compliance is neither an assurance as to the future viability of the Company nor the efficiency or effectiveness with which the management has conducted the affairs of the Company.
For P.R.REDDY & CO. Firm Regn., No.003268S Chartered Accountants Sd/- P.RAGHUNADHA REDDYHyderabad, Partner24th May 2017 Membership No.23758
Annual Report 2016-17 89
Statutory reports 30-89
Financial statements 90-188
Company overview 01-29
CEO/CFO CERTIFICATION (Pursuant to Regulation 17(8) of SEBI (LODR) Regulations, 2015)
We hereby certify that:
a. We have reviewed financial statements and the cash flow statement for the Financial Year ended 31st March 2017 and that to the best of our knowledge and belief :
i. these statements do not contain any materially untrue statement or omit any material fact or contain statements that might be misleading;
ii. these statements together present a true and fair view of the company’s affairs and are in compliance with existing accounting standards, applicable laws and regulations.
b. There are, to the best of our knowledge and belief, no transactions entered into by the company during the year which are fraudulent, illegal or violative of the company’s code of conduct.
c. We accept responsibility for establishing and maintaining internal controls for financial reporting and that we have evaluated the effectiveness of internal control systems of the company pertaining to financial reporting and we have disclosed to the auditors and the Audit Committee, deficiencies in the design or operation of such internal controls, if any, of which we are aware and the steps we have taken or propose to take to rectify these deficiencies.
d. We have indicated to the auditors and the Audit Committee that there are no:
i. significant changes in internal control over financial reporting during the year;
ii. significant changes in accounting policies during the year and that the same have been disclosing in the notes to the financial statements; and
iii. instances of significant fraud of which we have become aware and the involvement therein, if any, of the management or an employee having significant role in the company’s internal control system over financial reporting.
For KAVERI SEED COMPANY LIMITED
Sd/- Sd/- G.V.BHASKAR RAO G. VIJAY KUMAR Managing Director Chief Financial Officer
24th May 2017Secunderabad

90
Value Creation Through Transformation
Independent Auditor’s Report
TO THE MEMBERS OF
M/S. KAVERI SEED COMPANY LIMITED
Report on the Standalone Ind AS Financial StatementsWe have audited the accompanying standalone Ind AS financial statements of M/S. KAVERI SEED COMPANY LIMITED (“the Company”), which comprise the Balance Sheet as at 31st March, 2017, the Statement of Profit and Loss (Including the other comprehensive income), the Cash Flow Statement and the Statement of Changes in Equity for the year then ended, and a summary of the significant accounting policies and other explanatory information. [herein after referred to as “Standalone Ind AS financial statements”]
Management’s Responsibility for the Standalone Ind AS Financial StatementsThe Company’s Board of Directors is responsible for the matters stated in Section 134(5) of the Companies Act, 2013 (“the Act”) with respect to the preparation of these standalone Ind AS financial statements that give a true and fair view of the financial position, financial performance, cash flows and changes in equity of the Company in accordance with the accounting principles generally accepted in India, including the Accounting Standards specified under Section 133 of the Act, read with Rule 7 of the Companies (Accounts) Rules, 2014. This responsibility also includes maintenance of adequate accounting records in accordance with the provisions of the Act for safeguarding the assets of the Company and for preventing and detecting the frauds and other irregularities; selection and application of appropriate accounting policies; making judgments and estimates that are reasonable and prudent; and design, implementation and maintenance of adequate internal financial controls, that were operating effectively for ensuring the accuracy and completeness of the accounting records, relevant to the preparation and presentation of the Standalone Ind AS financial statements that give a true and fair view and are free from material misstatement, whether due to fraud or error.
Auditor’s ResponsibilityOur responsibility is to express an opinion on these standalone Ind AS financial statements based on our audit.
We have taken into account the provisions of the Act, the accounting and auditing standards and matters which are required to be included in the audit report under the provisions of the Act and the Rules made there under.
We conducted our audit of the Ind AS financial statements in accordance with the Standards on Auditing specified under Section 143(10) of the Act. Those Standards require that we comply with ethical requirements and plan and perform the audit to obtain reasonable assurance about whether the Standalone Ind AS financial statements are free from material misstatement.
An audit involves performing procedures to obtain audit evidence about the amounts and the disclosures in the Standalone Ind AS financial statements. The procedures selected depend on the auditor’s judgment, including the assessment of the risks of material misstatement of the Standalone Ind AS financial statements, whether due to fraud or error. In making those risk assessments, the auditor considers internal financial control relevant to the Company’s preparation of the Standalone Ind AS financial statements that give a true and fair view in order to design audit procedures that are appropriate in the circumstances. An audit also includes evaluating the appropriateness of the accounting policies used and the reasonableness of the accounting estimates made by the Company’s Directors, as well as evaluating the overall presentation of the Standalone Ind AS financial statements.
We believe that the audit evidence we have obtained is sufficient and appropriate to provide a basis for our audit opinion on the standalone Ind AS financial statements.
OpinionIn our opinion and to the best of our information and according to the explanations given to us, the aforesaid standalone Ind AS financial statements give the information required by the Act in the manner so required and give a true and fair view in conformity with the accounting principles generally accepted in India including the Ind AS, in the case of the Balance Sheet, of the state of affairs of the Company as at 31st March, 2017, in the case of the Statement of Profit and Loss, of the Profit for the year ended on that date, in the case of the Cash Flow Statement, of the cash flows for the year ended on that date, and in the case of Statement of

Annual Report 2016-17 91
Statutory reports 30-89
Financial statements 90-188
Company overview 01-29
Changes in Equity, of the changes in equity of the year ended on that date.
Report on Other Legal and Regulatory Requirements: As required by the Companies (Auditor’s Report) Order, 2016 (“the Order”), issued by the Central Government of India in terms of sub-section (11) of section 143 of the Companies Act, 2013, we give in the “Annexure – A” a statement on the matters specified in paragraphs 3 and 4 of the Order, to the extent applicable.
As required by Section 143 (3) of the Act, we report that:(a) We have sought and obtained all the information and
explanations which to the best of our Knowledge and belief were necessary for the purposes of our audit.
(b) In our opinion, proper books of account as required by law have been kept by the Company so far as it appears from our examination of those books.
(c) The Balance Sheet, the Statement of Profit and Loss, the Cash Flow Statement and the Statement of Changes in Equity dealt with by this Report are in agreement with the books of account.
(d) In our opinion, the aforesaid standalone Ind AS financial statements comply with the Indian Accounting Standards specified under section 133 of the Companies Act, 2013, read with Rule 7 of the Companies (Accounts) Rules, 2014.
(e) On the basis of the written representations received from the directors as on 31st March, 2017, and taken on record by the Board of Directors, none of the directors is disqualified as on 31st March, 2017, from being appointed as a director in terms of Section 164 (2) of the Companies Act, 2013.
(f ) With respect to the adequacy of the internal financial controls over financial reporting of the Company and
the operating effectiveness of such controls, refer to our separate Report in “Annexure –B”.
(g) With respect to the other matters to be included in the Auditor’s Report in accordance with Rule 11 of the Companies (Audit and Auditors) Rules, 2014, in our opinion and to the best of our knowledge and belief and according to the information and explanations given to us:
i. The Company does not have any pending litigations which would impact its financial position.
ii. The Company did not have any long-term contracts including derivative contracts for which there were any material foreseeable losses.
iii. There were no amounts which were required to be transferred to the Investor Education and Protection Fund by the Company.
iv. The company has provided requisite disclosures in the Standalone Ind AS financial statements as to holdings as well as dealings in Specified Bank Notes during the period from 8 November 2016 to 30 December 2016. Based on audit procedures and relying on the management representation, we report that the disclosures are in accordance with books of account maintained by the company and as produced to us by the Management.
For P R REDDY & COFirm Regn No.003268S
CHARTERED ACCOUNTANTS
sd/-P. RAGHUNADHA REDDY
Place: Hyderabad, PartnerDate: 24th May, 2017. Membership No. 23758

92
Value Creation Through Transformation
Annexure - A referred to in the Auditors’ Report to the Members of M/S.KAVERI SEED COMPANY LIMITED for the year ended 31st March, 2017. We report that:
i. a. The company has maintained proper records, showing full particulars, including quantitative details and situation of fixed assets.
b. The fixed assets were physically verified during the year by the management in accordance with regular programme of verification which, in our opinion, provides for physical verification of the fixed assets at reasonable intervals. According to the information and explanations given to us, no material discrepancies were noticed on such verification.
c. According to the information and explanations given to us, and on the basis of our examination of records of the company, the title deeds of immovable properties shown in the fixed asset schedule are held in the name of company.
ii. The inventory has been physically verified during the year by the management. In our opinion, the frequency of verification is reasonable. The discrepancies noticed on physical verification between the physical stocks and the book records are not material and they have been properly dealt with in the books of accounts.
iii. The Company has not granted any loans, secured or unsecured to companies, firms, limited liability partnerships or other parties covered in the register maintained under section 189 of the Companies Act, 2013, during the year. Accordingly paragraph 3(iii) of the Order is not applicable to the Company.
iv. According to the information and explanations given to us, The Company has not given any loans, made any investments, given any guarantees and securities to
any person to which provisions of the section 185 and 186 of the companies Act 2013 are applicable.
v. According to the information and explanations given to us, the Company has not accepted any deposit from the public. Therefore, the provisions of Clause (v) of paragraph 3 of the CARO 2016 are not applicable to the Company.
vi. According to the information and explanations given to us, the maintenance of cost records under sub-section (1) of section 148 of the Companies Act, 2013, has not been prescribed by the Central Government for the Company.
vii.
a. The Company is regular in depositing with appropriate authorities’ undisputed statutory dues, including provident fund, Employees’ state insurance, income-tax, sales-tax, service tax, customs duty, duty of excise, Value added tax, cess and other material statutory dues as applicable to it. According to the information and explanations given to us, there are no undisputed amounts payable in respect aforesaid dues, as at 31st March, 2017 for a period of more than six months from the date they became payable.
b. According to the information and explanations given to us, there are no dues of income-tax, service tax and customs duty, which have not been deposited on account of any dispute. However, according to information and explanations given to us, the following dues of Sales tax and Duty of Excise have not been deposited by the company an account of disputes.
Name of the Statute Nature of Dues Amount ` Period to which the amount Relates Forum where dispute is pending
Central Excise Act Excise Duty 2,76,58,572*# April,2010 To March 2014 Directorate General of Central Excise - Intelligence, Zonal Unit, Begumpet, Hyderabad.
Karnataka VAT Act VAT,Penalty& Interest 5,61,55,366 $ April,2009 To March 2010 Deputy Commissioner of Commercial Taxes (Audit), Davangere, Karnataka
APGST Act Purchase Tax 22,36,467 & April,2003 To March 2004 Deputy Commissioner (C.T) , Abids Division, Hyderabad.
*. Net of Amounts paid under protest #. The company has filed an appeal before Commissioner of Customs & Central Excise , Hyderabad IV Commissionerate, Hyderabad.$. The company has submitted application to the Deputy Commissioner of Commercial Taxes, Davangere, Karnataka for rectification of the Assessment Order.&. The company has filed appeal before Hon’ble High Court of Andhrapradesh, Hyderabad.
Annual Report 2016-17 93
Statutory reports 30-89
Financial statements 90-188
Company overview 01-29
viii. Based on our audit procedures and according to the information and explanations given to us, we are of the opinion that the Company has not defaulted in repayment of dues to financial institutions, banks, Government or dues to debenture holders.
ix. In our opinion and according to the information and explanations given to us, the Company has utilized the money raised by way of the term loans for the purposes for which they were raised and has not raised money by way of initial public offer/further public offer (Including debt instruments) during the year. Accordingly, the provisions of Clause 3(ix) of the Order are not applicable to the Company.
x. In our opinion and according to the information and explanations given to us, no fraud by the Company or no material fraud on the Company by its officers or employees has been noticed or reported during the year.
xi. In our opinion and according to the information and explanations given to us, Managerial remuneration paid or provided with requisite approvals mandated in the provision of section 197 read with schedule V to the Companies Act 2013.
xii. In our opinion, the company is not a nidhi, therefore provisions of clause 3(xii) of companies (Auditors Report) Order, 2016 as amended are not applicable to the company.
xiii. In our opinion and according to the information and explanations given to us, all transactions entered
by related parties are in compliance with section 177 and 188 of Companies Act, 2013 where applicable and the details have been disclosed in the Standalone Ind AS financial Statements as required by applicable accounting standards.
xiv. According to the information and explanations given to us, the company has not made any preferential allotment of shares or private placement of shares or fully or partly convertible debentures during the year under the review. Therefore, the provisions of clause 3(xiv) of the Order are not applicable to the Company.
xv. According to the information and explanations given to us, during the year the company has not entered in to any non-cash transactions with directors or persons connected with him. Accordingly, paragraph – 3(xv) of the order is not applicable.
xvi. In our opinion and according to the information and explanations given to us, the company is not required to be registered under section 45-IA of the Reserve Bank of India Act, 1934. Accordingly, the provisions of Clause 3(xvi) of the Order are not applicable to the Company.
For P R REDDY & COFirm Regn No.003268S
CHARTERED ACCOUNTANTS
sd/-P. RAGHUNADHA REDDY
Place: Hyderabad, PartnerDate: 24th May, 2017. Membership No. 23758

94
Value Creation Through Transformation
Annexure - B referred to Independent Auditor’s Report to the Members of M/S.KAVERI SEED COMPANY LIMITED for the year ended 31st March, 2017.
Referred to in the Independent Auditor’s Report of even date to the members of Kaveri Seed Company Limited on the standalone Ind AS financial statements for the year ended March 31, 2017.
Report on the Internal Financial Controls under Clause (1) of Sub-section 3 of Section 143 of the Act1. We have audited the internal financial controls over
financial reporting of Kaveri Seed Company Limited (“the company”) as of March 31, 2017 in conjunction with our audit of the standalone Ind AS financial statements of the company for the year ended on that date.
Management’s Responsibility for Internal Financial Controls2. The Company’s management is responsible for
establishing and maintaining internal financial controls based on the internal control over financial reporting criteria established by the Company considering the essential components of internal control stated in the Guidance Note on Audit of Internal Financial Controls over Financial Reporting [the “Guidance Note”] issued by the Institute of Chartered Accounts of India [“ICAI”]. These responsibilities include the design, implementation and maintenance of adequate internal financial controls that were operating effectively for ensuring the orderly and efficient conduct of its business, including adherence to Company’s policies, the safeguarding of its assets, the preventing and detection of frauds and errors, the accuracy and completeness of the accounting records, and the timely preparation of reliable financial information, as required under the Companies Act, 2013.
Auditor’s Responsibility3. Our responsibility is to express an opinion on the
Company’s internal financial controls over financial reporting based on our audit. We conducted our audit in accordance with the Guidance Note on Audit of Internal Financial Controls over Financial Reporting (the “Guidance Note”) and the standards on Auditing, issued by ICAI and deemed to be prescribed under section 143(10) of the Companies Act, 2013, to the extent applicable to an audit of internal financial controls, both applicable to an audit of internal financial controls and both issued by the ICAI. Those standards
and the Guidance Note require that we comply with ethical requirements and plan and perform the audit to obtain reasonable assurance about whether adequate internal financial controls over financial reporting was established and maintained and if such controls operated effectively in all material respects.
4. Our audit involves performing procedures to obtain audit evidence about the adequacy of the internal financial controls system over financial reporting and their operating effectiveness. Our audit of internal financial controls over financial reporting included obtaining an understanding of internal financial controls over financial reporting, assessing the risk that a material weakness exists, and testing and evaluating the design and operating effectiveness of internal control based on the assessed risk. The procedures selected depending on the auditor’s judgment, including the assessment of the risks of the material misstatement of the Standalone Ind AS financial statements, whether due to fraud or error.
5. We believe that the audit evidence we have obtained is sufficient and appropriate to provide a basis for our audit opinion on the Company’s internal financial controls system over financial reporting.
Meaning of Internal Financial Controls over Financial Reporting6. A Company’s internal financial control over financial
reporting is a process designed to provide reasonable assurance regarding the reliability of financial reporting and the preparation of financial statements for external purpose in accordance with Generally Accepted Accounting Principles. A Company’s internal financial control over financial reporting includes those policies and procedures that (1) pertain to the maintenance of records that, in reasonable detail, accurately and fairly reflect the transactions and dispositions of the assets of the company; (2) provide reasonable assurance that transaction are recorded as necessary to permit preparation of financial statements in accordance with Generally Accepted Accounting Principles, and that receipts and expenditure of the company are being made only in accordance with authorizations of the management and directors of the company; and

Annual Report 2016-17 95
Statutory reports 30-89
Financial statements 90-188
Company overview 01-29
(3) provide reasonable assurance regarding prevention or timely detection of unauthorized acquisition, use, or disposition of the Company’s assets that could have a material effect on the financial statements.
Inherent Limitations of Internal Financial Controls over Financial Reporting7. Because of the inherent limitations of internal
financial controls over financial reporting, including the possibility of collusion or improper management override of controls, material misstatements due to error or fraud may occur and not be detected. Also, projection of any evaluation of the internal financial controls over financial reporting to future periods are subject to the risk that the internal financial control over financial reporting may become inadequate because of changes in conditions, or that the degree of compliance with the policies or procedures may deteriorate.
Opinion8. In our opinion, the company has, in all material respects,
an adequate internal financial controls systems over financial reporting and such internal financial controls over financial reporting were operating effectively as at March 31, 2017, based on the internal control over financial reporting criteria established by the company considering the essential components of internal controls stated in the Guidance Note on Audit of Internal Financial Controls over Financial Reporting issued by the Institute of Chartered Accounts of India.
For P R REDDY & COFirm Regn No.003268S
CHARTERED ACCOUNTANTS
sd/-P. RAGHUNADHA REDDY
Place: Hyderabad, PartnerDate: 24th May, 2017. Membership No. 23758
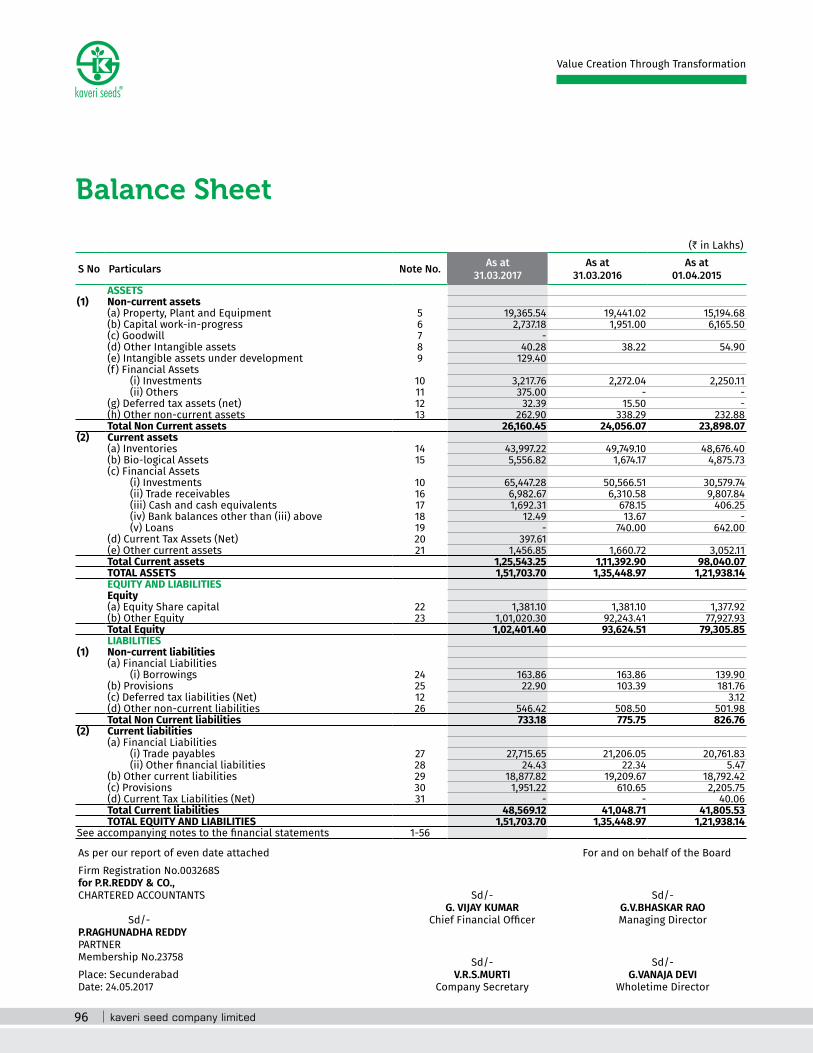
96
Value Creation Through Transformation
Balance Sheet
(` in Lakhs)
S No Particulars Note No. As at 31.03.2017
As at 31.03.2016
As at 01.04.2015
ASSETS(1) Non-current assets
(a) Property, Plant and Equipment 5 19,365.54 19,441.02 15,194.68 (b) Capital work-in-progress 6 2,737.18 1,951.00 6,165.50 (c) Goodwill 7 - (d) Other Intangible assets 8 40.28 38.22 54.90 (e) Intangible assets under development 9 129.40 (f) Financial Assets (i) Investments 10 3,217.76 2,272.04 2,250.11 (ii) Others 11 375.00 - - (g) Deferred tax assets (net) 12 32.39 15.50 - (h) Other non-current assets 13 262.90 338.29 232.88 Total Non Current assets 26,160.45 24,056.07 23,898.07
(2) Current assets(a) Inventories 14 43,997.22 49,749.10 48,676.40 (b) Bio-logical Assets 15 5,556.82 1,674.17 4,875.73(c) Financial Assets (i) Investments 10 65,447.28 50,566.51 30,579.74 (ii) Trade receivables 16 6,982.67 6,310.58 9,807.84 (iii) Cash and cash equivalents 17 1,692.31 678.15 406.25 (iv) Bank balances other than (iii) above 18 12.49 13.67 - (v) Loans 19 - 740.00 642.00 (d) Current Tax Assets (Net) 20 397.61 (e) Other current assets 21 1,456.85 1,660.72 3,052.11 Total Current assets 1,25,543.25 1,11,392.90 98,040.07 TOTAL ASSETS 1,51,703.70 1,35,448.97 1,21,938.14 EQUITY AND LIABILITIESEquity(a) Equity Share capital 22 1,381.10 1,381.10 1,377.92 (b) Other Equity 23 1,01,020.30 92,243.41 77,927.93 Total Equity 1,02,401.40 93,624.51 79,305.85 LIABILITIES
(1) Non-current liabilities(a) Financial Liabilities (i) Borrowings 24 163.86 163.86 139.90 (b) Provisions 25 22.90 103.39 181.76 (c) Deferred tax liabilities (Net) 12 3.12 (d) Other non-current liabilities 26 546.42 508.50 501.98 Total Non Current liabilities 733.18 775.75 826.76
(2) Current liabilities(a) Financial Liabilities (i) Trade payables 27 27,715.65 21,206.05 20,761.83 (ii) Other financial liabilities 28 24.43 22.34 5.47 (b) Other current liabilities 29 18,877.82 19,209.67 18,792.42 (c) Provisions 30 1,951.22 610.65 2,205.75 (d) Current Tax Liabilities (Net) 31 - - 40.06 Total Current liabilities 48,569.12 41,048.71 41,805.53 TOTAL EQUITY AND LIABILITIES 1,51,703.70 1,35,448.97 1,21,938.14
See accompanying notes to the financial statements 1-56
As per our report of even date attached For and on behalf of the BoardFirm Registration No.003268Sfor P.R.REDDY & CO.,CHARTERED ACCOUNTANTS Sd/- Sd/-
G. VIJAY KUMAR G.V.BHASKAR RAOSd/- Chief Financial Officer Managing Director
P.RAGHUNADHA REDDYPARTNERMembership No.23758 Sd/- Sd/-Place: Secunderabad V.R.S.MURTI G.VANAJA DEVI Date: 24.05.2017 Company Secretary Wholetime Director

Annual Report 2016-17 97
Statutory reports 30-89
Financial statements 90-188
Company overview 01-29
Statement of Profit and Loss
As per our report of even date attached For and on behalf of the BoardFirm Registration No.003268Sfor P.R.REDDY & CO.,CHARTERED ACCOUNTANTS Sd/- Sd/-
G. VIJAY KUMAR G.V.BHASKAR RAOSd/- Chief Financial Officer Managing Director
P.RAGHUNADHA REDDYPARTNERMembership No.23758 Sd/- Sd/-Place: Secunderabad V.R.S.MURTI G.VANAJA DEVI Date: 24.05.2017 Company Secretary Wholetime Director
(` in Lakhs)
S No Particulars Note Year Ended March 31, 2017
Year Ended March 31, 2016
I Incomea) Revenue from Operations 32 66,989.10 71,652.95 b) Other Income 33 3,434.90 1,166.83 Total Income 70,424.00 72,819.78
II Expensesa) Cost of Material Consumed 34 37,842.31 36,348.57 b) Changes in Inventories of Finished Goods and Work in
Progress35 1,906.57 2,197.61
c) Employee Benefit Expenses 36 3,245.18 3,122.99 d) Finance Costs 37 12.27 16.90 e) Depreciation & Amortisation Expenses 38 2,849.21 2,498.29 f) Other Expenses 39 10,207.37 10,899.71
Total Expenses 56,062.91 55,084.07 III Profit before Exceptional Items and Tax ( I-II) 14,361.09 17,735.71 IV Exceptional Item (Refer Note No.43) (5,923.80) - V Profit before Tax (III+IV) 8,437.29 17,735.71 VI Less : Tax expense
Current Tax 1,159.84 526.37 Earlier Years Tax (375.59) Mat Credit Entitlement (177.18) Deferred Tax (16.89) 590.17 (18.62) 507.75
VII Profit for the Year (V-VI) 7,847.12 17,227.96 VIII Other Comprehensive Income
(i) Items that will not be reclassfied to Profit or loss Fair value of Investments through other comprehensive Income 1,452.44 1,888.14 Acturial gain/(loss) on employee benefits through other
comprehensive Income (43.91) -
1,408.53 1,888.14 (ii) Income tax relating to items that will not be
reclassfied to profit or loss Current tax on fair value of investments through other
comprehensive Income (478.76) (641.78)
929.77 1,246.36 IX Total Comprehensive Income for the period (VII+VIII)
Comprising Profit / (loss) and Other Comprehensive Income for the Period
8,776.89 18,474.32
X Earnings Per Equity Share (for continuing operations) (1) Basic (equity shares, par value ` 2 each) 11.36 24.95 (2) Diluted (equity shares, par value ` 2 each) 11.36 24.95
XI Earnings Per Equity Share (for discontinued operations) (1) Basic (equity shares, par value ` 2 each) - - (2) Diluted (equity shares, par value ` 2 each) - -
XII Earnings Per Equity Share (for discontinued & Continuing operations) (1) Basic (equity shares, par value ` 2 each) 11.36 24.95 (2) Diluted (equity shares, par value ` 2 each) 11.36 24.95
Notes on Financial Statements 1-56
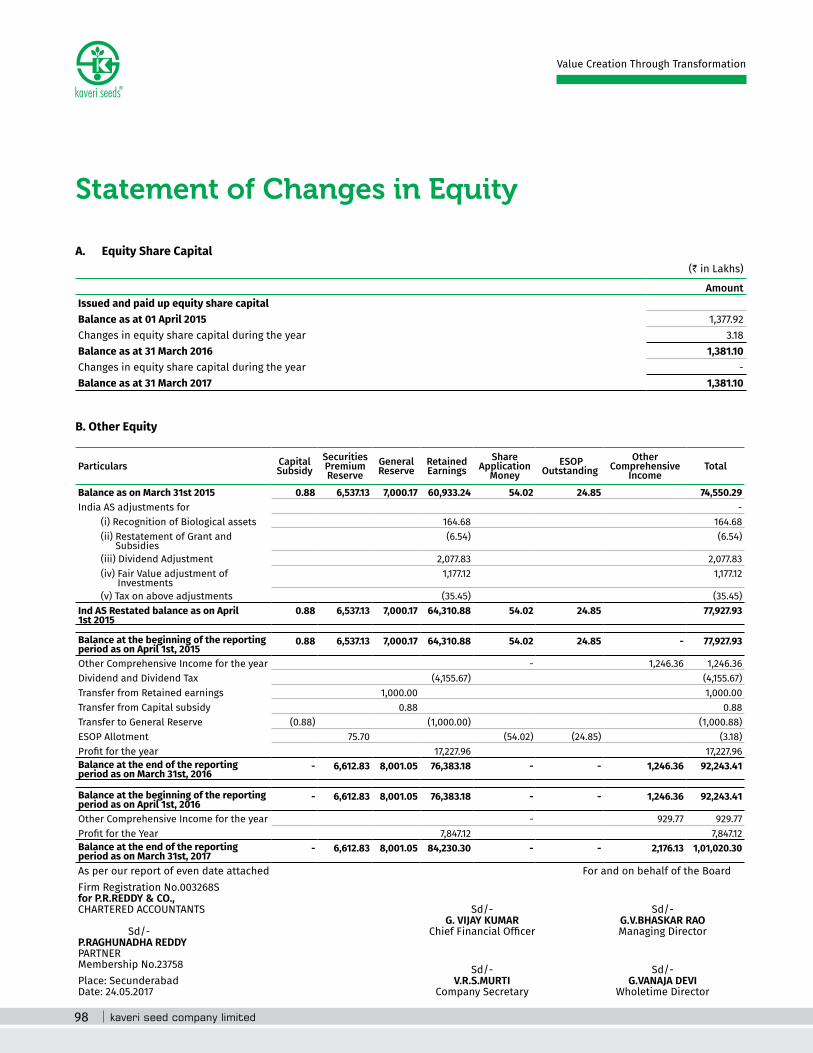
98
Value Creation Through Transformation
Statement of Changes in Equity
A. Equity Share Capital (` in Lakhs)
AmountIssued and paid up equity share capital Balance as at 01 April 2015 1,377.92 Changes in equity share capital during the year 3.18 Balance as at 31 March 2016 1,381.10 Changes in equity share capital during the year -
Balance as at 31 March 2017 1,381.10
B. Other Equity
Particulars Capital Subsidy
Securities Premium Reserve
General Reserve
Retained Earnings
Share Application
Money ESOP
Outstanding Other
Comprehensive Income
Total
Balance as on March 31st 2015 0.88 6,537.13 7,000.17 60,933.24 54.02 24.85 74,550.29 India AS adjustments for -
(i) Recognition of Biological assets 164.68 164.68 (ii) Restatement of Grant and
Subsidies (6.54) (6.54)
(iii) Dividend Adjustment 2,077.83 2,077.83 (iv) Fair Value adjustment of
Investments 1,177.12 1,177.12
(v) Tax on above adjustments (35.45) (35.45)Ind AS Restated balance as on April 1st 2015
0.88 6,537.13 7,000.17 64,310.88 54.02 24.85 77,927.93
Balance at the beginning of the reporting period as on April 1st, 2015
0.88 6,537.13 7,000.17 64,310.88 54.02 24.85 - 77,927.93
Other Comprehensive Income for the year - 1,246.36 1,246.36 Dividend and Dividend Tax (4,155.67) (4,155.67)Transfer from Retained earnings 1,000.00 1,000.00 Transfer from Capital subsidy 0.88 0.88 Transfer to General Reserve (0.88) (1,000.00) (1,000.88)ESOP Allotment 75.70 (54.02) (24.85) (3.18)Profit for the year 17,227.96 17,227.96 Balance at the end of the reporting period as on March 31st, 2016
- 6,612.83 8,001.05 76,383.18 - - 1,246.36 92,243.41
Balance at the beginning of the reporting period as on April 1st, 2016
- 6,612.83 8,001.05 76,383.18 - - 1,246.36 92,243.41
Other Comprehensive Income for the year - 929.77 929.77 Profit for the Year 7,847.12 7,847.12 Balance at the end of the reporting period as on March 31st, 2017
- 6,612.83 8,001.05 84,230.30 - - 2,176.13 1,01,020.30
As per our report of even date attached For and on behalf of the BoardFirm Registration No.003268Sfor P.R.REDDY & CO.,CHARTERED ACCOUNTANTS Sd/- Sd/-
G. VIJAY KUMAR G.V.BHASKAR RAO Sd/- Chief Financial Officer Managing Director
P.RAGHUNADHA REDDYPARTNERMembership No.23758 Sd/- Sd/-Place: Secunderabad V.R.S.MURTI G.VANAJA DEVIDate: 24.05.2017 Company Secretary Wholetime Director

Annual Report 2016-17 99
Statutory reports 30-89
Financial statements 90-188
Company overview 01-29
Statement of Cash Flow
(` in Lakhs)
Particulars As at 31-Mar-2017
As at 31-Mar-2016
Cash flows from operating activitiesProfit before taxation and exceptional items 14,361.09 17,735.71 Adjustments for: Depreciation & Amortisation 2,849.21 2,498.29 (Profit)/Loss on sale of Fixed Assets (23.33) (3.08) Dividend Received (0.54) (6.11) Gain from Investments (3,250.81) (1,024.51) Interest received (118.07) (82.90) Finance charges 12.27 16.90 Operating profit before working capital changes 13,829.82 19,134.30 (Increase) / Decrease in Inventories and Biological Assets 1,869.24 2,128.85 (Increase)/Decrease in Trade Receivables and other receivables (672.09) 3,497.26 (Increase)/Decrease in Loans & Advances (Other assets ) (510.24) 1,270.48 Increase/(Decrease) in Trade Payables 6,509.60 444.22 Increase/(Decrease) in Provisions 1,260.08 (1,673.47)Increase/(Decrease) in Other liabilities (291.85) 397.45 Taxes paid during the year (590.17) (507.75)Net cash provided by operating activities 21,404.38 24,691.34 Cash flows from investing activitiesPayments for property, plant and equipment (3,564.38) (2,520.32)Proceeds from disposal of property, plant and equipment 47.02 23.25 Payments for investment (88,178.97) (85,091.37)Proceeds from disposal of investments 74,057.25 66,329.03 Payments for intangible assets (150.70) (13.29)Proceeds from earmarked deposits with Bank 1.18 (13.67)Loans given to subsidaries (44.60) (109.51)Loans repaid by subsidaries 784.60 11.51 Investment in subsidaries (775.00)Dividend Received 0.54 6.11 Gain from Investments 3,250.81 1,024.51 Interest received 118.07 82.90 Net Cash used for investing activities (14,454.17) (20,270.85)Cash flows from Exceptional Items (5,923.80) - Cash flows from financing activitiesProceeds from borrowings 23.96 Dividend including Tax on Dividend - (4,155.66)Finance charges (12.27) (16.90)Net cash provided by financing activities (12.27) (4,148.60)Net increase in cash & cash equivalents 1,014.15 271.90 Cash & Cash equivalents at the beginning of the period 678.15 406.25 Cash & Cash equivalents at the end of the period 1,692.31 678.15
As per our report of even date attached For and on behalf of the BoardFirm Registration No.003268Sfor P.R.REDDY & CO.,CHARTERED ACCOUNTANTS Sd/- Sd/-
G. VIJAY KUMAR G.V.BHASKAR RAO Sd/- Chief Financial Officer Managing Director
P.RAGHUNADHA REDDYPARTNERMembership No.23758 Sd/- Sd/-Place: Secunderabad V.R.S.MURTI G.VANAJA DEVIDate: 24.05.2017 Company Secretary Wholetime Director

100
Notes forming part of Financial Statements for the year ended March 31, 2017
Value Creation Through Transformation
1 Corporate Information Kaveri Seed Company Limited (”the Company”) has
been incorporated on August 27, 1986, as private limited company and converted into public limited company on November 07, 2006 . The company has been listed on 04.10.2007 on the Bombay Stock Exchange and the National Stock Exchange in India. The company is into research, production, processing and marketing of various high quality hybrid seeds.
The financial statements reflect the results of its operations carried on by the company.
2 Summary of significant accounting policies2.1 Statement of Compliance: The financial statements have been prepared in
accordance with the Indian Accounting Standards (Ind AS) specified under Section 133 of the Companies Act, 2013, read with Rule 3 of the Companies (Indian Accounting Standards) Rules, 2015. These are the Company’s first financial statements prepared in accordance with Ind AS and Ind AS 101 First time adoption of Indian Accounting Standards has been applied.
Upto the year ended March 31, 2016, the company prepared its financial statements in accordance with the requirements of previous GAAP, which includes Standards notified under the Companies (Accounting Standards) Rules, 2006. These are the company’s first Ind AS financial statements. The date of transition to Ind AS is April 1, 2015.
2.2 Basis for preparation of financial statements: The financial statements have been prepared on accrual
and going concern basis. The accounting policies are applied consistently to all the periods presented in the financial statements, including the preparation of the opening Ind AS Balance Sheet as at 1st April,2015 being the date of transition to Ind AS. All assets and liabilities have been classified as current or non current as per the Company’s normal operating cycle and other criteria as set out in the Division II of Schedule III of Companies Act 2013. Based on the nature of products and the time between acquisition of assets for processing and their realisation in cash and cash equivalents, the company has ascertained its operating cycle as 12 months for
the purpose of current or non-current classification of assets and liabilities.
2.3 Use of Estimates: The preparation of financial statements requires the
management of the company to make estimates and assumptions to be made that affect the reported amounts of assets and liabilities on the date of financial statements, disclosure of contingent liabilities as at the date of the financial statements, and the reported amounts of income and expenses during the reported period. Changes in estimates are reflected in the financial statements in the period in which changes are made and, if material, their effects are disclosed in the financial statements.
2.4 Property, Plant & Equipment and Other Intangible assets: Property, plant and equipment is stated at acquisition
cost net of accumulated depreciation and accumulated impairment losses, if any. Subsequent costs are included in the asset’s carrying amount or recognised as a separate asset, as appropriate, only when it is probable that future economic benefits associated with the item will flow to the Company and the cost of the item can be measured reliably. All other repairs and maintenance are charged to the Statement of Profit and Loss during the period in which they are incurred. Gains or losses arising on retirement or disposal of property, plant and equipment are recognised in the Statement of Profit and Loss. Property, plant and equipment which are not ready for intended use as on the date of Balance Sheet are disclosed as “Capital work-in-progress”. Depreciation is provided on a pro-rata basis on the WDV method based on estimated useful life prescribed under Schedule II to the Companies Act, 2013.
Freehold land is not depreciated.
Upon first-time adoption of Ind AS, the Company has elected to measure all its property, plant and equipment at the Previous GAAP carrying amount as its deemed cost on the date of transition to Ind AS i.e., 1st April,2015.
Separately purchased intangible assets are initially measured at cost. Intangible assets are carried at cost less any accumulated amortisation and accumulated impairment losses, if any.

Annual Report 2016-17 101
Notes forming part of Financial Statements for the year ended March 31, 2017
Statutory reports 30-89
Financial statements 90-188
Company overview 01-29
2.5 Biological Asset Recognition and measurement The company recognises the biological asset
(agricultural produce) when:
(a) the company controls the asset as a result of past events;
(b) it is probable that future economic benefits associated with the asset will flow to the company; and
(c) the fair value or cost of the asset can be measured reliably.
The biological asset are measured on initial recognition and at the end of each reporting period at its fair value less costs to sell.
A gain or loss arising on initial recognition of biological asset at fair value less costs to sell is included in retained earnings and thereafter in profit or loss for the period in which it arised.
2.6 Leases: Leases in which a substantial portion of the risks and
rewards of ownership are retained by the lessor are classified as operating leases. Payments and receipts under such leases are recognised to the Statement of Profit and Loss on a straight-line basis over the term of the lease unless the lease payments to the lessor are structured to increase in line with expected general inflation to compensate for the lessor’s expected inflationary cost increases, in which case the same are recognised as an expense in line with the contractual term.
2.7 Borrowing Costs Borrowing costs directly attributable to the acquisition,
construction or production of qualifying assets, which are assets that necessarily take a substantial period of time to get ready for their intended use or sale, are added to the cost of those assets, until such time as the assets are substantially ready for their intended use or sale.
Interest income earned on the temporary investment of specific borrowings pending their expenditure on qualifying assets is deducted from the borrowing costs eligible for capitalisation.
All other borrowing costs are recognised in profit or loss in the period in which they are incurred.
2.8 Government Grants Government Grants are recognised in profit or loss on a
systematic basis over the periods in which the company recognises as expenses the related cost for which the grants are intended to compensate. Specifically, government grants whose primary condition is that the company purchase, construct or otherwise acquire non-current assets are recognised as deferred revenue in the balance sheet and transferred to profit or loss on a systematic and rational basis over the useful lives of the related assets.
Government grants that are receivable as compensation for expenses or losses already incurred or for the purpose of giving immediate financial support to the company with no future related costs are recognised in profit or loss in the period in which they become receivable.
2.9 Impairment of Assets: i) Financial assets Company assesses at each balance sheet date
whether there is objective evidence that a financial asset or a company of financial assets is impaired. A financial asset is considered to be impaired if objective evidence indicates that one or more events have had a negative effect on the estimated future cash flows of that asset.
Impairment loss on financial assets carried at amortised cost is measured at the difference between the asset’s carrying amount and the present value of estimated future cash flows, discounted at the financial asset’s original effective interest rate. In a subsequent period, if

102
Notes forming part of Financial Statements for the year ended March 31, 2017
Value Creation Through Transformation
the amount of impairment loss decreases and the decreases can be related objectively to an event, the previously recognised impairment is reversed through profit or loss.
ii) Non-financial assets Property, Plant & Equipment and Other Intangible
assets Property, Plant and Equipment and Other
intangible assets with definite life are evaluated for recoverability whenever there is any indication that their carrying amounts may not be recoverable. If any such indication exists, the recoverable amount (i.e. higher of the fair value less cost to sell and the value-in-use) is determined on an individual asset basis unless the asset does not generate cash flows that are largely independent of those from other assets. In such cases, the recoverable amount is determined for the cash generating unit (CGU) to which the asset belongs.
If the recoverable amount of an asset (or CGU) is estimated to be less than its carrying amount, the carrying amount of the asset (or CGU) is reduced to its recoverable amount. An impairment loss is recognised in the profit or loss
2. 10 Revenue recognition: Revenue from sale of goods is recognised when all
the significant risks and rewards of ownership in the goods are transferred to the buyer as per the terms of the contract, there is no continuing managerial involvement with the goods and the amount of revenue can be measured reliably. The Company retains no effective control of the goods transferred to a degree usually associated with ownership and no significant uncertainty exists regarding the amount of the consideration that will be derived from the sale of goods. Revenue is measured at fair value of the consideration received or receivable, after deduction of any trade discounts, schemes, volume rebates and any taxes or duties collected on behalf of the government which are levied on sales such as sales tax, value added tax, etc
Income from export incentives such as duty drawback and premium on sale of import licenses, and lease license fee are recognised on accrual basis.
2.11 Dividend and Interest Income Dividend income from investments is recognised when
the shareholders right to receive payment has been established (provided that it is probable that the economic benefits will flow to the company and the amount of income can be measured reliably).
Interest income from a financial asset is recognised when it is probable that the economic benefits will flow to the company and the amount of income can be measured reliably. Interest income is accrued on a time basis, by reference to the principal outstanding and at the effective interest rate applicable, which is the rate that exactly discounts estimated future cash receipts through the expected life of the financial asset to that asset’s net carrying amount on initial recognition.
2.12 Foreign currency transactions: The functional currency of the Company is Indian
Rupees (INR).
Foreign currency transactions are recorded at exchange rates prevailing on the date of the transaction. Gains and losses arising on settlement are included in the profit or loss.
2.13 Financial Instruments Financial assets and liabilities are recognised when the
company becomes a party to the contractual provisions of the instrument.
Financial assets and liabilities are initially measured at fair value. Transaction costs that are directly attributable to the acquisition or issue of financial assets and financial liabilities (other than financial assets and financial liabilities at fair value through profit or loss) are added to or deducted from the fair value measured on initial recognition of financial asset or financial liability.

Annual Report 2016-17 103
Notes forming part of Financial Statements for the year ended March 31, 2017
Statutory reports 30-89
Financial statements 90-188
Company overview 01-29
Transaction costs directly attributable to the acquisition of financial assets or financial liabilities at fair value through profit or loss are recognised in profit or loss.
i) Non-derivative financial instruments Cash and cash equivalents The company considers all highly liquid financial
instruments, which are readily convertible into known amounts of cash that are subject to an insignificant risk of change in value and having original maturities of three months or less from the date of purchase, to be cash equivalents. Cash and cash equivalents consist of balances with banks which are unrestricted for withdrawal and usage.
Financial assets at fair value through other comprehensive income
Financial assets are measured at fair value through other comprehensive income if these financial assets are held within a business whose objective is achieved by both collecting contractual cash flows on specified dates that are solely payments of prinicipal and interest on the prinicipal amount outstanding and selling financial assets.
The company, has made an irrevocable election to present in other comprehensive income subsequent changes in fair value of investments not held for trading.
Financial assets at cost Investment in subsidiaries are measured at cost.
Financial liabilities Financial liabilities at fair value through profit
and loss are stated at fair value, with any gains or losses arising on remeasurement recognised in profit and loss.
For trade and other payables maturing within one year from the Balance Sheet date, the carrying amounts approximate fair value due to the short maturity of these instruments.
2.14 Employee Benefits: a) Gratuity: The company accounts for its gratuity liability, a
defined retirement benefit plan covering eligible employees. The gratuity plan provides for a lump sum payment to employees at retirement, death, incapacitation or termination of the employment based on the respective employee’s salary and the tenure of the employment. Liabilities with regard to a Gratuity plan are determined based on the actuarial valuation carried out by an independent actuary as at the Balance Sheet date using the Projected Unit Credit method for the Company.
Actuarial gains and losses are recognised in full in other comprehensive income and accumulated in equity in the period in which they occur.
b) Provident fund: The eligible employees of the Company are entitled
to receive the benefits of Provident fund, a defined contribution plan, in which both employees and the Company and its subsidiaries make monthly contributions at a specified percentage of the covered employees’ salary (currently at 12% of the basic salary) which are charged to the Statement of Profit and Loss on accrual basis. The provident fund contributions are paid to the Regional Provident Fund Commissioner by the Company.
The Company has no further obligations for future provident fund and superannuation fund benefits other than its annual contributions.
c) Compensated absences: The company provides for the encashment of leave
subject to certain company’s rules. The employees are entitled to accumulate leave subject to certain limits, for future encashment or availment. The liability is provided based on the number of days of unavailed leave at each Balance Sheet date on the basis of an independent actuarial valuation using the Projected Unit Credit method for the Company and its subsidiaries.
104
Notes forming part of Financial Statements for the year ended March 31, 2017
Value Creation Through Transformation
The liability which is not expected to occur within twelve months after the end of the period in which the employee renders the related services are recognised based on actuarial valuation as at the Balance Sheet date.
Actuarial gains and losses are recognised in full in the Statement of Profit and Loss in the period in which they occur.
The company also offers a short term benefit in the form of encashment of unavailed accumulated compensated absence above certain limit for all of its employees and same is being provided for in the books at actual cost.
d) Other short term employee benefits: Other short-term employee benefits such as
performance incentives expected to be paid in exchange for the services rendered by employees, are recognised during the period when the employee renders the service.
2.15 Share Based Payment Arrangements Employees of the Company receive remuneration in the
form of sharebased payments in consideration of the services rendered.
Under the equity settled share based payment, the fair value on the grant date of the awards given to employees is recognised as ‘employee benefit expenses’ with a corresponding increase in equity over the vesting period. The fair value of the options at the grant date is calculated by an independant valuer basis Black Scholes model. At the end of each reporting period, apart from the non market vesting condition, the expense is reviewed and adjusted to reflect changes to the level of options expected to vest. When the options are exercised, the Company issues fresh equity shares.
For cash-settled share based payments, the fair value of the amount payable to employees is recognised as ‘employee benefit expenses’ with a corresponding increase in liabilities, over the period of non market vesting conditions getting fulfilled. The liability is
remeasured at each reporting period up to, and including the settlement date, with changes in fair value recognised in employee benefits expenses.
2.16 Inventories Inventories comprise of Raw and Packing Materials,
Work in Progress, Finished Goods(Manufactured and Traded). Inventories are valued at the lower of cost or the net realisable value after providing for obsolescence and other losses, where considered necessary. Cost is determined on FIFO basis. Cost includes all charges in bringing the goods to their present location and condition, including octroi and other levies, transit insurance and receiving charges. The cost of work-in-progress and finished goods comprises of materials, direct labour, other direct costs and related production overheads. Net realizable value is the estimated selling price in the ordinary course of business less the estimated costs of completion and the estimated costs necessary to make the sale.
2.17 Trade Receivables Trade receivables are stated at net of advances. Ageing
of receivable are considered as tool to determine the degree of liquidity. Receivable due for more than two years and balance considered doubtful, referred for recovery through legal proceeding are considered for provision.
2.18 Taxation: Tax expense comprises of current tax and deferred tax.
Current tax is measured at the amount expected to be paid to / recovered from the tax authorities, based on estimated tax liability computed after taking credit for allowances and exemption in accordance with the tax laws applicable in India.
Minimum Alternative Tax (MAT) paid in accordance with the tax laws, which gives rise to future economic benefits in the form of adjustment of future income tax liability is considered as an asset if there is convincing evidence that the company will pay normal tax in future periods. Accordingly, it is recognized as an asset in the Balance Sheet when it is probable that the future economic benefit associated with it will flow to the company and the asset can be measured reliably.

Annual Report 2016-17 105
Notes forming part of Financial Statements for the year ended March 31, 2017
Statutory reports 30-89
Financial statements 90-188
Company overview 01-29
Deferred income taxes Deferred income tax is recognised using the balance
sheet approach. Deferred income tax assets and liabilities are recognised for deductible and taxable temporary differences arising between the tax base of assets and liabilities and their carrying amount.
Deferred income tax asset are recognised to the extent that it is probable that taxable profit will be available against which the deductible temporary differences and the carry forward of unused tax credits and unused tax losses can be utilised.
Deferred income tax liabilities are recognised for all taxable temporary differences except in respect of taxable temporary differences associated with investments in subsidiaries where the timing of the reversal of the temporary difference can be controlled and it is probable that the temporary difference will not reverse in the foreseeable future.
The carrying amount of deferred income tax assets is reviewed at each reporting date and reduced to the extent that it is no longer probable that sufficient taxable profit will be available to allow all or part of the deferred income tax asset to be utilised.
Deferred tax assets and liabilities are measured using substantively enacted tax rates expected to apply to taxable income in the years in which the temporary differences are expected to be received or settled.
2.19 Earnings per Share: Basic earnings/ (loss) per share are calculated by
dividing the net profit / (loss) for the period attributable to equity shareholders by the weighted average number of equity shares outstanding during the period.
For the purpose of calculating diluted earnings / (loss) per share, the net profit / (loss) for the period attributable to equity shareholders and the weighted average number of shares outstanding during the period are adjusted for the effects of all dilutive potential equity shares.
The dilutive potential equity shares are adjusted for the proceeds receivable, had the shares been issued at
fair value. Dilutive potential equity shares are deemed converted as of the beginning of the period, unless issued at a later date.
2. 20 Provision, Contingent Liabilities and Contingent Assets:
A provision is recognized when the company has a present obligation as a result of past event and it is probable that an outflow of resources will be required to settle the obligation, in respect of which reliable estimate can be made. If the effect of the time value of money is material, provisions are discounted using a current pre-tax rate that reflects, when appropriate, the risks specific to the liability. When discounting is used, the increase in the provision due to the passage of time is recognised as a finance cost.
Contingent Liabilities and Contingent Assets are not recognized in the financial statements.
3 Explanation of Transition to Ind AS The Transition as at April 1,2015 to Ind AS was carried
out from Previous GAAP. The exemptions and exceptions applied by the company in accordance with Ind AS 101 - First-time Adoption of Indian Accounting Standards, the reconciliations of equity and total comprehensive income in accordance with previous GAAP to Ind AS are explained below.
The company has applied the following exemptions: (a) Deemed cost for property, plant and equipment
and intangible assets
The company has elected to continue with the carrying value of all its property, plant and equipment, investment property, and intangible assets recognised as of 01 April 2015 (the transition date) measured as per the previous GAAP and use that carrying value as its deemed cost as of the transition date.
(b) Investment in subsidiaries The Company has elected to measure its
investments in subsidiaries at the Previous GAAP carrying amount as its deemed cost on the date of transition to Ind AS.
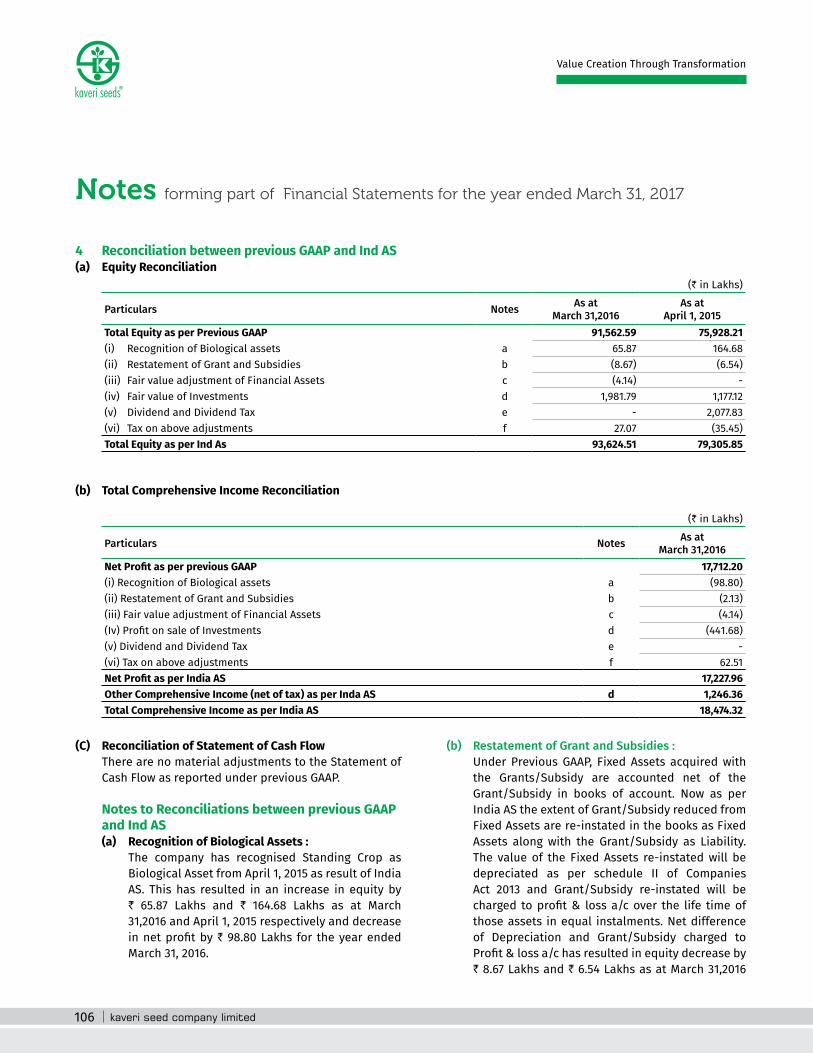
106
Notes forming part of Financial Statements for the year ended March 31, 2017
Value Creation Through Transformation
4 Reconciliation between previous GAAP and Ind AS(a) Equity Reconciliation
(` in Lakhs)
Particulars Notes As at March 31,2016
As at April 1, 2015
Total Equity as per Previous GAAP 91,562.59 75,928.21 (i) Recognition of Biological assets a 65.87 164.68 (ii) Restatement of Grant and Subsidies b (8.67) (6.54)(iii) Fair value adjustment of Financial Assets c (4.14) -
(iv) Fair value of Investments d 1,981.79 1,177.12 (v) Dividend and Dividend Tax e - 2,077.83 (vi) Tax on above adjustments f 27.07 (35.45)Total Equity as per Ind As 93,624.51 79,305.85
(b) Total Comprehensive Income Reconciliation
(` in Lakhs)
Particulars Notes As at March 31,2016
Net Profit as per previous GAAP 17,712.20 (i) Recognition of Biological assets a (98.80)(ii) Restatement of Grant and Subsidies b (2.13)(iii) Fair value adjustment of Financial Assets c (4.14)(Iv) Profit on sale of Investments d (441.68)(v) Dividend and Dividend Tax e -
(vi) Tax on above adjustments f 62.51 Net Profit as per India AS 17,227.96 Other Comprehensive Income (net of tax) as per Inda AS d 1,246.36 Total Comprehensive Income as per India AS 18,474.32
(C) Reconciliation of Statement of Cash Flow There are no material adjustments to the Statement of
Cash Flow as reported under previous GAAP.
Notes to Reconciliations between previous GAAP and Ind AS
(a) Recognition of Biological Assets : The company has recognised Standing Crop as
Biological Asset from April 1, 2015 as result of India AS. This has resulted in an increase in equity by ` 65.87 Lakhs and ` 164.68 Lakhs as at March 31,2016 and April 1, 2015 respectively and decrease in net profit by ` 98.80 Lakhs for the year ended March 31, 2016.
(b) Restatement of Grant and Subsidies : Under Previous GAAP, Fixed Assets acquired with
the Grants/Subsidy are accounted net of the Grant/Subsidy in books of account. Now as per India AS the extent of Grant/Subsidy reduced from Fixed Assets are re-instated in the books as Fixed Assets along with the Grant/Subsidy as Liability. The value of the Fixed Assets re-instated will be depreciated as per schedule II of Companies Act 2013 and Grant/Subsidy re-instated will be charged to profit & loss a/c over the life time of those assets in equal instalments. Net difference of Depreciation and Grant/Subsidy charged to Profit & loss a/c has resulted in equity decrease by ` 8.67 Lakhs and ` 6.54 Lakhs as at March 31,2016

Annual Report 2016-17 107
Notes forming part of Financial Statements for the year ended March 31, 2017
Statutory reports 30-89
Financial statements 90-188
Company overview 01-29
and April 1, 2015 respectively and decrease net profit by ` 2.13 Lakhs for the year ended March 31, 2016.
(c) Fair Value Adjustments of Financial Assets: Under India AS, historical percentage of receivables
written off over the years need to be provided from sales and the same should be reduced in sales and as well as in trade receivables. This has resulted in decrease of equity by ` 4.14 Lakhs and ` Nil as at March 31,2016 and April 1,2015 respectively and decrease in net profit by ` 4.14 Lakhs for the year ended March 31,2016.
(d) Fair Value of Investments : Under previous GAAP, current investments were
measured at cost less diminution in value, under India AS investments are measured at fair value. Net increase in fairvalue after reducing provision for current tax has resulted in increase of equity by ` 1981.79 Lakhs and ` 1177.12 Lakhs as at March 31,2016 and April 1,2015 respectively.
The fairvalue difference as on April 1, 2015 is effected to retained earnings and later increase/decrease is effected to Other Comprehensive
Income (OCI). For the year ended March 31,2016 this has resulted in increase in Other Comprehensive Income (OCI) by ` 1246.36 Lakhs net of provision for current tax and decrease in net profit by `
441.68 Lakhs due to redemption of investment held on April 1,2015 on those fairvalue difference is already effected to retained earings.
(e) Dividend and Dividend Tax : Under India AS, dividend to holders of equity
instruments is recognised as a liability in the year in which the obligation to pay is established. Under previous GAAP, dividend payable is recorded as a liability in the year to which it relates. This has resulted in an increase in equity by ` Nil and `
2077.83 Lakhs as at March 31, 2016 and April 1, 2015 respectively.
(f ) Tax Adjustments : Tax adjustments include deferred tax impact on
account of differences between previous GAAP and Ind AS. These adjustments have resulted in an increase in equity under Ind AS by ` 27.07 Lakhs and ` (35.45) Lakhs as at March 31, 2016 and as at April 1, 2015 respectively and increase in net profit by ` 62.51 Lakhs as at March 31, 2016.
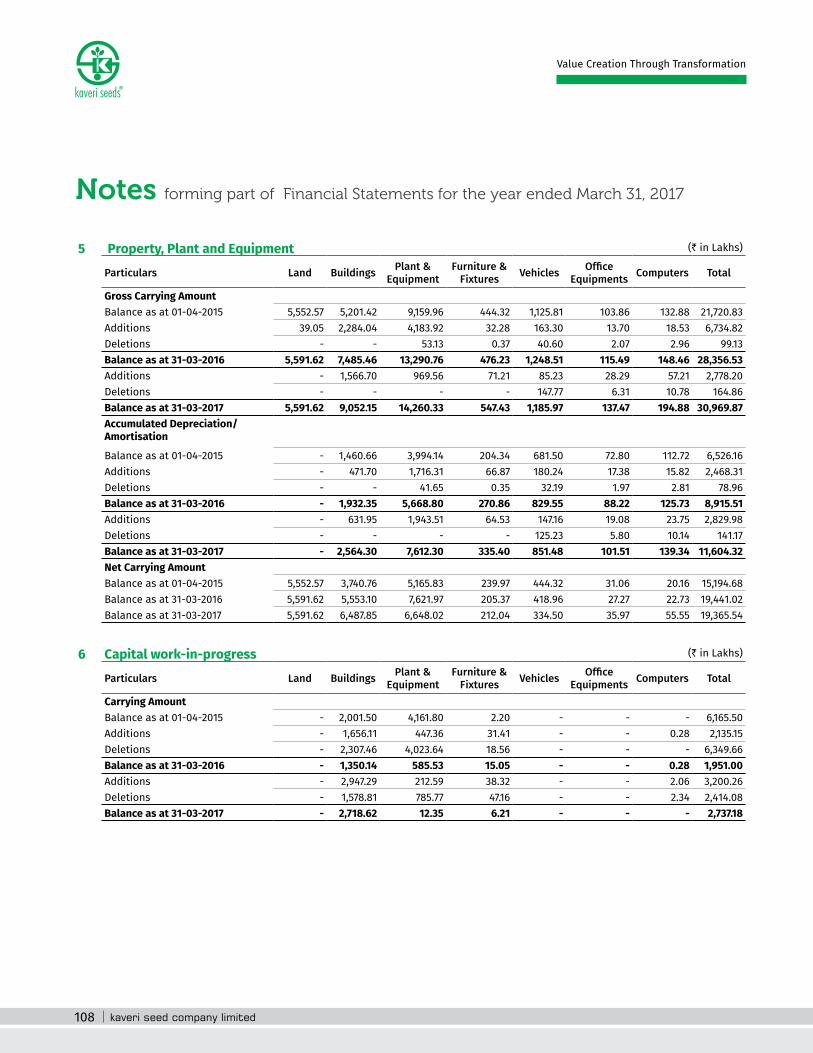
108
Notes forming part of Financial Statements for the year ended March 31, 2017
Value Creation Through Transformation
5 Property, Plant and Equipment (` in Lakhs)
Particulars Land Buildings Plant & Equipment
Furniture & Fixtures Vehicles Office
Equipments Computers Total
Gross Carrying AmountBalance as at 01-04-2015 5,552.57 5,201.42 9,159.96 444.32 1,125.81 103.86 132.88 21,720.83 Additions 39.05 2,284.04 4,183.92 32.28 163.30 13.70 18.53 6,734.82 Deletions - - 53.13 0.37 40.60 2.07 2.96 99.13 Balance as at 31-03-2016 5,591.62 7,485.46 13,290.76 476.23 1,248.51 115.49 148.46 28,356.53 Additions - 1,566.70 969.56 71.21 85.23 28.29 57.21 2,778.20 Deletions - - - - 147.77 6.31 10.78 164.86 Balance as at 31-03-2017 5,591.62 9,052.15 14,260.33 547.43 1,185.97 137.47 194.88 30,969.87 Accumulated Depreciation/Amortisation
Balance as at 01-04-2015 - 1,460.66 3,994.14 204.34 681.50 72.80 112.72 6,526.16 Additions - 471.70 1,716.31 66.87 180.24 17.38 15.82 2,468.31 Deletions - - 41.65 0.35 32.19 1.97 2.81 78.96 Balance as at 31-03-2016 - 1,932.35 5,668.80 270.86 829.55 88.22 125.73 8,915.51 Additions - 631.95 1,943.51 64.53 147.16 19.08 23.75 2,829.98 Deletions - - - - 125.23 5.80 10.14 141.17 Balance as at 31-03-2017 - 2,564.30 7,612.30 335.40 851.48 101.51 139.34 11,604.32 Net Carrying AmountBalance as at 01-04-2015 5,552.57 3,740.76 5,165.83 239.97 444.32 31.06 20.16 15,194.68 Balance as at 31-03-2016 5,591.62 5,553.10 7,621.97 205.37 418.96 27.27 22.73 19,441.02 Balance as at 31-03-2017 5,591.62 6,487.85 6,648.02 212.04 334.50 35.97 55.55 19,365.54
6 Capital work-in-progress (` in Lakhs)
Particulars Land Buildings Plant & Equipment
Furniture & Fixtures Vehicles Office
Equipments Computers Total
Carrying AmountBalance as at 01-04-2015 - 2,001.50 4,161.80 2.20 - - - 6,165.50 Additions - 1,656.11 447.36 31.41 - - 0.28 2,135.15 Deletions - 2,307.46 4,023.64 18.56 - - - 6,349.66 Balance as at 31-03-2016 - 1,350.14 585.53 15.05 - - 0.28 1,951.00 Additions - 2,947.29 212.59 38.32 - - 2.06 3,200.26 Deletions - 1,578.81 785.77 47.16 - - 2.34 2,414.08 Balance as at 31-03-2017 - 2,718.62 12.35 6.21 - - - 2,737.18
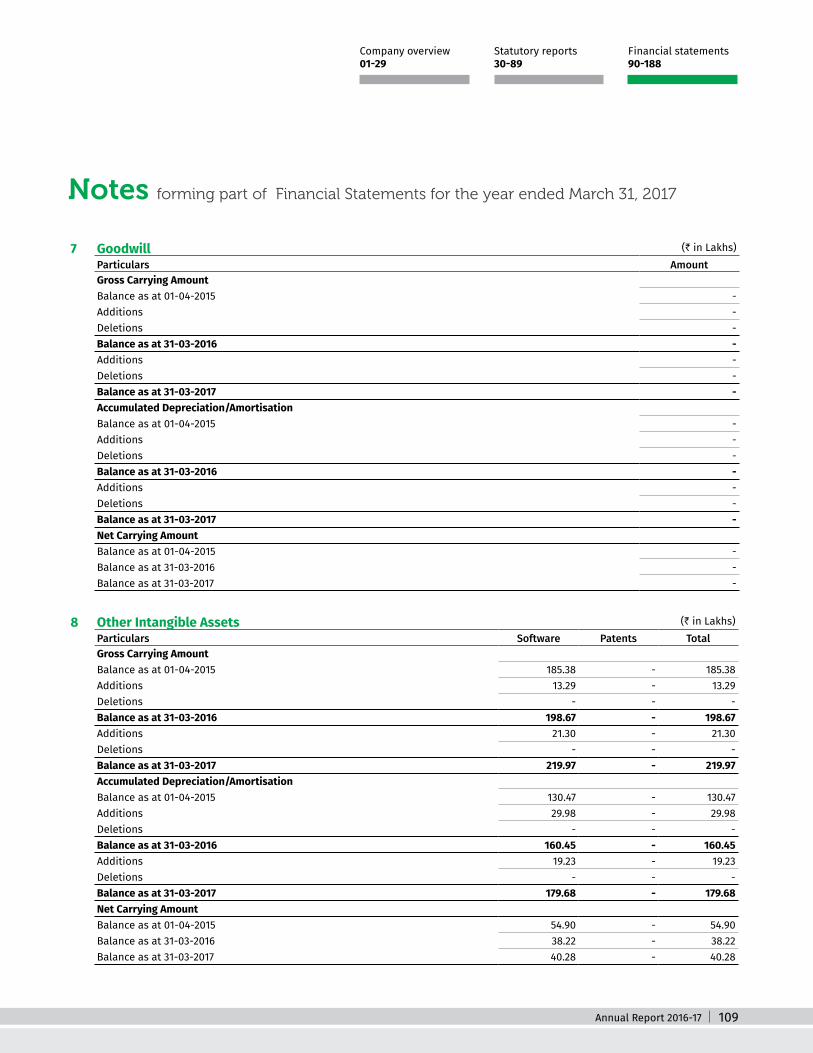
Annual Report 2016-17 109
Notes forming part of Financial Statements for the year ended March 31, 2017
Statutory reports 30-89
Financial statements 90-188
Company overview 01-29
7 Goodwill (` in Lakhs) Particulars AmountGross Carrying AmountBalance as at 01-04-2015 -
Additions -
Deletions -
Balance as at 31-03-2016 -
Additions -
Deletions -
Balance as at 31-03-2017 -
Accumulated Depreciation/AmortisationBalance as at 01-04-2015 -
Additions -
Deletions -
Balance as at 31-03-2016 -
Additions -
Deletions -
Balance as at 31-03-2017 -
Net Carrying AmountBalance as at 01-04-2015 -
Balance as at 31-03-2016 -
Balance as at 31-03-2017 -
8 Other Intangible Assets (` in Lakhs) Particulars Software Patents TotalGross Carrying AmountBalance as at 01-04-2015 185.38 - 185.38 Additions 13.29 - 13.29 Deletions - - -
Balance as at 31-03-2016 198.67 - 198.67 Additions 21.30 - 21.30 Deletions - - -
Balance as at 31-03-2017 219.97 - 219.97 Accumulated Depreciation/AmortisationBalance as at 01-04-2015 130.47 - 130.47 Additions 29.98 - 29.98 Deletions - - -
Balance as at 31-03-2016 160.45 - 160.45 Additions 19.23 - 19.23 Deletions - - -
Balance as at 31-03-2017 179.68 - 179.68 Net Carrying AmountBalance as at 01-04-2015 54.90 - 54.90 Balance as at 31-03-2016 38.22 - 38.22 Balance as at 31-03-2017 40.28 - 40.28

110
Notes forming part of Financial Statements for the year ended March 31, 2017
Value Creation Through Transformation
9 InTangible assets under development (` in Lakhs) Particulars Software TotalCarrying AmountBalance as at 01-04-2015 - -
Additions - -
Deletions - -
Balance as at 31-03-2016 - -
Additions 129.40 129.40 Deletions - -
Balance as at 31-03-2017 129.40 129.40
10 Investments (` in Lakhs)
Particulars As at March 31,2017
As at March 31,2016
As at April 01,2015
Non Current InvestmentsEquity Investments of Subsidaries 2,975.93 2,200.93 2,200.93 Equity Investments of Associates 0.54 0.54 0.55 Equity Investments - Others 115.99 70.27 48.33 Investment in Government Securities 0.30 0.30 0.30 Investment in Real Estate Portfolio Management Fund 125.00 - -
3,217.76 2,272.04 2,250.11 Current Investments
Liquid Mutual Fund Units 9,872.42 8,309.23 8,098.33 Fixed Maturity Plan Mutual Fund Units 7,058.78 3,729.03 1,101.81 Non convertible Debentures - 1,090.48 2,575.82 Other Debt Mutual Fund Units 49,636.61 38,079.55 18,803.77
66,567.81 51,208.29 30,579.74 Less: Provision for Tax on OCI (1,120.53) (641.78) -
65,447.28 50,566.51 30,579.74
(` in Lakhs)
Particulars As at
March 31,2017 As at
March 31,2016 As at
April 01,2015 Qty Nos Amount Qty Nos Amount Qty Nos Amount
Non Current Investments
7,70,000 77.00 7,70,000 77.00 7,70,000 77.00
UNQUOTED Equity Investment in Subsidiaries (Investments Carried at Cost)
Equity shares of ` 10 each fully paid up in Aditya Agritech (P) LtdEquity shares of ` 10 each fully paid up in Kaveri Microtech Pvt Ltd
1,45,36,360 1,453.64 1,45,36,360 1,453.64 1,45,36,360 1,453.64
Equity shares of ` 10 each fully paid up in Genome Agritech Pvt Ltd
91,800 30.29 91,800 30.29 91,800 30.29
Equity shares of ` 10 each fully paid up in Kexveg India Pvt Ltd
1,41,50,000 1,415.00 64,00,000 640.00 64,00,000 640.00
2,975.93 2,200.93 2,200.93

Annual Report 2016-17 111
Notes forming part of Financial Statements for the year ended March 31, 2017
Statutory reports 30-89
Financial statements 90-188
Company overview 01-29
(` in Lakhs)
Particulars As at
March 31,2017 As at
March 31,2016 As at
April 01,2015 Qty Nos Amount Qty Nos Amount Qty Nos Amount
Equity Investments of Associates(Investments Carried at Fair Value through Other Comprehensive Income)Equity Shares of ` 100 each in Swarna Bharat Biotechnics Pvt Ltd - fully paid up
3,600 0.54 3,600 0.54 3,600 0.55
Equity Shares of ` 10 each in Swadeshi Biotechnics Ltd -fully paid up
700 - 700 - 700 -
0.54 0.54 0.55 Investment in Government Securities(Investments Carried at Cost)National Savings Certificates 2 0.30 2 0.30 2 0.30
0.30 0.30 0.30 Investment in Real Estate Portfolio Management Fund(Investments Carried at Fair Value through Other Comprehensive Income)ASK Real Estate Special Situations Mutual Fund 125 125.00
125.00 -
QUOTEDEquity Investments - Others(Other than trade)(Investments Carried at Fair Value through Other Comprehensive Income)Equity shares of ` 10 each In Vijay Textiles Ltd - fully paid up
1,99,425 84.56 1,99,425 37.59 1,99,425 13.96
Equity shares of ` 10 each in Bank of Maharastra - fully paid up
1,900 0.64 1,900 0.55 1,900 0.71
Equity shares of ` 10 each in Indian Overseas Bank - fully paid up
9,700 2.59 9,700 2.94 9,700 4.16
Equity Shares of ` 1 each in Tata Consultancy Services Ltd - full paid up
1,160 28.21 1,160 29.19 1,160 29.50
115.99 70.27 48.33
Current InvestmentsUnquoted(Other than trade) (Investments Carried at Fair Value through Other Comprehensive Income)Liquid Mutual Fund Units
BSL Cash Plus - Growth - Direct Plan 4,66,126 1,218.03 - - - -
HDFC Floating Rate IF-LT-DP-Growth 1,12,41,614 3,233.76 1,12,41,614 2,969.40 1,12,41,614 2,740.91 HDFC Floating Rate IF-ST-DP-WS-Grow - - 96,71,591 2,524.30 - -
HDFC Liquid-DP-Growthoption - - 13,388 400.34 - -
IDFC Money Manager Fund-Investment Plan-Growth-(Direct Plan)
- - - - 83,06,568 1,806.88
IDFC Cash Fund-Growth-(Direct Plan) 29 0.57 57,091 1,051.51 71,636 1,218.24 ICICI Money Market Fund-Drt Growth-P8101 - - - - 3,10,225 600.25
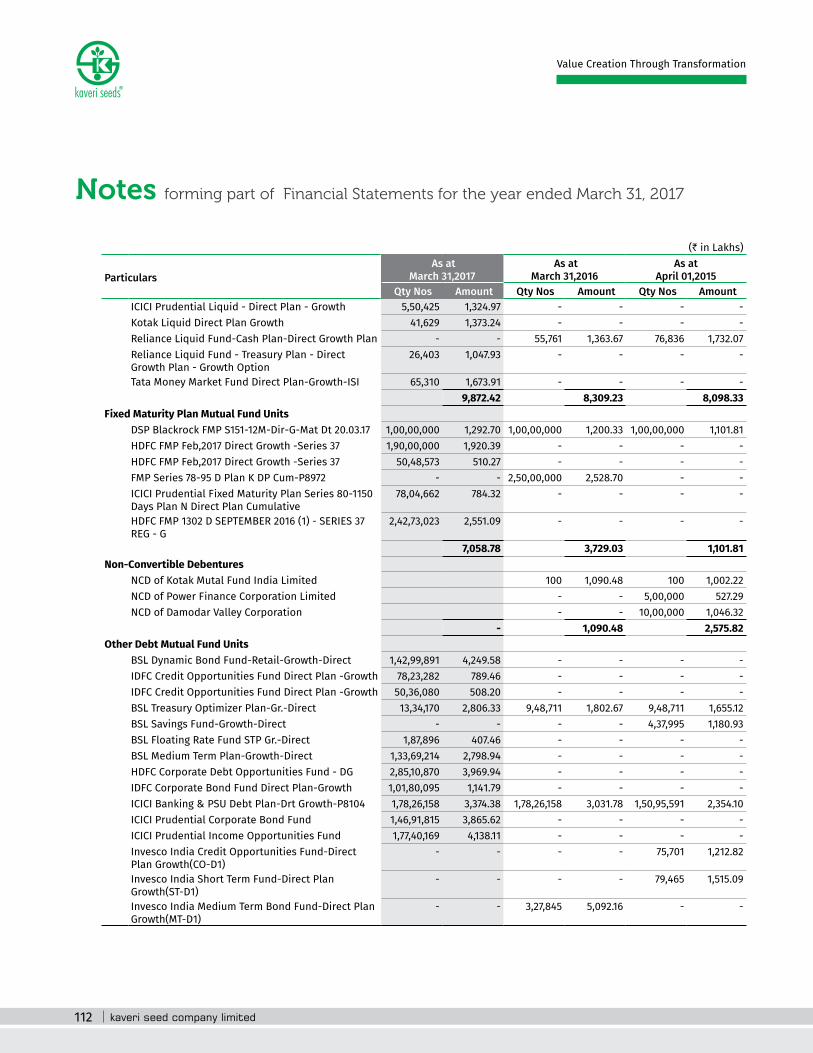
112
Notes forming part of Financial Statements for the year ended March 31, 2017
Value Creation Through Transformation
(` in Lakhs)
Particulars As at
March 31,2017 As at
March 31,2016 As at
April 01,2015 Qty Nos Amount Qty Nos Amount Qty Nos Amount
ICICI Prudential Liquid - Direct Plan - Growth 5,50,425 1,324.97 - - - -
Kotak Liquid Direct Plan Growth 41,629 1,373.24 - - - -
Reliance Liquid Fund-Cash Plan-Direct Growth Plan - - 55,761 1,363.67 76,836 1,732.07 Reliance Liquid Fund - Treasury Plan - Direct Growth Plan - Growth Option
26,403 1,047.93 - - - -
Tata Money Market Fund Direct Plan-Growth-ISI 65,310 1,673.91 - - - -
9,872.42 8,309.23 8,098.33 Fixed Maturity Plan Mutual Fund Units
DSP Blackrock FMP S151-12M-Dir-G-Mat Dt 20.03.17 1,00,00,000 1,292.70 1,00,00,000 1,200.33 1,00,00,000 1,101.81 HDFC FMP Feb,2017 Direct Growth -Series 37 1,90,00,000 1,920.39 - - - -
HDFC FMP Feb,2017 Direct Growth -Series 37 50,48,573 510.27 - - - -
FMP Series 78-95 D Plan K DP Cum-P8972 - - 2,50,00,000 2,528.70 - -
ICICI Prudential Fixed Maturity Plan Series 80-1150 Days Plan N Direct Plan Cumulative
78,04,662 784.32 - - - -
HDFC FMP 1302 D SEPTEMBER 2016 (1) - SERIES 37 REG - G
2,42,73,023 2,551.09 - - - -
7,058.78 3,729.03 1,101.81 Non-Convertible Debentures
NCD of Kotak Mutal Fund India Limited 100 1,090.48 100 1,002.22 NCD of Power Finance Corporation Limited - - 5,00,000 527.29 NCD of Damodar Valley Corporation - - 10,00,000 1,046.32
- 1,090.48 2,575.82 Other Debt Mutual Fund Units
BSL Dynamic Bond Fund-Retail-Growth-Direct 1,42,99,891 4,249.58 - - - -
IDFC Credit Opportunities Fund Direct Plan -Growth 78,23,282 789.46 - - - -
IDFC Credit Opportunities Fund Direct Plan -Growth 50,36,080 508.20 - - - -
BSL Treasury Optimizer Plan-Gr.-Direct 13,34,170 2,806.33 9,48,711 1,802.67 9,48,711 1,655.12 BSL Savings Fund-Growth-Direct - - - - 4,37,995 1,180.93 BSL Floating Rate Fund STP Gr.-Direct 1,87,896 407.46 - - - -
BSL Medium Term Plan-Growth-Direct 1,33,69,214 2,798.94 - - - -
HDFC Corporate Debt Opportunities Fund - DG 2,85,10,870 3,969.94 - - - -
IDFC Corporate Bond Fund Direct Plan-Growth 1,01,80,095 1,141.79 - - - -
ICICI Banking & PSU Debt Plan-Drt Growth-P8104 1,78,26,158 3,374.38 1,78,26,158 3,031.78 1,50,95,591 2,354.10 ICICI Prudential Corporate Bond Fund 1,46,91,815 3,865.62 - - - -
ICICI Prudential Income Opportunities Fund 1,77,40,169 4,138.11 - - - -
Invesco India Credit Opportunities Fund-Direct Plan Growth(CO-D1)
- - - - 75,701 1,212.82
Invesco India Short Term Fund-Direct Plan Growth(ST-D1)
- - - - 79,465 1,515.09
Invesco India Medium Term Bond Fund-Direct Plan Growth(MT-D1)
- - 3,27,845 5,092.16 - -
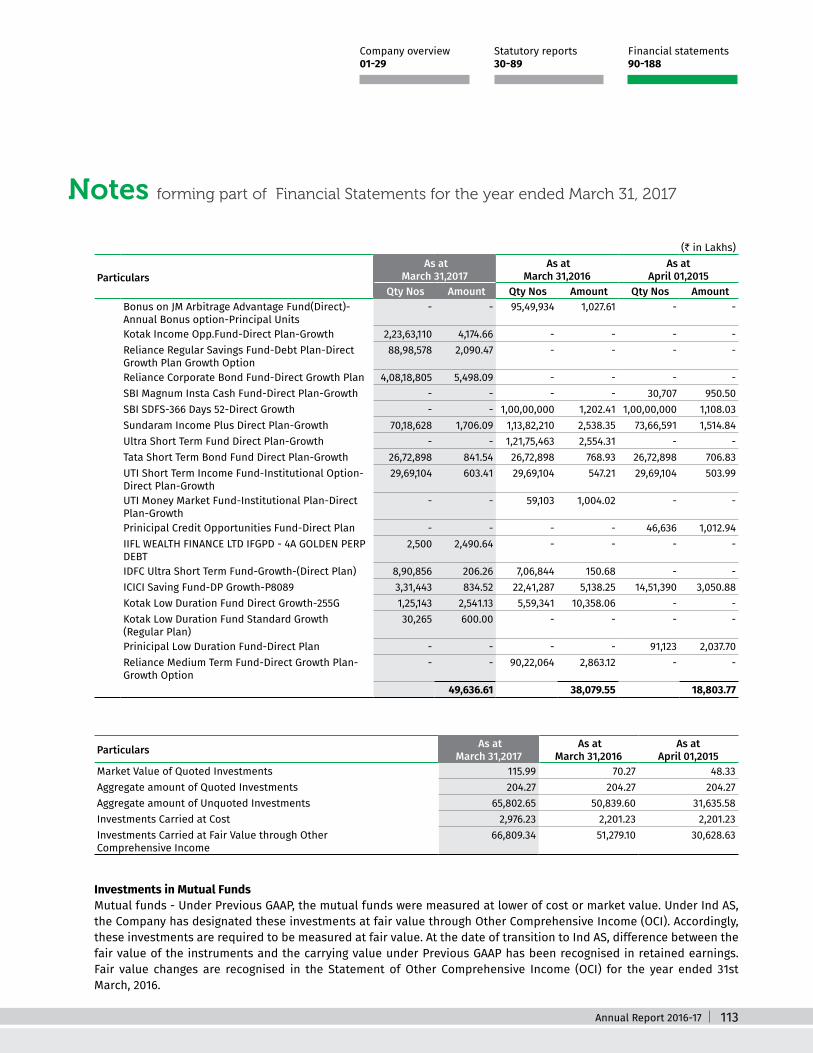
Annual Report 2016-17 113
Notes forming part of Financial Statements for the year ended March 31, 2017
Statutory reports 30-89
Financial statements 90-188
Company overview 01-29
(` in Lakhs)
Particulars As at
March 31,2017 As at
March 31,2016 As at
April 01,2015 Qty Nos Amount Qty Nos Amount Qty Nos Amount
Bonus on JM Arbitrage Advantage Fund(Direct)-Annual Bonus option-Principal Units
- - 95,49,934 1,027.61 - -
Kotak Income Opp.Fund-Direct Plan-Growth 2,23,63,110 4,174.66 - - - -
Reliance Regular Savings Fund-Debt Plan-Direct Growth Plan Growth Option
88,98,578 2,090.47 - - - -
Reliance Corporate Bond Fund-Direct Growth Plan 4,08,18,805 5,498.09 - - - -
SBI Magnum Insta Cash Fund-Direct Plan-Growth - - - - 30,707 950.50 SBI SDFS-366 Days 52-Direct Growth - - 1,00,00,000 1,202.41 1,00,00,000 1,108.03 Sundaram Income Plus Direct Plan-Growth 70,18,628 1,706.09 1,13,82,210 2,538.35 73,66,591 1,514.84 Ultra Short Term Fund Direct Plan-Growth - - 1,21,75,463 2,554.31 - -
Tata Short Term Bond Fund Direct Plan-Growth 26,72,898 841.54 26,72,898 768.93 26,72,898 706.83 UTI Short Term Income Fund-Institutional Option-Direct Plan-Growth
29,69,104 603.41 29,69,104 547.21 29,69,104 503.99
UTI Money Market Fund-Institutional Plan-Direct Plan-Growth
- - 59,103 1,004.02 - -
Prinicipal Credit Opportunities Fund-Direct Plan - - - - 46,636 1,012.94 IIFL WEALTH FINANCE LTD IFGPD - 4A GOLDEN PERP DEBT
2,500 2,490.64 - - - -
IDFC Ultra Short Term Fund-Growth-(Direct Plan) 8,90,856 206.26 7,06,844 150.68 - -
ICICI Saving Fund-DP Growth-P8089 3,31,443 834.52 22,41,287 5,138.25 14,51,390 3,050.88 Kotak Low Duration Fund Direct Growth-255G 1,25,143 2,541.13 5,59,341 10,358.06 - -
Kotak Low Duration Fund Standard Growth (Regular Plan)
30,265 600.00 - - - -
Prinicipal Low Duration Fund-Direct Plan - - - - 91,123 2,037.70 Reliance Medium Term Fund-Direct Growth Plan-Growth Option
- - 90,22,064 2,863.12 - -
49,636.61 38,079.55 18,803.77
Particulars As at March 31,2017
As at March 31,2016
As at April 01,2015
Market Value of Quoted Investments 115.99 70.27 48.33 Aggregate amount of Quoted Investments 204.27 204.27 204.27 Aggregate amount of Unquoted Investments 65,802.65 50,839.60 31,635.58 Investments Carried at Cost 2,976.23 2,201.23 2,201.23 Investments Carried at Fair Value through Other Comprehensive Income
66,809.34 51,279.10 30,628.63
Investments in Mutual Funds Mutual funds - Under Previous GAAP, the mutual funds were measured at lower of cost or market value. Under Ind AS,
the Company has designated these investments at fair value through Other Comprehensive Income (OCI). Accordingly, these investments are required to be measured at fair value. At the date of transition to Ind AS, difference between the fair value of the instruments and the carrying value under Previous GAAP has been recognised in retained earnings. Fair value changes are recognised in the Statement of Other Comprehensive Income (OCI) for the year ended 31st March, 2016.

114
Notes forming part of Financial Statements for the year ended March 31, 2017
Value Creation Through Transformation
Investments in Subsidaries Investments in Subsidaries - Under Previous GAAP were measured at cost. Under Ind AS, the Company has designated
these investments at cost only.
Investments in Associates & Other Equities Investment in Associates & Other Equities - Under Previous GAAP were measured at lower of cost or market value .
Under Ind AS, the Company has designated these investments at fair value through Other Comprehensive Income (OCI). Accordingly, these investments are required to be measured at fair value. At the date of transition to Ind AS, difference between the fair value of the instruments and the carrying value under Previous GAAP has been recognised in retained earnings. Fair value changes are recognised in the Statement of Other Comprehensive Income (OCI) for the year ended 31st March, 2016.
Equity Investment in Subsidiaries
Particulars Nature of Business
Proportion (%) of equity interest March 31,2017 March 31,2016 April 01,2015
Equity shares of ` 10 each fully paid up in Aditya Agritech Pvt Ltd Seeds 70 70 70 Equity shares of ` 10 each fully paid up in Kaveri Microtech Pvt Ltd Micronutrients 100 100 100 Equity shares of ` 10 each fully paid up in Genome Agritech Pvt Ltd Seeds 51 51 51 Equity shares of ` 10 each fully paid up in Kex veg India Pvt Ltd Vegetables 100 100 100
11 Other Financial Assets (Non - Current) (` in Lakhs)
Particulars As at March 31,2017
As at March 31,2016
As at April 01,2015
Unsecured and considered good Advance paid to ASK Real Estate Fund 375.00 - -
375.00
500.00Lakhs paid to M/s. ASK Real Estate Fund, out of this 125 units of ASK Real Estate Special Situation Mutual Fund has been allotted for ` 125.00Lakhs. The balance amount of ` 375.00 Lakhs was kept as advance for further allottment of Real Estate Fund units.
12 Deferred tax assets (net) (` in Lakhs)
Particulars As at March 31,2017
As at March 31,2016
As at April 01,2015
Defered Tax Liability on account of differences in depreciation as per tax books and financial books. 6.15 (0.65) (8.00)
Deferred tax asset arising on account of timing differences relating to:
-
Provision for Bad and doubtful trade receivables 25.80 14.89 3.03 Employee Benefits 0.44 1.26 1.85
32.39 15.50 (3.12)
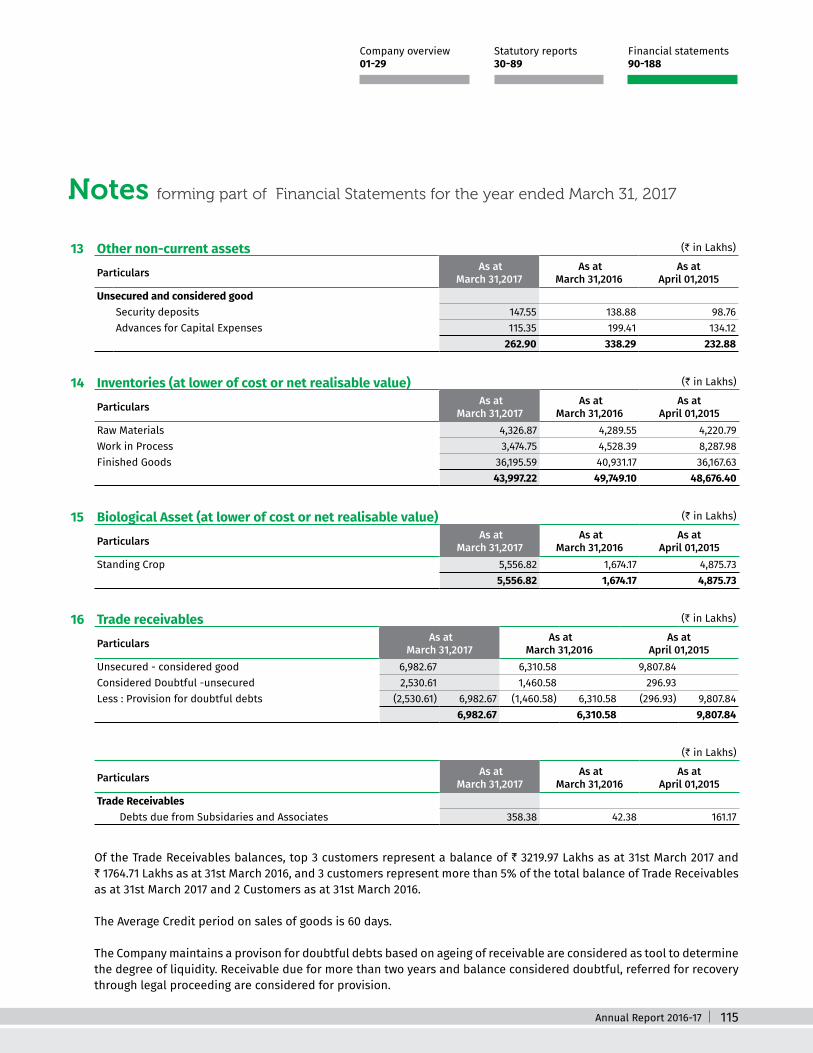
Annual Report 2016-17 115
Notes forming part of Financial Statements for the year ended March 31, 2017
Statutory reports 30-89
Financial statements 90-188
Company overview 01-29
13 Other non-current assets (` in Lakhs)
Particulars As at March 31,2017
As at March 31,2016
As at April 01,2015
Unsecured and considered good Security deposits 147.55 138.88 98.76 Advances for Capital Expenses 115.35 199.41 134.12
262.90 338.29 232.88
14 Inventories (at lower of cost or net realisable value) (` in Lakhs)
Particulars As at March 31,2017
As at March 31,2016
As at April 01,2015
Raw Materials 4,326.87 4,289.55 4,220.79 Work in Process 3,474.75 4,528.39 8,287.98 Finished Goods 36,195.59 40,931.17 36,167.63
43,997.22 49,749.10 48,676.40
15 Biological Asset (at lower of cost or net realisable value) (` in Lakhs)
Particulars As at March 31,2017
As at March 31,2016
As at April 01,2015
Standing Crop 5,556.82 1,674.17 4,875.73 5,556.82 1,674.17 4,875.73
16 Trade receivables (` in Lakhs)
Particulars As at March 31,2017
As at March 31,2016
As at April 01,2015
Unsecured - considered good 6,982.67 6,310.58 9,807.84 Considered Doubtful -unsecured 2,530.61 1,460.58 296.93 Less : Provision for doubtful debts (2,530.61) 6,982.67 (1,460.58) 6,310.58 (296.93) 9,807.84
6,982.67 6,310.58 9,807.84
(` in Lakhs)
Particulars As at March 31,2017
As at March 31,2016
As at April 01,2015
Trade Receivables Debts due from Subsidaries and Associates 358.38 42.38 161.17
Of the Trade Receivables balances, top 3 customers represent a balance of ` 3219.97 Lakhs as at 31st March 2017 and ` 1764.71 Lakhs as at 31st March 2016, and 3 customers represent more than 5% of the total balance of Trade Receivables as at 31st March 2017 and 2 Customers as at 31st March 2016.
The Average Credit period on sales of goods is 60 days.
The Company maintains a provison for doubtful debts based on ageing of receivable are considered as tool to determine the degree of liquidity. Receivable due for more than two years and balance considered doubtful, referred for recovery through legal proceeding are considered for provision.

116
Notes forming part of Financial Statements for the year ended March 31, 2017
Value Creation Through Transformation
(` in Lakhs)
Particulars As at March 31,2017
As at March 31,2016
Movement in the Provision for doubtful debtsBalance at the beginning of the year 1,460.58 296.93 Movement in provision for doubtful debts based on ageing 1070.03 1163.65Balance at the end of the year 2,530.61 1,460.58
17 Cash and cash equivalents (` in Lakhs)
Particulars As at March 31,2017
As at March 31,2016
As at April 01,2015
1. Cash on hand 5.24 3.62 2.94 2. Balances with Banks - Current Accounts 1,687.07 674.53 403.31
1,692.31 678.15 406.25
Details of Specified Bank Notes (SBN) held and transacted during demonetisation period from 08-11-2016 to 30-12-2016 (` in Lakhs)
Particulars SBNs Other denomination notes Total
Closing cash in hand as on 08-11-2016 5.50 17.93 23.43 (+) Permited Receipts - 17.15 17.15 (-) Permitted Payments - 22.43 22.43 (-) Amount deposited in Banks 5.50 0.55 6.04 Closing Cash in hand as on 30-12-2016 - 12.10 12.10
Threre are no Repatriation restricutions with regard to cash and cash equivalents as at the end of the reporting period and prior periods.
Explanation : For the purposes of this clause, the term ‘Specified Bank Notes’ shall have the same meaning provided in the notification of the Government of India, in the Ministry of Finance, Department of Economic Affairs number S.O. 3407(E), dated the 8th November, 2016.
18 Bank balances other than above (` in Lakhs)
Particulars As at March 31,2017
As at March 31,2016
As at April 01,2015
i Fixed deposits with original maturity more than 3 months but less than 12 months
- - -
ii Earmarked balances with banks - Deposit Accounts 12.49 13.67 -
Total 12.49 13.67 -

Annual Report 2016-17 117
Notes forming part of Financial Statements for the year ended March 31, 2017
Statutory reports 30-89
Financial statements 90-188
Company overview 01-29
Deposit in Earmarked balance with banks represents bank balance in unclaimed dividend accounts.
19 Loans (` in Lakhs)
Particulars As at March 31,2017
As at March 31,2016
As at April 01,2015
Unsecured and Considered Good Loans to Subsidary Companies 740.00 642.00
- 740.00 642.00
20 Current Tax Assets (` in Lakhs)
Particulars As at March 31,2017
As at March 31,2016
As at April 01,2015
Income Tax Refund due 397.61 - -
397.61 - -
Tax Refund includes ` 375.59 Lakhs of earlier years and ` 22.02 Lakhs of current year.
21 Other current assets (` in Lakhs)
Particulars As at March 31,2017
As at March 31,2016
As at April 01,2015
Unsecured and considered good Advance to suppliers 1,237.58 989.64 1,064.35 Advance to Staff 46.29 47.64 90.01 Prepaid expenses 70.91 571.90 1,296.58 Others 11.61 51.55 601.17 Gratuity Advance 90.46 - -
1,456.85 1,660.72 3,052.11
22 Equity Share Capital (` in Lakhs)
Particulars As at March 31,2017
As at March 31,2016
As at April 01,2015
SHARE CAPITAL Authorised 10,00,00,000 (10,00,00,000) Equtity shares of ` 2/-(` 2/-) each 2,000.00 2,000.00 2,000.00 Issued,Subscribed & Paid up 6,90,55,095/-(6,90,55,095) Equtity shares of ` 2/-(` 2/-) each-fully
paid up 1,381.10 1,381.10 1,377.92
1,381.10 1,381.10 1,377.92

118
Notes forming part of Financial Statements for the year ended March 31, 2017
Value Creation Through Transformation
a) Reconcilation of number of Shares Equity Shares
(` in Lakhs)
Particulars As at March 31,2017 As at March 31,2016 As at April 01,2015
No of shares (`) No of shares (`) No of shares (`)At the beginning of the year 6,90,55,095 1,381.10 6,88,96,195 1,377.92 6,88,96,195 1,377.92 Add: Issued during the year 1,58,900 3.18 Less: Shares Cancelled during the yearAt the end of the year 6,90,55,095 1,381.10 6,90,55,095 1,381.10 6,88,96,195 1,377.92
b) Details of Shareholders holding more than 5% shares in the company (` in Lakhs)
Particulars As at March 31,2017 As at March 31,2016 As at April 01,2015
No of shares (`) No of shares (`) No of shares (`)G Vanaja Devi 1,57,75,050 22.84% 1,57,75,050 22.84% 1,52,70,448 22.16% G V Bhaskar Rao - HUF 1,12,40,645 16.28% 1,12,40,645 16.28% 1,12,40,645 16.32% G V Bhaskar Rao 60,31,990 8.74% 60,31,990 8.74% 60,31,990 8.76% Ashoka PTE Limited 47,90,301 6.94% - -
IDFC Premier Equity Fund - - 22,77,235 3.31% Small Cap World Fund, INC - - 41,30,970 6.00%
Rights, preferences and restrictions attached to equity shares The Company has only one class of shares referred to as equity shares having a par value of ` 2 per share. Each
shareholder is eligible for one vote per share held and carry a right to dividend. The dividend proposed by the Board of Directors is subject to the approval of the shareholders in the ensuing Annual General Meeting, except in case of interim dividend. In the event of liquidation, the equity shareholders are eligible to receive the remaining assets of the Company after distribution of all preferential amounts, in proportion to their shareholding.
Share options granted under the Company’s employee share option plan Share options granted under the Company’s Employee Share option plan carry no rights to dividends and no voting
rights. Further details of the Employee Share option plan are provided.

Annual Report 2016-17 119
Notes forming part of Financial Statements for the year ended March 31, 2017
Statutory reports 30-89
Financial statements 90-188
Company overview 01-29
23 Other Equity (` in Lakhs) As at March 31,2017 As at March 31,2016 As at April 01, 2015
a) Capital Subsidy Opening Balance - - 0.88 - 0.88 - Less : Transfer to General Reserve - - 0.88 - - 0.88
b) Securities Premium Opening Balance 6,612.83 - 6,537.13 - 6,537.13 - Add: Transfer from ESOP - 6,612.83 75.70 6,612.83 - 6,537.13
c) General Reserve Opening Balance 8,001.05 7,000.17 7,000.17 Add: Tranfer from Retained Earnings - 1,000.00 - Add : Transfer from Capital Subsidy - 8,001.05 0.88 8,001.05 - 7,000.17
d) Share application money Opening Balance - - 54.02 54.02 - Less: Transfer to Share Capital & Premium - - 54.02 - 54.02
e) ESOP Outstandings Opening Balance - - 24.85 - 24.85 - Less: Transfer to Share Capital & Premium - - 24.85 - - 24.85
f) Other Comprehensive Income Opening Balance 1,246.36 - - - - - (i) Items that will not be reclassfied to Profit or loss Fair value of Investments through Other
Comprehensive Income 1,452.44 - 1,888.14 - - -
Acturial (gain)/loss on employee benefits through Other Comprehensive Income
(43.91) - - - - -
(ii) Income tax relating to items that will not be reclassfied to profit or loss
Current tax on Fair value of Investments through Other Comprehensive Income
(478.76) - (641.78) - - -
- 2,176.13 - 1,246.36 - -g) Retained Earnings Opening Balance 76,383.17 - 64,310.88 - 60,933.24 - Addtions: Recognition of Biological assets - - - - 164.68 - Dividend Adjustments - - - - 2,077.83 - Profit for the year 7,847.12 - 17,227.96 - - - Fair Value adjustments of Investments - - - - 1,177.12 - Less: Transferred to General Reserve - - 1,000.00 - - - Payment of Dividend & Dividend Tax - - 4,155.67 - - - Restatement of Grant and Subsidies - - - - 6.54 - Deferred tax adjustment - 84,230.30 - 76,383.17 35.45 64,310.88
- 1,01,020.30 - 92,243.41 - 77,927.93
General Reserve: The Company has transferred a portion of the net profit of the Company before declaring dividend to general reserve pursuant to the earlier provisions of Companies Act 1956. Mandatory transfer to general reserve is not required under the Companies Act 2013.
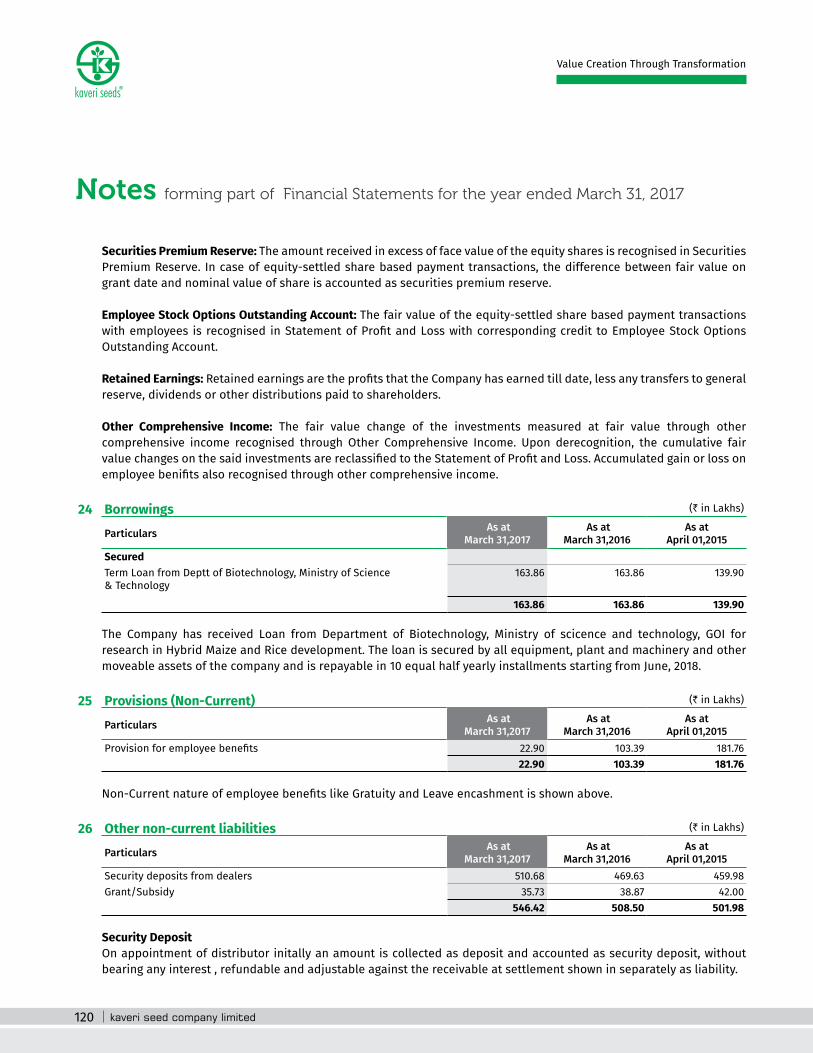
120
Notes forming part of Financial Statements for the year ended March 31, 2017
Value Creation Through Transformation
Securities Premium Reserve: The amount received in excess of face value of the equity shares is recognised in Securities Premium Reserve. In case of equity-settled share based payment transactions, the difference between fair value on grant date and nominal value of share is accounted as securities premium reserve.
Employee Stock Options Outstanding Account: The fair value of the equity-settled share based payment transactions with employees is recognised in Statement of Profit and Loss with corresponding credit to Employee Stock Options Outstanding Account.
Retained Earnings: Retained earnings are the profits that the Company has earned till date, less any transfers to general reserve, dividends or other distributions paid to shareholders.
Other Comprehensive Income: The fair value change of the investments measured at fair value through other comprehensive income recognised through Other Comprehensive Income. Upon derecognition, the cumulative fair value changes on the said investments are reclassified to the Statement of Profit and Loss. Accumulated gain or loss on employee benifits also recognised through other comprehensive income.
24 Borrowings (` in Lakhs)
Particulars As at March 31,2017
As at March 31,2016
As at April 01,2015
SecuredTerm Loan from Deptt of Biotechnology, Ministry of Science & Technology
163.86 163.86 139.90
163.86 163.86 139.90
The Company has received Loan from Department of Biotechnology, Ministry of scicence and technology, GOI for research in Hybrid Maize and Rice development. The loan is secured by all equipment, plant and machinery and other moveable assets of the company and is repayable in 10 equal half yearly installments starting from June, 2018.
25 Provisions (Non-Current) (` in Lakhs)
Particulars As at March 31,2017
As at March 31,2016
As at April 01,2015
Provision for employee benefits 22.90 103.39 181.76 22.90 103.39 181.76
Non-Current nature of employee benefits like Gratuity and Leave encashment is shown above.
26 Other non-current liabilities (` in Lakhs)
Particulars As at March 31,2017
As at March 31,2016
As at April 01,2015
Security deposits from dealers 510.68 469.63 459.98 Grant/Subsidy 35.73 38.87 42.00
546.42 508.50 501.98
Security Deposit On appointment of distributor initally an amount is collected as deposit and accounted as security deposit, without
bearing any interest , refundable and adjustable against the receivable at settlement shown in separately as liability.

Annual Report 2016-17 121
Notes forming part of Financial Statements for the year ended March 31, 2017
Statutory reports 30-89
Financial statements 90-188
Company overview 01-29
27 Trade payables (` in Lakhs)
Particulars As at March 31,2017
As at March 31,2016
As at April 01,2015
Creditors for Expenses 15,979.41 7,135.04 7,338.94 Sundry Creditors 11,736.24 14,071.01 13,422.89
27,715.65 21,206.05 20,761.83
28 Other financial liabilities (` in Lakhs)
Particulars As at March 31,2017
As at March 31,2016
As at April 01,2015
Un Claimed Dividend 12.49 13.67 - Interest Accured but not due 11.94 8.67 5.47
24.43 22.34 5.47
There are no amounts due for payment to the Investor Education and Protection Fund under section 125 of the companies Act, 2013 as at 31st March 2017, 31st March 2016 and as at 1st April 2015.
29 Other current liabilities (` in Lakhs)
Particulars As at March 31,2017
As at March 31,2016
As at April 01,2015
Advance from customers against Sales 17,991.84 18,261.44 18,073.52 Payable to Staff 321.82 525.55 611.66 TDS Payable 564.16 422.68 107.24
18,877.82 19,209.67 18,792.42
30 Provisions (` in Lakhs)
Particulars As at March 31,2017
As at March 31,2016
As at April 01,2015
Provision for employee benefits 19.55 20.34 Provision for Schemes 1,931.67 590.31 2,205.75
1,951.22 610.65 2,205.75
31 Current Tax Liabilities (` in Lakhs)
Particulars As at March 31,2017
As at March 31,2016
As at April 01,2015
Provision for Income Tax (net) - - 38.76 Provision for Wealth tax - - 1.30
- - 40.06
(` in Lakhs)
Particulars As at March 31,2017
As at March 31,2016
As at April 01,2015
Adjustments in provision for Income TaxAdvance Income Tax 1,000.00 525.00 460.00 TDS receivables 0.52 1.37 1.24

122
Notes forming part of Financial Statements for the year ended March 31, 2017
Value Creation Through Transformation
32 Revenue from Operations (` in Lakhs)
Particulars As at March 31,2017
As at March 31,2016
Sale of Seeds 66,989.10 71,652.95 TOTAL 66,989.10 71,652.95
33 Other Income (` in Lakhs)
Particulars As at March 31,2017
As at March 31,2016
Capital Gain on sale of Assets 23.33 3.08 Dividend Income 0.54 6.11 Capital Gains from Investments 3,250.81 1,024.51 Interest Income 118.07 82.90 Others 39.02 47.09 Grant/Subsidy written Back 3.13 3.13 TOTAL 3,434.90 1,166.83
34 Cost of Materials Consumed (` in Lakhs)
Particulars As at March 31,2017
As at March 31,2016
Raw Material Consumed/Production ExpensesOpening Stock 4,289.55 4,220.79 Add : Purchases/Production Expenses including processing Charges** 37,879.64 36,417.32
42,169.19 40,638.11 Less : Closing Stock 4,326.87 4,289.55
37,842.31 36,348.57 ** Processing ChargesFreight Inward 826.59 883.62 Machinery Repairs & Maintenance 221.16 146.04 Seed Certification charges 0.75 7.19 Power & Fuel 700.82 555.94 Building & Godown repairs & maint. 0.72 7.47 Godown Rent 101.95 170.80 Cold Storage Maintenance 32.05 145.53 Factory Maintenance 749.78 839.75 Expense on processing 718.20 730.43 R&D Farm Expenses** 1,166.36 1,088.00 Total 4,518.39 4,574.77

Annual Report 2016-17 123
Notes forming part of Financial Statements for the year ended March 31, 2017
Statutory reports 30-89
Financial statements 90-188
Company overview 01-29
34 Cost of Materials Consumed (` in Lakhs)
Particulars As at March 31,2017
As at March 31,2016
** R&D Farm Expenses Cultivation Expenses 8.07 13.91 Fertilizers & Pesticides 33.04 52.02 Electricity charges 36.99 26.60 Electrical items & motor repairing charges 2.54 2.33 Farm Maintenance 50.74 61.59 Labour charges 165.12 164.65 Postage & telephones 2.24 1.06 Printing & Stationery 12.64 3.36 Security charges 43.79 43.69 Staff Welfare 2.65 2.58 Travelling expenses 2.75 1.22 Vehicle Maintenance 20.18 19.73 Land Lease 126.62 126.26 Research Expenses 114.71 8.65 Testing Expenses 99.99 121.46 Professional Expenses 51.26 52.67 Salaries - Farm 393.03 386.21
1,166.36 1,088.00
35 Changes in Inventories of Finished Goods and Work in Progress (` in Lakhs)
Particulars As at March 31,2017
As at March 31,2016
(Increase)/Decrease in Finished goods Opening Stock 40,931.00 36,168.00 Closing Stock 36,196.00 4,735.58 40,931.00 (4,763.54)(Increase)/Decrease in Work in Process Opening Stock 4,528.00 8,288.00 Closing Stock 3,475.00 1,053.63 4,528.00 3,759.60 (Increase)/Decrease in Biological Assets Opening Stock 1,674.00 4,876.00 Closing Stock 5,557.00 (3,882.65) 1,674.00 3,201.55
1,906.57 2,197.61
(Contd.)
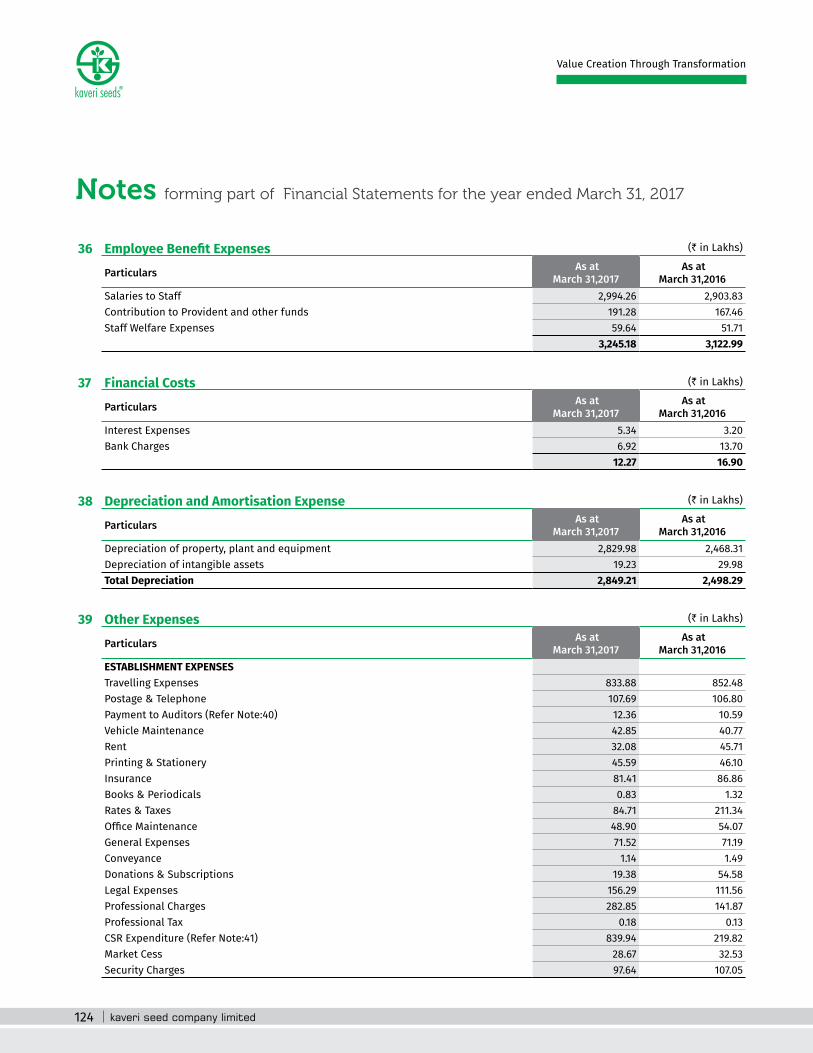
124
Notes forming part of Financial Statements for the year ended March 31, 2017
Value Creation Through Transformation
36 Employee Benefit Expenses (` in Lakhs)
Particulars As at March 31,2017
As at March 31,2016
Salaries to Staff 2,994.26 2,903.83 Contribution to Provident and other funds 191.28 167.46 Staff Welfare Expenses 59.64 51.71
3,245.18 3,122.99
37 Financial Costs (` in Lakhs)
Particulars As at March 31,2017
As at March 31,2016
Interest Expenses 5.34 3.20 Bank Charges 6.92 13.70
12.27 16.90
38 Depreciation and Amortisation Expense (` in Lakhs)
Particulars As at March 31,2017
As at March 31,2016
Depreciation of property, plant and equipment 2,829.98 2,468.31 Depreciation of intangible assets 19.23 29.98 Total Depreciation 2,849.21 2,498.29
39 Other Expenses (` in Lakhs)
Particulars As at March 31,2017
As at March 31,2016
ESTABLISHMENT EXPENSESTravelling Expenses 833.88 852.48 Postage & Telephone 107.69 106.80 Payment to Auditors (Refer Note:40) 12.36 10.59 Vehicle Maintenance 42.85 40.77 Rent 32.08 45.71 Printing & Stationery 45.59 46.10 Insurance 81.41 86.86 Books & Periodicals 0.83 1.32 Rates & Taxes 84.71 211.34 Office Maintenance 48.90 54.07 General Expenses 71.52 71.19 Conveyance 1.14 1.49 Donations & Subscriptions 19.38 54.58 Legal Expenses 156.29 111.56 Professional Charges 282.85 141.87 Professional Tax 0.18 0.13 CSR Expenditure (Refer Note:41) 839.94 219.82 Market Cess 28.67 32.53 Security Charges 97.64 107.05
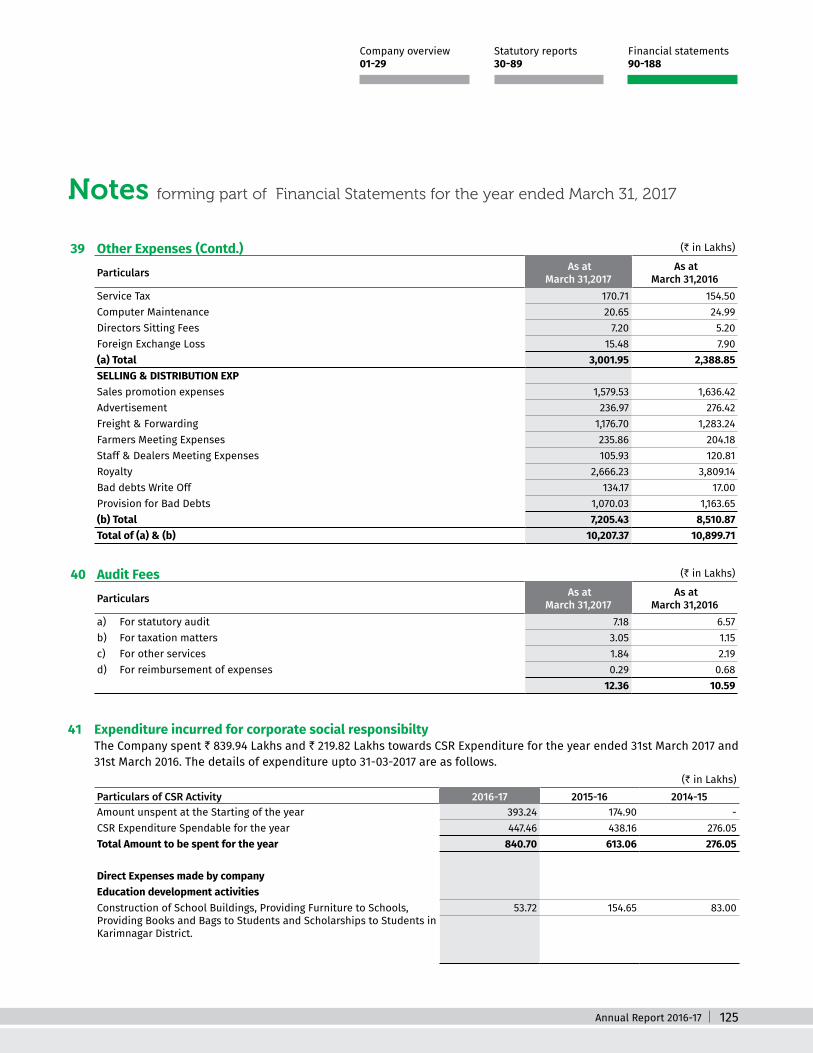
Annual Report 2016-17 125
Notes forming part of Financial Statements for the year ended March 31, 2017
Statutory reports 30-89
Financial statements 90-188
Company overview 01-29
39 Other Expenses (` in Lakhs)
Particulars As at March 31,2017
As at March 31,2016
Service Tax 170.71 154.50 Computer Maintenance 20.65 24.99 Directors Sitting Fees 7.20 5.20 Foreign Exchange Loss 15.48 7.90 (a) Total 3,001.95 2,388.85 SELLING & DISTRIBUTION EXPSales promotion expenses 1,579.53 1,636.42 Advertisement 236.97 276.42 Freight & Forwarding 1,176.70 1,283.24 Farmers Meeting Expenses 235.86 204.18 Staff & Dealers Meeting Expenses 105.93 120.81 Royalty 2,666.23 3,809.14 Bad debts Write Off 134.17 17.00 Provision for Bad Debts 1,070.03 1,163.65 (b) Total 7,205.43 8,510.87 Total of (a) & (b) 10,207.37 10,899.71
40 Audit Fees (` in Lakhs)
Particulars As at March 31,2017
As at March 31,2016
a) For statutory audit 7.18 6.57 b) For taxation matters 3.05 1.15 c) For other services 1.84 2.19 d) For reimbursement of expenses 0.29 0.68
12.36 10.59
41 Expenditure incurred for corporate social responsibilty The Company spent ` 839.94 Lakhs and ` 219.82 Lakhs towards CSR Expenditure for the year ended 31st March 2017 and
31st March 2016. The details of expenditure upto 31-03-2017 are as follows. (` in Lakhs)
Particulars of CSR Activity 2016-17 2015-16 2014-15Amount unspent at the Starting of the year 393.24 174.90 -
CSR Expenditure Spendable for the year 447.46 438.16 276.05 Total Amount to be spent for the year 840.70 613.06 276.05
Direct Expenses made by company Education development activities
Construction of School Buildings, Providing Furniture to Schools, Providing Books and Bags to Students and Scholarships to Students in Karimnagar District.
53.72 154.65 83.00
(Contd.)

126
Notes forming part of Financial Statements for the year ended March 31, 2017
Value Creation Through Transformation
(` in Lakhs) Particulars of CSR Activity 2016-17 2015-16 2014-15Rural development activities
Conservation of Water Resources, Providing Street Lights, Providing Cycle Rikshaw for Cleaning of Garbage in Karminagar and Siddipet Districts.
11.22 65.17 18.15
Contribution made to Kaveri Bhaskar Rao Charitable Foundation 775.00 - -
Total Amount Spent during the year 839.94 219.82 101.15 Unspent amount at the End of the year 0.76 393.24 174.90
42 Income Taxes: The reconciliation between the statutory income tax rate applicable to the company and the effective income tax rate of the company
is as follows: (` in Lakhs)
Income tax recognised in profit or loss As at 31-03-2017 As at 31-03-2016Statutory Income tax rate 34.61% 34.61%Differences due to:Income Exempt from Tax -20.98% -32.22%Effect of expenses that are not deductible in determining taxable profit (permanent disallowances)
-3.55% -0.47%
Tax Income at Different Rates -0.11% -0.10%Others 3.78% 1.15%Effective tax rate 13.75% 2.97%
Movement in Defered Tax Assets/(Liabilities) Movement during the Year ended April 1st, 2015
(` in Lakhs)
Deferred Tax Asset/Liabilities As at 31st March, 2015
Credit/(charge) in the statement of Profit and Loss
Directly recognised in
Equity
As at 1st April, 2015
Provision for employee benefits 1.85 - 1.85 Provision for bad and doubtful trade receivables 38.48 (35.45) 3.03 Depreciation (8.00) - (8.00)
32.33 (35.45) (3.12)
Movement during the Year ended March 31st, 2016 (` in Lakhs)
Deferred Tax Asset/Liabilities As at 1st April, 2015
Credit/(charge) in the statement of Profit and Loss
Directly recognised in
Equity
As at 31st March, 2016
Provision for employee benefits 1.85 (0.59) 1.26 Provision for bad and doubtful trade receivables 3.03 11.86 14.89 Depreciation (8.00) 7.35 (0.65)
(3.12) 18.62 15.50
41 Expenditure incurred for corporate social responsibilty (contd.)
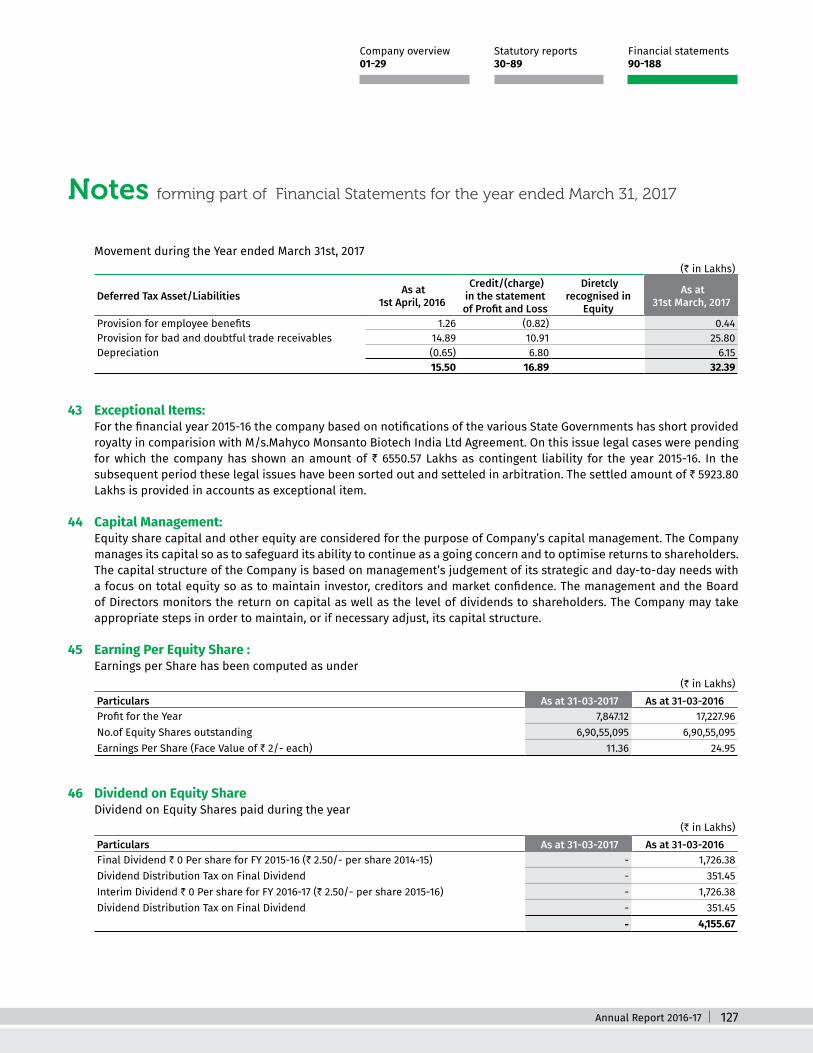
Annual Report 2016-17 127
Notes forming part of Financial Statements for the year ended March 31, 2017
Statutory reports 30-89
Financial statements 90-188
Company overview 01-29
Movement during the Year ended March 31st, 2017 (` in Lakhs)
Deferred Tax Asset/Liabilities As at 1st April, 2016
Credit/(charge) in the statement of Profit and Loss
Diretcly recognised in
Equity
As at 31st March, 2017
Provision for employee benefits 1.26 (0.82) 0.44 Provision for bad and doubtful trade receivables 14.89 10.91 25.80 Depreciation (0.65) 6.80 6.15
15.50 16.89 32.39
43 Exceptional Items: For the financial year 2015-16 the company based on notifications of the various State Governments has short provided
royalty in comparision with M/s.Mahyco Monsanto Biotech India Ltd Agreement. On this issue legal cases were pending for which the company has shown an amount of ` 6550.57 Lakhs as contingent liability for the year 2015-16. In the subsequent period these legal issues have been sorted out and setteled in arbitration. The settled amount of ` 5923.80 Lakhs is provided in accounts as exceptional item.
44 Capital Management: Equity share capital and other equity are considered for the purpose of Company’s capital management. The Company
manages its capital so as to safeguard its ability to continue as a going concern and to optimise returns to shareholders. The capital structure of the Company is based on management’s judgement of its strategic and day-to-day needs with a focus on total equity so as to maintain investor, creditors and market confidence. The management and the Board of Directors monitors the return on capital as well as the level of dividends to shareholders. The Company may take appropriate steps in order to maintain, or if necessary adjust, its capital structure.
45 Earning Per Equity Share : Earnings per Share has been computed as under
(` in Lakhs) Particulars As at 31-03-2017 As at 31-03-2016Profit for the Year 7,847.12 17,227.96 No.of Equity Shares outstanding 6,90,55,095 6,90,55,095 Earnings Per Share (Face Value of ` 2/- each) 11.36 24.95
46 Dividend on Equity Share Dividend on Equity Shares paid during the year
(` in Lakhs) Particulars As at 31-03-2017 As at 31-03-2016Final Dividend ` 0 Per share for FY 2015-16 (` 2.50/- per share 2014-15) - 1,726.38 Dividend Distribution Tax on Final Dividend - 351.45 Interim Dividend ` 0 Per share for FY 2016-17 (` 2.50/- per share 2015-16) - 1,726.38 Dividend Distribution Tax on Final Dividend - 351.45
- 4,155.67

128
Notes forming part of Financial Statements for the year ended March 31, 2017
Value Creation Through Transformation
47 FINANCIAL INSTRUMENTS Refer Note 2.13 for accounting policy on Financial Instruments.
A. ACCOUNTING CLASSIFICATIONS AND FAIR VALUES The carrying amounts and fair values of financial instruments by class are as follows:
(` in Lakhs)
ParticularsCarrying value /Fair value
As at 31st March , 2017
As at 31st March, 2016
As at 1st April, 2015
FINANCIAL ASSETS Financial assets measured at fair valueInvestments measured ati. Fair value through other comprehensive income (Note 10) 66,809.34 51,279.10 30,628.63
66,809.34 51,279.10 30,628.63 FINANCIAL LIABILITIES
- - -
The Company has disclosed financial instruments such as cash and cash equivalents, other bank balances, trade receivables, current account balances with group companies and joint venture, trade payables and unpaid dividends at carrying value because their carrying amounts are a reasonable approximation of the fair values due to their short term nature.
B. INCOME, EXPENSES, GAINS OR LOSSES ON FINANCIAL INSTRUMENTS Interest income and expenses, gains or losses recognised on financial assets and liabilities in the Statement of Profit
and Loss are as follows:
(` in Lakhs)
Particulars Year ended 31st March, 2017
Year ended 31st March, 2016
Financial assets measured at fair value through other comprehensive income‘Investment in equity & debt instrument 973.68 1,246.36
C. FAIR VALUE HIERARCHY The fair value of financial instruments have been classified into three categories depending on the inputs used in the
valuation technique. The hierarchy gives the highest priority to quoted prices in active markets for identical assets or liabilities (Level 1 measurements) and lowest priority to unobservable inputs (Level 3 measurements).
The categories used are as follows:
Level 1 : Quoted Prices for identical Instruments in an active Market
Level 2: Directly or indirectly observable market inputs, other than Level 1 inputs, and
Level 3: Inputs which are not based on observable market data
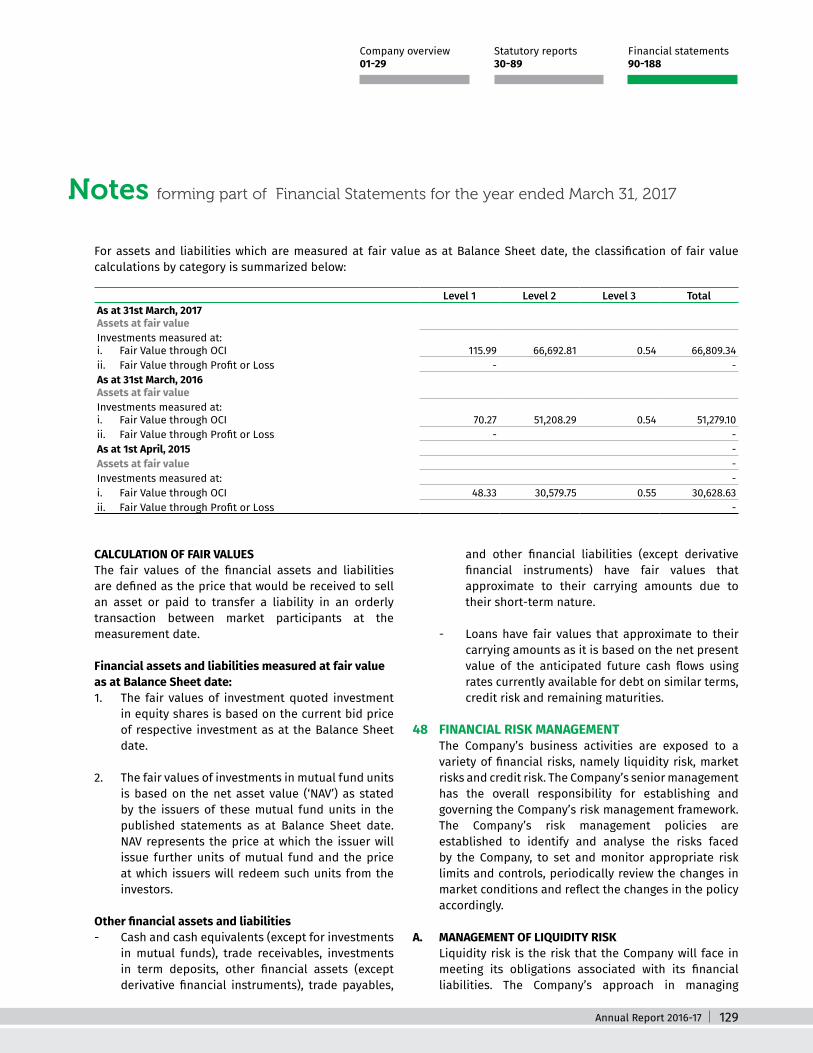
Annual Report 2016-17 129
Notes forming part of Financial Statements for the year ended March 31, 2017
Statutory reports 30-89
Financial statements 90-188
Company overview 01-29
For assets and liabilities which are measured at fair value as at Balance Sheet date, the classification of fair value calculations by category is summarized below:
Level 1 Level 2 Level 3 TotalAs at 31st March, 2017Assets at fair valueInvestments measured at: i. Fair Value through OCI 115.99 66,692.81 0.54 66,809.34 ii. Fair Value through Profit or Loss - -
As at 31st March, 2016 Assets at fair valueInvestments measured at: i. Fair Value through OCI 70.27 51,208.29 0.54 51,279.10 ii. Fair Value through Profit or Loss - -
As at 1st April, 2015 -
Assets at fair value -
Investments measured at: -
i. Fair Value through OCI 48.33 30,579.75 0.55 30,628.63 ii. Fair Value through Profit or Loss -
CALCULATION OF FAIR VALUES The fair values of the financial assets and liabilities
are defined as the price that would be received to sell an asset or paid to transfer a liability in an orderly transaction between market participants at the measurement date.
Financial assets and liabilities measured at fair value as at Balance Sheet date:
1. The fair values of investment quoted investment in equity shares is based on the current bid price of respective investment as at the Balance Sheet date.
2. The fair values of investments in mutual fund units is based on the net asset value (‘NAV’) as stated by the issuers of these mutual fund units in the published statements as at Balance Sheet date. NAV represents the price at which the issuer will issue further units of mutual fund and the price at which issuers will redeem such units from the investors.
Other financial assets and liabilities - Cash and cash equivalents (except for investments
in mutual funds), trade receivables, investments in term deposits, other financial assets (except derivative financial instruments), trade payables,
and other financial liabilities (except derivative financial instruments) have fair values that approximate to their carrying amounts due to their short-term nature.
- Loans have fair values that approximate to their carrying amounts as it is based on the net present value of the anticipated future cash flows using rates currently available for debt on similar terms, credit risk and remaining maturities.
48 FINANCIAL RISK MANAGEMENT The Company’s business activities are exposed to a
variety of financial risks, namely liquidity risk, market risks and credit risk. The Company’s senior management has the overall responsibility for establishing and governing the Company’s risk management framework. The Company’s risk management policies are established to identify and analyse the risks faced by the Company, to set and monitor appropriate risk limits and controls, periodically review the changes in market conditions and reflect the changes in the policy accordingly.
A. MANAGEMENT OF LIQUIDITY RISK Liquidity risk is the risk that the Company will face in
meeting its obligations associated with its financial liabilities. The Company’s approach in managing

130
Notes forming part of Financial Statements for the year ended March 31, 2017
Value Creation Through Transformation
liquidity is to ensure that it will have sufficient funds to meet its liabilities when due without incurring unacceptable losses. In doing this, management considers both normal and stressed conditions.
The Company maintained a cautious liquidity strategy, with a positive cash balance throughout the year ended 31st March, 2017 and 31st March, 2016. Cash flow from operating activities provides the funds to service the financial liabilities on a day-to-day basis.
The Company regularly monitors the rolling forecasts to ensure it has sufficient cash on an on-going basis to meet operational needs. Any short term surplus
cash generated, over and above the amount required for working capital management and other operational requirements, is retained as cash and cash equivalents (to the extent required) and any excess is invested in highly marketable debt investments with appropriate maturities to optimise the cash returns on investments while ensuring sufficient liquidity to meet its liabilities.
The following table shows the maturity analysis of the Company’s financial liabilities based on contractually agreed undiscounted cash flows along with its carrying value as at the Balance Sheet date.
Undiscounted AmountCarrying amount
Payable within 1 year
More than 1 year
Total
As at 31st March, 2017Non-derivative liabilitiesTrade payables (including acceptances) 27,715.65 27,715.65 - 27,715.65 Borrowings 163.86 - 163.86 163.86 Unpaid dividend 12.49 12.49 - 12.49 Other Payables 11.94 11.94 - 11.94 As at 31st March, 2016Non-derivative liabilitiesTrade payables (including acceptances) 21,206.05 21,206.05 - 21,206.05 Borrowings 163.86 - 163.86 163.86 Unpaid dividend 13.67 13.67 - 13.67 Other Payables 8.67 8.67 - 8.67 As at 1st April, 2015Non-derivative liabilitiesTrade payables (including acceptances) 20,761.83 20,761.83 - 20,761.83 Borrowings 139.90 - 139.90 139.90 Unpaid dividend - - - -
Other Payables 5.47 5.47 - 5.47
B. MANAGEMENT OF MARKET RISK The Company’s size and operations result in it being
exposed to the following market risks that arise from its use of financial instruments:
CURRENCY RISK PRICE RISK INTEREST RATE RISK
The above risks may affect the Company’s income and expenses, or the value of its financial instruments. The Company’s exposure to and management of these risks are explained below.
1. CURRENCY RISK ‘POTENTIAL IMPACT OF RISK The impact of risk due to change in foreign currency
value is very minute on the company as the company’s exposure to foreign currency is very low.
Annual Report 2016-17 131
Notes forming part of Financial Statements for the year ended March 31, 2017
Statutory reports 30-89
Financial statements 90-188
Company overview 01-29
As at 31st March, 2017, the net unhedged exposure to the Company on holding financial assets (trade receivables and capital advances) ‘and liabilities (trade payables and capital ‘creditors) other than in their functional currency ‘amounted to ` 0 Lakhs payable (31st March, ‘2016 ` 0 Lakhs and 1st April, 2015 ` 0 Lakhs).
MANAGEMENT POLICY The Company is not majorly exposed to foreign currency
exchange risk because of its low volume foreign currency transactions, even though management exercises proper precautions to minute the currency risk in foreign exchange transactions. The company deals with US Dollor and Euro for its foreign currency transactions.
The Company makes its exports against advance irrevocable LC to mitigate the risk of currency exchange due to delay in remittances. The company does not opt for forward exchange contracts. Foreign exchange transactions are closely monitored to reduce the risk.
The aim of the Company’s approach to management of currency risk is to leave the Company with no material residual risk.
SENSITIVITY TO RISK A 5% strengthening of the INR against key currencies
to which the Company is exposed (net of hedge) would have led to approximately ‘an additional ` 0 Lakhs gain in the Statement of ‘Profit and Loss (2015-16: ` 0 Lakhs gain). A 5% ‘weakening of the INR against these currencies ‘would have led to an equal but opposite effect.
2. PRICE RISK POTENTIAL IMPACT OF RISK The Company is exposed to the price risk due to its
investment in debt mutual funds. The price risk arises due to uncertainties about the future market values of these investments.
At 31st March 2017, the investments in debt mutual funds amounts to ` 62697.12 Lakhs (31st March, 2016 ` 48634.07 Lakhs and 1st April, 2015 ` 29430.05 Lakhs). These are exposed to price risk.
MANAGEMENT POLICY The Company takes all the precautions to minimise price
risk arising from investments in debt mutual funds. The company is investing mainly in debt mutual funds through leading mutual fund companies and in best mutual funds where price risk is very low. The company will examine fund performance, rating, liquidty and risk aspects before investing.
SENSITIVITY TO RISK A 0.5% increase in prices would have led to
approximately an additional ` 313.49 Lakhs gain in the Statement of Profit and Loss (2015-16 ` 243.17 Lakhs gain). A 0.5 % decrease in prices would have led to an equal but opposite effect.
3. INTEREST RATE RISK POTENTIAL IMPACT OF RISK The impact of interest rate risk is very minute on the
company as the company does not have exposure to any interest rate sensitive investments or securities.
The company does not have any investment in interest sensitive securities/bonds as on 31st march 2017, 2016 and 2015.
MANAGEMENT POLICY The Company makes maximum of the investments in
non interest sensitive sectors to mitigate interest rate risk.
SENSITIVITY TO RISK A 0.25% or .50% increase/decrease in interest rates will
not make any difference to the company profit or loss as there are no interest rate sensitive investments.
C. MANAGEMENT OF CREDIT RISK Credit risk is the risk of financial loss to the company if a
customer or counter-party fails to meet its contractual obligations.
Trade receivables Concentration of credit risk with respect to trade
receivables is moderate, due to the Company’s customer base being large and diverse and also company receives

132
Notes forming part of Financial Statements for the year ended March 31, 2017
Value Creation Through Transformation
good amount of receipts towards advances. All trade receivables are reviewed and assessed for default on a quarterly basis based on collections and ageing.
Our historical experience of collecting receivables is that credit risk is moderate. Hence, trade receivables are considered to be a single class of financial assets.
Other financial assets The Company maintains exposure in cash and cash
equivalents, term deposits with banks, investments
money market liquid mutual funds and derivative instrument with financial institutions. The Company has set counter-parties limits based on multiple factors including financial position, credit rating, etc. The Company has given inter-corporate deposits (ICD) only to its subsidiaries amounting ` 0 Lakhs (31st March, 2016 ` 740 Lakhs and 1st April, 2015 ` 642 Lakhs).
The Company’s maximum exposure to credit risk as at 31st March, 2017, 2016 and 1st April, 2015 is the carrying value of each class of financial assets.
49 Disclosures Pursuant to Securities and Exchange Board of India (Listing Obligations and Disclosure Requirements) Regulations, 2015 and Section 186 of the Companies Act, 2013 (` in Lakhs)
Year ended 31st March, 2017
Year ended 31st March, 2016
(a) Loans to subsidiaries Loan to subsidiary: Kexveg India Pvt Ltd Balance as at the year end - 740.00 Maximum amount outstanding at any time during the year 784.60 751.51 [Kexveg India Pvt Limited has utilised the loan for meeting working capital
requirements.)
(b) Investment by the loans in the shares of the Company The loanees have not made any investments in the shares of the Company Nil Nil
50 Related Party Transactions50.1 Following is the list of related parties and their relationships
A. Key managerial persons and their relatives1 Mr. G.V.Bhaskar Rao2 Mrs. G. Vanaja Devi3 Mr. R. Venumanohar Rao4 Mr. C. Vamsheedhar5 Mr. C. Mithun Chand6 Mr. G.Pawan7 Mrs. G. Madhusree8 G.V.Bhaskar Rao - HUF9 C. Vamsheedhar - HUF10 R. Venumanohar Rao - HUF B. Subsidary Companies:11 M/s. Kexveg India Pvt Ltd12 M/s. Aditya Agritech Pvt Ltd13 M/s. Genome Agritech Pvt Ltd14 M/s. Kaveri Microteck Pvt LtdC Other related firms15 M/s. Kaveri Infra

Annual Report 2016-17 133
Notes forming part of Financial Statements for the year ended March 31, 2017
Statutory reports 30-89
Financial statements 90-188
Company overview 01-29
50.2 Related party transactions for the year ended 31 March 2017 are as follows: (` in Lakhs) 31-03-2017 31-03-2016
Remuneration paidMr. G.V.Bhaskar Rao 171.75 155.52 Mrs. G. Vanaja Devi 106.75 96.72 Mr. R. Venumanohar Rao - 74.98 Mr. C. Vamsheedhar 52.68 47.86 Mr. C. Mithun Chand 43.93 39.94
375.11 415.02 Land and godown lease paidMr. G.V.Bhaskar Rao 0.60 8.43 Mrs. G. Vanaja Devi 8.49 8.49 Mr. G.Pawan 12.31 12.31 Mrs. G. Madhusree 10.80 10.80 G.V.Bhaskar Rao - HUF 41.58 39.96 C. Vamsheedhar - HUF 4.48 4.48 R. Venumanohar Rao - HUF 4.52 4.52 M/s. Kaveri Infra 10.87 10.87
93.65 99.86 Dividend paidMr. G.V.Bhaskar Rao - 150.80 Mrs. G. Vanaja Devi - 381.76 Mr. R. Venumanohar Rao - 52.95 Mr. C. Vamsheedhar - 27.48 Mr. C. Mithun Chand - 23.22 Mr. G.Pawan - 62.73 Mrs. G. Madhusree - -
G.V.Bhaskar Rao - HUF - 281.02 - 979.96
Investments made during the yearEquity Share Capital in M/s. Kexveg India Pvt Ltd 775.00 -
Loans & Advances Paid during the yearM/s. Kexveg India Pvt Ltd - 98.00
Land Lease ReceivedM/s. Kexveg India Pvt Ltd 14.23 14.23
Sales made during the yearM/s. Aditya Agritech Pvt Ltd 2,796.16 2,326.67 M/s. Genome Agritech Pvt Ltd 598.35 503.79
3,394.51 2,830.46
(` in Lakhs) 31-03-2017 31-03-2016
Debit balances outstanding as at 31-03-2017M/s. Genome Agritech Pvt Ltd 358.38 42.38 M/s. Kexveg India Pvt Ltd - 740.00
358.38 782.38 Credit balances outstanding as at 31-03-2017
M/s. Aditya Agritech Pvt Ltd 893.44 875.92

134
Notes forming part of Financial Statements for the year ended March 31, 2017
Value Creation Through Transformation
51 Employee benefit plans The gratuity scheme is a final salary Defined Benefit Plan that provides for a lump sum payment made on exit either by
way of retirement, death, disability or voluntary withdrawal. The benfits are defined on the basis of final salary and the period of service and paid as lump sum at exit. The plan design meand the risks commonly affecting the liabilities and the financial results are expected to:
a) Interest rate risk : the defined benefit obligation calculated uses a discount rate based on government bonds. If bond yields fall, the defined benefit obligation will tend to increase.
b) Salary inflation risk : Higher than expexted increases in salary will increase the defined benefit obligation
c) Demographic risk : For example, as plan is open to new entrants, an increase in membership will increase the defined benefit obligation. Also, the plan only provides benefits upon completion of a vesting criteria. Therefore, if tunover rates increase, then the liability will tend to fall as fewer employees reach vesting period.
The Principal Assumptions used for the purposes of the acturial valuation as follows
I) Reconciliation of Benefit Obligation: (` in Lakhs) Particulars 31.03.2017Liabiltiy at the beginning of the period / year 111.80 Acquisition adjustment - Interest Cost 8.94 Past Service Cost - Current Services Cost 17.18 Benefits paid (61.59)Actuarial (gain)/ loss 43.91 Liability at the end of the period / year 120.26
II) Reconciliation of fair value of plan assets: (` in Lakhs) Particulars 31.03.2017Fair value of plan assets at the beginning of the period/year 197.90 Acquisition adjustment - Expected return on plan assets 18.27 Controbitopms 57.10 Benefits paid (61.59)Premium Expenses (0.97)Actuarial (gain)/ loss on obligation -
Fair value of plan assets at the beginning of the period/year 210.72 Total actruarial gain / (loss) to be recognized 43.91
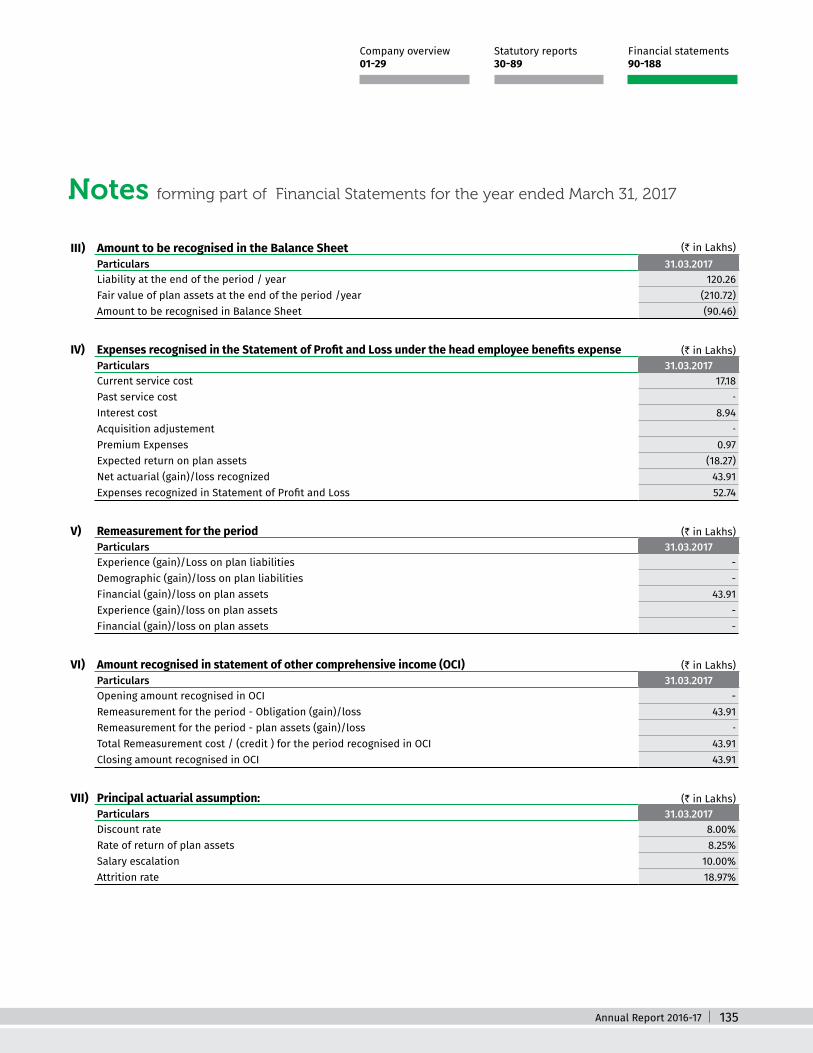
Annual Report 2016-17 135
Notes forming part of Financial Statements for the year ended March 31, 2017
Statutory reports 30-89
Financial statements 90-188
Company overview 01-29
III) Amount to be recognised in the Balance Sheet (` in Lakhs) Particulars 31.03.2017Liability at the end of the period / year 120.26 Fair value of plan assets at the end of the period /year (210.72)Amount to be recognised in Balance Sheet (90.46)
IV) Expenses recognised in the Statement of Profit and Loss under the head employee benefits expense (` in Lakhs) Particulars 31.03.2017Current service cost 17.18 Past service cost -
Interest cost 8.94 Acquisition adjustement -
Premium Expenses 0.97 Expected return on plan assets (18.27)Net actuarial (gain)/loss recognized 43.91 Expenses recognized in Statement of Profit and Loss 52.74
V) Remeasurement for the period (` in Lakhs) Particulars 31.03.2017Experience (gain)/Loss on plan liabilities - Demographic (gain)/loss on plan liabilities - Financial (gain)/loss on plan assets 43.91 Experience (gain)/loss on plan assets - Financial (gain)/loss on plan assets -
VI) Amount recognised in statement of other comprehensive income (OCI) (` in Lakhs) Particulars 31.03.2017Opening amount recognised in OCI - Remeasurement for the period - Obligation (gain)/loss 43.91 Remeasurement for the period - plan assets (gain)/loss -
Total Remeasurement cost / (credit ) for the period recognised in OCI 43.91 Closing amount recognised in OCI 43.91
VII) Principal actuarial assumption: (` in Lakhs) Particulars 31.03.2017Discount rate 8.00%Rate of return of plan assets 8.25%Salary escalation 10.00%Attrition rate 18.97%
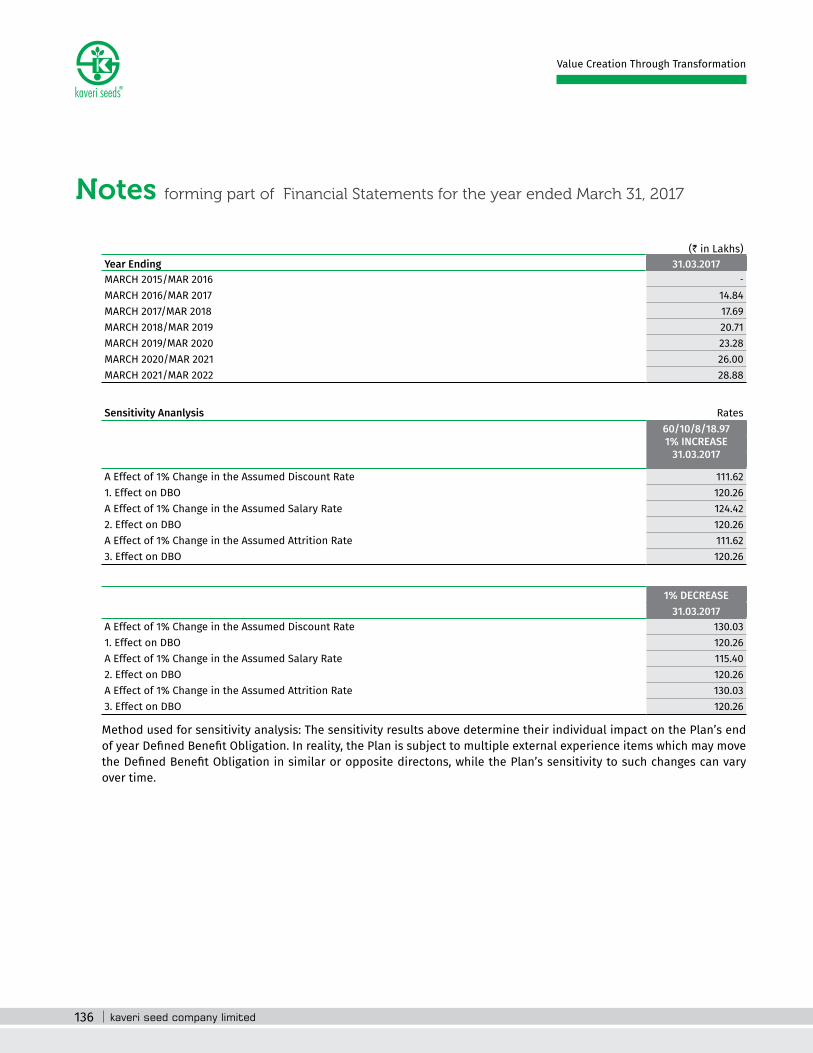
136
Notes forming part of Financial Statements for the year ended March 31, 2017
Value Creation Through Transformation
(` in Lakhs) Year Ending 31.03.2017MARCH 2015/MAR 2016 -
MARCH 2016/MAR 2017 14.84 MARCH 2017/MAR 2018 17.69 MARCH 2018/MAR 2019 20.71 MARCH 2019/MAR 2020 23.28 MARCH 2020/MAR 2021 26.00 MARCH 2021/MAR 2022 28.88
Sensitivity Ananlysis Rates60/10/8/18.971% INCREASE
31.03.2017
A Effect of 1% Change in the Assumed Discount Rate 111.62 1. Effect on DBO 120.26 A Effect of 1% Change in the Assumed Salary Rate 124.42 2. Effect on DBO 120.26 A Effect of 1% Change in the Assumed Attrition Rate 111.62 3. Effect on DBO 120.26
1% DECREASE 31.03.2017
A Effect of 1% Change in the Assumed Discount Rate 130.03 1. Effect on DBO 120.26 A Effect of 1% Change in the Assumed Salary Rate 115.40 2. Effect on DBO 120.26 A Effect of 1% Change in the Assumed Attrition Rate 130.03 3. Effect on DBO 120.26
Method used for sensitivity analysis: The sensitivity results above determine their individual impact on the Plan’s end of year Defined Benefit Obligation. In reality, the Plan is subject to multiple external experience items which may move the Defined Benefit Obligation in similar or opposite directons, while the Plan’s sensitivity to such changes can vary over time.

Annual Report 2016-17 137
Notes forming part of Financial Statements for the year ended March 31, 2017
Statutory reports 30-89
Financial statements 90-188
Company overview 01-29
52 Disclosures as required by the Micro, Small and Medium Enterprises Development Act, 2006 are as under: (` in Lakhs)
Particulars As at March 31,2017
As at March 31,2016
As at April 01,2015
Principle amount due to suppliers registered under the MSMED Act and Remaining unpaid as at year end
521.82 - -
Interest due to supplies registered unde the MSMED Act and remaining unpaid as at year end
2.08 - -
Principal amount paid to suppliers registered under the MSMED Act, beyond the appointed day during the year
132.39 - -
Interest paid, other than under section 16 of MSMED Act, to suppliers registered under the MSMED Act, beyond the appointed day during the year.
- - -
Interest paid, under section 16 of MSMED Act, to suppliers registered under the MSMED Act, beyond the appointed day during the year.
2.08 - -
Interest due and payable towards suppliers registered under MSMED Act, for payments already made
- - -
Further Interest remaining due and payable for earlier years - - -
The above information regarding Micro, Small and Medium Enterprises has been determined to the extent such parties have been identified on the basis of information available with the Company.
53 Commitments (` in Lakhs)
Particulars As at 31-03-2017
As at 31-03-2016
Estimated amount of contracts (net of advances) remaining to be executed on capital account and not provided for:
137.53 29.23
54 Contingent Liabilities (` in Lakhs)
Particulars As at 31-03-2017
As at 31-03-2016
Claims against the Company not acknowledged as debts. This comprises of 954.08 7,521.00 i. Tax demands disputed by the Company relating to disallowances / additions
of fiscal benefits, pending before various judicial forums and tax authorities, aggregating to
860.50 860.50
ii. Other matters not related to tax 10.75 10.75 iii. Royalty Payment for use of BT Cotton technology 6,550.57 iv. Bank guarantees 82.83 99.18
138
Notes forming part of Financial Statements for the year ended March 31, 2017
Value Creation Through Transformation
55 Operating Leases The Company’s significant leasing arrangements are in respect of operating leases for lands and premises (Agricultural
lands, office, stores, godown etc.). These leasing arrangements which are cancellable range between 11 months and 10 years generally, or longer, and are usually renewable by mutual consent on mutually agreeable terms. The aggregate lease rentals payable are charged as rent in the Statement of Profit and Loss.
The company does not have any non-cancellable agreements.
56 Segment Information56.1 The Company has only one business segment via, Seeds.56.2 Geographical information The Company operates in single principal geographical area i.e., India. Though the Company has operations across
various geographies within India, the same are considered as a single operating segment considering the following factors
- These operating segements have similar long term gross profit margins.
- The nature of the products and production processes are similar and the methods used to distribute the products to the customers are the same.
56.3 In view of the above mentioned classification of business and geograhical segments, the particulars relating to Segment revenue and results, Segment assets and liabilities, Other segment information, revenue from major products and services, geographical information are not furnished herewith.
As per our report of even date attached For and on behalf of the Board
Firm Registration No.003268Sfor P.R.REDDY & CO.,CHARTERED ACCOUNTANTS Sd/- Sd/-
G. VIJAY KUMAR G.V.BHASKAR RAO Sd/- Chief Financial Officer Managing Director
P.RAGHUNADHA REDDYPARTNERMembership No.23758
Sd/- Sd/-Place: Secunderabad V.R.S.MURTI G.VANAJA DEVIDate: 24.05.2017 Company Secretary Wholetime Director

Annual Report 2016-17 139
Statutory reports 30-89
Financial statements 90-188
Company overview 01-29
Independent Auditor’s Report – Consolidated
TO THE MEMBERS OF
M/S. KAVERI SEED COMPANY LIMITED
Report on the Consolidated Ind AS Financial StatementsWe have audited the accompanying consolidated Ind AS financial statements of M/S. KAVERI SEED COMPANY LIMITED (hereinafter referred to as “the Holding Company”) and its subsidiaries (the Holding Company and its subsidiaries
together referred to as “the Group”) comprising of the Consolidated Balance Sheet as at 31st March, 2017, the Consolidated Statement of Profit and Loss (Including other comprehensive Income), the Consolidated Cash Flow Statement and the Consolidated Statement of Changes in Equity for the year then ended, and a summary of the significant accounting policies and other explanatory information (hereinafter referred to as “the consolidated Ind AS financial statements”).
Management’s Responsibility for the Consolidated Ind AS Financial StatementsThe Holding Company’s Board of Directors is responsible for the preparation of these consolidated Ind AS financial statements in terms of the requirements of the Companies Act, 2013 ( “the Act”) that give a true and fair view of the consolidated financial position, consolidated financial performance (Including other comprehensive income), consolidated cash flows and consolidated changes in equity of the Group in accordance with the accounting principles
generally accepted in India, including the Indian Accounting Standards prescribed under Section 133 of the Act, read with Rule 7 of the Companies (Accounts) Rules, 2014. The respective Board of Directors of the companies included in the Group are responsible for maintenance of adequate accounting records in accordance with the provisions of
the Act for safeguarding the assets of the Group and for preventing and detecting frauds and other irregularities; the selection and application of appropriate accounting policies; making judgments and estimates that are reasonable and prudent; and the design, implementation and maintenance of adequate internal financial controls, that were operating effectively for ensuring the accuracy and completeness of the accounting records, relevant to the preparation and presentation of the Standalone Ind AS financial statements that give a true and fair view and are free from material misstatement, whether due to fraud or error, which have been used for the purpose of preparation of the Consolidated Ind AS financial statements by the Directors of the Holding Company, as aforesaid.
Auditor’s ResponsibilityOur responsibility is to express an opinion on these Consolidated Ind AS financial statements based on our audit. While conducting the audit, we have taken into account the provisions of the Act, the accounting and auditing standards and matters which are required to be included in the audit report under the provisions of the Act and the Rules made there under.
We conducted our audit in accordance with the Standards on Auditing specified under Section 143(10) of the Act. Those Standards require that we comply with ethical requirements and plan and perform the audit to obtain reasonable assurance about whether the consolidated Ind AS financial statements are free from material misstatement.
An audit involves performing procedures to obtain audit evidence about the amounts and the disclosures in the consolidated Ind AS financial statements. The procedures selected depend on the auditor’s judgment, including the assessment of the risks of material misstatement of the consolidated Ind AS financial statements, whether due
140
Value Creation Through Transformation
to fraud or error. In making those risk assessments, the auditor considers internal financial control relevant to the Holding Company’s preparation of the consolidated Ind AS financial statements that give a true and fair view in order to design audit procedures that are appropriate in the circumstances but not for the purpose of expressing an opinion on whether the Holding Company has an adequate internal financial controls system over financial reporting in place and the operating effectiveness of such controls. An audit also includes evaluating the appropriateness of the accounting policies used and the reasonableness of the accounting estimates made by the Holding Company’s Board of Directors, as well as evaluating the overall presentation of the consolidated Ind AS financial statements.
We believe that the audit evidence obtained by us is sufficient and appropriate to provide a basis for our audit opinion on the consolidated Ind AS financial statements.
OpinionIn our opinion and to the best of our information and according to the explanations given to us, the aforesaid consolidated Ind AS financial statements give the information required by the Act in the manner so required and give a true and fair view in conformity with the accounting principles generally accepted in India including the Ind AS, of the consolidated state of affairs of the Group as at 31st March, 2017, and its consolidated financial performance (Including other comprehensive income), its consolidated cash flows and consolidated statement of changes in equity for the year ended on that date.
Report on Other Legal and Regulatory Requirements1. As required by Section 143(3) of the Act, we report, to
the extent applicable, that:
(a) We have sought and obtained all the information
and explanations which to the best of our knowledge and belief were necessary for the purposes of our audit of the aforesaid consolidated Ind AS financial statements.
(b) In our opinion, proper books of account as required by law relating to preparation of the aforesaid consolidated Ind AS financial statements have been kept so far as it appears from our examination of those books .
(c) The Consolidated Balance Sheet, the Consolidated
Statement of Profit and Loss (Including other comprehensive income), the Consolidated Cash Flow Statement and Consolidated Statement of Changes in Equity dealt with by this Report are in agreement with the relevant books of account maintained for the purpose of preparation of the
consolidated Ind AS financial statements.
(d) In our opinion, the aforesaid consolidated Ind AS financial statements comply with the Indian Accounting Standards prescribed under Section 133 of the Act, read with Rule 7 of the Companies (Accounts) Rules, 2014.
(e) On the basis of the written representations received from the directors of the Holding Company as on

Annual Report 2016-17 141
Statutory reports 30-89
Financial statements 90-188
Company overview 01-29
31st March, 2017 taken on record by the Board of Directors of the Holding Company, none of the directors of the Group companies is disqualified as on 31st March, 2017 from being appointed as a director in terms of Section 164 (2) of the Act.
(f ) With respect to the adequacy of the internal financial controls over financial reporting of the
Holding Company and its subsidiary companies and the operating effectiveness of such controls, refer to our separate Report in “Annexure –A”.
(g) With respect to the other matters to be included in the Auditor’s Report in accordance with Rule 11 of the Companies (Audit and Auditor’s) Rules, 2014, in our opinion and to the best of our information and according to the explanations given to us:
i. There were no pending litigations which would impact the consolidated financial position of the Group Companies.
ii. The Group Companies did not have any Long term Contracts including Derivative Contracts for which there were any material foreseeable losses.
iii. There were no amounts which were required
to be transferred to the Investor Education and Protection Fund by the Holding Company, and its subsidiary companies.
iv. The requisite disclosures in the consolidated Ind AS financial statements for holdings as well as dealings in Specified Bank Notes during the period from 8th November 2016 to 30th December 2016 have been provided with respect to Holding Company and subsidiaries. Based on audit procedures and reliance on management representation, we report that the disclosures are in accordance with books of account and other records maintained by the Holding Company and subsidiaries and as produced to us by the management.
For P R REDDY & COFirm Regn No.003268S
CHARTERED ACCOUNTANTS
Sd/-P. RAGHUNADHA REDDY
Place: Hyderabad, PartnerDate: 24th May, 2017. Membership No. 23758
142
Value Creation Through Transformation
Annexure - A Referred to Independent Auditor’s Report to the Members of M/S.KAVERI SEED COMPANY LIMITED for the year ended 31st March, 2017.
Referred to in the Independent Auditor’s Report of even date to the members of Kaveri Seed Company Limited on the consolidated Ind AS financial statements for the year ended March 31, 2017.
Report on the Internal Financial Controls under Clause (1) of Sub-section 3 of Section 143 of the Act1. We have audited the internal financial controls over
financial reporting of Kaveri Seed Company Limited (“the holding company”) and its subsidiary companies as of March 31, 2017 in conjunction with our audit of the consolidated Ind AS financial statements of the company for the year ended on that date.
Management’s Responsibility for Internal Financial Controls2. The respective board of directors of the holding
company and its subsidiary Companies are responsible for establishing and maintaining internal financial controls based on the internal control over financial reporting criteria established by the Holding Company and subsidiary companies considering the essential components of internal control stated in the Guidance Note on Audit of Internal Financial Controls over Financial Reporting issued by the Institute of Chartered Accounts of India (ICAI). These responsibilities include the design, implementation and maintenance of adequate internal financial controls that were operating effectively for ensuring the orderly and efficient conduct of its business, including adherence to Company’s policies, the safeguarding of its assets, the preventing and detection of frauds and errors, the accuracy and completeness of the accounting records, and the timely preparation of reliable financial information, as required under the Act.
Auditor’s Responsibility3. Our responsibility is to express an opinion on the Holding
Company’s, and its subsidiary companies, internal financial controls over financial reporting based on our audit. We conducted our audit in accordance with the Guidance Note on Audit of Internal Financial Controls over Financial Reporting (the “Guidance Note”) and the standards on Auditing deemed to be prescribed under section 143(10) of the Act to the extent applicable to
an audit of internal financial controls, both applicable to an audit of internal financial controls and both issued by the ICAI. Those standards and the Guidance Note require that we comply with ethical requirements and plan and perform the audit to obtain reasonable assurance about whether adequate internal financial controls over financial reporting was established and maintained and if such controls operated effectively in all material respect.
4. Our audit involves performing procedures to obtain audit evidence about the adequacy of the internal financial controls system over financial reporting and their operating effectiveness. Our audit of internal financial controls over financial reporting included obtaining an understanding of internal financial controls over financial reporting, assessing the risk that a material weakness exists, and testing and evaluating the design and operating effectiveness of internal control based on the assessed risk. The procedures selected depending on the auditor’s judgment, including the assessment of the risks of the material misstatement of the financial statements, whether due to fraud or error.
5. We believe that the audit evidence we have obtained is sufficient and appropriate to provide a basis for our audit opinion on the Holding Company’s and its subsidiary companies internal financial controls system over financial reporting.
Meaning of Internal Financial Controls over Financial Reporting6. A Company’s internal financial control over financial
reporting is a process designed to provide reasonable assurance regarding the reliability of financial reporting and the preparation of financial statements for external purpose in accordance with Generally Accepted Accounting Principles. A Company’s internal financial control over financial reporting includes those policies and procedures that (1) pertain to the maintenance of records that, in reasonable detail, accurately and fairly reflect the transactions and dispositions of the assets of the company; (2) provide reasonable assurance that transaction are recorded as necessary to permit
Annual Report 2016-17 143
Statutory reports 30-89
Financial statements 90-188
Company overview 01-29
preparation of financial statements in accordance with Generally Accepted Accounting Principles, and that receipts and expenditure of the company are being made only in accordance with authorization of the management and directors of the company; and (3) provide reasonable assurance regarding prevention or timely detection of unauthorized acquisition, use, or disposition of the Company’s assets that could have a material effect on the financial statements.
Inherent Limitations of Internal Financial Controls over Financial Reporting7. Because of the inherent limitations of internal
financial controls over financial reporting, including the possibility of collusion or improper management override of controls, material misstatements due to error or fraud may occur and not be detected. Also, projection of any evaluation of the internal financial controls over financial reporting to future periods are subject to the risk that the internal financial control over financial reporting may become inadequate because of changes in conditions, or that the degree of compliance with the policies or procedures may deteriorate.
Opinion8. In our opinion, the Holding Company and its subsidiary
companies have in all material respects, an adequate internal financial controls systems over financial reporting and such internal financial controls over financial reporting were operating effectively as at March 31, 2017, based on the internal control over financial reporting criteria established by the Holding company and its subsidiary companies considering the essential components of internal controls stated in the Guidance Note on Audit of Internal Financial Controls over Financial Reporting issued by the Institute of Chartered Accounts of India.
For P R REDDY & COFirm Regn No.003268S
CHARTERED ACCOUNTANTS
Sd/-P. RAGHUNADHA REDDY
Place: Hyderabad, PartnerDate: 24th May, 2017. Membership No. 23758
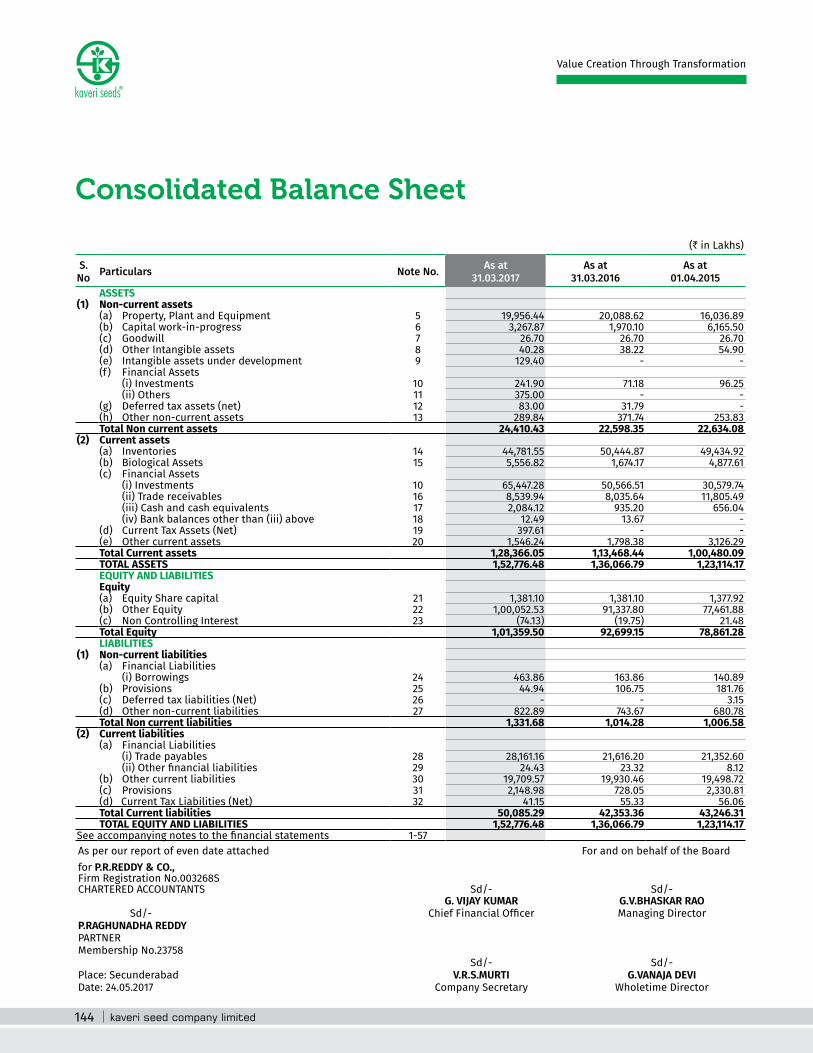
144
Value Creation Through Transformation
Consolidated Balance Sheet
(` in Lakhs)
S.No Particulars Note No. As at
31.03.2017As at
31.03.2016As at
01.04.2015ASSETS
(1) Non-current assets(a) Property, Plant and Equipment 5 19,956.44 20,088.62 16,036.89 (b) Capital work-in-progress 6 3,267.87 1,970.10 6,165.50 (c) Goodwill 7 26.70 26.70 26.70 (d) Other Intangible assets 8 40.28 38.22 54.90 (e) Intangible assets under development 9 129.40 - - (f ) Financial Assets (i) Investments 10 241.90 71.18 96.25 (ii) Others 11 375.00 - - (g) Deferred tax assets (net) 12 83.00 31.79 - (h) Other non-current assets 13 289.84 371.74 253.83 Total Non current assets 24,410.43 22,598.35 22,634.08
(2) Current assets(a) Inventories 14 44,781.55 50,444.87 49,434.92 (b) Biological Assets 15 5,556.82 1,674.17 4,877.61 (c) Financial Assets (i) Investments 10 65,447.28 50,566.51 30,579.74 (ii) Trade receivables 16 8,539.94 8,035.64 11,805.49 (iii) Cash and cash equivalents 17 2,084.12 935.20 656.04 (iv) Bank balances other than (iii) above 18 12.49 13.67 - (d) Current Tax Assets (Net) 19 397.61 - - (e) Other current assets 20 1,546.24 1,798.38 3,126.29 Total Current assets 1,28,366.05 1,13,468.44 1,00,480.09 TOTAL ASSETS 1,52,776.48 1,36,066.79 1,23,114.17EQUITY AND LIABILITIESEquity(a) Equity Share capital 21 1,381.10 1,381.10 1,377.92 (b) Other Equity 22 1,00,052.53 91,337.80 77,461.88 (c) Non Controlling Interest 23 (74.13) (19.75) 21.48 Total Equity 1,01,359.50 92,699.15 78,861.28 LIABILITIES
(1) Non-current liabilities(a) Financial Liabilities (i) Borrowings 24 463.86 163.86 140.89 (b) Provisions 25 44.94 106.75 181.76 (c) Deferred tax liabilities (Net) 26 - - 3.15 (d) Other non-current liabilities 27 822.89 743.67 680.78 Total Non current liabilities 1,331.68 1,014.28 1,006.58
(2) Current liabilities(a) Financial Liabilities (i) Trade payables 28 28,161.16 21,616.20 21,352.60 (ii) Other financial liabilities 29 24.43 23.32 8.12 (b) Other current liabilities 30 19,709.57 19,930.46 19,498.72 (c) Provisions 31 2,148.98 728.05 2,330.81 (d) Current Tax Liabilities (Net) 32 41.15 55.33 56.06 Total Current liabilities 50,085.29 42,353.36 43,246.31 TOTAL EQUITY AND LIABILITIES 1,52,776.48 1,36,066.79 1,23,114.17
See accompanying notes to the financial statements 1-57As per our report of even date attached For and on behalf of the Board for P.R.REDDY & CO.,Firm Registration No.003268SCHARTERED ACCOUNTANTS Sd/- Sd/-
G. VIJAY KUMAR G.V.BHASKAR RAOSd/- Chief Financial Officer Managing Director
P.RAGHUNADHA REDDYPARTNERMembership No.23758
Sd/- Sd/-Place: Secunderabad V.R.S.MURTI G.VANAJA DEVIDate: 24.05.2017 Company Secretary Wholetime Director

Annual Report 2016-17 145
Statutory reports 30-89
Financial statements 90-188
Company overview 01-29
Consolidated Statement of Profit & Loss
As per our report of even date attached For and on behalf of the Board for P.R.REDDY & CO.,Firm Registration No.003268SCHARTERED ACCOUNTANTS Sd/- Sd/-
G. VIJAY KUMAR G.V.BHASKAR RAOSd/- Chief Financial Officer Managing Director
P.RAGHUNADHA REDDYPARTNERMembership No.23758 Sd/- Sd/-Place: Secunderabad V.R.S.MURTI G.VANAJA DEVIDate: 24.05.2017 Company Secretary Wholetime Director
(` in Lakhs)
S.No Particulars Note Year Ended
March 31, 2017 Year Ended
March 31, 2016 I Income
a) Revenue from Operations 33 70,635.76 74,530.27 b) Other Income 34 3,442.23 1,309.97 Total Income 74,077.99 75,840.24
II Expensesa) Cost of Material Consumed 35 39,123.84 37,509.47 b) Changes in Inventories of Finished Goods and Work in
Progress36 1,805.48 2,305.70
c) Excise Duty 136.69 41.77 d) Employee Benefit Expenses 37 3,990.98 3,825.32 e) Finance Costs 38 24.14 23.89 f) Depreciation & Amortisation Expenses 39 3,023.67 2,744.24 g) Other Expenses 40 11,624.10 12,095.91 Tota l Expenses 59,728.90 58,546.30
III Profit before Exceptional Items and Tax ( I-II) 14,349.09 17,293.94 IV Exceptional Item (Refer Note.44) (5,923.80) - V Profit before Tax ( III+IV) 8,425.29 17,293.94 VI Less : Tax expense
Current Tax 1,290.99 581.71 Earlier Years Tax (366.28) Mat Credit Entitlement (177.18) Deferred Tax (51.18) 696.34 (34.95) 546.76
VII Profit for the Year ( V-VI) 7,728.95 16,747.18 VIII Non Controlling Interest
Aditya 17.46 8.10 Genome (71.85) (54.39) (49.33) (41.23)
IX Profit after non controlling interest 7,783.34 16,788.41 X Other Comprehensive Income
(i) Items that will not be reclassfied to Profit or loss Fair value of Investments through other comprehensive Income 1,452.44 1,888.14 Acturial gain/(loss) on employee benefits through other
comprehensive Income (41.56) -
1,410.88 1,888.14 (ii) Income tax relating to items that will not be reclassfied to
profit or loss -
Current tax on Fair value of Investments through other comprehensive Income
(479.49) (641.78)
931.39 1,246.36 XI Total Comprehensive Income for the period (IX+X) Comprising
Profit /(loss) and Other Comprehensive Income for the Period 8,714.73 18,034.77
XII Earnings Per Equity Share (for continuing operations)(1) Basic (equity shares, par value ` 2 each) 11.27 24.31 (2) Diluted (equity shares, par value ` 2 each) 11.27 24.31
XIII Earnings Per Equity Share (for discontinued operations)(1) Basic (equity shares, par value ` 2 each) - - (2) Diluted (equity shares, par value ` 2 each) - -
XIV Earnings Per Equity Share (for discontinued & Continuing operations) (1) Basic (equity shares, par value ` 2 each) 11.27 24.31 (2) Diluted (equity shares, par value ` 2 each) 11.27 24.31
Notes on Financial Statements 1-57
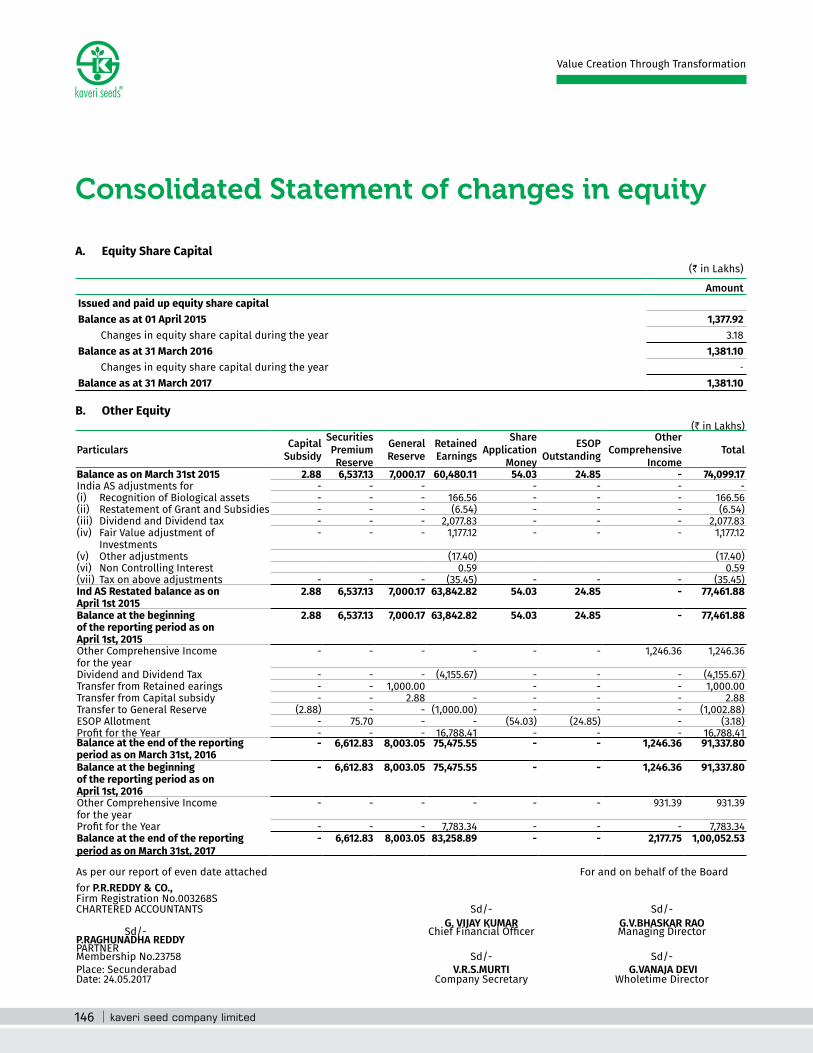
146
Value Creation Through Transformation
Consolidated Statement of changes in equity
A. Equity Share Capital(` in Lakhs)
AmountIssued and paid up equity share capital Balance as at 01 April 2015 1,377.92 Changes in equity share capital during the year 3.18 Balance as at 31 March 2016 1,381.10 Changes in equity share capital during the year -
Balance as at 31 March 2017 1,381.10
B. Other Equity (` in Lakhs)
Particulars Capital Subsidy
Securities Premium Reserve
General Reserve
Retained Earnings
Share Application
Money
ESOP Outstanding
Other Comprehensive
Income Total
Balance as on March 31st 2015 2.88 6,537.13 7,000.17 60,480.11 54.03 24.85 - 74,099.17 India AS adjustments for - - - - - - - (i) Recognition of Biological assets - - - 166.56 - - - 166.56 (ii) Restatement of Grant and Subsidies - - - (6.54) - - - (6.54)(iii) Dividend and Dividend tax - - - 2,077.83 - - - 2,077.83 (iv) Fair Value adjustment of
Investments - - - 1,177.12 - - - 1,177.12
(v) Other adjustments (17.40) (17.40)(vi) Non Controlling Interest 0.59 0.59 (vii) Tax on above adjustments - - - (35.45) - - - (35.45)Ind AS Restated balance as on April 1st 2015
2.88 6,537.13 7,000.17 63,842.82 54.03 24.85 - 77,461.88
Balance at the beginning of the reporting period as on April 1st, 2015
2.88 6,537.13 7,000.17 63,842.82 54.03 24.85 - 77,461.88
Other Comprehensive Income for the year
- - - - - - 1,246.36 1,246.36
Dividend and Dividend Tax - - - (4,155.67) - - - (4,155.67)Transfer from Retained earings - - 1,000.00 - - - 1,000.00 Transfer from Capital subsidy - - 2.88 - - - - 2.88 Transfer to General Reserve (2.88) - - (1,000.00) - - - (1,002.88)ESOP Allotment - 75.70 - - (54.03) (24.85) - (3.18)Profit for the Year - - - 16,788.41 - - - 16,788.41 Balance at the end of the reporting period as on March 31st, 2016
- 6,612.83 8,003.05 75,475.55 - - 1,246.36 91,337.80
Balance at the beginning of the reporting period as on April 1st, 2016
- 6,612.83 8,003.05 75,475.55 - - 1,246.36 91,337.80
Other Comprehensive Income for the year
- - - - - - 931.39 931.39
Profit for the Year - - - 7,783.34 - - - 7,783.34 Balance at the end of the reporting period as on March 31st, 2017
- 6,612.83 8,003.05 83,258.89 - - 2,177.75 1,00,052.53
As per our report of even date attached For and on behalf of the Board for P.R.REDDY & CO.,Firm Registration No.003268SCHARTERED ACCOUNTANTS Sd/- Sd/-
G. VIJAY KUMAR G.V.BHASKAR RAOSd/- Chief Financial Officer Managing Director
P.RAGHUNADHA REDDYPARTNERMembership No.23758 Sd/- Sd/-Place: Secunderabad V.R.S.MURTI G.VANAJA DEVI Date: 24.05.2017 Company Secretary Wholetime Director

Annual Report 2016-17 147
Statutory reports 30-89
Financial statements 90-188
Company overview 01-29
Consolidated Statement of Cash Flow
(` in Lakhs)
Particulars As at 31-Mar-2017
As at 31-Mar-2016
Cash flows from operating activitiesProfit before taxation 14,349.09 17,293.94 Adjustments for: Depreciation & Amortisation 3,023.67 2,744.24 (Profit)/Loss on sale of Fixed Assets (44.75) (3.08) Dividend Received (0.54) (6.11) Gain from Investments (3,250.81) (1,024.51) Interest received (118.07) (82.90) Finance charges 24.14 23.89 Operating profit before working capital changes 13,982.73 18,945.47 (Increase) / Decrease in Inventories and Biological Assets 1,780.68 2,193.49 (Increase)/Decrease in Trade Receivables and other receivables (504.30) 3,769.85 (Increase)/Decrease in Loans & Advances (Other assets ) (489.78) 1,178.21 Increase/(Decrease) in Trade Payables 6,544.97 263.60 Increase/(Decrease) in Provisions 1,359.13 (1,677.78)Increase/(Decrease) in Other liabilities (154.75) 505.95 Taxes paid during the year (696.34) (546.76)Net cash provided by operating activities 21,822.33 24,632.03 Cash flows from investing activitiesPayments for property, plant and equipment (4,331.72) (2,590.75)Proceeds from disposal of property, plant and equipment 77.04 23.25 Payments for investment (88,177.33) (85,044.37)Proceeds from disposal of investment 74,057.25 66,329.03 Payments for intangible assets (21.30) (13.29)Proceeds from earmarked deposits with Bank 1.18 (13.67)Dividend Received 0.54 6.11 Gain from Investments 3,250.81 1,024.51 Interest received 118.07 82.90 Net Cash used for investing activities (15,025.46) (20,196.28)Cash flows from Exceptional Items (5,923.80) -
Cash flows from financing activitiesProceeds from Borrowings 300.00 22.97 Dividend including Tax on Dividend - (4,155.67)Finance charges (24.14) (23.89)Net cash provided by financing activities 275.86 (4,156.58)Net increase in cash & cash equivalents 1,148.92 279.15 Cash & Cash equivalents at the beginning of the period 935.20 656.04 Cash & Cash equivalents at the end of the period 2,084.12 935.20 As per our report of even date attached For and on behalf of the Board for P.R.REDDY & CO.,Firm Registration No.003268SCHARTERED ACCOUNTANTS Sd/- Sd/-
G. VIJAY KUMAR G.V.BHASKAR RAOSd/- Chief Financial Officer Managing Director
P.RAGHUNADHA REDDYPARTNERMembership No.23758 Sd/- Sd/-Place: Secunderabad V.R.S.MURTI G.VANAJA DEVIDate: 24.05.2017 Company Secretary Wholetime Director
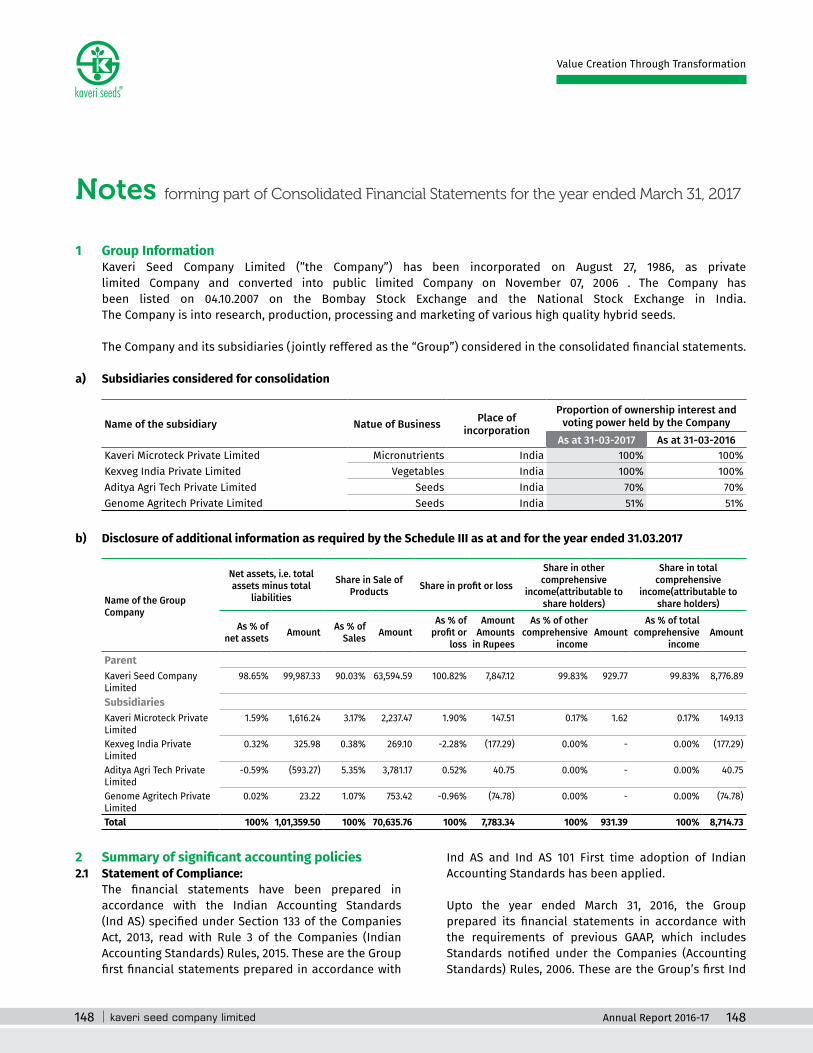
148
Notes forming part of Consolidated Financial Statements for the year ended March 31, 2017
Value Creation Through Transformation
1 Group Information Kaveri Seed Company Limited (”the Company”) has been incorporated on August 27, 1986, as private
limited Company and converted into public limited Company on November 07, 2006 . The Company has been listed on 04.10.2007 on the Bombay Stock Exchange and the National Stock Exchange in India. The Company is into research, production, processing and marketing of various high quality hybrid seeds.
The Company and its subsidiaries (jointly reffered as the “Group”) considered in the consolidated financial statements.
a) Subsidiaries considered for consolidation
Name of the subsidiary Natue of Business Place of incorporation
Proportion of ownership interest and voting power held by the Company
As at 31-03-2017 As at 31-03-2016Kaveri Microteck Private Limited Micronutrients India 100% 100%Kexveg India Private Limited Vegetables India 100% 100%Aditya Agri Tech Private Limited Seeds India 70% 70%Genome Agritech Private Limited Seeds India 51% 51%
b) Disclosure of additional information as required by the Schedule III as at and for the year ended 31.03.2017
Name of the Group Company
Net assets, i.e. total assets minus total
liabilities
Share in Sale of Products Share in profit or loss
Share in other comprehensive
income(attributable to share holders)
Share in total comprehensive
income(attributable to share holders)
As % of net assets Amount As % of
Sales AmountAs % of
profit or loss
Amount Amounts
in Rupees
As % of other comprehensive
incomeAmount
As % of total comprehensive
incomeAmount
ParentKaveri Seed Company Limited
98.65% 99,987.33 90.03% 63,594.59 100.82% 7,847.12 99.83% 929.77 99.83% 8,776.89
SubsidiariesKaveri Microteck Private Limited
1.59% 1,616.24 3.17% 2,237.47 1.90% 147.51 0.17% 1.62 0.17% 149.13
Kexveg India Private Limited
0.32% 325.98 0.38% 269.10 -2.28% (177.29) 0.00% - 0.00% (177.29)
Aditya Agri Tech Private Limited
-0.59% (593.27) 5.35% 3,781.17 0.52% 40.75 0.00% - 0.00% 40.75
Genome Agritech Private Limited
0.02% 23.22 1.07% 753.42 -0.96% (74.78) 0.00% - 0.00% (74.78)
Total 100% 1,01,359.50 100% 70,635.76 100% 7,783.34 100% 931.39 100% 8,714.73
2 Summary of significant accounting policies2.1 Statement of Compliance: The financial statements have been prepared in
accordance with the Indian Accounting Standards (Ind AS) specified under Section 133 of the Companies Act, 2013, read with Rule 3 of the Companies (Indian Accounting Standards) Rules, 2015. These are the Group first financial statements prepared in accordance with
Ind AS and Ind AS 101 First time adoption of Indian Accounting Standards has been applied.
Upto the year ended March 31, 2016, the Group prepared its financial statements in accordance with the requirements of previous GAAP, which includes Standards notified under the Companies (Accounting Standards) Rules, 2006. These are the Group’s first Ind
Annual Report 2016-17 148

Annual Report 2016-17 149
Notes forming part of Consolidated Financial Statements for the year ended March 31, 2017
Statutory reports 30-89
Financial statements 90-188
Company overview 01-29
AS financial statements. The date of transition to Ind AS is April 1, 2015.
2.2 Basis for preparation of financial statements: The financial statements have been prepared on accrual
and going concern basis. The accounting policies are applied consistently to all the periods presented in the financial statements, including the preparation of the opening Ind AS Balance Sheet as at 1st April,2015 being the date of transition to Ind AS. All assets and liabilities have been classified as current or non current as per the Group’s normal operating cycle and other criteria as set out in the Division II of Schedule III of Companies Act 2013. Based on the nature of products and the time between acquisition of assets for processing and their realisation in cash and cash equivalents, the Group has accertained its operating cycle as 12 months for the purpose of current or non-current classification of assets and liabilities.
2.3 Use of Estimates: The preparation of financial statements requires the
management of the Group to make estimates and assumptions to be made that affect the reported amounts of assets and liabilities on the date of financial statements, disclosure of contingent liabilities as at the date of the financial statements, and the reported amounts of income and expenses during the reported period. Changes in estimates are reflected in the financial statements in the period in which changes are made and, if material, their effects are disclosed in the financial statements.
2.4 Property, Plant & Equipment and Other Intangible assets:
Property, plant and equipment is stated at acquisition cost net of accumulated depreciation and accumulated impairment losses, if any. Subsequent costs are included in the asset’s carrying amount or recognised as a separate asset, as appropriate, only when it is probable that future economic benefits associated with the item will flow to the Group and the cost of the item can be measured reliably. All other repairs and maintenance are charged to the Statement of Profit and Loss during the period in which they are incurred. Gains or losses arising on retirement or disposal of property, plant and equipment are recognised in the Statement
of Profit and Loss. Property, plant and equipment which are not ready for intended use as on the date of Balance Sheet are disclosed as “Capital work-in-progress”. Depreciation is provided on a pro-rata basis on the straight line method based on estimated useful life prescribed under Schedule II to the Companies Act, 2013.
Freehold land is not depreciated.
Upon first-time adoption of Ind AS, the Group has elected to measure all its property, plant and equipment at the Previous GAAP carrying amount as its deemed cost on the date of transition to Ind AS i.e., 1st April,2015.
Separately purchased intangible assets are initially measured at cost. Intangible assets are carried at cost less any accumulated amortisation and accumulated impairment losses, if any.
2.5 Biological Asset Recognition and measurement The Group recognises the biological asset (agricultural
produce) when:
(a) the Group controls the asset as a result of past events;
(b) it is probable that future economic benefits associated with the asset will flow to the Group; and
(c) the fair value or cost of the asset can be measured reliably.
The biological asset are measured on initial recognition and at the end of each reporting period at its fair value less costs to sell.
A gain or loss arising on initial recognition of biological asset at fair value less costs to sell is included in retained earnings and thereafter in profit or loss for the period in which it arised.
2.6 Leases: Leases in which a substantial portion of the risks and
rewards of ownership are retained by the lessor are
150
Notes forming part of Consolidated Financial Statements for the year ended March 31, 2017
Value Creation Through Transformation
classified as operating leases. Payments and receipts under such leases are recognised to the Statement of Profit and Loss on a straight-line basis over the term of the lease unless the lease payments to the lessor are structured to increase in line with expected general inflation to compensate for the lessor’s expected inflationary cost increases, in which case the same are recognised as an expense in line with the contractual term.
2.7 Borrowing Costs Borrowing costs directly attributable to the acquisition,
construction or production of qualifying assets, which are assets that necessarily take a substantial period of time to get ready for their intended use or sale, are added to the cost of those assets, until such time as the assets are substantially ready for their intended use or sale.
Interest income earned on the temporary investment of specific borrowings pending their expenditure on qualifying assets is deducted from the borrowing costs eligible for capitalisation.
All other borrowing costs are recognised in profit or loss in the period in which they are incurred.
2.8 Government Grants Government Grants are recognised in profit or loss on
a systematic basis over the periods in which the Group recognises as expenses the related cost for which the grants are intended to compensate. Specifically, government grants whose primary condition is that the Group purchase, construct or otherwise acquire non-current assets are recognised as deferred revenue in the balance sheet and transferred to profit or loss on a systematic and rational basis over the useful lives of the related assets.
Government grants that are receivable as compensation for expenses or losses already incurred or for the purpose of giving immediate financial support to the Group with no future related costs are recognised in profit or loss in the period in which they become receivable.
2.9 Impairment of Assets: i) Financial assets Group assesses at each balance sheet date whether
there is objective evidence that a financial asset or a Group of financial assets is impaired. A financial asset is considered to be impaired if objective evidence indicates that one or more events have had a negative effect on the estimated future cash flows of that asset.
Impairment loss on financial assets carried at amortised cost is measured at the difference between the asset’s carrying amount and the present value of estimated future cash flows, discounted at the financial asset’s original effective interest rate. In a subsequent period, if the amount of impairment loss decreases and the decreases can be related objectively to an event, the previously recognised impairment is reversed through profit or loss.
ii) Non-financial assets Property, Plant & Equipment and Other Intangible
assets Property, Plant and Equipment and Other
intangible assets with definite life are evaluated for recoverability whenever there is any indication that their carrying amounts may not be recoverable. If any such indication exists, the recoverable amount (i.e. higher of the fair value less cost to sell and the value-in-use) is determined on an individual asset basis unless the asset does not generate cash flows that are largely independent of those from other assets. In such cases, the recoverable amount is determined for the cash generating unit (CGU) to which the asset belongs.
If the recoverable amount of an asset (or CGU) is estimated to be less than its carrying amount, the carrying amount of the asset (or CGU) is reduced to its recoverable amount. An impairment loss is recognised in the profit or loss
Annual Report 2016-17 151
Notes forming part of Consolidated Financial Statements for the year ended March 31, 2017
Statutory reports 30-89
Financial statements 90-188
Company overview 01-29
2.10 Revenue recognition: Revenue from sale of goods is recognised when all
the significant risks and rewards of ownership in the goods are transferred to the buyer as per the terms of the contract, there is no continuing managerial involvement with the goods and the amount of revenue can be measured reliably. The Group retains no effective control of the goods transferred to a degree usually associated with ownership and no significant uncertainty exists regarding the amount of the consideration that will be derived from the sale of goods. Revenue is measured at fair value of the consideration received or receivable, after deduction of any trade discounts, schemes, volume rebates and any taxes or duties collected on behalf of the government which are levied on sales such as sales tax, value added tax, etc
Income from export incentives such as duty drawback and premium on sale of import licenses, and lease license fee are recognised on accrual basis.
2.11 Dividend and Interest Income Dividend income from investments is recognised
when the shareholders right to receive payment has been established (provided that it is probable that the economic benefits will flow to the Group and the amount of income can be measured reliably).
Interest income from a financial asset is recognised when it is probable that the economic benefits will flow to the Group and the amount of income can be measured reliably. Interest income is accrued on a time basis, by reference to the principal outstanding and at the effective interest rate applicable, which is the rate that exactly discounts estimated future cash receipts through the expected life of the financial asset to that asset’s net carrying amount on initial recognition.
2.12 Foreign currency transactions: The functional currency of the Group is Indian Rupees
(INR).
Foreign currency transactions are recorded at exchange rates prevailing on the date of the transaction. Gains and losses arising on settlement are included in the profit or loss.
2.13 Financial Instruments Financial assets and liabilities are recognised when the
Group becomes a party to the contractual provisions of the instrument.
Financial assets and liabilities are initially measured at fair value. Transaction costs that are directly attributable to the acquisition or issue of financial assets and financial liabilities (other than financial assets and financial liabilities at fair value through profit or loss) are added to or deducted from the fair value measured on initial recognition of financial asset or financial liability.
Transaction costs directly attributable to the acquisition of financial assets or financial liabilities at fair value through profit or loss are recognised in profit or loss.
i) Non-derivative financial instruments Cash and cash equivalents The Group considers all highly liquid financial
instruments, which are readily convertible into known amounts of cash that are subject to an insignificant risk of change in value and having original maturities of three months or less from the date of purchase, to be cash equivalents. Cash and cash equivalents consist of balances with banks which are unrestricted for withdrawal and usage.
Financial assets at fair value through other comprehensive income
Financial assets are measured at fair value through other comprehensive income if these financial assets are held within a business whose objective is achieved by both collecting contractual cash flows on specified dates that are solely payments
152
Notes forming part of Consolidated Financial Statements for the year ended March 31, 2017
Value Creation Through Transformation
of principal and interest on the principal amount outstanding and selling financial assets.
The Group, has made an irrevocable election to present in other comprehensive income subsequent changes in fair value of investments not held for trading.
Financial assets at cost Investment in subsidiaries are measured at cost.
Financial liabilities Financial liabilities at fair value through profit
and loss are stated at fair value, with any gains or losses arising on remeasurement recognised in profit and loss.
For trade and other payables maturing within one year from the Balance Sheet date, the carrying amounts approximate fair value due to the short maturity of these instruments.
2.14 Employee Benefits: a) Gratuity: The Group accounts for its gratuity liability, a
defined retirement benefit plan covering eligible employees. The gratuity plan provides for a lump sum payment to employees at retirement, death, incapacitation or termination of the employment based on the respective employee’s salary and the tenure of the employment. Liabilities with regard to a Gratuity plan are determined based on the actuarial valuation carried out by an independent actuary as at the Balance Sheet date using the Projected Unit Credit method for the Group.
Actuarial gains and losses are recognised in full in other comprehensive income and accumulated in equity in the period in which they occur.
b) Provident fund: The eligible employees of the Group are entitled to
receive the benefits of Provident fund, a defined contribution plan, in which both employees and the Company and its subsidiaries make monthly
contributions at a specified percentage of the covered employees’ salary (currently at 12% of the basic salary) which are charged to the Statement of Profit and Loss on accrual basis. The provident fund contributions are paid to the Regional Provident Fund Commissioner by the Company and its subsidiaries.
The Group has no further obligations for future provident fund and superannuation fund benefits other than its annual contributions.
c) Compensated absences: The Group provides for the encashment of leave
subject to certain Company’s rules. The employees are entitled to accumulate leave subject to certain limits, for future encashment or availment. The liability is provided based on the number of days of unavailed leave at each Balance Sheet date on the basis of an independent actuarial valuation using the Projected Unit Credit method for the Company and its subsidiaries.
The liability which is not expected to occur within twelve months after the end of the period in which the employee renders the related services are recognised based on actuarial valuation as at the Balance Sheet date.
Actuarial gains and losses are recognised in full in the Statement of Profit and Loss in the period in which they occur.
The Group also offers a short term benefit in the form of encashment of unavailed accumulated compensated absence above certain limit for all of its employees and same is being provided for in the books at actual cost.
d) Other short term employee benefits: Other short-term employee benefits such as
performance incentives expected to be paid in exchange for the services rendered by employees, are recognised during the period when the employee renders the service.

Annual Report 2016-17 153
Notes forming part of Consolidated Financial Statements for the year ended March 31, 2017
Statutory reports 30-89
Financial statements 90-188
Company overview 01-29
2.15 Share Based Payment Arrangements Employees of the Group receive remuneration in the
form of sharebased payments in consideration of the services rendered.
Under the equity settled share based payment, the fair value on the grant date of the awards given to employees is recognised as ‘employee benefit expenses’ with a corresponding increase in equity over the vesting period. The fair value of the options at the grant date is calculated by an independent valuer basis Black Scholes model. At the end of each reporting period, apart from the non market vesting condition, the expense is reviewed and adjusted to reflect changes to the level of options expected to vest. When the options are exercised, the Group issues fresh equity shares.
For cash-settled share based payments, the fair value of the amount payable to employees is recognised as ‘employee benefit expenses’ with a corresponding increase in liabilities, over the period of non market vesting conditions getting fulfilled. The liability is remeasured at each reporting period up to, and including the settlement date, with changes in fair value recognised in employee benefits expenses.
2.16 Inventories Inventories comprise of Raw and Packing Materials,
Work in Progress, Finished Goods(Manufactured and Traded). Inventories are valued at the lower of cost or the net realisable value after providing for obsolescence and other losses, where considered necessary. Cost is deteremined on FIFO basis. Cost includes all charges in bringing the goods to their present location and condition, including octroi and other levies, transit insurance and receiving charges. The cost of work-in-progress and finished goods comprises of materials, direct labour, other direct costs and related production overheads. Net realizable value is the estimated selling price in the ordinary course of business less the estimated costs of completion and the estimated costs necessary to make the sale.
2.17 Trade Receivables Trade receivables are stated at net of advances. Ageing
of receivable are considered as tool to determine the
degree of liquidity. Receivable due for more than two years and balance considered doubtful, referred for
recovery through legal proceeding are considered for provision.
2.18 Taxation: Tax expense comprises of current tax and deferred tax.
Current tax is measured at the amount expected to be paid to / recovered from the tax authorities, based on estimated tax liability computed after taking credit for allowances and exemption in accordance with the tax laws applicable in India.
Minimum Alternative Tax (MAT) paid in accordance with the tax laws, which gives rise to future economic benefits in the form of adjustment of future income tax liability is considered as an asset if there is convincing evidence that the Group will pay normal tax in future periods. Accordingly, it is recognized as an asset in the Balance Sheet when it is probable that the future economic benefit associated with it will flow to the Group and the asset can be measured reliably.
Deferred income taxes Deferred income tax is recognised using the balance
sheet approach. Deferred income tax assets and liabilities are recognised for deductible and taxable temporary differences arising between the tax base of assets and liabilities and their carrying amount.
Deferred income tax asset are recognised to the extent that it is probable that taxable profit will be available against which the deductible temporary differences and the carry forward of unused tax credits and unused tax losses can be utilised.
Deferred income tax liabilities are recognised for all taxable temporary differences except in respect of taxable temporary differences associated with investments in subsidiaries where the timing of the reversal of the temporary difference can be controlled and it is probable that the temporary difference will not reverse in the foreseeable future.
The carrying amount of deferred income tax assets is reviewed at each reporting date and reduced to the
154
Notes forming part of Consolidated Financial Statements for the year ended March 31, 2017
Value Creation Through Transformation
extent that it is no longer probable that sufficient taxable profit will be available to allow all or part of the deferred income tax asset to be utilised.
Deferred tax assets and liabilities are measured using substantively enacted tax rates expected to apply to taxable income in the years in which the temporary differences are expected to be received or settled.
2.19 Earnings per Share: Basic earnings/ (loss) per share are calculated by
dividing the net profit / (loss) for the period attributable to equity shareholders by the weighted average number of equity shares outstanding during the period.
For the purpose of calculating diluted earnings / (loss) per share, the net profit / (loss) for the period attributable to equity shareholders and the weighted average number of shares outstanding during the period are adjusted for the effects of all dilutive potential equity shares.
The dilutive potential equity shares are adjusted for the proceeds receivable, had the shares been issued at fair value. Dilutive potential equity shares are deemed converted as of the beginning of the period, unless issued at a later date.
2.20 Provision, Contingent Liabilities and Contingent Assets:
A provision is recognized when the Group has a present obligation as a result of past event and it is probable
that an outflow of resources will be required to settle the obligation, in respect of which reliable estimate can be made. If the effect of the time value of money is material, provisions are discounted using a current pre-tax rate that reflects, when appropriate, the risks specific to the liability. When discounting is used, the increase in the provision due to the passage of time is recognised as a finance cost.
Contingent Liabilities and Contingent Assets are not recognized in the financial statements.
3 Explanation of Transition to Ind AS The Transition as at April 1,2015 to Ind AS was carried
out from Previous GAAP. The exemptions and exceptions applied by the Group in accordance with Ind AS 101 - First-time Adoption of Indian Accounting Standards, the reconciliations of equity and total comprehensive income in accordance with previous GAAP to Ind AS are explained below.
The Group has applied the following exemptions: Deemed cost for property, plant and equipment and
intangible assets The Group has elected to continue with the carrying
value of all its property, plant and equipment, investment property, and intangible assets recognised as of 01 April 2015 (the transition date) measured as per the previous GAAP and use that carrying value as its deemed cost as of the transition date.

Annual Report 2016-17 155
Notes forming part of Consolidated Financial Statements for the year ended March 31, 2017
Statutory reports 30-89
Financial statements 90-188
Company overview 01-29
4 Reconciliation between previous GAAP and Ind AS(a) Equity Reconciliation
(` in Lakhs)
Particulars Notes As at March 31,2016
As at April 1, 2015
Total Equity as per Previous GAAP 90,649.38 75,499.16 (i) Recognition of Biological assets a 65.87 166.56 (ii) Restatement of Grant and Subsidies b (8.67) (6.54)(iii) Fair value adjustment of Financial Assets c (4.14) -
(iv) Fair value of Investments d 1,981.79 1,177.12 (v) Other Adjustments (12.15) (17.40)(vi) Dividend and Dividend Tax f - 2,077.83 (vii) Tax on above adjustments g 27.07 (35.45)(viii) Non Controlling InterestTotal Equity as per Ind As 92,699.15 78,861.28
(b) Total Comprehensive Income Reconciliation(` in Lakhs)
Particulars Notes As at March 31,2016
Net Profit as per previous GAAP 17,228.04 (i) Recognition of Biological assets a (100.67)(ii) Restatement of Grant and Subsidies b (2.13)(iii) Fair value adjustment of Financial Assets c (4.14)(Iv) Profit on sale of Investments d (441.68)(v) Other Adjustments 5.25 (vi) Tax on above adjustments g 62.51 Net Profit as per India AS 16,747.18 Other Comprehensive Income (net of tax) as per Inda AS d 1,246.36 Total Comprehensive Income as per India AS 17,993.54
(C) Reconciliation of Statement of Cash Flow There are no material adjustments to the Statements of
Cash Flows as reported under previous GAAP.
Notes to Reconciliations between previous GAAP and Ind AS
(a) Recognition of Biological Assets : The Group has recognised Standing Crop as
Biological Asset from April 1, 2015 as result of India AS. This has resulted in an increase in equity by ` 65.87 Lakhs and 166.56 Lakhs as at March 31,2016
and April 1, 2015 respectively and decrease in net profit by ` 100.67 Lakhs for the year ended March 31, 2016.
(b) Restatement of Grant and Subsidies : Under Previous GAAP, Fixed Assets acquired with
the Grants/Subsidy are accounted net of the Grant/Subsidy in books of account. Now as per India AS the extent of Grant/Subsidy reduced from Fixed Assets are re-instated in the books as Fixed Assets along with the Grant/Subsidy as Liability.

156
Notes forming part of Consolidated Financial Statements for the year ended March 31, 2017
Value Creation Through Transformation
The value of the Fixed Assets re-instated will be depreciated as per schedule II of Companies Act 2013 and Grant/Subsidy re-instated will be charged to profit & loss a/c over the life time of those assets in equal instalments. Net difference of Depreciation and Grant/Subsidy charged to Profit & loss a/c has resulted in equity decrease by ` 8.67 Lakhs and ` 6.54 Lakhs as at March 31,2016 and April 1, 2015 respectively and decrease net profit by ` 2.13 Lakhs for the year ended March 31, 2016.
(c) Fair Value Adjustments of Financial Assets: Under India AS, historical percentage of receivables
written off over the years need to be provided from sales and the same should be reduced in sales and as well as in trade receivables. This has resulted in decrease of equity by ` 4.14 Lakhs and ` Nil as at March 31,2016 and April 1,2015 respectively and decrease in net profit by ` 4.14 Lakhs for the year ended March 31,2016.
(d) Fair Value of Investments : Under previous GAAP, current investments were
measured at cost less diminution in value, under India AS investments are measured at fair value. Net increase in fairvalue after reducing provision for current tax has resulted in increase of equity by ` 1981.79 Lakhs and ` 1177.12 Lakhs as at March 31,2016 and April 1,2015 respectively.
The fairvalue difference as on April 1, 2015 is effected to retained earnings and later increase/decrease is effected to Other Comprehensive Income (OCI). For the year ended March 31,2016 this has resulted in increase in Other Comprehensive Income (OCI) by ` 1246.36 Lakhs net of provision for current tax and decrease in net profit by `
441.68 Lakhs due to redemption of investment held on April 1,2015 on those fairvalue difference is already effected to retained earings.
(f ) Dividend and Dividend Tax : Under India AS, dividend to holders of equity
instruments is recognised as a liability in the year in which the obligation to pay is established. Under previous GAAP, dividend payable is recorded as a liability in the year to which it relates. This has resulted in an increase in equity by ` Nil and `
2077.83 Lakhs as at March 31, 2016 and April 1, 2015 respectively.
(g) Tax Adjustments : Tax adjustments include deferred tax impact on
account of differences between previous GAAP and Ind AS. These adjustments have resulted in an increase in equity under Ind AS by ` 27.07 Lakhs and ` (35.45) Lakhs as at March 31, 2016 and as at April 1, 2015 respectively and increase in net profit by ` 62.51 Lakhs as at March 31, 2016.

Annual Report 2016-17 157
Notes forming part of Consolidated Financial Statements for the year ended March 31, 2017
Statutory reports 30-89
Financial statements 90-188
Company overview 01-29
5 Property, Plant and Equipment (` in Lakhs)
Particulars Land Buildings Plant & Equipment
Furniture & Fixtures Vehicles Office
Equipments Computers Total
Gross Carrying AmountBalance as at 01-04-2015 5,592.76 5,269.02 10,403.33 453.93 1,379.30 106.32 141.48 23,346.13 Additions 39.05 2,284.04 4,208.75 32.61 181.86 15.52 24.33 6,786.16 Deletions - - 53.13 0.37 40.60 2.07 2.96 99.13 Balance as at 31-03-2016 5,631.81 7,553.05 14,558.96 486.17 1,520.55 119.77 162.86 30,033.17 Additions - 1,645.74 1,005.92 71.21 91.84 30.32 59.53 2,904.55 Deletions - - - - 246.49 6.31 10.78 263.58 Balance as at 31-03-2017 5,631.81 9,198.79 15,564.88 557.38 1,365.90 143.78 211.60 32,674.14 Accumulated Depreciation/Amortisation
Balance as at 01-04-2015 - 1,475.79 4,613.61 207.16 818.27 74.71 119.71 7,309.24 Additions - 476.69 1,903.39 68.74 228.13 17.84 19.47 2,714.26 Deletions - - 41.65 0.35 32.19 1.97 2.81 78.96 Balance as at 31-03-2016 - 1,952.49 6,475.35 275.55 1,014.21 90.58 136.37 9,944.54 Additions - 637.71 2,077.48 65.91 176.29 20.26 26.79 3,004.44 Deletions - - - - 215.35 5.80 10.14 231.29 Balance as at 31-03-2017 - 2,590.20 8,552.83 341.46 975.15 105.04 153.01 12,717.69 Net Carrying AmountBalance as at 01-04-2015 5,592.76 3,793.22 5,789.73 246.77 561.03 31.61 21.77 16,036.89 Balance as at 31-03-2016 5,631.81 5,600.56 8,083.60 210.62 506.34 29.20 26.49 20,088.62 Balance as at 31-03-2017 5,631.81 6,608.59 7,012.05 215.92 390.75 38.74 58.59 19,956.44
6 Capital work-in-progress (` in Lakhs)
Particulars Land Buildings Plant & Equipment
Furniture & Fixtures Vehicles Office
Equipments Computers Total
Carrying AmountBalance as at 01-04-2015 - 2,001.50 4,161.80 2.20 - - - 6,165.50 Additions - 1,675.20 447.36 31.41 - - 0.28 2,154.25 Deletions - 2,307.46 4,023.64 18.56 - - - 6,349.66 Balance as at 31-03-2016 - 1,369.24 585.53 15.05 - - 0.28 1,970.10 Additions - 3,537.92 212.59 38.32 - - 2.06 3,790.89 Deletions - 1,657.85 785.77 47.16 - - 2.34 2,493.12 Balance as at 31-03-2017 - 3,249.31 12.35 6.21 - - - 3,267.87
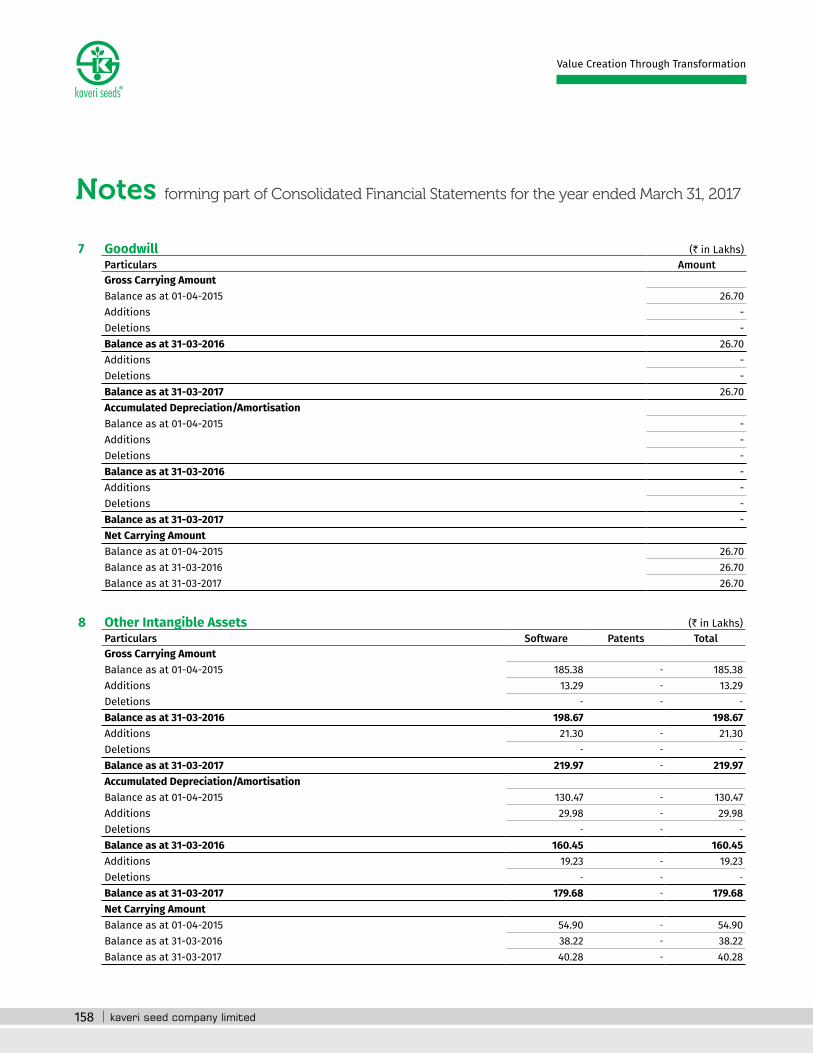
158
Notes forming part of Consolidated Financial Statements for the year ended March 31, 2017
Value Creation Through Transformation
7 Goodwill (` in Lakhs) Particulars AmountGross Carrying AmountBalance as at 01-04-2015 26.70 Additions -
Deletions -
Balance as at 31-03-2016 26.70 Additions -
Deletions -
Balance as at 31-03-2017 26.70 Accumulated Depreciation/AmortisationBalance as at 01-04-2015 -
Additions -
Deletions -
Balance as at 31-03-2016 -
Additions -
Deletions -
Balance as at 31-03-2017 -
Net Carrying AmountBalance as at 01-04-2015 26.70 Balance as at 31-03-2016 26.70 Balance as at 31-03-2017 26.70
8 Other Intangible Assets (` in Lakhs) Particulars Software Patents TotalGross Carrying AmountBalance as at 01-04-2015 185.38 - 185.38 Additions 13.29 - 13.29 Deletions - - -
Balance as at 31-03-2016 198.67 198.67 Additions 21.30 - 21.30 Deletions - - -
Balance as at 31-03-2017 219.97 - 219.97 Accumulated Depreciation/AmortisationBalance as at 01-04-2015 130.47 - 130.47 Additions 29.98 - 29.98 Deletions - - -
Balance as at 31-03-2016 160.45 160.45 Additions 19.23 - 19.23 Deletions - - -
Balance as at 31-03-2017 179.68 - 179.68 Net Carrying AmountBalance as at 01-04-2015 54.90 - 54.90 Balance as at 31-03-2016 38.22 - 38.22 Balance as at 31-03-2017 40.28 - 40.28

Annual Report 2016-17 159
Notes forming part of Consolidated Financial Statements for the year ended March 31, 2017
Statutory reports 30-89
Financial statements 90-188
Company overview 01-29
9 InTangible assets under development (` in Lakhs) Particulars Software Patents TotalCarrying AmountBalance as at 01-04-2015 - - -
Additions - - -
Deletions - - -
Balance as at 31-03-2016 - - -
Additions 129.40 - 129.40 Deletions - - -
Balance as at 31-03-2017 129.40 - 129.40
10 Investments (` in Lakhs)
Particulars As at March 31,2017
As at March 31,2016
As at April 01,2015
Non Current Investments Equity Investments of Associates 0.54 0.54 0.55 Equity Investments - Others 115.99 70.27 48.33 Investment in Government Securities 0.37 0.37 0.37 Investment in Real Estate Portfolio Management Fund 125.00 - -
Investments in Chit Funds - - 47.00
241.90 71.18 96.25 Current Investments
Liquid Mutual Fund Units 9,872.42 8,309.23 8,098.33 Fixed Maturity Plan Mutual Fund Units 7,058.78 3,729.03 1,101.81 Non convertible Debentures - 1,090.48 2,575.82 Other Debt Mutual Fund Units 49,636.61 38,079.55 18,803.77
66,567.81 51,208.29 30,579.74 Less: Provision for Tax on OCI 1,120.53 641.78
65,447.28 50,566.51 30,579.74
(` in Lakhs)
Particulars As at
March 31,2017 As at
March 31,2016 As at
April 01,2015 Qty Nos Amount Qty Nos Amount Qty Nos Amount
Non Current InvestmentsUNQUOTED
Equity Investments of Associates(Investments Carried at Fair Value through Other Comprehensive Income)Equity Shares of ` 100 each in Swarna Bharat Biotechnics Pvt Ltd - fully paid up
3,600 0.54 3,600 0.54 3,600 0.55
Equity Shares of ` 10 each in Swadeshi Biotechnics Ltd -fully paid up
700 - 700 - 700 -
0.54 0.54 0.55 Investment in Government Securities(Investments Carried at Cost)National Savings Certificates 2 0.37 2 0.37 2 0.37
0.37 0.37 0.37
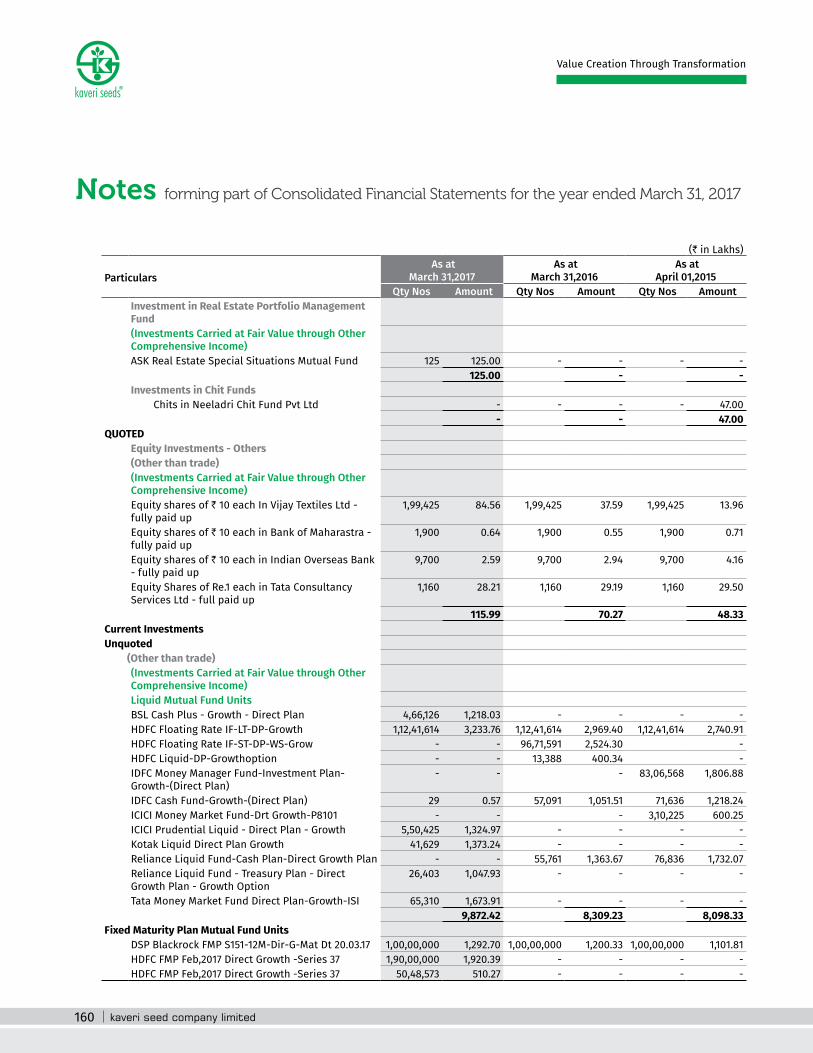
160
Notes forming part of Consolidated Financial Statements for the year ended March 31, 2017
Value Creation Through Transformation
(` in Lakhs)
Particulars As at
March 31,2017 As at
March 31,2016 As at
April 01,2015 Qty Nos Amount Qty Nos Amount Qty Nos Amount
Investment in Real Estate Portfolio Management Fund(Investments Carried at Fair Value through Other Comprehensive Income)ASK Real Estate Special Situations Mutual Fund 125 125.00 - - - -
125.00 - -
Investments in Chit Funds Chits in Neeladri Chit Fund Pvt Ltd - - - - 47.00
- - 47.00 QUOTED
Equity Investments - Others(Other than trade)(Investments Carried at Fair Value through Other Comprehensive Income)Equity shares of ` 10 each In Vijay Textiles Ltd - fully paid up
1,99,425 84.56 1,99,425 37.59 1,99,425 13.96
Equity shares of ` 10 each in Bank of Maharastra - fully paid up
1,900 0.64 1,900 0.55 1,900 0.71
Equity shares of ` 10 each in Indian Overseas Bank - fully paid up
9,700 2.59 9,700 2.94 9,700 4.16
Equity Shares of Re.1 each in Tata Consultancy Services Ltd - full paid up
1,160 28.21 1,160 29.19 1,160 29.50
115.99 70.27 48.33 Current InvestmentsUnquoted (Other than trade) (Investments Carried at Fair Value through Other
Comprehensive Income) Liquid Mutual Fund Units
BSL Cash Plus - Growth - Direct Plan 4,66,126 1,218.03 - - - -
HDFC Floating Rate IF-LT-DP-Growth 1,12,41,614 3,233.76 1,12,41,614 2,969.40 1,12,41,614 2,740.91 HDFC Floating Rate IF-ST-DP-WS-Grow - - 96,71,591 2,524.30 -
HDFC Liquid-DP-Growthoption - - 13,388 400.34 -
IDFC Money Manager Fund-Investment Plan-Growth-(Direct Plan)
- - - 83,06,568 1,806.88
IDFC Cash Fund-Growth-(Direct Plan) 29 0.57 57,091 1,051.51 71,636 1,218.24 ICICI Money Market Fund-Drt Growth-P8101 - - - 3,10,225 600.25 ICICI Prudential Liquid - Direct Plan - Growth 5,50,425 1,324.97 - - - -
Kotak Liquid Direct Plan Growth 41,629 1,373.24 - - - -
Reliance Liquid Fund-Cash Plan-Direct Growth Plan - - 55,761 1,363.67 76,836 1,732.07 Reliance Liquid Fund - Treasury Plan - Direct Growth Plan - Growth Option
26,403 1,047.93 - - - -
Tata Money Market Fund Direct Plan-Growth-ISI 65,310 1,673.91 - - - -
9,872.42 8,309.23 8,098.33 Fixed Maturity Plan Mutual Fund Units
DSP Blackrock FMP S151-12M-Dir-G-Mat Dt 20.03.17 1,00,00,000 1,292.70 1,00,00,000 1,200.33 1,00,00,000 1,101.81 HDFC FMP Feb,2017 Direct Growth -Series 37 1,90,00,000 1,920.39 - - - -
HDFC FMP Feb,2017 Direct Growth -Series 37 50,48,573 510.27 - - - -
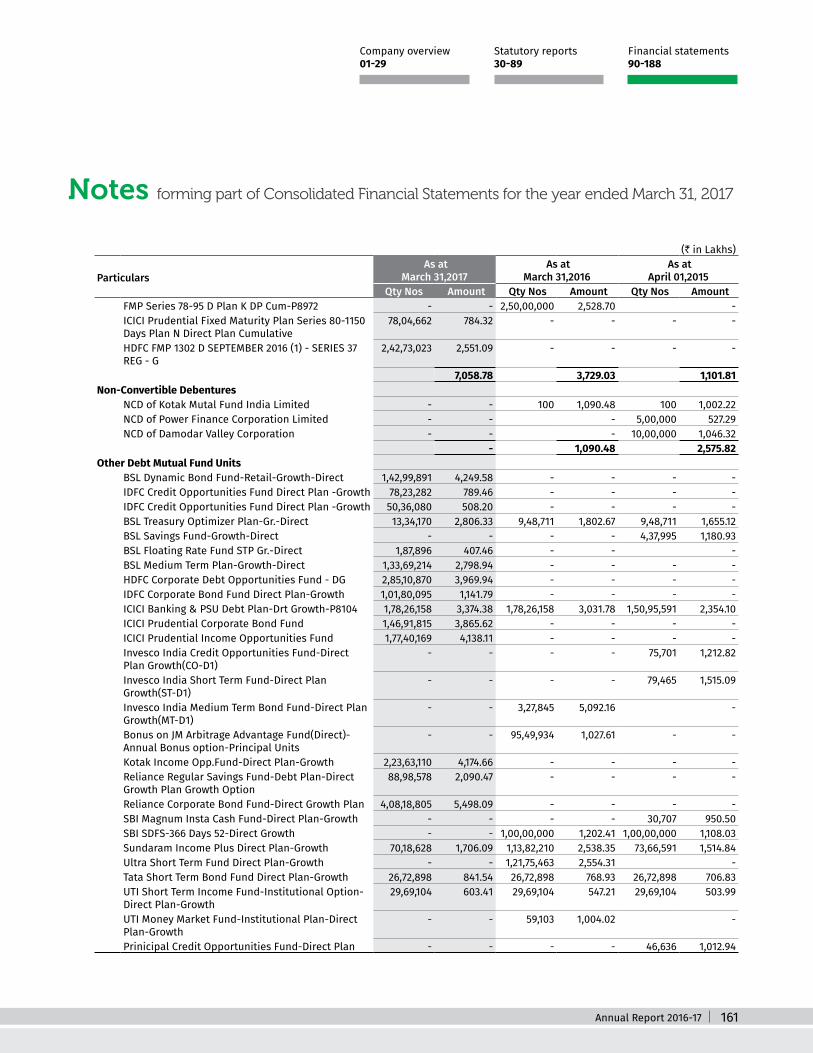
Annual Report 2016-17 161
Notes forming part of Consolidated Financial Statements for the year ended March 31, 2017
Statutory reports 30-89
Financial statements 90-188
Company overview 01-29
(` in Lakhs)
Particulars As at
March 31,2017 As at
March 31,2016 As at
April 01,2015 Qty Nos Amount Qty Nos Amount Qty Nos Amount
FMP Series 78-95 D Plan K DP Cum-P8972 - - 2,50,00,000 2,528.70 -
ICICI Prudential Fixed Maturity Plan Series 80-1150 Days Plan N Direct Plan Cumulative
78,04,662 784.32 - - - -
HDFC FMP 1302 D SEPTEMBER 2016 (1) - SERIES 37 REG - G
2,42,73,023 2,551.09 - - - -
7,058.78 3,729.03 1,101.81 Non-Convertible Debentures
NCD of Kotak Mutal Fund India Limited - - 100 1,090.48 100 1,002.22 NCD of Power Finance Corporation Limited - - - 5,00,000 527.29 NCD of Damodar Valley Corporation - - - 10,00,000 1,046.32
- 1,090.48 2,575.82 Other Debt Mutual Fund Units
BSL Dynamic Bond Fund-Retail-Growth-Direct 1,42,99,891 4,249.58 - - - -
IDFC Credit Opportunities Fund Direct Plan -Growth 78,23,282 789.46 - - - -
IDFC Credit Opportunities Fund Direct Plan -Growth 50,36,080 508.20 - - - -
BSL Treasury Optimizer Plan-Gr.-Direct 13,34,170 2,806.33 9,48,711 1,802.67 9,48,711 1,655.12 BSL Savings Fund-Growth-Direct - - - - 4,37,995 1,180.93 BSL Floating Rate Fund STP Gr.-Direct 1,87,896 407.46 - - -
BSL Medium Term Plan-Growth-Direct 1,33,69,214 2,798.94 - - - -
HDFC Corporate Debt Opportunities Fund - DG 2,85,10,870 3,969.94 - - - -
IDFC Corporate Bond Fund Direct Plan-Growth 1,01,80,095 1,141.79 - - - -
ICICI Banking & PSU Debt Plan-Drt Growth-P8104 1,78,26,158 3,374.38 1,78,26,158 3,031.78 1,50,95,591 2,354.10 ICICI Prudential Corporate Bond Fund 1,46,91,815 3,865.62 - - - -
ICICI Prudential Income Opportunities Fund 1,77,40,169 4,138.11 - - - -
Invesco India Credit Opportunities Fund-Direct Plan Growth(CO-D1)
- - - - 75,701 1,212.82
Invesco India Short Term Fund-Direct Plan Growth(ST-D1)
- - - - 79,465 1,515.09
Invesco India Medium Term Bond Fund-Direct Plan Growth(MT-D1)
- - 3,27,845 5,092.16 -
Bonus on JM Arbitrage Advantage Fund(Direct)-Annual Bonus option-Principal Units
- - 95,49,934 1,027.61 - -
Kotak Income Opp.Fund-Direct Plan-Growth 2,23,63,110 4,174.66 - - - -
Reliance Regular Savings Fund-Debt Plan-Direct Growth Plan Growth Option
88,98,578 2,090.47 - - - -
Reliance Corporate Bond Fund-Direct Growth Plan 4,08,18,805 5,498.09 - - - -
SBI Magnum Insta Cash Fund-Direct Plan-Growth - - - - 30,707 950.50 SBI SDFS-366 Days 52-Direct Growth - - 1,00,00,000 1,202.41 1,00,00,000 1,108.03 Sundaram Income Plus Direct Plan-Growth 70,18,628 1,706.09 1,13,82,210 2,538.35 73,66,591 1,514.84 Ultra Short Term Fund Direct Plan-Growth - - 1,21,75,463 2,554.31 -
Tata Short Term Bond Fund Direct Plan-Growth 26,72,898 841.54 26,72,898 768.93 26,72,898 706.83 UTI Short Term Income Fund-Institutional Option-Direct Plan-Growth
29,69,104 603.41 29,69,104 547.21 29,69,104 503.99
UTI Money Market Fund-Institutional Plan-Direct Plan-Growth
- - 59,103 1,004.02 -
Prinicipal Credit Opportunities Fund-Direct Plan - - - - 46,636 1,012.94
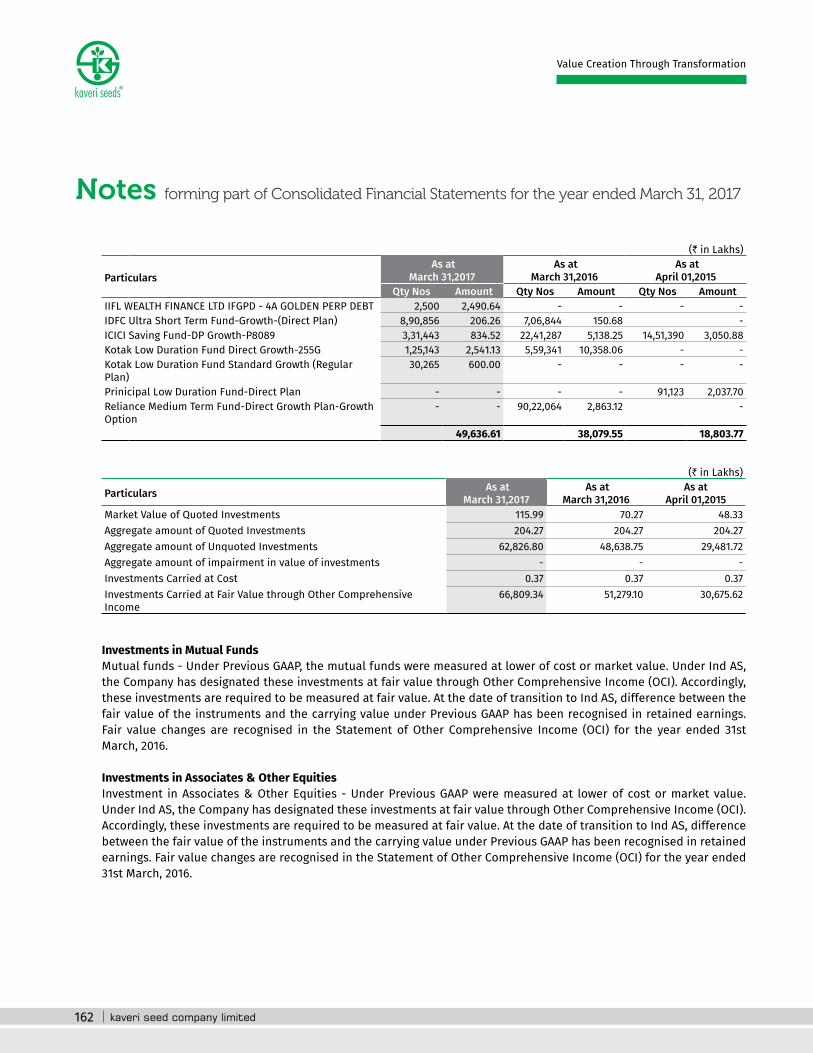
162
Notes forming part of Consolidated Financial Statements for the year ended March 31, 2017
Value Creation Through Transformation
(` in Lakhs)
Particulars As at
March 31,2017 As at
March 31,2016 As at
April 01,2015 Qty Nos Amount Qty Nos Amount Qty Nos Amount
IIFL WEALTH FINANCE LTD IFGPD - 4A GOLDEN PERP DEBT 2,500 2,490.64 - - - -
IDFC Ultra Short Term Fund-Growth-(Direct Plan) 8,90,856 206.26 7,06,844 150.68 -
ICICI Saving Fund-DP Growth-P8089 3,31,443 834.52 22,41,287 5,138.25 14,51,390 3,050.88 Kotak Low Duration Fund Direct Growth-255G 1,25,143 2,541.13 5,59,341 10,358.06 - -
Kotak Low Duration Fund Standard Growth (Regular Plan)
30,265 600.00 - - - -
Prinicipal Low Duration Fund-Direct Plan - - - - 91,123 2,037.70 Reliance Medium Term Fund-Direct Growth Plan-Growth Option
- - 90,22,064 2,863.12 -
49,636.61 38,079.55 18,803.77
(` in Lakhs)
Particulars As at March 31,2017
As at March 31,2016
As at April 01,2015
Market Value of Quoted Investments 115.99 70.27 48.33 Aggregate amount of Quoted Investments 204.27 204.27 204.27 Aggregate amount of Unquoted Investments 62,826.80 48,638.75 29,481.72 Aggregate amount of impairment in value of investments - - -
Investments Carried at Cost 0.37 0.37 0.37 Investments Carried at Fair Value through Other Comprehensive Income
66,809.34 51,279.10 30,675.62
Investments in Mutual Funds Mutual funds - Under Previous GAAP, the mutual funds were measured at lower of cost or market value. Under Ind AS,
the Company has designated these investments at fair value through Other Comprehensive Income (OCI). Accordingly, these investments are required to be measured at fair value. At the date of transition to Ind AS, difference between the fair value of the instruments and the carrying value under Previous GAAP has been recognised in retained earnings. Fair value changes are recognised in the Statement of Other Comprehensive Income (OCI) for the year ended 31st March, 2016.
Investments in Associates & Other Equities Investment in Associates & Other Equities - Under Previous GAAP were measured at lower of cost or market value.
Under Ind AS, the Company has designated these investments at fair value through Other Comprehensive Income (OCI). Accordingly, these investments are required to be measured at fair value. At the date of transition to Ind AS, difference between the fair value of the instruments and the carrying value under Previous GAAP has been recognised in retained earnings. Fair value changes are recognised in the Statement of Other Comprehensive Income (OCI) for the year ended 31st March, 2016.

Annual Report 2016-17 163
Notes forming part of Consolidated Financial Statements for the year ended March 31, 2017
Statutory reports 30-89
Financial statements 90-188
Company overview 01-29
11 Other Financial Assets (Non - Current) (` in Lakhs)
Particulars As at March 31,2017
As at March 31,2016
As at April 01,2015
Unsecured and considered good Advance paid to ASK Real Estate Fund 375.00 - -
375.00 - -
500.00Lakhs paid to M/s. ASK Real Estate Fund, out of this 125 units of ASK Real Estate Special Situation Mutual Fund has been allotted for ` 125.00Lakhs. The balance amount of ` 375.00 Lakhs was kept as advance for further allottment of Real Estate Fund units.
12 Deferred tax assets (net) (` in Lakhs)
Particulars As at March 31,2017
As at March 31,2016
As at April 01,2015
Defered Tax Liability on account of differences in depreciationas per tax books and financial books. 21.87 15.64 -
Deferred tax asset arising on account of timing differences relating to:
Provision for Bad and doubtful trade receivables 44.36 14.89 -
Employee Benefits 16.77 1.26 -
83.00 31.79 -
13 Other non-current assets (` in Lakhs)
Particulars As at March 31,2017
As at March 31,2016
As at April 01,2015
Unsecured and considered good Security deposits 158.53 153.08 109.30 Advances for Capital Expenses 131.31 218.65 134.12 Others advances - - 10.41
289.84 371.74 253.83
14 Inventories (at lower of cost or net realisable value) (` in Lakhs)
Particulars As at March 31,2017
As at March 31,2016
As at April 01,2015
Raw Materials 4,593.73 4,507.12 4,623.64 Work in Process 3,983.09 5,001.47 8,636.17 Finished Goods 36,204.73 40,936.28 36,175.10
44,781.55 50,444.87 49,434.92
15 Biological Asset (at lower of cost or net realisable value) (` in Lakhs)
Particulars As at March 31,2017
As at March 31,2016
As at April 01,2015
Standing Crop 5,556.82 1,674.17 4,877.61 5,556.82 1,674.17 4,877.61
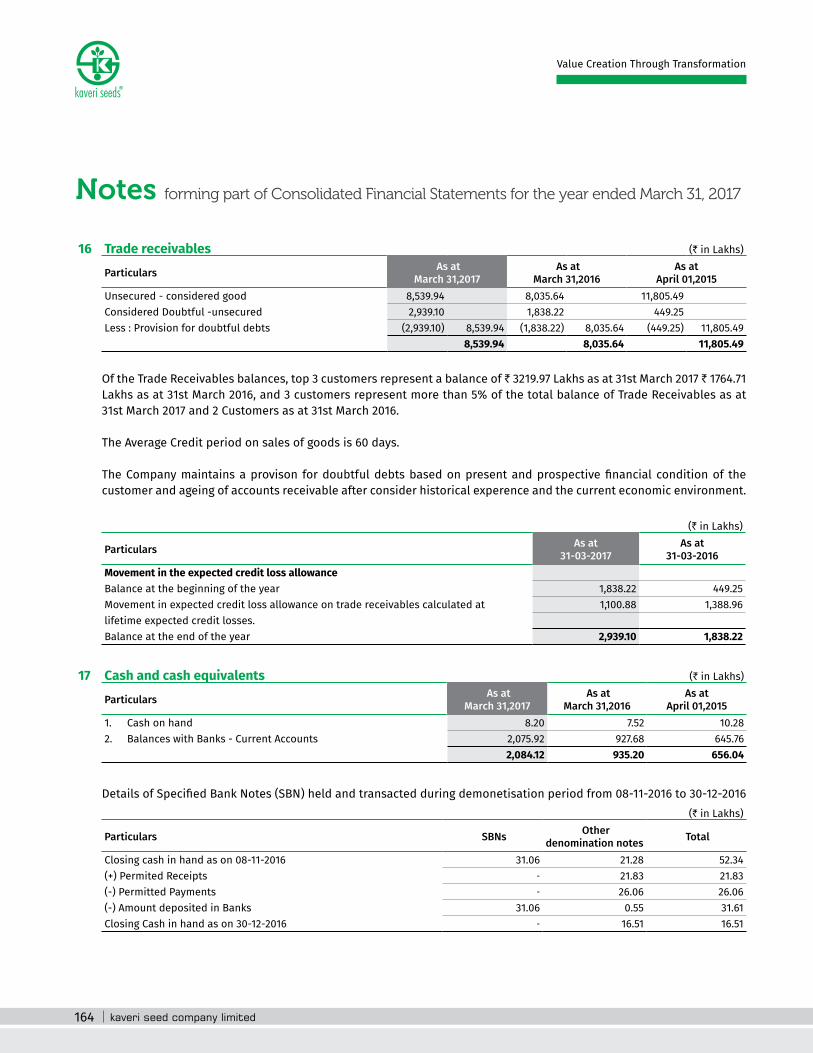
164
Notes forming part of Consolidated Financial Statements for the year ended March 31, 2017
Value Creation Through Transformation
16 Trade receivables (` in Lakhs)
Particulars As at March 31,2017
As at March 31,2016
As at April 01,2015
Unsecured - considered good 8,539.94 8,035.64 11,805.49 Considered Doubtful -unsecured 2,939.10 1,838.22 449.25 Less : Provision for doubtful debts (2,939.10) 8,539.94 (1,838.22) 8,035.64 (449.25) 11,805.49
8,539.94 8,035.64 11,805.49
Of the Trade Receivables balances, top 3 customers represent a balance of ` 3219.97 Lakhs as at 31st March 2017 ` 1764.71 Lakhs as at 31st March 2016, and 3 customers represent more than 5% of the total balance of Trade Receivables as at 31st March 2017 and 2 Customers as at 31st March 2016.
The Average Credit period on sales of goods is 60 days.
The Company maintains a provison for doubtful debts based on present and prospective financial condition of the customer and ageing of accounts receivable after consider historical experence and the current economic environment.
(` in Lakhs)
Particulars As at 31-03-2017
As at 31-03-2016
Movement in the expected credit loss allowanceBalance at the beginning of the year 1,838.22 449.25 Movement in expected credit loss allowance on trade receivables calculated at 1,100.88 1,388.96 lifetime expected credit losses.Balance at the end of the year 2,939.10 1,838.22
17 Cash and cash equivalents (` in Lakhs)
Particulars As at March 31,2017
As at March 31,2016
As at April 01,2015
1. Cash on hand 8.20 7.52 10.28 2. Balances with Banks - Current Accounts 2,075.92 927.68 645.76
2,084.12 935.20 656.04
Details of Specified Bank Notes (SBN) held and transacted during demonetisation period from 08-11-2016 to 30-12-2016 (` in Lakhs)
Particulars SBNs Other denomination notes Total
Closing cash in hand as on 08-11-2016 31.06 21.28 52.34 (+) Permited Receipts - 21.83 21.83 (-) Permitted Payments - 26.06 26.06 (-) Amount deposited in Banks 31.06 0.55 31.61 Closing Cash in hand as on 30-12-2016 - 16.51 16.51

Annual Report 2016-17 165
Notes forming part of Consolidated Financial Statements for the year ended March 31, 2017
Statutory reports 30-89
Financial statements 90-188
Company overview 01-29
Threre are no Repatriation restricutions with regard to cash and cash equivalents as at the end of the reporting period and prior periods.
Explanation : For the purposes of this clause, the term ‘Specified Bank Notes’ shall have the same meaning provided in the notification of the Government of India, in the Ministry of Finance, Department of Economic Affairs number S.O. 3407(E), dated the 8th November, 2016.
18 Bank balances other than above (` in Lakhs)
Particulars As at March 31,2017
As at March 31,2016
As at April 01,2015
i Fixed deposits with original maturity more than 3 months but less than 12 months
- - -
ii Earmarked balances with banks - Deposit Accounts 12.49 13.67 -
Total 12.49 13.67 -
Deposit in Earmarked balance with banks represents bank balance in unclaimed dividend accounts.
19 Current Tax Assets (Net) (` in Lakhs)
Particulars As at March 31,2017
As at March 31,2016
As at April 01,2015
Unsecured Considered Good Income Tax Refund Due 397.61 - -
397.61 - -
Tax Refund includes ` 375.59 Lakhs of earlier years and ` 22.02 Lakhs of current year.
20 Other current assets (` in Lakhs)
Particulars As at March 31,2017
As at March 31,2016
As at April 01,2015
(Unsecured and considered good)Advance to suppliers 1,293.54 1,091.88 1,116.60 Advance to Staff 70.32 68.33 100.92 Prepaid expenses 75.37 576.02 1,296.83 Others 16.55 62.15 611.93 Gratuity Advance 90.46 - -
1,546.24 1,798.38 3,126.29

166
Notes forming part of Consolidated Financial Statements for the year ended March 31, 2017
Value Creation Through Transformation
21 Equity Share Capital (` in Lakhs)
Particulars As at March 31,2017
As at March 31,2016
As at April 01,2015
SHARE CAPITAL Authorised 10,00,00,000 (10,00,00,000) Equtity shares of ` 2/-(` 2/-) each 2,000.00 2,000.00 2,000.00 Issued,Subscribed & Paid up 6,90,55,095(6,90,55,095) Equtity shares of ` 2/-(` 2/-) each
fully paid up 1,381.10 1,381.10 1,377.92
1,381.10 1,381.10 1,377.92
a) Reconcilation of number of Share Equity Shares
(` in Lakhs)
Particulars As at March 31,2017 As at March 31,2016 As at April 01,2015
No of shares (`) No of shares (`) No of shares (`)At the beginning of the year 6,90,55,095 1,381.10 6,88,96,195 1,377.92 6,88,96,195 1,377.92 Add: Issued during the year - - 1,58,900 3.18 -
Less: Shares Cancelled during the year - - - - -
At the end of the year 6,90,55,095 1,381.10 6,90,55,095 1,381.10 6,88,96,195 1,377.92
b) Details of Shareholders holding more than 5% shares in the company (` in Lakhs)
Particulars As at March 31,2017 As at March 31,2016 As at April 01,2015
No of shares (`) No of shares (`) No of shares (`)G Vanaja Devi 1,57,75,050 22.84% 1,57,75,050 22.84% 1,52,70,448 22.16% G V Bhaskar Rao - HUF 1,12,40,645 16.28% 1,12,40,645 16.28% 1,12,40,645 16.32% G V Bhaskar Rao 60,31,990 8.74% 60,31,990 8.74% 60,31,990 8.76% Ashoka PTE Limited 47,90,301 6.94% - -
IDFC Premier Equity Fund - - 22,77,235 3.31% Small Cap World Fund, INC - - 41,30,970 6.00%
Rights, preferences and restrictions attached to equity shares The Company has only one class of shares referred to as equity shares having a par value of ` 2 per share. Each
shareholder is eligible for one vote per share held and carry a right to dividend. The dividend proposed by the Board of Directors is subject to the approval of the shareholders in the ensuing Annual General Meeting, except in case of interim dividend. In the event of liquidation, the equity shareholders are eligible to receive the remaining assets of the Company after distribution of all preferential amounts, in proportion to their shareholding.
Share options granted under the Company’s employee share option plan Share options granted under the Company’s Employee Share option plan carry no rights to dividends and no voting
rights. Further details of the Employee Share option plan are provided.
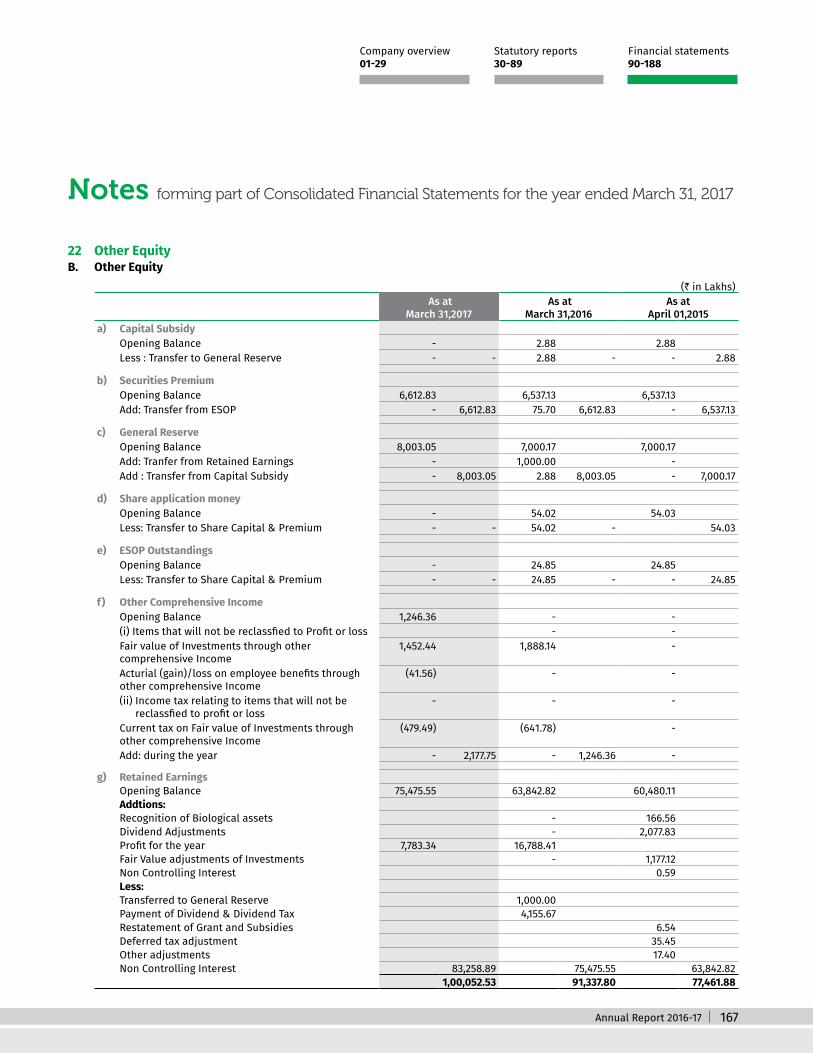
Annual Report 2016-17 167
Notes forming part of Consolidated Financial Statements for the year ended March 31, 2017
Statutory reports 30-89
Financial statements 90-188
Company overview 01-29
22 Other EquityB. Other Equity
(` in Lakhs) As at
March 31,2017 As at
March 31,2016 As at
April 01,2015 a) Capital Subsidy Opening Balance - 2.88 2.88 Less : Transfer to General Reserve - - 2.88 - - 2.88
b) Securities Premium Opening Balance 6,612.83 6,537.13 6,537.13 Add: Transfer from ESOP - 6,612.83 75.70 6,612.83 - 6,537.13
c) General Reserve Opening Balance 8,003.05 7,000.17 7,000.17 Add: Tranfer from Retained Earnings - 1,000.00 -
Add : Transfer from Capital Subsidy - 8,003.05 2.88 8,003.05 - 7,000.17
d) Share application money Opening Balance - 54.02 54.03 Less: Transfer to Share Capital & Premium - - 54.02 - 54.03
e) ESOP Outstandings Opening Balance - 24.85 24.85 Less: Transfer to Share Capital & Premium - - 24.85 - - 24.85
f) Other Comprehensive Income Opening Balance 1,246.36 - - (i) Items that will not be reclassfied to Profit or loss - -
Fair value of Investments through other comprehensive Income
1,452.44 1,888.14 -
Acturial (gain)/loss on employee benefits through other comprehensive Income
(41.56) - -
(ii) Income tax relating to items that will not be reclassfied to profit or loss
- - -
Current tax on Fair value of Investments through other comprehensive Income
(479.49) (641.78) -
Add: during the year - 2,177.75 - 1,246.36 -
g) Retained Earnings Opening Balance 75,475.55 63,842.82 60,480.11 Addtions: Recognition of Biological assets - 166.56 Dividend Adjustments - 2,077.83 Profit for the year 7,783.34 16,788.41 Fair Value adjustments of Investments - 1,177.12 Non Controlling Interest 0.59 Less: Transferred to General Reserve 1,000.00 Payment of Dividend & Dividend Tax 4,155.67 Restatement of Grant and Subsidies 6.54 Deferred tax adjustment 35.45 Other adjustments 17.40 Non Controlling Interest 83,258.89 75,475.55 63,842.82
1,00,052.53 91,337.80 77,461.88

168
Notes forming part of Consolidated Financial Statements for the year ended March 31, 2017
Value Creation Through Transformation
General Reserve: The Company has transferred a portion of the net profit of the Company before declaring dividend to general reserve pursuant to the earlier provisions of Companies Act 1956. Mandatory transfer to general reserve is not required under the Companies Act 2013.
Securities Premium Reserve: The amount received in excess of face value of the equity shares is recognised in Securities Premium Reserve. In case of equity-settled share based payment transactions, the difference between fair value on grant date and nominal value of share is accounted as securities premium reserve.
Employee Stock Options Outstanding Account: The fair value of the equity-settled share based payment transactions with employees is recognised in Statement of Profit and Loss with corresponding credit to Employee Stock Options Outstanding Account.
Retained Earnings: Retained earnings are the profits that the Company has earned till date, less any transfers to general reserve, dividends or other distributions paid to shareholders.
Other Comprehensive Income: The fair value change of the investments measured at fair value through other comprehensive income recognised through Other Comprehensive Income. Upon derecognition, the cumulative fair value changes on the said investments are reclassified to the Statement of Profit and Loss. Accumulated gain or loss on employee benifits also recognised through other comprehensive income.
23 Non Controlling Interest (` in Lakhs)
Particulars As at 31.03.2017
As at 31.03.2017
As at 31.03.2015
At the beginning of the year (19.75) 21.48 22.07 Add: Issued during the year (54.39) (41.23) (0.59)At the end of the year (74.13) (19.75) 21.48
Details of non-wholly owned subsidiaries that have material non-controlling interests
The table below shows details of non-wholly owned subsidiaries of the Group that have material non-controlling interests :
Name of Subsidiary principal place of business
Proportion of ownership interests and voting rights held by non-
controlling interests as At 31.03.2017
Accumulated non-controlling interests
as At 31.03.2017Aditya Agritech Private Limited Secunderabad 70 57.07 Genome Agritech Private Limited Secunderabad 51 (131.20)
Summarised financial information in respect of each of the subsidary that has material non-controlling interests is set out below. The summarised financial information below represents amounts before intragroup eliminations.
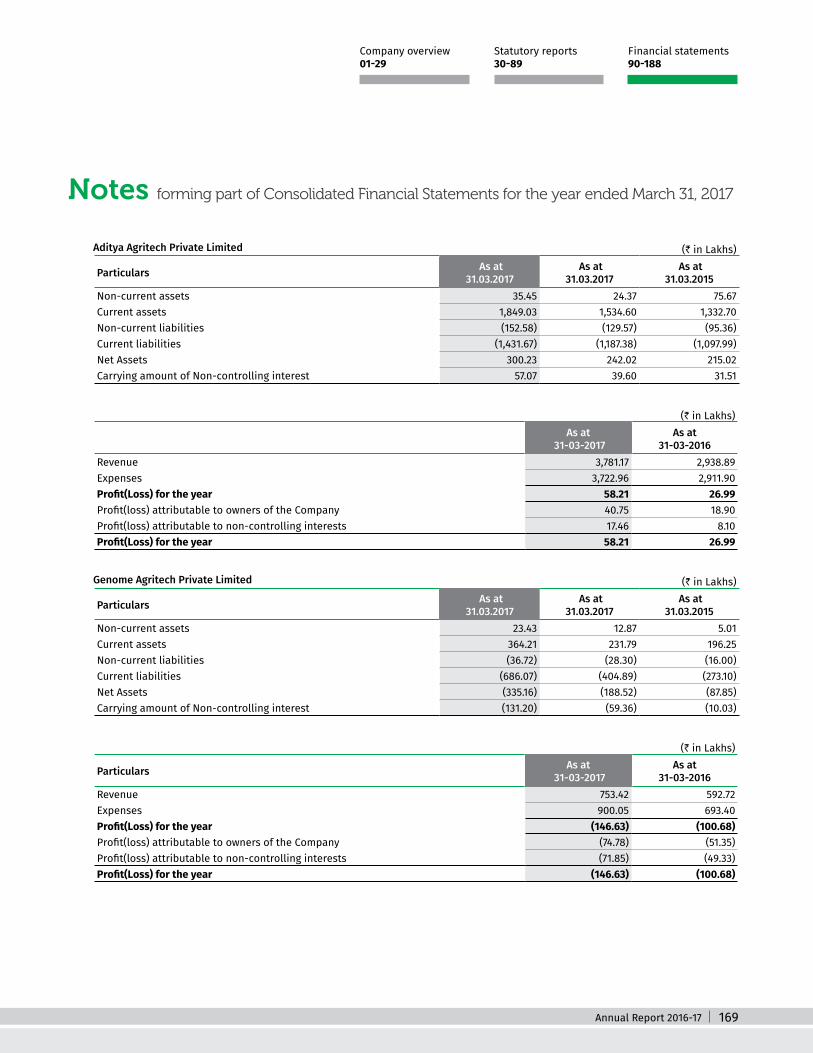
Annual Report 2016-17 169
Notes forming part of Consolidated Financial Statements for the year ended March 31, 2017
Statutory reports 30-89
Financial statements 90-188
Company overview 01-29
Aditya Agritech Private Limited (` in Lakhs)
Particulars As at 31.03.2017
As at 31.03.2017
As at 31.03.2015
Non-current assets 35.45 24.37 75.67 Current assets 1,849.03 1,534.60 1,332.70 Non-current liabilities (152.58) (129.57) (95.36)Current liabilities (1,431.67) (1,187.38) (1,097.99)Net Assets 300.23 242.02 215.02 Carrying amount of Non-controlling interest 57.07 39.60 31.51
(` in Lakhs) As at
31-03-2017As at
31-03-2016Revenue 3,781.17 2,938.89 Expenses 3,722.96 2,911.90 Profit(Loss) for the year 58.21 26.99 Profit(loss) attributable to owners of the Company 40.75 18.90 Profit(loss) attributable to non-controlling interests 17.46 8.10 Profit(Loss) for the year 58.21 26.99
Genome Agritech Private Limited (` in Lakhs)
Particulars As at 31.03.2017
As at 31.03.2017
As at 31.03.2015
Non-current assets 23.43 12.87 5.01 Current assets 364.21 231.79 196.25 Non-current liabilities (36.72) (28.30) (16.00)Current liabilities (686.07) (404.89) (273.10)Net Assets (335.16) (188.52) (87.85)Carrying amount of Non-controlling interest (131.20) (59.36) (10.03)
(` in Lakhs)
Particulars As at 31-03-2017
As at 31-03-2016
Revenue 753.42 592.72 Expenses 900.05 693.40 Profit(Loss) for the year (146.63) (100.68)Profit(loss) attributable to owners of the Company (74.78) (51.35)Profit(loss) attributable to non-controlling interests (71.85) (49.33)Profit(Loss) for the year (146.63) (100.68)
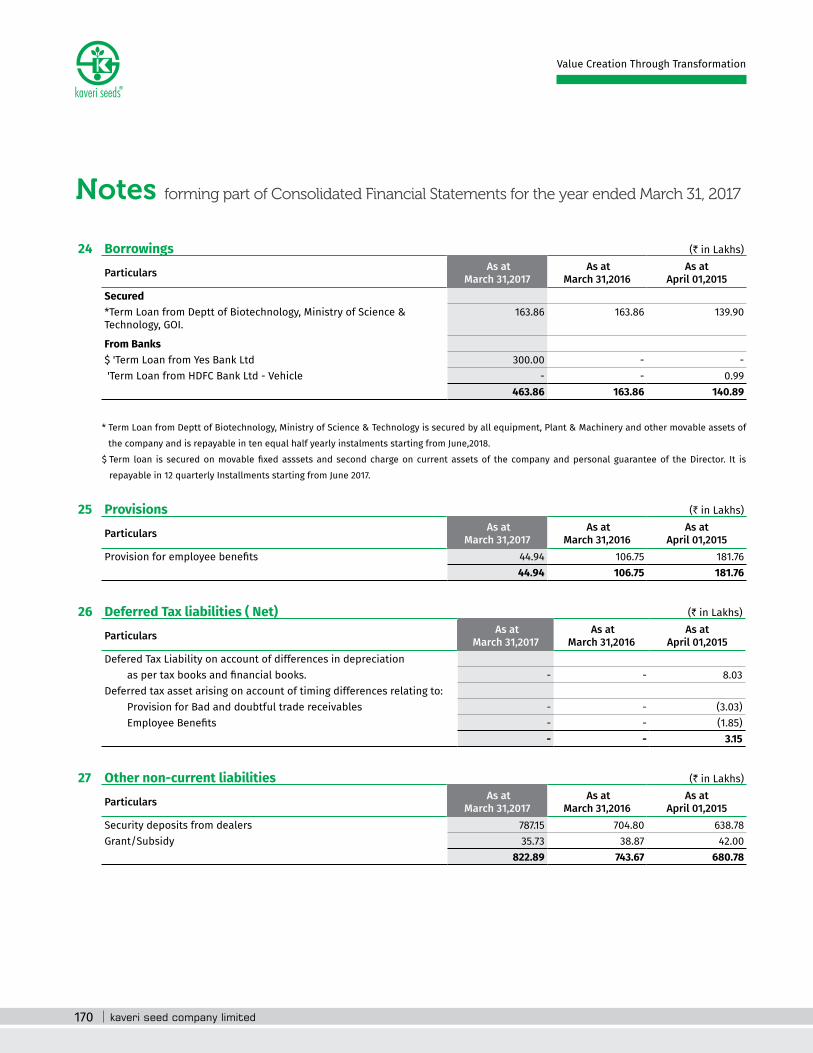
170
Notes forming part of Consolidated Financial Statements for the year ended March 31, 2017
Value Creation Through Transformation
24 Borrowings (` in Lakhs)
Particulars As at March 31,2017
As at March 31,2016
As at April 01,2015
Secured*Term Loan from Deptt of Biotechnology, Ministry of Science & Technology, GOI.
163.86 163.86 139.90
From Banks$ 'Term Loan from Yes Bank Ltd 300.00 - -
'Term Loan from HDFC Bank Ltd - Vehicle - - 0.99 463.86 163.86 140.89
* Term Loan from Deptt of Biotechnology, Ministry of Science & Technology is secured by all equipment, Plant & Machinery and other movable assets of the company and is repayable in ten equal half yearly instalments starting from June,2018.
$ Term loan is secured on movable fixed asssets and second charge on current assets of the company and personal guarantee of the Director. It is repayable in 12 quarterly Installments starting from June 2017.
25 Provisions (` in Lakhs)
Particulars As at March 31,2017
As at March 31,2016
As at April 01,2015
Provision for employee benefits 44.94 106.75 181.76 44.94 106.75 181.76
26 Deferred Tax liabilities ( Net) (` in Lakhs)
Particulars As at March 31,2017
As at March 31,2016
As at April 01,2015
Defered Tax Liability on account of differences in depreciation as per tax books and financial books. - - 8.03 Deferred tax asset arising on account of timing differences relating to: Provision for Bad and doubtful trade receivables - - (3.03) Employee Benefits - - (1.85)
- - 3.15
27 Other non-current liabilities (` in Lakhs)
Particulars As at March 31,2017
As at March 31,2016
As at April 01,2015
Security deposits from dealers 787.15 704.80 638.78 Grant/Subsidy 35.73 38.87 42.00
822.89 743.67 680.78
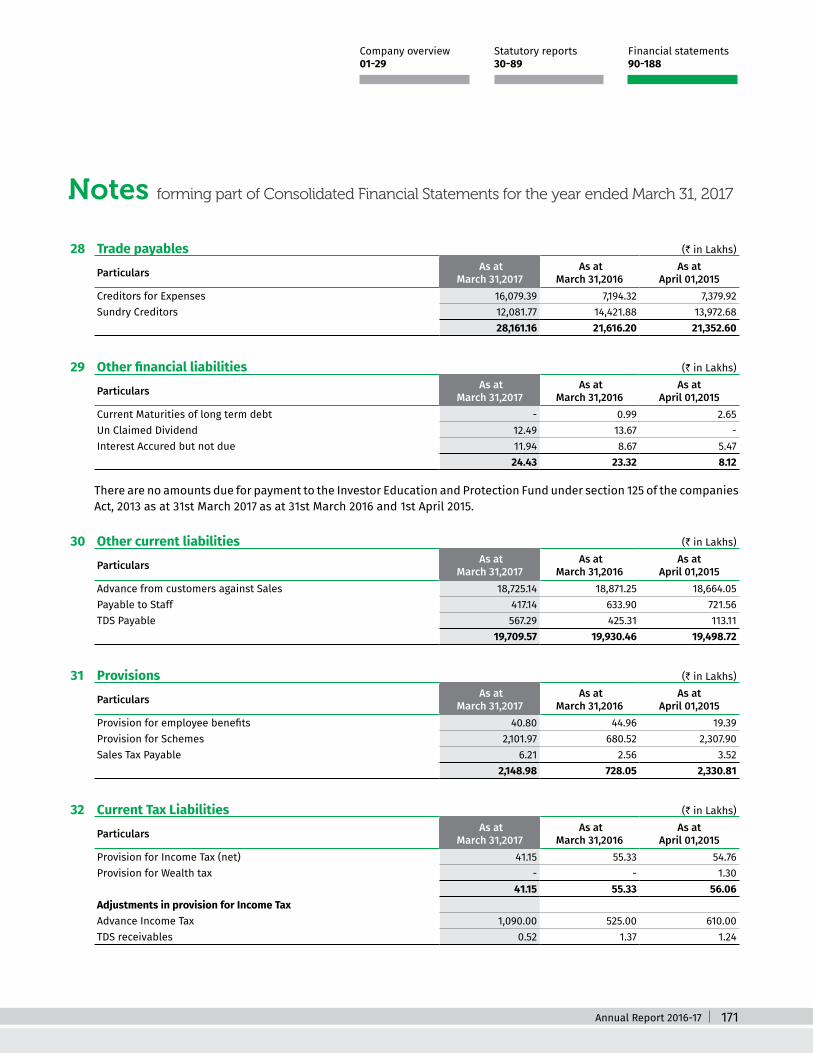
Annual Report 2016-17 171
Notes forming part of Consolidated Financial Statements for the year ended March 31, 2017
Statutory reports 30-89
Financial statements 90-188
Company overview 01-29
28 Trade payables (` in Lakhs)
Particulars As at March 31,2017
As at March 31,2016
As at April 01,2015
Creditors for Expenses 16,079.39 7,194.32 7,379.92 Sundry Creditors 12,081.77 14,421.88 13,972.68
28,161.16 21,616.20 21,352.60
29 Other financial liabilities (` in Lakhs)
Particulars As at March 31,2017
As at March 31,2016
As at April 01,2015
Current Maturities of long term debt - 0.99 2.65 Un Claimed Dividend 12.49 13.67 -
Interest Accured but not due 11.94 8.67 5.47 24.43 23.32 8.12
There are no amounts due for payment to the Investor Education and Protection Fund under section 125 of the companies Act, 2013 as at 31st March 2017 as at 31st March 2016 and 1st April 2015.
30 Other current liabilities (` in Lakhs)
Particulars As at March 31,2017
As at March 31,2016
As at April 01,2015
Advance from customers against Sales 18,725.14 18,871.25 18,664.05 Payable to Staff 417.14 633.90 721.56 TDS Payable 567.29 425.31 113.11
19,709.57 19,930.46 19,498.72
31 Provisions (` in Lakhs)
Particulars As at March 31,2017
As at March 31,2016
As at April 01,2015
Provision for employee benefits 40.80 44.96 19.39 Provision for Schemes 2,101.97 680.52 2,307.90 Sales Tax Payable 6.21 2.56 3.52
2,148.98 728.05 2,330.81
32 Current Tax Liabilities (` in Lakhs)
Particulars As at March 31,2017
As at March 31,2016
As at April 01,2015
Provision for Income Tax (net) 41.15 55.33 54.76 Provision for Wealth tax - - 1.30
41.15 55.33 56.06 Adjustments in provision for Income TaxAdvance Income Tax 1,090.00 525.00 610.00 TDS receivables 0.52 1.37 1.24
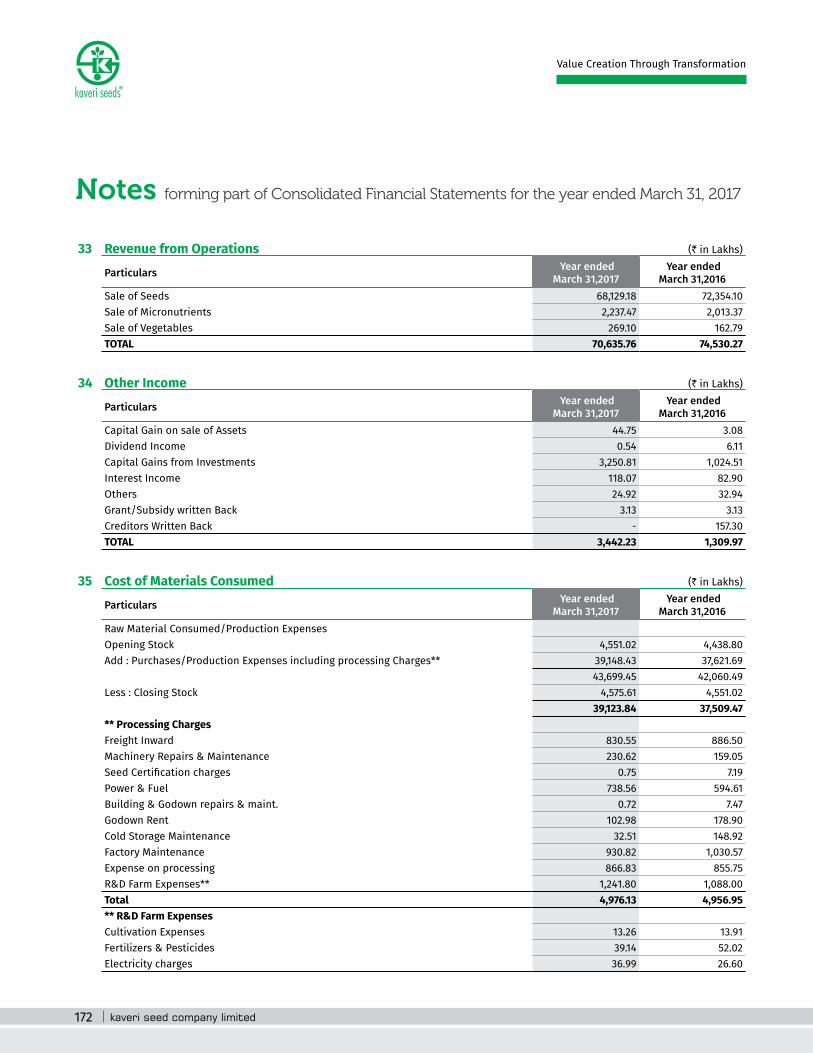
172
Notes forming part of Consolidated Financial Statements for the year ended March 31, 2017
Value Creation Through Transformation
33 Revenue from Operations (` in Lakhs)
Particulars Year ended March 31,2017
Year ended March 31,2016
Sale of Seeds 68,129.18 72,354.10 Sale of Micronutrients 2,237.47 2,013.37 Sale of Vegetables 269.10 162.79 TOTAL 70,635.76 74,530.27
34 Other Income (` in Lakhs)
Particulars Year ended March 31,2017
Year ended March 31,2016
Capital Gain on sale of Assets 44.75 3.08 Dividend Income 0.54 6.11 Capital Gains from Investments 3,250.81 1,024.51 Interest Income 118.07 82.90 Others 24.92 32.94 Grant/Subsidy written Back 3.13 3.13 Creditors Written Back - 157.30 TOTAL 3,442.23 1,309.97
35 Cost of Materials Consumed (` in Lakhs)
Particulars Year ended March 31,2017
Year ended March 31,2016
Raw Material Consumed/Production ExpensesOpening Stock 4,551.02 4,438.80 Add : Purchases/Production Expenses including processing Charges** 39,148.43 37,621.69
43,699.45 42,060.49 Less : Closing Stock 4,575.61 4,551.02
39,123.84 37,509.47 ** Processing ChargesFreight Inward 830.55 886.50 Machinery Repairs & Maintenance 230.62 159.05 Seed Certification charges 0.75 7.19 Power & Fuel 738.56 594.61 Building & Godown repairs & maint. 0.72 7.47 Godown Rent 102.98 178.90 Cold Storage Maintenance 32.51 148.92 Factory Maintenance 930.82 1,030.57 Expense on processing 866.83 855.75 R&D Farm Expenses** 1,241.80 1,088.00 Total 4,976.13 4,956.95 ** R&D Farm Expenses Cultivation Expenses 13.26 13.91 Fertilizers & Pesticides 39.14 52.02 Electricity charges 36.99 26.60

Annual Report 2016-17 173
Notes forming part of Consolidated Financial Statements for the year ended March 31, 2017
Statutory reports 30-89
Financial statements 90-188
Company overview 01-29
35 Cost of Materials Consumed (` in Lakhs)
Particulars Year ended March 31,2017
Year ended March 31,2016
Electrical items & motor repairing charges 2.54 2.33 Farm Maintenance 52.94 61.59 Labour charges 172.34 164.65 Postage & telephones 2.52 1.06 Printing & Stationery 13.15 3.36 Security charges 43.79 43.69 Staff Welfare 2.97 2.58 Travelling expenses 4.46 1.22 Vehicle Maintenance 23.15 19.73 Land Lease 126.62 126.26 Research Expenses 114.71 8.65 Testing Expenses 109.11 121.46 Professional Expenses 52.08 52.67 Salaries - Farm 432.03 386.21
1,241.80 1,088.00
36 Changes in Inventories of Finished Goods and Work in Progress (` in Lakhs)
Particulars As at March 31,2017
As at March 31,2016
(Increase)/Decrease in Finished goods Opening Stock 41,365.47 36,710.02 Closing Stock 36,730.97 4,634.50 41,365.47 (4,655.45)(Increase)/Decrease in Work in Process Opening Stock 4,528.39 8,287.98 Closing Stock 3,474.75 1,053.63 4,528.39 3,759.60 (Increase)/Decrease in Biological Assets Opening Stock 1,674.17 4,875.73 Closing Stock 5,556.82 (3,882.65) 1,674.17 3,201.55
1,805.48 2,305.70
37 Employee Benefit Expenses (` in Lakhs)
Particulars As at March 31,2017
As at March 31,2016
Salaries to Staff 3,687.54 3,567.35 Contribution to Provident and other funds 230.50 200.41 Staff Welfare Expenses 72.94 57.55
3,990.98 3,825.32
(Contd.)

174
Notes forming part of Consolidated Financial Statements for the year ended March 31, 2017
Value Creation Through Transformation
38 Financial Costs (` in Lakhs)
Particulars As at March 31,2017
As at March 31,2016
Interest Expenses 11.04 3.59 Loss on Chits - 2.85 Bank Charges 13.10 17.44
24.14 23.89
39 Depreciation and Amortisation Expense (` in Lakhs)
Particulars As at March 31,2017
As at March 31,2016
Depreciation of property, plant and equipment 3,004.44 2,714.26 Depreciation of intangible assets 19.23 29.98 Total Depreciation and amortisation expense 3,023.67 2,744.24
40 Other Expenses (` in Lakhs)
Particulars As at March 31,2017
As at March 31,2016
ESTABLISHMENT EXPENSESTravelling Expenses 1,092.44 1,108.32 Postage & Telephone 127.93 133.16 Payment to Auditors (Refer Note: 41) 15.72 13.29 Vehicle Maintenance 56.30 51.04 Rent 47.70 51.42 Printing & Stationery 50.05 51.26 Insurance 92.42 93.91 Books & Periodicals 0.93 1.35 Rates & Taxes 96.26 219.37 Office Maintenance 65.66 59.48 General Expenses 77.00 78.38 Conveyance 2.01 2.63 Donations & Subscriptions 19.53 54.58 Legal Expenses 156.29 111.56 Professional Charges 286.14 144.47 Professional Tax 0.33 0.33 Sales Tax 0.64 - CSR Expenditure (Refer Note:42) 839.94 219.82 Market Cess 28.67 32.53 Security Charges 128.84 137.74 Service Tax 189.50 172.55 Computer Maintenance 21.40 25.15 Directors Sitting Fees 7.20 5.20 Foreign Exchange Loss 15.48 18.00 (a) Total 3,418.37 2,785.56

Annual Report 2016-17 175
Notes forming part of Consolidated Financial Statements for the year ended March 31, 2017
Statutory reports 30-89
Financial statements 90-188
Company overview 01-29
40 Other Expenses (` in Lakhs)
Particulars As at March 31,2017
As at March 31,2016
SELLING & DISTRIBUTION EXPSales promotion expenses 1,815.25 1,840.88 Advertisement 306.71 277.08 Freight & Forwarding 1,506.33 1,538.02 Farmers Meeting Expenses 268.15 257.66 Staff & Dealers Meeting Expenses 166.67 178.38 Royalty 2,666.23 3,809.14 Bad debts Write Off 375.53 20.24Provision for Bad Debts 1,100.88 1,388.96(b) Total 8,205.73 9,310.35 Total of (a) & (b) 11,624.10 12,095.91
41 Audit Fees (` in Lakhs)
Particulars As at March 31,2017
As at March 31,2016
a) For statutory audit 9.69 8.59 b) For taxation matters 3.89 1.83 c) For other services 1.85 2.19 d) For reimbursement of expenses 0.29 0.68
15.72 13.29
42 Expenditure incurred for corporate social responsibilty The Group spent ` 839.94 Lakhs and ` 219.82 Lakhs towards CSR Expenditure for the year ended 31st March 2017 and 31st
March 2016. The details of expenditure upto 31-03-2017 are as follows. (` in Lakhs)
Particulars of CSR Activity 2016-17 2015-16 2014-15Amount unspent at the Starting of the year 393.24 174.90 -
CSR Expenditure Spendable for the year 447.46 438.16 276.05 Total Amount to be spent for the year 840.70 613.06 276.05 Direct Expenses made by companyEducation development activities
53.72 154.65 83.00 Construction of School Buildings, Providing Furniture to Schools, Providing Books and Bags to Students and Scholarships to Students in Karimnagar District.
Rural development activities 11.22 65.17 18.15
Conservation of Water Resources, Providing Street Lights, Providing Cycle Rikshaw for Cleaning of Garbage in Karminagar and Siddipet Districts. Contribution made to Kaveri Bhaskar Rao Charitable Foundation 775.00 - -
Total Amount Spent during the year 839.94 219.82 101.15 Unspent amount at the End of the year 0.76 393.24 174.90
(Contd.)
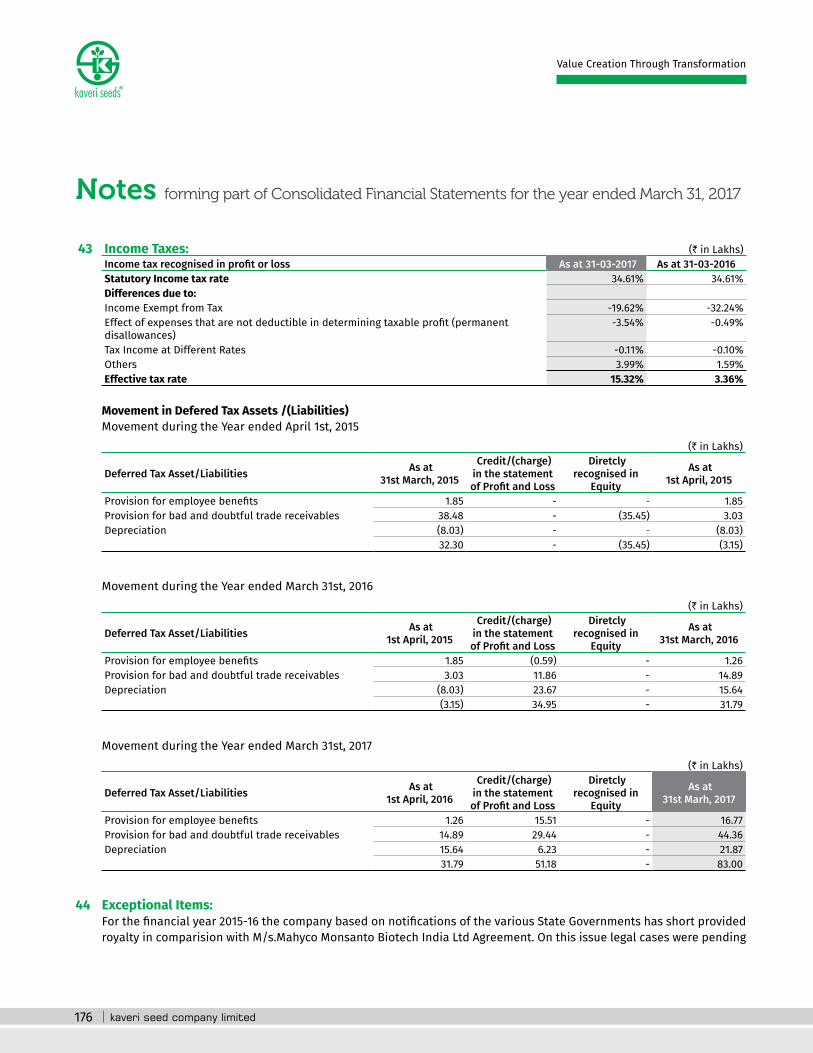
176
Notes forming part of Consolidated Financial Statements for the year ended March 31, 2017
Value Creation Through Transformation
43 Income Taxes: (` in Lakhs) Income tax recognised in profit or loss As at 31-03-2017 As at 31-03-2016Statutory Income tax rate 34.61% 34.61%Differences due to:Income Exempt from Tax -19.62% -32.24%Effect of expenses that are not deductible in determining taxable profit (permanent disallowances)
-3.54% -0.49%
Tax Income at Different Rates -0.11% -0.10%Others 3.99% 1.59%Effective tax rate 15.32% 3.36%
Movement in Defered Tax Assets /(Liabilities) Movement during the Year ended April 1st, 2015
(` in Lakhs)
Deferred Tax Asset/Liabilities As at 31st March, 2015
Credit/(charge) in the statement of Profit and Loss
Diretcly recognised in
Equity
As at 1st April, 2015
Provision for employee benefits 1.85 - - 1.85 Provision for bad and doubtful trade receivables 38.48 - (35.45) 3.03 Depreciation (8.03) - - (8.03)
32.30 - (35.45) (3.15)
Movement during the Year ended March 31st, 2016 (` in Lakhs)
Deferred Tax Asset/Liabilities As at 1st April, 2015
Credit/(charge) in the statement of Profit and Loss
Diretcly recognised in
Equity
As at 31st March, 2016
Provision for employee benefits 1.85 (0.59) - 1.26 Provision for bad and doubtful trade receivables 3.03 11.86 - 14.89 Depreciation (8.03) 23.67 - 15.64
(3.15) 34.95 - 31.79
Movement during the Year ended March 31st, 2017 (` in Lakhs)
Deferred Tax Asset/Liabilities As at 1st April, 2016
Credit/(charge) in the statement of Profit and Loss
Diretcly recognised in
Equity
As at 31st Marh, 2017
Provision for employee benefits 1.26 15.51 - 16.77 Provision for bad and doubtful trade receivables 14.89 29.44 - 44.36 Depreciation 15.64 6.23 - 21.87
31.79 51.18 - 83.00
44 Exceptional Items: For the financial year 2015-16 the company based on notifications of the various State Governments has short provided
royalty in comparision with M/s.Mahyco Monsanto Biotech India Ltd Agreement. On this issue legal cases were pending

Annual Report 2016-17 177
Notes forming part of Consolidated Financial Statements for the year ended March 31, 2017
Statutory reports 30-89
Financial statements 90-188
Company overview 01-29
for which the company has shown an amount of ` 6550.57 Lakhs as contingent liability for the year 2015-16. In the subsequent period these legal issues have been sorted out and setteled in arbitration. The settled amount of ` 5923.80 Lakhs is provided in accounts as exceptional item.
45 Capital Management: Equity share capital and other equity are considered for the purpose of Company’s capital management. The Company
manages its capital so as to safeguard its ability to continue as a going concern and to optimise returns to shareholders. The capital structure of the Company is based on management’s judgement of its strategic and day-to-day needs with a focus on total equity so as to maintain investor, creditors and market confidence. The management and the Board of Directors monitors the return on capital as well as the level of dividends to shareholders. The Company may take appropriate steps in order to maintain, or if necessary adjust, its capital structure.
46 Earning Per Equity Share : Earnings per Share has been computed as under
(` in Lakhs) Particulars As at 31-03-2017 As at 31-03-2016Profit for the Year 7,783.34 16,788.41 No.of Equity Shares outstanding 6,90,55,095 6,90,55,095 Earnings Per Share (Face Value of ` 2/- each) 11.27 24.31
47 Dividend on Equity Share Dividend on Equity Shares paid during the year
(` in Lakhs) Particulars As at 31-03-2017 As at 31-03-2016Final Dividend ` 0 Per share for FY 2015-16 (` 2.50/- per share 2014-15) - 1,726.38 Dividend Distribution Tax on Final Dividend - 351.45 Interim Dividend ` 0 Per share for FY 2016-17 (` 2.50/- per share 2015-16) - 1,726.38 Dividend Distribution Tax on Final Dividend - 351.45
- 4,155.67
48 FINANCIAL INSTRUMENTS Refer Note 2.13 for accounting policy on Financial Instruments.
A. ACCOUNTING CLASSIFICATIONS AND FAIR VALUES The carrying amounts and fair values of financial instruments by class are as follows:
(` in Lakhs)
ParticularsCarrying value /Fair value
As at 31st March , 2017
As at 31st March, 2016
As at 1st April, 2015
FINANCIAL ASSETSFinancial assets measured at fair valueInvestments measured ati). Fair value through other comprehensive income (Note:10) 66,809.34 51,279.10 30,675.62
66,809.34 51,279.10 30,628.63 FINANCIAL LIABILITIES
- - -
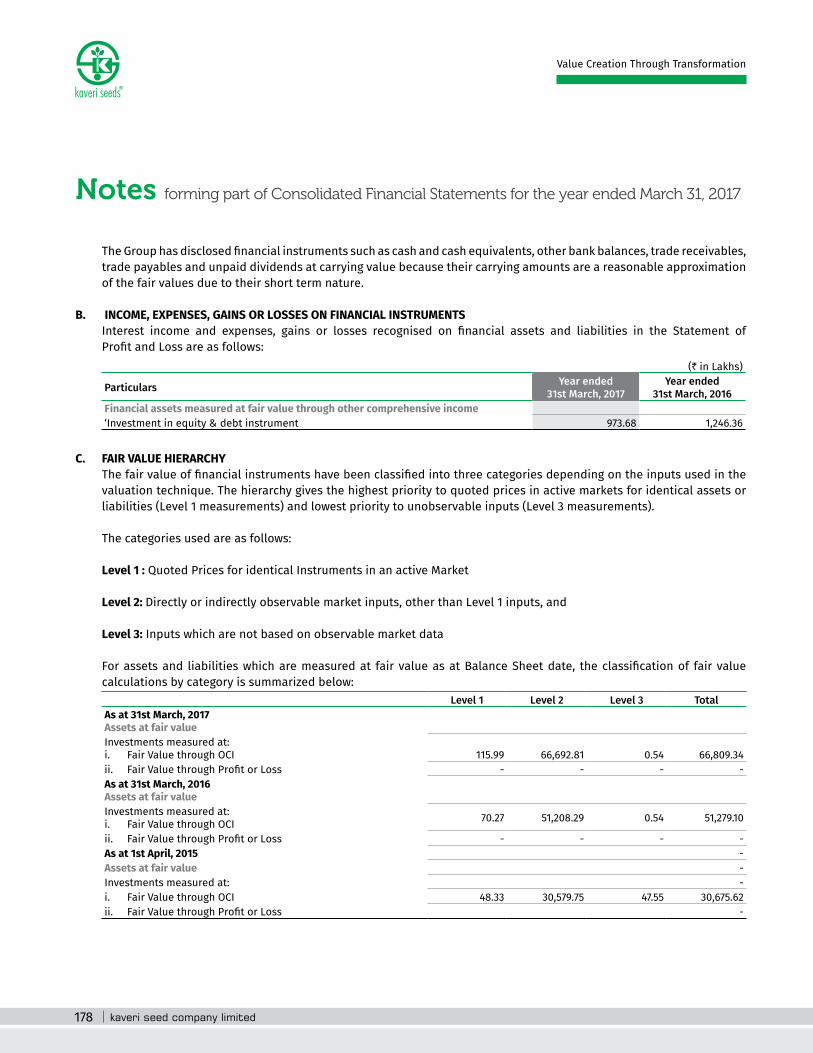
178
Notes forming part of Consolidated Financial Statements for the year ended March 31, 2017
Value Creation Through Transformation
The Group has disclosed financial instruments such as cash and cash equivalents, other bank balances, trade receivables, trade payables and unpaid dividends at carrying value because their carrying amounts are a reasonable approximation of the fair values due to their short term nature.
B. INCOME, EXPENSES, GAINS OR LOSSES ON FINANCIAL INSTRUMENTS Interest income and expenses, gains or losses recognised on financial assets and liabilities in the Statement of
Profit and Loss are as follows: (` in Lakhs)
Particulars Year ended 31st March, 2017
Year ended 31st March, 2016
Financial assets measured at fair value through other comprehensive income‘Investment in equity & debt instrument 973.68 1,246.36
C. FAIR VALUE HIERARCHY The fair value of financial instruments have been classified into three categories depending on the inputs used in the
valuation technique. The hierarchy gives the highest priority to quoted prices in active markets for identical assets or liabilities (Level 1 measurements) and lowest priority to unobservable inputs (Level 3 measurements).
The categories used are as follows:
Level 1 : Quoted Prices for identical Instruments in an active Market
Level 2: Directly or indirectly observable market inputs, other than Level 1 inputs, and
Level 3: Inputs which are not based on observable market data
For assets and liabilities which are measured at fair value as at Balance Sheet date, the classification of fair value calculations by category is summarized below:
Level 1 Level 2 Level 3 TotalAs at 31st March, 2017Assets at fair valueInvestments measured at: i. Fair Value through OCI 115.99 66,692.81 0.54 66,809.34 ii. Fair Value through Profit or Loss - - - -
As at 31st March, 2016 Assets at fair valueInvestments measured at: i. Fair Value through OCI 70.27 51,208.29 0.54 51,279.10
ii. Fair Value through Profit or Loss - - - -
As at 1st April, 2015 -
Assets at fair value -
Investments measured at: -
i. Fair Value through OCI 48.33 30,579.75 47.55 30,675.62 ii. Fair Value through Profit or Loss -

Annual Report 2016-17 179
Notes forming part of Consolidated Financial Statements for the year ended March 31, 2017
Statutory reports 30-89
Financial statements 90-188
Company overview 01-29
CALCULATION OF FAIR VALUES The fair values of the financial assets and liabilities
are defined as the price that would be received to sell an asset or paid to transfer a liability in an orderly transaction between market participants at the measurement date.
Financial assets and liabilities measured at fair value as at Balance Sheet date:
1. The fair values of investment quoted investment in equity shares is based on the current bid price of respective investment as at the Balance Sheet date.
2. The fair values of investments in mutual fund units is based on the net asset value (‘NAV’) as stated by the issuers of these mutual fund units in the published statements as at Balance Sheet date. NAV represents the price at which the issuer will issue further units of mutual fund and the price at which issuers will redeem such units from the investors.
Other financial assets and liabilities - Cash and cash equivalents (except for investments
in mutual funds), trade receivables, investments in term deposits, other financial assets (except derivative financial instruments), trade payables, and other financial liabilities (except derivative financial instruments) have fair values that approximate to their carrying amounts due to their short-term nature.
- Loans have fair values that approximate to their carrying amounts as it is based on the net present value of the anticipated future cash flows using rates currently available for debt on similar terms, credit risk and remaining maturities.
49 FINANCIAL RISK MANAGEMENT The Group’s business activities are exposed to a
variety of financial risks, namely liquidity risk, market
risks and credit risk. The Group’s senior management has the overall responsibility for establishing and governing the Group’s risk management framework. The Group’s risk management policies are established to identify and analyse the risks faced by the Group, to set and monitor appropriate risk limits and controls, periodically review the changes in market conditions and reflect the changes in the policy accordingly.
A. MANAGEMENT OF LIQUIDITY RISK Liquidity risk is the risk that the Group will face in
meeting its obligations associated with its financial liabilities. The Group’s approach in managing liquidity is to ensure that it will have sufficient funds to meet its liabilities when due without incurring unacceptable losses. In doing this, management considers both normal and stressed conditions.
The Group maintained a cautious liquidity strategy, with a positive cash balance throughout the year ended 31st March, 2017 and 31st March, 2016. Cash flow from operating activities provides the funds to service the financial liabilities on a day-to-day basis.
The Group regularly monitors the rolling forecasts to ensure it has sufficient cash on an on-going basis to meet operational needs. Any short term surplus cash generated, over and above the amount required for working capital management and other operational requirements, is retained as cash and cash equivalents (to the extent required) and any excess is invested in highly marketable debt investments with appropriate maturities to optimise the cash returns on investments while ensuring sufficient liquidity to meet its liabilities.
The following table shows the maturity analysis of the Group’s financial liabilities based on contractually agreed undiscounted cash flows along with its carrying value as at the Balance Sheet date.

180
Notes forming part of Consolidated Financial Statements for the year ended March 31, 2017
Value Creation Through Transformation
Undiscounted AmountCarrying amount
Payable within 1 year
More than 1 years
Total
As at 31st March, 2017Non-derivative liabilitiesTrade payables (including acceptances) 28,161.16 28,161.16 - 28,161.16 Borrowings 463.86 - 463.86 463.86 Unpaid dividend 12.49 12.49 - 12.49 Other Payables 11.94 11.94 - 11.94 As at 31st March, 2016Non-derivative liabilitiesTrade payables (including acceptances) 21,616.20 21,616.20 - 21,616.20 Borrowings 163.86 - 163.86 163.86 Unpaid dividend 13.67 13.67 - 13.67 Other Payables 9.66 9.66 - 9.66 As at 1st April, 2015Non-derivative liabilitiesTrade payables (including acceptances) 21,352.60 21,352.60 - 21,352.60 Borrowings 140.89 - 140.89 140.89 Unpaid dividend - - - -
Other Payables 8.12 8.12 - 8.12
B. MANAGEMENT OF MARKET RISK The Group’s size and operations result in it being
exposed to the following market risks that arise from its use of financial instruments:
CURRENCY RISK PRICE RISK INTEREST RATE RISK
The above risks may affect the Group’s income and expenses, or the value of its financial instruments. The Group’s exposure to and management of these risks are explained below.
1. CURRENCY RISK ‘POTENTIAL IMPACT OF RISK The impact of risk due to change in foreign currency
value is very minute on the Group as the Group’s exposure to foreign currency is very low.
As at 31st March, 2017, the net unhedged ‘exposure to the Group on holding financial ‘assets (trade receivables and capital advances) ‘and liabilities (trade payables
and capital ‘creditors) other than in their functional currency ‘amounted to ` 36.27 Lakhs payable (31st March, ‘2016 ` 16.56 Lakhs and 1st April, 2015 ` 100.85 Lakhs).
MANAGEMENT POLICY The Group is not majorly exposed to foreign currency
exchange risk because of its low volume foreign currency transactions, even though management exercises proper precautions to minute the currency risk in foreign exchange transactions. The Group deals with US Dollor and Euro for its foreign currency transactions.
The Group makes its exports mainly against advance irrevocable LC to mitigate the risk of currency exchange due to delay in remittances. The Group does not opt for forward exchange contracts. Foreign exchange transactions are closely monitored to reduce the risk.
The aim of the Group’s approach to ‘management of currency risk is to leave the ‘Group with no material residual risk.

Annual Report 2016-17 181
Notes forming part of Consolidated Financial Statements for the year ended March 31, 2017
Statutory reports 30-89
Financial statements 90-188
Company overview 01-29
SENSITIVITY TO RISK A 5% strengthening of the INR against key ‘currencies
to which the Group is exposed ‘(net of hedge) would have led to approximately ‘an additional ` 1.81 Lakhs gain in the Statement of ‘Profit and Loss (2015-16: ` 0.83 Lakhs gain). A 5% ‘weakening of the INR against these currencies ‘would have led to an equal but opposite effect.
2. PRICE RISK POTENTIAL IMPACT OF RISK The Group is exposed to the price risk due to its
investment in debt mutual funds. The price risk arises due to uncertainties about the future market values of these investments.
At 31st March 2017, the investments in debt mutual funds amounts to ` 62697.12 Lakhs (31st March, 2016 ` 48634.07 Lakhs and 1st April, 2015 ` 29430.05 Lakhs). These are exposed to price risk.
MANAGEMENT POLICY The Group takes all the precautions to minimise price
risk arising from investments in debt mutual funds. The Group is investing mainly in debt mutual funds through leading mutual fund companies and in best mutual funds where price risk is very low. The Group will examine fund performance, rating, liquidty and risk aspects before investing.
SENSITIVITY TO RISK A 0.5% increase in prices would have led to
approximately an additional ` 313.49 Lakhs gain in the Statement of Profit and Loss (2015-16 ` 243.17 Lakhs gain). A 0.5% decrease in prices would have led to an equal but opposite effect.
3. INTEREST RATE RISK POTENTIAL IMPACT OF RISK The impact of interest rate risk is very minute on
the Group as the Group does not have exposure to any interest rate sensitive investments or securities.
The Group does not have any investment in interest sensitive securities/bonds as on 31st march 2017, 2016 and 2015.
MANAGEMENT POLICY The Group makes maximum of the investments in non
interest sensitive sectors to mitigate interest rate risk.
SENSITIVITY TO RISK A 0.25% or .50% increase/decrease in interest rates will
not make any difference to the Group profit or loss as there are no interest rate sensitive investments.
C. MANAGEMENT OF CREDIT RISK Credit risk is the risk of financial loss to the Group if a
customer or counter-party fails to meet its contractual obligations.
Trade receivables Concentration of credit risk with respect to trade
receivables is moderate, due to the Group’s customer base being large and diverse and also Group receives good amount of receipts towards advances. All trade receivables are reviewed and assessed for default on a quarterly basis based on collections and ageing.
Our historical experience of collecting receivables is that credit risk is moderate. Hence, trade receivables are considered to be a single class of financial assets.
Other financial assets The Group maintains exposure in cash and cash
equivalents, term deposits with banks, investments in money market liquid mutual funds and derivative instrument with financial institutions. The Group has set counter-parties limits based on multiple factors including financial position, credit rating, etc.
The Group’s maximum exposure to credit risk as at 31st March, 2017, 2016 and 1st April, 2015 is the carrying value of each class of financial assets.

182
Notes forming part of Consolidated Financial Statements for the year ended March 31, 2017
Value Creation Through Transformation
50 Related Party Transactions50.1 Following is the list of related parties and their relationships
A. Key managerial persons and their relatives1 Mr. G.V.Bhaskar Rao2 Mrs. G. Vanaja Devi3 Mr. R. Venumanohar Rao4 Mr. C. Vamsheedhar5 Mr. C. Mithun Chand6 Mr. G.Pawan7 Mrs. G. Madhusree8 G.V.Bhaskar Rao - HUF9 C. Vamsheedhar - HUF10 R. Venumanohar Rao - HUF 11 Mr. T Venkateswarlu12 Mr. N Papa Rao13 Mr N Venkateswara RaoB. Other related firms11 M/s. Kaveri Infra
50.2 Related party transactions for the year ended 31 March 2017 are as follows: (` in Lakhs) 31-03-2017 31-03-2016
Remuneration paidMr. G.V.Bhaskar Rao 171.75 155.52 Mrs. G. Vanaja Devi 106.75 96.72 Mr. R. Venumanohar Rao - 74.98 Mr. C. Vamsheedhar 52.68 47.86 Mr. C. Mithun Chand 43.93 39.94 Mr. T Venkateswarlu 15.78 10.00 Mr. N Papa Rao 12.00 12.00 Mr N Venkateswara Rao 12.00 12.00
414.89 449.02 Land and godown lease paidMr. G.V.Bhaskar Rao 0.60 8.43 Mrs. G. Vanaja Devi 8.49 8.49 Mr. G.Pawan 12.31 12.31 Mrs. G. Madhusree 10.80 10.80 G.V.Bhaskar Rao - HUF 41.58 39.96 C. Vamsheedhar - HUF 4.48 4.48 R. Venumanohar Rao - HUF 4.52 4.52 M/s. Kaveri Infra 10.87 10.87

Annual Report 2016-17 183
Notes forming part of Consolidated Financial Statements for the year ended March 31, 2017
Statutory reports 30-89
Financial statements 90-188
Company overview 01-29
50.2 Related party transactions for the year ended 31 March 2017 are as follows: (` in Lakhs) 31-03-2017 31-03-2016
93.65 99.86 Dividend paidMr. G.V.Bhaskar Rao - 150.80 Mrs. G. Vanaja Devi - 381.76 Mr. R. Venumanohar Rao - 52.95
Mr. C. Vamsheedhar - 27.48 Mr. C. Mithun Chand - 23.22 Mr. G.Pawan - 62.73 Mrs. G. Madhusree - -
G.V.Bhaskar Rao - HUF - 281.02 - 979.96
51 Disclosures as required by the Micro, Small and Medium Enterprises Development Act, 2006 are as under: (` in Lakhs)
Particulars As at March 31,2017
As at March 31,2016
As at April 01,2015
Principle amount due to suppliers registered under the MSMED Act and Remaining unpaid as at year end
563.71
Interest due to supplies registered unde the MSMED Act and remaining unpaid as at year end
3.37
Principal amount paid to suppliers registered under the MSMED Act, beyond the appointed day during the year
169.00
Interest paid, other than under section 16 of MSMED Act, to suppliers registered under the MSMED Act, beyond the appointed day during the year.
-
Interest paid, under section 16 of MSMED Act, to suppliers registered under the MSMED Act, beyond the appointed day during the year.
3.37
Interest due and payable towards suppliers registered under MSMED Act, for payments already made
-
Further Interest remaining due and payable for earlier years -
The above information regarding Micro, Small and Medium Enterprises has been determined to the extent such parties have been identified on the basis of information available with the Company.
(Contd.)

184
Notes forming part of Consolidated Financial Statements for the year ended March 31, 2017
Value Creation Through Transformation
52 Commitments (` in Lakhs)
Particulars As at 31-03-2017
As at 31-03-2016
Estimated amount of contracts (net of advances) remaining to be executed on capital account and not provided for:
241.96 56.80
53 Contingent Liabilities (` in Lakhs)
Particulars As at 31-03-2017
As at 31-03-2016
Claims against the Company not acknowledged as debts. This comprises of 1,081.00 7,564.54 i. Tax demands disputed by the Company relating to disallowances / additions
of fiscal benefits, pending before various judicial forums and tax authorities, aggregating to
987.42 904.04
ii. Other matters not related to tax 10.75 10.75 iii. Royalty Payment for use of BT Cotton technology - 6,550.57 iv. Bank guarantees 82.83 99.18
54 Operating Leases The Company’s significant leasing arrangements are in respect of operating leases for lands and premises (residential,
office, stores, godown etc.). These leasing arrangements which are cancellable (other than those specified below), range between 11 months and 10 years generally, or longer, and are usually renewable by mutual consent on mutually agreeable terms. The aggregate lease rentals payable are charged as rent in the Statement of Profit and Loss.
The company does not have any non-cancellable agreements.
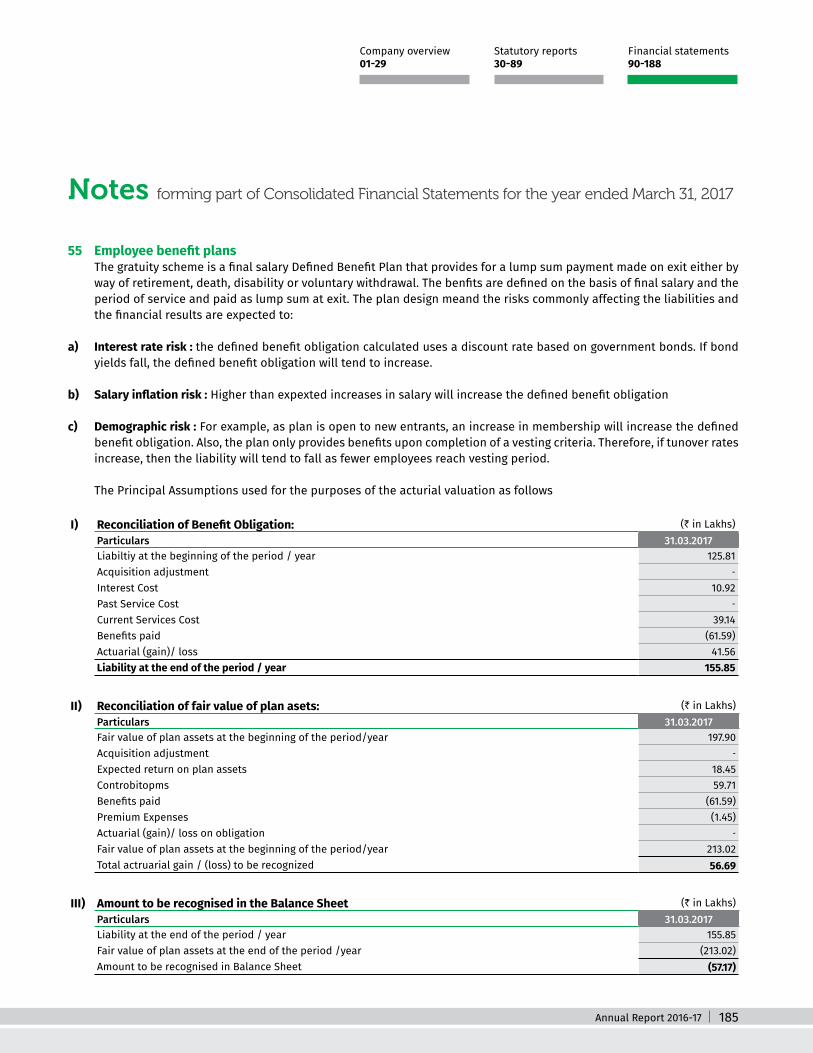
Annual Report 2016-17 185
Notes forming part of Consolidated Financial Statements for the year ended March 31, 2017
Statutory reports 30-89
Financial statements 90-188
Company overview 01-29
55 Employee benefit plans The gratuity scheme is a final salary Defined Benefit Plan that provides for a lump sum payment made on exit either by
way of retirement, death, disability or voluntary withdrawal. The benfits are defined on the basis of final salary and the period of service and paid as lump sum at exit. The plan design meand the risks commonly affecting the liabilities and the financial results are expected to:
a) Interest rate risk : the defined benefit obligation calculated uses a discount rate based on government bonds. If bond yields fall, the defined benefit obligation will tend to increase.
b) Salary inflation risk : Higher than expexted increases in salary will increase the defined benefit obligation
c) Demographic risk : For example, as plan is open to new entrants, an increase in membership will increase the defined benefit obligation. Also, the plan only provides benefits upon completion of a vesting criteria. Therefore, if tunover rates increase, then the liability will tend to fall as fewer employees reach vesting period.
The Principal Assumptions used for the purposes of the acturial valuation as follows
I) Reconciliation of Benefit Obligation: (` in Lakhs) Particulars 31.03.2017Liabiltiy at the beginning of the period / year 125.81 Acquisition adjustment -
Interest Cost 10.92 Past Service Cost -
Current Services Cost 39.14 Benefits paid (61.59)Actuarial (gain)/ loss 41.56 Liability at the end of the period / year 155.85
II) Reconciliation of fair value of plan asets: (` in Lakhs) Particulars 31.03.2017Fair value of plan assets at the beginning of the period/year 197.90 Acquisition adjustment -
Expected return on plan assets 18.45 Controbitopms 59.71 Benefits paid (61.59)Premium Expenses (1.45)Actuarial (gain)/ loss on obligation -
Fair value of plan assets at the beginning of the period/year 213.02 Total actruarial gain / (loss) to be recognized 56.69
III) Amount to be recognised in the Balance Sheet (` in Lakhs) Particulars 31.03.2017Liability at the end of the period / year 155.85 Fair value of plan assets at the end of the period /year (213.02)Amount to be recognised in Balance Sheet (57.17)

186
Notes forming part of Consolidated Financial Statements for the year ended March 31, 2017
Value Creation Through Transformation
IV) Expenses recognised in the Statement of Profit and Loss under the head employee benefit expense (` in Lakhs) Particulars 31.03.2017Current service cost 39.14 Past service cost -
Interest cost 10.92 Acquisition adjustement -
Premium Expenses 1.45 Expected return on plan assets (18.45)Net actuarial (gain)/loss recognized 41.56 Expenses recognized in Statement of Profit and Loss 74.63
V) Remeasurement for the period (` in Lakhs) Particulars 31.03.2017Experience (gain)/Loss on plan liabilities -
Demographic (gain)/loss on plan liabilities -
Financial (gain)/loss on plan assets 41.56 Experience (gain)/loss on plan assets -
Financial (gain)/loss on plan assets -
VI) Amount recognised in statement of other comprehensive income (OCI) (` in Lakhs) Particulars 31.03.2017Opening amount recognised in OCI -
Remeasurement for the period - Obligation (gain)/loss 41.56 Remeasurement for the period - plan assets (gain)/loss -
Total Remeasurement cost / (credit) for the period recognised in OCI 41.56 Closing amount recognised in OCI 41.56

Annual Report 2016-17 187
Notes forming part of Consolidated Financial Statements for the year ended March 31, 2017
Statutory reports 30-89
Financial statements 90-188
Company overview 01-29
56 Segment Information The Group has identified and reported three reportable segments viz., Seeds, Micronutrients and Vegetables based on
the nature of products and service, the differing risks and returns and the internal reporting systems. The accounting policies adopted for segment reporting are in line with the accounting policy of the Group.
Segment information is as follows: (` in Lakhs)
S. No Particulars
SegmentSeeds Micronutrients Vegetables Total
2016-17 2015-16 2016-17 2015-16 2016-17 2015-16 2016-17 2015-161 Segment Revenue 68,129.18 72,354.10 2,237.47 2,013.38 269.10 162.79 70,635.76 74,530.27 2 Segment results before
interest and taxes and Other Income
10,868.22 16,541.17 238.41 (240.19) (175.63) (293.12) 10,931.00 16,007.86
Interest Expenses 13.72 20.30 8.63 0.32 1.79 3.27 24.14 23.89 Other Income 3,420.68 1,152.67 21.43 157.30 0.13 - 3,442.23 1,309.97
3 Profit before Exceptional Item and tax
14,275.18 17,673.54 251.21 (83.21) (177.29) (296.39) 14,349.09 17,293.94
Exceptional Item 5,923.80 - - - - - 5,923.80 -
Current Tax 641.21 541.89 106.32 39.82 - - 747.53 581.71 Deffered Tax (48.56) (22.64) (2.62) (12.31) - - (51.18) (34.95)
4 Net Profit after Tax 7,758.74 17,154.29 147.51 (110.72) (177.29) (296.39) 7,728.95 16,747.18 5 Other Information
Segment Assets 1,49,774.73 1,33,420.07 2,607.42 2,145.18 394.32 501.54 1,52,776.48 1,36,066.79 Segment Liabilities 50,357.46 42,656.30 991.18 678.07 68.34 33.27 51,416.98 43,367.64 Capital Expenditure 3,716.56 2,547.85 636.46 39.97 - 16.22 4,353.02 2,604.04 Depreciation 2,860.73 2,513.01 48.10 63.75 114.84 167.47 3,023.67 2,744.24
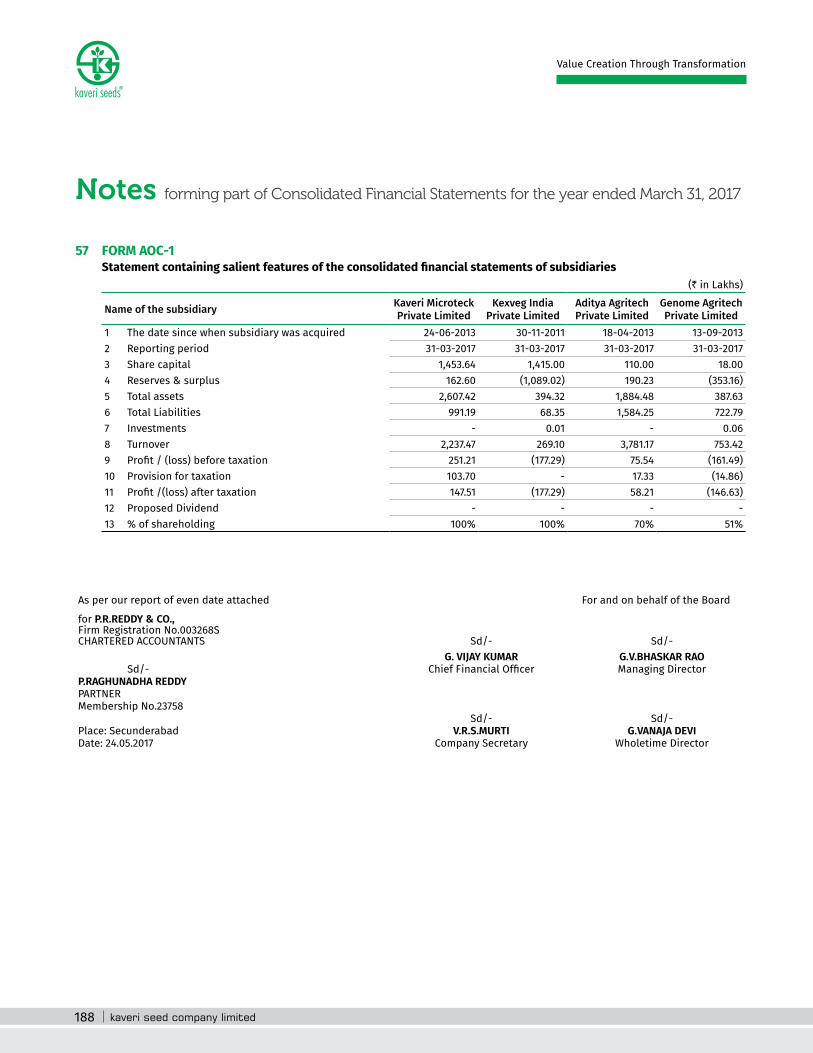
188
Notes forming part of Consolidated Financial Statements for the year ended March 31, 2017
Value Creation Through Transformation
57 FORM AOC-1 Statement containing salient features of the consolidated financial statements of subsidiaries
(` in Lakhs)
Name of the subsidiary Kaveri Microteck Private Limited
Kexveg India Private Limited
Aditya Agritech Private Limited
Genome Agritech Private Limited
1 The date since when subsidiary was acquired 24-06-2013 30-11-2011 18-04-2013 13-09-20132 Reporting period 31-03-2017 31-03-2017 31-03-2017 31-03-20173 Share capital 1,453.64 1,415.00 110.00 18.00 4 Reserves & surplus 162.60 (1,089.02) 190.23 (353.16)5 Total assets 2,607.42 394.32 1,884.48 387.63 6 Total Liabilities 991.19 68.35 1,584.25 722.79 7 Investments - 0.01 - 0.06 8 Turnover 2,237.47 269.10 3,781.17 753.42 9 Profit / (loss) before taxation 251.21 (177.29) 75.54 (161.49)10 Provision for taxation 103.70 - 17.33 (14.86)11 Profit /(loss) after taxation 147.51 (177.29) 58.21 (146.63)12 Proposed Dividend - - - -
13 % of shareholding 100% 100% 70% 51%
As per our report of even date attached For and on behalf of the Board
for P.R.REDDY & CO.,Firm Registration No.003268SCHARTERED ACCOUNTANTS Sd/- Sd/-
G. VIJAY KUMAR G.V.BHASKAR RAOSd/- Chief Financial Officer Managing Director
P.RAGHUNADHA REDDYPARTNERMembership No.23758
Sd/- Sd/-Place: Secunderabad V.R.S.MURTI G.VANAJA DEVIDate: 24.05.2017 Company Secretary Wholetime Director
kaveri seed company limitedCIN: L01120AP1986PLC006728
Regd. Office: 513-B, 5th Floor, Minerva Complex, S.D.Road, Secunderabad – 500 003, Telangana State.
Email: [email protected] Website : www.kaveriseeds.in
30th Annual General Meeting – Monday, 25th day of September, 2017.
ATTENDANCE SLIPFolio No./Client Id: No. of Shares:
Name and address of
First/Sole Shareholder:
I, hereby record my presence at the 30th Annual General Meeting of the Company to be held on Monday the 25th day of September 2017 at 12.15 PM at the FTAPCCI Auditorium, The Federation of Andhra Pradesh Chambers of Commerce and Industry, Federation House, 11-6-841, FTAPCCI Marg, Red Hills, Hyderabad – 500 004, Telangana.
Name of the Member/Proxy Signature of the Member/Proxy(Block Letters)
Notes:a) Only Member/Proxy can attend the meeting. No minors would be allowed at the meeting.b) Member/Proxy who wish to attend the meeting must bring this attendance slip to the meeting and hand over at the
entrance duly filled in and signed.c) Member/Proxy should bring his/her copy of the Annual Report for reference at the meeting.

ROUTE MAP
FTAPCCI Auditorium, The Federation of Andhra Pradesh Chambers of Commerce and Industry

kaveri seed company limitedCIN: L01120AP1986PLC006728
Regd. Office: 513-B, 5th Floor, Minerva Complex, S.D.Road, Secunderabad – 500 003, Telangana State. Email: [email protected] Website : www.kaveriseeds.in30th Annual General Meeting – Monday, 25th day of September, 2017.
PROXY FORM(Pursuant to Section 105(6) of the Companies Act, 2013 and Rule 19(3) of the Companies (Management and Administration) Rules, 2014)
Name of the Shareholder(s):
Registered Address:
E-mail ID: Folio No. /Client Id: DP ID:
Folio No./Client ID No. DP ID No.
I/We, being member(s) of Kaveri Seed Company Limited, holding shares of the Company, hereby appoint:
A. Name: E-mail id
Address:
Signature
or failing him
B. Name: E-mail id
Address:
Signature
or failing him
C. Name: E-mail id
Address:
Signature
as my/our proxy to attend and vote (on poll) for me/us, on my/our behalf at the 30th Annual General Meeting of the Company to be held on Monday the 25th day of September 2017 at 12.15 PM at the FTAPCCI Auditorium, The Federation of Andhra Pradesh Chambers of Commerce and Industry, Federation House, 11-6-841, FTAPCCI Marg, Red Hills, Hyderabad – 500 004, Telangana, and at any adjournment thereof in respect of such resolutions as are indicated below:
ORDINARY BUSINESS:1. Approval the Audited Standalone & Consolidated Balance Sheet as at 31st March 2017, Statement of Profit & Loss and Cash Flow
Statement for the year ended on 31st March 2017 along with the reports of the Directors and Auditors thereon.
2. To appoint a Director in place of Mr. C.Vamsheedhar (DIN :01458939) who retires by rotation and being eligible offers himself for reappointment.
3. Approval the Appointment of the Auditors M/s. M. Bhaskar Rao & Co., Chartered Accountants and fix their remuneration.
Signature of the Shareholder Signature of the Proxyholder(s) Signed this day of 2017
Notes:a) Proxy need not be a member of the Company.
b) The Proxy Form duly filled in and signed by the member(s) across Revenue Stamp should reach the Company’s Registered Office: 513-B, 5th Floor, Minerva Complex, S.D.Road, Secunderabad – 500 003, Telangana, at least 48 hours before the commencement of the meeting.
c) Corporate members intending to send their authorized representative(s) to attend the meeting are requested to send a certified copy of the Board resolution authorizing their representative(s) to attend and vote on their behalf at the meeting.
Revenue Stamp

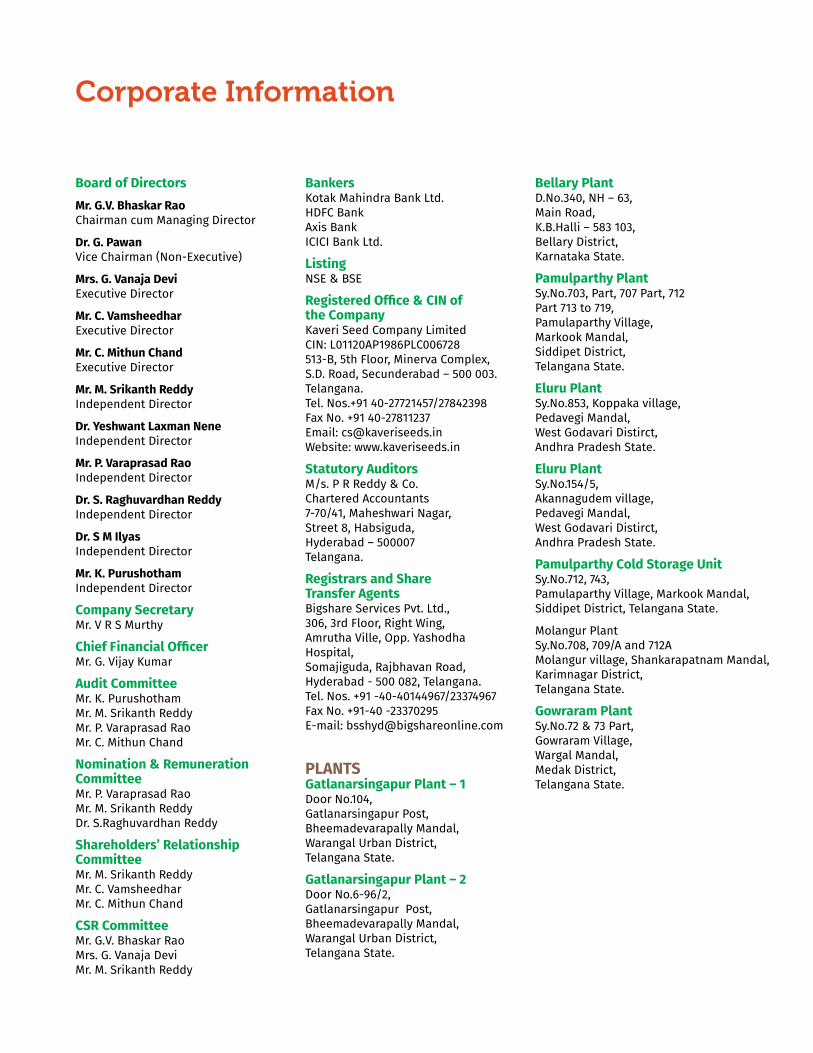
Corporate Information
Board of DirectorsMr. G.V. Bhaskar Rao Chairman cum Managing Director
Dr. G. Pawan Vice Chairman (Non-Executive)
Mrs. G. Vanaja Devi Executive Director
Mr. C. Vamsheedhar Executive Director
Mr. C. Mithun Chand Executive Director
Mr. M. Srikanth Reddy Independent Director
Dr. Yeshwant Laxman Nene Independent Director
Mr. P. Varaprasad Rao Independent Director
Dr. S. Raghuvardhan Reddy Independent Director
Dr. S M Ilyas Independent Director
Mr. K. Purushotham Independent Director
Company Secretary Mr. V R S Murthy
Chief Financial Officer Mr. G. Vijay Kumar
Audit Committee Mr. K. Purushotham Mr. M. Srikanth Reddy Mr. P. Varaprasad Rao Mr. C. Mithun Chand
Nomination & Remuneration Committee Mr. P. Varaprasad Rao Mr. M. Srikanth Reddy Dr. S.Raghuvardhan Reddy
Shareholders’ Relationship Committee Mr. M. Srikanth Reddy Mr. C. Vamsheedhar Mr. C. Mithun Chand
CSR Committee Mr. G.V. Bhaskar Rao Mrs. G. Vanaja Devi Mr. M. Srikanth Reddy
Bankers Kotak Mahindra Bank Ltd. HDFC Bank Axis Bank ICICI Bank Ltd.
Listing NSE & BSE
Registered Office & CIN of the Company Kaveri Seed Company Limited CIN: L01120AP1986PLC006728 513-B, 5th Floor, Minerva Complex, S.D. Road, Secunderabad – 500 003. Telangana. Tel. Nos.+91 40-27721457/27842398 Fax No. +91 40-27811237 Email: [email protected] Website: www.kaveriseeds.in
Statutory Auditors M/s. P R Reddy & Co. Chartered Accountants 7-70/41, Maheshwari Nagar, Street 8, Habsiguda, Hyderabad – 500007 Telangana.
Registrars and Share Transfer Agents Bigshare Services Pvt. Ltd., 306, 3rd Floor, Right Wing, Amrutha Ville, Opp. Yashodha Hospital, Somajiguda, Rajbhavan Road, Hyderabad - 500 082, Telangana. Tel. Nos. +91 -40-40144967/23374967 Fax No. +91-40 -23370295 E-mail: [email protected]
PLANTS Gatlanarsingapur Plant – 1 Door No.104, Gatlanarsingapur Post, Bheemadevarapally Mandal, Warangal Urban District, Telangana State.
Gatlanarsingapur Plant – 2 Door No.6-96/2, Gatlanarsingapur Post, Bheemadevarapally Mandal, Warangal Urban District, Telangana State.
Bellary Plant D.No.340, NH – 63, Main Road, K.B.Halli – 583 103, Bellary District, Karnataka State.
Pamulparthy Plant Sy.No.703, Part, 707 Part, 712 Part 713 to 719, Pamulaparthy Village, Markook Mandal, Siddipet District, Telangana State.
Eluru Plant Sy.No.853, Koppaka village, Pedavegi Mandal, West Godavari Distirct, Andhra Pradesh State.
Eluru Plant Sy.No.154/5, Akannagudem village, Pedavegi Mandal, West Godavari Distirct, Andhra Pradesh State.
Pamulparthy Cold Storage Unit Sy.No.712, 743, Pamulaparthy Village, Markook Mandal, Siddipet District, Telangana State.
Molangur Plant Sy.No.708, 709/A and 712A Molangur village, Shankarapatnam Mandal, Karimnagar District, Telangana State.
Gowraram Plant Sy.No.72 & 73 Part, Gowraram Village, Wargal Mandal, Medak District, Telangana State.

Registered Officekaveri seed company limitedCIN: L01120AP1986PLC006728
513-B, 5th Floor, Minerva Complex, S.D.Road, Secunderabad – 500 003, TelanganaTel.Nos.+91 40-27721457/27842398, Fax No.+91 40-27811237 Email: [email protected] Website: www.kaveriseeds.in
conc
ept, c
onte
nt an
d de
sign a
t(in
fo@
aicl.in
)