katharine drake - w. p. carey school of businesskatharine drake . of . school of accountancy . ......
TRANSCRIPT
Distinguished Lecture Series School of Accountancy
W. P. Carey School of Business Arizona State University
Katharine Drake of
School of Accountancy W.P. Carey School of Business
Arizona State University will discuss
“Does Firm Life Cycle Explain the Relation Between
Book-Tax Differences and Earnings Persistence?”
on
February 2, 2012
11:00am in BA201
Does Firm Life Cycle Explain the Relation Between Book-Tax
Differences and Earnings Persistence?
Katharine D. Drake
Arizona State University
W.P. Carey School of Business
School of Accountancy
300 East Lemon Street BA 223Q
Tempe, AZ 85287
Draft: January 25, 2012
Preliminary Draft – Please do not cite
Acknowledgements: I am grateful to Melissa Martin, Laura Wellman, Jenny Brown, Steve
Kaplan, Charles Christian, Eric Weisbrod, Allison Koester, members of the Arizona State
University Tax Reading Group and to participants in the Spring 2011 University of
Arizona Doctoral Tax Seminar for their helpful comments. All errors are my own.
Does Firm Life Cycle Explain the Relation Between Book-Tax
Differences and Earnings Persistence?
Abstract
Existing literature consistently documents a relationship between book-tax
differences and future financial performance. Specifically, large book-tax differences are
associated with lower earnings persistence. I contend that one reason the tax information
contained in financial statements is informative about future earnings is that the
relationship between book and taxable income captures information about a firm’s life
cycle stage.
I use fundamental analysis to group firm-year observations into life cycle stages
using two measures of life cycle from the literature. I document a link between book-tax
differences and firm life cycle and I build on prior studies which find a relation between
earnings persistence and book-tax differences, and earnings persistence and firm life cycle.
I find that after controlling for firm life cycle stage, the association between large positive
and large negative book-tax differences and lower earnings persistence does not hold. My
results offer an economically based explanation for the relation between book-tax
differences and earnings persistence as an alternative explanation to prior research.
To ensure that my findings are not merely proxying for earnings management, I
document that firm life cycle explains variation in book-tax differences and the observed
relationship between book-tax differences and future earnings above and beyond earnings
management.
Keywords: Book-tax differences, earnings persistence, firm life cycle

2
Does Firm Life Cycle Explain the Relation Between Book-Tax Differences and
Earnings Persistence?
I. Introduction
Extant literature consistently finds an association between book-tax differences (BTD)1
and both the persistence of accruals and earnings (Hanlon 2005) and future earnings growth (Lev
and Nissim 2004). These findings are appealing to researchers and investors alike in that
understanding the information in BTD enhances the informativeness of reported financial
statement information. While researchers consistently document a relation between this tax
fundamental and financial performance, the explanation for this association remains unclear.
Specifically, what is it about BTD that relate to earnings persistence or future earnings growth?
The consensus among researchers is that BTD can arise from a number of different sources
including inherent differences between the tax and financial reporting systems, upwards earnings
management, and tax planning strategies (Hanlon 2005; Lev and Nissim 2004; Blaylock et al.
2012). These prior studies do not provide an economic framework as to why the information
contained in BTD is associated with future earnings. I offer life cycle theory as an explanation for
why BTD are associated with future earnings.
Fundamental to this explanation is the hypothesis that BTD will vary predictably over the
life of the firm. Life cycle research uses fundamental analysis to identify stages across firm-year
1 Throughout the paper, I use the term book-tax differences to represent the differences between a firm’s “book”
income as reported following GAAP for financial statement reporting and its taxable income. Taxable income is an
estimate of a firm’s taxable income from information in the financial statements. Actual income reported to taxing
authorities is not observable, and thus must be estimated by researchers and investors from information contained in
the financial statements.
3
observations (i.e. introduction, growth, maturity and decline).2 I document expected variation in
firm performance, including sales, ROA, cash flows and earnings persistence across life cycle
stages. Because firms engage in fundamentally different transactions depending on their life cycle
stage, and because these transactions map into financial reporting and tax reporting differently, I
expect BTD will vary across firm life cycle. I contend that BTD are a function of the natural course
of business, capturing growth and decline, and are thus associated with earnings persistence.
Specifically, in an introduction growth phase, firms tend to increase operations and acquire assets
and investments. Increases in estimates and depreciation and amortization increase the level of
book-tax differences without necessarily increasing tax aggressiveness or indicating earnings
management. Mature firms are often thought of as “steady state,” not growing nor declining. Firms
in a decline phase tend to reduce operations and sell assets. These actions reduce the level of
book-tax differences incurred, again, without necessarily affecting the level of tax aggressiveness.
Inherently, life cycle captures growth or decline in firm performance. Thus, I expect, and find, that
temporary book-tax differences will vary predictably across life cycle stages.3
I test whether the relation between BTD and firm life cycle explains the negative relation
between large BTD and earnings persistence. I document a link between BTD and firm life cycle.
I then build on prior studies that find a relation between earnings persistence and BTD, and
between earnings persistence and firm life cycle. I find that, controlling for firm life cycle stage,
the association between large positive and large negative BTD and lower earnings persistence does
2 Life cycle studies refer to the phases by varying names, and measures.
3 Permanent differences between GAAP and tax are those in which items of income or expense are included in one
measure but never in the other. Temporary differences, however, differ only in the timing of recognition of the income
or expense between the two reporting systems. Permanent differences between book and tax are not necessarily
associated with firm growth or decline, and therefore I do not expect permanent differences to vary predictably across
life cycle stages. Lev and Nissim (2004), Weber (2009) and other studies consider the ratio of book to (estimated)
taxable income, capturing both temporary and permanent differences. While their results are consistent with a life
cycle theory of the firm, there is no intuition regarding permanent differences across life cycle stages of the firm, and
thus I focus on temporary differences.
4
not hold. My results offer an alternative, economically based, explanation for the relation between
BTD and earnings persistence as an alternative explanation to prior research.
To ensure that my findings are not merely proxying for a prior explanation of the relation
between BTD and earnings (e.g. earnings management), I test whether the association between the
earnings management measure in Blaylock et al. (2012) and positive BTD is at least partially
explained by life cycle stage. I find that firm life cycle explains variation in BTD and the observed
relation between BTD and future earnings above and beyond earnings management.
This study makes three contributions. I contribute to the literature on book-tax differences
by providing an economic framework (firm life cycle) for the results in prior research regarding
the well-documented link between BTD and future earnings. Graham et al. (2010) comment that
“we find it puzzling that the tax information in the financial statements can simultaneously
communicate so little about a firm’s actual taxes (as asserted by practitioners) and still influence
analysts, explain future earnings and predict share prices, among other things...” (page 82). These
authors call for researchers to identify how and why tax information informs investors about future
earnings. Similarly, Hanlon and Heitzman (2010) call for future research to examine the source of
the information contained in BTD about future earnings. I contend that one reason the tax
information contained in financial statements is informative is that it captures information about a
firm’s life cycle stage.
My study also adds to the life cycle literature by documenting another facet of firm
performance (the relation between book and taxable income) that varies with firm life cycle. By
expanding our understanding of BTD this study also complements prior literature that examines
5
tax behavior in value and glamour firms by examining tax behavior across firm life cycle. (e.g.
Paprocki and Schnee 2004)
Finally, my study adds to the tax literature by providing an explanation as to why some
firms appear to avoid more taxes than others. BTD measure temporary book-tax differences and
thus high levels of BTD are associated with low cash effective tax rates (ETR), a measure of tax
avoidance, resulting from the deferral of tax expense. Dyreng et al. (2008) observe variation in the
level of tax avoidance among firms, proxied by cash ETR, even within the same industry. I
document that both BTD and cash ETR vary systematically across life cycle stages. While
different firms have different objectives and opportunities for tax planning and tax avoidance, I
also suggest that BTD (and, thus, the observed level of tax avoidance) varies across firm life cycle.
Historically, researchers use BTD as a measure of tax avoidance and tax aggressiveness. BTD are
associated with predicting tax sheltering (Wilson 2009), are a determinant of uncertain tax
positions (Cazier et al. 2009), and are subject to scrutiny by regulators (Badertscher et al. 2009;
Cloyd 1995; Mills 1998). This prior literature suggests that BTD indicate aggressive, illegitimate
or uncertain tax positions. I offer evidence that cross-sectional variation in cash ETR and BTD
results from fundamental differences in economic transactions at different stages of a firm’s life
cycle and not merely by aggressive behavior alone.
II. Literature Review and Hypothesis Development
Sources of book-tax differences
Firms report earnings to investors in accordance with GAAP and to the taxing authorities
by the rules and regulations set forth under law. Atwood et al. (2010) identify reasons for
differences in book and tax reporting, including, ”financial accounting rules are generally based on
6
the conservatism and matching principles whereas tax accounting rules are based on the
ability-to-pay principle, with incentives for taxpayers to engage in specific economic activities”
(page 114). There are numerous differences between GAAP and tax reporting, including
temporary differences (depreciation, estimates and reserves) and permanent differences (tax
exempt income, non-deductible expenses). Permanent differences between GAAP and tax are
those in which items of income or expense are included in one measure but never in the other.
Temporary differences, however, differ only in the timing of recognition of the income or expense
between the two reporting systems. One of the characteristics of GAAP accounting principles is
conservatism, that is, recognizing losses when probable and measurable, and using
forward-looking estimates to establish reserves. The tax code, however, does not allow for
deductions until economic performance occurs or losses are realized, giving rise to temporary
differences between book income and tax income.
Appendix A provides a summary of a number of common temporary differences between
book and tax reporting and their anticipated effect on earnings persistence. By their nature,
temporary differences have increasing and decreasing effects on the level of BTD. Appendix A
outlines, in general, sources of BTD and whether the underlying transactions give rise to positive
BTD (book income greater than taxable income) or negative BTD (taxable income greater than
book income).
Beyond the different reporting requirements for each system, BTD are affected by earnings
management activities creating non-conforming4 BTD (Badertscher et al. 2009; Blaylock et al.
2012; Ayers et al. 2009) and tax planning strategies (Blaylock et al. 2012; Ayers et al. 2009). It is
4 Badertcher et al. (2009) distinguish between conforming earnings management, that affects reported book and
taxable income equally, and non-conforming earnings management that creates a book-tax difference.

7
precisely the subjectivity involved in GAAP reporting that leads researchers to consider earnings
management as a source of BTD. Of course, most firms’ BTD in any given year will be a
combination of firm specific effects, inherent differences between book and tax reporting, any
non-conforming earnings management activities and tax planning strategies.
Given the number of different channels through which BTD can arise, researchers have
struggled to interpret the economic meaning of firms’ BTD and the means through which it relates
to future earnings.
Informativeness of book-tax differences
Beginning with Lev and Nissim (2004) and Hanlon (2005), a stream of literature examines
whether BTD provide information regarding future financial performance.5 Hanlon (2005)
documents a negative association between earnings persistence and large positive and large
negative BTD, which she measures using only temporary BTD. She finds that pre-tax earnings are
less persistent for firm-years with large negative and large positive BTD and suggests her findings
may be driven by firm characteristics, tax planning, or earnings management. To further examine
whether her results are driven by earnings management, she also tests and finds that accrual
earnings are less persistent for firm-years with large positive and large negative BTD.
Similarly, Lev and Nissim (2004) identify a positive relation between the ratio of taxable
income to book income and future earnings growth. They find that deferred tax expense is
positively related to subsequent earnings growth.6 Lev and Nissim’s (2004) measure incorporates
5 For a summary of the existing literature, see Hanlon and Heitzman (2010).
6 Lev and Nissim (2004) create a deferred tax fundamental, R_DEF, defined as a multinomial variable of
industry-year quintile rankings of the negative of the ratio of deferred tax expense to total assets. They find this
fundamental is negatively associated with earnings growth in the post-SFAS 109 period. Thus, higher levels of
deferred tax expense are associated with higher levels of earnings growth.
8
both temporary BTD (captured in their deferred tax fundamental) and permanent BTD (captured
by their tax fundamental). Their tests indicate that both measures capture information relevant for
future earnings growth. Lev and Nissim (2004) attribute their findings to inherent differences
between the two reporting systems, earnings management, or smoothing of taxable income.
Other studies examine the informativeness of BTD to firm stakeholders. Ayers et al. (2010)
find that both positive and negative changes in BTD are associated with decreases in firm credit
ratings. They infer the change in BTD is associated with decreased earnings quality and thus
informative to debt holders. Similarly, Comprix et al. (2011) show that large BTD are associated
with market participants’ uncertainty as measured by share turnover, analyst forecast dispersion,
and stock return variance.
Subsequent studies further consider the source of the BTD-persistence relation. Seidman
(2010) finds that GAAP changes and changes to general macroeconomic business conditions
affect the relation between BTD and earnings persistence. Jackson (2011) finds that temporary
BTD are related to changes in future pre-tax income. The subjectivity involved in GAAP reporting
leads researchers to consider earnings management as a source of BTD. For example, Blaylock et
al. (2012) suggest that the relation between large positive BTD and lower earnings persistence
found in Hanlon (2005) is explained by earnings management. They test and find that firm-years
with large positive BTD likely arising from upwards earnings management exhibit lower earnings
persistence than other firms with large positive BTD.
Guenther (2011) also investigates the causes of the BTD-earnings persistence relation in
Hanlon (2005). He identifies certain influential observations that drive her results. He uses “data
snooping” in order to identify observations with data coding errors and observations that impact
9
Hanlon’s findings. Guenther finds that young firms, small firms, firms with high levels of ROA,
and firms with larger transitory items (gains/losses) drive the relation between large BTD and less
persistent earnings. Although his findings result from “data snooping,”7 they support the notion
that firm performance, age and disposition of assets impact the relation between BTD and earnings
persistence.
What is it about BTD that relate to earnings persistence or future earnings growth? And
how is the market able to appropriately assess this relation? Hanlon and Heitzman (2010)
comment “the evidence to date suggests that book–tax differences provide information about
current and future earnings (e.g., earnings persistence and future earnings growth) and potentially
indicate pre-tax earnings management” (Hanlon and Heitzman 2010, pg. 128). I posit that BTD
will vary predictably over the life of a firm and that life cycle explains the earnings persistence
variation across BTD groups.
Life Cycle
The life cycle theory of the firm (Mueller 1972) is concerned with how a firm grows,
matures, and declines. A different construct than “product” or “industry” life cycle, “firm” life
cycle considers the firm as a combination of “many overlapping, but distinct, product life cycle
stages” (Dickinson 2011, page 1970). The goal of life cycle analysis is to use fundamental analysis
to group firm-years into similar categories and then use these categories as a framework for
analyzing how varying incentives, constraints and strategies over a firm’s life cycle are related to
firm decisions and performance outcomes. Black (1998) notes, “firm-years in a given life cycle
stage are relatively more homogenous across multiple financial characteristics than a pooling of all
7 While Guenther’s results suggest that Hanlon’s findings arise from a small sample of outliers, Blaylock et al. (2012)
find that Hanlon’s results hold in their sample, which covers a different time period. Similarly, in my tests, Hanlon’s
results hold outside her original sample period.
10
firm-years” (page 40). In sum, life cycle provides an alternative economic framework in which to
study firms.
Life cycle studies cross many disciplines. A number of studies examine strategy (Miller
and Friesen 1984; Jawahar and McLaughlin 2001), governance (Ramaswamy et al. 2007; Chiang
et al. 2011), incentives (Liao 2008), discretionary accruals (Liu 2008), employee stock options
(Bens et al. 2002), research and development and capital expenditures (Ahmed and Jinan 2011),
and firm payout policy (Coulton and Ruddock 2011) across life cycle stages. My study is the first
to examine how tax outcomes, specifically BTD, vary across firm life cycle stages.
Life Cycle and Book-Tax Differences
Appendix B summarizes firm characteristics of the life cycle phases as documented in
prior literature.8 Firms in introductory and growth phases of a life cycle are characterized by
investment in capital expenditures, acquisition of subsidiaries, and a focus on sales growth
(Spence 1979; Jenkins et al. 2004). Mature firms often focus on efficiencies and are characterized
by steady state earnings (Black 1998). In shakeout and decline phases, firms dispose of assets
(Dickinson 2011) and focus on cost minimization (Jenkins et al. 2004). Because firms in
difference phases of life cycle engage in fundamentally different economic transactions with
different book and tax treatments, I build on these differences and examine BTD across life cycle
stages.
In considering anticipated firm behavior across life cycle stages, I focus on temporary
book-tax differences. Poterba et al. (2010) examine firm tax footnotes in detail and tabulate
sources of deferred tax assets and liabilities. They find that temporary differences related to
8 See discussion in section IV regarding the measures of life cycle.
11
property and equipment are the largest source of deferred tax liabilities. Appendix A summarizes
common sources of temporary differences between GAAP and tax reporting and the anticipated
impact on BTD (e.g., giving rise to a negative or positive BTD). For example, the addition of
property and equipment will result in positive BTD from the use of accelerated depreciation for tax
purposes but not for book purposes (thus book income is greater than taxable income so the BTD is
positive). However, the disposition of property and equipment with tax accumulated depreciation
in excess of book accumulated depreciation results in a negative BTD. Thus, growth firms are
expected to have increasing BTD, and shakeout/decline firms are expected to have decreasing or
negative BTD.
Growth firms are characterized by increasing operations, increases in accounts receivable
and inventory, large positive accruals (Liu 2008), sales growth (Black 1998), high capital
expenditures (Black 1998), high overall levels of investment (Spence 1979), and incentive/stock
based compensation plans (Liao 2008; Bens et al. 2002). All of these transactions are associated
with deferral of income for tax purposes. Increases in accounts receivable and inventory lead to
estimates of allowances, creating differences between book and taxable income. Capital
expenditures create deferred tax liabilities associated with accelerated depreciation for tax
reporting but not for book reporting (so book income is greater than taxable income). Deferrals of
income for tax purposes generate positive BTD. I anticipate that as firms grow they will generate
positive BTD. Because book-tax differences are related to firm behaviors across the growth phase
of life cycle, I hypothesize:
H1a: During the growth phase of a firm’s life cycle, pre-tax book income will be higher than
estimated taxable income (positive BTD).

12
As firms mature, they are characterized by a lower level of investment and innovation
(Aharony et al. 2006, Chiang et al. 2011), lower levels of sales growth, and more persistent net
income (Black 1998). Where firms in a growth stage have significant increases in investment and
firms in a decline stage dispose of assets, mature firms replace assets as needed, generating smaller
differences between book and taxable income. The tax effects of the firms’ anticipated strategy
and income in mature firms are expected to be relatively constant. Likewise, mature firms are more
stable, and likely invest in tax planning. Given the anticipated increasing positive BTD in the
growth period, I expect firms will also have positive BTD in the maturity phase.
H1b: During the maturity phase of a firm’s life cycle, pre-tax book income will be higher
than estimated taxable income (positive BTD).
Shakeout or decline firms are characterized by changes in strategy designed to revitalize the
firm. These firms reduce investment, and in some cases, dispose of assets to generate cash flows
(Dickinson 2011). Decline firms have large negative accruals as the volume of transactions
decreases and reserves are reduced (Liu 2008). Low profitability, combined with reversal of
previously deferred taxable income will result in taxable income increasing and book income
decreasing. Thus, I hypothesize:
H1c: During the decline phase of a firm’s life cycle, pre-tax book income will be lower than
estimated taxable income (negative BTD).
Together, H1a, H1b and H1c posit that firm life cycle is associated with cross-sectional
variation in BTD.

13
Life Cycle and Earnings Persistence
Jenkins et al. (2004) create a link between a firm’s focus and strategy and the value relevance
placed by investors on earnings components. They highlight that firms focus on different strategic
actions in growth, maturity, and decline phases. In a growth phase firms are focused on changes in
sales, and the authors document that the value relevance of a change in sales is relatively greater
than other stages. Similarly, mature firms change focus from growth in sales to growth in
profitability, and value relevance of changes in profitability increase relative to sales growth.
Lastly, for firms in decline, firm strategy focuses on increases in profitability, which is reflected in
the value relevance of changes in profitability.
Thus, in considering the earnings persistence expectation for growth firms, I rely on the link
created by Jenkins et al. (2004) between firm strategy and market valuation. Market participant
evaluate firms based on reliable predictors of future earnings. Growth firms are increasing in
complexity (Liao 2008) and focused on innovation (Chiang et al. 2011). Value relevance studies
identify sales (Black 1998) and cash flows (Aharony et al. 2006) as more value relevant than
bottom line profitability in the growth stage. Thus, if growth firms are focused on factors other
than profitability, and if market participants place less value on current earnings as a predictor of
future earnings, I expect variation in future earnings for growth firms. Some growth firms will
grow both sales and earnings, while others will grow sales only.
In contrast, mature firms are focused on cost minimization (Jenkins et al. 2004) and
profitability (Black 1998). Dickinson (2011) finds that mature firms have the highest levels of
after-tax earnings persistence. Further, during the mature phase, investors value earnings more

14
than in the growth phase (Black 1998). Given this relation between firm strategy and market
valuation, I verify that the results of Dickinson’s tests hold for pre-tax earnings and hypothesize:
H2a: During the growth phase of a firm’s life cycle, pre-tax book income will be less
persistent than during the maturity phase.
Unlike mature and growth firms, firms in a shakeout or decline phase are focused on
recovery or survival. They often look for efficiencies and cost minimization strategies (Jenkins et
al. 2004). Declining firms face low profit margins, low earnings (Miller and Friesen 1984; Black
1998), and investors again focus on cash flows as a signal of profitability (Black 1998). Given the
nature of these firms’ focus and investor valuation, I hypothesize:
H2b: During the shakeout/decline phase of a firm’s life cycle, pre-tax book income will be
less persistent than during the maturity phase.
Life Cycle, Book-Tax-Differences and Earnings Persistence
Hanlon and Heitzman (2010) review existing literature and comment that
“The evidence to date suggests that book-tax differences provide information about current
and future earnings (e.g. earnings persistence and future earnings growth)… Recent
research partitions the book-tax differences to hone in on the underlying causes of these
relations” (Hanlon and Heitzman 2010, pg. 128).
If, as suggested in the hypotheses above, earnings persistence varies across both life cycle stage
and BTD, and BTD are associated with life cycle, I contend that the observed relation between
BTD and earnings persistence are driven, at least in part, by life cycle stage. Stated otherwise, the
reason BTD are informative about future earnings is that BTD capture, to some extent, firm life
cycle.

15
Blaylock et al. (2012) suggest that the relation between large positive BTD and lower
earnings persistence found in Hanlon (2005) is explained by earnings management. However,
upwards earnings management cannot be sustained over long periods of time (Fedyk et al. 2011;
Allen et al. 2009), and earnings management measures are often subject to measurement error and
bias, especially in phases of extreme growth (Kothari et al. 2005). I contend that life cycle offers an
alternate explanation for Hanlon’s findings. I expect BTD are a function of the natural course of
business, capturing growth and decline, and are thus informative about future earnings.
Hanlon (2005) finds that firm years with large positive and large negative BTD are
associated with less persistent earnings. If the relation between book and taxable income is
predictable across life cycle stages, the earnings persistence information contained in book-tax
differences will also vary across life cycle stage. If BTD vary predictably across life cycle stage,
and both BTD and life cycle stage are associated with earnings persistence, I hypothesize:
H3: Controlling for firm life cycle stage, firm-years with large positive or large negative
book-tax differences will not be associated with lower earnings persistence.
III. Sample selection
I begin with a sample of firm-years from 1994-2010 in the intersection of CRSP and
COMPUSTAT that are incorporated in the U.S., excluding financial institutions and utilities.9
Consistent with other BTD studies, my study begins after the implementation of SFAS 109
Accounting for Income Taxes in 1993 to ensure consistent accounting for temporary book-tax
differences across my sample time period. I require firms to have all regression variables, and,
consistent with Hanlon (2005) and Blaylock et al. (2012), I exclude firms-year observations with
9 Similar to other tax studies, I exclude financial institutions and utilities (SIC codes 4900-4999 and 6000-6999)
because firms in regulated industries face a fundamentally different set of tax/non-tax trade-offs.

16
negative pre-tax income, reported net operating loss, or negative current tax expense, as the
measure of BTD for these firms has different meaning for these observations. As discussed in
Hanlon (2005), tax losses result in deferred tax assets, that “obscure the effects of ‘true’ book-tax
differences in the deferred tax expense account” (page 144). Because I am interested in examining
true book-tax differences arising from the firm’s transactions, I incorporate the same screens as
Hanlon(2005). After incorporating the required screens to construct the life cycle measures
described below, my final sample consists of 21,453 firm-year observations consisting of 4,358
unique firms.
IV. Research Design and Methodology
Life cycle measures
To capture firm life cycle I draw on two distinctly different life cycle measures from the
literature. See Appendix C for details of the construction of both measures. Anthony and Ramesh
(1992), hereafter A&R, construct a measure of life cycle that incorporates a firm’s five year history
of four characteristics age, sales growth, dividend growth, and capital expenditures.10
Under
A&R’s methodology, each year firms are assigned scores based on their relative ranking of these
four characteristics. The scores for each of the four characteristics are then combined into a
composite score so that each firm-year observation can be categorized into one of the following
life cycle stages: growth, growth/maturity, maturity, maturity/stagnant, and stagnant phases of life
cycle.11
In a recent study, Dickinson (2011) forms an alternative measure of a firm’s life cycle
10
By construction, requiring a five year history of these variables removes true “introduction stage” firms from the
sample. However, due to the uncertainty involved in this stage, most studies do not focus on the introduction stage
(Black 1992). 11
See robustness checks in Section V for additional life cycle measures and modifications to the Anthony and Ramesh
(1992) measure.
17
using cash flow patterns from operations, investing and financing activities. The cash flow model
builds on the combination of the sign of each of the three components of the cash flow statement to
categorize firms into one of five life cycle stages: introduction, growth, maturity, shakeout, and
decline stages. For example, growth firms are associated with positive cash flows from operations,
negative cash flows from investing activities, and positive cash flows from financing activities.
Similarly, decline firms are associated with negative cash flows from operations and positive cash
flows from investing activities. Several advantages of the cash flow measure of life cycle over the
A&R measure are that it includes information readily available to investors, does not involve any
comparisons across multiple periods, involves less subjectivity or relativity to other firms and
offers a simple proxy for life cycle.
While each of the measures above captures different facets of a firm’s life cycle, I choose
to use both. Either measure of life cycle is adequate for my study because I am looking for patterns
over the life of a firm. The two measures are somewhat correlated (ρ = 0.21, p <0.0001), but do not
overlap perfectly, and thus I interpret them as capturing different constructs of a firm’s life cycle.
In my analysis, I find that a number of firms achieve and maintain “maturity” status. Others grow
and mature and decline. Still others mature then re-enter the growth stage. Both the Dickinson and
the A&R models allow forward or backward progression across life cycle stages.
Models:
To test my first hypothesis, whether BTD vary across firm life cycle stages, I construct a
measure of temporary BTD consistent with Hanlon (2005) as follows:
(1)
I scale BTD by average assets to enable comparability across firms. I use t-tests to examine
18
whether the means vary across life cycle groups.
In order to test my hypothesis that earnings persistence varies across firm life cycle stages,
I follow Hanlon (2005) and construct a model of the persistence of pre-tax earnings using the
following equation:
(2)
where PTBI is pre-tax book income. I use pre-tax earnings to test persistence because my variables
of interest involve tax expense and thus affect after-tax earnings. I then estimate an equation
interacting indicator variables for life cycle stages with pre-tax earnings, allowing the coefficient
on current earnings to vary by life cycle stage. I compare coefficients across the groups in order to
determine if persistence varies by life cycle stage:
(3)
Where LCt is a series of indicator variables set to 1 if a firm-year observation is in a particular life
cycle category, 0 otherwise. I measure life cycle stage by both the cash flow components
methodology in Dickinson (2011) and the A&R (1992) measure. Other variables are as defined
above. Equation (3) omits an intercept term because of the five life cycle variables.
The finding in Hanlon (2005) that large BTD are associated with less persistent earnings
are essential to my third hypothesis that links BTD, life cycle and earnings persistence. Thus, I
replicate the model in Hanlon (2005) as follows.
(4)
where LNBTD is an indicator set equal to 1 if a firm-year observation is in the lowest quintile of
scaled BTD, and LPBTD is an indicator set equal to 1 if a firm-year is in the highest quintile of
scaled BTD, and zero otherwise. Consistent with Hanlon’s findings, I expect γ4 and γ5 to be
19
negative.
In order to test my main hypothesis, whether the relation between BTD and future earnings
identified in previous studies is explained by firm life cycle stage, I construct the following model:
(5)
where variables are as defined above. Again, I omit an intercept term because of the five life cycle
variables. If LNBTD and LPBTD capture life cycle, I anticipate the coefficients on β8 and β9 to be
insignificant. Alternatively, if some portion of BTD is explained by life cycle, I anticipate that the
coefficients β8 and β9 will be smaller than γ4 and γ5in model (4) above.
V. Results
Descriptive Analysis of Sample
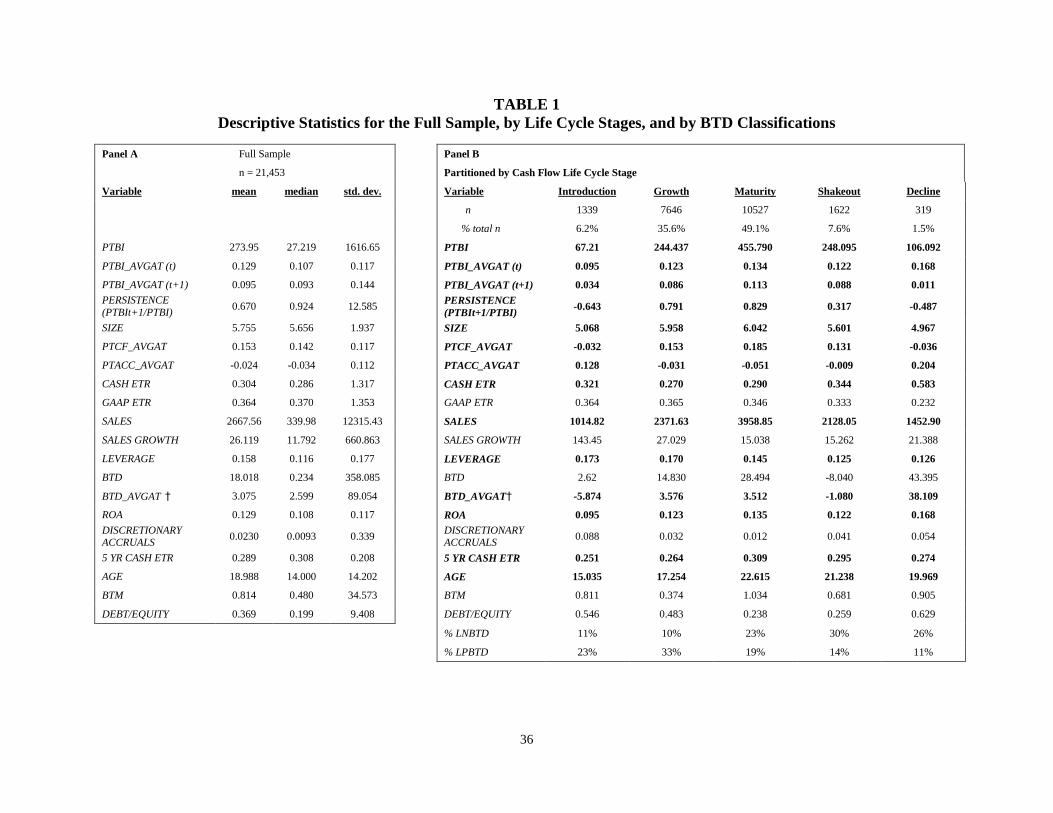
Panel A of Table 1 presents descriptive statistics for the full sample of observations. Panel
B presents the means of the variables partitioned into life cycle stages by the cash flow method
(see Appendix C). Bold numbers indicate significance across groups at the 5% level. The means by
life cycle stage indicate that pre-tax earnings (PTBI) are increasing from the introduction to the
growth and maturity phases, then decreasing in the shakeout and decline phases. A similar trend is
apparent for earnings persistence (PTBIt+1/PTBIt), size, pre-tax cash flows (PTCF), and sales,
confirming that Dickinson’s cash flow measure captures some features of firm life cycle. Of
relevance to this study
are the measures of BTD and scaled BTD (BTD_AVGAT). The means document positive BTD in
20
the growth and maturity phases, and negative in the shakeout. The BTD average in the decline
sample may be an indication of some survival bias; firms that reach a decline phase yet continue at
least one year have increasing BTD as they recover. The trend in cash ETR and five year cash ETR
also follows expectations; that mature firms have the highest cash ETR. Additionally, I find that
mature firms are generally older than growth firms. Lastly, I include the % of large positive and
large negative BTD observations in each life cycle stage.
Panel C presents the same variables partitioned on life cycle stage as measured by A&R
(1992).12
Again, most variables demonstrate the anticipated trend across life cycle groups.13
The
two methodologies capture different facets of firm life cycle and thus, I anticipate different results
from the analysis. Overall, the descriptive statistics grouped by both measures appear to
consistently show mature firms have the highest levels of earnings, persistence, sales, etc.
Lastly, Panel D examines the same sample partitioned across BTD groups, where LNBTD
(LPBTD) represents the group of firm-years with scaled BTD in the bottom (top) quintile of
firm-years. The remainder of firms are classified as Small BTD, consistent with Hanlon (2005).
Again, the trends across groups are predictable, and appear to support the notion that there is a
relation between firm life cycle and BTD. Overall, Table 1 provides preliminary evidence in
support of my hypotheses that BTD are associated with firm life cycle. Consistent with
expectations, firm-years classified as maturity and growth/ (shakeout/decline/stagnant) are
associated with higher (lower) levels of BTD, in support of H1.
INSERT TABLE 1 HERE
In order to test H2a and H2b, whether earnings persistence varies predictably across life
12
The measure requires annual rankings of firms relative to all other firms based on sales growth, dividends, age and
capital expenditures (See Appendix C for specific details of the calculation). Hence, the data screens required for my
regression analysis alter the groupings from the anticipated 20% in each category. 13
Recall that the cash flow stages begin with an introductory phase; however, the A&R categories begin with a
growth phase.

21
cycle stages, I estimate Equation (3) and compare the coefficients on the interaction between PTBI
and life cycle stage across groups. Table 2 shows the results of estimating Equation (3) using both
the cash flow model of life cycle stages and the A&R model of firm life cycle. Only the
coefficients in the cash flow model regression vary significantly (p <0.0001 for all stages) between
life cycle stages. The coefficients on the A&R life cycle measures interacted with PTBI do not vary
significantly between groups. This indicates that the cash flow model of life cycle captures a
different construct of life cycle than A&R. To test H2a that the growth phase will exhibit lower
earnings persistence than the maturity phase, I compare the coefficients on PTBI*Stage2 and
PTBI*Stage3 and find the difference is significant (p <0.0001). Similarly, to test H2b that
firms-years in the shakeout phase of life cycle will exhibit lower earnings persistence than the
mature phase, I compare coefficients on PTBI*Stage3 and PTBI*Stage4 and find the difference is
significant (p < 0.0001). The cash flow model results support H2 that earnings persistence varies
by life cycle stage.
INSERT TABLE 2 HERE
In order to test my main prediction hypothesis that the documented relation between
earnings persistence and BTD is explained in part by life cycle, I first replicate the findings in
Hanlon (2005) within my sample period. Table 3 presents the main test from Hanlon (2005) as
modeled in Equation (4), confirming that large positive and large negative BTD are associated
with lower earnings persistence. Interestingly, Guenther (2011) identifies that Hanlon’s results are
driven by 113 “influential” observations, suggesting that the findings will not hold outside her
sample.14
However, both my study and Blaylock et al. (2012) find that Hanlon’s results hold for
periods beyond her original sample, suggesting that while Guenther’s findings indicate an
14
In untabulated results, I eliminate Guenther’s “influential” observations from my sample and find that Hanlon’s
results still hold; firm years with large positive and large negative BTD are associated with less persistent earnings.

22
alternate explanation, overall large positive and large negative BTD are associated with lower
earnings persistence.
INSERT TABLE 3 HERE
Hypothesis 3 builds on the results documented above, suggesting that the association
between firm-years with large positive and large negative BTD and lower levels of earnings
persistence will not hold when controlling for firm life cycle. In Table 4 I examine the results from
estimating Equation (5) using both the cash flow and A&R models of firm life cycle. The
coefficients on LPBTD*PTBI and LNBTD*PTBI are of interest for H3. Recall from Hanlon (2005)
and the results documented on Table 3, that the coefficients on those interaction terms are
significant and negative, indicating an association between large positive and large negative BTD
and lower earnings persistence. However, with the addition of life cycle and the relation between
life cycle and earnings persistence, the relation between LPBTD and LNBTD and earnings
persistence changes.
Using the cash flow model of life cycle, I find that the relation between LPBTD and
earnings persistence is no longer significant. In testing the coefficient on LNBTD, I find that the
difference between the coefficient on LNBTD *PTBI in the Hanlon model (Table 3) and in the life
cycle test on Table 4 are different (the difference is significant p = 0.0230), suggesting that large
negative BTD are still associated with earnings persistence after controlling for life cycle, but that
life cycle explains some of the negative relation. In the case of large positive BTD, the inclusion of
life cycle in the model subsumes the relation.
Using the A&R life cycle model, I find that the observed relation between LNBTD and
earning persistence is no longer significant in the presence of life cycle. The relation between
LPBTD and earnings persistence is also affected; the coefficient on LPBTD*PTBI is smaller than
23
in Equation (4) on Table 3 (the difference is significant p= 0.0111). While the coefficient on
LPBTD*PTBI is significantly smaller in Table 4, it is negative and significant, indicating that life
cycle only explains a portion of the existing relation. Overall, the results using the cash flow and
A&R models of life cycle partially support H3. Controlling for life cycle alters the negative
association between firm-years with large positive and large negative BTD and earnings
persistence.
INSERT TABLE 4 HERE
To further test the relation between life cycle stages, large book-tax differences, and
earnings persistence, in Table 5 I present Hanlon’s original BTD-persistence model [Equation (4)]
regressed on the sample partitioned by life cycle stage. If life cycle explains the less persistent
earnings associated with large BTD found in Hanlon (2005), I expect that partitioning the sample
by life cycle will result in insignificant coefficients across life cycle stages. Panel A presents the
results using the A&R model of life cycle, and Panel B presents the results using the cash flow
model. For both models of life cycle, I note that the coefficients on the interaction terms vary
across life cycle stage. I interpret the results on Table 5 panels A and B as supporting H3 and
documenting that the relation between LNBTD and LPBTD is related to firm life cycle. Similar to
the results on Table 4, I find that life cycle impacts the relation between BTD and earnings
persistence.
INSERT TABLE 5 HERE
Taken together, the results suggest that the reason book-tax differences are informative
about earnings persistence is that BTD captures life cycle phase.
Robustness
In my tests, I use two measures of life cycle, the cash flow model and the A&R measure

24
that relies on a five year ranking of sales growth, dividends, capital expenditures, and age. One
concern is that since these are researchers-constructed measures of life cycle, my results may be
driven by one particular component of the aggregate measure rather than by true life cycle. Thus, I
also consider the disaggregated components of the A&R measure. I test a ranking of firm-year
based on sales growth, or capital expenditures, or firm age. None of these measures alone captures
the same effect as the A&R model. My findings suggest that the aggregate measure employed by
A&R is more powerful than its individual components in capturing the life cycle stage of the firm.
Likewise, I also construct a measure based on cash flows from operations (the “earnings”
component of the cash flow life cycle measure) to examine whether the results from the cash flow
measure are dependent only on the cash flows from operations. Again, I find this abbreviated
measure does not yield informative results. Because the descriptive statistics in Table 1 indicate
size varies significantly and predictably across life cycle stage, I also test whether ranking firms
based on size impacts my results. I find that size significantly impacts earnings persistence, but
does not significantly impact the BTD-persistence tested in Equation (5). Lastly, to verify my
results are not a factor of dividing my sample, I also assign firms to life cycle stages randomly and
find the results do not support my hypotheses.
Earnings management and Tax Avoidance
Blaylock et al. (2012) conduct a similar analysis to investigate the results of Hanlon (2005)
within the large positive BTD group (LPBTD). Their analysis suggests that the lower earning
persistence identified within the LPBTD group is driven by firm-years with high levels of
discretionary accruals, an indication of possible earnings management. Both Kothari et al. (2005)
and Liu (2008) provide evidence that growth affects the interpretation of discretionary accrual
measures. Blaylock et al. (2012) construct a model of earnings persistence and interact current

25
earnings with EM and TAXAVOID, measures designed to capture whether the large BTD is likely a
result of earnings management or tax planning. In Table 6 I consider the findings documented in
Blaylock et al. (2012) controlling for the effect of life cycle on earnings persistence. Similar to my
other tests, I find that within the LPBTD group, controlling for life cycle affects the coefficient on
EM*PTBI (the persistence of earnings for firm-years associated with earnings management).
Thus, including life cycle in the model affects the interpretation of the results in Blaylock et al.
(2012). Further analysis using the measures in Blaylock et al. and life cycle together may help
highlight firms for which earnings management creates large positive BTD.
INSERT TABLE 6 HERE
Lastly, as noted above, Guenther (2011) examines the results in Hanlon (2005), by
examining “influential observations.” Using “data snooping” Guenther identifies 113 observations
driving the lower persistence in Hanlon’s study and identifies the characteristics of those
observations. He documents that Hanlon’s results do not hold once controls are added for those
factors such as high levels of special items, gains and losses, etc. In Table 7 I examine the relation
among the Guenther’s variables and identify where his measures vary significantly vary across life
cycle stages. The results in Table 7 indicate that Guenther’s findings capture some measure of life
cycle. Further analysis is needed to determine what other factors impact the BTD-persistence
relation.
INSERT TABLE 7 HERE
VI. Conclusions, limitations and future research
The purpose of my study is to examine whether life cycle explains the relation between
book-tax differences and earnings persistence. A number of prior studies find that the relation
between book and taxable income is informative about a firm’s future earnings. I rely on an
26
economic theory (firm life cycle) to explain these results. My hypothesis is that because a number
of factors explaining growth and decline are associated with transactions such as depreciation,
increasing (decreasing) accruals, and gains and losses, that the stage of a firm’s life cycle will be
associated with its BTD, and thus its future earnings.
My results indicate that the relation between BTD and earnings persistence varies by life
cycle, suggesting that life cycle at least partially explains the relation between BTD and earnings
persistence. In the case of large positive BTD, which is often identified as a signal of low earnings
quality or earnings management, life cycle captures some of the relation between BTD and
earnings persistence, suggesting that the relation between BTD and earnings management is more
complex and requires additional examination.
For firm-years with large negative BTD, I find that the decline phases of a firm’s life cycle
explain, to some extent, the lower earnings persistence found in this group. Other studies that
further examine the results in Hanlon (2005) (e.g. Blaylock et al. 2012) consider the large positive
BTD group only; I contribute to the literature by providing an explanation for the observed relation
between both large positive and large negative BTD and earnings persistence.
Finally, my results expand the findings in Blaylock et al. (2012) and Guenther (2011). Both
studies, similar to this one, seek to examine the results in Hanlon (2005) more closely. My study
further supports the findings in Guenther (2011) by offering a life cycle explanation for why the
influential observations he identifies impact the BTD-persistence relation. I also offer an
alternative explanation for the results in Blaylock et al. (2012) (who document that the lower
earnings persistence associated with LPBTD are driven by earnings management.)
I combine findings from the life cycle and tax literature to provide evidence that temporary
BTD vary across firm life cycle stage. Further examination may reveal that firm-years with BTD

27
contrary to magnitude and sign predicted by life cycle are early predictors of changes to future
earnings.
The next question to examine is how market participants incorporate life cycle and
book-tax differences into their expectations. Life cycle theory predicts that market participants
have different expectations and react differently to firm performance over the phases of the life
cycle. Given firm characteristics, both innate and those included in the construction of the life
cycle measures, I expect that the differing market expectations across firm life cycle will extend to
BTD. The life cycle literature has documented that investors value earnings, sales, cash flows and
accruals differently across life cycle stages. Because the existing tax literature supports the theory
that investors adjust their expectations of firm performance for years with large BTD, it is possible
that investors’ reaction is a function of their understanding of firm life cycle.
Lastly, my study addresses the question of why some firms appear to avoid more taxes than
others. If BTD vary by life cycle, it may be interesting to consider the findings in other tax studies
that examine the characteristics of firms that appear to avoid income taxes. For example, Higgins
et al. (2011) find that tax avoidance is related to a firm’s strategy of product differentiation or cost
minimization. Specifically, they find that firms focused on cost minimization are less likely to be
identified as avoiding taxes. Miller and Friesen (1984) identify that price cutting and low levels of
innovation are indicative of the decline phase. Based on a life cycle explanation, the cost
minimizing firms identified in Higgins et al. will have negative levels of BTD, and thus exhibit
low levels of tax avoidance. The results of my study suggest considering the information in BTD
in a life cycle framework may enhance our understanding of firm behavior.

28
REFERENCES
Aharony, J., H. Falk, and N. Yehuda. 2006. Corporate Life Cycle and the Relative
Value-Relevance of Cash Flow versus Accrual Financial Information: Working Paper, The
Technion-Israel Institute of Technology and Johnson Graduate School of Management,
Cornell University.
Ahmed, K., and M. Jinan. 2011. The association between research and development expenditure
and firm performance: testing a life cycle hypothesis. International Journal of Accounting,
Auditing and Performance Evaluation 7 (4):267-286.
Allen, E., C. Larson, and R. G. Sloan. 2009. Accrual reversals, earnings and stock returns:
Working paper, Washington University in St. Louis.
Anthony, J. H., and K. Ramesh. 1992. Association between accounting performance measures and
stock prices: A test of the life cycle hypothesis. Journal of Accounting and Economics 15
(2-3):203-227.
Ayers, B. C., J. X. Jiang, and S. K. Laplante. 2009. Taxable Income as a Performance Measure:
The Effects of Tax Planning and Earnings Quality. Contemporary Accounting Research 26
(1):15-54.
Ayers, B. C., S. K. Laplante, and S. T. McGuire. 2010. Credit Ratings and Taxes: The Effect of
Book–Tax Differences on Ratings Changes. Contemporary Accounting Research 27
(2):359-402.
Badertscher, B., J. Phillips, M. Pincus, and S. Rego. 2009. Earnings Management Strategies and
the Trade-Off between Tax Benefits and Detection Risk: To Conform or Not to Conform?
The Accounting Review 84 (1):63-97.
Bens, D., V. Nagar, and M. Wong. 2002. Real investment implications of employee stock option
exercises. Journal of Accounting Research 40 (2):359-393.
Black, E. 1998. Life-cycle impacts on the incremental value-relevance of earnings and cash flow
measures. Journal of Financial Statement Analysis 4:40-57.
Blaylock, B., T. Shevlin, and R. Wilson. 2012. Tax Avoidance, Large Positive Book-Tax
Differences and Earnings Persistence. The Accounting Review 87 (1):91-120.
Cazier, R., S. Rego, X. Tian, and R. Wilson. 2009. Early evidence on the determinants of
unrecognized tax benefits: Working paper, University of Iowa.
Chiang, S., P. Lee, and A. Anandarajan. 2011. The Influence of Corporate Governance on
Innovative Success: A Life Cycle Analysis: Working paper, Soowhow University.
Cloyd, B. 1995. The effects of financial accounting conformity on recommendations of tax
preparers. The Journal of the American Taxation Association 17 (2):50-70.
Comprix, J., R. Graham, and J. Moore. 2011. Empirical Evidence on the Impact of Book-Tax
Differences on Divergence of Opinion Among Investors. Journal of the American
Taxation Association 33 (1):51-78.
Coulton, J. J., and C. Ruddock. 2011. Corporate Payout Policy in Australia and a Test of the Life
Cycle Theory: Australian School of Business Research Paper No. 2010 ACCT 03.
DeAngelo, H., L. DeAngelo, and R. Stulz. 2006. Dividend policy and the earned/contributed
capital mix: a test of the life-cycle theory. Journal of Financial Economics 81 (2):227-254.
Dickinson, V. 2011. Cash Flow Patterns as a Proxy for Firm Life Cycle. The Accounting Review
86 (6):1969-1994.

29
Dyreng, S. D., M. Hanlon, and E. L. Maydew. 2008. Long-run corporate tax avoidance. The
Accounting Review 83 (1):61.
Fedyk, T., Z. Singer, and T. Sougiannis. 2011. Does the accrual anomaly end when abnormal
accruals reverse: Working paper, Arizona State University, McGill University and
University of Illinois at Urbana-Champaign.
Graham, J., J. Raedy, and D. Shackelford. 2010. Research in accounting for income taxes:
National Bureau of Economic Research Cambridge, Massachusetts.
Grullon, G., and R. Michaely. 2004. The information content of share repurchase programs. The
Journal of Finance 59 (2):651-680.
Guenther, D. A. 2011. What do we learn from large book-tax differences?: Working paper,
University of Oregon.
Hanlon, M. 2005. The Persistence and Pricing of Earnings, Accruals, and Cash Flows When Firms
Have Large Book-Tax Differences. The Accounting Review 80 (1):137-166.
Hanlon, M., and S. Heitzman. 2010. A review of tax research. Journal of Accounting and
Economics.
Higgins, D., T. Omer, and J. Phillips. 2011. Does a Firm's Business Strategy Influence its Level of
Tax Avoidance: Working paper, University of Connecticut.
Jackson, M. 2011. Book-Tax Differences and Earnings Growth: Working paper, University of
Nevada, Reno.
Jawahar, I., and G. McLaughlin. 2001. Toward a descriptive stakeholder theory: An organizational
life cycle approach. Academy of Management Review:397-414.
Jenkins, D., G. Kane, and U. Velury. 2004. The impact of the corporate life-cycle on the
value-relevance of disaggregated earnings components. Review of Accounting and Finance
3 (4):5-20.
Kothari, S., A. J. Leone, and C. E. Wasley. 2005. Performance matched discretionary accrual
measures. Journal of Accounting and Economics 39 (1):163-197.
Lev, B., and D. Nissim. 2004. Taxable income, future earnings, and equity values. The Accounting
Review 79 (4):1039-1074.
Liao, C. 2008. Incentive reward control: Based on the competitive advantage, transaction cost
economics and organizational life cycle viewpoint. Human Systems Management 27
(2):123-130.
Liu, M. 2008. Accruals and managerial operating decisions over the firm life cycle: Working
paper, Pennsylvania State University.
Miller, D., and P. Friesen. 1984. A longitudinal study of the corporate life cycle. Management
Science 30 (10):1161-1183.
Mills, L. 1998. Book-tax differences and Internal Revenue Service adjustments. Journal of
Accounting Research 36 (2):343-356.
Mueller, D. C. 1972. A life cycle theory of the firm. The Journal of Industrial Economics 20
(3):199-219.
Paprocki, C., and E. Schnee. 2004. The Trade-Off Between Tax Savings and Financial Reporting
Costs: An Analysis of the Effective Tax Rates of Glamour Companies: Working paper,
University of Alabama.
Pashley, M., and G. Philippatos. 1990. Voluntary divestitures and corporate life-cycle: some
empirical evidence. Applied Economics 22 (9):1181-1196.

30
Poterba, J. M., N. Rao, and J. Seidman. 2010. Deferred tax positions and incentives for corporate
behavior around corporate tax changes: Working paper, Massachusetts Institute of
Technology.
Raedy, J., J. Seidman, and D. Shackelford. 2011. Is there information content in the tax footnote:
Working paper, University of North Carolina.
Ramaswamy, V., J. C. Ueng, and L. Carl. 2007. Corporate governance characteristics of growth
companies: An empirical study. Academy of Accounting and Financial Studies 12 (1):71.
Seidman, J. K. 2010. Interpreting fluctuations in the book-tax income gap as tax sheltering:
Alternative explanations: Working paper, University of Texas.
Shyu, J., and Y. Chen. 2009. Diversification, Performance, and the Corporate Life Cycle.
Emerging Markets Finance and Trade 45 (6):57-68.
Spence, A. M. 1979. Investment strategy and growth in a new market. The Bell Journal of
Economics:1-19.
Spilker, B., B. Ayers, J. Robinson, E. Outslay, R. Worsham, J. Barrick, and C. Weaver. 2010.
Taxation of Business Entities: 2010 edition: McGraw-Hill/Irwin, New York, NY.
Wilson, R. J. 2009. An Examination of Corporate Tax Shelter Participants. The Accounting
Review 84 (3):969-999.
Xu, B. 2007. Life cycle effect on the value relevance of common risk factors. Review of
Accounting and Finance 6 (2):162-175.
Yu, Y., and S. Jiang. 2010. Corporate life cycle and share repurchases: Evidence from the Taiwan
Stock Market. African Journal of Business Management 4 (14):3139-3148.

31
Appendix A - Book-Tax Differences
Book-tax
Differences
Source of Positive BTD (PBTD)15
Source of Negative BTD (NBTD)
Property, plant &
equipment
In general, GAAP requires depreciating assets
over the estimated useful life. Tax rules allow
for accelerated depreciation over established lives
Tax depreciation expense > book depreciation expense
(young assets and/or increasing acquisitions)
Book depreciation expense > tax depreciation expense (aged assets
not being replaced)
Tax gain > book gain (disposing of assets with excess tax accumulated
depreciation over book depreciation)
Revenues In general, GAAP requires recognizing
revenues when earned, tax requires recognition when received.
Installment sale revenue recognized at transaction date,
revenues not recognized for tax purposes until received.
Subsequent recognition for GAAP of revenues received
but not earned, recognized for tax purposes upon receipt.
Subsequent receipt of installment sale revenues recognized for tax
purposes, previously recognized for GAAP.
Revenues received in advance recognized for tax purposes when
received (i.e. subscription revenues), recognized when earned for GAAP.
Inventory In general, GAAP requires matching of costs of
inventory with sales revenue. IRS rules require capitalization of additional indirect costs
(“UNICAP”). Firms may use different cost
flow methods under both reporting systems.
Current year increase in tax inventory > current year
increase in book inventory
Inventory growth
Current year change in book inventory < change in tax inventory
Inventory decline
Bad debts
GAAP requires estimating a reserve for uncollectable accounts to match revenues and
expenses. Tax allows a deduction only once the
account is written off.
Write off of bad debts > Allowance Increase (sales decreasing)
Allowance increase >write off of bad debts (sales increasing)
Warranty reserve GAAP requires recording an estimate of future
warranty expenses as a liability at the time of
sale (matching). Tax allows a deduction of
expenses only once they have been incurred.
Actual warranty expenditures > estimated warranty
expense
(sales decreasing, estimated warranty reserve decreasing)
Estimated warranty expense > actual warranty expenditures (sales
increasing and/or estimated warranty increasing)
Goodwill Goodwill from asset acquisition is amortized
for tax purposes over a 15 year life. Goodwill
for GAAP is tested annually for impairment and adjusted downward in the event
impairment is identified.
Tax amortization expense>GAAP impairment GAAP impairment > tax amortization
These BTD were selected from Poterba et al. (2010) and Raedy et al. (2011) who examine the information content of tax footnote disclosures and tabulate the temporary differences reported in the Schedule
of Deferred Tax Positions of the Fortune 250 firms from 1993 through 2007.
15 Spilker et al. (2010) refer to positive BTD as “favorable” and negative BTD as “unfavorable,” referring to the impact on earnings reported for income tax purposes.

32
Appendix B – Characteristics of Life Cycle Phases and Expectations of Book-Tax Differences
Life cycle phase Characteristics of phase
Book-tax differences
Expectation
Persistence expectation
Introduction
(Early Growth)
(most studies ignore this
phase as it is considered to
be the time before going public)
Operations/Strategy
o Little positive earnings or positive cash flows (Black 1998)
Investing
o Innovation (Miller and Friesen 1984)
o Few assets in place (Black 1998; Aharony et al. 2006) o R&D investment (Black 1998)
Financing o Stockholders demand returns greater than market for uncertainty (Mueller 1972)
o ESO granted (Bens et al. 2002)
o Cash constraint (Black 1998) o Low dividends (Black 1998)
o Contributed capital/total equity high (DeAngelo et al. 2006)
o Reinvest profits and raise additional capital (Mueller 1972)
Valuation
o Value of the firm based on growth opportunities (Black 1998)
Loss, NOLs
Possible TI>NI, or NI>TI as move into growth phase.
Variation in persistence
(strong firms survive)
Earnings less likely to persist
because of changes in assets in
place (Black 1998)
Growth (Late Growth)
Operations/Strategy o Firm complexity increases (Liao 2008)
o Increases in accounts receivable and inventory (Liu 2008) o Large positive accruals (Liu 2008)
o Growth pursued at the expense of stockholder welfare (Mueller 1972)
o Growing organizational complexity (Mueller 1972) o High sales growth (Black 1998)
o Product differentiation (Jenkins et al. 2004)
o Rapid growth and technological innovation (Chiang et al. 2011) o Rapid and accelerating growth in sales (Spence 1979)
Investing
o Firm has many positive NPV projects available (Grullon and Michaely 2004) o Innovation (Miller and Friesen 1984)
o High capital expenditures (Black 1998) o High levels of investment (Spence 1979)
Financing
o Incentive based compensation plans (Liao 2008) o ESO issued/granted (Bens et al. 2002)
o Low dividends (Black 1998)
Valuation o Cash flows more value relevant (Aharony et al. 2006)
o Value of firm based on growth and growth opportunities more so than assets in place
(Black 1998)
o Earnings related to changes in assets in place (Black 1998)
o Earnings less likely to persist (Black 1998) o Performance more informative for pricing than risk factors (Xu 2007)
NI > TI (LPBTD)
Firms focus on sales more than profitability (Aharony et al.
2006; Black 1998)
Maturity Operations/Strategy
o Net income persists because of assets in place (Black 1998) o Profitability maximized (Black 1998; Dickinson 2011)
o Cost minimization strategy (Jenkins et al. 2004)
NI > TI
(PBTD) decreasing across phase
As NI >TI decreases, move into
Earnings persistence expected
to be highest in maturity
(Dickinson 2011)

33
o Low growth (Black 1998)
o Sales levels stabilize (Chiang et al. 2011)
Investing o Fewer investment opportunities leads to excess cash (Aharony et al. 2006; Yu and
Jiang 2010) o Less new innovations (Chiang et al. 2011)
o Depreciation may suffice to finance asset replacement and maintenance. (Aharony et
al. 2006)
Financing
o Excess cash leads to repurchases (Grullon and Michaely 2004; Yu and Jiang 2010) o Firms service debt and distribute cash to shareholders (Dickinson 2011)
o High levels of retained earnings lead to increased dividends and share repurchases
(Coulton and Ruddock 2011)
Valuation
o Related diversification increases firm value, unrelated diversification erodes firm
value (Shyu and Chen 2009) o Beta and leverage risk factors priced (Xu 2007)
o Decrease in risk results from a decrease in cost of capital and a decrease in growth options (Grullon and Michaely 2004)
o Value of firm based more on assets in place (Black 1998)
o High levels of market value of equity and book value of equity (Black 1998)
shakeout/decline.
Shake-out/ revival (Early Decline)
Operations/Strategy o Large firms with organizational complexity and inefficient information flow, leading
to increased uncertainty and decreased profitability. (Mueller 1972) o Cost minimization and focus on operational efficiencies (Jenkins et al. 2004)
o New management may be brought in and new markets and products explored
(Ramaswamy et al. 2007)
Investing
o Declining innovations (Mueller 1972)
o Firms divest to remove less profitable operations, resulting in increased profitability and decreased debt levels (Pashley and Philippatos 1990)
o Firms can regenerate by investing in new technology (Black 1998)
Financing o Increasing share of profits distributed to shareholders (Mueller 1972)
o Increased repurchases and dividends. (Coulton and Ruddock 2011)
Valuation
o Risk factors priced (Xu 2007)
Tax planning may be more important in this phase due to cash
constraints
Likely move from NI>TI to
TI>NI
As the relation between TI and NI
changes, the information content
of book-tax differences will
change
If TI>NI not true, decline may not
persist.
Earnings expected to be less persistent for firms in decline.
Anticipate variation in
persistence (strong firms revert to growth/maturity, weak
decline further)
Decline (Late Decline)
Operations/Strategy o Inflexible firms recommit to prior strategy (Liao 2008)
o Inventory write down and write off of uncollectible receivables (Liu 2008) o Large negative accruals (Liu 2008)
o Price cutting (Miller and Friesen 1984)
o Low earnings, low profit margins (Black 1998)
Investing
o Low levels of innovation (Miller and Friesen 1984)
Financing o Low dividend payout (Black 1998)
Valuation o Probability of liquidation high (Black 1998)
TI > NI (LNBTD)
Should indicate lack of persistence of earnings.
If TI>NI not true, decline may not persist.
Tax planning may be more important in this phase due to cash
constraints
Lowest level of persistence.

34
Appendix C Life Cycle Measures
1. Following Anthony and Ramesh (1992)
Anthony and Ramesh use four classification variables
1. Dividend as a percentage of net income
2. Percentage sales growth
3. Capital expenditure as a percentage of the total value of the firm16
4. Aget from founding dates from Jay Ritter website.17
IBEDt = income before extraordinary items and discontinued operations in year t
Salest = net sales in year t
CEt = capital expenditures in year t (CAPX)
16
Anthony and Ramesh (1992) exclude CEV from their measure because for their time frame that variable is poorly populated. I include it in my calculations,
however, excluding CEV does not impact the inferences of my results. 17
bear.warrington.ufl.edu/ritter/foundingdates.htm

35
VALUEt = market value of equity plus book value of long-term debt at the end of year t (DLTT)
For each of the firm-year, the median value of the prior five years is calculated for each of the financial variables.
For each variable, the median measure is ranked into low, medium and high based on the following table:
Life Cycle Stage (score) DP SG CEV AGE
Growth (1) Low High High Young
Mature (2) Medium Medium Medium Adult
Stagnant (3) High Low Low Old
Each firm-year is then assigned a score based on each variable (low DP = 1, Old age = 3). Using a composite score, firm-year
observations are assigned to five groups – Growth, Growth/Mature, Mature, Mature/Stagnant, and Stagnant.
2. Following Dickinson (2011)
Dickinson (2011) models life cycle stage based on the sign of the three components of the cash flow statement.
Introduction Growth Mature Shakeout Shakeout Shakeout Decline Decline
Cash flows from operating activities - + + - + + - -
Cash flows from investing activities - - - - + + + +
Cash flows from financing activities + + - - + - + -
36
TABLE 1
Descriptive Statistics for the Full Sample, by Life Cycle Stages, and by BTD Classifications
Panel A Full Sample Panel B
n = 21,453 Partitioned by Cash Flow Life Cycle Stage
Variable mean median std. dev. Variable Introduction Growth Maturity Shakeout Decline
n 1339 7646 10527 1622 319
% total n 6.2% 35.6% 49.1% 7.6% 1.5%
PTBI 273.95 27.219 1616.65 PTBI 67.21 244.437 455.790 248.095 106.092
PTBI_AVGAT (t) 0.129 0.107 0.117 PTBI_AVGAT (t) 0.095 0.123 0.134 0.122 0.168
PTBI_AVGAT (t+1) 0.095 0.093 0.144 PTBI_AVGAT (t+1) 0.034 0.086 0.113 0.088 0.011
PERSISTENCE
(PTBIt+1/PTBI) 0.670 0.924 12.585
PERSISTENCE
(PTBIt+1/PTBI) -0.643 0.791 0.829 0.317 -0.487
SIZE 5.755 5.656 1.937 SIZE 5.068 5.958 6.042 5.601 4.967
PTCF_AVGAT 0.153 0.142 0.117 PTCF_AVGAT -0.032 0.153 0.185 0.131 -0.036
PTACC_AVGAT -0.024 -0.034 0.112 PTACC_AVGAT 0.128 -0.031 -0.051 -0.009 0.204
CASH ETR 0.304 0.286 1.317 CASH ETR 0.321 0.270 0.290 0.344 0.583
GAAP ETR 0.364 0.370 1.353 GAAP ETR 0.364 0.365 0.346 0.333 0.232
SALES 2667.56 339.98 12315.43 SALES 1014.82 2371.63 3958.85 2128.05 1452.90
SALES GROWTH 26.119 11.792 660.863 SALES GROWTH 143.45 27.029 15.038 15.262 21.388
LEVERAGE 0.158 0.116 0.177 LEVERAGE 0.173 0.170 0.145 0.125 0.126
BTD 18.018 0.234 358.085 BTD 2.62 14.830 28.494 -8.040 43.395
BTD_AVGAT † 3.075 2.599 89.054 BTD_AVGAT† -5.874 3.576 3.512 -1.080 38.109
ROA 0.129 0.108 0.117 ROA 0.095 0.123 0.135 0.122 0.168
DISCRETIONARY ACCRUALS
0.0230 0.0093 0.339 DISCRETIONARY
ACCRUALS 0.088 0.032 0.012 0.041 0.054
5 YR CASH ETR 0.289 0.308 0.208 5 YR CASH ETR 0.251 0.264 0.309 0.295 0.274
AGE 18.988 14.000 14.202 AGE 15.035 17.254 22.615 21.238 19.969
BTM 0.814 0.480 34.573 BTM 0.811 0.374 1.034 0.681 0.905
DEBT/EQUITY 0.369 0.199 9.408 DEBT/EQUITY 0.546 0.483 0.238 0.259 0.629
% LNBTD 11% 10% 23% 30% 26%
% LPBTD 23% 33% 19% 14% 11%

37
Panel C Panel D
Partitioned by Anthony and Ramesh (1992) Life Cycle Stage Partitioned by Large positive and large negative BTD
Variable Growth Growth/
Maturity Maturity
Maturity/
Stagnant Stagnant
Variable LPBTD Small BTD LNBTD
n 1699 2968 4590 5238 6958 n 4287 12881 4285
% total n 7.9% 13.8% 21.4% 24.5% 32.4% % total n 20% 60% 20%
PTBI 97.208 118.826 338.188 307.710 495.733 PTBI 354.031 367.709 238.386
PTBI_AVGAT (t) 0.131 0.134 0.129 0.119 0.130 PTBI_AVGAT (t) 0.142 0.118 0.141
PTBI_AVGAT (t+1) 0.088 0.087 0.090 0.092 0.110 PTBI_AVGAT
(t+1) 0.094 0.094 0.106
PERSISTENCE (PTBIt+1/PTBI)
0.276 0.344 0.390 0.942 0.935 PERSISTENCE
(PTBIt+1/PTBI) 0.574 0.679 0.842
SIZE 5.618 5.788 5.827 5.947 6.064 SIZE 5.913 6.016 5.608
PTCF_AVGAT 0.167 0.161 0.155 0.150 0.154 PTCF_AVGAT 0.165 0.146 0.173
PTACC_AVGAT -0.036 -0.028 -0.026 -0.031 -0.024 PTACC_AVGAT -0.023 -0.028 -0.032
CASH ETR 0.225 0.283 0.277 0.313 0.313 CASH ETR 0.183 0.314 0.335
GAAP ETR 0.292 0.368 0.363 0.375 0.341 GAAP ETR 0.401 0.392 0.188
SALES 974.489 1382.11 2949.37 3292.33 4226.02 SALES 2642.64 3593.96 2130.35
SALES GROWTH 140.27 34.523 23.375 11.955 5.978 SALES GROWTH 23.539 25.894 24.926
LEVERAGE 0.155 0.151 0.159 0.164 0.144 LEVERAGE 0.179 0.157 0.120
BTD 9.548 7.732 22.199 35.098 14.839 BTD 136.612 18.351 -88.841
BTD_AVGAT † 2.548 1.596 2.723 3.702 3.195 BTD_AVGAT † 64.101 3.282 -59.873
ROA 0.132 0.135 0.130 0.120 0.131 ROA 0.143 0.119 0.142
DISCRETIONARY
ACCRUALS -0.002 0.025 0.021 0.035 0.031
DISCRETIONARY
ACCRUALS 0.244 0.024 0.035
5 YR CASH ETR 0.196 0.246 0.260 0.294 0.338 5 YR CASH ETR 0.008 0.307 0.281
AGE 6.717 9.732 14.475 22.033 30.083 AGE 19.577 21.065 18.072
BTM 0.571 0.559 0.487 0.622 1.513 BTM 2.232 0.611 0.293
DEBT/EQUITY 0.434 0.207 0.282 0.360 0.422 DEBT/EQUITY 0.479 0.402 0.080
% LNBTD 17% 18% 21% 21% 23%
% LPBTD 23% 28% 19% 14% 16%
Variable Definitions
Bold font indicates the difference between group is significant at p=0.05 or smaller
† Multiplied by 1,000 for descriptive statistics
ARSTAGE = life cycle stage as defined by Anthony and Ramesh (1992)

38
CFSTAGE = life cycle stage based on cash flow components as defined by Dickinson (2011)
LC = life cycle stage
PTBI = Pre-tax book income (PI)
PTBI t+1 = Pre-tax book income (PI) in year t+1, scaled by average assets
PTBI t = Pre-tax book income (PI) in year t, scaled by average assets
PTCF = Pre-tax cash flows (OANCF+TXPD-XIDOC) in year t, scaled by average assets
PTACC = Pre-tax accruals (PTBI-PTCF) in year t, scaled by average assets
EM = Indicator variable equal to 1 for firm-year observations with modified Jones Model discretionary accruals in the top quintile of all
firm-years in the sample
TAXAVOID = Indicator variable equal to 1 for firm -year observations with a five-year cash effective tax rate (see Dyreng et al. 2008) in the lowest
quintile of all firm-years in the sample
Persistence = PTBI t+1/PTBI t
size = natural log of assets
Cash ETR = as defined by Dyreng et al. (2008) cash taxes paid divided by pre-tax income less special items TXPD/(PI-SPI)
GAAP ETR = as defined by Dyreng et al. (2008) tax expense divided by pre-tax income TXT/PI
sales = total sales (SALE)
sales growth = change in sales = (sales t - sales t-1)/sales t-1
leverage = long-term debt scaled by total assets DLTT/AT
BTD = temporary differences between book and tax as defined in Hanlon (2005) as sum of federal and foreign deferred tax expense grossed up by the
statutory tax rate (35%) = (TXDFO+TXDFED)/.35
BTD_avgat = BTD scaled by average assets
ROA = Net income scaled by average assets
Discretionary
accruals
= modified Jones model discretionary accruals
5 YR Cash
ETR
= as defined in Dyreng et al. (2008) = sum 5 years cash taxes paid / sum 5 years pre-tax income less special items
Age = firm age calculated as current year less founding year from Jay Ritter web site (bear.warrington.ufl.edu/ritter/foundingdates.htm);
BTM = ratio of a firm's book value of equity to its market value of equity at time t (SEQ/(PRCC_F*CSHO)
Debt/Equity = Ratio of long-term debt (DLTT) to equity (SEQ)
% LNBTD % of the sample that is in the lowest quintile of annual scaled BTD
% LPBTD % of the sample that is in the highest quintile of annual scaled BTD
All continuous variables are winsorized at 1% and 99%.
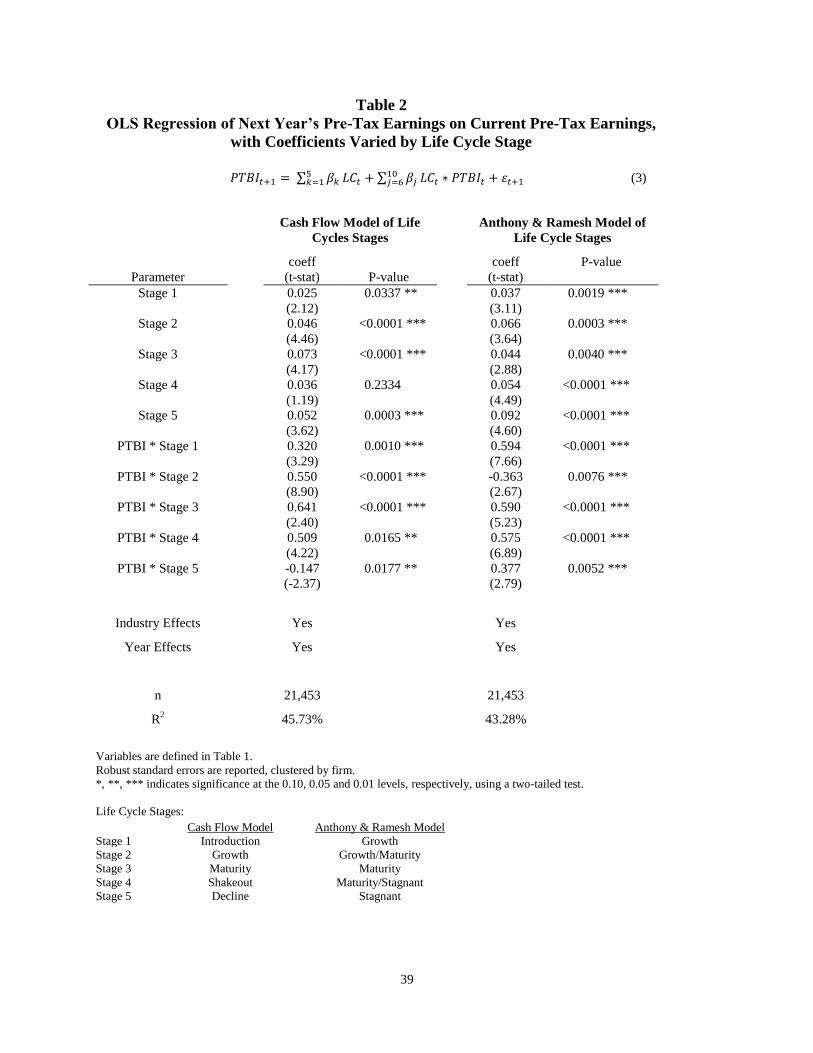
39
Table 2
OLS Regression of Next Year’s Pre-Tax Earnings on Current Pre-Tax Earnings,
with Coefficients Varied by Life Cycle Stage
(3)
Cash Flow Model of Life
Cycles Stages
Anthony & Ramesh Model of
Life Cycle Stages
Parameter
coeff
(t-stat) P-value
coeff
(t-stat)
P-value
Stage 1 0.025
(2.12)
0.0337 ** 0.037
(3.11)
0.0019 ***
Stage 2 0.046
(4.46)
<0.0001 *** 0.066
(3.64)
0.0003 ***
Stage 3 0.073
(4.17)
<0.0001 *** 0.044
(2.88)
0.0040 ***
Stage 4 0.036
(1.19)
0.2334 0.054
(4.49)
<0.0001 ***
Stage 5 0.052
(3.62)
0.0003 *** 0.092
(4.60)
<0.0001 ***
PTBI * Stage 1 0.320
(3.29)
0.0010 *** 0.594
(7.66)
<0.0001 ***
PTBI * Stage 2 0.550
(8.90)
<0.0001 *** -0.363
(2.67)
0.0076 ***
PTBI * Stage 3 0.641
(2.40)
<0.0001 *** 0.590
(5.23)
<0.0001 ***
PTBI * Stage 4 0.509
(4.22)
0.0165 ** 0.575
(6.89)
<0.0001 ***
PTBI * Stage 5 -0.147
(-2.37)
0.0177 ** 0.377
(2.79)
0.0052 ***
Industry Effects Yes Yes
Year Effects Yes Yes
n 21,453 21,453
R2 45.73% 43.28%
Variables are defined in Table 1.
Robust standard errors are reported, clustered by firm.
*, **, *** indicates significance at the 0.10, 0.05 and 0.01 levels, respectively, using a two-tailed test.
Life Cycle Stages:
Cash Flow Model Anthony & Ramesh Model
Stage 1 Introduction Growth
Stage 2 Growth Growth/Maturity
Stage 3 Maturity Maturity
Stage 4 Shakeout Maturity/Stagnant
Stage 5 Decline Stagnant

40
Table 3
Replication of Hanlon (2005) OLS Regression of Next Year’s Pre-Tax
Earnings on Current Pre-Tax Earnings, with Coefficients Varied by
Large Positive and Large Negative BTD
(4)
Parameter
coeff
(t-stat)
P-value
Intercept 0.012
(1.64)
0.1008 **
LNBTD 0.041
(2.18)
0.0296 **
LPBTD 0.028
(1.45)
0.1464
PTBI 0.671
(10.28)
<0.0001 ***
PTBI*LNBTD -0.307
(-2.22)
0.0267 **
PTBI*LPBTD -0.321
(-2.18)
0.0296 **
Industry Effects Yes
Year Effects Yes
n 21,453
R2 17.05%
Variables are defined in Table 1.
Robust standard errors are reported, clustered by firm.
*, **, *** indicates significance at the 0.10, 0.05 and 0.01 levels, respectively, using a two-tailed test.
.

41
Table 4
OLS Regression of Next Year’s Pre-Tax Earnings on Current Pre-Tax Earnings,
with Coefficients Varied by Life Cycle Stage and
Large Positive and Large Negative BTD
(5)
Cash Flow Model of Life
Cycles Stages
Anthony & Ramesh Model of
Life Cycle Stages
Parameter
coeff
(t-stat) P-value
coeff
(t-stat)
P-value
LNBTD 0.040
(2.25)
0.0245 ** 0.040
(2.72)
0.0066 ***
LPBTD 0.004
(0.20)
0.8385 0.028
(1.65)
0.0984 *
Stage 1 0.015
(1.14)
0.2557 0.019
(1.49)
0.1352
Stage 2 0.036
(2.62)
0.0089 *** 0.045
(2.93)
0.0034 ***
Stage 3 0.058
(4.61)
<0.0001 *** 0.023
(1.67)
0.0952 *
Stage 4 0.020
(0.71)
0.4759 0.042
(2.86)
0.0042 ***
Stage 5 0.039
(2.19)
0.0283 ** 0.070
(4.54)
<0.0001 ***
LNBTD * PTBI -0.280
(-0.07)
0.0373 ** -0.289
(-2.56)
0.1050
LPBTD * PTBI -0.118
(-0.41)
0.4397 -0.297
(-2.28)
0.0227 **
PTBI * Stage 1 0.429
(3.88)
0.0001 *** 0.777
(8.93)
<0.0001 ***
PTBI * Stage 2 0.662
(6.55)
<0.0001 *** 0.555
(4.75)
<0.0001 ***
PTBI * Stage 3 0.792
(3.21)
0.0013 *** 0.786
(7.69)
<0.0001 ***
PTBI * Stage 4 0.649
(7.78)
<0.0001 *** 0.691
(5.98)
<0.0001 ***
PTBI * Stage 5 -0.010
(-0.09)
0.9316 0.567
(5.47)
<0.0001 ***
Industry Effects Yes Yes
Year Effects Yes Yes
n 21,453 21,453
R2 46.46% 44.23%
Variables are defined in Table 1.
Robust standard errors are reported, clustered by firm.
*, **, *** indicates significance at the 0.10, 0.05 and 0.01 levels, respectively, using a two-tailed test.

42
Life Cycle Stages:
Cash Flow Model Anthony & Ramesh Model
Stage 1 Introduction Growth
Stage 2 Growth Growth/Maturity
Stage 3 Maturity Maturity
Stage 4 Shakeout Maturity/Stagnant
Stage 5 Decline Stagnant
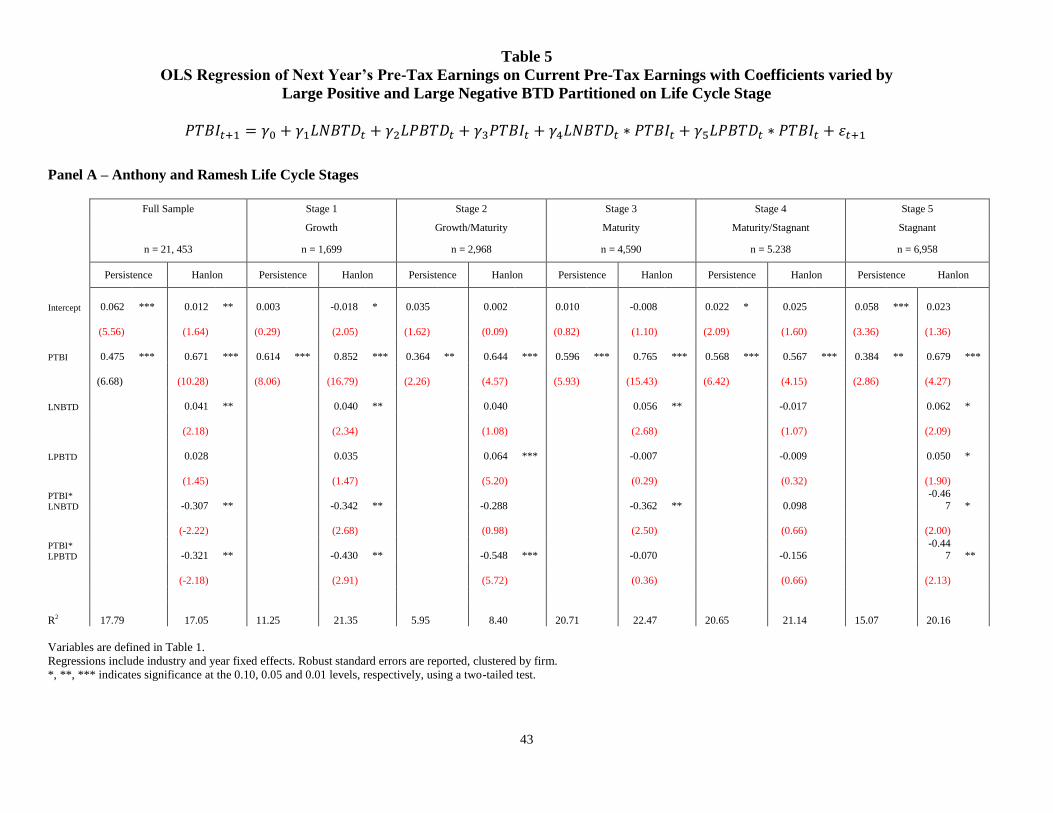
43
Table 5
OLS Regression of Next Year’s Pre-Tax Earnings on Current Pre-Tax Earnings with Coefficients varied by
Large Positive and Large Negative BTD Partitioned on Life Cycle Stage
Panel A – Anthony and Ramesh Life Cycle Stages
Full Sample Stage 1 Stage 2 Stage 3 Stage 4 Stage 5
Growth Growth/Maturity Maturity Maturity/Stagnant Stagnant
n = 21, 453 n = 1,699 n = 2,968 n = 4,590 n = 5.238 n = 6,958
Persistence Hanlon Persistence Hanlon Persistence Hanlon Persistence Hanlon Persistence Hanlon Persistence Hanlon
Intercept 0.062 *** 0.012 ** 0.003 -0.018 * 0.035 0.002 0.010 -0.008 0.022 * 0.025 0.058 *** 0.023
(5.56) (1.64) (0.29) (2.05) (1.62) (0.09) (0.82) (1.10) (2.09) (1.60) (3.36) (1.36)
PTBI 0.475 *** 0.671 *** 0.614 *** 0.852 *** 0.364 ** 0.644 *** 0.596 *** 0.765 *** 0.568 *** 0.567 *** 0.384 ** 0.679 ***
(6.68) (10.28) (8.06) (16.79) (2.26) (4.57) (5.93) (15.43) (6.42) (4.15) (2.86) (4.27)
LNBTD 0.041 ** 0.040 ** 0.040 0.056 ** -0.017 0.062 *
(2.18) (2.34) (1.08) (2.68) (1.07) (2.09)
LPBTD 0.028 0.035 0.064 *** -0.007 -0.009 0.050 *
(1.45) (1.47) (5.20) (0.29) (0.32) (1.90)
PTBI*
LNBTD -0.307 ** -0.342 ** -0.288 -0.362 ** 0.098
-0.46
7 *
(-2.22) (2.68) (0.98) (2.50) (0.66) (2.00)
PTBI*
LPBTD -0.321 ** -0.430 ** -0.548 *** -0.070 -0.156 -0.44
7 **
(-2.18) (2.91) (5.72) (0.36) (0.66) (2.13)
R2 17.79 17.05 11.25 21.35 5.95 8.40 20.71 22.47 20.65 21.14 15.07 20.16
Variables are defined in Table 1.
Regressions include industry and year fixed effects. Robust standard errors are reported, clustered by firm.
*, **, *** indicates significance at the 0.10, 0.05 and 0.01 levels, respectively, using a two-tailed test.
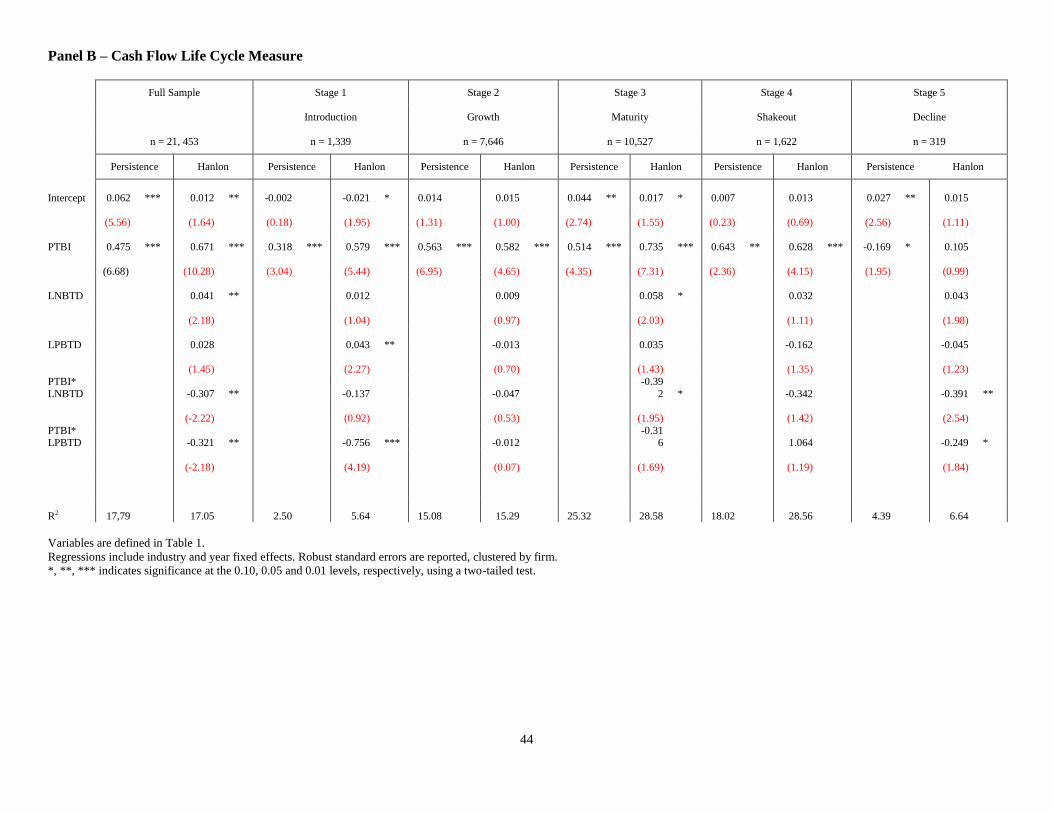
44
Panel B – Cash Flow Life Cycle Measure
Full Sample Stage 1 Stage 2 Stage 3 Stage 4 Stage 5
Introduction Growth Maturity Shakeout Decline
n = 21, 453 n = 1,339 n = 7,646 n = 10,527 n = 1,622 n = 319
Persistence Hanlon Persistence Hanlon Persistence Hanlon Persistence Hanlon Persistence Hanlon Persistence Hanlon
Intercept 0.062 *** 0.012 ** -0.002 -0.021 * 0.014 0.015 0.044 ** 0.017 * 0.007 0.013 0.027 ** 0.015
(5.56) (1.64) (0.18) (1.95) (1.31) (1.00) (2.74) (1.55) (0.23) (0.69) (2.56) (1.11)
PTBI 0.475 *** 0.671 *** 0.318 *** 0.579 *** 0.563 *** 0.582 *** 0.514 *** 0.735 *** 0.643 ** 0.628 *** -0.169 * 0.105
(6.68) (10.28) (3.04) (5.44) (6.95) (4.65) (4.35) (7.31) (2.36) (4.15) (1.95) (0.99)
LNBTD 0.041 ** 0.012 0.009 0.058 * 0.032 0.043
(2.18) (1.04) (0.97) (2.03) (1.11) (1.98)
LPBTD 0.028 0.043 ** -0.013 0.035 -0.162 -0.045
(1.45) (2.27) (0.70) (1.43) (1.35) (1.23)
PTBI*
LNBTD -0.307 ** -0.137 -0.047
-0.39
2 * -0.342 -0.391 **
(-2.22) (0.92) (0.53) (1.95) (1.42) (2.54)
PTBI*
LPBTD -0.321 ** -0.756 *** -0.012
-0.31
6 1.064 -0.249 *
(-2.18) (4.19) (0.07) (1.69) (1.19) (1.84)
R2 17,79 17.05 2.50 5.64 15.08 15.29 25.32 28.58 18.02 28.56 4.39 6.64
Variables are defined in Table 1.
Regressions include industry and year fixed effects. Robust standard errors are reported, clustered by firm.
*, **, *** indicates significance at the 0.10, 0.05 and 0.01 levels, respectively, using a two-tailed test.
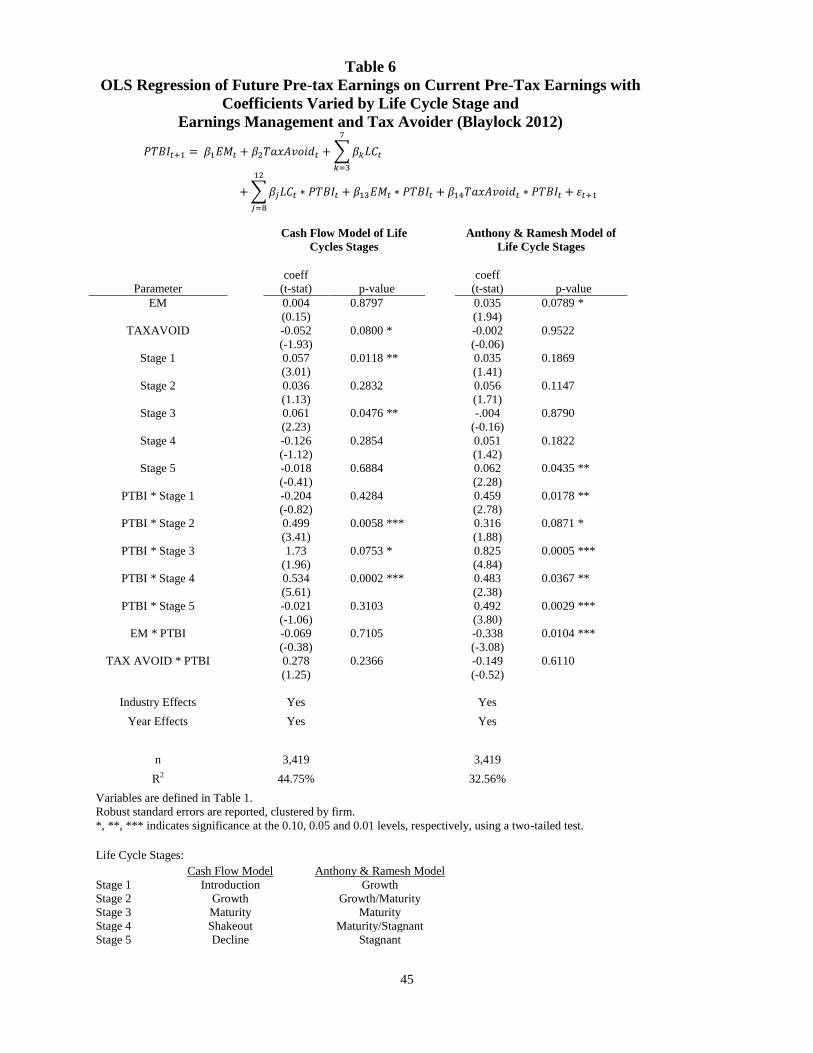
45
Table 6
OLS Regression of Future Pre-tax Earnings on Current Pre-Tax Earnings with
Coefficients Varied by Life Cycle Stage and
Earnings Management and Tax Avoider (Blaylock 2012)
Cash Flow Model of Life
Cycles Stages
Anthony & Ramesh Model of
Life Cycle Stages
Parameter
coeff
(t-stat) p-value
coeff
(t-stat) p-value
EM 0.004
(0.15)
0.8797 0.035
(1.94)
0.0789 *
TAXAVOID -0.052
(-1.93)
0.0800 * -0.002
(-0.06)
0.9522
Stage 1 0.057
(3.01)
0.0118 ** 0.035
(1.41)
0.1869
Stage 2 0.036
(1.13)
0.2832 0.056
(1.71)
0.1147
Stage 3 0.061
(2.23)
0.0476 ** -.004
(-0.16)
0.8790
Stage 4 -0.126
(-1.12)
0.2854 0.051
(1.42)
0.1822
Stage 5 -0.018
(-0.41)
0.6884 0.062
(2.28)
0.0435 **
PTBI * Stage 1 -0.204
(-0.82)
0.4284 0.459
(2.78)
0.0178 **
PTBI * Stage 2 0.499
(3.41)
0.0058 *** 0.316
(1.88)
0.0871 *
PTBI * Stage 3 1.73
(1.96)
0.0753 * 0.825
(4.84)
0.0005 ***
PTBI * Stage 4 0.534
(5.61)
0.0002 *** 0.483
(2.38)
0.0367 **
PTBI * Stage 5 -0.021
(-1.06)
0.3103 0.492
(3.80)
0.0029 ***
EM * PTBI -0.069
(-0.38)
0.7105 -0.338
(-3.08)
0.0104 ***
TAX AVOID * PTBI 0.278
(1.25)
0.2366 -0.149
(-0.52)
0.6110
Industry Effects Yes Yes
Year Effects Yes Yes
n 3,419 3,419
R2 44.75% 32.56%
Variables are defined in Table 1.
Robust standard errors are reported, clustered by firm.
*, **, *** indicates significance at the 0.10, 0.05 and 0.01 levels, respectively, using a two-tailed test.
Life Cycle Stages:
Cash Flow Model Anthony & Ramesh Model
Stage 1 Introduction Growth
Stage 2 Growth Growth/Maturity
Stage 3 Maturity Maturity
Stage 4 Shakeout Maturity/Stagnant
Stage 5 Decline Stagnant
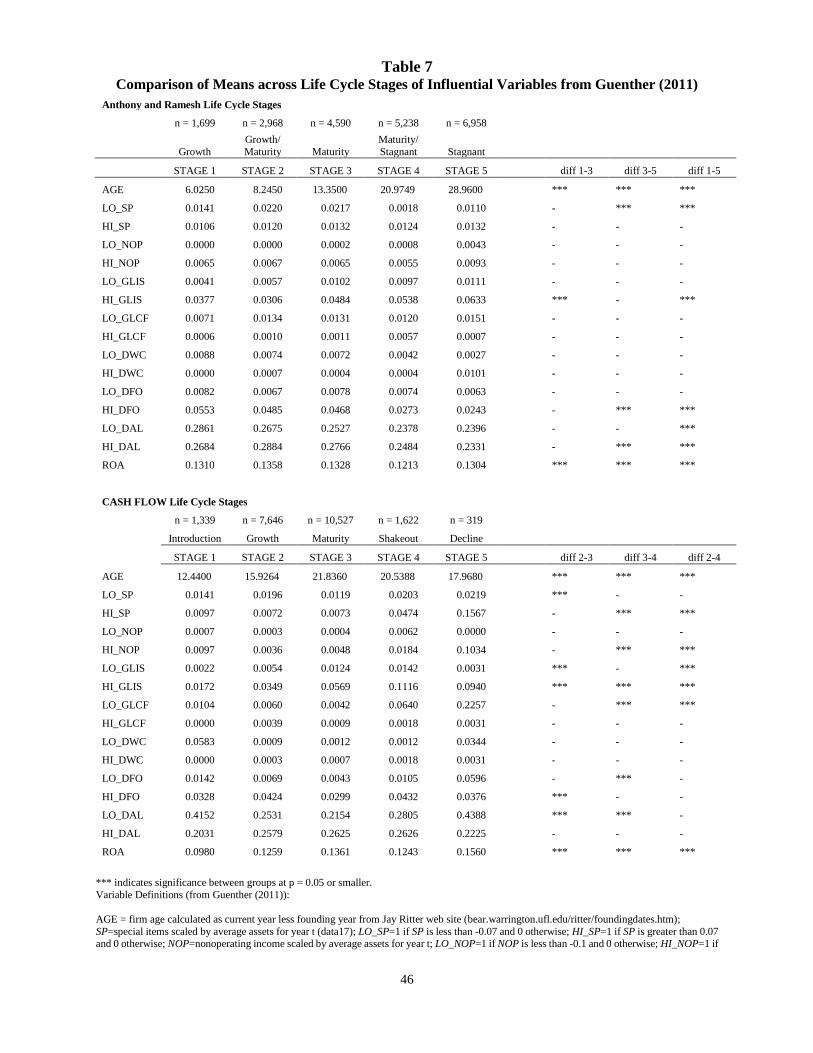
46
Table 7 Comparison of Means across Life Cycle Stages of Influential Variables from Guenther (2011)
Anthony and Ramesh Life Cycle Stages
n = 1,699 n = 2,968 n = 4,590 n = 5,238 n = 6,958
Growth
Growth/
Maturity Maturity
Maturity/
Stagnant Stagnant
STAGE 1 STAGE 2 STAGE 3 STAGE 4 STAGE 5
diff 1-3 diff 3-5 diff 1-5
AGE 6.0250 8.2450 13.3500 20.9749 28.9600
*** *** ***
LO_SP 0.0141 0.0220 0.0217 0.0018 0.0110
- *** ***
HI_SP 0.0106 0.0120 0.0132 0.0124 0.0132
- - -
LO_NOP 0.0000 0.0000 0.0002 0.0008 0.0043
- - -
HI_NOP 0.0065 0.0067 0.0065 0.0055 0.0093
- - -
LO_GLIS 0.0041 0.0057 0.0102 0.0097 0.0111
- - -
HI_GLIS 0.0377 0.0306 0.0484 0.0538 0.0633
*** - ***
LO_GLCF 0.0071 0.0134 0.0131 0.0120 0.0151
- - -
HI_GLCF 0.0006 0.0010 0.0011 0.0057 0.0007
- - -
LO_DWC 0.0088 0.0074 0.0072 0.0042 0.0027
- - -
HI_DWC 0.0000 0.0007 0.0004 0.0004 0.0101
- - -
LO_DFO 0.0082 0.0067 0.0078 0.0074 0.0063
- - -
HI_DFO 0.0553 0.0485 0.0468 0.0273 0.0243
- *** ***
LO_DAL 0.2861 0.2675 0.2527 0.2378 0.2396
- - ***
HI_DAL 0.2684 0.2884 0.2766 0.2484 0.2331
- *** ***
ROA 0.1310 0.1358 0.1328 0.1213 0.1304
*** *** ***
CASH FLOW Life Cycle Stages
n = 1,339 n = 7,646 n = 10,527 n = 1,622 n = 319
Introduction Growth Maturity Shakeout Decline
STAGE 1 STAGE 2 STAGE 3 STAGE 4 STAGE 5
diff 2-3 diff 3-4 diff 2-4
AGE 12.4400 15.9264 21.8360 20.5388 17.9680
*** *** ***
LO_SP 0.0141 0.0196 0.0119 0.0203 0.0219
*** - -
HI_SP 0.0097 0.0072 0.0073 0.0474 0.1567
- *** ***
LO_NOP 0.0007 0.0003 0.0004 0.0062 0.0000
- - -
HI_NOP 0.0097 0.0036 0.0048 0.0184 0.1034
- *** ***
LO_GLIS 0.0022 0.0054 0.0124 0.0142 0.0031
*** - ***
HI_GLIS 0.0172 0.0349 0.0569 0.1116 0.0940
*** *** ***
LO_GLCF 0.0104 0.0060 0.0042 0.0640 0.2257
- *** ***
HI_GLCF 0.0000 0.0039 0.0009 0.0018 0.0031
- - -
LO_DWC 0.0583 0.0009 0.0012 0.0012 0.0344
- - -
HI_DWC 0.0000 0.0003 0.0007 0.0018 0.0031
- - -
LO_DFO 0.0142 0.0069 0.0043 0.0105 0.0596
- *** -
HI_DFO 0.0328 0.0424 0.0299 0.0432 0.0376
*** - -
LO_DAL 0.4152 0.2531 0.2154 0.2805 0.4388
*** *** -
HI_DAL 0.2031 0.2579 0.2625 0.2626 0.2225
- - -
ROA 0.0980 0.1259 0.1361 0.1243 0.1560
*** *** ***
*** indicates significance between groups at p = 0.05 or smaller.
Variable Definitions (from Guenther (2011)):
AGE = firm age calculated as current year less founding year from Jay Ritter web site (bear.warrington.ufl.edu/ritter/foundingdates.htm);
SP=special items scaled by average assets for year t (data17); LO_SP=1 if SP is less than -0.07 and 0 otherwise; HI_SP=1 if SP is greater than 0.07 and 0 otherwise; NOP=nonoperating income scaled by average assets for year t; LO_NOP=1 if NOP is less than -0.1 and 0 otherwise; HI_NOP=1 if

47
NOP is greater than 0.1 and 0 otherwise; GLIS=gain or loss from the income statement scaled by average assets for year t; LO_GLIS=1 if GLIS is
less than 0 and 0 otherwise; HI_GLIS=1 if GLIS is greater than 0 and 0 otherwise; GLCF=gain or loss on the cash flow statement scaled by average assets for year t (data213); LO_GLCF=1 if GLCF is less than -0.07 and 0 otherwise; HI_GLCF=1 if GLCF is greater than 0.07 and 0 otherwise;
DWC=change in working capital accounts from the statement of cash flows scaled by average assets for year t; LO_DWC=1 if DWC is less than -0.3
and 0 otherwise; HI_DWC=1 if DWC is greater than 0.3 and 0 otherwise;