kai böhme sabine zillmer, kai pflanz, tomas hanell ... · kai böhme sabine zillmer, kai pflanz,...
TRANSCRIPT
ESPON Typology CompilationS O ypo ogy Co p at o
Kai BöhmeKai BöhmeSabine Zillmer, Kai Pflanz, Tomas Hanell & Petteri Niemi
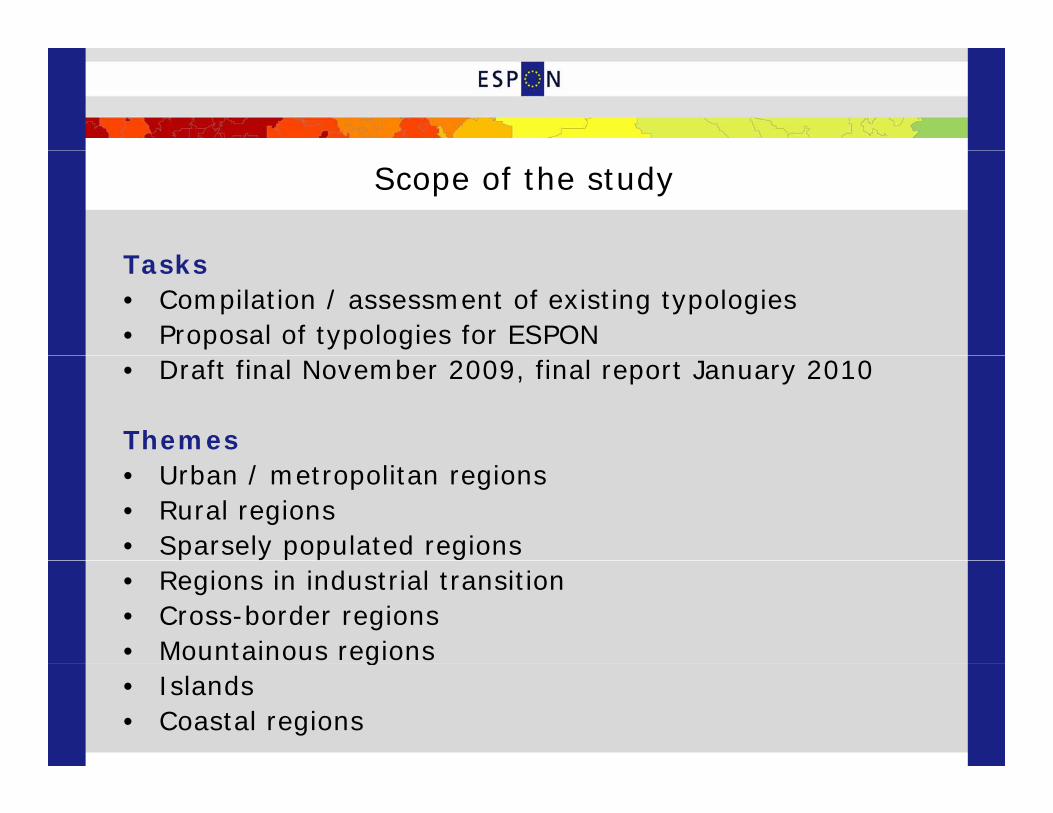
Scope of the study
Tasks• Compilation / assessment of existing typologies • Proposal of typologies for ESPON • Draft final November 2009, final report January 2010
Themes • Urban / metropolitan regions• Rural regions• Sparsely populated regions• Regions in industrial transition• Cross-border regions• Mountainous regionsg• Islands • Coastal regions
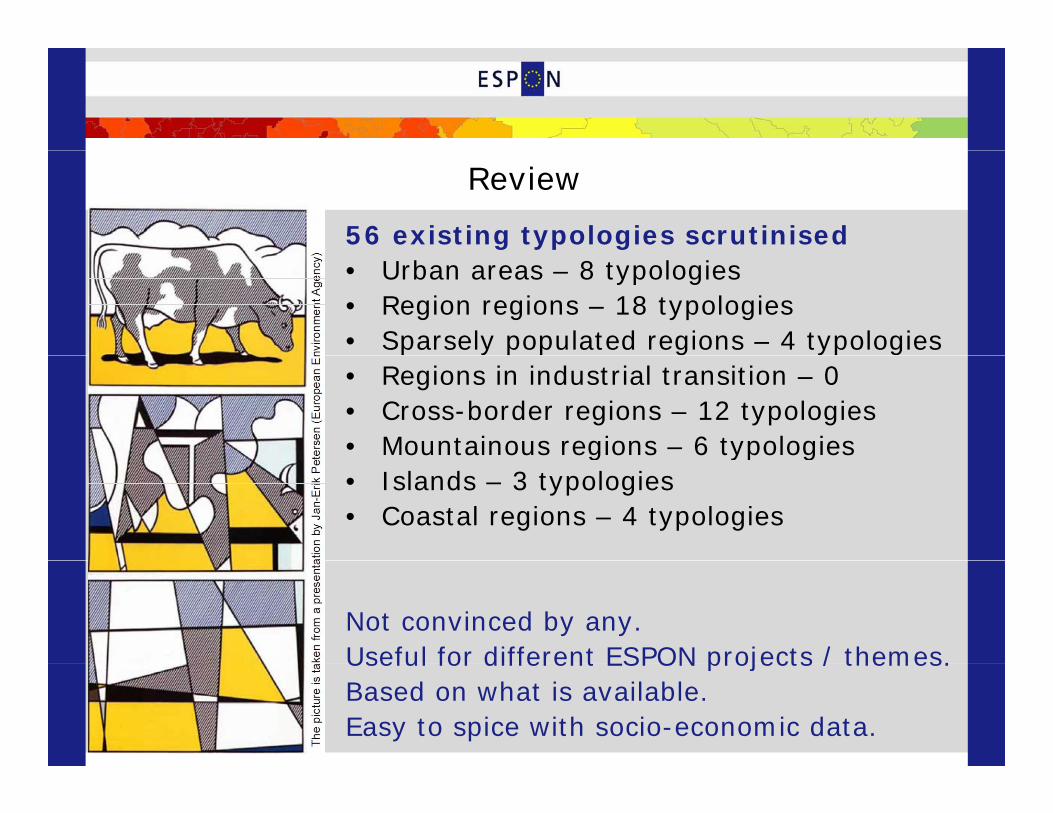
Review
56 existing typologies scrutinised• Urban areas – 8 typologies • Region regions – 18 typologies • Sparsely populated regions – 4 typologies• Regions in industrial transition – 0• Cross-border regions – 12 typologies • Mountainous regions – 6 typologies g yp g• Islands – 3 typologies • Coastal regions – 4 typologies
Not convinced by any.Useful for different ESPON projects / themes.Useful for different ESPON projects / themes.Based on what is available.Easy to spice with socio-economic data.
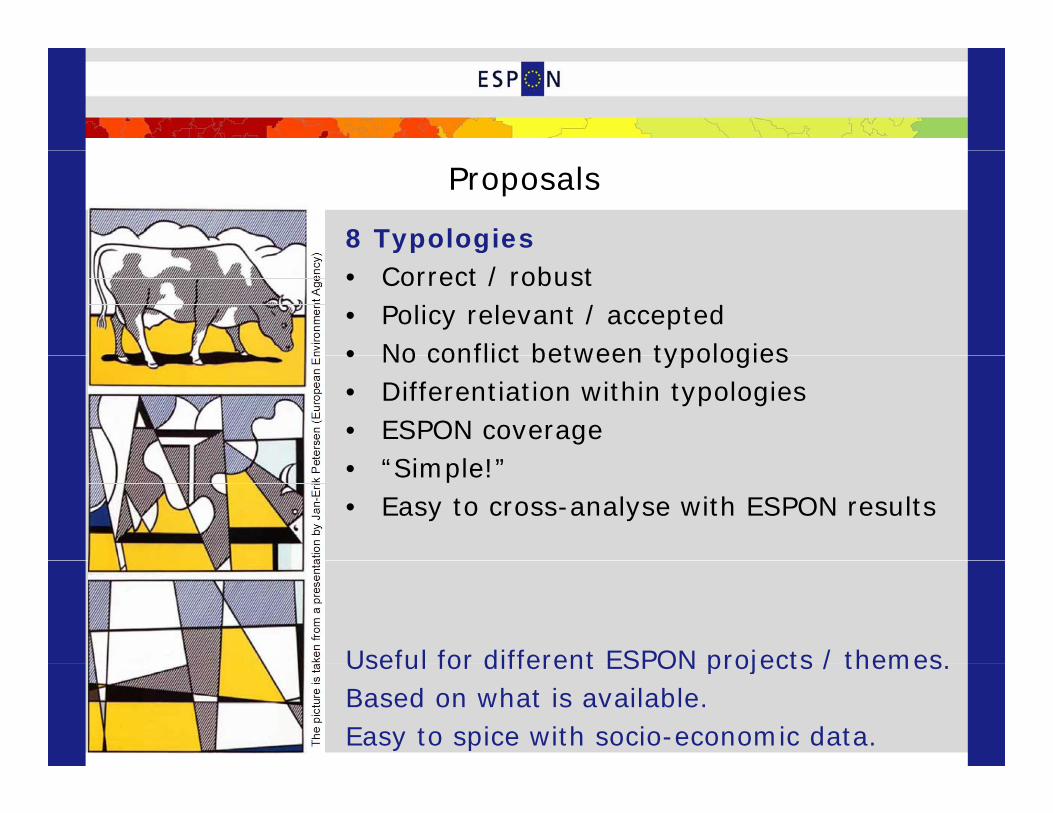
Proposals
8 Typologies g• Correct / robust • Policy relevant / accepted • No conflict between typologies • No conflict between typologies • Differentiation within typologies • ESPON coverage
“Si l !”• “Simple!”• Easy to cross-analyse with ESPON results
Useful for different ESPON projects / themesUseful for different ESPON projects / themes.Based on what is available.Easy to spice with socio-economic data.
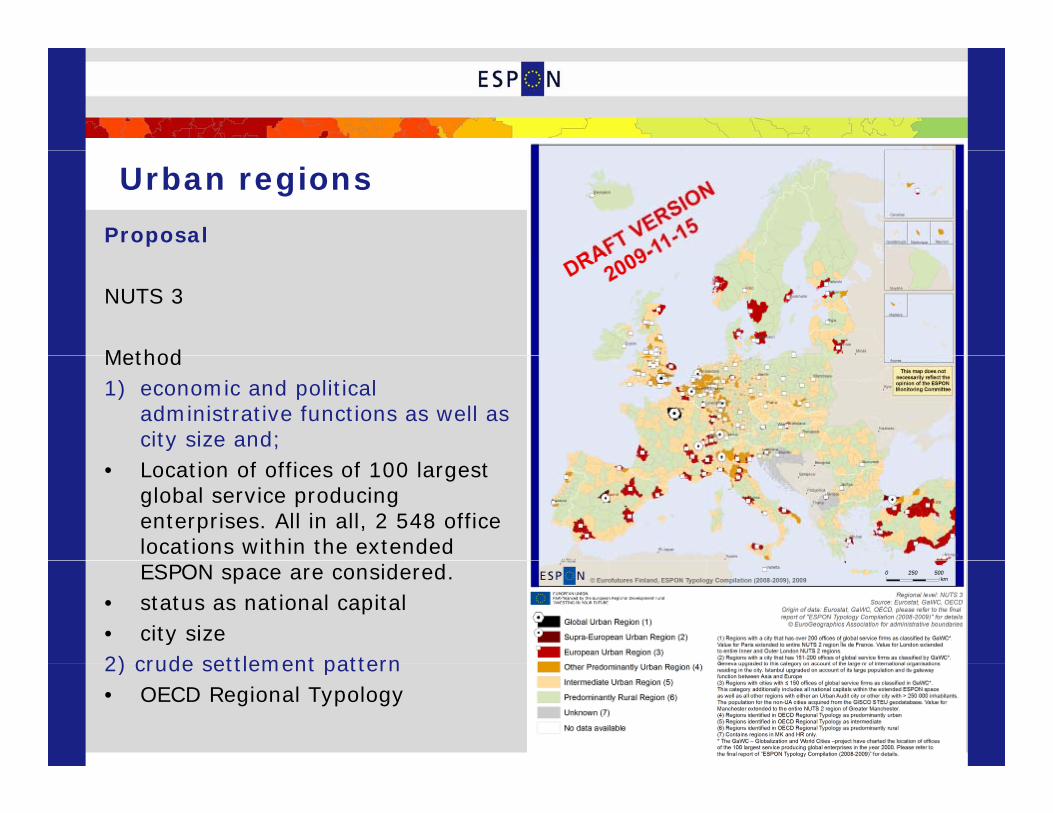
Urban regions
Proposal
NUTS 3
MethodMethod1) economic and political
administrative functions as well as city size and;
• Location of offices of 100 largest global service producing enterprises. All in all, 2 548 office locations within the extended ESPON space are considered.
• status as national capital• city size2) crude settlement pattern2) crude settlement pattern• OECD Regional Typology
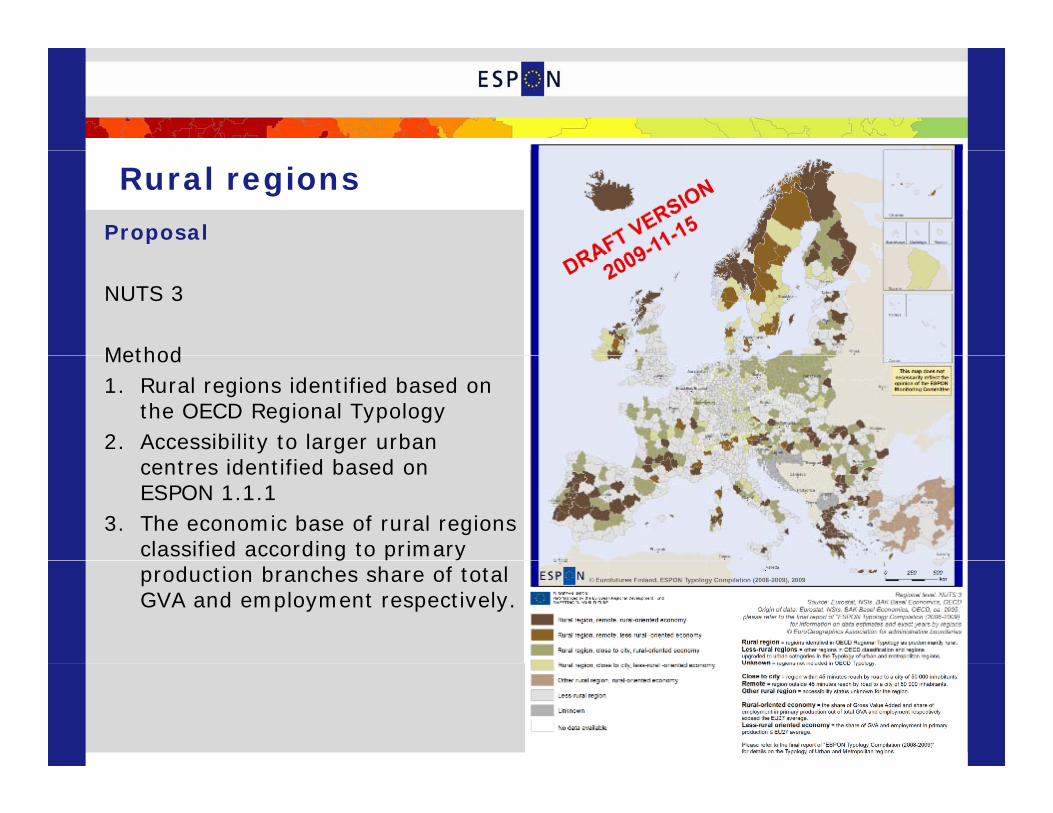
Rural regions
Proposal
NUTS 3
MethodMethod1. Rural regions identified based on
the OECD Regional Typology2. Accessibility to larger urban
centres identified based on ESPON 1.1.1
3. The economic base of rural regions classified according to primary gproduction branches share of total GVA and employment respectively.
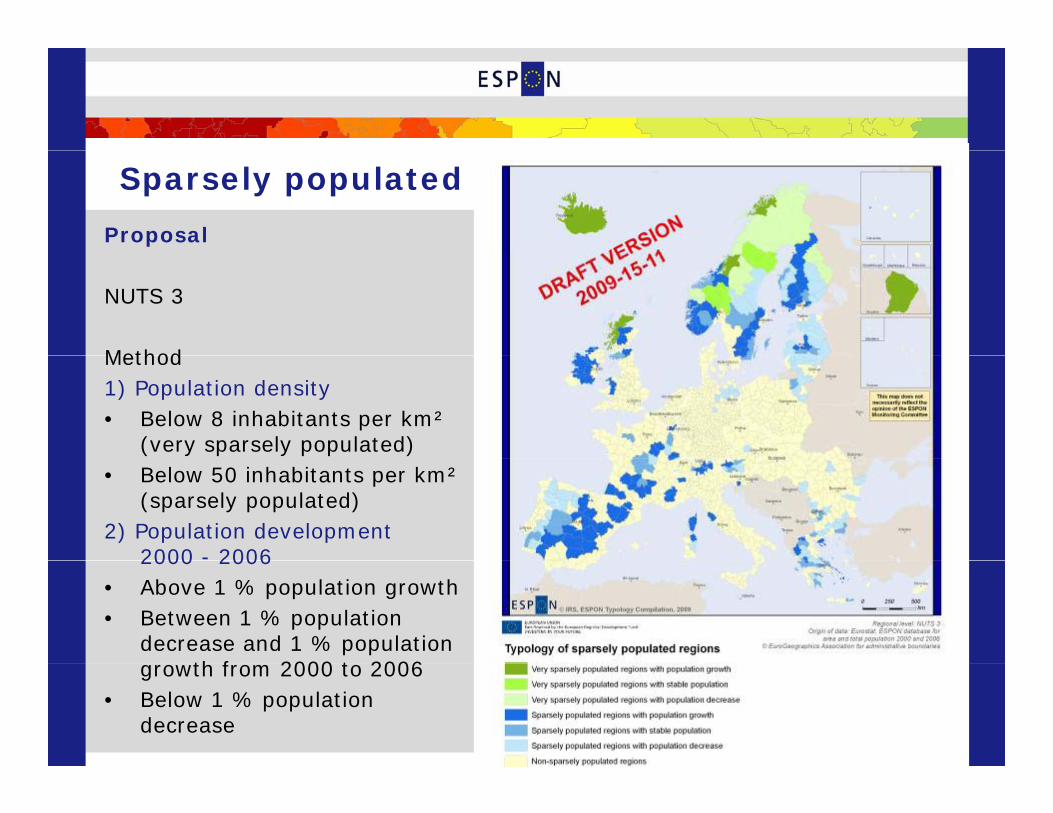
Sparsely populated regions
Proposal
NUTS 3
MethodMethod1) Population density• Below 8 inhabitants per km²
(very sparsely populated)• Below 50 inhabitants per km²
(sparsely populated)2) Population development
2000 - 20062000 2006• Above 1 % population growth• Between 1 % population
decrease and 1 % population th f 2000 t 2006growth from 2000 to 2006
• Below 1 % population decrease
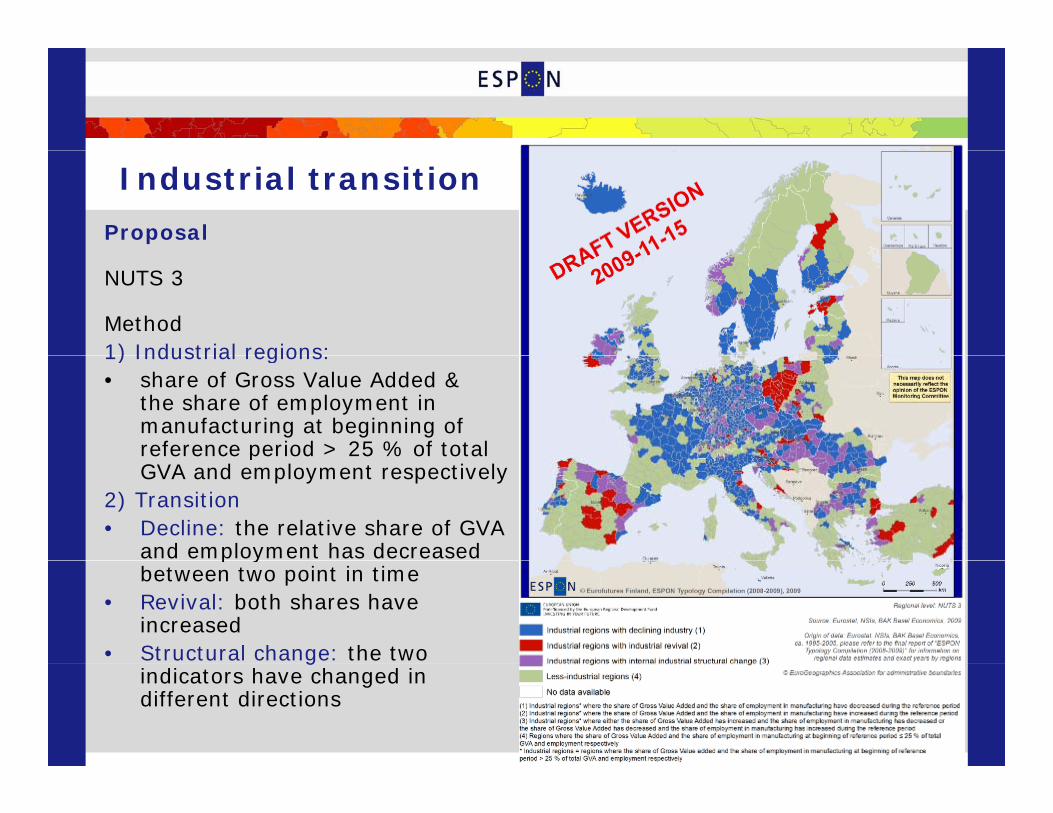
Industrial transition
Proposal
NUTS 3
Method1) Industrial regions: 1) Industrial regions: • share of Gross Value Added &
the share of employment in manufacturing at beginning of reference period > 25 % of total pGVA and employment respectively
2) Transition• Decline: the relative share of GVA
and employment has decreased p ybetween two point in time
• Revival: both shares have increased
• Structural change: the two gindicators have changed in different directions
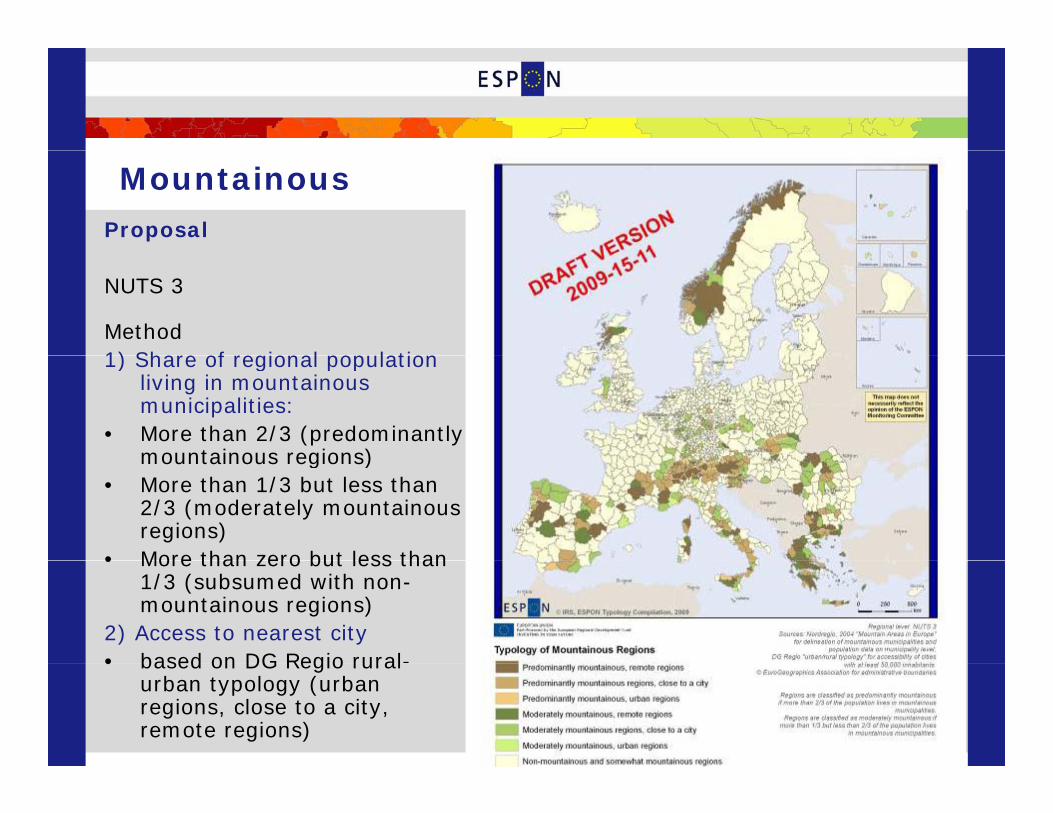
MountainousProposal
NUTS 3
Method1) Share of regional population 1) Share of regional population
living in mountainous municipalities:
• More than 2/3 (predominantly mountainous regions)mountainous regions)
• More than 1/3 but less than 2/3 (moderately mountainous regions)
• More than zero but less than • More than zero but less than 1/3 (subsumed with non-mountainous regions)
2) Access to nearest city• based on DG Regio rural-• based on DG Regio rural
urban typology (urban regions, close to a city, remote regions)
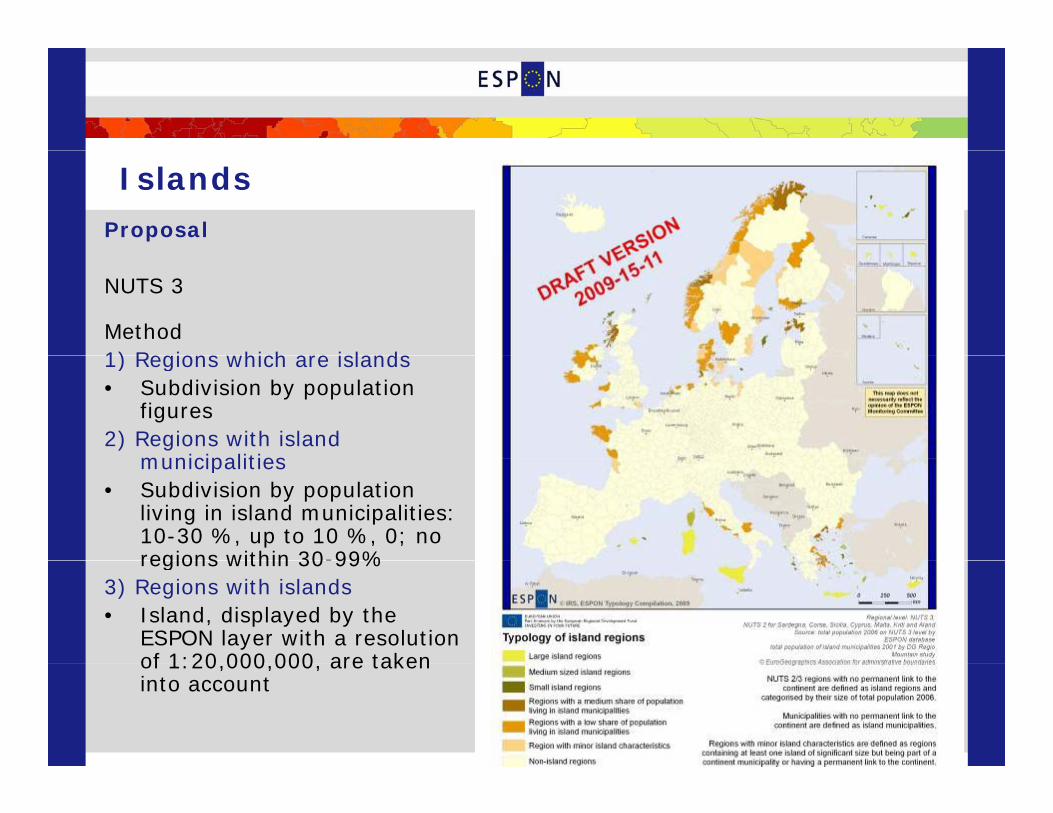
IslandsProposal
NUTS 3
Method1) Regions which are islands 1) Regions which are islands • Subdivision by population
figures2) Regions with island
municipalities municipalities • Subdivision by population
living in island municipalities: 10-30 %, up to 10 %, 0; no regions within 30-99%regions within 30 99%
3) Regions with islands• Island, displayed by the
ESPON layer with a resolution of 1:20 000 000 are taken of 1:20,000,000, are taken into account
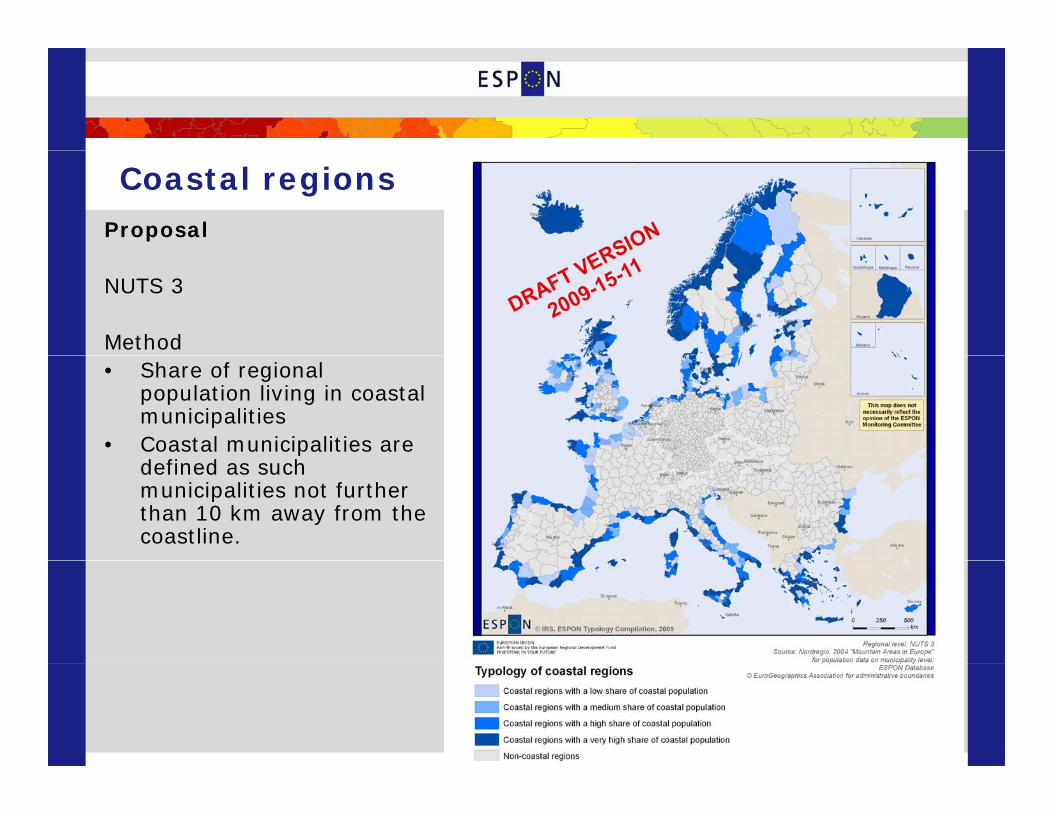
Coastal regionsProposal
NUTS 3
Method• Share of regional
population living in coastal municipalities
• Coastal municipalities are defined as such municipalities not further than 10 km away from the coastline.
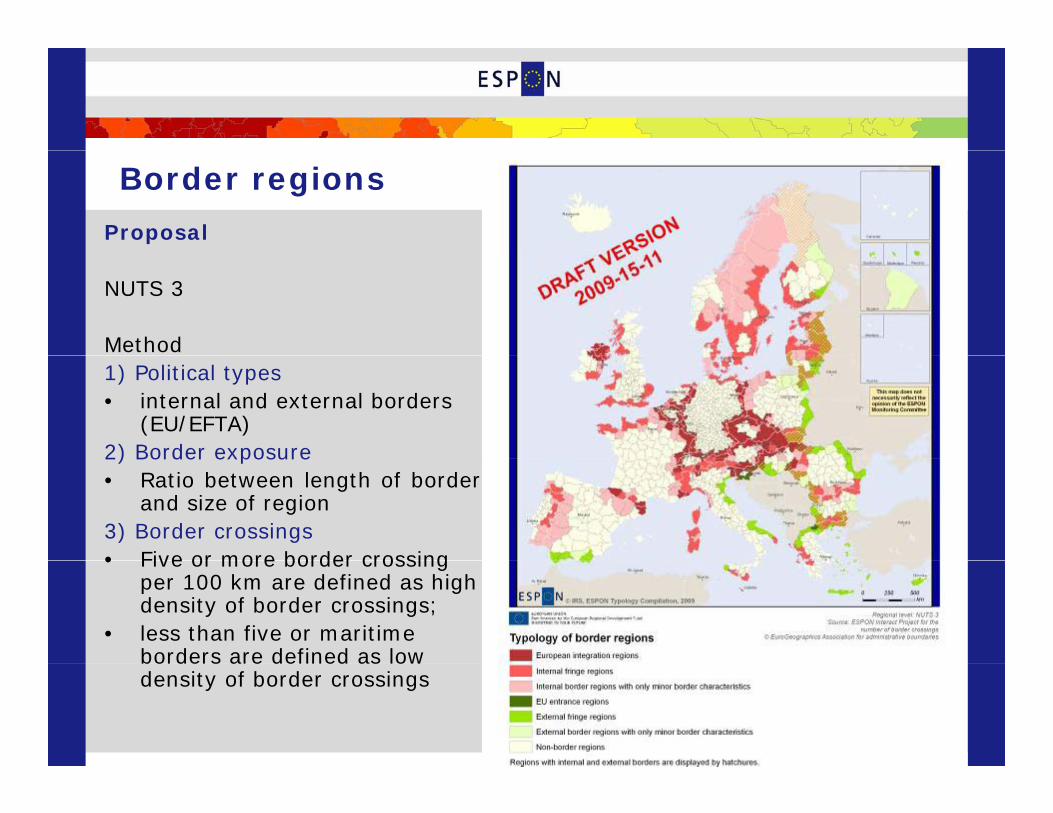
Border regions
Proposal
NUTS 3
Method1) Political types• internal and external borders
(EU/EFTA)2) Border exposure2) Border exposure• Ratio between length of border
and size of region3) Border crossings• Five or more border crossing • Five or more border crossing
per 100 km are defined as high density of border crossings;
• less than five or maritime borders are defined as low borders are defined as low density of border crossings
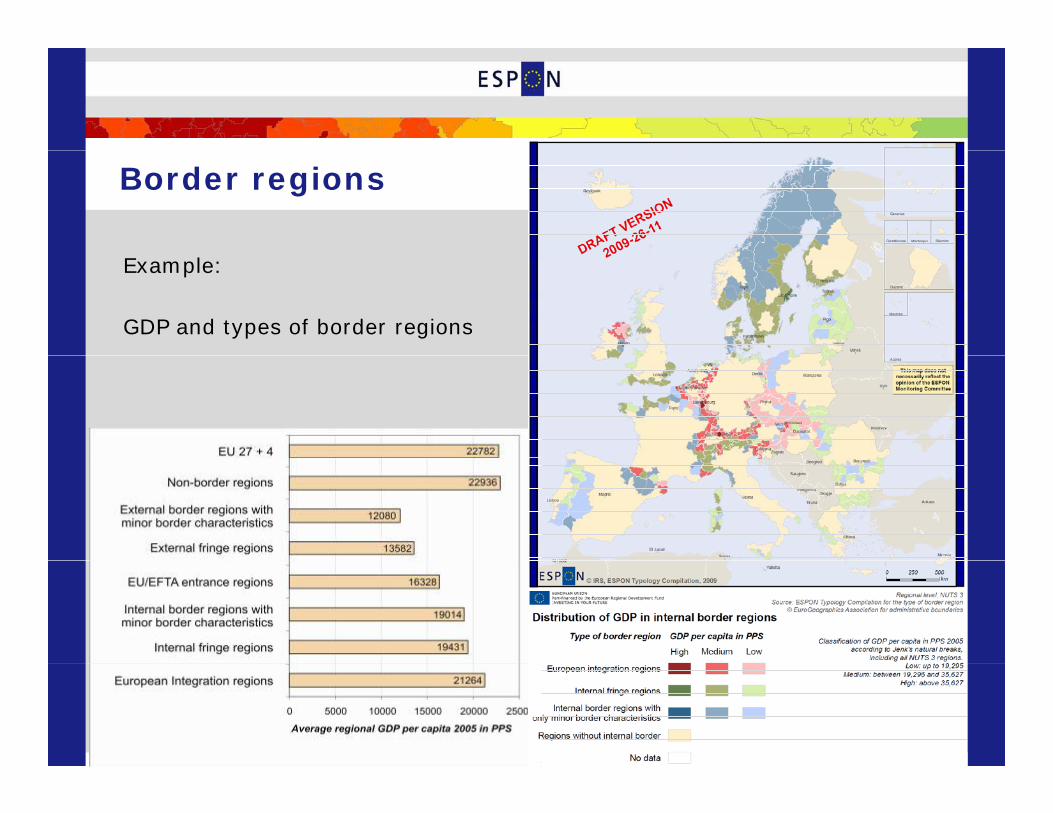
Border regions
Example:
GDP and types of border regions
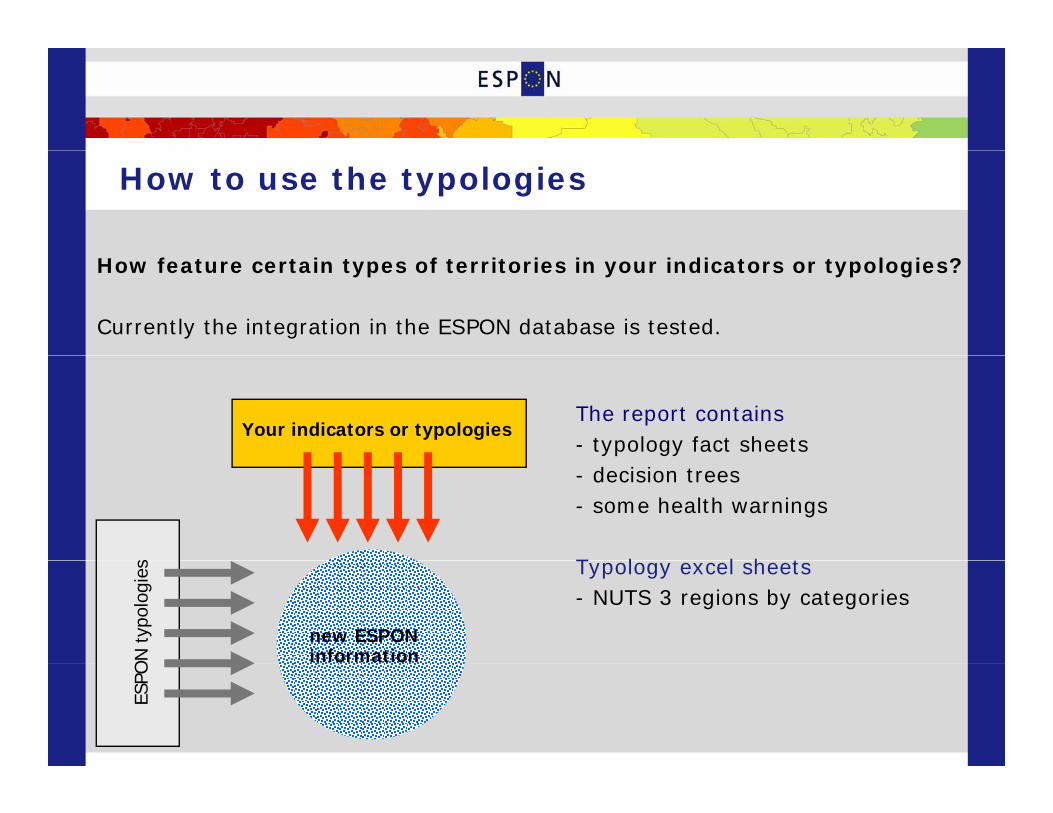
How to use the typologies
How feature certain types of territories in your indicators or typologies?
Currently the integration in the ESPON database is tested.
The report contains- typology fact sheets
Your indicators or typologies
- decision trees - some health warnings
T l l h tTypology excel sheets- NUTS 3 regions by categories
ON
typ
olog
ies
new ESPON information
ESPO

Thank you very much for your attention!
For comments and For comments and further suggestions:
Dr Kai Böhme Spatial Foresight GmbHpa a o g G b
+352 691 87 32 49 [email protected]