juniper networks inc ( jnpr ) 1194 north mathilda...
TRANSCRIPT
JUNIPER NETWORKS INC ( JNPR )
1194 NORTH MATHILDA AVESUNNYVALE, CA, 94089650−526−8000www.juniper.net
10−QQuarterly report pursuant to sections 13 or 15(d)Filed on 8/6/2010 Filed Period 6/30/2010
Table of Contents
UNITED STATES SECURITIES AND EXCHANGE COMMISSIONWashington, D.C. 20549
Form 10−Q(Mark One)
þ QUARTERLY REPORT PURSUANT TO SECTION 13 OR 15(d) OF THE SECURITIES EXCHANGEACT OF 1934For the quarterly period ended June 30, 2010
OR
o TRANSITION REPORT PURSUANT TO SECTION 13 OR 15(d) OF THE SECURITIES EXCHANGEACT OF 1934For the transition period from to
Commission file number 001−34501
JUNIPER NETWORKS, INC.(Exact name of registrant as specified in its charter)
Delaware 77−0422528(State or other jurisdiction of (IRS Employer
incorporation or organization) Identification No.)
1194 North Mathilda AvenueSunnyvale, California 94089 (408) 745−2000
(Address of principal executive offices, (Registrant’s telephone number,including zip code) including area code)
Indicate by check mark whether the Registrant (1) has filed all reports required to be filed by Section 13 or 15(d) of the Securities Exchange Act of 1934during the preceding 12 months (or for such shorter period that the registrant was required to file such reports), and (2) has been subject to such filingsrequirements for the past 90 days. Yes þ No o Indicate by check mark whether the Registrant has submitted electronically and posted on its corporate Web site, if any, every Interactive Data Filerequired to be submitted and posted pursuant to Rule 405 of Regulation S−T during the preceding 12 months (or for such shorter period that the registrantwas required to submit and post such files). Yes þ No o Indicate by check mark whether the registrant is a large accelerated filer, an accelerated filer, a non−accelerated filer, or a smaller reporting company.See definition of “large accelerated filer,” “accelerated filer” and “smaller reporting company” in Rule 12b−2 of the Exchange Act. (Check one):
Large Accelerated Filer þ Accelerated Filer o Non−Accelerated Filer o Smaller Reporting Company o(Do not check if a smaller reporting company)
Indicate by check mark whether the registrant is a shell company (as defined in Rule 12b−2 of the Exchange Act). Yes o No þ There were approximately 519,918,000 shares of the Company’s Common Stock, par value $0.00001, outstanding as of July 30, 2010.
Table of Contents
PART I − FINANCIAL INFORMATION 3
Item 1. Financial Statements 3
Condensed Consolidated Statements of Operations 3
Condensed Consolidated Balance Sheets 4
Condensed Consolidated Statements of Cash Flows 5
Notes to Condensed Consolidated Financial Statements 6
Item 2. Management's Discussion and Analysis of Financial Condition and Results of Operations 41
Item 3. Quantitative and Qualitative Disclosures About Market Risk 62
Item 4. Controls and Procedures 63
PART II − OTHER INFORMATION 64
Item 1. Legal Proceedings 64
Item 1A. Risk Factors 64
Item 2. Unregistered Sales of Equity Securities and Use of Proceeds 77
Item 6. Exhibits 78
SIGNATURES 79EX−10.2EX−31.1EX−31.2EX−32.1EX−32.2EX−101 INSTANCE DOCUMENTEX−101 SCHEMA DOCUMENTEX−101 CALCULATION LINKBASE DOCUMENTEX−101 LABELS LINKBASE DOCUMENTEX−101 PRESENTATION LINKBASE DOCUMENTEX−101 DEFINITION LINKBASE DOCUMENT
2
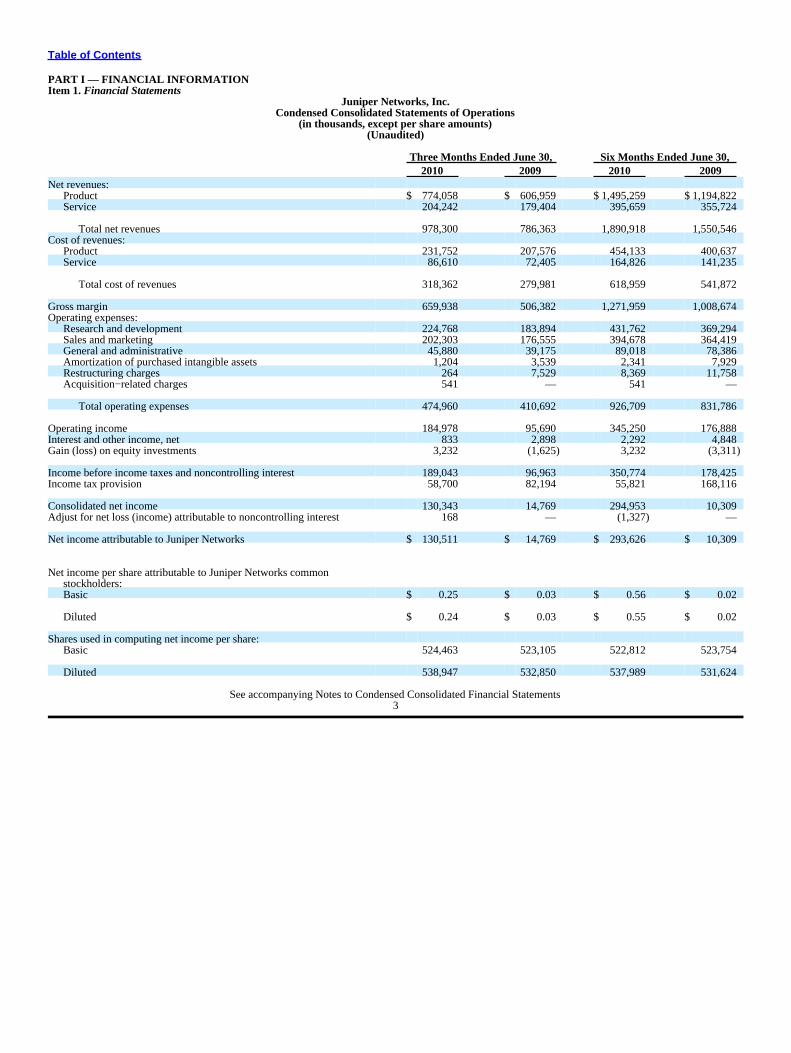
Table of Contents
PART I — FINANCIAL INFORMATIONItem 1. Financial Statements
Juniper Networks, Inc.Condensed Consolidated Statements of Operations
(in thousands, except per share amounts)(Unaudited)
Three Months Ended June 30, Six Months Ended June 30,2010 2009 2010 2009
Net revenues:Product $ 774,058 $ 606,959 $ 1,495,259 $ 1,194,822Service 204,242 179,404 395,659 355,724
Total net revenues 978,300 786,363 1,890,918 1,550,546Cost of revenues:
Product 231,752 207,576 454,133 400,637Service 86,610 72,405 164,826 141,235
Total cost of revenues 318,362 279,981 618,959 541,872
Gross margin 659,938 506,382 1,271,959 1,008,674Operating expenses:
Research and development 224,768 183,894 431,762 369,294Sales and marketing 202,303 176,555 394,678 364,419General and administrative 45,880 39,175 89,018 78,386Amortization of purchased intangible assets 1,204 3,539 2,341 7,929Restructuring charges 264 7,529 8,369 11,758Acquisition−related charges 541 — 541 —
Total operating expenses 474,960 410,692 926,709 831,786
Operating income 184,978 95,690 345,250 176,888Interest and other income, net 833 2,898 2,292 4,848Gain (loss) on equity investments 3,232 (1,625) 3,232 (3,311)
Income before income taxes and noncontrolling interest 189,043 96,963 350,774 178,425Income tax provision 58,700 82,194 55,821 168,116
Consolidated net income 130,343 14,769 294,953 10,309Adjust for net loss (income) attributable to noncontrolling interest 168 — (1,327) —
Net income attributable to Juniper Networks $ 130,511 $ 14,769 $ 293,626 $ 10,309
Net income per share attributable to Juniper Networks commonstockholders:Basic $ 0.25 $ 0.03 $ 0.56 $ 0.02
Diluted $ 0.24 $ 0.03 $ 0.55 $ 0.02
Shares used in computing net income per share:Basic 524,463 523,105 522,812 523,754
Diluted 538,947 532,850 537,989 531,624
See accompanying Notes to Condensed Consolidated Financial Statements3
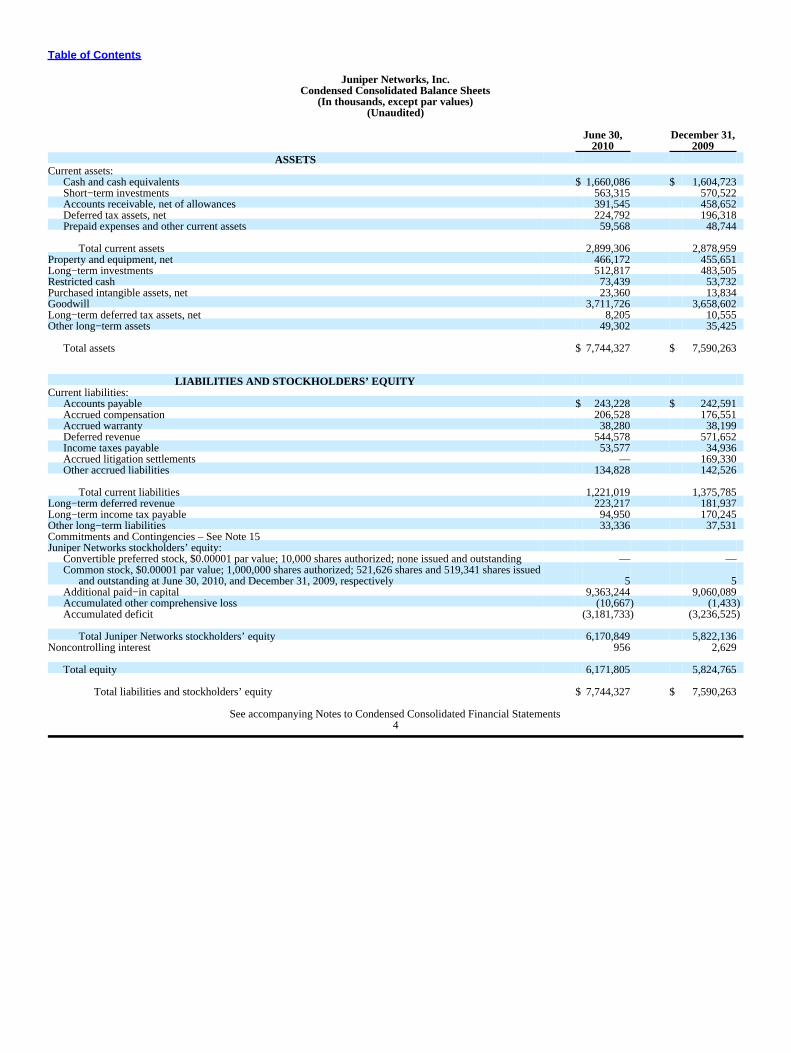
Table of Contents
Juniper Networks, Inc.Condensed Consolidated Balance Sheets
(In thousands, except par values)(Unaudited)
June 30, December 31,2010 2009
ASSETSCurrent assets:
Cash and cash equivalents $ 1,660,086 $ 1,604,723Short−term investments 563,315 570,522Accounts receivable, net of allowances 391,545 458,652Deferred tax assets, net 224,792 196,318Prepaid expenses and other current assets 59,568 48,744
Total current assets 2,899,306 2,878,959Property and equipment, net 466,172 455,651Long−term investments 512,817 483,505Restricted cash 73,439 53,732Purchased intangible assets, net 23,360 13,834Goodwill 3,711,726 3,658,602Long−term deferred tax assets, net 8,205 10,555Other long−term assets 49,302 35,425
Total assets $ 7,744,327 $ 7,590,263
LIABILITIES AND STOCKHOLDERS’ EQUITYCurrent liabilities:
Accounts payable $ 243,228 $ 242,591Accrued compensation 206,528 176,551Accrued warranty 38,280 38,199Deferred revenue 544,578 571,652Income taxes payable 53,577 34,936Accrued litigation settlements — 169,330Other accrued liabilities 134,828 142,526
Total current liabilities 1,221,019 1,375,785Long−term deferred revenue 223,217 181,937Long−term income tax payable 94,950 170,245Other long−term liabilities 33,336 37,531Commitments and Contingencies – See Note 15Juniper Networks stockholders’ equity:
Convertible preferred stock, $0.00001 par value; 10,000 shares authorized; none issued and outstanding — —Common stock, $0.00001 par value; 1,000,000 shares authorized; 521,626 shares and 519,341 shares issued
and outstanding at June 30, 2010, and December 31, 2009, respectively 5 5Additional paid−in capital 9,363,244 9,060,089Accumulated other comprehensive loss (10,667) (1,433)Accumulated deficit (3,181,733) (3,236,525)
Total Juniper Networks stockholders’ equity 6,170,849 5,822,136Noncontrolling interest 956 2,629
Total equity 6,171,805 5,824,765
Total liabilities and stockholders’ equity $ 7,744,327 $ 7,590,263
See accompanying Notes to Condensed Consolidated Financial Statements4
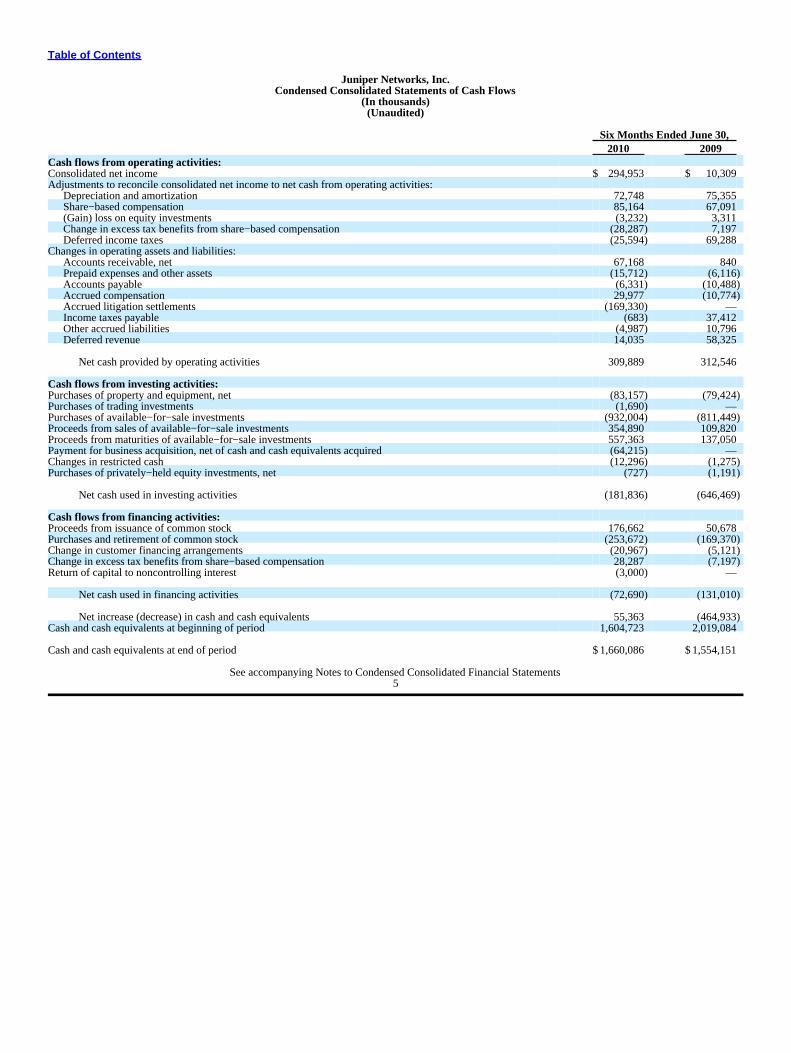
Table of Contents
Juniper Networks, Inc.Condensed Consolidated Statements of Cash Flows
(In thousands)(Unaudited)
Six Months Ended June 30,2010 2009
Cash flows from operating activities:Consolidated net income $ 294,953 $ 10,309Adjustments to reconcile consolidated net income to net cash from operating activities:
Depreciation and amortization 72,748 75,355Share−based compensation 85,164 67,091(Gain) loss on equity investments (3,232) 3,311Change in excess tax benefits from share−based compensation (28,287) 7,197Deferred income taxes (25,594) 69,288
Changes in operating assets and liabilities:Accounts receivable, net 67,168 840Prepaid expenses and other assets (15,712) (6,116)Accounts payable (6,331) (10,488)Accrued compensation 29,977 (10,774)Accrued litigation settlements (169,330) —Income taxes payable (683) 37,412Other accrued liabilities (4,987) 10,796Deferred revenue 14,035 58,325
Net cash provided by operating activities 309,889 312,546
Cash flows from investing activities:Purchases of property and equipment, net (83,157) (79,424)Purchases of trading investments (1,690) —Purchases of available−for−sale investments (932,004) (811,449)Proceeds from sales of available−for−sale investments 354,890 109,820Proceeds from maturities of available−for−sale investments 557,363 137,050Payment for business acquisition, net of cash and cash equivalents acquired (64,215) —Changes in restricted cash (12,296) (1,275)Purchases of privately−held equity investments, net (727) (1,191)
Net cash used in investing activities (181,836) (646,469)
Cash flows from financing activities:Proceeds from issuance of common stock 176,662 50,678Purchases and retirement of common stock (253,672) (169,370)Change in customer financing arrangements (20,967) (5,121)Change in excess tax benefits from share−based compensation 28,287 (7,197)Return of capital to noncontrolling interest (3,000) —
Net cash used in financing activities (72,690) (131,010)
Net increase (decrease) in cash and cash equivalents 55,363 (464,933)Cash and cash equivalents at beginning of period 1,604,723 2,019,084
Cash and cash equivalents at end of period $1,660,086 $1,554,151
See accompanying Notes to Condensed Consolidated Financial Statements5
Table of Contents
Juniper Networks, Inc.Notes to Condensed Consolidated Financial Statements
(Unaudited)Note 1. Basis of PresentationThe unaudited Condensed Consolidated Financial Statements of Juniper Networks, Inc. (“Juniper Networks” or the “Company”) have been prepared inaccordance with U.S. generally accepted accounting principles (“U.S. GAAP”) for interim financial information as well as the instructions to Form 10−Qand the rules and regulations of the U.S. Securities and Exchange Commission (“SEC”). Accordingly, they do not include all of the information andfootnotes required by U.S. GAAP for complete financial statements. In the opinion of management, all adjustments, including normal recurring accruals,considered necessary for a fair presentation have been included. The results of operations for the three and six months ended June 30, 2010, are notnecessarily indicative of the results that may be expected for the year ending December 31, 2010, or any future period. The information included in thisQuarterly Report on Form 10−Q should be read in conjunction with “Management’s Discussion and Analysis of Financial Condition and Results ofOperations,” “Risk Factors,” “Quantitative and Qualitative Disclosures About Market Risk,” and the Consolidated Financial Statements and footnotesthereto included in the Company’s Annual Report on Form 10−K for the year ended December 31, 2009.As of June 30, 2010, the Company owned a 60 percent interest in a joint venture with Nokia Siemens Networks B.V. (“NSN”). Given the Company’smajority ownership interest in the joint venture, the accounts of the joint venture have been consolidated with the accounts of the Company, and anoncontrolling interest has been recorded for the noncontrolling investor’s interests in the net assets and operations of the joint venture.ReclassificationsIn the first quarter of 2010, the Company reclassified certain selling and marketing costs that were previously reported as cost of service revenues as salesand marketing expense. Accordingly, $6.0 million and $12.6 million of costs reported in the three and six months ended June 30, 2009, respectively, havebeen reclassified from cost of service revenues to sales and marketing expense to conform to the current period’s presentation. The reclassification did notimpact the Company’s previously reported net revenues, segment results, operating income, net income, or earnings per share.Note 2. Summary of Significant Accounting PoliciesRecent Accounting Policy ChangesRevenue RecognitionIn October 2009, the Financial Accounting Standards Board (“FASB”) issued Accounting Standards Update (“ASU”) No. 2009−13, “Multiple−DeliverableRevenue Arrangements” (“ASU 2009−13”). ASU 2009−13 changes the requirements for establishing separate units of accounting in a multiple elementarrangement and requires the allocation of arrangement consideration to each deliverable to be based on the relative selling price. Under the new standard,the Company allocates the total arrangement consideration to each separable element of an arrangement based upon the relative selling price of eachelement. Arrangement consideration allocated to undelivered elements is deferred until delivery. Concurrently with issuing ASU 2009−13, the FASB alsoissued ASU No. 2009−14, “Certain Revenue Arrangements That Include Software Elements” (“ASU 2009−14”). ASU 2009−14 excludes software that iscontained on a tangible product from the scope of software revenue guidance if the software component and the non−software component function togetherto deliver the tangible products’ essential functionality. The Company early adopted these standards on a prospective basis as of the beginning of fiscal 2010for new and materially modified arrangements originating after December 31, 2009.
6
Table of Contents
Juniper Networks, Inc.Notes to Condensed Consolidated Financial Statements (Continued)
As a result of the adoption of ASU 2009−13 and ASU 2009−14, net revenues for the three and six months ended June 30, 2010 were approximately$53 million and $78 million higher than the net revenues that would have been recorded under the previous accounting rules. The increase in revenues wasdue to recognition of revenue for products booked and shipped during these periods which consisted primarily of $38 million and $60 million for the three−and six−month periods ended June 30, 2010, respectively, related to undelivered product commitments for which the Company was unable to demonstratefair value pursuant to the previous accounting standards. The remainder of the increase in revenue for the three− and six−month periods was due to productssold into multiple−year service arrangements which were recognized ratably under the previous accounting standards and for the change in the Company’sallocation methodology from the residual method to the relative selling price method as prescribed by the new standard.Revenue is recognized when all of the following criteria have been met:
• Persuasive evidence of an arrangement exists. The Company generally relies upon sales contracts, or agreements, and customer purchase orders todetermine the existence of an arrangement.
• Delivery has occurred. The Company uses shipping terms and related documents, or written evidence of customer acceptance, when applicable, toverify delivery or performance. In instances where the Company has outstanding obligations related to product delivery or the final acceptance ofthe product, revenue is deferred until all the delivery and acceptance criteria have been met.
• Sales price is fixed or determinable. The Company assesses whether the sales price is fixed or determinable based on the payment terms andwhether the sales price is subject to refund or adjustment.
• Collectability is reasonably assured. The Company assesses collectability based on the creditworthiness of the customer as determined by ourcredit checks and the customer’s payment history. The Company records accounts receivable net of allowance for doubtful accounts, estimatedcustomer returns and pricing credits.
For fiscal 2010 and future periods, pursuant to the guidance of ASU 2009−13, when a sales arrangement contains multiple elements and software andnon−software components function together to deliver the tangible products’ essential functionality, the Company allocates revenue to each element basedon a selling price hierarchy. The selling price for a deliverable is based on its vendor−specific objective evidence (“VSOE”) if available, third partyevidence (“TPE”) if VSOE is not available, or estimated selling price (“ESP”) if neither VSOE nor TPE is available. The Company then recognizes revenueon each deliverable in accordance with its policies for product and service revenue recognition. VSOE of selling price is based on the price charged whenthe element is sold separately. In determining VSOE, the Company requires that a substantial majority of the selling prices fall within a reasonable rangebased on historical discounting trends for specific products and services. TPE of selling price is established by evaluating largely interchangeable competitorproducts or services in stand−alone sales to similarly situated customers. However, as the Company’s products contain a significant element of proprietarytechnology and its solutions offer substantially different features and functionality, the comparable pricing of products with similar functionality typicallycannot be obtained. Additionally, as the Company is unable to reliably determine what competitors products’ selling prices are on a stand−alone basis, theCompany is not typically able to determine TPE. The best estimate of selling price is established considering multiple factors including, but not limited topricing practices in different geographies and through different sales channels, gross margin objectives, internal costs, competitor pricing strategies, andindustry technology lifecycles.In multiple element arrangements where more−than−incidental software deliverables are included, revenue is allocated to each separate unit of accountingfor each of the non−software deliverables and to the software deliverables as a group using the relative selling prices of each of the deliverables in thearrangement based on the aforementioned selling price hierarchy. If the arrangement contains more than one software deliverable, the arrangementconsideration allocated to the software deliverables as a group is then allocated to each software deliverable using the guidance for recognizing softwarerevenue, as amended.
7
Table of Contents
Juniper Networks, Inc.Notes to Condensed Consolidated Financial Statements (Continued)
The Company limits the amount of revenue recognition for delivered elements to the amount that is not contingent on the future delivery of products orservices, future performance obligation, or subject to customer−specific return or refund privileges. The Company evaluates each deliverable in anarrangement to determine whether they represent separate units of accounting. A deliverable constitutes a separate unit of accounting when it hasstand−alone value and there are no customer−negotiated refunds or return rights for the delivered elements. If the arrangement includes acustomer−negotiated refund or return right relative to the delivered item, and the delivery and performance of the undelivered item is considered probableand substantially in the Company’s control, the delivered element constitutes a separate unit of accounting. In circumstances when the aforementionedcriteria are not met, the deliverable is combined with the undelivered elements, and the allocation of the arrangement consideration and revenue recognitionis determined for the combined unit as a single unit. Allocation of the consideration is determined at arrangement inception on the basis of each unit’srelative selling price. The new standards do not generally change the units of accounting for the Company’s revenue transactions. The Company cannotreasonably estimate the effect of adopting these standards on future financial periods as the impact will vary depending on the nature and volume of new ormaterially modified deals in any given period.For transactions entered into prior to January 1, 2010, revenues for arrangements with multiple elements, such as sales of products that include services, areallocated to each element using the residual method based on the VSOE of fair value of the undelivered items pursuant to Accounting StandardsCodification (“ASC”) Topic 985−605, Software – Revenue Recognition. Under the residual method, the amount of revenue allocated to delivered elementsequals the total arrangement consideration less the aggregate fair value of any undelivered elements. If VSOE of one or more undelivered items does notexist, revenue from the entire arrangement is deferred and recognized at the earlier of: (i) delivery of those elements or (ii) when fair value can beestablished unless maintenance is the only undelivered element, in which case, the entire arrangement fee is recognized ratably over the contractual supportperiod.The Company accounts for multiple agreements with a single customer as one arrangement if the contractual terms and/or substance of those agreementsindicate that they may be so closely related that they are, in effect, parts of a single arrangement. The Company’s ability to recognize revenue in the futuremay be affected if actual selling prices are significantly less than fair value. In addition, the Company’s ability to recognize revenue in the future could beimpacted by conditions imposed by its customers.For sales to direct end−users, value−added resellers, and original equipment manufacturer (“OEM”) partners, the Company recognizes product revenueupon transfer of title and risk of loss, which is generally upon shipment. It is the Company’s practice to identify an end−user prior to shipment to avalue−added reseller. For the Company’s end−users and value−added resellers, there are no significant obligations for future performance such as rights ofreturn or pricing credits. The Company’s agreements with its OEM partners may allow future rights of returns. A portion of the Company’s sales is madethrough distributors under agreements allowing for pricing credits or rights of return. Product revenue on sales made through these distributors is recognizedupon sell−through as reported by the distributors to the Company. Deferred revenue on shipments to distributors reflects the effects of distributor pricingcredits and the amount of gross margin expected to be realized upon sell−through. Deferred revenue is recorded net of the related product costs of revenue.The Company records reductions to revenue for estimated product returns and pricing adjustments, such as rebates and price protection, in the same periodthat the related revenue is recorded. The amount of these reductions is based on historical sales returns and price protection credits, specific criteria includedin rebate agreements, and other factors known at the time. Should actual product returns or pricing adjustments differ from estimates, additional reductionsto revenue may be required. In addition, the Company reports revenues net of sales taxes. Service revenues include revenue from maintenance, training, andprofessional services. Maintenance is offered under renewable contracts. Revenue from maintenance service contracts is deferred and is recognized ratablyover the contractual support period, which is generally one to three years. Revenue from training and professional services is recognized as the services arecompleted or ratably over the contractual period, which is generally one year or less.
8
Table of Contents
Juniper Networks, Inc.Notes to Condensed Consolidated Financial Statements (Continued)
The Company sells certain interests in accounts receivable on a non−recourse basis as part of customer financing arrangements primarily with one majorfinancing company. Cash received under this arrangement in advance of revenue recognition is recorded as short−term debt.Recent Accounting PronouncementsIn May 2010, the FASB issued ASU No. 2010−19, Topic 830 — Foreign Currency Issues: Multiple Foreign Currency Exchange Rates—An announcementmade by the staff of the U.S. Securities and Exchange Commission (“ASU 2010−19”), which incorporates the SEC Staff Announcement made at theMarch 18, 2010 meeting of the FASB Emerging Issues Task Force (“EITF”). The Staff Announcement provided the SEC staff’s view on certain foreigncurrency issues related to investments in Venezuela. This guidance is effective as of the announcement date, March 18, 2010. The Company’s adoption ofASU 2010−19 did not have an impact on the Company’s consolidated results of operations or financial condition.In April 2010, the FASB issued ASU No. 2010−17, Topic 605 — Revenue Recognition – Milestone Method (“ASU 2010−17”), which provides guidance ondefining a milestone and determining when it may be appropriate to apply the milestone method of revenue recognition for research or developmenttransactions. The amendments in ASU 2010−17 are effective on a prospective basis for milestones achieved in fiscal years, and interim periods within thoseyears beginning on or after June 15, 2010. Early adoption is permitted; however, if a Company elects to early adopt, the amendment must be appliedretrospectively from the beginning of the year of adoption. The Company’s adoption of ASU 2010−17 is not expected to have an impact on the Company’sconsolidated results of operations or financial condition.In April 2010, the FASB issued ASU No. 2010−13, Topic 718 — Effect of Denominating the Exercise Price of a Share−Based Payment Award in theCurrency of the Market in Which the Underlying Equity Security Trades (“ASU 2010−13”), which provides guidance on the classification of a share−basedpayment award as either equity or a liability. A share−based payment award that contains a condition that is not a market, performance, or service conditionis required to be classified as a liability. The amendments in ASU 2010−13 are effective for fiscal years, and interim periods within those years beginningon or after December 15, 2010. The Company’s adoption of ASU 2010−13 is not expected to have an impact on the Company’s consolidated results ofoperations or financial condition.In January 2010, the FASB issued ASU No. 2010−06, Topic 820 — Improving Disclosures about Fair Value Measurements (“ASU 2010−06”), whichprovides additional fair value measurement disclosures and clarifies certain existing disclosure requirements. Except for the requirement to disclosepurchases, sales, issuances, and settlements of Level 3 measurements on a gross basis, the disclosure and clarification requirements are effective for interimand annual reporting periods beginning after December 15, 2009. The requirement to separately disclose purchases, sales, issuances, and settlements ofrecurring Level 3 measurements on a gross basis is effective for fiscal years beginning after December 15, 2010, and for interim periods within those fiscalyears. ASU 2010−06 relates to disclosure requirements only and as such does not impact the Company’s consolidated results of operations or financialcondition.In December 2009, the FASB issued ASU No. 2009−17, Topic 810 — Improvements to Financial Reporting by Enterprises Involved with Variable InterestEntities (“ASU 2009−17”), which incorporated the revised accounting guidance of variable interest entities into FASB ASC Topic 810, Consolidation.Initially issued by the FASB in June 2009, the revised guidance eliminates the qualifying special−purpose entities (“QSPE”) concept, amends the provisionson determining whether an entity is a variable interest entity and would require consolidation, and requires additional disclosures. This guidance is effectivefor a company’s first annual reporting period that begins after November 15, 2009, interim periods within the first annual reporting period, and for interimand annual reporting periods thereafter. The Company’s adoption of ASU 2009−17 during the first quarter of 2010 did not impact its consolidated results ofoperations or financial condition.
9
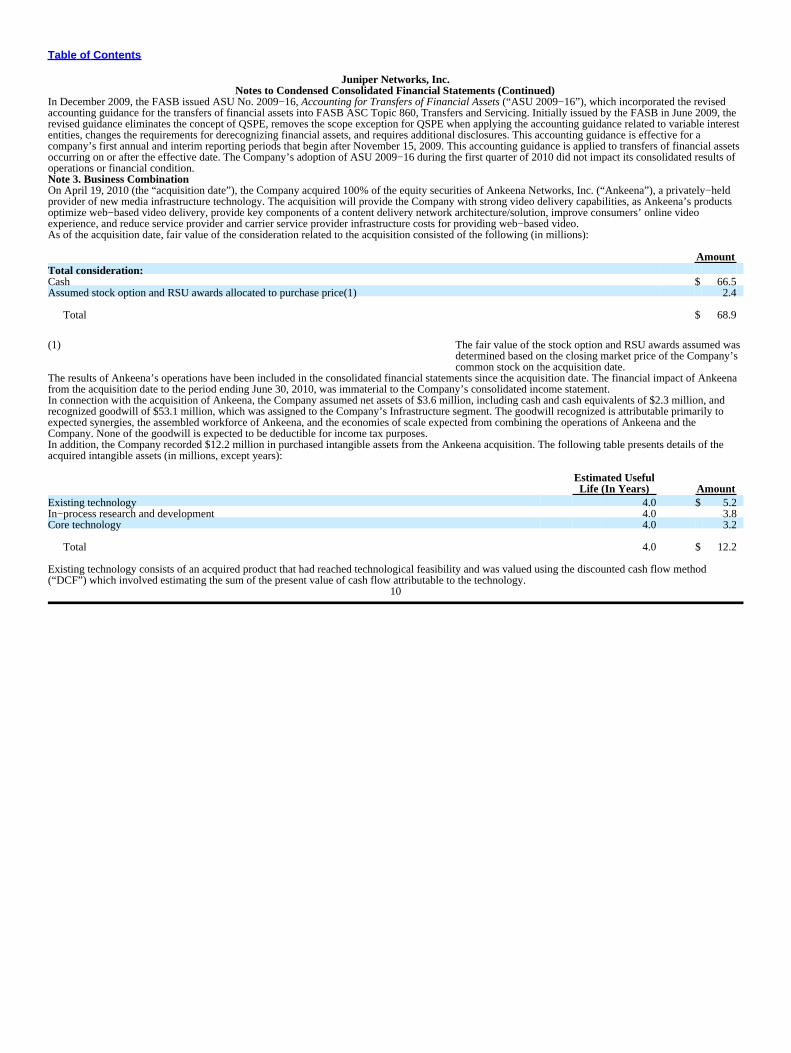
Table of Contents
Juniper Networks, Inc.Notes to Condensed Consolidated Financial Statements (Continued)
In December 2009, the FASB issued ASU No. 2009−16, Accounting for Transfers of Financial Assets (“ASU 2009−16”), which incorporated the revisedaccounting guidance for the transfers of financial assets into FASB ASC Topic 860, Transfers and Servicing. Initially issued by the FASB in June 2009, therevised guidance eliminates the concept of QSPE, removes the scope exception for QSPE when applying the accounting guidance related to variable interestentities, changes the requirements for derecognizing financial assets, and requires additional disclosures. This accounting guidance is effective for acompany’s first annual and interim reporting periods that begin after November 15, 2009. This accounting guidance is applied to transfers of financial assetsoccurring on or after the effective date. The Company’s adoption of ASU 2009−16 during the first quarter of 2010 did not impact its consolidated results ofoperations or financial condition.Note 3. Business CombinationOn April 19, 2010 (the “acquisition date”), the Company acquired 100% of the equity securities of Ankeena Networks, Inc. (“Ankeena”), a privately−heldprovider of new media infrastructure technology. The acquisition will provide the Company with strong video delivery capabilities, as Ankeena’s productsoptimize web−based video delivery, provide key components of a content delivery network architecture/solution, improve consumers’ online videoexperience, and reduce service provider and carrier service provider infrastructure costs for providing web−based video.As of the acquisition date, fair value of the consideration related to the acquisition consisted of the following (in millions):
AmountTotal consideration:Cash $ 66.5Assumed stock option and RSU awards allocated to purchase price(1) 2.4
Total $ 68.9
(1) The fair value of the stock option and RSU awards assumed wasdetermined based on the closing market price of the Company’scommon stock on the acquisition date.
The results of Ankeena’s operations have been included in the consolidated financial statements since the acquisition date. The financial impact of Ankeenafrom the acquisition date to the period ending June 30, 2010, was immaterial to the Company’s consolidated income statement.In connection with the acquisition of Ankeena, the Company assumed net assets of $3.6 million, including cash and cash equivalents of $2.3 million, andrecognized goodwill of $53.1 million, which was assigned to the Company’s Infrastructure segment. The goodwill recognized is attributable primarily toexpected synergies, the assembled workforce of Ankeena, and the economies of scale expected from combining the operations of Ankeena and theCompany. None of the goodwill is expected to be deductible for income tax purposes.In addition, the Company recorded $12.2 million in purchased intangible assets from the Ankeena acquisition. The following table presents details of theacquired intangible assets (in millions, except years):
Estimated UsefulLife (In Years) Amount
Existing technology 4.0 $ 5.2In−process research and development 4.0 3.8Core technology 4.0 3.2
Total 4.0 $ 12.2
Existing technology consists of an acquired product that had reached technological feasibility and was valued using the discounted cash flow method(“DCF”) which involved estimating the sum of the present value of cash flow attributable to the technology.
10
Table of Contents
Juniper Networks, Inc.Notes to Condensed Consolidated Financial Statements (Continued)
Acquired in−process research and development (“IPR&D”) consists of existing research and development projects at the time of the acquisition. Projectsthat qualify as IPR&D assets represent those that have not yet reached technological feasibility and have no alternative future use. IPR&D acquired wasvalued using the DCF method, which involved estimating the sum of the present value of cash flow attributable to the technology. After initial recognition,acquired IPR&D assets are accounted for as indefinite−lived intangible assets. Development costs incurred after acquisition on acquired developmentalprojects are expensed as incurred. Upon completion of development, acquired IPR&D assets are considered amortizable finite−lived assets. At the close ofthe acquisition, total IPR&D assets related to the Ankeena acquisition was $3.8 million and estimated future cost to complete these IPR&D projects was$1.6 million.Core technology represents a combination of processes and trade secrets that were used for existing products and planned future releases. It was valuedusing the profit allocation method, which involved estimating the profit saved due to ownership of an asset or license to the asset versus paying for the rightto use that asset.Purchased intangibles with finite lives will be amortized on a straight−line basis over their respective estimated useful lives.The Company recognized $0.5 million of acquisition−related costs that were expensed in the current period. These costs are reported in its condensedconsolidated income statement as acquisition−related charges.Prior to the acquisition, the Company had a $2.0 million, or a 7.7% ownership interest in Ankeena and accounted for it as a privately−held equityinvestment. As of the acquisition−date, the fair value of this equity interest in Ankeena was $5.2 million based on a noncontrolling interest fair value andwas included in the purchase price. The Company recognized a $3.2 million gain, which was reported within gain (loss) on equity investments in thecondensed consolidated income statement.Note 4. Net Income per ShareBasic net income per share and diluted net income per share are computed by dividing net income available to common stockholders by theweighted−average number of common shares outstanding for that period. Diluted net income per share is computed giving effect to all dilutive potentialshares that were outstanding during the period. Dilutive potential common shares consist of common shares issuable upon exercise of stock options, vestingof restricted stock units (“RSUs”), and performance share awards (“PSAs”).
11
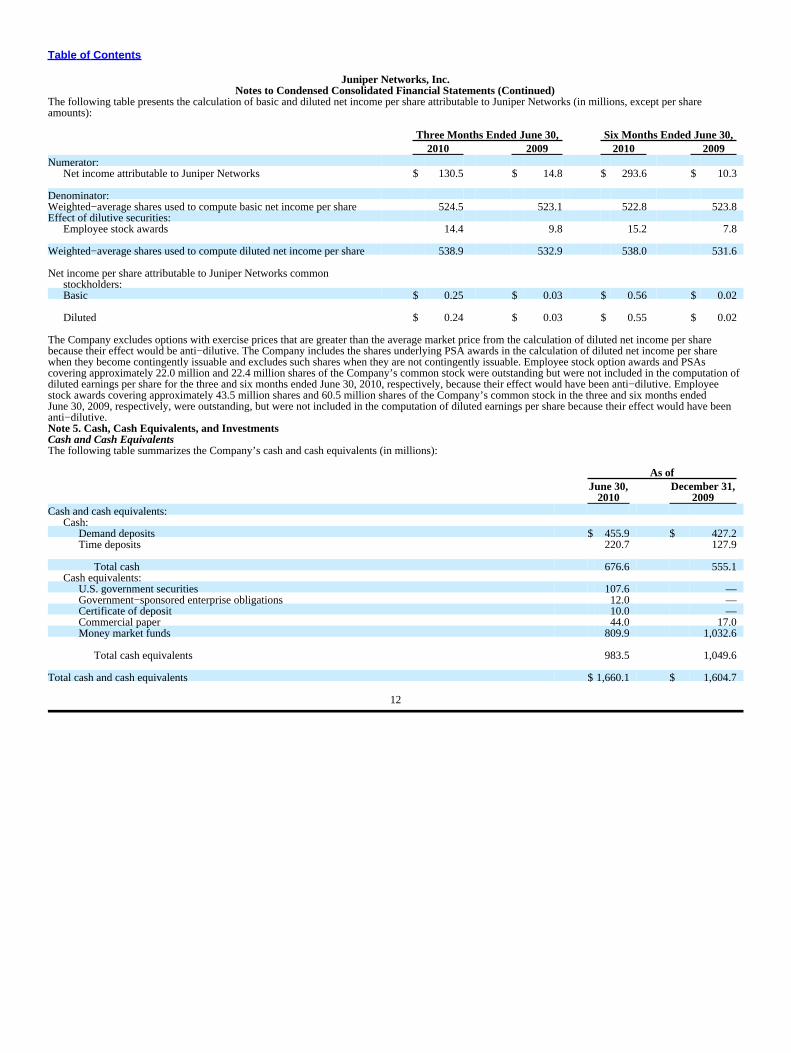
Table of Contents
Juniper Networks, Inc.Notes to Condensed Consolidated Financial Statements (Continued)
The following table presents the calculation of basic and diluted net income per share attributable to Juniper Networks (in millions, except per shareamounts):
Three Months Ended June 30, Six Months Ended June 30,2010 2009 2010 2009
Numerator:Net income attributable to Juniper Networks $ 130.5 $ 14.8 $ 293.6 $ 10.3
Denominator:Weighted−average shares used to compute basic net income per share 524.5 523.1 522.8 523.8Effect of dilutive securities:
Employee stock awards 14.4 9.8 15.2 7.8
Weighted−average shares used to compute diluted net income per share 538.9 532.9 538.0 531.6
Net income per share attributable to Juniper Networks commonstockholders:Basic $ 0.25 $ 0.03 $ 0.56 $ 0.02
Diluted $ 0.24 $ 0.03 $ 0.55 $ 0.02
The Company excludes options with exercise prices that are greater than the average market price from the calculation of diluted net income per sharebecause their effect would be anti−dilutive. The Company includes the shares underlying PSA awards in the calculation of diluted net income per sharewhen they become contingently issuable and excludes such shares when they are not contingently issuable. Employee stock option awards and PSAscovering approximately 22.0 million and 22.4 million shares of the Company’s common stock were outstanding but were not included in the computation ofdiluted earnings per share for the three and six months ended June 30, 2010, respectively, because their effect would have been anti−dilutive. Employeestock awards covering approximately 43.5 million shares and 60.5 million shares of the Company’s common stock in the three and six months endedJune 30, 2009, respectively, were outstanding, but were not included in the computation of diluted earnings per share because their effect would have beenanti−dilutive.Note 5. Cash, Cash Equivalents, and InvestmentsCash and Cash EquivalentsThe following table summarizes the Company’s cash and cash equivalents (in millions):
As ofJune 30, December 31,
2010 2009Cash and cash equivalents:
Cash:Demand deposits $ 455.9 $ 427.2Time deposits 220.7 127.9
Total cash 676.6 555.1Cash equivalents:
U.S. government securities 107.6 —Government−sponsored enterprise obligations 12.0 —Certificate of deposit 10.0 —Commercial paper 44.0 17.0Money market funds 809.9 1,032.6
Total cash equivalents 983.5 1,049.6
Total cash and cash equivalents $ 1,660.1 $ 1,604.7
12
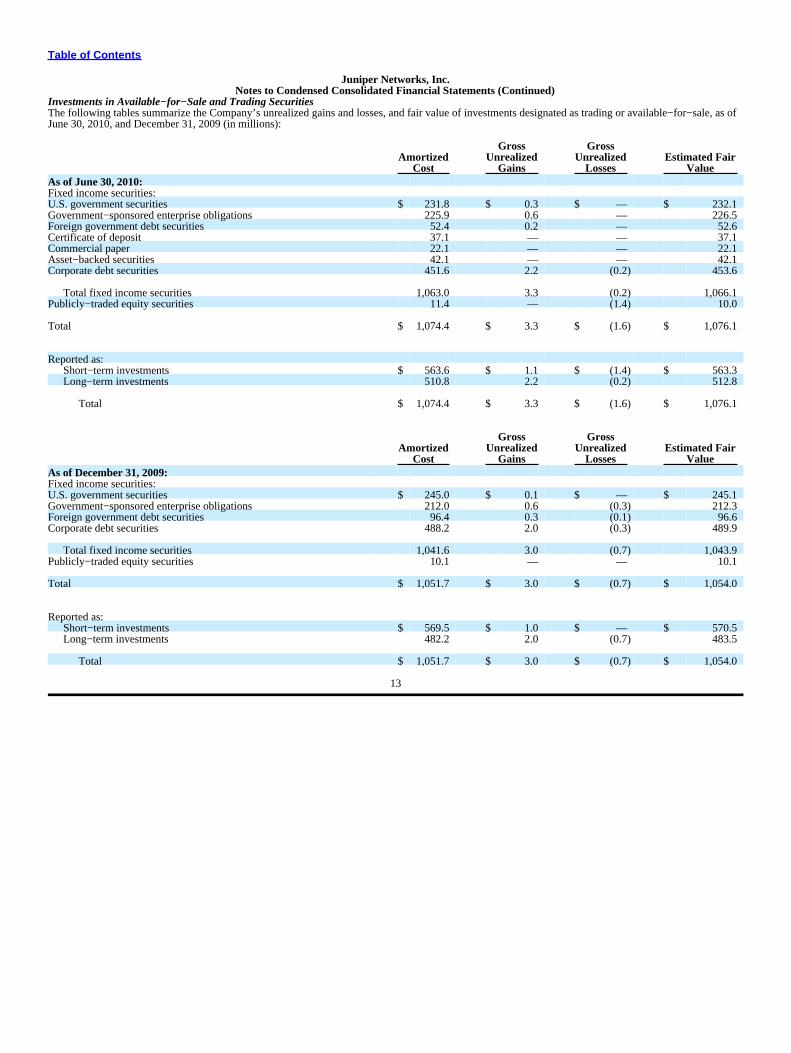
Table of Contents
Juniper Networks, Inc.Notes to Condensed Consolidated Financial Statements (Continued)
Investments in Available−for−Sale and Trading SecuritiesThe following tables summarize the Company’s unrealized gains and losses, and fair value of investments designated as trading or available−for−sale, as ofJune 30, 2010, and December 31, 2009 (in millions):
Gross GrossAmortized Unrealized Unrealized Estimated Fair
Cost Gains Losses ValueAs of June 30, 2010:Fixed income securities:U.S. government securities $ 231.8 $ 0.3 $ — $ 232.1Government−sponsored enterprise obligations 225.9 0.6 — 226.5Foreign government debt securities 52.4 0.2 — 52.6Certificate of deposit 37.1 — — 37.1Commercial paper 22.1 — — 22.1Asset−backed securities 42.1 — — 42.1Corporate debt securities 451.6 2.2 (0.2) 453.6
Total fixed income securities 1,063.0 3.3 (0.2) 1,066.1Publicly−traded equity securities 11.4 — (1.4) 10.0
Total $ 1,074.4 $ 3.3 $ (1.6) $ 1,076.1
Reported as:Short−term investments $ 563.6 $ 1.1 $ (1.4) $ 563.3Long−term investments 510.8 2.2 (0.2) 512.8
Total $ 1,074.4 $ 3.3 $ (1.6) $ 1,076.1
Gross GrossAmortized Unrealized Unrealized Estimated Fair
Cost Gains Losses ValueAs of December 31, 2009:Fixed income securities:U.S. government securities $ 245.0 $ 0.1 $ — $ 245.1Government−sponsored enterprise obligations 212.0 0.6 (0.3) 212.3Foreign government debt securities 96.4 0.3 (0.1) 96.6Corporate debt securities 488.2 2.0 (0.3) 489.9
Total fixed income securities 1,041.6 3.0 (0.7) 1,043.9Publicly−traded equity securities 10.1 — — 10.1
Total $ 1,051.7 $ 3.0 $ (0.7) $ 1,054.0
Reported as:Short−term investments $ 569.5 $ 1.0 $ — $ 570.5Long−term investments 482.2 2.0 (0.7) 483.5
Total $ 1,051.7 $ 3.0 $ (0.7) $ 1,054.0
13
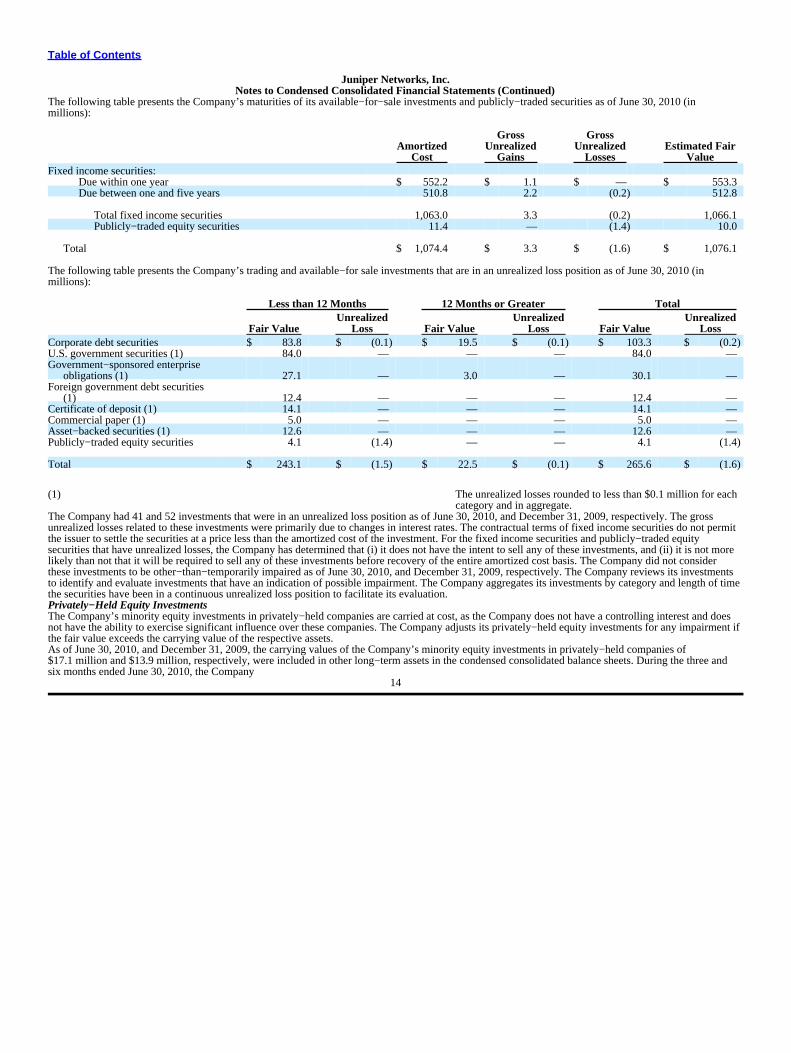
Table of Contents
Juniper Networks, Inc.Notes to Condensed Consolidated Financial Statements (Continued)
The following table presents the Company’s maturities of its available−for−sale investments and publicly−traded securities as of June 30, 2010 (inmillions):
Gross GrossAmortized Unrealized Unrealized Estimated Fair
Cost Gains Losses ValueFixed income securities:
Due within one year $ 552.2 $ 1.1 $ — $ 553.3Due between one and five years 510.8 2.2 (0.2) 512.8
Total fixed income securities 1,063.0 3.3 (0.2) 1,066.1Publicly−traded equity securities 11.4 — (1.4) 10.0
Total $ 1,074.4 $ 3.3 $ (1.6) $ 1,076.1
The following table presents the Company’s trading and available−for sale investments that are in an unrealized loss position as of June 30, 2010 (inmillions):
Less than 12 Months 12 Months or Greater TotalUnrealized Unrealized Unrealized
Fair Value Loss Fair Value Loss Fair Value LossCorporate debt securities $ 83.8 $ (0.1) $ 19.5 $ (0.1) $ 103.3 $ (0.2)U.S. government securities (1) 84.0 — — — 84.0 —Government−sponsored enterprise
obligations (1) 27.1 — 3.0 — 30.1 —Foreign government debt securities
(1) 12.4 — — — 12.4 —Certificate of deposit (1) 14.1 — — — 14.1 —Commercial paper (1) 5.0 — — — 5.0 —Asset−backed securities (1) 12.6 — — — 12.6 —Publicly−traded equity securities 4.1 (1.4) — — 4.1 (1.4)
Total $ 243.1 $ (1.5) $ 22.5 $ (0.1) $ 265.6 $ (1.6)
(1) The unrealized losses rounded to less than $0.1 million for eachcategory and in aggregate.
The Company had 41 and 52 investments that were in an unrealized loss position as of June 30, 2010, and December 31, 2009, respectively. The grossunrealized losses related to these investments were primarily due to changes in interest rates. The contractual terms of fixed income securities do not permitthe issuer to settle the securities at a price less than the amortized cost of the investment. For the fixed income securities and publicly−traded equitysecurities that have unrealized losses, the Company has determined that (i) it does not have the intent to sell any of these investments, and (ii) it is not morelikely than not that it will be required to sell any of these investments before recovery of the entire amortized cost basis. The Company did not considerthese investments to be other−than−temporarily impaired as of June 30, 2010, and December 31, 2009, respectively. The Company reviews its investmentsto identify and evaluate investments that have an indication of possible impairment. The Company aggregates its investments by category and length of timethe securities have been in a continuous unrealized loss position to facilitate its evaluation.Privately−Held Equity InvestmentsThe Company’s minority equity investments in privately−held companies are carried at cost, as the Company does not have a controlling interest and doesnot have the ability to exercise significant influence over these companies. The Company adjusts its privately−held equity investments for any impairment ifthe fair value exceeds the carrying value of the respective assets.As of June 30, 2010, and December 31, 2009, the carrying values of the Company’s minority equity investments in privately−held companies of$17.1 million and $13.9 million, respectively, were included in other long−term assets in the condensed consolidated balance sheets. During the three andsix months ended June 30, 2010, the Company
14
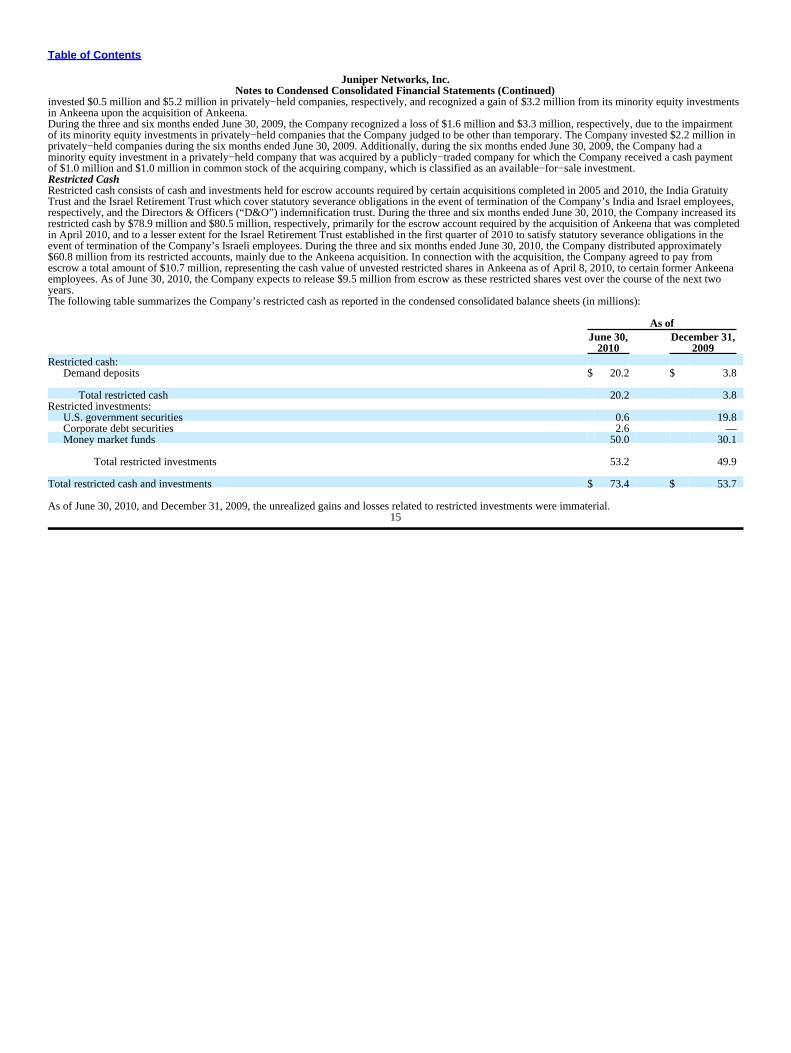
Table of Contents
Juniper Networks, Inc.Notes to Condensed Consolidated Financial Statements (Continued)
invested $0.5 million and $5.2 million in privately−held companies, respectively, and recognized a gain of $3.2 million from its minority equity investmentsin Ankeena upon the acquisition of Ankeena.During the three and six months ended June 30, 2009, the Company recognized a loss of $1.6 million and $3.3 million, respectively, due to the impairmentof its minority equity investments in privately−held companies that the Company judged to be other than temporary. The Company invested $2.2 million inprivately−held companies during the six months ended June 30, 2009. Additionally, during the six months ended June 30, 2009, the Company had aminority equity investment in a privately−held company that was acquired by a publicly−traded company for which the Company received a cash paymentof $1.0 million and $1.0 million in common stock of the acquiring company, which is classified as an available−for−sale investment.Restricted CashRestricted cash consists of cash and investments held for escrow accounts required by certain acquisitions completed in 2005 and 2010, the India GratuityTrust and the Israel Retirement Trust which cover statutory severance obligations in the event of termination of the Company’s India and Israel employees,respectively, and the Directors & Officers (“D&O”) indemnification trust. During the three and six months ended June 30, 2010, the Company increased itsrestricted cash by $78.9 million and $80.5 million, respectively, primarily for the escrow account required by the acquisition of Ankeena that was completedin April 2010, and to a lesser extent for the Israel Retirement Trust established in the first quarter of 2010 to satisfy statutory severance obligations in theevent of termination of the Company’s Israeli employees. During the three and six months ended June 30, 2010, the Company distributed approximately$60.8 million from its restricted accounts, mainly due to the Ankeena acquisition. In connection with the acquisition, the Company agreed to pay fromescrow a total amount of $10.7 million, representing the cash value of unvested restricted shares in Ankeena as of April 8, 2010, to certain former Ankeenaemployees. As of June 30, 2010, the Company expects to release $9.5 million from escrow as these restricted shares vest over the course of the next twoyears.The following table summarizes the Company’s restricted cash as reported in the condensed consolidated balance sheets (in millions):
As ofJune 30, December 31,
2010 2009Restricted cash:
Demand deposits $ 20.2 $ 3.8
Total restricted cash 20.2 3.8Restricted investments:
U.S. government securities 0.6 19.8Corporate debt securities 2.6 —Money market funds 50.0 30.1
Total restricted investments 53.2 49.9
Total restricted cash and investments $ 73.4 $ 53.7
As of June 30, 2010, and December 31, 2009, the unrealized gains and losses related to restricted investments were immaterial.15

Table of Contents
Juniper Networks, Inc.Notes to Condensed Consolidated Financial Statements (Continued)
Note 6. Fair Value MeasurementsThe Company determines the fair values of its financial instruments based on a fair value hierarchy, which requires an entity to maximize the use ofobservable inputs and minimize the use of unobservable inputs when measuring fair value. Fair value is defined as the price that would be received uponsale of an asset or paid to transfer a liability in an orderly transaction between market participants at the measurement date. The fair value assumes that thetransaction to sell the asset or transfer the liability occurs in the principal or most advantageous market for the asset or liability and establishes that the fairvalue of an asset or liability shall be determined based on the assumptions that market participants would use in pricing the asset or liability. Theclassification of a financial asset or liability within the hierarchy is based upon the lowest level input that is significant to the fair value measurement. Thefair value hierarchy prioritizes the inputs into three levels that may be used to measure fair value:Level 1 – Inputs are unadjusted quoted prices in active markets for identical assets or liabilities.Level 2 – Inputs are quoted prices for similar assets and liabilities in active markets or inputs that are observable for the asset or liability, either directly orindirectly through market corroboration, for substantially the full term of the financial instrument. These inputs are valued using market based approaches.Level 3 – Inputs are unobservable inputs based on the Company’s assumptions. These inputs, if any, are valued using internal financial models.
16
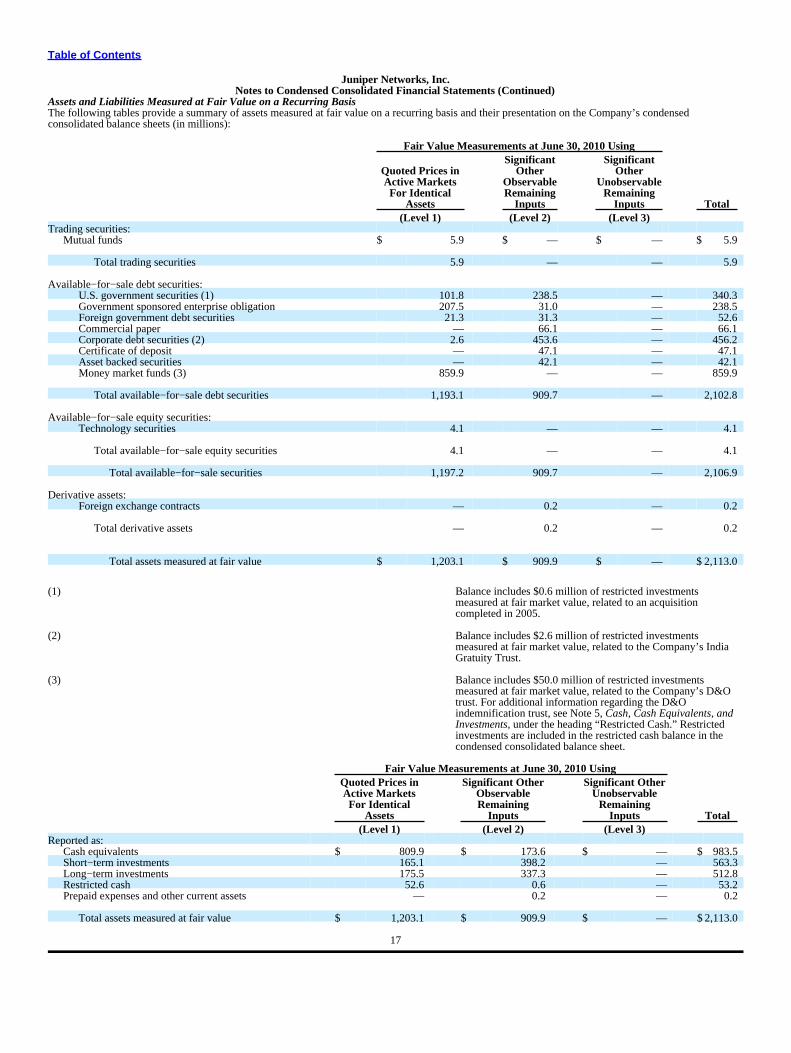
Table of Contents
Juniper Networks, Inc.Notes to Condensed Consolidated Financial Statements (Continued)
Assets and Liabilities Measured at Fair Value on a Recurring BasisThe following tables provide a summary of assets measured at fair value on a recurring basis and their presentation on the Company’s condensedconsolidated balance sheets (in millions):
Fair Value Measurements at June 30, 2010 UsingSignificant Significant
Quoted Prices in Other OtherActive Markets Observable UnobservableFor Identical Remaining Remaining
Assets Inputs Inputs Total(Level 1) (Level 2) (Level 3)
Trading securities:Mutual funds $ 5.9 $ — $ — $ 5.9
Total trading securities 5.9 — — 5.9
Available−for−sale debt securities:U.S. government securities (1) 101.8 238.5 — 340.3Government sponsored enterprise obligation 207.5 31.0 — 238.5Foreign government debt securities 21.3 31.3 — 52.6Commercial paper — 66.1 — 66.1Corporate debt securities (2) 2.6 453.6 — 456.2Certificate of deposit — 47.1 — 47.1Asset backed securities — 42.1 — 42.1Money market funds (3) 859.9 — — 859.9
Total available−for−sale debt securities 1,193.1 909.7 — 2,102.8
Available−for−sale equity securities:Technology securities 4.1 — — 4.1
Total available−for−sale equity securities 4.1 — — 4.1
Total available−for−sale securities 1,197.2 909.7 — 2,106.9
Derivative assets:Foreign exchange contracts — 0.2 — 0.2
Total derivative assets — 0.2 — 0.2
Total assets measured at fair value $ 1,203.1 $ 909.9 $ — $ 2,113.0
(1) Balance includes $0.6 million of restricted investmentsmeasured at fair market value, related to an acquisitioncompleted in 2005.
(2) Balance includes $2.6 million of restricted investmentsmeasured at fair market value, related to the Company’s IndiaGratuity Trust.
(3) Balance includes $50.0 million of restricted investmentsmeasured at fair market value, related to the Company’s D&Otrust. For additional information regarding the D&Oindemnification trust, see Note 5, Cash, Cash Equivalents, andInvestments, under the heading “Restricted Cash.” Restrictedinvestments are included in the restricted cash balance in thecondensed consolidated balance sheet.
Fair Value Measurements at June 30, 2010 UsingQuoted Prices in Significant Other Significant OtherActive Markets Observable UnobservableFor Identical Remaining Remaining
Assets Inputs Inputs Total(Level 1) (Level 2) (Level 3)
Reported as:Cash equivalents $ 809.9 $ 173.6 $ — $ 983.5Short−term investments 165.1 398.2 — 563.3Long−term investments 175.5 337.3 — 512.8Restricted cash 52.6 0.6 — 53.2Prepaid expenses and other current assets — 0.2 — 0.2
Total assets measured at fair value $ 1,203.1 $ 909.9 $ — $2,113.0
17
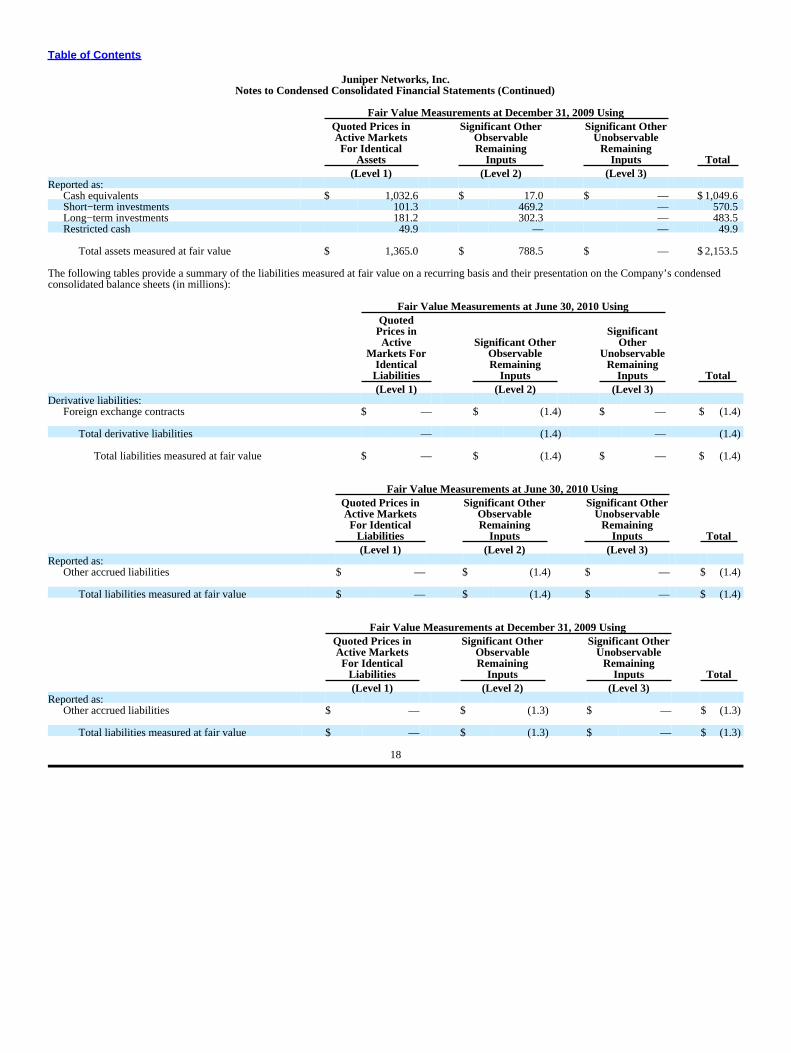
Table of Contents
Juniper Networks, Inc.Notes to Condensed Consolidated Financial Statements (Continued)
Fair Value Measurements at December 31, 2009 UsingQuoted Prices in Significant Other Significant OtherActive Markets Observable UnobservableFor Identical Remaining Remaining
Assets Inputs Inputs Total(Level 1) (Level 2) (Level 3)
Reported as:Cash equivalents $ 1,032.6 $ 17.0 $ — $1,049.6Short−term investments 101.3 469.2 — 570.5Long−term investments 181.2 302.3 — 483.5Restricted cash 49.9 — — 49.9
Total assets measured at fair value $ 1,365.0 $ 788.5 $ — $2,153.5
The following tables provide a summary of the liabilities measured at fair value on a recurring basis and their presentation on the Company’s condensedconsolidated balance sheets (in millions):
Fair Value Measurements at June 30, 2010 UsingQuotedPrices in SignificantActive Significant Other Other
Markets For Observable UnobservableIdentical Remaining RemainingLiabilities Inputs Inputs Total(Level 1) (Level 2) (Level 3)
Derivative liabilities:Foreign exchange contracts $ — $ (1.4) $ — $ (1.4)
Total derivative liabilities — (1.4) — (1.4)
Total liabilities measured at fair value $ — $ (1.4) $ — $ (1.4)
Fair Value Measurements at June 30, 2010 UsingQuoted Prices in Significant Other Significant OtherActive Markets Observable UnobservableFor Identical Remaining Remaining
Liabilities Inputs Inputs Total(Level 1) (Level 2) (Level 3)
Reported as:Other accrued liabilities $ — $ (1.4) $ — $ (1.4)
Total liabilities measured at fair value $ — $ (1.4) $ — $ (1.4)
Fair Value Measurements at December 31, 2009 UsingQuoted Prices in Significant Other Significant OtherActive Markets Observable UnobservableFor Identical Remaining Remaining
Liabilities Inputs Inputs Total(Level 1) (Level 2) (Level 3)
Reported as:Other accrued liabilities $ — $ (1.3) $ — $ (1.3)
Total liabilities measured at fair value $ — $ (1.3) $ — $ (1.3)
18
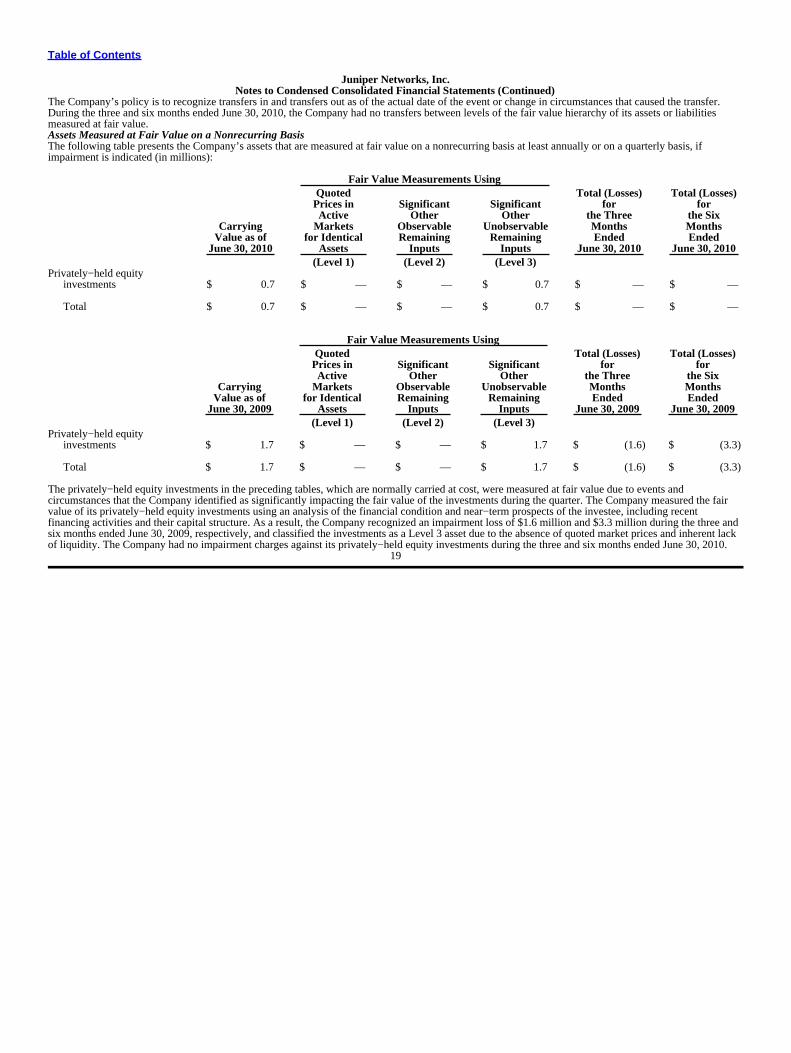
Table of Contents
Juniper Networks, Inc.Notes to Condensed Consolidated Financial Statements (Continued)
The Company’s policy is to recognize transfers in and transfers out as of the actual date of the event or change in circumstances that caused the transfer.During the three and six months ended June 30, 2010, the Company had no transfers between levels of the fair value hierarchy of its assets or liabilitiesmeasured at fair value.Assets Measured at Fair Value on a Nonrecurring BasisThe following table presents the Company’s assets that are measured at fair value on a nonrecurring basis at least annually or on a quarterly basis, ifimpairment is indicated (in millions):
Fair Value Measurements UsingQuoted Total (Losses) Total (Losses)Prices in Significant Significant for forActive Other Other the Three the Six
Carrying Markets Observable Unobservable Months MonthsValue as of for Identical Remaining Remaining Ended Ended
June 30, 2010 Assets Inputs Inputs June 30, 2010 June 30, 2010(Level 1) (Level 2) (Level 3)
Privately−held equityinvestments $ 0.7 $ — $ — $ 0.7 $ — $ —
Total $ 0.7 $ — $ — $ 0.7 $ — $ —
Fair Value Measurements UsingQuoted Total (Losses) Total (Losses)Prices in Significant Significant for forActive Other Other the Three the Six
Carrying Markets Observable Unobservable Months MonthsValue as of for Identical Remaining Remaining Ended Ended
June 30, 2009 Assets Inputs Inputs June 30, 2009 June 30, 2009(Level 1) (Level 2) (Level 3)
Privately−held equityinvestments $ 1.7 $ — $ — $ 1.7 $ (1.6) $ (3.3)
Total $ 1.7 $ — $ — $ 1.7 $ (1.6) $ (3.3)
The privately−held equity investments in the preceding tables, which are normally carried at cost, were measured at fair value due to events andcircumstances that the Company identified as significantly impacting the fair value of the investments during the quarter. The Company measured the fairvalue of its privately−held equity investments using an analysis of the financial condition and near−term prospects of the investee, including recentfinancing activities and their capital structure. As a result, the Company recognized an impairment loss of $1.6 million and $3.3 million during the three andsix months ended June 30, 2009, respectively, and classified the investments as a Level 3 asset due to the absence of quoted market prices and inherent lackof liquidity. The Company had no impairment charges against its privately−held equity investments during the three and six months ended June 30, 2010.
19
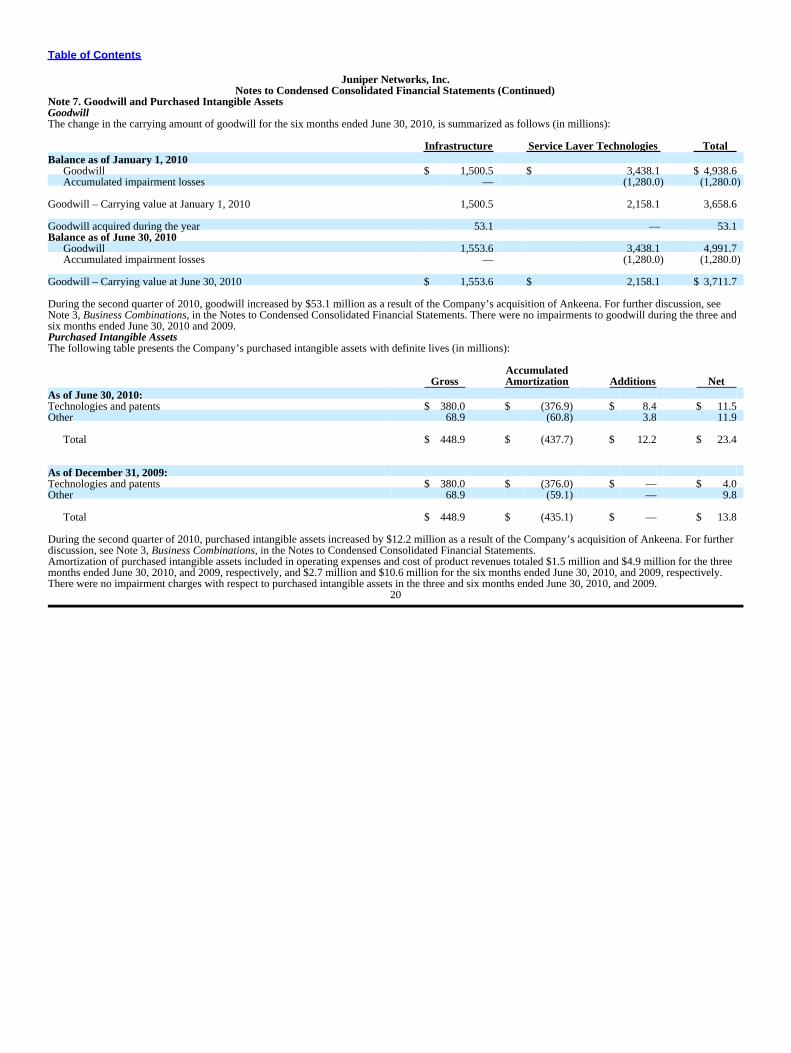
Table of Contents
Juniper Networks, Inc.Notes to Condensed Consolidated Financial Statements (Continued)
Note 7. Goodwill and Purchased Intangible AssetsGoodwillThe change in the carrying amount of goodwill for the six months ended June 30, 2010, is summarized as follows (in millions):
Infrastructure Service Layer Technologies TotalBalance as of January 1, 2010
Goodwill $ 1,500.5 $ 3,438.1 $ 4,938.6Accumulated impairment losses — (1,280.0) (1,280.0)
Goodwill – Carrying value at January 1, 2010 1,500.5 2,158.1 3,658.6
Goodwill acquired during the year 53.1 — 53.1Balance as of June 30, 2010
Goodwill 1,553.6 3,438.1 4,991.7Accumulated impairment losses — (1,280.0) (1,280.0)
Goodwill – Carrying value at June 30, 2010 $ 1,553.6 $ 2,158.1 $ 3,711.7
During the second quarter of 2010, goodwill increased by $53.1 million as a result of the Company’s acquisition of Ankeena. For further discussion, seeNote 3, Business Combinations, in the Notes to Condensed Consolidated Financial Statements. There were no impairments to goodwill during the three andsix months ended June 30, 2010 and 2009.Purchased Intangible AssetsThe following table presents the Company’s purchased intangible assets with definite lives (in millions):
AccumulatedGross Amortization Additions Net
As of June 30, 2010:Technologies and patents $ 380.0 $ (376.9) $ 8.4 $ 11.5Other 68.9 (60.8) 3.8 11.9
Total $ 448.9 $ (437.7) $ 12.2 $ 23.4
As of December 31, 2009:Technologies and patents $ 380.0 $ (376.0) $ — $ 4.0Other 68.9 (59.1) — 9.8
Total $ 448.9 $ (435.1) $ — $ 13.8
During the second quarter of 2010, purchased intangible assets increased by $12.2 million as a result of the Company’s acquisition of Ankeena. For furtherdiscussion, see Note 3, Business Combinations, in the Notes to Condensed Consolidated Financial Statements.Amortization of purchased intangible assets included in operating expenses and cost of product revenues totaled $1.5 million and $4.9 million for the threemonths ended June 30, 2010, and 2009, respectively, and $2.7 million and $10.6 million for the six months ended June 30, 2010, and 2009, respectively.There were no impairment charges with respect to purchased intangible assets in the three and six months ended June 30, 2010, and 2009.
20
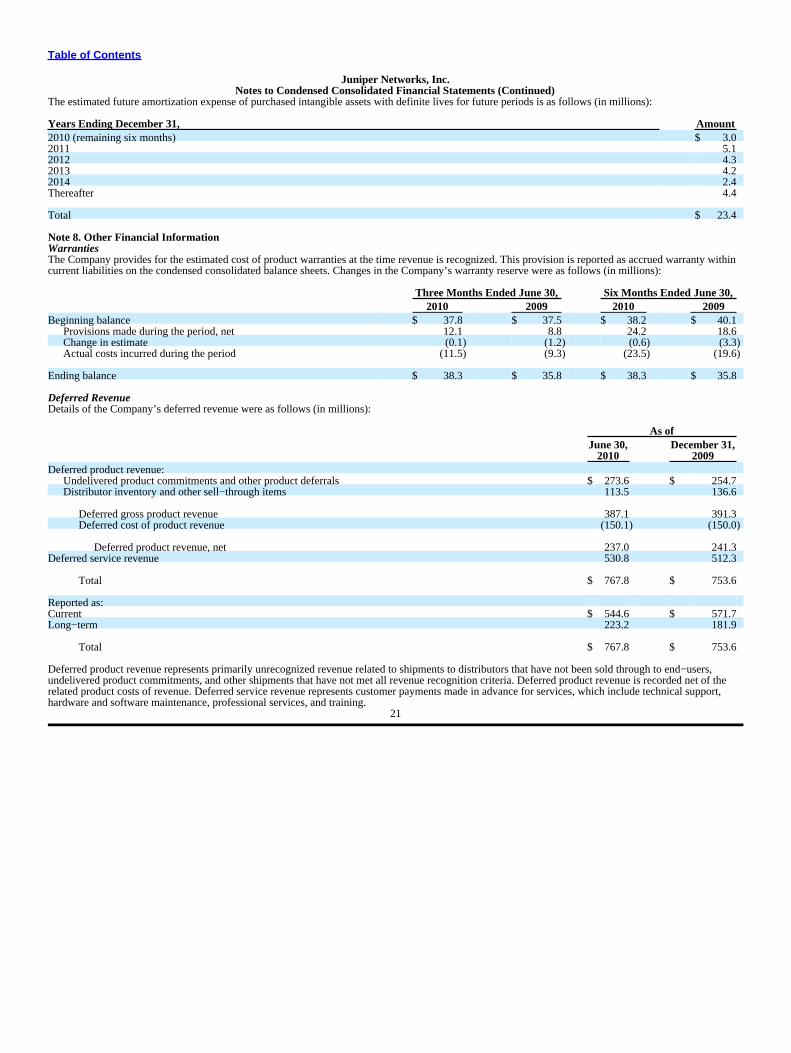
Table of Contents
Juniper Networks, Inc.Notes to Condensed Consolidated Financial Statements (Continued)
The estimated future amortization expense of purchased intangible assets with definite lives for future periods is as follows (in millions):
Years Ending December 31, Amount2010 (remaining six months) $ 3.02011 5.12012 4.32013 4.22014 2.4Thereafter 4.4
Total $ 23.4
Note 8. Other Financial InformationWarrantiesThe Company provides for the estimated cost of product warranties at the time revenue is recognized. This provision is reported as accrued warranty withincurrent liabilities on the condensed consolidated balance sheets. Changes in the Company’s warranty reserve were as follows (in millions):
Three Months Ended June 30, Six Months Ended June 30,2010 2009 2010 2009
Beginning balance $ 37.8 $ 37.5 $ 38.2 $ 40.1Provisions made during the period, net 12.1 8.8 24.2 18.6Change in estimate (0.1) (1.2) (0.6) (3.3)Actual costs incurred during the period (11.5) (9.3) (23.5) (19.6)
Ending balance $ 38.3 $ 35.8 $ 38.3 $ 35.8
Deferred RevenueDetails of the Company’s deferred revenue were as follows (in millions):
As ofJune 30, December 31,
2010 2009Deferred product revenue:
Undelivered product commitments and other product deferrals $ 273.6 $ 254.7Distributor inventory and other sell−through items 113.5 136.6
Deferred gross product revenue 387.1 391.3Deferred cost of product revenue (150.1) (150.0)
Deferred product revenue, net 237.0 241.3Deferred service revenue 530.8 512.3
Total $ 767.8 $ 753.6
Reported as:Current $ 544.6 $ 571.7Long−term 223.2 181.9
Total $ 767.8 $ 753.6
Deferred product revenue represents primarily unrecognized revenue related to shipments to distributors that have not been sold through to end−users,undelivered product commitments, and other shipments that have not met all revenue recognition criteria. Deferred product revenue is recorded net of therelated product costs of revenue. Deferred service revenue represents customer payments made in advance for services, which include technical support,hardware and software maintenance, professional services, and training.
21
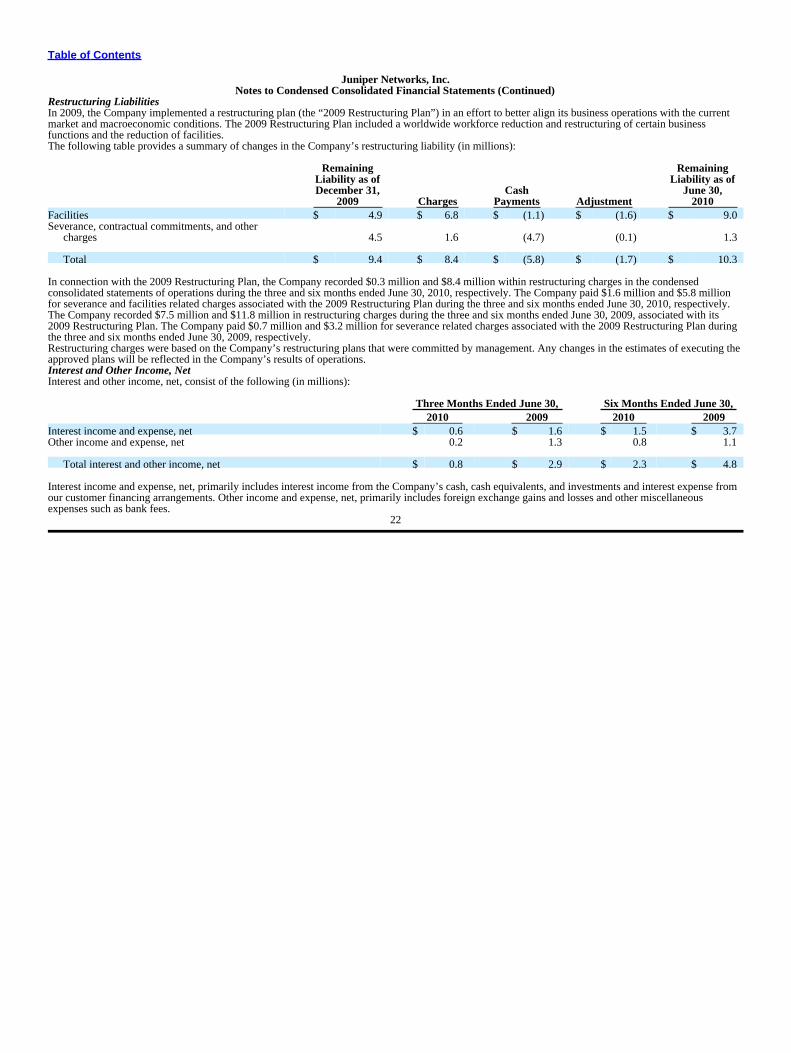
Table of Contents
Juniper Networks, Inc.Notes to Condensed Consolidated Financial Statements (Continued)
Restructuring LiabilitiesIn 2009, the Company implemented a restructuring plan (the “2009 Restructuring Plan”) in an effort to better align its business operations with the currentmarket and macroeconomic conditions. The 2009 Restructuring Plan included a worldwide workforce reduction and restructuring of certain businessfunctions and the reduction of facilities.The following table provides a summary of changes in the Company’s restructuring liability (in millions):
Remaining RemainingLiability as of Liability as ofDecember 31, Cash June 30,
2009 Charges Payments Adjustment 2010Facilities $ 4.9 $ 6.8 $ (1.1) $ (1.6) $ 9.0Severance, contractual commitments, and other
charges 4.5 1.6 (4.7) (0.1) 1.3
Total $ 9.4 $ 8.4 $ (5.8) $ (1.7) $ 10.3
In connection with the 2009 Restructuring Plan, the Company recorded $0.3 million and $8.4 million within restructuring charges in the condensedconsolidated statements of operations during the three and six months ended June 30, 2010, respectively. The Company paid $1.6 million and $5.8 millionfor severance and facilities related charges associated with the 2009 Restructuring Plan during the three and six months ended June 30, 2010, respectively.The Company recorded $7.5 million and $11.8 million in restructuring charges during the three and six months ended June 30, 2009, associated with its2009 Restructuring Plan. The Company paid $0.7 million and $3.2 million for severance related charges associated with the 2009 Restructuring Plan duringthe three and six months ended June 30, 2009, respectively.Restructuring charges were based on the Company’s restructuring plans that were committed by management. Any changes in the estimates of executing theapproved plans will be reflected in the Company’s results of operations.Interest and Other Income, NetInterest and other income, net, consist of the following (in millions):
Three Months Ended June 30, Six Months Ended June 30,2010 2009 2010 2009
Interest income and expense, net $ 0.6 $ 1.6 $ 1.5 $ 3.7Other income and expense, net 0.2 1.3 0.8 1.1
Total interest and other income, net $ 0.8 $ 2.9 $ 2.3 $ 4.8
Interest income and expense, net, primarily includes interest income from the Company’s cash, cash equivalents, and investments and interest expense fromour customer financing arrangements. Other income and expense, net, primarily includes foreign exchange gains and losses and other miscellaneousexpenses such as bank fees.
22
Table of Contents
Juniper Networks, Inc.Notes to Condensed Consolidated Financial Statements (Continued)
Note 9. Financing ArrangementsThe Company has customer financing arrangements to sell its accounts receivable to a major third−party financing provider. The program does not and isnot intended to affect the timing of revenue recognition because the Company only recognizes revenue upon sell−through. Under the financingarrangements, proceeds from the financing provider are due to the Company 30 days from the sale of the receivable. In these transactions with the financingprovider, the Company has surrendered control over the transferred assets. The accounts receivable have been isolated from the Company and put beyondthe reach of creditors, even in the event of bankruptcy. The Company does not maintain effective control over the transferred assets through obligations orrights to redeem, transfer, or repurchase the receivables after they have been transferred.Pursuant to the financing arrangements for the sale of receivables, the Company sold net receivables of $156.2 million and $81.1 million during the threemonths ended June 30, 2010, and 2009, respectively, and $282.4 million and $172.3 million during the six months ended June 30, 2010, and 2009,respectively. During the three months ended June 30, 2010, and 2009, the Company received cash proceeds of $137.6 million and $80.2 million,respectively, and $276.5 million and $175.7 million during the six months ended June 30, 2010, and 2009, respectively, from the financing provider. Theamounts owed by the financing provider recorded as accounts receivable on the Company’s condensed consolidated balance sheets as of June 30, 2010, andDecember 31, 2009, were $99.0 million and $89.8 million, respectively.The portion of the receivable financed that has not been recognized as revenue is accounted for as a financing arrangement and is included in other accruedliabilities and other long−term liabilities in the condensed consolidated balance sheet. As of June 30, 2010, and December 31, 2009, the estimated amountsof cash received from the financing provider that had not been recognized as revenue from distributors were $31.6 million and $52.6 million, respectively.Note 10. Derivative InstrumentsThe Company uses derivatives partially to offset its market exposure to fluctuations in certain foreign currencies and does not enter into derivatives forspeculative or trading purposes.Cash Flow HedgesThe Company uses foreign currency forward or option contracts to hedge certain forecasted foreign currency transactions relating to cost of services andoperating expenses. The derivatives are intended to protect the U.S. Dollar equivalent of the Company’s planned cost of services and operating expensesdenominated in foreign currencies. These derivatives are designated as cash flow hedges. Execution of these cash flow hedge derivatives typically occursevery month with maturities of less than one year. The effective portion of the derivative’s gain or loss is initially reported as a component of accumulatedother comprehensive income (loss) on the condensed consolidated balance sheets, and upon occurrence of the forecasted transaction, is subsequentlyreclassified into the cost of services or operating expense line item to which the hedged transaction relates. The Company records any ineffectiveness of thehedging instruments, which was immaterial during the three and six months ended June 30, 2010, and 2009, respectively, in interest and other income, net,on its condensed consolidated statements of operations. Cash flows from such hedges are classified as operating activities. All amounts within accumulatedother comprehensive income (loss) are expected to be reclassified into earnings within the next 12 months.The total fair value of the Company’s derivative assets located in other current assets on the condensed consolidated balance sheet as of June 30, 2010, andDecember 31, 2009, was $0.2 million and $0.2 million, respectively. The total fair value of the Company’s derivative liabilities located in other accruedliabilities on the condensed consolidated balance sheet as of June 30, 2010, and December 31, 2009, was $1.4 million and $1.5 million, respectively.The Company recognized a loss of $2.9 million in accumulated other comprehensive loss for the effective portion of
23
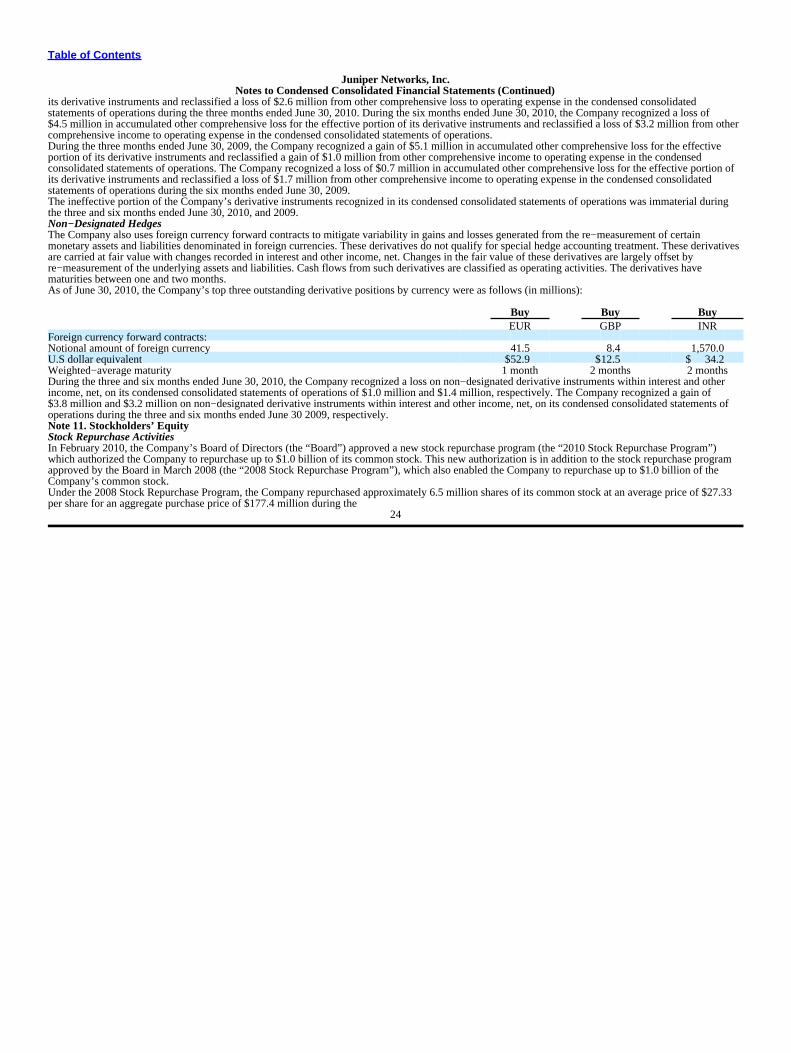
Table of Contents
Juniper Networks, Inc.Notes to Condensed Consolidated Financial Statements (Continued)
its derivative instruments and reclassified a loss of $2.6 million from other comprehensive loss to operating expense in the condensed consolidatedstatements of operations during the three months ended June 30, 2010. During the six months ended June 30, 2010, the Company recognized a loss of$4.5 million in accumulated other comprehensive loss for the effective portion of its derivative instruments and reclassified a loss of $3.2 million from othercomprehensive income to operating expense in the condensed consolidated statements of operations.During the three months ended June 30, 2009, the Company recognized a gain of $5.1 million in accumulated other comprehensive loss for the effectiveportion of its derivative instruments and reclassified a gain of $1.0 million from other comprehensive income to operating expense in the condensedconsolidated statements of operations. The Company recognized a loss of $0.7 million in accumulated other comprehensive loss for the effective portion ofits derivative instruments and reclassified a loss of $1.7 million from other comprehensive income to operating expense in the condensed consolidatedstatements of operations during the six months ended June 30, 2009.The ineffective portion of the Company’s derivative instruments recognized in its condensed consolidated statements of operations was immaterial duringthe three and six months ended June 30, 2010, and 2009.Non−Designated HedgesThe Company also uses foreign currency forward contracts to mitigate variability in gains and losses generated from the re−measurement of certainmonetary assets and liabilities denominated in foreign currencies. These derivatives do not qualify for special hedge accounting treatment. These derivativesare carried at fair value with changes recorded in interest and other income, net. Changes in the fair value of these derivatives are largely offset byre−measurement of the underlying assets and liabilities. Cash flows from such derivatives are classified as operating activities. The derivatives havematurities between one and two months.As of June 30, 2010, the Company’s top three outstanding derivative positions by currency were as follows (in millions):
Buy Buy BuyEUR GBP INR
Foreign currency forward contracts:Notional amount of foreign currency 41.5 8.4 1,570.0U.S dollar equivalent $52.9 $12.5 $ 34.2Weighted−average maturity 1 month 2 months 2 monthsDuring the three and six months ended June 30, 2010, the Company recognized a loss on non−designated derivative instruments within interest and otherincome, net, on its condensed consolidated statements of operations of $1.0 million and $1.4 million, respectively. The Company recognized a gain of$3.8 million and $3.2 million on non−designated derivative instruments within interest and other income, net, on its condensed consolidated statements ofoperations during the three and six months ended June 30 2009, respectively.Note 11. Stockholders’ EquityStock Repurchase ActivitiesIn February 2010, the Company’s Board of Directors (the “Board”) approved a new stock repurchase program (the “2010 Stock Repurchase Program”)which authorized the Company to repurchase up to $1.0 billion of its common stock. This new authorization is in addition to the stock repurchase programapproved by the Board in March 2008 (the “2008 Stock Repurchase Program”), which also enabled the Company to repurchase up to $1.0 billion of theCompany’s common stock.Under the 2008 Stock Repurchase Program, the Company repurchased approximately 6.5 million shares of its common stock at an average price of $27.33per share for an aggregate purchase price of $177.4 million during the
24
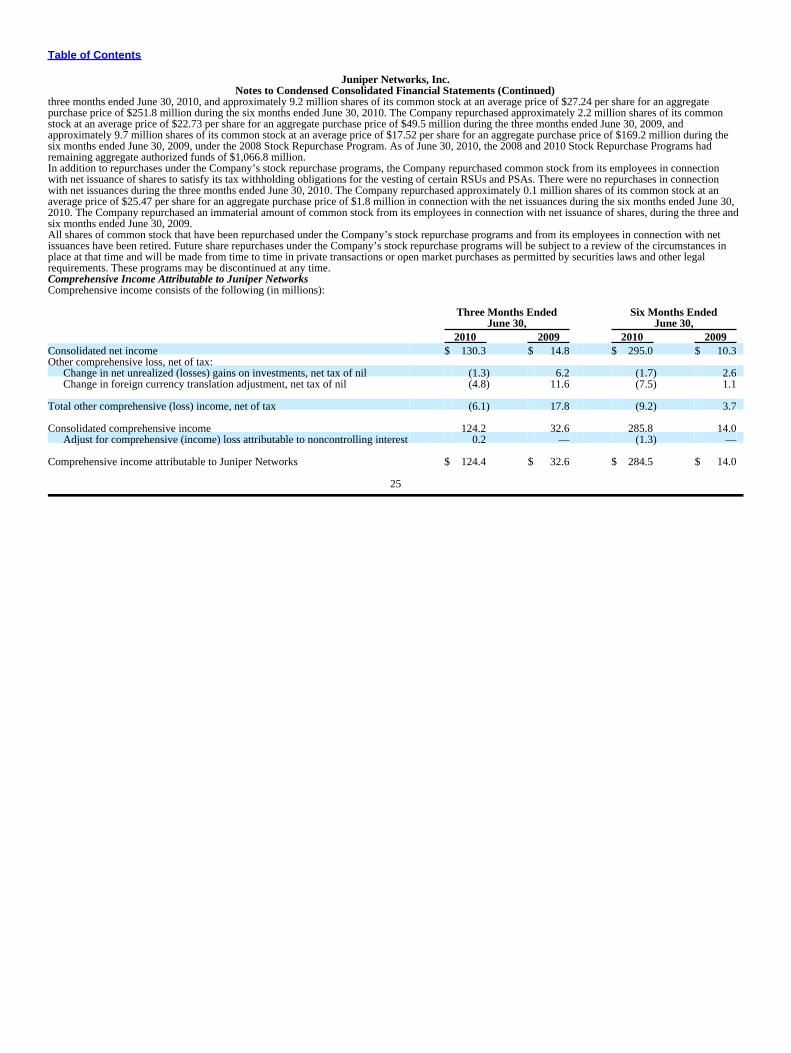
Table of Contents
Juniper Networks, Inc.Notes to Condensed Consolidated Financial Statements (Continued)
three months ended June 30, 2010, and approximately 9.2 million shares of its common stock at an average price of $27.24 per share for an aggregatepurchase price of $251.8 million during the six months ended June 30, 2010. The Company repurchased approximately 2.2 million shares of its commonstock at an average price of $22.73 per share for an aggregate purchase price of $49.5 million during the three months ended June 30, 2009, andapproximately 9.7 million shares of its common stock at an average price of $17.52 per share for an aggregate purchase price of $169.2 million during thesix months ended June 30, 2009, under the 2008 Stock Repurchase Program. As of June 30, 2010, the 2008 and 2010 Stock Repurchase Programs hadremaining aggregate authorized funds of $1,066.8 million.In addition to repurchases under the Company’s stock repurchase programs, the Company repurchased common stock from its employees in connectionwith net issuance of shares to satisfy its tax withholding obligations for the vesting of certain RSUs and PSAs. There were no repurchases in connectionwith net issuances during the three months ended June 30, 2010. The Company repurchased approximately 0.1 million shares of its common stock at anaverage price of $25.47 per share for an aggregate purchase price of $1.8 million in connection with the net issuances during the six months ended June 30,2010. The Company repurchased an immaterial amount of common stock from its employees in connection with net issuance of shares, during the three andsix months ended June 30, 2009.All shares of common stock that have been repurchased under the Company’s stock repurchase programs and from its employees in connection with netissuances have been retired. Future share repurchases under the Company’s stock repurchase programs will be subject to a review of the circumstances inplace at that time and will be made from time to time in private transactions or open market purchases as permitted by securities laws and other legalrequirements. These programs may be discontinued at any time.Comprehensive Income Attributable to Juniper NetworksComprehensive income consists of the following (in millions):
Three Months Ended Six Months EndedJune 30, June 30,
2010 2009 2010 2009Consolidated net income $ 130.3 $ 14.8 $ 295.0 $ 10.3Other comprehensive loss, net of tax:
Change in net unrealized (losses) gains on investments, net tax of nil (1.3) 6.2 (1.7) 2.6Change in foreign currency translation adjustment, net tax of nil (4.8) 11.6 (7.5) 1.1
Total other comprehensive (loss) income, net of tax (6.1) 17.8 (9.2) 3.7
Consolidated comprehensive income 124.2 32.6 285.8 14.0Adjust for comprehensive (income) loss attributable to noncontrolling interest 0.2 — (1.3) —
Comprehensive income attributable to Juniper Networks $ 124.4 $ 32.6 $ 284.5 $ 14.0
25
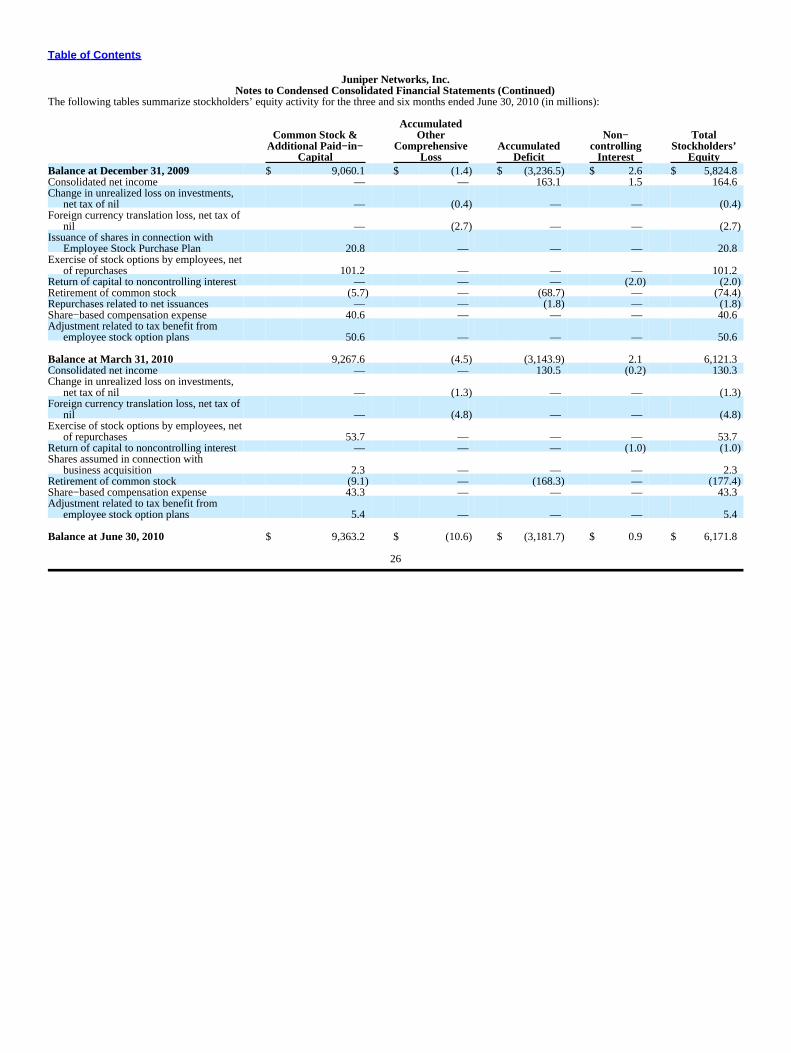
Table of Contents
Juniper Networks, Inc.Notes to Condensed Consolidated Financial Statements (Continued)
The following tables summarize stockholders’ equity activity for the three and six months ended June 30, 2010 (in millions):
AccumulatedCommon Stock & Other Non− Total
Additional Paid−in− Comprehensive Accumulated controlling Stockholders’Capital Loss Deficit Interest Equity
Balance at December 31, 2009 $ 9,060.1 $ (1.4) $ (3,236.5) $ 2.6 $ 5,824.8Consolidated net income — — 163.1 1.5 164.6Change in unrealized loss on investments,
net tax of nil — (0.4) — — (0.4)Foreign currency translation loss, net tax of
nil — (2.7) — — (2.7)Issuance of shares in connection with
Employee Stock Purchase Plan 20.8 — — — 20.8Exercise of stock options by employees, net
of repurchases 101.2 — — — 101.2Return of capital to noncontrolling interest — — — (2.0) (2.0)Retirement of common stock (5.7) — (68.7) — (74.4)Repurchases related to net issuances — — (1.8) — (1.8)Share−based compensation expense 40.6 — — — 40.6Adjustment related to tax benefit from
employee stock option plans 50.6 — — — 50.6
Balance at March 31, 2010 9,267.6 (4.5) (3,143.9) 2.1 6,121.3Consolidated net income — — 130.5 (0.2) 130.3Change in unrealized loss on investments,
net tax of nil — (1.3) — — (1.3)Foreign currency translation loss, net tax of
nil — (4.8) — — (4.8)Exercise of stock options by employees, net
of repurchases 53.7 — — — 53.7Return of capital to noncontrolling interest — — — (1.0) (1.0)Shares assumed in connection with
business acquisition 2.3 — — — 2.3Retirement of common stock (9.1) — (168.3) — (177.4)Share−based compensation expense 43.3 — — — 43.3Adjustment related to tax benefit from
employee stock option plans 5.4 — — — 5.4
Balance at June 30, 2010 $ 9,363.2 $ (10.6) $ (3,181.7) $ 0.9 $ 6,171.8
26
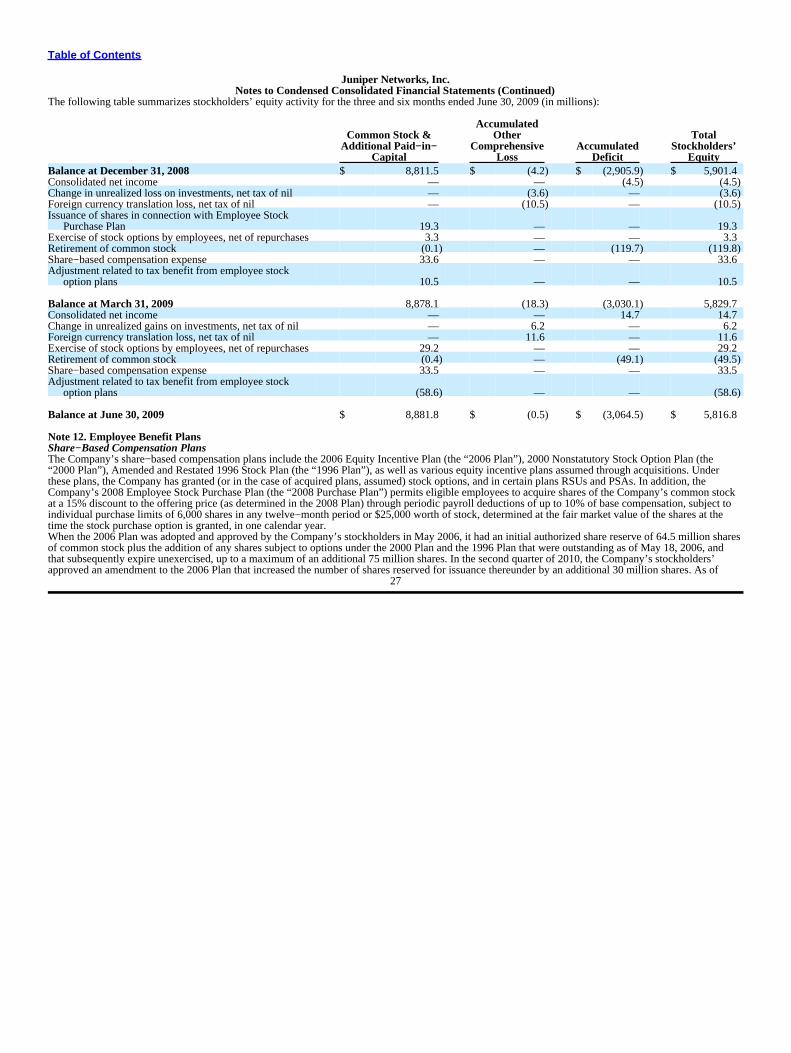
Table of Contents
Juniper Networks, Inc.Notes to Condensed Consolidated Financial Statements (Continued)
The following table summarizes stockholders’ equity activity for the three and six months ended June 30, 2009 (in millions):
AccumulatedCommon Stock & Other Total
Additional Paid−in− Comprehensive Accumulated Stockholders’Capital Loss Deficit Equity
Balance at December 31, 2008 $ 8,811.5 $ (4.2) $ (2,905.9) $ 5,901.4Consolidated net income — — (4.5) (4.5)Change in unrealized loss on investments, net tax of nil — (3.6) — (3.6)Foreign currency translation loss, net tax of nil — (10.5) — (10.5)Issuance of shares in connection with Employee Stock
Purchase Plan 19.3 — — 19.3Exercise of stock options by employees, net of repurchases 3.3 — — 3.3Retirement of common stock (0.1) — (119.7) (119.8)Share−based compensation expense 33.6 — — 33.6Adjustment related to tax benefit from employee stock
option plans 10.5 — — 10.5
Balance at March 31, 2009 8,878.1 (18.3) (3,030.1) 5,829.7Consolidated net income — — 14.7 14.7Change in unrealized gains on investments, net tax of nil — 6.2 — 6.2Foreign currency translation loss, net tax of nil — 11.6 — 11.6Exercise of stock options by employees, net of repurchases 29.2 — — 29.2Retirement of common stock (0.4) — (49.1) (49.5)Share−based compensation expense 33.5 — — 33.5Adjustment related to tax benefit from employee stock
option plans (58.6) — — (58.6)
Balance at June 30, 2009 $ 8,881.8 $ (0.5) $ (3,064.5) $ 5,816.8
Note 12. Employee Benefit PlansShare−Based Compensation PlansThe Company’s share−based compensation plans include the 2006 Equity Incentive Plan (the “2006 Plan”), 2000 Nonstatutory Stock Option Plan (the“2000 Plan”), Amended and Restated 1996 Stock Plan (the “1996 Plan”), as well as various equity incentive plans assumed through acquisitions. Underthese plans, the Company has granted (or in the case of acquired plans, assumed) stock options, and in certain plans RSUs and PSAs. In addition, theCompany’s 2008 Employee Stock Purchase Plan (the “2008 Purchase Plan”) permits eligible employees to acquire shares of the Company’s common stockat a 15% discount to the offering price (as determined in the 2008 Plan) through periodic payroll deductions of up to 10% of base compensation, subject toindividual purchase limits of 6,000 shares in any twelve−month period or $25,000 worth of stock, determined at the fair market value of the shares at thetime the stock purchase option is granted, in one calendar year.When the 2006 Plan was adopted and approved by the Company’s stockholders in May 2006, it had an initial authorized share reserve of 64.5 million sharesof common stock plus the addition of any shares subject to options under the 2000 Plan and the 1996 Plan that were outstanding as of May 18, 2006, andthat subsequently expire unexercised, up to a maximum of an additional 75 million shares. In the second quarter of 2010, the Company’s stockholders’approved an amendment to the 2006 Plan that increased the number of shares reserved for issuance thereunder by an additional 30 million shares. As of
27
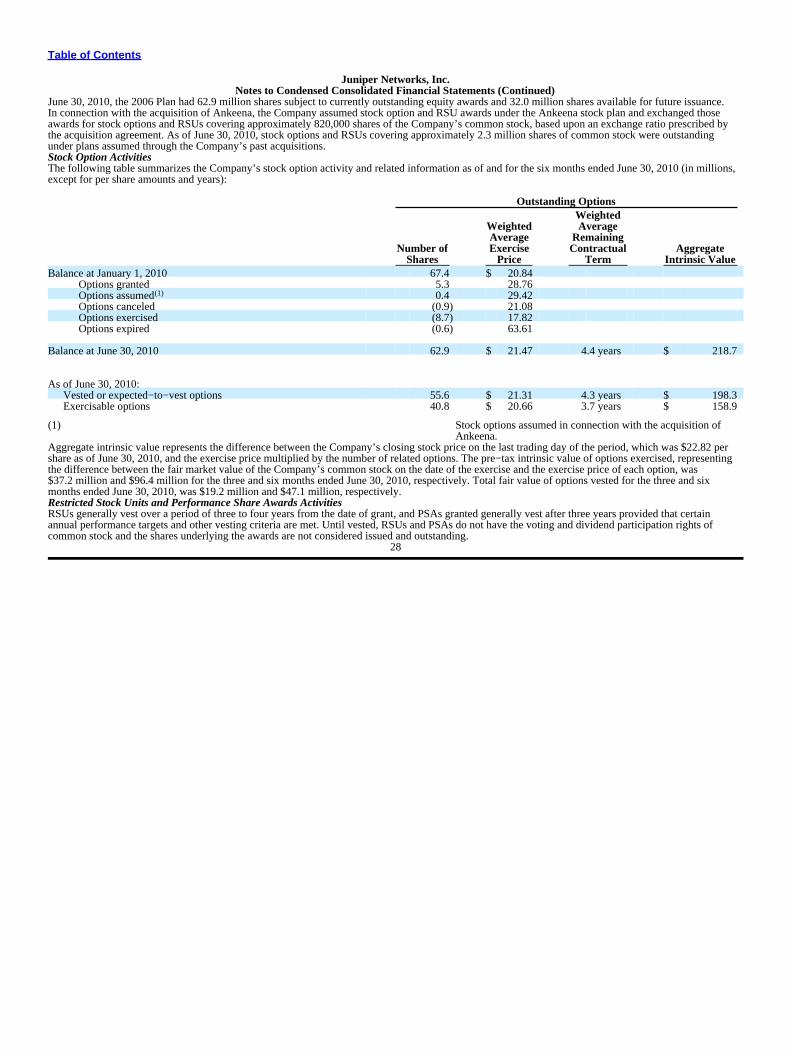
Table of Contents
Juniper Networks, Inc.Notes to Condensed Consolidated Financial Statements (Continued)
June 30, 2010, the 2006 Plan had 62.9 million shares subject to currently outstanding equity awards and 32.0 million shares available for future issuance.In connection with the acquisition of Ankeena, the Company assumed stock option and RSU awards under the Ankeena stock plan and exchanged thoseawards for stock options and RSUs covering approximately 820,000 shares of the Company’s common stock, based upon an exchange ratio prescribed bythe acquisition agreement. As of June 30, 2010, stock options and RSUs covering approximately 2.3 million shares of common stock were outstandingunder plans assumed through the Company’s past acquisitions.Stock Option ActivitiesThe following table summarizes the Company’s stock option activity and related information as of and for the six months ended June 30, 2010 (in millions,except for per share amounts and years):
Outstanding OptionsWeighted
Weighted AverageAverage Remaining
Number of Exercise Contractual AggregateShares Price Term Intrinsic Value
Balance at January 1, 2010 67.4 $ 20.84Options granted 5.3 28.76Options assumed(1) 0.4 29.42Options canceled (0.9) 21.08Options exercised (8.7) 17.82Options expired (0.6) 63.61
Balance at June 30, 2010 62.9 $ 21.47 4.4 years $ 218.7
As of June 30, 2010:Vested or expected−to−vest options 55.6 $ 21.31 4.3 years $ 198.3Exercisable options 40.8 $ 20.66 3.7 years $ 158.9
(1) Stock options assumed in connection with the acquisition ofAnkeena.
Aggregate intrinsic value represents the difference between the Company’s closing stock price on the last trading day of the period, which was $22.82 pershare as of June 30, 2010, and the exercise price multiplied by the number of related options. The pre−tax intrinsic value of options exercised, representingthe difference between the fair market value of the Company’s common stock on the date of the exercise and the exercise price of each option, was$37.2 million and $96.4 million for the three and six months ended June 30, 2010, respectively. Total fair value of options vested for the three and sixmonths ended June 30, 2010, was $19.2 million and $47.1 million, respectively.Restricted Stock Units and Performance Share Awards ActivitiesRSUs generally vest over a period of three to four years from the date of grant, and PSAs granted generally vest after three years provided that certainannual performance targets and other vesting criteria are met. Until vested, RSUs and PSAs do not have the voting and dividend participation rights ofcommon stock and the shares underlying the awards are not considered issued and outstanding.
28
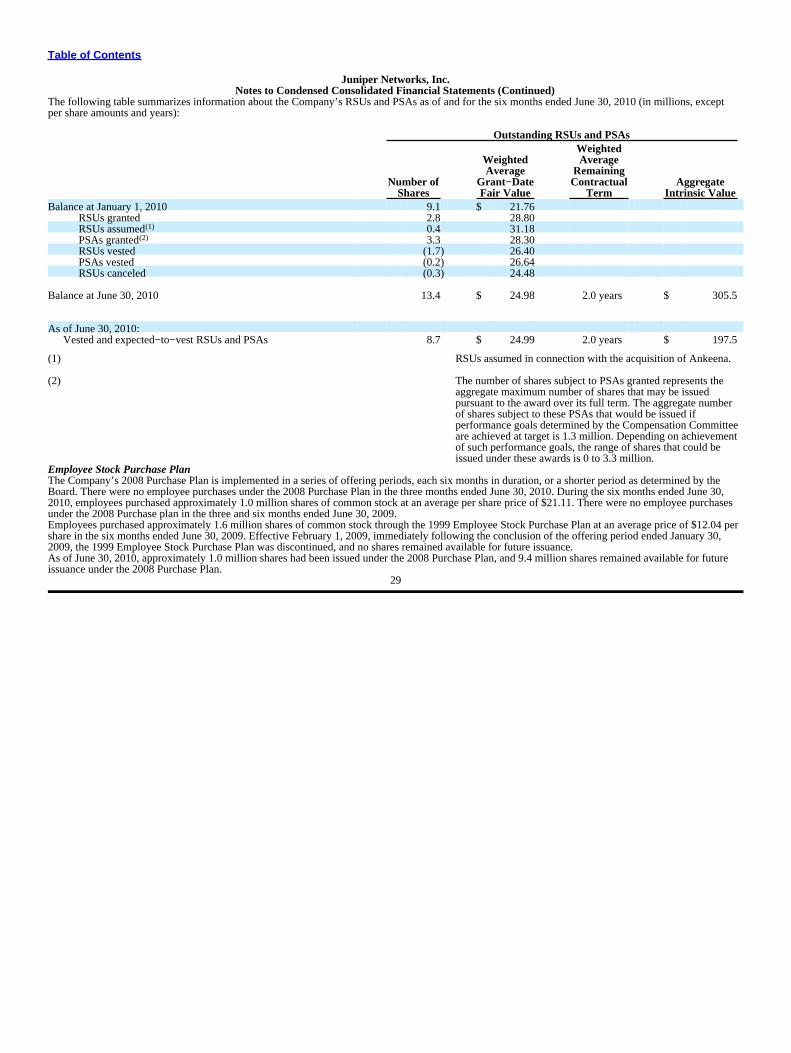
Table of Contents
Juniper Networks, Inc.Notes to Condensed Consolidated Financial Statements (Continued)
The following table summarizes information about the Company’s RSUs and PSAs as of and for the six months ended June 30, 2010 (in millions, exceptper share amounts and years):
Outstanding RSUs and PSAsWeighted
Weighted AverageAverage Remaining
Number of Grant−Date Contractual AggregateShares Fair Value Term Intrinsic Value
Balance at January 1, 2010 9.1 $ 21.76RSUs granted 2.8 28.80RSUs assumed(1) 0.4 31.18PSAs granted(2) 3.3 28.30RSUs vested (1.7) 26.40PSAs vested (0.2) 26.64RSUs canceled (0.3) 24.48
Balance at June 30, 2010 13.4 $ 24.98 2.0 years $ 305.5
As of June 30, 2010:Vested and expected−to−vest RSUs and PSAs 8.7 $ 24.99 2.0 years $ 197.5
(1) RSUs assumed in connection with the acquisition of Ankeena.
(2) The number of shares subject to PSAs granted represents theaggregate maximum number of shares that may be issuedpursuant to the award over its full term. The aggregate numberof shares subject to these PSAs that would be issued ifperformance goals determined by the Compensation Committeeare achieved at target is 1.3 million. Depending on achievementof such performance goals, the range of shares that could beissued under these awards is 0 to 3.3 million.
Employee Stock Purchase PlanThe Company’s 2008 Purchase Plan is implemented in a series of offering periods, each six months in duration, or a shorter period as determined by theBoard. There were no employee purchases under the 2008 Purchase Plan in the three months ended June 30, 2010. During the six months ended June 30,2010, employees purchased approximately 1.0 million shares of common stock at an average per share price of $21.11. There were no employee purchasesunder the 2008 Purchase plan in the three and six months ended June 30, 2009.Employees purchased approximately 1.6 million shares of common stock through the 1999 Employee Stock Purchase Plan at an average price of $12.04 pershare in the six months ended June 30, 2009. Effective February 1, 2009, immediately following the conclusion of the offering period ended January 30,2009, the 1999 Employee Stock Purchase Plan was discontinued, and no shares remained available for future issuance.As of June 30, 2010, approximately 1.0 million shares had been issued under the 2008 Purchase Plan, and 9.4 million shares remained available for futureissuance under the 2008 Purchase Plan.
29
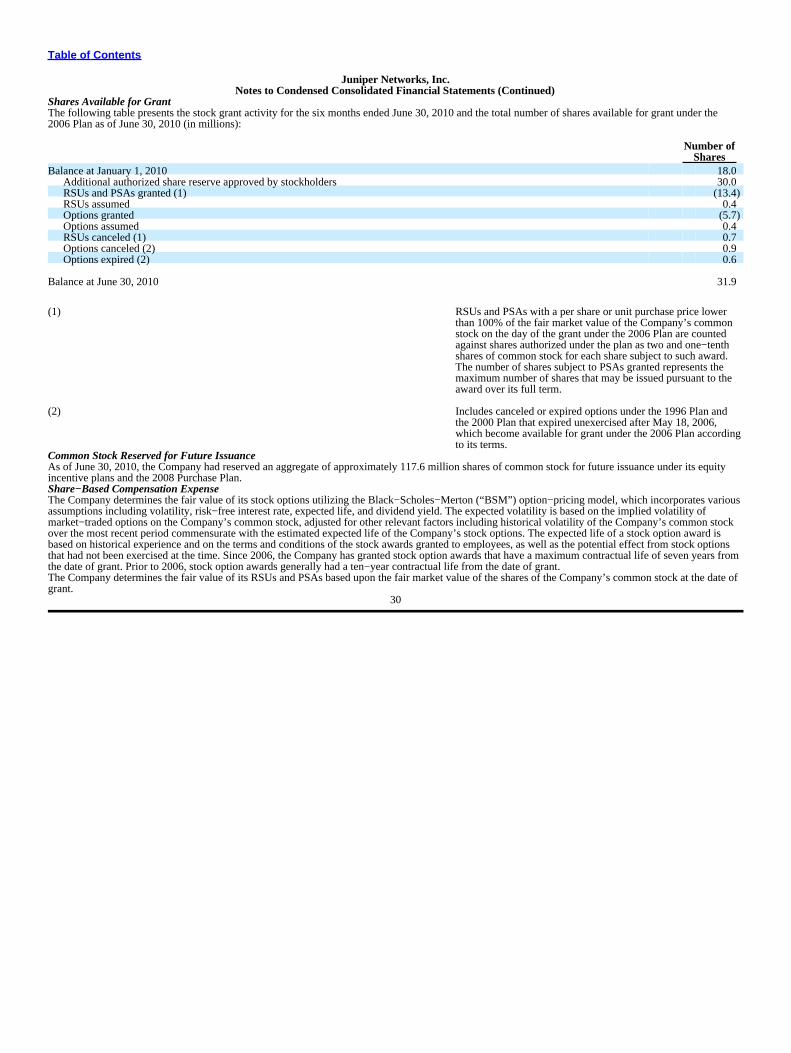
Table of Contents
Juniper Networks, Inc.Notes to Condensed Consolidated Financial Statements (Continued)
Shares Available for GrantThe following table presents the stock grant activity for the six months ended June 30, 2010 and the total number of shares available for grant under the2006 Plan as of June 30, 2010 (in millions):
Number ofShares
Balance at January 1, 2010 18.0Additional authorized share reserve approved by stockholders 30.0RSUs and PSAs granted (1) (13.4)RSUs assumed 0.4Options granted (5.7)Options assumed 0.4RSUs canceled (1) 0.7Options canceled (2) 0.9Options expired (2) 0.6
Balance at June 30, 2010 31.9
(1) RSUs and PSAs with a per share or unit purchase price lowerthan 100% of the fair market value of the Company’s commonstock on the day of the grant under the 2006 Plan are countedagainst shares authorized under the plan as two and one−tenthshares of common stock for each share subject to such award.The number of shares subject to PSAs granted represents themaximum number of shares that may be issued pursuant to theaward over its full term.
(2) Includes canceled or expired options under the 1996 Plan andthe 2000 Plan that expired unexercised after May 18, 2006,which become available for grant under the 2006 Plan accordingto its terms.
Common Stock Reserved for Future IssuanceAs of June 30, 2010, the Company had reserved an aggregate of approximately 117.6 million shares of common stock for future issuance under its equityincentive plans and the 2008 Purchase Plan.Share−Based Compensation ExpenseThe Company determines the fair value of its stock options utilizing the Black−Scholes−Merton (“BSM”) option−pricing model, which incorporates variousassumptions including volatility, risk−free interest rate, expected life, and dividend yield. The expected volatility is based on the implied volatility ofmarket−traded options on the Company’s common stock, adjusted for other relevant factors including historical volatility of the Company’s common stockover the most recent period commensurate with the estimated expected life of the Company’s stock options. The expected life of a stock option award isbased on historical experience and on the terms and conditions of the stock awards granted to employees, as well as the potential effect from stock optionsthat had not been exercised at the time. Since 2006, the Company has granted stock option awards that have a maximum contractual life of seven years fromthe date of grant. Prior to 2006, stock option awards generally had a ten−year contractual life from the date of grant.The Company determines the fair value of its RSUs and PSAs based upon the fair market value of the shares of the Company’s common stock at the date ofgrant.
30
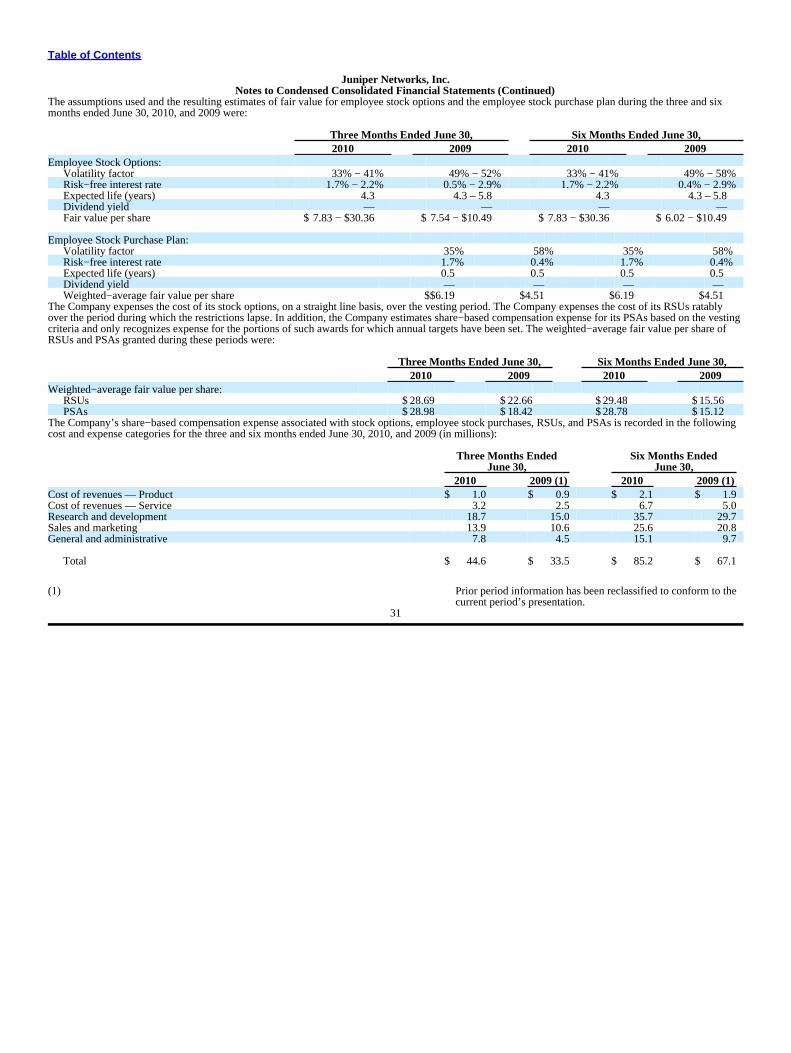
Table of Contents
Juniper Networks, Inc.Notes to Condensed Consolidated Financial Statements (Continued)
The assumptions used and the resulting estimates of fair value for employee stock options and the employee stock purchase plan during the three and sixmonths ended June 30, 2010, and 2009 were:
Three Months Ended June 30, Six Months Ended June 30,2010 2009 2010 2009
Employee Stock Options:Volatility factor 33% − 41% 49% − 52% 33% − 41% 49% − 58%Risk−free interest rate 1.7% − 2.2% 0.5% − 2.9% 1.7% − 2.2% 0.4% − 2.9%Expected life (years) 4.3 4.3 – 5.8 4.3 4.3 – 5.8Dividend yield — — — —Fair value per share $ 7.83 − $30.36 $ 7.54 − $10.49 $ 7.83 − $30.36 $ 6.02 − $10.49
Employee Stock Purchase Plan:Volatility factor 35% 58% 35% 58%Risk−free interest rate 1.7% 0.4% 1.7% 0.4%Expected life (years) 0.5 0.5 0.5 0.5Dividend yield — — — —Weighted−average fair value per share $$6.19 $4.51 $6.19 $4.51
The Company expenses the cost of its stock options, on a straight line basis, over the vesting period. The Company expenses the cost of its RSUs ratablyover the period during which the restrictions lapse. In addition, the Company estimates share−based compensation expense for its PSAs based on the vestingcriteria and only recognizes expense for the portions of such awards for which annual targets have been set. The weighted−average fair value per share ofRSUs and PSAs granted during these periods were:
Three Months Ended June 30, Six Months Ended June 30,2010 2009 2010 2009
Weighted−average fair value per share:RSUs $28.69 $22.66 $29.48 $15.56PSAs $28.98 $18.42 $28.78 $15.12
The Company’s share−based compensation expense associated with stock options, employee stock purchases, RSUs, and PSAs is recorded in the followingcost and expense categories for the three and six months ended June 30, 2010, and 2009 (in millions):
Three Months Ended Six Months EndedJune 30, June 30,
2010 2009 (1) 2010 2009 (1)Cost of revenues — Product $ 1.0 $ 0.9 $ 2.1 $ 1.9Cost of revenues — Service 3.2 2.5 6.7 5.0Research and development 18.7 15.0 35.7 29.7Sales and marketing 13.9 10.6 25.6 20.8General and administrative 7.8 4.5 15.1 9.7
Total $ 44.6 $ 33.5 $ 85.2 $ 67.1
(1) Prior period information has been reclassified to conform to thecurrent period’s presentation.
31
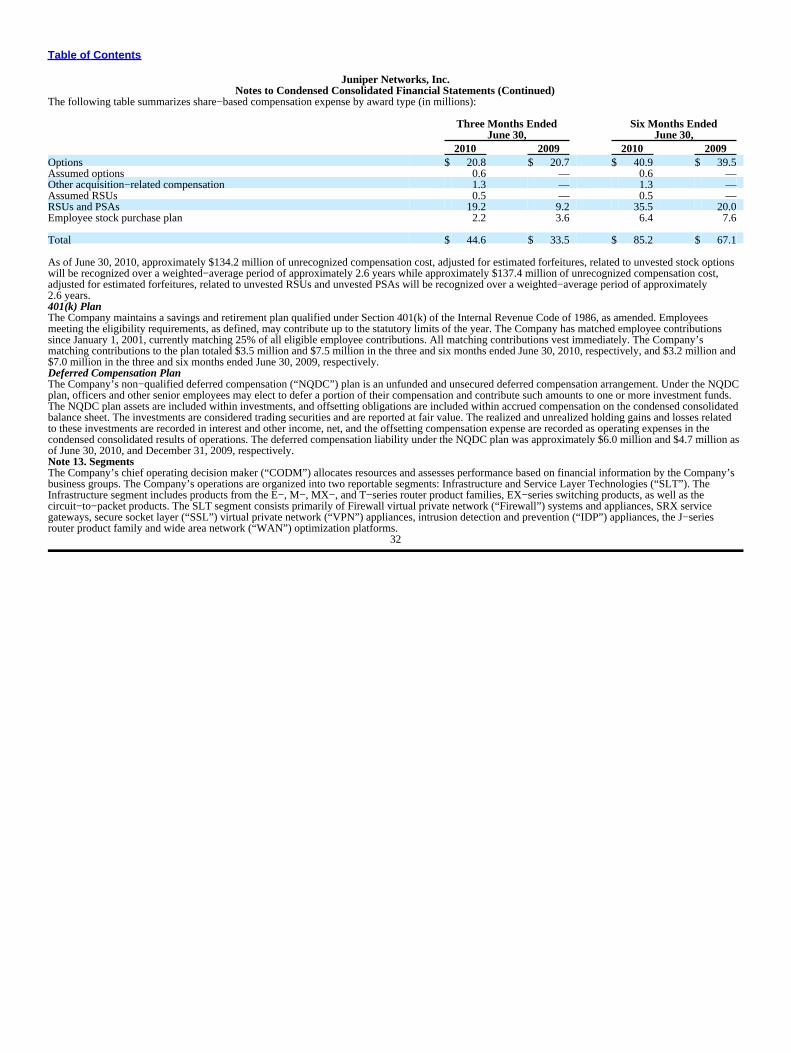
Table of Contents
Juniper Networks, Inc.Notes to Condensed Consolidated Financial Statements (Continued)
The following table summarizes share−based compensation expense by award type (in millions):
Three Months Ended Six Months EndedJune 30, June 30,
2010 2009 2010 2009Options $ 20.8 $ 20.7 $ 40.9 $ 39.5Assumed options 0.6 — 0.6 —Other acquisition−related compensation 1.3 — 1.3 —Assumed RSUs 0.5 — 0.5 —RSUs and PSAs 19.2 9.2 35.5 20.0Employee stock purchase plan 2.2 3.6 6.4 7.6
Total $ 44.6 $ 33.5 $ 85.2 $ 67.1
As of June 30, 2010, approximately $134.2 million of unrecognized compensation cost, adjusted for estimated forfeitures, related to unvested stock optionswill be recognized over a weighted−average period of approximately 2.6 years while approximately $137.4 million of unrecognized compensation cost,adjusted for estimated forfeitures, related to unvested RSUs and unvested PSAs will be recognized over a weighted−average period of approximately2.6 years.401(k) PlanThe Company maintains a savings and retirement plan qualified under Section 401(k) of the Internal Revenue Code of 1986, as amended. Employeesmeeting the eligibility requirements, as defined, may contribute up to the statutory limits of the year. The Company has matched employee contributionssince January 1, 2001, currently matching 25% of all eligible employee contributions. All matching contributions vest immediately. The Company’smatching contributions to the plan totaled $3.5 million and $7.5 million in the three and six months ended June 30, 2010, respectively, and $3.2 million and$7.0 million in the three and six months ended June 30, 2009, respectively.Deferred Compensation PlanThe Company’s non−qualified deferred compensation (“NQDC”) plan is an unfunded and unsecured deferred compensation arrangement. Under the NQDCplan, officers and other senior employees may elect to defer a portion of their compensation and contribute such amounts to one or more investment funds.The NQDC plan assets are included within investments, and offsetting obligations are included within accrued compensation on the condensed consolidatedbalance sheet. The investments are considered trading securities and are reported at fair value. The realized and unrealized holding gains and losses relatedto these investments are recorded in interest and other income, net, and the offsetting compensation expense are recorded as operating expenses in thecondensed consolidated results of operations. The deferred compensation liability under the NQDC plan was approximately $6.0 million and $4.7 million asof June 30, 2010, and December 31, 2009, respectively.Note 13. SegmentsThe Company’s chief operating decision maker (“CODM”) allocates resources and assesses performance based on financial information by the Company’sbusiness groups. The Company’s operations are organized into two reportable segments: Infrastructure and Service Layer Technologies (“SLT”). TheInfrastructure segment includes products from the E−, M−, MX−, and T−series router product families, EX−series switching products, as well as thecircuit−to−packet products. The SLT segment consists primarily of Firewall virtual private network (“Firewall”) systems and appliances, SRX servicegateways, secure socket layer (“SSL”) virtual private network (“VPN”) appliances, intrusion detection and prevention (“IDP”) appliances, the J−seriesrouter product family and wide area network (“WAN”) optimization platforms.
32
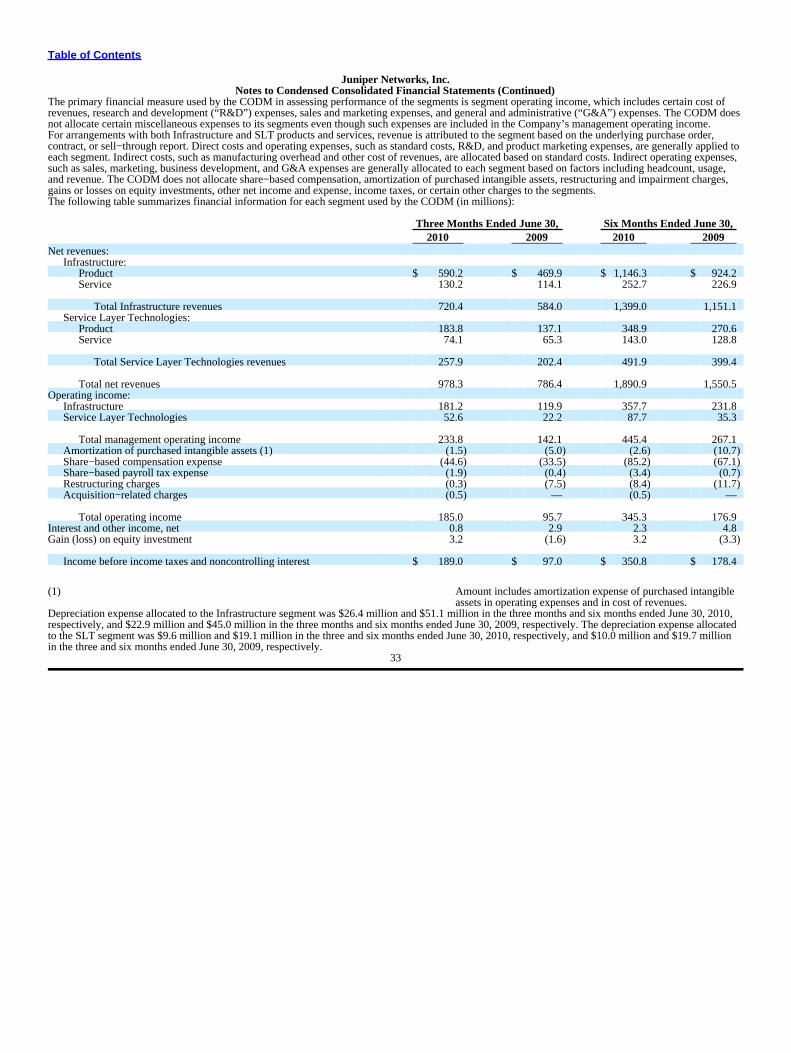
Table of Contents
Juniper Networks, Inc.Notes to Condensed Consolidated Financial Statements (Continued)
The primary financial measure used by the CODM in assessing performance of the segments is segment operating income, which includes certain cost ofrevenues, research and development (“R&D”) expenses, sales and marketing expenses, and general and administrative (“G&A”) expenses. The CODM doesnot allocate certain miscellaneous expenses to its segments even though such expenses are included in the Company’s management operating income.For arrangements with both Infrastructure and SLT products and services, revenue is attributed to the segment based on the underlying purchase order,contract, or sell−through report. Direct costs and operating expenses, such as standard costs, R&D, and product marketing expenses, are generally applied toeach segment. Indirect costs, such as manufacturing overhead and other cost of revenues, are allocated based on standard costs. Indirect operating expenses,such as sales, marketing, business development, and G&A expenses are generally allocated to each segment based on factors including headcount, usage,and revenue. The CODM does not allocate share−based compensation, amortization of purchased intangible assets, restructuring and impairment charges,gains or losses on equity investments, other net income and expense, income taxes, or certain other charges to the segments.The following table summarizes financial information for each segment used by the CODM (in millions):
Three Months Ended June 30, Six Months Ended June 30,2010 2009 2010 2009
Net revenues:Infrastructure:
Product $ 590.2 $ 469.9 $ 1,146.3 $ 924.2Service 130.2 114.1 252.7 226.9
Total Infrastructure revenues 720.4 584.0 1,399.0 1,151.1Service Layer Technologies:
Product 183.8 137.1 348.9 270.6Service 74.1 65.3 143.0 128.8
Total Service Layer Technologies revenues 257.9 202.4 491.9 399.4
Total net revenues 978.3 786.4 1,890.9 1,550.5Operating income:
Infrastructure 181.2 119.9 357.7 231.8Service Layer Technologies 52.6 22.2 87.7 35.3
Total management operating income 233.8 142.1 445.4 267.1Amortization of purchased intangible assets (1) (1.5) (5.0) (2.6) (10.7)Share−based compensation expense (44.6) (33.5) (85.2) (67.1)Share−based payroll tax expense (1.9) (0.4) (3.4) (0.7)Restructuring charges (0.3) (7.5) (8.4) (11.7)Acquisition−related charges (0.5) — (0.5) —
Total operating income 185.0 95.7 345.3 176.9Interest and other income, net 0.8 2.9 2.3 4.8Gain (loss) on equity investment 3.2 (1.6) 3.2 (3.3)
Income before income taxes and noncontrolling interest $ 189.0 $ 97.0 $ 350.8 $ 178.4
(1) Amount includes amortization expense of purchased intangibleassets in operating expenses and in cost of revenues.
Depreciation expense allocated to the Infrastructure segment was $26.4 million and $51.1 million in the three months and six months ended June 30, 2010,respectively, and $22.9 million and $45.0 million in the three months and six months ended June 30, 2009, respectively. The depreciation expense allocatedto the SLT segment was $9.6 million and $19.1 million in the three and six months ended June 30, 2010, respectively, and $10.0 million and $19.7 millionin the three and six months ended June 30, 2009, respectively.
33
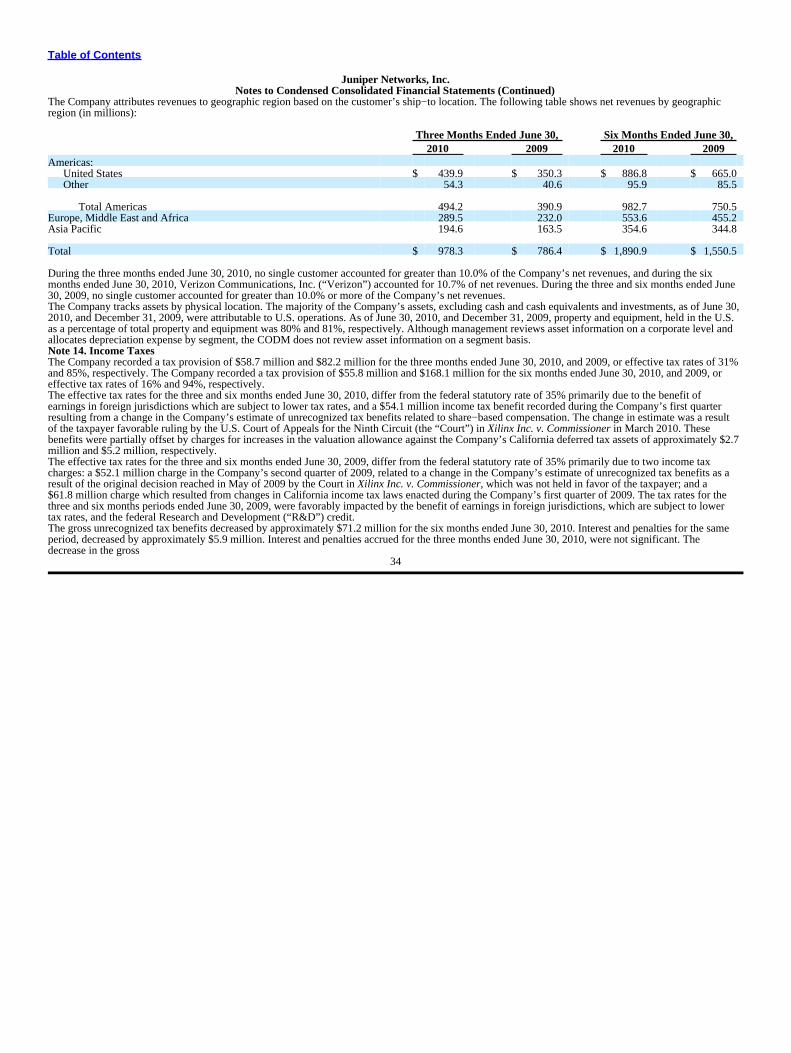
Table of Contents
Juniper Networks, Inc.Notes to Condensed Consolidated Financial Statements (Continued)
The Company attributes revenues to geographic region based on the customer’s ship−to location. The following table shows net revenues by geographicregion (in millions):
Three Months Ended June 30, Six Months Ended June 30,2010 2009 2010 2009
Americas:United States $ 439.9 $ 350.3 $ 886.8 $ 665.0Other 54.3 40.6 95.9 85.5
Total Americas 494.2 390.9 982.7 750.5Europe, Middle East and Africa 289.5 232.0 553.6 455.2Asia Pacific 194.6 163.5 354.6 344.8
Total $ 978.3 $ 786.4 $ 1,890.9 $ 1,550.5
During the three months ended June 30, 2010, no single customer accounted for greater than 10.0% of the Company’s net revenues, and during the sixmonths ended June 30, 2010, Verizon Communications, Inc. (“Verizon”) accounted for 10.7% of net revenues. During the three and six months ended June30, 2009, no single customer accounted for greater than 10.0% or more of the Company’s net revenues.The Company tracks assets by physical location. The majority of the Company’s assets, excluding cash and cash equivalents and investments, as of June 30,2010, and December 31, 2009, were attributable to U.S. operations. As of June 30, 2010, and December 31, 2009, property and equipment, held in the U.S.as a percentage of total property and equipment was 80% and 81%, respectively. Although management reviews asset information on a corporate level andallocates depreciation expense by segment, the CODM does not review asset information on a segment basis.Note 14. Income TaxesThe Company recorded a tax provision of $58.7 million and $82.2 million for the three months ended June 30, 2010, and 2009, or effective tax rates of 31%and 85%, respectively. The Company recorded a tax provision of $55.8 million and $168.1 million for the six months ended June 30, 2010, and 2009, oreffective tax rates of 16% and 94%, respectively.The effective tax rates for the three and six months ended June 30, 2010, differ from the federal statutory rate of 35% primarily due to the benefit ofearnings in foreign jurisdictions which are subject to lower tax rates, and a $54.1 million income tax benefit recorded during the Company’s first quarterresulting from a change in the Company’s estimate of unrecognized tax benefits related to share−based compensation. The change in estimate was a resultof the taxpayer favorable ruling by the U.S. Court of Appeals for the Ninth Circuit (the “Court”) in Xilinx Inc. v. Commissioner in March 2010. Thesebenefits were partially offset by charges for increases in the valuation allowance against the Company’s California deferred tax assets of approximately $2.7million and $5.2 million, respectively.The effective tax rates for the three and six months ended June 30, 2009, differ from the federal statutory rate of 35% primarily due to two income taxcharges: a $52.1 million charge in the Company’s second quarter of 2009, related to a change in the Company’s estimate of unrecognized tax benefits as aresult of the original decision reached in May of 2009 by the Court in Xilinx Inc. v. Commissioner, which was not held in favor of the taxpayer; and a$61.8 million charge which resulted from changes in California income tax laws enacted during the Company’s first quarter of 2009. The tax rates for thethree and six months periods ended June 30, 2009, were favorably impacted by the benefit of earnings in foreign jurisdictions, which are subject to lowertax rates, and the federal Research and Development (“R&D”) credit.The gross unrecognized tax benefits decreased by approximately $71.2 million for the six months ended June 30, 2010. Interest and penalties for the sameperiod, decreased by approximately $5.9 million. Interest and penalties accrued for the three months ended June 30, 2010, were not significant. Thedecrease in the gross
34
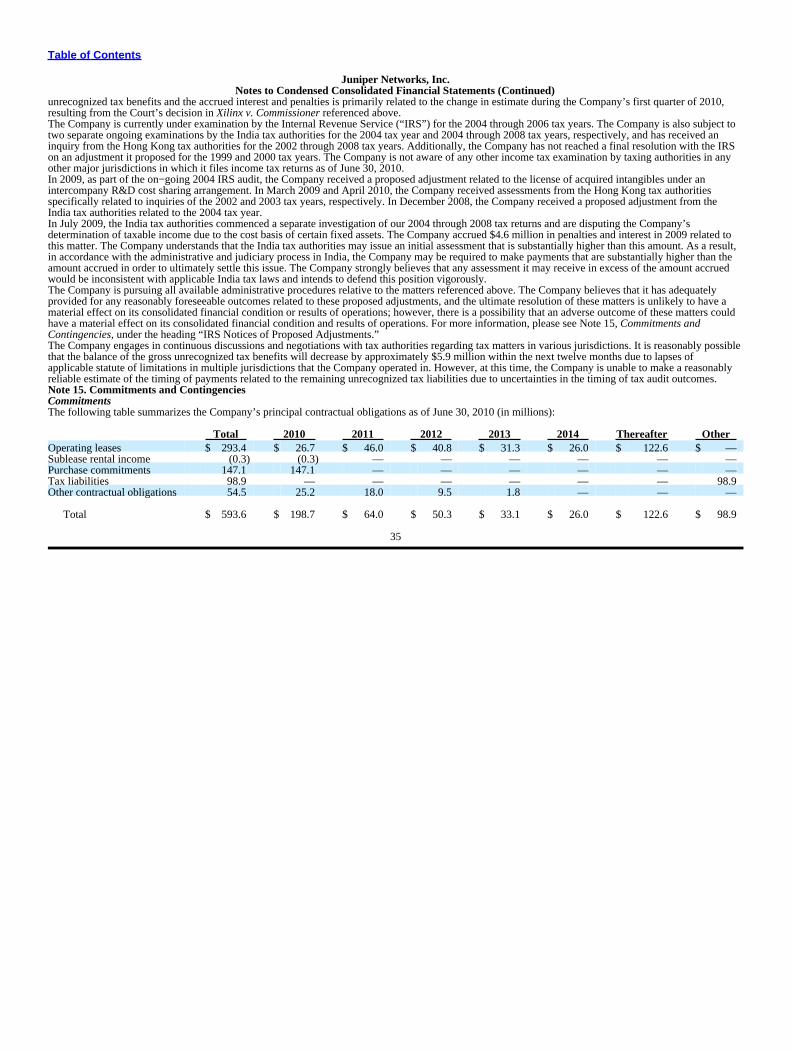
Table of Contents
Juniper Networks, Inc.Notes to Condensed Consolidated Financial Statements (Continued)
unrecognized tax benefits and the accrued interest and penalties is primarily related to the change in estimate during the Company’s first quarter of 2010,resulting from the Court’s decision in Xilinx v. Commissioner referenced above.The Company is currently under examination by the Internal Revenue Service (“IRS”) for the 2004 through 2006 tax years. The Company is also subject totwo separate ongoing examinations by the India tax authorities for the 2004 tax year and 2004 through 2008 tax years, respectively, and has received aninquiry from the Hong Kong tax authorities for the 2002 through 2008 tax years. Additionally, the Company has not reached a final resolution with the IRSon an adjustment it proposed for the 1999 and 2000 tax years. The Company is not aware of any other income tax examination by taxing authorities in anyother major jurisdictions in which it files income tax returns as of June 30, 2010.In 2009, as part of the on−going 2004 IRS audit, the Company received a proposed adjustment related to the license of acquired intangibles under anintercompany R&D cost sharing arrangement. In March 2009 and April 2010, the Company received assessments from the Hong Kong tax authoritiesspecifically related to inquiries of the 2002 and 2003 tax years, respectively. In December 2008, the Company received a proposed adjustment from theIndia tax authorities related to the 2004 tax year.In July 2009, the India tax authorities commenced a separate investigation of our 2004 through 2008 tax returns and are disputing the Company’sdetermination of taxable income due to the cost basis of certain fixed assets. The Company accrued $4.6 million in penalties and interest in 2009 related tothis matter. The Company understands that the India tax authorities may issue an initial assessment that is substantially higher than this amount. As a result,in accordance with the administrative and judiciary process in India, the Company may be required to make payments that are substantially higher than theamount accrued in order to ultimately settle this issue. The Company strongly believes that any assessment it may receive in excess of the amount accruedwould be inconsistent with applicable India tax laws and intends to defend this position vigorously.The Company is pursuing all available administrative procedures relative to the matters referenced above. The Company believes that it has adequatelyprovided for any reasonably foreseeable outcomes related to these proposed adjustments, and the ultimate resolution of these matters is unlikely to have amaterial effect on its consolidated financial condition or results of operations; however, there is a possibility that an adverse outcome of these matters couldhave a material effect on its consolidated financial condition and results of operations. For more information, please see Note 15, Commitments andContingencies, under the heading “IRS Notices of Proposed Adjustments.”The Company engages in continuous discussions and negotiations with tax authorities regarding tax matters in various jurisdictions. It is reasonably possiblethat the balance of the gross unrecognized tax benefits will decrease by approximately $5.9 million within the next twelve months due to lapses ofapplicable statute of limitations in multiple jurisdictions that the Company operated in. However, at this time, the Company is unable to make a reasonablyreliable estimate of the timing of payments related to the remaining unrecognized tax liabilities due to uncertainties in the timing of tax audit outcomes.Note 15. Commitments and ContingenciesCommitmentsThe following table summarizes the Company’s principal contractual obligations as of June 30, 2010 (in millions):
Total 2010 2011 2012 2013 2014 Thereafter OtherOperating leases $ 293.4 $ 26.7 $ 46.0 $ 40.8 $ 31.3 $ 26.0 $ 122.6 $ —Sublease rental income (0.3) (0.3) — — — — — —Purchase commitments 147.1 147.1 — — — — — —Tax liabilities 98.9 — — — — — — 98.9Other contractual obligations 54.5 25.2 18.0 9.5 1.8 — — —
Total $ 593.6 $ 198.7 $ 64.0 $ 50.3 $ 33.1 $ 26.0 $ 122.6 $ 98.9
35
Table of Contents
Juniper Networks, Inc.Notes to Condensed Consolidated Financial Statements (Continued)
Operating LeasesThe Company leases its facilities under operating leases that expire at various times, the longest of which expires in November 2022. Future minimumpayments under the non−cancelable operating leases, net of committed sublease income, totaled $293.1 million as of June 30, 2010. Rent expense was$13.7 million and $27.8 million for the three and six months ended June 30, 2010, respectively, and $14.3 million and $28.3 million for the three and sixmonths ended June 30, 2009, respectively.Purchase CommitmentsIn order to reduce manufacturing lead times and ensure adequate component supply, contract manufacturers utilized by the Company place non−cancelable,non−returnable (“NCNR”) orders for components based on the Company’s build forecasts. As of June 30, 2010, there were NCNR component orders placedby the contract manufacturers with a value of $147.1 million. The contract manufacturers use the components to build products based on the Company’sforecasts and customer purchase orders received by the Company. Generally, the Company does not own the components and title to the products transfersfrom the contract manufacturers to the Company and immediately to the Company’s customers upon delivery at a designated shipment location. If thecomponents remain unused or the products remain unsold for specified periods, the Company may incur carrying charges or obsolete materials charges forcomponents that the contract manufacturers purchased to build products to meet the Company’s forecast or customer orders. As of June 30, 2010, theCompany had accrued $22.0 million based on its estimate of such charges.Tax LiabilitiesAs of June 30, 2010, the Company had $98.9 million included in current and long−term liabilities in the condensed consolidated balance sheet forunrecognized tax positions. At this time, the Company is unable to make a reasonably reliable estimate of the timing of payments related to the additional$98.9 million in liability due to uncertainties in the timing of tax audit outcomes.Other Contractual ObligationsAs of June 30, 2010, other contractual obligations primarily consisted of $19.3 million of indemnity−related and service related escrows required by certainacquisitions completed in 2005 and 2010, $15.4 million remaining balance for a data center hosting agreement that requires payments through the end ofApril 2013, $12.1 million for license and service agreements, and $7.7 million under a software subscription agreement that requires payments through theend of January 2011.GuaranteesThe Company enters into agreements with customers that contain indemnification provisions relating to potential situations where claims could be allegedthat the Company’s products infringe the intellectual property rights of a third party. Other guarantees or indemnification arrangements include guaranteesof product and service performance, guarantees related to third−party customer−financing arrangements, and standby letters of credit for certain leasefacilities. As of June 30, 2010, the Company had $22.4 million in guarantees and standby letters of credit and recorded a liability of $9.7 million related to athird−party customer−financing guarantee. As of December 31, 2009, the Company had $34.0 million in guarantees and standby letters of credit along witha liability of $21.9 million related to a third−party customer−financing guarantee.
36
Table of Contents
Juniper Networks, Inc.Notes to Condensed Consolidated Financial Statements (Continued)
Legal ProceedingsThe Company is subject to legal claims and litigation arising in the ordinary course of business, such as employment or intellectual property claims,including the matters described below. The outcome of any such matters is currently not determinable. Although the Company does not expect that any suchlegal claims or litigation will ultimately have a material adverse effect on its consolidated financial condition or results of operations, an adverse result inone or more of such matters could negatively affect the Company’s consolidated financial results in the period in which they occur.Federal Securities Class ActionOn July 14, 2006, and August 29, 2006, two purported class actions were filed in the Northern District of California against the Company and certain of theCompany’s current and former officers and directors. On November 20, 2006, the Court consolidated the two actions as In re Juniper Networks, Inc.Securities Litigation, No. C06−04327−JW, and appointed the New York City Pension Funds as lead plaintiffs. The lead plaintiffs filed a ConsolidatedClass Action Complaint on January 12, 2007, and filed an Amended Consolidated Class Action Complaint on April 9, 2007. The Amended ConsolidatedComplaint alleges that the defendants violated federal securities laws by manipulating stock option grant dates to coincide with low stock prices and issuingfalse and misleading statements including, among others, incorrect financial statements due to the improper accounting of stock option grants. TheAmended Consolidated Complaint asserts claims for violations of the Securities Act of 1933 and the Securities Exchange Act of 1934 on behalf of allpersons who purchased or otherwise acquired Juniper Networks’ publicly−traded securities from July 12, 2001, through and including August 10, 2006.Plaintiffs seek unspecified damages in an unspecified amount. On June 7, 2007, the defendants filed a motion to dismiss certain of the claims, and a hearingwas held on September 10, 2007. On March 31, 2008, the Court issued an order granting in part and denying in part the defendants’ motion to dismiss. Theorder dismissed with prejudice plaintiffs’ section 10(b) claim to the extent it was based on challenged statements made before July 14, 2001. The order alsodismissed, with leave to amend, plaintiffs’ section 10(b) claim against Pradeep Sindhu. The order upheld all of plaintiffs’ remaining claims. Plaintiffs didnot amend their complaint.On September 25, 2009, the Court certified a plaintiff class consisting of all persons and entities who purchased or otherwise acquired the Company’ssecurities from July 11, 2003 to August 10, 2006 inclusive, and were damaged thereby, including those who received or acquired Juniper Networks’common stock issued pursuant to the registration statement on SEC Form S−4, dated March 10, 2004, for the Company’s merger with NetScreenTechnologies Inc. and purchasers of Zero Coupon Convertible Senior Notes due June 15, 2008 issued pursuant to a registration statement on SEC Form S−3dated November 20, 2003. Excluded from the class are the defendants and the current and former officers and directors of the Company, their immediatefamilies, their heirs, successors, or assigns and any entity controlled by any such person.On February 5, 2010, the Company and the lead plaintiffs entered into an agreement in principle to settle the claims against the Company and each of theCompany’s current and former officers and directors. The settlement is contingent upon final approval by the Court. On April 12, 2010, the Court grantedpreliminary approval of the proposed settlement and scheduled a fairness hearing for August 30, 2010, to consider whether to grant final approval of thesettlement. Under the proposed settlement, the claims against the Company and its officers and directors will be dismissed with prejudice and released inexchange for a $169.0 million cash payment by the Company. The Company considers the proposed payment to be probable and reasonably estimable and,therefore, recorded the cash settlement amount as a pre−tax operating expense in its consolidated statement of operations for the fourth quarter endedDecember 31, 2009.
37
Table of Contents
Juniper Networks, Inc.Notes to Condensed Consolidated Financial Statements (Continued)
Calamore Proxy Statement ActionOn March 28, 2007, an action titled Jeanne M. Calamore v. Juniper Networks, Inc., et al., No. C−07−1772−JW, was filed by Jeanne M. Calamore in theNorthern District of California against the Company and certain of the Company’s current and former officers and directors. The complaint alleges that theproxy statement for the Company’s 2006 Annual Meeting of Stockholders contained various false and misleading statements in that it failed to disclosestock option backdating information. As a result, the plaintiff seeks preliminary and permanent injunctive relief with respect to the Company’s 2006 EquityIncentive Plan, including seeking to invalidate the plan and all equity awards granted and grantable thereunder. On May 21, 2007, the Company filed amotion to dismiss, and the plaintiff filed a motion for preliminary injunction. On July 19, 2007, the Court issued an order denying the plaintiff’s motion fora preliminary injunction and dismissing the complaint in its entirety with leave to amend. The plaintiff filed an amended complaint on August 27, 2007, andthe defendants filed a motion to dismiss on October 9, 2007. On August 13, 2008, the Court issued an order granting the Company’s motion to dismiss withprejudice, and entered final judgment in favor of the Company. On September 9, 2008, the plaintiff filed a Notice of Appeal in the United States Court ofAppeals for the Ninth Circuit. The plaintiff’s appeal was fully briefed and the Court of Appeals heard oral argument on the appeal on October 7, 2009. OnFebruary 5, 2010, the Ninth Circuit issued a memorandum decision affirming the District Court’s dismissal with prejudice. On February 19, 2010, plaintifffiled a Petition for Rehearing and Suggestion for Rehearing En Banc and on March 24, 2010, the Ninth Circuit denied that petition.IPO Allocation CaseIn December 2001, a class action complaint was filed in the United States District Court for the Southern District of New York against the Goldman SachsGroup, Inc., Credit Suisse First Boston Corporation, FleetBoston Robertson Stephens, Inc., Royal Bank of Canada (Dain Rauscher Wessels), SG CowenSecurities Corporation, UBS Warburg LLC (Warburg Dillon Read LLC), Chase (Hambrecht & Quist LLC), J.P. Morgan Chase & Co., Lehman Brothers,Inc., Salomon Smith Barney, Inc., Merrill Lynch, Pierce, Fenner & Smith, Incorporated (collectively, the “Underwriters”), Juniper Networks and certain ofJuniper Networks’ officers. This action was brought on behalf of purchasers of the Company’s common stock in its initial public offering in June 1999 andthe Company’s secondary offering in September 1999.Specifically, among other things, this complaint alleged that the prospectus pursuant to which shares of common stock were sold in the Company’s initialpublic offering and the Company’s subsequent secondary offering contained certain false and misleading statements or omissions regarding the practices ofthe Underwriters with respect to their allocation of shares of common stock in these offerings and their receipt of commissions from customers related tosuch allocations. Various plaintiffs have filed actions asserting similar allegations concerning the initial public offerings of approximately 300 other issuers.These various cases pending in the Southern District of New York have been coordinated for pretrial proceedings as In re Initial Public Offering SecuritiesLitigation, 21 MC 92. In April 2002, the plaintiffs filed a consolidated amended complaint in the action against the Company, alleging violations of theSecurities Act of 1933 and the Securities Exchange Act of 1934. The defendants in the coordinated proceeding filed motions to dismiss. In October 2002,the Company’s officers were dismissed from the case without prejudice pursuant to a stipulation. On February 19, 2003, the Court granted in part anddenied in part the motion to dismiss, but declined to dismiss the claims against the Company.The parties have reached a global settlement of the litigation. On October 5, 2009, the Court entered an Opinion and Order granting final approval of thesettlement. Under the settlement, the insurers are to pay the full amount of settlement share allocated to the Company, and the Company will bear nofinancial liability. The Company, as well as the officer and director defendants who were previously dismissed from the action pursuant to tollingagreements, will receive complete dismissals from the case. Certain objectors have appealed the Court’s October 5, 2009, final order to the Second CircuitCourt of Appeals.
38
Table of Contents
Juniper Networks, Inc.Notes to Condensed Consolidated Financial Statements (Continued)
IRS Notices of Proposed AdjustmentsIn 2007, the IRS opened an examination of the Company’s U.S. federal income tax and employment tax returns for the 2004 fiscal year. Subsequently, theIRS extended their examination of the Company’s employment tax returns to include fiscal years 2005 and 2006. As of June 30, 2010, the IRS has not yetconcluded its examinations of these returns. In September 2008, as part of its ongoing audit of the U.S. federal income tax return, the IRS issued a Notice ofProposed Adjustment (“NOPA”) regarding the Company’s business credits. The Company believes that it has adequately provided for any reasonablyforeseeable outcome related to this proposed adjustment.In July 2009, the Company received a NOPA from the IRS claiming that the Company owes additional taxes, plus interest and possible penalties, for the2004 tax year based on a transfer pricing transaction related to the license of acquired intangibles under an intercompany R&D cost sharing arrangement.The asserted changes to the Company’s 2004 tax year would affect the Company’s income tax liabilities in tax years subsequent to 2003. Because of theNOPA, the estimated incremental tax liability would be approximately $807 million, excluding interest and penalties. The Company has filed a protest tothe proposed deficiency with the IRS, which will cause the matter to be referred to the Appeals Division of the IRS. The Company strongly believes theIRS’ position with regard to this matter is inconsistent with applicable tax laws and existing Treasury regulations, and that the Company’s previouslyreported income tax provision for the year in question is appropriate. However, there can be no assurance that this matter will be resolved in the Company’sfavor. Regardless of whether this matter is resolved in the Company’s favor, the final resolution of this matter could be expensive and time−consuming todefend and/or settle. While the Company believes it has provided adequately for this matter, there is a possibility that an adverse outcome of the mattercould have a material effect on its results of operations and financial condition.The Company has not reached a final resolution with the IRS on an adjustment the IRS proposed for the 1999 and 2000 tax years. The Company is alsounder routine examination by certain state and non−U.S. tax authorities. The Company believes that it has adequately provided for any reasonablyforeseeable outcomes related to these audits.Note 16. Joint VentureIn 2009, the Company entered into an agreement to form a joint venture to provide a combined carrier Ethernet−based solution with NSN. Since inception,the Company has had a 60 percent interest in the joint venture. Both NSN and Juniper Networks are entitled to appoint two board members to the Board ofthe joint venture. The Board shall consist of four board members at all times.Given the Company’s majority ownership interest in the joint venture, the venture’s financial results have been consolidated with the accounts of theCompany, and a noncontrolling interest has been recorded to reflect the noncontrolling investor’s interest in the venture’s results. All intercompanytransactions have been eliminated, with the exception of the noncontrolling interest.
39

Table of Contents
Juniper Networks, Inc.Notes to Condensed Consolidated Financial Statements (Continued)
Note 17. Subsequent EventsStock RepurchasesSubsequent to June 30, 2010, through the filing of this report, the Company repurchased and retired approximately 3.1 million shares of its common stockfor approximately $79.5 million through its 2008 and 2010 Stock Repurchase Programs at an average purchase price of $25.76 per share. As of the filingdate, the Company’s 2010 Stock Repurchase Program had remaining authorized funds of $987.3 million for future stock repurchases and the 2008 StockRepurchase Program had no remaining authorized funds available for future stock repurchases. Purchases under the Company’s stock repurchase programsare subject to a review of the circumstances in place at the time and will be made from time to time as permitted by securities laws and other legalrequirements. These programs may be discontinued at any time.Business AcquisitionIn July 2010, the Company announced it had entered into a definitive agreement to acquire SMobile Systems, Inc., a privately−held software companyfocused on smart−phone and tablet security solutions for a total consideration of approximately $70 million. The acquisition of SMobile Systems, Inc. wasconsummated on July 30, 2010.
40
Table of Contents
Item 2. Management’s Discussion and Analysis of Financial Condition and Results of OperationsForward−Looking StatementsThis Quarterly Report on Form 10−Q (“Report”), including the “Management’s Discussion and Analysis of Financial Condition and Results ofOperations,” contains forward−looking statements regarding future events and the future results of Juniper Networks, Inc. (“we,” “us,” or the“Company”) that are based on our current expectations, estimates, forecasts, and projections about our business, our results of operations, the industry inwhich we operate and the beliefs and assumptions of our management. Words such as “expects,” “anticipates,” “targets,” “goals,” “projects,” “would,”“could,” “intends,” “plans,” “believes,” “seeks,” “estimates,” variations of such words, and similar expressions are intended to identify suchforward−looking statements. These forward−looking statements are only predictions and are subject to risks, uncertainties, and assumptions that aredifficult to predict. Therefore, actual results may differ materially and adversely from those expressed in any forward−looking statements. Factors thatmight cause or contribute to such differences include, but are not limited to, those discussed in this Report under the section entitled “Risk Factors” inItem 1A of Part II and elsewhere, and in other reports we file with the SEC, specifically our most recent Annual Report on Form 10−K. Whileforward−looking statements are based on reasonable expectations of our management at the time that they are made, you should not rely on them. Weundertake no obligation to revise or update publicly any forward−looking statements for any reason.The following discussion is based upon our unaudited Condensed Consolidated Financial Statements included elsewhere in this Report, which have beenprepared in accordance with U.S. generally accepted accounting principles (“U.S. GAAP”). In the course of operating our business, we routinely makedecisions as to the timing of the payment of invoices, the collection of receivables, the manufacturing and shipment of products, the fulfillment of orders,the purchase of supplies, and the building of inventory and spare parts, among other matters. Each of these decisions has some impact on the financialresults for any given period. In making these decisions, we consider various factors including contractual obligations, customer satisfaction, competition,internal and external financial targets and expectations, and financial planning objectives. The preparation of these financial statements requires us to makeestimates and judgments that affect the reported amounts of assets, liabilities, revenues, expenses, and related disclosure of contingencies. On an ongoingbasis, we evaluate our estimates, including those related to sales returns, pricing credits, warranty costs, allowance for doubtful accounts, impairment oflong−term assets, especially goodwill and intangible assets, contract manufacturer exposures for carrying and obsolete material charges, assumptions usedin the valuation of share−based compensation, and litigation. We base our estimates on historical experience and on various other assumptions that webelieve to be reasonable under the circumstances, the results of which form the basis for making judgments about the carrying values of assets and liabilitiesthat are not readily apparent from other sources. For further information about our critical accounting policies and estimates, see Note 2 “CriticalAccounting Policies” to our Condensed Consolidated Financial Statements and our “Critical Accounting Policies and Estimates” section included in this“Management’s Discussion and Analysis of Financial Condition and Results of Operations.” Actual results may differ from these estimates under differentassumptions or conditions.To aid in understanding our operating results for the periods covered by this Report, we have provided an executive overview and a summary of thesignificant events that affected the most recent fiscal quarter and a discussion of the nature of our operating expenses. These sections should be read inconjunction with the more detailed discussion and analysis of our consolidated financial condition and results of operations in this Item 2, our “RiskFactors” section included in Item 1A of Part II, and our unaudited condensed consolidated financial statements and notes included in Item 1 of Part I of thisreport.
41
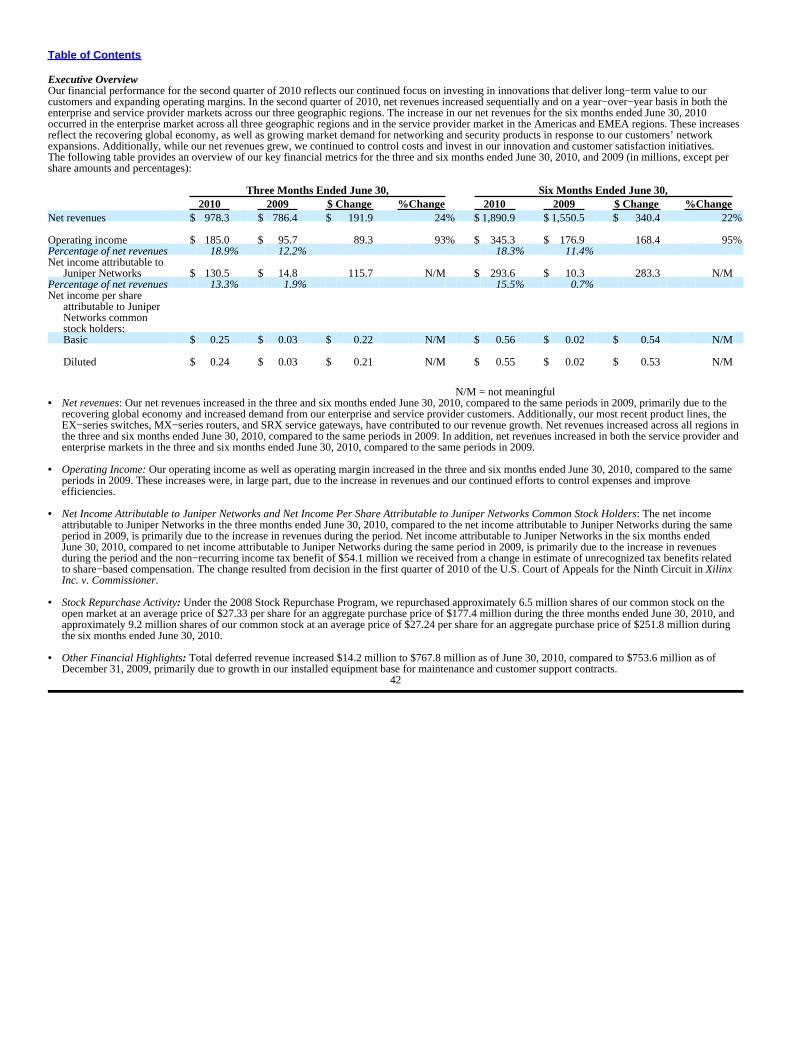
Table of Contents
Executive OverviewOur financial performance for the second quarter of 2010 reflects our continued focus on investing in innovations that deliver long−term value to ourcustomers and expanding operating margins. In the second quarter of 2010, net revenues increased sequentially and on a year−over−year basis in both theenterprise and service provider markets across our three geographic regions. The increase in our net revenues for the six months ended June 30, 2010occurred in the enterprise market across all three geographic regions and in the service provider market in the Americas and EMEA regions. These increasesreflect the recovering global economy, as well as growing market demand for networking and security products in response to our customers’ networkexpansions. Additionally, while our net revenues grew, we continued to control costs and invest in our innovation and customer satisfaction initiatives.The following table provides an overview of our key financial metrics for the three and six months ended June 30, 2010, and 2009 (in millions, except pershare amounts and percentages):
Three Months Ended June 30, Six Months Ended June 30,2010 2009 $ Change %Change 2010 2009 $ Change %Change
Net revenues $ 978.3 $ 786.4 $ 191.9 24% $ 1,890.9 $ 1,550.5 $ 340.4 22%
Operating income $ 185.0 $ 95.7 89.3 93% $ 345.3 $ 176.9 168.4 95%Percentage of net revenues 18.9% 12.2% 18.3% 11.4%Net income attributable to
Juniper Networks $ 130.5 $ 14.8 115.7 N/M $ 293.6 $ 10.3 283.3 N/MPercentage of net revenues 13.3% 1.9% 15.5% 0.7%Net income per share
attributable to JuniperNetworks commonstock holders:Basic $ 0.25 $ 0.03 $ 0.22 N/M $ 0.56 $ 0.02 $ 0.54 N/M
Diluted $ 0.24 $ 0.03 $ 0.21 N/M $ 0.55 $ 0.02 $ 0.53 N/M
N/M = not meaningful• Net revenues: Our net revenues increased in the three and six months ended June 30, 2010, compared to the same periods in 2009, primarily due to the
recovering global economy and increased demand from our enterprise and service provider customers. Additionally, our most recent product lines, theEX−series switches, MX−series routers, and SRX service gateways, have contributed to our revenue growth. Net revenues increased across all regions inthe three and six months ended June 30, 2010, compared to the same periods in 2009. In addition, net revenues increased in both the service provider andenterprise markets in the three and six months ended June 30, 2010, compared to the same periods in 2009.
• Operating Income: Our operating income as well as operating margin increased in the three and six months ended June 30, 2010, compared to the sameperiods in 2009. These increases were, in large part, due to the increase in revenues and our continued efforts to control expenses and improveefficiencies.
• Net Income Attributable to Juniper Networks and Net Income Per Share Attributable to Juniper Networks Common Stock Holders: The net incomeattributable to Juniper Networks in the three months ended June 30, 2010, compared to the net income attributable to Juniper Networks during the sameperiod in 2009, is primarily due to the increase in revenues during the period. Net income attributable to Juniper Networks in the six months endedJune 30, 2010, compared to net income attributable to Juniper Networks during the same period in 2009, is primarily due to the increase in revenuesduring the period and the non−recurring income tax benefit of $54.1 million we received from a change in estimate of unrecognized tax benefits relatedto share−based compensation. The change resulted from decision in the first quarter of 2010 of the U.S. Court of Appeals for the Ninth Circuit in XilinxInc. v. Commissioner.
• Stock Repurchase Activity: Under the 2008 Stock Repurchase Program, we repurchased approximately 6.5 million shares of our common stock on theopen market at an average price of $27.33 per share for an aggregate purchase price of $177.4 million during the three months ended June 30, 2010, andapproximately 9.2 million shares of our common stock at an average price of $27.24 per share for an aggregate purchase price of $251.8 million duringthe six months ended June 30, 2010.
• Other Financial Highlights: Total deferred revenue increased $14.2 million to $767.8 million as of June 30, 2010, compared to $753.6 million as ofDecember 31, 2009, primarily due to growth in our installed equipment base for maintenance and customer support contracts.
42
Table of Contents
Business and Market EnvironmentWe design, develop, and sell products and services that together provide our customers with high−performance network infrastructure that createsresponsive and trusted environments for accelerating the deployment of services and applications over a single network. We serve the high−performancenetworking requirements of global service providers, enterprises, governments, and research and public sector organizations that view the network ascritical to their success. High−performance networking is designed to provide fast, reliable and secure access to applications and services at scale. We offera high−performance network infrastructure that includes IP routing, Ethernet switching, security and application acceleration solutions, as well aspartnerships designed to extend the value of the network and worldwide services and support designed to optimize customer investments.During 2010, we continued to deliver new and innovative, high−performance network infrastructure solutions. We also expanded our portfolio of offeringsfor the enterprise market to provide a comprehensive portfolio of routing, switching, and security products that are running on Junos. We launched our nextgeneration data center architecture called 3−2−1, that enables customers to connect large numbers of data centers, servers, and storage devices in a way thatwe believe improves the economics and the performance of these massive data centers. We announced the EX4500, a data center switch that can leverageour Virtual Chassis technology to create a data center fabric across multiple networking devices and can offer up to 48 10−10GbE ports. We began shippingthe new EX2200 line of fixed−configuration managed Ethernet switches that offers a plug−and−play solution that addresses access connectivityrequirements of today’s high performance businesses. We also announced the EX8200−40XS line card that enables our Juniper switches to deliver 4010−gigabit Ethernet (“GbE”) ports, and the MX80 3D Universal Edge Router, powered by the Junos Trio chipset and designed for both service provider andenterprise deployments. Additionally, we announced our latest fabric chipset that will enable customers to upgrade their existing T−series core routerswithout service interruption.In the area of mobility, we announced and began shipping Junos Pulse, a downloadable client software for secure connections across mobile devicesincluding notebooks, netbooks, smart−phones, and tablets as well as non−mobile devices to a broad range of corporate applications for a better, simplerexperience for users.In addition to our infrastructure and mobility products, we announced four new applications that will enable IT managers to orchestrate the automation andsecurity of networks from a single user−oriented management interface: Juniper Virtual Control, a Junos Space−based application to help data centercustomers manage their Juniper physical switches and VMware virtual switches; Juniper Ethernet Design, a unified Ethernet management application thatenables the data center or campus network to dial up or down as needed in response to the needs of applications and users; Juniper Security Design, asoftware application that allows point−and−click turn−up of both security devices and services; and Juniper Service Insight, a software application forproactive detection, diagnosis, and resolution of network performance issues.On the partnership front, we announced several new and expanded mobility partnerships intended to deliver software and solutions for mobile operators andimprove experience and economics of their networks. Additionally, in April 2010, we completed our acquisition of Ankeena Networks, Inc. (“Ankeena”), aprivately−held company, which gives us video delivery capabilities that optimize web−based video delivery, provide key components of a content deliverynetwork architecture/solution, improve consumers’ online video experience, and reduces service provider and carrier service provider infrastructure costsfor providing web−based video.Over the first two quarters of 2010, the global economy continued to recover, yet the pace and trajectory of that recovery varied by geography. In thiseconomic climate, we saw increased demand for our products and services due to the growing demand for networking, as more traffic is being carried overthe internet, computing is being centralized in massive data centers, and more people in businesses rely on digital devices connected to the network. Thisdemand improved the purchasing behavior of our customers across all theaters for enterprise and among service providers in the Americas and EMEA. Inthe second quarter of 2010, we continued to invest in key research and development (“R&D”) projects that we believe will lead to future growth andremained focused on containing costs and allocating resources effectively.
43
Table of Contents
Critical Accounting Policies and EstimatesThe preparation of financial statements and related disclosures in conformity with U.S. GAAP requires us to make judgments, assumptions, and estimatesthat affect the amounts reported in the condensed consolidated financial statements and the accompanying notes. We base our estimates and assumptions oncurrent facts, historical experience, and various other factors that we believe are reasonable under the circumstances to determine the carrying values ofassets and liabilities that are not readily apparent from other sources. Note 2, Summary of Significant Accounting Policies, in Notes to CondensedConsolidated Financial Statements in Item 1 of Part I of this Quarterly Report on Form 10−Q, describes the significant accounting policies and methodsused in the preparation of the condensed consolidated financial statements. The critical accounting policies described below are significantly affected bycritical accounting estimates. Such accounting policies require significant judgments, assumptions, and estimates used in the preparation of the condensedconsolidated financial statements and actual results could differ materially from the amounts reported based on these policies. To the extent there arematerial differences between our estimates and the actual results, our future consolidated results of operations may be affected.• Revenue Recognition. Revenue is recognized when all of the following criteria have been met:
• Persuasive evidence of an arrangement exists. We generally rely upon sales contracts, or agreements and customer purchase orders, to determinethe existence of an arrangement.
• Delivery has occurred. We use shipping terms and related documents or written evidence of customer acceptance, when applicable, to verifydelivery or performance. In instances where we have outstanding obligations related to product delivery or the final acceptance of the product,revenue is deferred until all the delivery and acceptance criteria have been met.
• Sales price is fixed or determinable. We assess whether the sales price is fixed or determinable based on the payment terms and whether the salesprice is subject to refund or adjustment.
• Collectability is reasonably assured. We assess collectability based on the creditworthiness of the customer as determined by our credit checks andthe customer’s payment history. We record accounts receivable net of allowance for doubtful accounts, estimated customer returns, and pricingcredits.
We adopted Accounting Standards Update (“ASU”) No. 2009−13 “Multiple−Deliverable Revenue Arrangements” (“ASU 2009−13”) and ASUNo. 2009−14, “Certain Revenue Arrangements That Include Software Elements” (“ASU 2009−14”) on a prospective basis as of the beginning of fiscal2010 for new and materially modified arrangements originating after December 31, 2009. Under the new standards, we allocate the total arrangementconsideration to each separable element of an arrangement based on the relative selling price of each element. Arrangement consideration allocated toundelivered elements is deferred until delivery.
For fiscal 2010 and future periods, pursuant to the guidance of ASU 2009−13, when a sales arrangement contains multiple elements, and software andnon−software components that function together to deliver the tangible products’ essential functionality, we allocate revenue to each element based on aselling price hierarchy. The selling price for a deliverable is based on our vendor−specific objective evidence (“VSOE”) if available, third party evidence(“TPE”) if VSOE is not available, or estimated selling price (“ESP”) if neither VSOE nor TPE is available. We then recognize revenue on eachdeliverable in accordance with our policies for product and service revenue recognition.
VSOE is based on the price charged when the element is sold separately. In determining VSOE, we require that a substantial majority of the sellingprices fall within a reasonable range based on historical discounting trends for specific products and services. TPE of selling price is established byevaluating largely interchangeable competitor products or services in stand−alone sales to similarly situated customers. However, as our products containa significant element of proprietary technology and our solutions offer substantially different features and functionality, the comparable pricing ofproducts with similar functionality typically cannot be obtained. Additionally, as we are unable to reliably determine what competitors products’ sellingprices are on a stand−alone
44
Table of Contents
basis, we are not typically able to determine TPE. When determining the best estimate of selling price, we apply management judgment by consideringmultiple factors including, but not limited to pricing practices in different geographies and through different sales channels, gross margin objectives,internal costs, competitor pricing strategies and industry technology lifecycles.
For transactions initiated prior to January 1, 2010, revenue for arrangements with multiple elements, such as sales of products that include services, wasallocated to each element using the residual method based on the VSOE of fair value of the undelivered items pursuant to Accounting StandardsCodification (“ASC”) Topic 985−605, Software – Revenue Recognition. Under the residual method, the amount of revenue allocated to deliveredelements equals the total arrangement consideration less the aggregate fair value of any undelivered elements. If VSOE of fair value of one or moreundelivered items does not exist, revenue from the entire arrangement is deferred and recognized at the earlier of (i) delivery of those elements or(ii) when fair value can be established unless maintenance is the only undelivered element, in which case, the entire arrangement fee is recognizedratably over the contractual support period.
As a result of the adoption of ASU 2009−13 and ASU 2009−14, net revenues for the three and six months ended June 30, 2010 were approximately$53 million and $78 million higher than the net revenues that would have been recorded under the previous accounting rules. The increase in revenueswas due to recognition of revenue for products booked and shipped during these periods which consisted primarily of $38 million and $60 million for thethree− and six−month periods ended June 30, 2010, respectively, related to undelivered product commitments for which we were unable to demonstratefair value pursuant to the previous accounting standards. The remainder of the increase in revenue for the three− and six−month periods was due toproducts sold into multiple−year service arrangements which were recognized ratably under the previous accounting standards and for the change in ourallocation methodology from the residual method to the relative selling price method as prescribed by the new standard.
We cannot reasonably estimate the effect of adopting these standards on future financial periods as the impact will vary depending on the nature andvolume of new or materially modified arrangements in any given period as well as on changes in our business practices. However, as ASU 2009−13 andASU 2009−14 would allow us to recognize revenue for the portion allocated to delivered items in multiple element arrangements and defer revenue foronly the portion allocated to the undelivered items, we expect that the magnitude of deferrals related to undelivered product commitments and otheritems, for which we previously would not have been able to establish VSOE, will gradually decrease over time.
We account for multiple agreements with a single customer as one arrangement if the contractual terms and/or substance of those agreements indicatethat they may be so closely related that they are, in effect, parts of a single arrangement. Our ability to recognize revenue in the future may be affected ifactual selling prices are significantly less than fair value. In addition, our ability to recognize revenue in the future could be impacted by conditionsimposed by our customers.
For sales to direct end−users, value−added resellers, and OEM partners, we recognize product revenue upon transfer of title and risk of loss, which isgenerally upon shipment. It is our practice to identify an end−user prior to shipment to a value−added reseller. For our end−users and value−addedresellers, there are no significant obligations for future performance such as rights of return or pricing credits. Our agreements with OEM partners mayallow future rights of returns. A portion of our sales is made through distributors under agreements allowing for pricing credits or rights of return. Werecognize product revenue on sales made through these distributors upon sell−through as reported to us by the distributors. Deferred revenue onshipments to distributors reflects the effects of distributor pricing credits and the amount of gross margin expected to be realized upon sell−through.Deferred revenue is recorded net of the related product costs of revenue.
We record reductions to revenue for estimated product returns and pricing adjustments, such as rebates and price protection, in the same period that therelated revenue is recorded. The amount of these reductions is based on historical sales returns and price protection credits, specific criteria included inrebate agreements, and other factors known at the time. Should actual product returns or pricing adjustments differ from our estimates, additionalreductions to revenue may be required. In addition, we report revenue net of sales taxes.
45
Table of Contents
Service revenues include revenue from maintenance, training, and professional services. Maintenance is offered under renewable contracts. Revenuefrom maintenance service contracts is deferred and is recognized ratably over the contractual support period, which is generally one to three years.Revenue from training and professional services is recognized as the services are completed or ratably over the contractual period, which is generally oneyear or less.
We sell certain interests in accounts receivable on a non−recourse basis as part of a customer financing arrangement primarily with one major financingcompany. We record cash received under this arrangement in advance of revenue recognition as short−term debt.
• Contract Manufacturer Liabilities. We outsource most of our manufacturing, repair, and supply chain management operations to our independentcontract manufacturers, and a significant portion of our cost of revenues consists of payments to them. Our independent contract manufacturersmanufacture our products primarily in China, Malaysia, Mexico, and the U.S. We have employees in our manufacturing and operations organization whomanage relationships with our contract manufacturers, manage our supply chain, and monitor product testing and quality. We generally do not own thecomponents, and title to products transfers from the contract manufacturers to us and immediately to our customers upon shipment. Our independentcontract manufacturers produce our products using design specifications, quality assurance programs, and standards that we establish, and they procurecomponents and manufacture our products based on our demand forecasts. These forecasts are based on our estimates of future demand for our products,which are in turn based on historical trends and an analysis from our sales and marketing organizations, adjusted for overall market conditions. Weestablish a provision for inventory, carrying costs, and obsolete material exposures for excess components purchased based on historical trends. If theactual component usage and product demand are significantly lower than forecasted, which may be caused by factors outside of our control, we mayincur charges for excess components, which could have an adverse impact on our gross margins and profitability. Supply chain management remains anarea of focus as we balance the risk of material obsolescence and supply chain flexibility in order to reduce lead times.
• Warranty Costs. We generally offer a one−year warranty on all of our hardware products and a 90−day warranty on the media that contains the softwareembedded in the products. We accrue for warranty costs as part of our cost of sales based on associated material costs, labor costs for customer support,and overhead at the time revenue is recognized. Material cost is estimated primarily based upon the historical costs to repair or replace product returnswithin the warranty period. Technical support labor and overhead cost are estimated primarily based upon historical trends in the cost to support thecustomer cases within the warranty period. Although we engage in extensive product quality programs and processes, our warranty obligation is affectedby product failure rates, use of materials, technical labor costs, and associated overhead incurred. Should actual product failure rates, use of materials, orservice delivery costs differ from our estimates, we may incur additional warranty costs, which could reduce gross margin.
• Goodwill and Purchased Intangible Assets. We make significant estimates and assumptions when evaluating impairment of goodwill and otherintangible assets on an ongoing basis, as well as when valuing goodwill and other intangible assets in connection with the initial purchase price allocationof an acquired entity. The amounts and useful lives assigned to identified intangible assets impacts the amount and timing of future amortization expense.The value of our intangible assets, including goodwill, could be impacted by future adverse changes such as: (i) future declines in our operating results,(ii) a sustained decline in our market capitalization, (iii) significant slowdown in the worldwide economy or the networking industry, or (iv) failure tomeet our forecasted operating results. We evaluate these assets on an annual basis as of November 1 or more frequently if we believe indicators ofimpairment exist. The process of evaluating the potential impairment of goodwill and intangible assets is subjective and requires significant judgment atmany points during the analysis. Impairment of goodwill is tested at the reporting unit level by comparing the reporting unit’s carrying value, includinggoodwill, to the fair value of the reporting unit. The fair values of the reporting units are estimated using a combination of the income approach and themarket approach. Under the market approach, we estimate fair value of our reporting units based on market multiples of revenue or earnings forcomparable companies. Under the income approach, we calculate fair value of a reporting unit based on the present value of estimated future cash flows.If the fair value of the reporting
46
Table of Contents
unit exceeds the carrying value of the net assets assigned to that unit, goodwill is not impaired and we are not required to perform further testing. If thecarrying value of the net assets assigned to the reporting unit exceeds the fair value of the reporting unit, then we must perform the second step of theimpairment test in order to determine the implied fair value of the reporting unit’s goodwill. If the carrying value of a reporting unit’s goodwill exceedsits implied fair value, then we record an impairment loss equal to the difference. Intangible assets are evaluated for impairment whenever events orchanges in circumstances indicate that the carrying amount of the assets may not be recoverable. An asset is considered impaired if its carrying amountexceeds the future net cash flow the asset is expected to generate. If an asset is considered to be impaired, the impairment to be recognized is the amountby which the carrying amount of the asset exceeds its fair value. We assess the recoverability of our intangible assets by determining whether theunamortized balances are greater than the sum of undiscounted future net cash flows of the related assets. The amount of impairment, if any, is measuredbased on projected discounted future net cash flows. The estimates we have used are consistent with the plans and estimates that we use to manage ourbusiness. If our actual results or the plans and estimates used in future impairment analyses are lower than the original estimates used to assess therecoverability of these assets, we could incur additional impairment charges.
• Share−Based Compensation. We recognize share−based compensation expense for all share−based payment awards including employee stock options,restricted stock units (“RSUs”), performance share awards (“PSAs”), and purchases under our Employee Stock Purchase Plan in accordance with FASBASC Topic Compensation – Stock Compensation (“FASB ASC Topic 718”). Share−based compensation expense for expected−to−vest share−basedawards is valued under the single−option approach and amortized on a straight−line basis, net of estimated forfeitures.
We utilize the Black−Scholes−Merton (“BSM”) option−pricing model in order to determine the fair value of stock options. The BSM model requiresvarious highly subjective assumptions including volatility, expected option life, and risk−free interest rate. The expected volatility is based on theimplied volatility of market traded options on our common stock, adjusted for other relevant factors including historical volatility of our common stockover the most recent period commensurate with the estimated expected life of our stock options. The expected life of an award is based on historicalexperience, the terms and conditions of the stock awards granted to employees, as well as the potential effect from options that have not been exercisedat the time. We determine the fair value of RSUs and PSAs based on the closing market price of our common stock on the grant date. In addition, weestimate stock compensation expense for our PSAs based on the vesting criteria and only recognize expense for the portions of such awards for whichannual targets have been set.
The assumptions used in calculating the fair value of share−based payment awards represent management’s best estimates. These estimates involveinherent uncertainties and the application of management’s judgment. If factors change and we use different assumptions, our share−based compensationexpense could be materially different in the future. In addition, we are required to estimate the expected forfeiture rate and recognize expense only forthose expected−to−vest shares. If our actual forfeiture rate is materially different from our estimate, our recorded share−based compensationexpense could be different.
• Income Taxes. Estimates and judgments occur in the calculation of certain tax liabilities and in the determination of the recoverability of certain deferredtax assets, which arise from temporary differences and carryforwards. Deferred tax assets and liabilities are measured using the currently enacted taxrates that apply to taxable income in effect for the years in which those tax assets are expected to be realized or settled. We regularly assess the likelihoodthat our deferred tax assets will be realized from recoverable income taxes or recovered from future taxable income based on the realization criteria setforth in FASB ASC Topic – Income Taxes (“FASB ASC Topic 740”). To the extent that we believe any amounts are not more likely than not to berealized, we record a valuation allowance to reduce our deferred tax assets. We believe it is more likely than not that future income from the reversal ofthe deferred tax liabilities and forecasted income will be sufficient to fully recover the remaining deferred tax assets. In the event we determine that all orpart of the net deferred tax assets are not realizable in the future, an adjustment to the valuation allowance would be charged to earnings in the periodsuch determination is made. Similarly, if we subsequently realize deferred tax assets that were previously determined to be unrealizable, the respectivevaluation allowance would be reversed, resulting in an adjustment to earnings in the period such determination is made. In addition, the calculation ofour tax liabilities involves dealing with uncertainties in the
47
Table of Contents
application of complex tax regulations. We recognize and measure potential liabilities based upon our estimate of whether, and the extent to which,additional taxes will be due.
Significant judgment is required in determining any valuation allowance recorded against deferred tax assets. In assessing the need for a valuationallowance, we consider all available evidence, including past operating results, estimates of future taxable income, and the feasibility of tax planningstrategies. In the event that we change our determination as to the amount of deferred tax assets that can be realized, we will adjust our valuationallowance with a corresponding effect to the provision for income taxes in the period in which such determination is made.
Significant judgment is also required in evaluating our uncertain tax positions under FASB ASC Topic 740 and determining our provision for incometaxes. Although we believe our reserves under FASB ASC Topic 740 are reasonable, no assurance can be given that the final tax outcome of thesematters will not be different from that which is reflected in our historical income tax provisions and accruals. We adjust these reserves in light ofchanging facts and circumstances, such as the closing of a tax audit or the refinement of an estimate. To the extent that the final tax outcome of thesematters is different from the amounts recorded, such differences will affect the provision for income taxes in the period in which such determination ismade as it was during the first quarter of 2010, when we recorded a non−recurring income tax benefit as a result of a taxpayer favorable federal appellatecourt ruling in Xilinx, Inc. v. Commissioner. The provision for income taxes includes the effect of reserves under FASB ASC Topic 740 and any changesto the reserves that are considered appropriate, as well as the related net interest and penalties, if applicable.
• Loss Contingencies. We are subject to the possibility of various loss contingencies arising in the ordinary course of business. We consider the likelihoodof loss or impairment of an asset, or the incurrence of a liability, as well as our ability to reasonably estimate the amount of loss, in determining losscontingencies. An estimated loss contingency is accrued when it is probable that an asset has been impaired or a liability has been incurred and theamount of loss can be reasonably estimated. We record a charge equal to the minimum estimated liability for litigation costs or a loss contingency onlywhen both of the following conditions are met: (i) information available prior to issuance of our consolidated financial statements indicates that it isprobable that an asset had been impaired or a liability had been incurred at the date of the financial statements and (ii) the range of loss can be reasonablyestimated. We regularly evaluate current information available to us to determine whether such accruals should be adjusted and whether new accruals arerequired.
From time to time, we are involved in disputes, litigation, and other legal actions. We are aggressively defending our current litigation matters. However,there are many uncertainties associated with any litigation, and these actions or other third−party claims against us may cause us to incur costly litigationand/or substantial settlement charges. In addition, the resolution of any future intellectual property litigation may require us to make royalty payments,which could adversely affect gross margins in future periods. If any of those events were to occur, our business, financial condition, results of operations,and cash flows could be adversely affected. The actual liability in any such matters may be materially different from our estimates, which could result inthe need to adjust our liability and record additional expenses. For a discussion of current litigation, please see Note 15, Commitments andContingencies, under the heading “Legal Proceedings” in the Notes to Condensed Consolidated Financial Statements in Item 1 of Part I of this QuarterlyReport on Form 10−Q.
Recent Accounting PronouncementsSee Note 2, Summary of Significant Accounting Policies, in the Notes to Condensed Consolidated Financial Statements in Item 1 of Part I of this QuarterlyReport on Form 10−Q, for a full description of recent accounting pronouncements, including the actual and expected dates of adoption and estimated effectson our consolidated results of operations and financial condition, which is incorporated herein by reference.
48
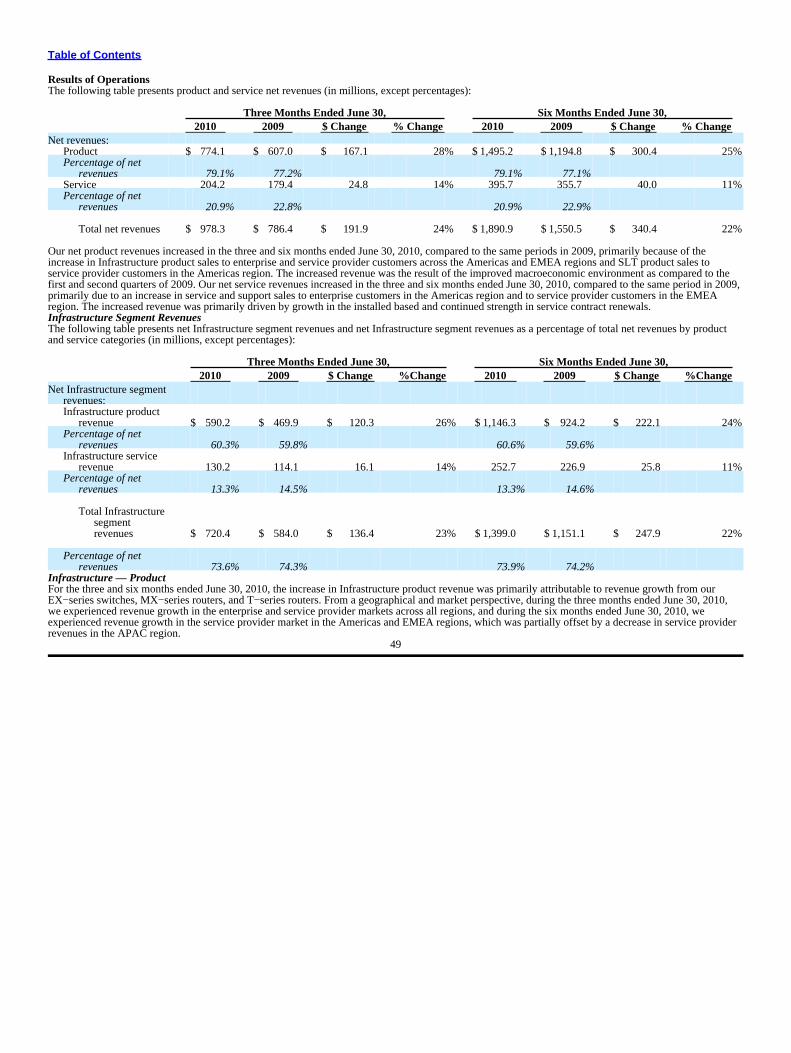
Table of Contents
Results of OperationsThe following table presents product and service net revenues (in millions, except percentages):
Three Months Ended June 30, Six Months Ended June 30,2010 2009 $ Change % Change 2010 2009 $ Change % Change
Net revenues:Product $ 774.1 $ 607.0 $ 167.1 28% $ 1,495.2 $ 1,194.8 $ 300.4 25%Percentage of net
revenues 79.1% 77.2% 79.1% 77.1%Service 204.2 179.4 24.8 14% 395.7 355.7 40.0 11%Percentage of net
revenues 20.9% 22.8% 20.9% 22.9%
Total net revenues $ 978.3 $ 786.4 $ 191.9 24% $ 1,890.9 $ 1,550.5 $ 340.4 22%
Our net product revenues increased in the three and six months ended June 30, 2010, compared to the same periods in 2009, primarily because of theincrease in Infrastructure product sales to enterprise and service provider customers across the Americas and EMEA regions and SLT product sales toservice provider customers in the Americas region. The increased revenue was the result of the improved macroeconomic environment as compared to thefirst and second quarters of 2009. Our net service revenues increased in the three and six months ended June 30, 2010, compared to the same period in 2009,primarily due to an increase in service and support sales to enterprise customers in the Americas region and to service provider customers in the EMEAregion. The increased revenue was primarily driven by growth in the installed based and continued strength in service contract renewals.Infrastructure Segment RevenuesThe following table presents net Infrastructure segment revenues and net Infrastructure segment revenues as a percentage of total net revenues by productand service categories (in millions, except percentages):
Three Months Ended June 30, Six Months Ended June 30,2010 2009 $ Change %Change 2010 2009 $ Change %Change
Net Infrastructure segmentrevenues:Infrastructure product
revenue $ 590.2 $ 469.9 $ 120.3 26% $ 1,146.3 $ 924.2 $ 222.1 24%Percentage of net
revenues 60.3% 59.8% 60.6% 59.6%Infrastructure service
revenue 130.2 114.1 16.1 14% 252.7 226.9 25.8 11%Percentage of net
revenues 13.3% 14.5% 13.3% 14.6%
Total Infrastructuresegmentrevenues $ 720.4 $ 584.0 $ 136.4 23% $ 1,399.0 $ 1,151.1 $ 247.9 22%
Percentage of netrevenues 73.6% 74.3% 73.9% 74.2%
Infrastructure — ProductFor the three and six months ended June 30, 2010, the increase in Infrastructure product revenue was primarily attributable to revenue growth from ourEX−series switches, MX−series routers, and T−series routers. From a geographical and market perspective, during the three months ended June 30, 2010,we experienced revenue growth in the enterprise and service provider markets across all regions, and during the six months ended June 30, 2010, weexperienced revenue growth in the service provider market in the Americas and EMEA regions, which was partially offset by a decrease in service providerrevenues in the APAC region.
49
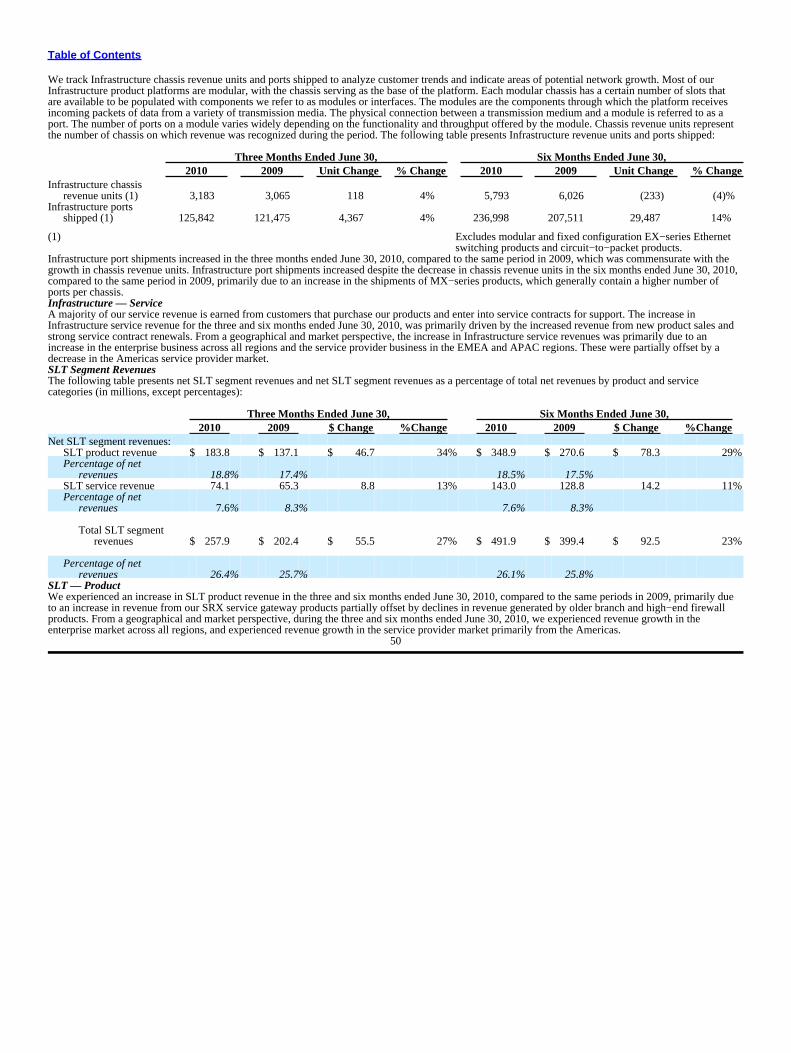
Table of Contents
We track Infrastructure chassis revenue units and ports shipped to analyze customer trends and indicate areas of potential network growth. Most of ourInfrastructure product platforms are modular, with the chassis serving as the base of the platform. Each modular chassis has a certain number of slots thatare available to be populated with components we refer to as modules or interfaces. The modules are the components through which the platform receivesincoming packets of data from a variety of transmission media. The physical connection between a transmission medium and a module is referred to as aport. The number of ports on a module varies widely depending on the functionality and throughput offered by the module. Chassis revenue units representthe number of chassis on which revenue was recognized during the period. The following table presents Infrastructure revenue units and ports shipped:
Three Months Ended June 30, Six Months Ended June 30,2010 2009 Unit Change % Change 2010 2009 Unit Change % Change
Infrastructure chassisrevenue units (1) 3,183 3,065 118 4% 5,793 6,026 (233) (4)%
Infrastructure portsshipped (1) 125,842 121,475 4,367 4% 236,998 207,511 29,487 14%
(1) Excludes modular and fixed configuration EX−series Ethernetswitching products and circuit−to−packet products.
Infrastructure port shipments increased in the three months ended June 30, 2010, compared to the same period in 2009, which was commensurate with thegrowth in chassis revenue units. Infrastructure port shipments increased despite the decrease in chassis revenue units in the six months ended June 30, 2010,compared to the same period in 2009, primarily due to an increase in the shipments of MX−series products, which generally contain a higher number ofports per chassis.Infrastructure — ServiceA majority of our service revenue is earned from customers that purchase our products and enter into service contracts for support. The increase inInfrastructure service revenue for the three and six months ended June 30, 2010, was primarily driven by the increased revenue from new product sales andstrong service contract renewals. From a geographical and market perspective, the increase in Infrastructure service revenues was primarily due to anincrease in the enterprise business across all regions and the service provider business in the EMEA and APAC regions. These were partially offset by adecrease in the Americas service provider market.SLT Segment RevenuesThe following table presents net SLT segment revenues and net SLT segment revenues as a percentage of total net revenues by product and servicecategories (in millions, except percentages):
Three Months Ended June 30, Six Months Ended June 30,2010 2009 $ Change %Change 2010 2009 $ Change %Change
Net SLT segment revenues:SLT product revenue $ 183.8 $ 137.1 $ 46.7 34% $ 348.9 $ 270.6 $ 78.3 29%Percentage of net
revenues 18.8% 17.4% 18.5% 17.5%SLT service revenue 74.1 65.3 8.8 13% 143.0 128.8 14.2 11%Percentage of net
revenues 7.6% 8.3% 7.6% 8.3%
Total SLT segmentrevenues $ 257.9 $ 202.4 $ 55.5 27% $ 491.9 $ 399.4 $ 92.5 23%
Percentage of netrevenues 26.4% 25.7% 26.1% 25.8%
SLT — ProductWe experienced an increase in SLT product revenue in the three and six months ended June 30, 2010, compared to the same periods in 2009, primarily dueto an increase in revenue from our SRX service gateway products partially offset by declines in revenue generated by older branch and high−end firewallproducts. From a geographical and market perspective, during the three and six months ended June 30, 2010, we experienced revenue growth in theenterprise market across all regions, and experienced revenue growth in the service provider market primarily from the Americas.
50
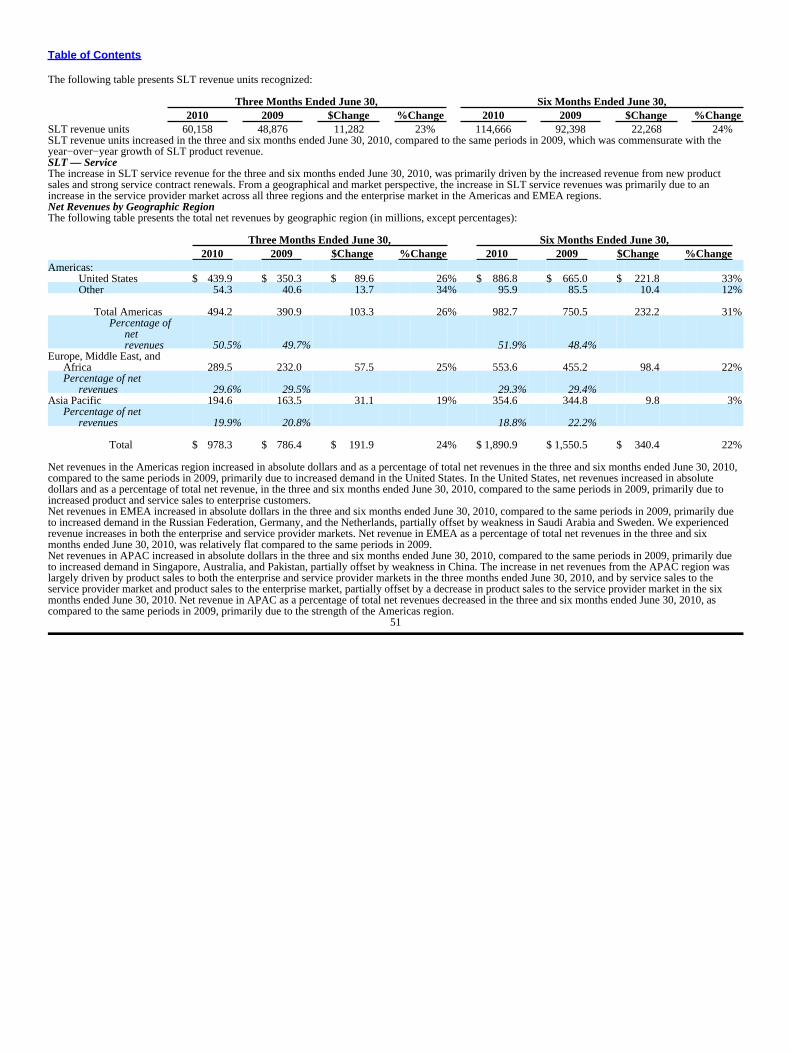
Table of Contents
The following table presents SLT revenue units recognized:
Three Months Ended June 30, Six Months Ended June 30,2010 2009 $Change %Change 2010 2009 $Change %Change
SLT revenue units 60,158 48,876 11,282 23% 114,666 92,398 22,268 24%SLT revenue units increased in the three and six months ended June 30, 2010, compared to the same periods in 2009, which was commensurate with theyear−over−year growth of SLT product revenue.SLT — ServiceThe increase in SLT service revenue for the three and six months ended June 30, 2010, was primarily driven by the increased revenue from new productsales and strong service contract renewals. From a geographical and market perspective, the increase in SLT service revenues was primarily due to anincrease in the service provider market across all three regions and the enterprise market in the Americas and EMEA regions.Net Revenues by Geographic RegionThe following table presents the total net revenues by geographic region (in millions, except percentages):
Three Months Ended June 30, Six Months Ended June 30,2010 2009 $Change %Change 2010 2009 $Change %Change
Americas:United States $ 439.9 $ 350.3 $ 89.6 26% $ 886.8 $ 665.0 $ 221.8 33%Other 54.3 40.6 13.7 34% 95.9 85.5 10.4 12%
Total Americas 494.2 390.9 103.3 26% 982.7 750.5 232.2 31%Percentage of
netrevenues 50.5% 49.7% 51.9% 48.4%
Europe, Middle East, andAfrica 289.5 232.0 57.5 25% 553.6 455.2 98.4 22%Percentage of net
revenues 29.6% 29.5% 29.3% 29.4%Asia Pacific 194.6 163.5 31.1 19% 354.6 344.8 9.8 3%
Percentage of netrevenues 19.9% 20.8% 18.8% 22.2%
Total $ 978.3 $ 786.4 $ 191.9 24% $ 1,890.9 $ 1,550.5 $ 340.4 22%
Net revenues in the Americas region increased in absolute dollars and as a percentage of total net revenues in the three and six months ended June 30, 2010,compared to the same periods in 2009, primarily due to increased demand in the United States. In the United States, net revenues increased in absolutedollars and as a percentage of total net revenue, in the three and six months ended June 30, 2010, compared to the same periods in 2009, primarily due toincreased product and service sales to enterprise customers.Net revenues in EMEA increased in absolute dollars in the three and six months ended June 30, 2010, compared to the same periods in 2009, primarily dueto increased demand in the Russian Federation, Germany, and the Netherlands, partially offset by weakness in Saudi Arabia and Sweden. We experiencedrevenue increases in both the enterprise and service provider markets. Net revenue in EMEA as a percentage of total net revenues in the three and sixmonths ended June 30, 2010, was relatively flat compared to the same periods in 2009.Net revenues in APAC increased in absolute dollars in the three and six months ended June 30, 2010, compared to the same periods in 2009, primarily dueto increased demand in Singapore, Australia, and Pakistan, partially offset by weakness in China. The increase in net revenues from the APAC region waslargely driven by product sales to both the enterprise and service provider markets in the three months ended June 30, 2010, and by service sales to theservice provider market and product sales to the enterprise market, partially offset by a decrease in product sales to the service provider market in the sixmonths ended June 30, 2010. Net revenue in APAC as a percentage of total net revenues decreased in the three and six months ended June 30, 2010, ascompared to the same periods in 2009, primarily due to the strength of the Americas region.
51
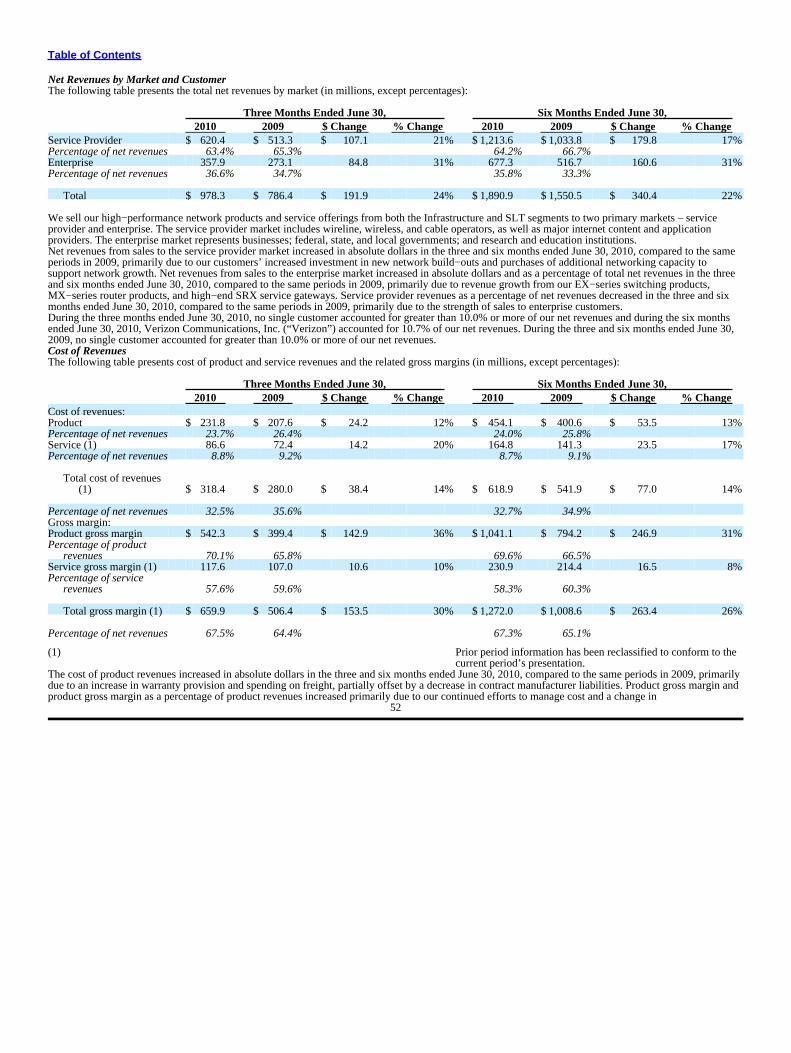
Table of Contents
Net Revenues by Market and CustomerThe following table presents the total net revenues by market (in millions, except percentages):
Three Months Ended June 30, Six Months Ended June 30,2010 2009 $ Change % Change 2010 2009 $ Change % Change
Service Provider $ 620.4 $ 513.3 $ 107.1 21% $ 1,213.6 $ 1,033.8 $ 179.8 17%Percentage of net revenues 63.4% 65.3% 64.2% 66.7%Enterprise 357.9 273.1 84.8 31% 677.3 516.7 160.6 31%Percentage of net revenues 36.6% 34.7% 35.8% 33.3%
Total $ 978.3 $ 786.4 $ 191.9 24% $ 1,890.9 $ 1,550.5 $ 340.4 22%
We sell our high−performance network products and service offerings from both the Infrastructure and SLT segments to two primary markets – serviceprovider and enterprise. The service provider market includes wireline, wireless, and cable operators, as well as major internet content and applicationproviders. The enterprise market represents businesses; federal, state, and local governments; and research and education institutions.Net revenues from sales to the service provider market increased in absolute dollars in the three and six months ended June 30, 2010, compared to the sameperiods in 2009, primarily due to our customers’ increased investment in new network build−outs and purchases of additional networking capacity tosupport network growth. Net revenues from sales to the enterprise market increased in absolute dollars and as a percentage of total net revenues in the threeand six months ended June 30, 2010, compared to the same periods in 2009, primarily due to revenue growth from our EX−series switching products,MX−series router products, and high−end SRX service gateways. Service provider revenues as a percentage of net revenues decreased in the three and sixmonths ended June 30, 2010, compared to the same periods in 2009, primarily due to the strength of sales to enterprise customers.During the three months ended June 30, 2010, no single customer accounted for greater than 10.0% or more of our net revenues and during the six monthsended June 30, 2010, Verizon Communications, Inc. (“Verizon”) accounted for 10.7% of our net revenues. During the three and six months ended June 30,2009, no single customer accounted for greater than 10.0% or more of our net revenues.Cost of RevenuesThe following table presents cost of product and service revenues and the related gross margins (in millions, except percentages):
Three Months Ended June 30, Six Months Ended June 30,2010 2009 $ Change % Change 2010 2009 $ Change % Change
Cost of revenues:Product $ 231.8 $ 207.6 $ 24.2 12% $ 454.1 $ 400.6 $ 53.5 13%Percentage of net revenues 23.7% 26.4% 24.0% 25.8%Service (1) 86.6 72.4 14.2 20% 164.8 141.3 23.5 17%Percentage of net revenues 8.8% 9.2% 8.7% 9.1%
Total cost of revenues(1) $ 318.4 $ 280.0 $ 38.4 14% $ 618.9 $ 541.9 $ 77.0 14%
Percentage of net revenues 32.5% 35.6% 32.7% 34.9%Gross margin:Product gross margin $ 542.3 $ 399.4 $ 142.9 36% $ 1,041.1 $ 794.2 $ 246.9 31%Percentage of product
revenues 70.1% 65.8% 69.6% 66.5%Service gross margin (1) 117.6 107.0 10.6 10% 230.9 214.4 16.5 8%Percentage of service
revenues 57.6% 59.6% 58.3% 60.3%
Total gross margin (1) $ 659.9 $ 506.4 $ 153.5 30% $ 1,272.0 $ 1,008.6 $ 263.4 26%
Percentage of net revenues 67.5% 64.4% 67.3% 65.1%
(1) Prior period information has been reclassified to conform to thecurrent period’s presentation.
The cost of product revenues increased in absolute dollars in the three and six months ended June 30, 2010, compared to the same periods in 2009, primarilydue to an increase in warranty provision and spending on freight, partially offset by a decrease in contract manufacturer liabilities. Product gross margin andproduct gross margin as a percentage of product revenues increased primarily due to our continued efforts to manage cost and a change in
52
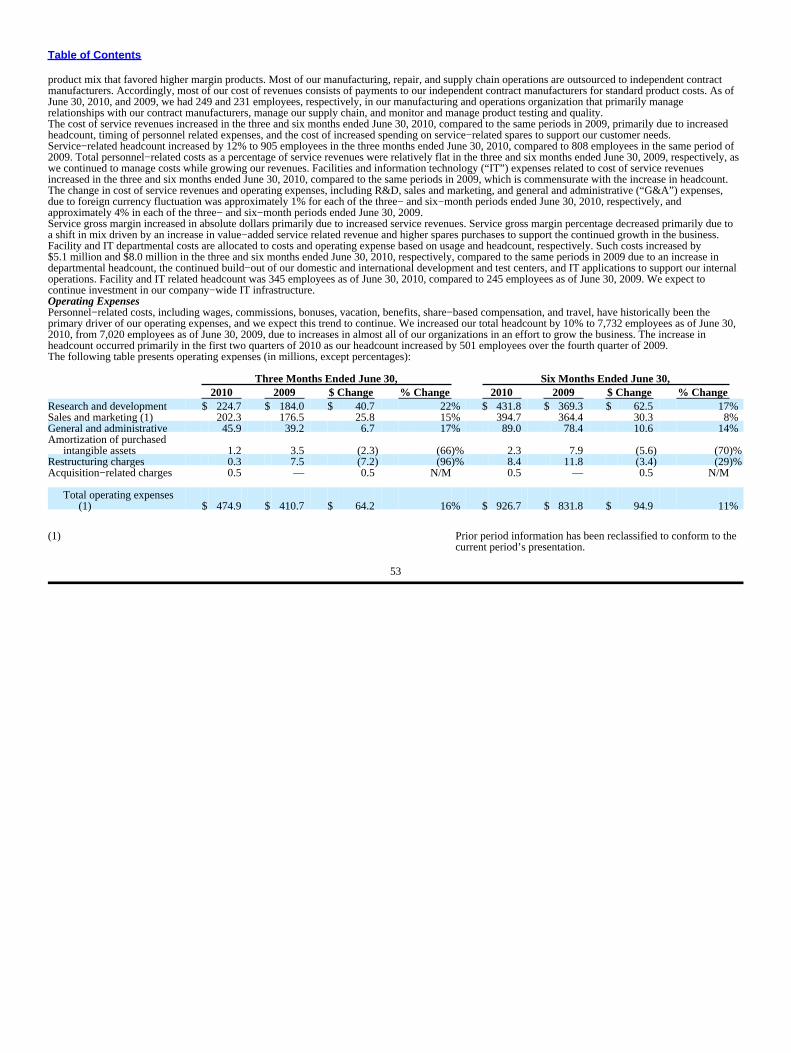
Table of Contents
product mix that favored higher margin products. Most of our manufacturing, repair, and supply chain operations are outsourced to independent contractmanufacturers. Accordingly, most of our cost of revenues consists of payments to our independent contract manufacturers for standard product costs. As ofJune 30, 2010, and 2009, we had 249 and 231 employees, respectively, in our manufacturing and operations organization that primarily managerelationships with our contract manufacturers, manage our supply chain, and monitor and manage product testing and quality.The cost of service revenues increased in the three and six months ended June 30, 2010, compared to the same periods in 2009, primarily due to increasedheadcount, timing of personnel related expenses, and the cost of increased spending on service−related spares to support our customer needs.Service−related headcount increased by 12% to 905 employees in the three months ended June 30, 2010, compared to 808 employees in the same period of2009. Total personnel−related costs as a percentage of service revenues were relatively flat in the three and six months ended June 30, 2009, respectively, aswe continued to manage costs while growing our revenues. Facilities and information technology (“IT”) expenses related to cost of service revenuesincreased in the three and six months ended June 30, 2010, compared to the same periods in 2009, which is commensurate with the increase in headcount.The change in cost of service revenues and operating expenses, including R&D, sales and marketing, and general and administrative (“G&A”) expenses,due to foreign currency fluctuation was approximately 1% for each of the three− and six−month periods ended June 30, 2010, respectively, andapproximately 4% in each of the three− and six−month periods ended June 30, 2009.Service gross margin increased in absolute dollars primarily due to increased service revenues. Service gross margin percentage decreased primarily due toa shift in mix driven by an increase in value−added service related revenue and higher spares purchases to support the continued growth in the business.Facility and IT departmental costs are allocated to costs and operating expense based on usage and headcount, respectively. Such costs increased by$5.1 million and $8.0 million in the three and six months ended June 30, 2010, respectively, compared to the same periods in 2009 due to an increase indepartmental headcount, the continued build−out of our domestic and international development and test centers, and IT applications to support our internaloperations. Facility and IT related headcount was 345 employees as of June 30, 2010, compared to 245 employees as of June 30, 2009. We expect tocontinue investment in our company−wide IT infrastructure.Operating ExpensesPersonnel−related costs, including wages, commissions, bonuses, vacation, benefits, share−based compensation, and travel, have historically been theprimary driver of our operating expenses, and we expect this trend to continue. We increased our total headcount by 10% to 7,732 employees as of June 30,2010, from 7,020 employees as of June 30, 2009, due to increases in almost all of our organizations in an effort to grow the business. The increase inheadcount occurred primarily in the first two quarters of 2010 as our headcount increased by 501 employees over the fourth quarter of 2009.The following table presents operating expenses (in millions, except percentages):
Three Months Ended June 30, Six Months Ended June 30,2010 2009 $ Change % Change 2010 2009 $ Change % Change
Research and development $ 224.7 $ 184.0 $ 40.7 22% $ 431.8 $ 369.3 $ 62.5 17%Sales and marketing (1) 202.3 176.5 25.8 15% 394.7 364.4 30.3 8%General and administrative 45.9 39.2 6.7 17% 89.0 78.4 10.6 14%Amortization of purchased
intangible assets 1.2 3.5 (2.3) (66)% 2.3 7.9 (5.6) (70)%Restructuring charges 0.3 7.5 (7.2) (96)% 8.4 11.8 (3.4) (29)%Acquisition−related charges 0.5 — 0.5 N/M 0.5 — 0.5 N/M
Total operating expenses(1) $ 474.9 $ 410.7 $ 64.2 16% $ 926.7 $ 831.8 $ 94.9 11%
(1) Prior period information has been reclassified to conform to thecurrent period’s presentation.
53
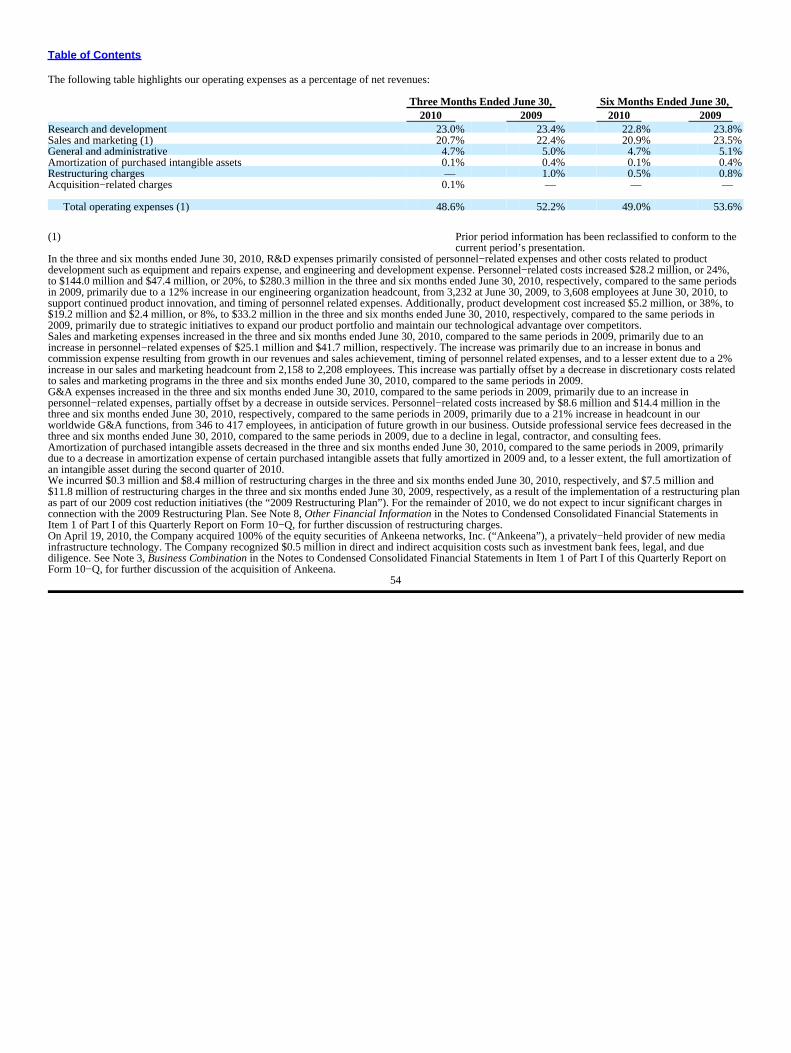
Table of Contents
The following table highlights our operating expenses as a percentage of net revenues:
Three Months Ended June 30, Six Months Ended June 30,2010 2009 2010 2009
Research and development 23.0% 23.4% 22.8% 23.8%Sales and marketing (1) 20.7% 22.4% 20.9% 23.5%General and administrative 4.7% 5.0% 4.7% 5.1%Amortization of purchased intangible assets 0.1% 0.4% 0.1% 0.4%Restructuring charges — 1.0% 0.5% 0.8%Acquisition−related charges 0.1% — — —
Total operating expenses (1) 48.6% 52.2% 49.0% 53.6%
(1) Prior period information has been reclassified to conform to thecurrent period’s presentation.
In the three and six months ended June 30, 2010, R&D expenses primarily consisted of personnel−related expenses and other costs related to productdevelopment such as equipment and repairs expense, and engineering and development expense. Personnel−related costs increased $28.2 million, or 24%,to $144.0 million and $47.4 million, or 20%, to $280.3 million in the three and six months ended June 30, 2010, respectively, compared to the same periodsin 2009, primarily due to a 12% increase in our engineering organization headcount, from 3,232 at June 30, 2009, to 3,608 employees at June 30, 2010, tosupport continued product innovation, and timing of personnel related expenses. Additionally, product development cost increased $5.2 million, or 38%, to$19.2 million and $2.4 million, or 8%, to $33.2 million in the three and six months ended June 30, 2010, respectively, compared to the same periods in2009, primarily due to strategic initiatives to expand our product portfolio and maintain our technological advantage over competitors.Sales and marketing expenses increased in the three and six months ended June 30, 2010, compared to the same periods in 2009, primarily due to anincrease in personnel−related expenses of $25.1 million and $41.7 million, respectively. The increase was primarily due to an increase in bonus andcommission expense resulting from growth in our revenues and sales achievement, timing of personnel related expenses, and to a lesser extent due to a 2%increase in our sales and marketing headcount from 2,158 to 2,208 employees. This increase was partially offset by a decrease in discretionary costs relatedto sales and marketing programs in the three and six months ended June 30, 2010, compared to the same periods in 2009.G&A expenses increased in the three and six months ended June 30, 2010, compared to the same periods in 2009, primarily due to an increase inpersonnel−related expenses, partially offset by a decrease in outside services. Personnel−related costs increased by $8.6 million and $14.4 million in thethree and six months ended June 30, 2010, respectively, compared to the same periods in 2009, primarily due to a 21% increase in headcount in ourworldwide G&A functions, from 346 to 417 employees, in anticipation of future growth in our business. Outside professional service fees decreased in thethree and six months ended June 30, 2010, compared to the same periods in 2009, due to a decline in legal, contractor, and consulting fees.Amortization of purchased intangible assets decreased in the three and six months ended June 30, 2010, compared to the same periods in 2009, primarilydue to a decrease in amortization expense of certain purchased intangible assets that fully amortized in 2009 and, to a lesser extent, the full amortization ofan intangible asset during the second quarter of 2010.We incurred $0.3 million and $8.4 million of restructuring charges in the three and six months ended June 30, 2010, respectively, and $7.5 million and$11.8 million of restructuring charges in the three and six months ended June 30, 2009, respectively, as a result of the implementation of a restructuring planas part of our 2009 cost reduction initiatives (the “2009 Restructuring Plan”). For the remainder of 2010, we do not expect to incur significant charges inconnection with the 2009 Restructuring Plan. See Note 8, Other Financial Information in the Notes to Condensed Consolidated Financial Statements inItem 1 of Part I of this Quarterly Report on Form 10−Q, for further discussion of restructuring charges.On April 19, 2010, the Company acquired 100% of the equity securities of Ankeena networks, Inc. (“Ankeena”), a privately−held provider of new mediainfrastructure technology. The Company recognized $0.5 million in direct and indirect acquisition costs such as investment bank fees, legal, and duediligence. See Note 3, Business Combination in the Notes to Condensed Consolidated Financial Statements in Item 1 of Part I of this Quarterly Report onForm 10−Q, for further discussion of the acquisition of Ankeena.
54
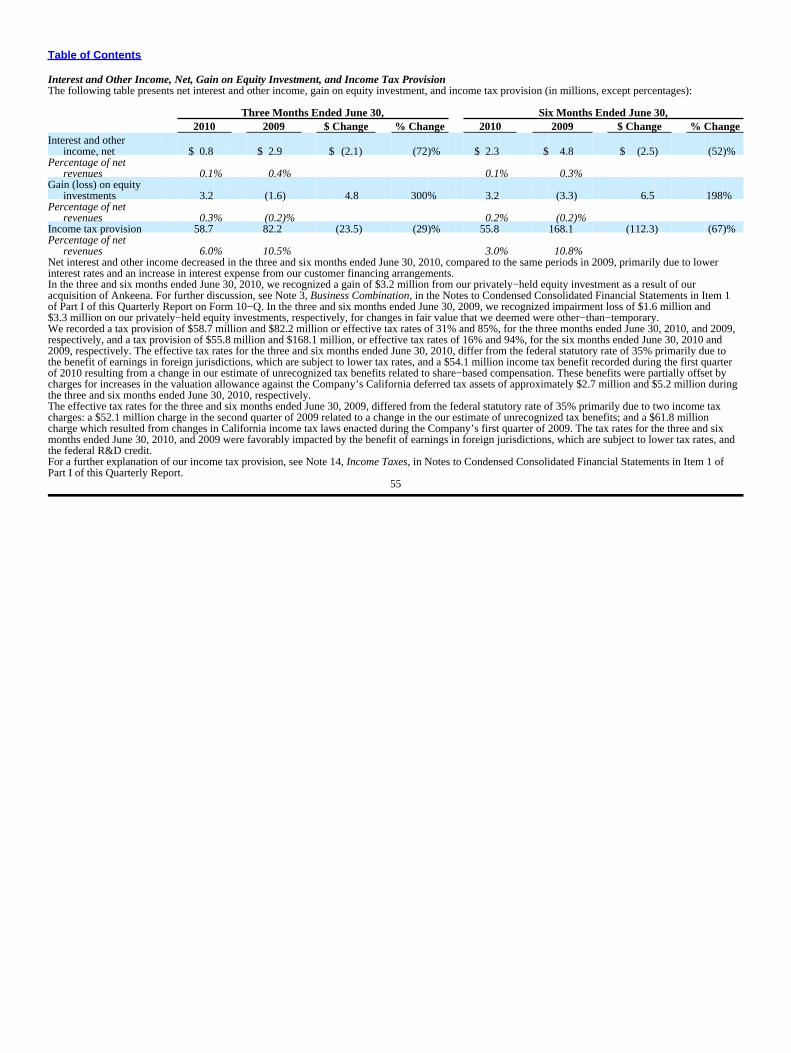
Table of Contents
Interest and Other Income, Net, Gain on Equity Investment, and Income Tax ProvisionThe following table presents net interest and other income, gain on equity investment, and income tax provision (in millions, except percentages):
Three Months Ended June 30, Six Months Ended June 30,2010 2009 $ Change % Change 2010 2009 $ Change % Change
Interest and otherincome, net $ 0.8 $ 2.9 $ (2.1) (72)% $ 2.3 $ 4.8 $ (2.5) (52)%
Percentage of netrevenues 0.1% 0.4% 0.1% 0.3%
Gain (loss) on equityinvestments 3.2 (1.6) 4.8 300% 3.2 (3.3) 6.5 198%
Percentage of netrevenues 0.3% (0.2)% 0.2% (0.2)%
Income tax provision 58.7 82.2 (23.5) (29)% 55.8 168.1 (112.3) (67)%Percentage of net
revenues 6.0% 10.5% 3.0% 10.8%Net interest and other income decreased in the three and six months ended June 30, 2010, compared to the same periods in 2009, primarily due to lowerinterest rates and an increase in interest expense from our customer financing arrangements.In the three and six months ended June 30, 2010, we recognized a gain of $3.2 million from our privately−held equity investment as a result of ouracquisition of Ankeena. For further discussion, see Note 3, Business Combination, in the Notes to Condensed Consolidated Financial Statements in Item 1of Part I of this Quarterly Report on Form 10−Q. In the three and six months ended June 30, 2009, we recognized impairment loss of $1.6 million and$3.3 million on our privately−held equity investments, respectively, for changes in fair value that we deemed were other−than−temporary.We recorded a tax provision of $58.7 million and $82.2 million or effective tax rates of 31% and 85%, for the three months ended June 30, 2010, and 2009,respectively, and a tax provision of $55.8 million and $168.1 million, or effective tax rates of 16% and 94%, for the six months ended June 30, 2010 and2009, respectively. The effective tax rates for the three and six months ended June 30, 2010, differ from the federal statutory rate of 35% primarily due tothe benefit of earnings in foreign jurisdictions, which are subject to lower tax rates, and a $54.1 million income tax benefit recorded during the first quarterof 2010 resulting from a change in our estimate of unrecognized tax benefits related to share−based compensation. These benefits were partially offset bycharges for increases in the valuation allowance against the Company’s California deferred tax assets of approximately $2.7 million and $5.2 million duringthe three and six months ended June 30, 2010, respectively.The effective tax rates for the three and six months ended June 30, 2009, differed from the federal statutory rate of 35% primarily due to two income taxcharges: a $52.1 million charge in the second quarter of 2009 related to a change in the our estimate of unrecognized tax benefits; and a $61.8 millioncharge which resulted from changes in California income tax laws enacted during the Company’s first quarter of 2009. The tax rates for the three and sixmonths ended June 30, 2010, and 2009 were favorably impacted by the benefit of earnings in foreign jurisdictions, which are subject to lower tax rates, andthe federal R&D credit.For a further explanation of our income tax provision, see Note 14, Income Taxes, in Notes to Condensed Consolidated Financial Statements in Item 1 ofPart I of this Quarterly Report.
55
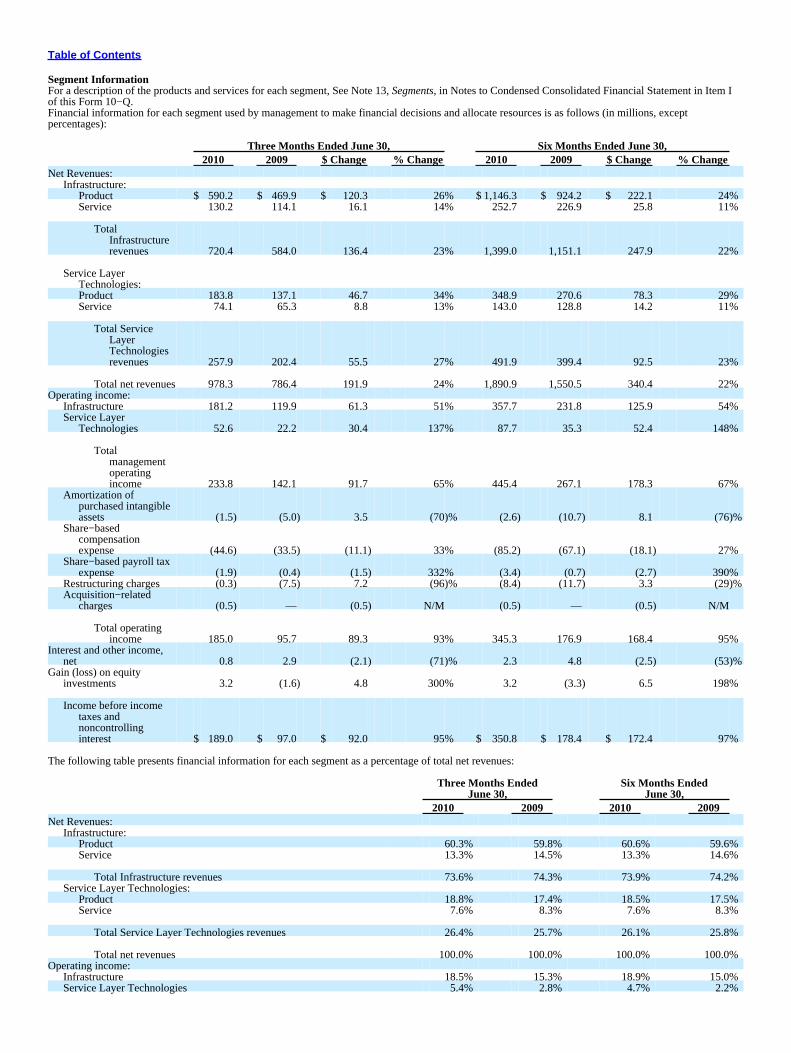
Table of Contents
Segment InformationFor a description of the products and services for each segment, See Note 13, Segments, in Notes to Condensed Consolidated Financial Statement in Item Iof this Form 10−Q.Financial information for each segment used by management to make financial decisions and allocate resources is as follows (in millions, exceptpercentages):
Three Months Ended June 30, Six Months Ended June 30,2010 2009 $ Change % Change 2010 2009 $ Change % Change
Net Revenues:Infrastructure:
Product $ 590.2 $ 469.9 $ 120.3 26% $ 1,146.3 $ 924.2 $ 222.1 24%Service 130.2 114.1 16.1 14% 252.7 226.9 25.8 11%
TotalInfrastructurerevenues 720.4 584.0 136.4 23% 1,399.0 1,151.1 247.9 22%
Service LayerTechnologies:Product 183.8 137.1 46.7 34% 348.9 270.6 78.3 29%Service 74.1 65.3 8.8 13% 143.0 128.8 14.2 11%
Total ServiceLayerTechnologiesrevenues 257.9 202.4 55.5 27% 491.9 399.4 92.5 23%
Total net revenues 978.3 786.4 191.9 24% 1,890.9 1,550.5 340.4 22%Operating income:
Infrastructure 181.2 119.9 61.3 51% 357.7 231.8 125.9 54%Service Layer
Technologies 52.6 22.2 30.4 137% 87.7 35.3 52.4 148%
Totalmanagementoperatingincome 233.8 142.1 91.7 65% 445.4 267.1 178.3 67%
Amortization ofpurchased intangibleassets (1.5) (5.0) 3.5 (70)% (2.6) (10.7) 8.1 (76)%
Share−basedcompensationexpense (44.6) (33.5) (11.1) 33% (85.2) (67.1) (18.1) 27%
Share−based payroll taxexpense (1.9) (0.4) (1.5) 332% (3.4) (0.7) (2.7) 390%
Restructuring charges (0.3) (7.5) 7.2 (96)% (8.4) (11.7) 3.3 (29)%Acquisition−related
charges (0.5) — (0.5) N/M (0.5) — (0.5) N/M
Total operatingincome 185.0 95.7 89.3 93% 345.3 176.9 168.4 95%
Interest and other income,net 0.8 2.9 (2.1) (71)% 2.3 4.8 (2.5) (53)%
Gain (loss) on equityinvestments 3.2 (1.6) 4.8 300% 3.2 (3.3) 6.5 198%
Income before incometaxes andnoncontrollinginterest $ 189.0 $ 97.0 $ 92.0 95% $ 350.8 $ 178.4 $ 172.4 97%
The following table presents financial information for each segment as a percentage of total net revenues:
Three Months Ended Six Months EndedJune 30, June 30,
2010 2009 2010 2009Net Revenues:
Infrastructure:Product 60.3% 59.8% 60.6% 59.6%Service 13.3% 14.5% 13.3% 14.6%
Total Infrastructure revenues 73.6% 74.3% 73.9% 74.2%Service Layer Technologies:
Product 18.8% 17.4% 18.5% 17.5%Service 7.6% 8.3% 7.6% 8.3%
Total Service Layer Technologies revenues 26.4% 25.7% 26.1% 25.8%
Total net revenues 100.0% 100.0% 100.0% 100.0%Operating income:
Infrastructure 18.5% 15.3% 18.9% 15.0%Service Layer Technologies 5.4% 2.8% 4.7% 2.2%
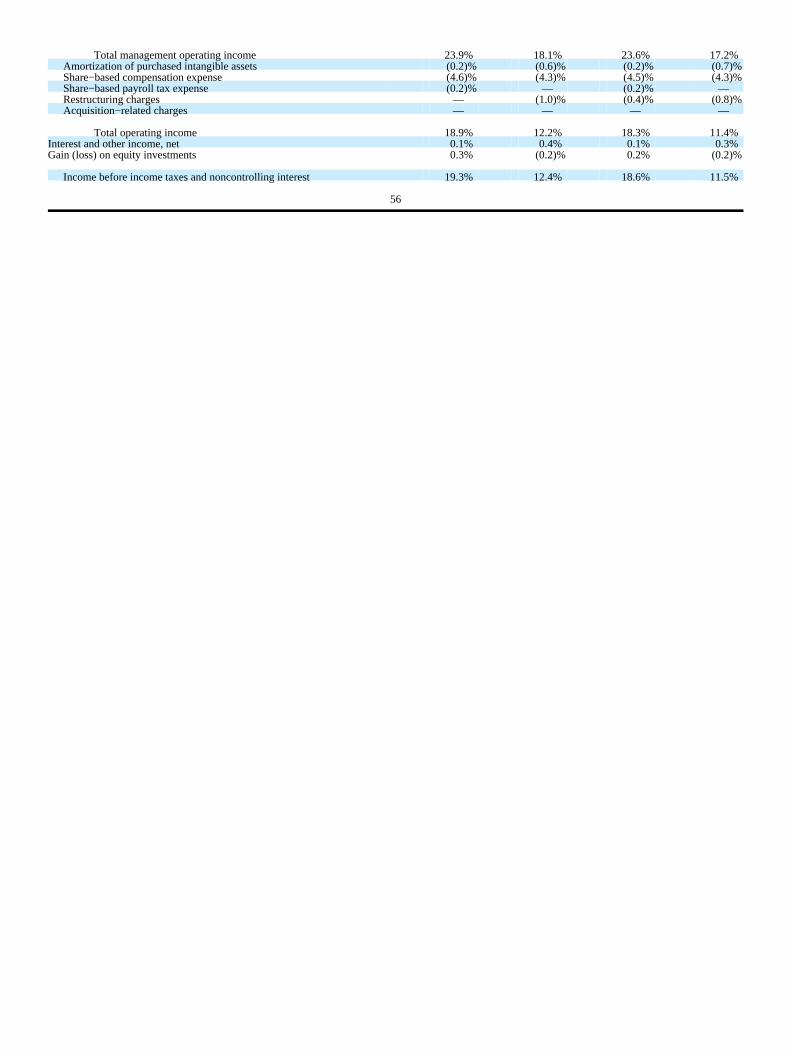
Total management operating income 23.9% 18.1% 23.6% 17.2%Amortization of purchased intangible assets (0.2)% (0.6)% (0.2)% (0.7)%Share−based compensation expense (4.6)% (4.3)% (4.5)% (4.3)%Share−based payroll tax expense (0.2)% — (0.2)% —Restructuring charges — (1.0)% (0.4)% (0.8)%Acquisition−related charges — — — —
Total operating income 18.9% 12.2% 18.3% 11.4%Interest and other income, net 0.1% 0.4% 0.1% 0.3%Gain (loss) on equity investments 0.3% (0.2)% 0.2% (0.2)%
Income before income taxes and noncontrolling interest 19.3% 12.4% 18.6% 11.5%
56
Table of Contents
Infrastructure SegmentAn analysis of the change in revenue for the Infrastructure segment, and the change in units, can be found above in the section titled “Net Revenues.”Infrastructure product gross margin and gross margin percentage increased in the three and six months ended June 30, 2010, compared to the same periodsin 2009, primarily due to our continued efforts to manage costs and a change in product mix that favored higher margin products.Infrastructure segment operating income and operating margin increased in the three and six months ended June 30, 2010, compared to the same periods in2009, primarily due to revenue growth discussed above in the section titled “Net Revenues” outpacing our expenses. We allocate sales and marketing,G&A, and facility and IT expenses to the Infrastructure segment generally based upon revenue, usage, and headcount. In the three and six months endedJune 30, 2010, R&D expense increased in absolute dollars as we continued our R&D investment efforts to develop innovative products and expand ourInfrastructure product portfolio. However, R&D expense decreased as a percentage of Infrastructure net revenues in the three months ended June 30, 2010,as our revenue growth outpaced our expenses for the period. R&D increased as a percentage of Infrastructure net revenues in the six months ended June 30,2010, due to greater investments in R&D in the first two quarters of 2010, compared to 2009 . Our sales and marketing expenses increased in absolutedollars and as a percentage of Infrastructure net revenues in the three and six months ended June 30, 2010, compared to the same periods in 2009, as weamplified our efforts to reach enterprise and service provider customers.SLT SegmentAn analysis of the change in revenue for the SLT segment, and the change in units, can be found above in the section titled “Net Revenues.”SLT product gross margin and gross margin percentage increased in the three and six months ended June 30, 2010, compared to the same periods in 2009,primarily due to a product mix that favored higher margin products and our cost cutting initiatives.SLT segment operating income and operating margin increased in the three and six months ended June 30, 2010, compared to the same periods in 2009,primarily due to revenue growth discussed above in the section titled “Net Revenues” outpacing our expenses. We allocate sales and marketing, G&A, aswell as facility and IT expenses to the SLT segment generally based on revenue, usage, and headcount. R&D related costs increased in absolute dollars inthe three and six months ended June 30, 2010, compared to the same periods in 2009, primarily due to our continued efforts to expand our product featuresand functionality based upon the trends in the marketplace. Additionally, sales and marketing expenses increased in absolute dollars in the three and sixmonths ended June 30, 2010, compared to the same periods in 2009, as we increased our efforts to reach enterprise and service provider customers. In thethree and six months ended June 30, 2010, compared to the same periods in 2009, R&D expense and sales and marketing expense each decreased as apercentage of SLT net revenues primarily due to the increase in net revenues and our continued efforts to manage costs.Amortization of Purchased Intangible Assets, Share−Based Compensation and Related Payroll Tax Expense, Restructuring Charges, Net Interest andOther Income, and Gain (Loss) on Equity Investment.See “Operating Expenses” and “Net Interest and Other Income, Gain (Loss) on Equity Investment, and Income Tax Provision” sections above for furtherdiscussion.
57
Table of Contents
Key Performance MeasuresIn addition to the financial metrics included in the condensed consolidated financial statements, we use the following key performance measures to assessquarterly operating results:
Three Months Ended June 30,2010 2009
Days sales outstanding (“DSO”) (a) 36 49Book−to−bill ratio(b) >1 >1
(a) We calculate DSO at the end of the applicable quarter based onthe ratio of ending accounts receivable, net of allowances,divided by average daily net sales for the preceding 90 days.DSO decreased in the second quarter of 2010, compared to thesecond quarter of 2009, primarily due to year−over−year growthin total net revenues.
(b) Book−to−bill ratio represents the ratio of product orders bookeddivided by product revenues during the period.
Liquidity and Capital ResourcesThe following sections discuss the effects of changes in our consolidated balance sheet and cash flows, contractual obligations, and our stock repurchaseprogram on our liquidity and capital resources.OverviewHistorically, we have funded our business primarily through our operating activities and the issuance of our common stock. The following table shows ourcapital resources (in millions, except percentages):
June 30, December 31,2010 2009 $ Change % Change
Working capital $ 1,678.3 $ 1,503.2 $ 175.1 12%
Cash and cash equivalents $ 1,660.1 $ 1,604.7 $ 55.4 3%Short−term investments 563.3 570.5 (7.2) (1)%Long−term investments 512.8 483.5 29.3 6%
Total cash, cash equivalents and investments $ 2,736.2 $ 2,658.7 $ 77.5 3%
The significant components of our working capital are cash and cash equivalents, short−term investments, and accounts receivable, reduced by accountspayable, income tax payable, accrued liabilities, and short−term deferred revenue. Working capital increased by $175.1 million in the six months endedJune 30, 2010, primarily due to an increase in cash and cash equivalents, and a decrease in other accrued liabilities. The increase in cash and cashequivalents was primarily due to cash generated from operations. An analysis of the increase in cash and cash equivalents can be found below in the sectiontitled “Summary of Cash Flows.” The decrease in other accrued liabilities was mainly due to the reduction of liability as a result of the payout of thelitigation settlement in the first quarter of 2010.Stock Repurchase ActivitiesIn February 2010, our Board approved an additional stock repurchase program (the “2010 Stock Repurchase Program”), which authorized us to repurchaseof up to $1.0 billion of our common stock. This new authorization is in addition to the stock repurchase program approved by the Board in March 2008 (the“2008 Stock Repurchase Program”), which also enabled us to repurchase up to $1.0 billion of our common stock.Under the 2008 Stock Repurchase Program, we repurchased approximately 6.5 million shares of our common stock at an average price of $27.33 per sharefor an aggregate purchase price of $177.4 million during the three months ended June 30, 2010, and approximately 9.2 million shares of our common stockat an average price of $27.24 per share for an aggregate purchase price of $251.8 million during the six months ended June 30, 2010. As of June 30, 2010,these stock repurchase programs had remaining aggregate authorized funds of $1,066.8 million.All shares of common stock purchased under our stock repurchase programs have been retired. Future share repurchases under our stock repurchaseprograms will be subject to a review of the circumstances at that time and
58
Table of Contents
will be made from time to time in private transactions or open market purchases as permitted by securities laws and other legal requirements. Theseprograms may be discontinued at any time.Summary of Cash FlowsIn the six months ended June, 2010, cash and cash equivalents increased by $55.4 million. This increase was the result of cash generated by operations of$309.9 million, partially offset by cash used in our investing and financing activities of $181.8 million and $72.7 million, respectively.Operating ActivitiesWe generated cash from operating activities of $309.9 million in the six months ended June 30, 2010, compared to $312.5 million in the same period of2009. The decrease of $2.7 million in the 2010 period compared to a year ago was chiefly due to payment of the litigation settlement in the first quarter of2010, and higher cash disbursements to suppliers and employees during the six months ended June 30, 2010, partially offset by higher net income. Inaddition, income taxes paid during the six months ended June 30, 2010 was higher compared to the same period in 2009.Investing ActivitiesFor the six months ended June 30, 2010, net cash used by investing activities was $181.8 million compared to $646.5 million in the six months endedJune 30, 2009. The change was primarily due to $21.4 million of cash used for investment purchases, net of sales and maturities of investments in the sixmonths ended 2010 as compared to $564.6 million of investment purchases, net of sales and maturities, for the same period a year ago. Additionally, inApril 2010, we paid $64.2 million, net of cash acquired, for Ankeena Networks.Financing ActivitiesNet cash used in financing activities was $72.7 million for the six months ended June 30, 2010, compared to $131.0 million used in financing activitiesduring the same period in 2009. In the six months ended June 30, 2010, we generated cash proceeds of $176.7 million from common stock issued toemployees, compared to cash proceeds of $50.7 million for the same period a year ago. Additionally, the increase in financing activities was also due to thechange in excess tax benefits from share−based compensation, which resulted from the reversal of Xilinx court case ruling in March of 2010, which was infavor of the Company. These increases were offset by cash usage of $253.7 million to repurchase our common stock through our 2008 Stock RepurchaseProgram and, to a lesser extent, from our employees in connection with net issuance of shares to satisfy our tax withholding obligations for vesting ofcertain RSU and performance share awards, as compared to $169.4 million in the same period in 2009. The significant increase in funds from the commonstock issuances, which mostly related to employee stock option exercises, was driven primarily by a higher average stock price in the first half of 2010compared to the same period a year ago.Deferred RevenueThe following table summarizes our deferred product and service revenues (in millions):
As ofJune 30, March 31, December 31,
2010 2010 2009Deferred product revenue:
Undelivered product commitments and other product deferrals $ 273.6 $ 271.8 $ 254.7Distributor inventory and other sell−through items 113.5 130.8 136.6
Deferred gross product revenue 387.1 402.6 391.3Deferred cost of product revenue (150.1) (152.5) (150.0)
Deferred product revenue, net 237.0 250.1 241.3Deferred service revenue 530.8 539.8 512.3
Total $ 767.8 $ 789.9 $ 753.6
59
Table of Contents
Deferred gross product revenue decreased $4.2 million compared to December 31, 2009, and decreased $15.5 million compared to March 31, 2010,primarily due to a decrease in distributor inventory and other sell−through related deferrals. Total deferred service revenue increased $18.5 millioncompared to December 31, 2009, largely due to higher multi−year service billings occuring in the first quarter of 2010.Off−Balance Sheet ArrangementsWe had no off−balance sheet arrangements as of June 30, 2010.Contractual ObligationsOur principal commitments primarily consist of obligations outstanding under operating leases, purchase commitments, tax liabilities, and other contractualobligations.Our contractual obligations under operating leases primarily relate to our leased facilities under our non−cancelable operating leases. Rent payments areallocated to costs and operating expenses in our condensed consolidated statements of operations. We occupy approximately 2.1 million square feetworldwide under operating leases. The majority of our office space is in North America, including our corporate headquarters in Sunnyvale, California. Ourlongest lease expires in November 2022. As of June 30, 2010, future minimum payments under our non−cancelable operating leases, net of committedsublease income, were $293.1 million, of which $26.4 million will be paid over the remaining six months of 2010.In order to reduce manufacturing lead times and ensure adequate component supply, contract manufacturers utilized by us place non−cancelable,non−returnable (“NCNR”) orders for components based on our build forecasts. As of June 30, 2010, there were NCNR component orders placed by thecontract manufacturers with a value of $147.1 million. The contract manufacturers use the components to build products based on our forecasts and onpurchase orders that we have received from customers. Generally, we do not own the components, and title to the products transfers from the contractmanufacturers to us and immediately to our customers upon delivery at a designated shipment location. If the components remain unused or the productsremain unsold for specified period, we may incur carrying charges or obsolete materials charges for components that the contract manufacturers purchasedto build products to meet our forecast or customer orders. As of June 30, 2010, we had accrued $22.0 million based on our estimate of such charges.As of June 30, 2010, we had $98.9 million in current and long−term liabilities in the condensed consolidated balance sheet for unrecognized tax positions.At this time, we are unable to make a reasonably reliable estimate of the timing of payments related to the additional $98.9 million in liabilities due touncertainties in the timing of tax audit outcomes.As of June 30, 2010, other contractual obligations primarily consisted of indemnity and service related escrows of $19.3 million, $15.4 million remainingbalance for a data center hosting agreement that requires payments through the end of April 2013, $12.1 million for license and service agreements, and$7.7 million under a software subscription agreement that requires payments through the end of January 2011.Liquidity and Capital Resource RequirementsLiquidity and capital resources may be impacted by our operating activities as well as acquisitions and investments in strategic relationships that we havemade or we may make in the future. Additionally, if we were to repurchase additional shares of our common stock under our stock repurchase programs,our liquidity may be impacted. As of June 30, 2010, we have over 50% of our cash and investment balances held outside of the U.S., which may be subjectto U.S. taxes if repatriated.In July 2010, we announced our intent to file a new $1.5 billion shelf registration with the SEC. The filing will replace our prior $1.0 billion shelfregistration which has expired. While we do not have any immediate plans to offer securities under this
60
Table of Contents
shelf registration, it is intended to give us flexibility to take advantage of financing opportunities as needed or deemed desirable in light of marketconditions. Any offerings of securities will be made pursuant to a prospectus.We have been focused on managing our annual equity usage as a percentage of the common stock outstanding to align with peer group competitive levelsand have made changes in recent years to reduce the number of shares underlying the equity awards we grant. Our intention for fiscal years 2010 and 2011is to target the number of shares underlying equity awards granted on an annual basis at approximately three percent (3%) of our common stock outstanding.Based upon shares underlying our grants to date of options, RSUs and performance shares (counting only the on−target measure of such performance shareawards), we believe we are on track with respect to this goal for 2010.Based on past performance and current expectations, we believe that our existing cash and cash equivalents, short−term, and long−term investments,together with cash generated from operations as well as cash generated from the exercise of employee stock options and purchases under our employeestock purchase plan will be sufficient to fund our operations and anticipated growth for at least the next 12 months. We believe our working capital issufficient to meet our liquidity requirements for capital expenditures, commitments, and other liquidity requirements associated with our existing operationsduring the same period. However, our future liquidity and capital requirements may vary materially from those now planned depending on many factors,including:• the overall levels of sales of our products, the mix of product sales, and gross profit margins;
• our business, product, capital expenditures, and R&D plans;
• repurchases of our common stock;
• incurrence and repayment of debt;
• litigation expenses, settlements, and judgments, or similar items related to resolution of tax audits;
• volume price discounts and customer rebates;
• the levels of accounts receivable that we maintain;
• acquisitions and/or funding of other businesses, assets, products, or technologies;
• changes in our compensation policies;
• capital improvements for new and existing facilities;
• technological advances;
• our competitors’ responses to our products and/or pricing;
• our relationships with suppliers, partners, and customers;
• possible future investments in raw material and finished goods inventories;
• expenses related to future restructuring plans, if any;
• tax expense associated with share−based awards;
• issuance of share−based awards and the related payment in cash for withholding taxes in the current year and possibly during future years;
• the level of exercises of stock options and stock purchases under our equity incentive plans; and
• general economic conditions and specific conditions in our industry and markets, including the effects of disruptions in global credit and financialmarkets, international conflicts, and related uncertainties.
Factors That May Affect Future ResultsA description of the risk factors associated with our business is included under “Risk Factors” in Item 1A of Part II of this report.
61
Table of Contents
Item 3. Quantitative and Qualitative Disclosures About Market RiskInterest Rate RiskWe maintain an investment portfolio of various holdings, types, and maturities. The values of our investments are subject to market price volatility. Inaddition, as of June 30, 2010, over 50% of our cash and marketable securities were held in non−U.S. domiciled countries. Our marketable securities aregenerally classified as available−for−sale and, consequently, are recorded on our condensed consolidated balance sheet at fair value with unrealized gains orlosses reported as a separate component of accumulated other comprehensive income (loss).At any time, a rise in interest rates could have a material adverse impact on the fair value of our investment portfolio. Conversely, declines in interest ratescould have a material impact on interest income from our investment portfolio. We do not currently hedge these interest rate exposures. We recognizedimmaterial gains and losses during the three and six months ended June 30, 2010, and 2009, related to the sales of our investments.Foreign Currency Risk and Foreign Exchange Forward ContractsPeriodically, we use derivatives to hedge against fluctuations in foreign exchange rates. We do not enter into derivatives for speculative or trading purposes.We use foreign currency forward contracts to mitigate variability in gains and losses generated from the re−measurement of certain monetary assets andliabilities denominated in non−functional currencies. These derivatives are carried at fair value with changes recorded in other income and expense, net, inthe same period as the changes in the fair value from the re−measurement of the underlying assets and liabilities. These foreign exchange contracts havematurities between one and two months.Our sales and costs of revenues are primarily denominated in U.S. dollars. Our cost of service revenue and operating expenses are denominated in U.S.dollars as well as other foreign currencies including the British Pound, the Euro, Indian Rupee, and Japanese Yen. Periodically, we use foreign currencyforward and/or option contracts to hedge certain forecasted foreign currency transactions relating to cost of service revenue and operating expenses. Thesederivatives are designated as cash flow hedges and have maturities of less than one year. The effective portion of the derivative’s gain or loss is initiallyreported as a component of accumulated other comprehensive income (loss) and, upon occurrence of the forecasted transaction, is subsequently reclassifiedinto the line item in the condensed consolidated statements of operations to which the hedged transaction relates. We record the ineffectiveness of thehedging instruments, which was immaterial during the three and six months ended June 30, 2010, and 2009, in other income and expense, net, on ourcondensed consolidated statements of operations. The change in operating expenses, including cost of service revenue, R&D, sales and marketing, andG&A expenses, due to foreign currency fluctuations was approximately 1% in each of the three and six months ended June 30, 2010, respectively, and 4%in each of the three and six month periods ended June 30, 2009, respectively.
62
Table of Contents
Equity Price RiskOur portfolio of publicly−traded equity securities is inherently exposed to equity price risk as the stock market fluctuates. We monitor our publicly−tradedequity investments for impairment on a periodic basis. In the event that the carrying value of a publicly−traded equity investment exceeds its fair value, andwe determine the decline in the value to be other than temporary, we reduce the carrying value to its current fair value. We do not purchase ourpublicly−traded equity securities with the intent to use them for trading or speculative purposes. They are classified as available−for−sale securities in ourcondensed consolidated balance sheets. The aggregate fair value of our marketable equity securities was $4.1 million and $5.4 million as of June 30, 2010,and December 31, 2009, respectively. Additionally, our non−qualified deferred compensation (“NQDC”) plan may also hold publicly−traded securities.Investments under the NQDC plan are considered trading securities and are reported at fair value on our condensed consolidated balance sheets. As ofJune 30, 2010, and December 31, 2009, the total investment under the NQDC plan was $6.0 million and $4.7 million, respectively. A hypothetical 30%adverse change in the stock prices of our portfolio of publicly−traded equity securities would result in an immaterial loss.In addition to publicly−traded equity securities, we have also invested in privately−held companies. These investments are carried at cost. The aggregatecost of our investments in privately−held companies was $17.1 million and $13.9 million as of June 30, 2010, and December 31, 2009, respectively.Item 4. Controls and ProceduresEvaluation of Disclosure Controls and ProceduresAttached, as exhibits to this report are certifications of our principal executive officer and principal financial officer, which are required in accordance withRule 13a−14 of the Securities Exchange Act of 1934, as amended (the “Exchange Act”). This “Controls and Procedures” section includes informationconcerning the controls and related evaluations referred to in the certifications and it should be read in conjunction with the certifications for a morecomplete understanding of the topics presented.We carried out an evaluation, under the supervision and with the participation of our management, including our principal executive officer and principalfinancial officer, of the effectiveness of the design and operation of our disclosure controls and procedures, as defined in Rules 13a−15(e) and 15d−15(e)under the Exchange Act. Based upon that evaluation, our principal executive officer and principal financial officer concluded that, as of the end of theperiod covered in this report, our disclosure controls and procedures were effective to ensure that information required to be disclosed by us in reports thatwe file or submit under the Exchange Act is recorded, processed, summarized, and reported within the time periods specified in Securities and ExchangeCommission rules and forms and is accumulated and communicated to our management, including our principal executive officer and principal financialofficer, as appropriate to allow timely decisions regarding required disclosure.Changes in Internal ControlsWe have initiated a multi−year implementation to upgrade certain key internal systems and processes, including our company−wide human resourcesmanagement system, customer relationship management (“CRM”) system, and our enterprise resource planning (“ERP”) system. This project is the result ofour normal business process to evaluate and upgrade or replace our systems software and related business processes to support our evolving operationalneeds. There were no changes in our internal control over financial reporting that occurred during the second quarter of 2010 that have materially affected,or are reasonably likely to materially affect, our internal control over financial reporting.
63
Table of Contents
Inherent Limitations on Effectiveness of ControlsOur management, including the Chief Executive Officer (“CEO”) and Chief Financial Officer (“CFO”), does not expect that our disclosure controls or ourinternal control over financial reporting will prevent or detect all error and all fraud. A control system, no matter how well designed and operated, canprovide only reasonable, not absolute, assurance that the control system’s objectives will be met. Our controls and procedures are designed to providereasonable assurance that our control system’s objective will be met and our CEO and CFO have concluded that our disclosure controls and procedures areeffective at the reasonable assurance level. The design of a control system must reflect the fact that there are resource constraints, and the benefits ofcontrols must be considered relative to their costs. Further, because of the inherent limitations in all control systems, no evaluation of controls can provideabsolute assurance that misstatements due to error or fraud will not occur or that all control issues and instances of fraud, if any, within the Company havebeen detected. These inherent limitations include the realities that judgments in decision−making can be faulty and that breakdowns can occur because ofsimple error or mistake. Controls can also be circumvented by the individual acts of some persons, by collusion of two or more people, or by managementoverride of the controls. The design of any system of controls is based in part on certain assumptions about the likelihood of future events. Projections ofany evaluation of controls effectiveness to future periods are subject to risks. Over time, controls may become inadequate because of changes in conditionsor deterioration in the degree of compliance with policies or procedures.PART II — OTHER INFORMATIONItem 1. Legal ProceedingsThe information set forth under “Legal Proceedings” section in Note 15 – Commitments and Contingencies in the Notes to Condensed ConsolidatedFinancial Statements in Item 1 Part I of this Quarterly Report on Form 10−Q, is incorporated herein by reference.Item 1A. Risk FactorsFactors That May Affect Future ResultsInvestments in equity securities of publicly−traded companies involve significant risks. The market price of our stock has historically reflected a highermultiple of expected future earnings than many other companies. Accordingly, even small changes in investor expectations for our future growth andearnings, whether as a result of actual or rumored financial or operating results, changes in the mix of the products and services sold, acquisitions, industrychanges or other factors, could trigger, and have triggered in the past, significant fluctuations in the market price of our common stock. Investors in oursecurities should carefully consider all of the relevant factors, including, but not limited to, the following factors, that could affect our stock price.Our quarterly results are inherently unpredictable and subject to substantial fluctuations, and, as a result, we may fail to meet the expectations ofsecurities analysts and investors, which could adversely affect the trading price of our common stock.Our revenues and operating results may vary significantly from quarter−to−quarter due to a number of factors, many of which are outside of our control andany of which may cause our stock price to fluctuate.The factors that may affect the unpredictability of our quarterly results include, but are not limited to: limited visibility into customer spending plans,changes in the mix of products and services sold, changes in geographies in which our products and services are sold, changing market conditions, includingcurrent and potential customer consolidation, competition, customer concentration, long sales and implementation cycles, regional economic and politicalconditions, and seasonality. For example, many companies in our industry experience adverse seasonal fluctuations in customer spending patterns,particularly in the first and third quarters.As a result of these risk factors, we believe that quarter−to−quarter comparisons of operating results are not necessarily a good indication of what our futureperformance will be. It is likely that in some future quarters, our
64
Table of Contents
operating results may be below the expectations of securities analysts or investors, in which case the price of our common stock may decline. Such a declinecould occur, and has occurred in the past, even when we have met our publicly stated revenues and/or earnings guidance.Fluctuating economic conditions make it difficult to predict revenues for a particular period and a shortfall in revenues or increase in costs ofproduction may harm our operating results.Our revenues depend significantly on general economic conditions and the demand for products in the markets in which we compete. Economic weakness,customer financial difficulties, and constrained spending on network expansion have recently resulted, and may in the future result, in decreased revenuesand earnings and could negatively impact our ability to forecast sales and operating results and our ability to forecast and manage our contract manufacturerrelationships. In addition, the recent recession and economic weakness, particularly in the United States and Europe, as well as turmoil in the geopoliticalenvironment in many parts of the world, may continue to put pressure on global economic conditions, which could lead to reduced demand for our productsand/or higher costs of production. Economic weakness may also lead to longer collection cycles for payments due from our customers, an increase incustomer bad debt, restructuring initiatives and associated expenses, and impairment of investments. Furthermore, the continued weakness and uncertaintyin worldwide credit markets may adversely impact the ability of our customers to adequately fund their expected capital expenditures, which could lead todelays or cancellations of planned purchases of our products or services. In addition, our operating expenses are largely based on anticipated revenue trendsand a high percentage of our expenses is, and will continue to be, fixed in the short−term.Uncertainty about future economic conditions makes it difficult to forecast operating results and to make decisions about future investments. Future orcontinued economic weakness, failure of our customers and markets to recover from such weakness, customer financial difficulties, increases in costs ofproduction, and reductions in spending on network maintenance and expansion could have a material adverse effect on demand for our products andconsequently on our business, financial condition, and results of operations.A limited number of our customers comprise a significant portion of our revenues and any decrease in revenues from these customers could have anadverse effect on our net revenues and operating results.A substantial majority of our net revenues depend on sales to a limited number of customers and distribution partners. For example, Verizon accounted forgreater than 10% of our net revenues for the six months ended June 30, 2010. This customer concentration increases the risk of quarterly fluctuations in ourrevenues and operating results. Changes in the business requirements, vendor selection, financial prospects, capital resources, or purchasing behavior of ourkey customers or potential new customers could significantly decrease sales to such customers or could lead to delays or cancellations of planned purchasesof our products or services. Any of these factors could adversely affect our business, financial condition, and results of operations.In addition, in recent years, there has been consolidation in the telecommunications industry (for example, the acquisitions of AT&T, Inc., MCI, Inc., andBellSouth Corporation) and consolidation among the large vendors of telecommunications equipment and services (for example, the acquisition of Redbackby Ericsson, the joint venture of NSN, and the acquisition of Foundry Networks by Brocade). Such consolidation may cause our customers who areinvolved in these transactions to suspend or indefinitely reduce their purchases of our products or have other unforeseen consequences that could harm ourbusiness, financial condition, and results of operations.If we receive Infrastructure product orders late in a quarter, we may be unable to recognize revenue for these orders in the same period, which couldadversely affect our quarterly revenues.Generally, our Infrastructure products are not stocked by distributors or resellers due to their cost and complexity and configurations required by ourcustomers, and we generally build such products as orders are received. If orders for these products are received late in any quarter, we may not be able tobuild, ship, and recognize revenue for these orders in the same period, which could adversely affect our ability to meet our expected revenues for suchquarter.
65
Table of Contents
The long sales and implementation cycles for our products, as well as our expectation that some customers will sporadically place large orders withshort lead times, may cause our revenues and operating results to vary significantly from quarter−to−quarter.A customer’s decision to purchase certain of our products involves a significant commitment of its resources and a lengthy evaluation and productqualification process. As a result, the sales cycle may be lengthy. In particular, customers making critical decisions regarding the design and implementationof large network deployments may engage in very lengthy procurement processes that may delay or impact expected future orders. Throughout the salescycle, we may spend considerable time educating and providing information to prospective customers regarding the use and benefits of our products. Evenafter making the decision to purchase, customers may deploy our products slowly and deliberately. Timing of deployment can vary widely and depends onthe skill set of the customer, the size of the network deployment, the complexity of the customer’s network environment, and the degree of hardware andoperating system configuration necessary to deploy the products. Customers with large networks usually expand their networks in large increments on aperiodic basis. Accordingly, we may receive purchase orders for significant dollar amounts on an irregular basis. These long cycles, as well as ourexpectation that customers will tend to sporadically place large orders with short lead times, may cause revenues and operating results to vary significantlyand unexpectedly from quarter−to−quarter.We face intense competition that could reduce our revenues and adversely affect our financial results.Competition is intense in the markets that we address. The infrastructure market has historically been dominated by Cisco with other companies such asAlcatel−Lucent, Brocade, Ericsson, Extreme Networks, Hewlett Packard Company, and Huawei providing products to a smaller segment of the market. Inaddition, a number of other small public and private companies have products or have announced plans for new products to address the same challenges andmarkets that our products address.In the SLT market, we face intense competition from a broader group of companies such as CheckPoint, Cisco, Fortinet, F5 Networks, and Riverbed. Inaddition, a number of other small public and private companies have products or have announced plans for new products to address the same challenges andmarkets that our products address.In addition, actual or speculated consolidation among competitors, or the acquisition of our partners and/or resellers by competitors, can increase thecompetitive pressures faced by us. In this regard, Ericsson acquired Redback in 2007, and Brocade acquired Foundry Networks in 2009. A number of ourcompetitors have substantially greater resources and can offer a wider range of products and services for the overall network equipment market than we do.If we are unable to compete successfully against existing and future competitors on the basis of product offerings or price, we could experience a loss inmarket share and revenues and/or be required to reduce prices, which could reduce our gross margins, and which could materially and adversely affect ourbusiness, financial condition, and results of operations.We rely on value−added resellers, distribution, and original equipment manufacturer partners to sell our products, and disruptions to, or our failure toeffectively develop and manage our distribution channel and the processes and procedures that support it could adversely affect our ability to generaterevenues from the sale of our products.Our future success is highly dependent upon establishing and maintaining successful relationships with a variety of value−added reseller and distributionpartners, including our worldwide strategic partners such as Ericsson, IBM, and NSN. The majority of our revenues are derived through value−addedresellers and distributors, most of which also sell competitors’ products. Our revenues depend in part on the performance of these partners. The loss of orreduction in sales to our value−added resellers or distributors could materially reduce our revenues. For example, in 2006, one of our largest resellers,Lucent, merged with Alcatel, a competitor of ours. As a result of becoming a competitor, their resale of our products declined subsequent to the merger, andwe ultimately terminated our reseller agreement. Our competitors may in some cases be effective in providing incentives to current or potential resellers anddistributors to favor their products or to prevent or reduce sales of our products. If we fail to develop and maintain relationships with our partners, fail todevelop new relationships with value−added resellers and distributors
66
Table of Contents
in new markets, or expand the number of distributors and resellers in existing markets, fail to manage, train or motivate existing value−added resellers anddistributors effectively, or if these partners are not successful in their sales efforts, sales of our products may decrease, and our business, financial condition,and results of operations would suffer.In addition, we recognize a portion of our revenues based on a sell−through model using information provided by our distributors. If those distributorsprovide us with inaccurate or untimely information, the amount or timing of our revenues could be adversely impacted.Further, in order to develop and expand our distribution channel, we must continue to scale and improve our processes and procedures that support it, andthose processes and procedures may become increasingly complex and inherently difficult to manage. For example, we recently entered into an agreementto form a joint venture with NSN to develop and resell joint carrier Ethernet solutions and entered into OEM agreements with Dell and IBM where they willrebrand and resell our products as part of their product portfolios. These relationships are complex and require additional processes and procedures that maybe challenging and costly to implement, maintain and manage. Our failure to successfully manage and develop our distribution channel and the processesand procedures that support it could adversely affect our ability to generate revenues from the sale of our products.Our ability to process orders and ship products in a timely manner is dependent in part on our business systems and performance of the systems andprocesses of third parties such as our contract manufacturers, suppliers, or other partners, as well as interfaces with the systems of such third parties. Ifour systems, the systems and processes of those third parties, or the interfaces between them experience delays or fail, our business processes and ourability to build and ship products could be impacted, and our financial results could be harmed.Some of our business processes depend upon our IT systems, the systems and processes of third parties, and on interfaces with the systems of third parties.For example, our order entry system feeds information into the systems of our contract manufacturers, which enable them to build and ship our products. Ifthose systems fail or are interrupted, our processes may function at a diminished level or not at all. This could negatively impact our ability to ship productsor otherwise operate our business, and our financial results could be harmed. For example, although it did not adversely affect our shipments, an earthquakein late December of 2006 disrupted communications with China, where a significant part of our manufacturing occurs.We also rely upon the performance of the systems and processes of our contract manufacturers to build and ship our products. If those systems andprocesses experience interruption or delay, our ability to build and ship our products in a timely manner may be harmed. For example, as we have expandedour contract manufacturing base to China, we have experienced instances where our contract manufacturer was not able to ship products in the time periodsexpected by us. If we are not able to ship our products or if product shipments are delayed, our ability to recognize revenue in a timely manner for thoseproducts would be affected and our financial results could be harmed.Upgrades to key internal systems and processes, and problems with the design or implementation of these systems and processes could interfere with ourbusiness and operations.We previously initiated a multi−year project to upgrade certain key internal systems and processes, including our company−wide human resourcesmanagement system, our customer relationship management (“CRM”) system and enterprise resource planning (“ERP”) system. In the first quarter of 2010,we implemented a major upgrade of our CRM system. We have invested, and will continue to invest, significant capital and human resources in the designand implementation of these systems and processes, which may be disruptive to our underlying business. Any disruptions or delays in the design andimplementation of the new systems or processes, particularly any disruptions or delays that impact our operations, could adversely affect our ability toprocess customer orders, ship products, provide service and support to our customers, bill and track our customers, fulfill contractual obligations, record andtransfer information in a timely and accurate manner, file SEC reports in a timely manner, or otherwise run our business. Even if we do not encounter theseadverse effects, the design and implementation of these new systems and processes may be much more costly than we anticipated. If we are unable tosuccessfully design and implement these new systems and processes as planned, or if the implementation of these systems and processes is more costly thananticipated, our business, financial condition, and results of operations could be negatively impacted.
67
Table of Contents
Governmental regulations affecting the import or export of products or affecting products containing encryption capabilities could negatively affect ourrevenues.The United States and various foreign governments have imposed controls, export license requirements, and restrictions on the import or export of sometechnologies, especially encryption technology. In addition, from time to time, governmental agencies have proposed additional regulation of encryptiontechnology, such as requiring certification, notifications, review of source code, or the escrow and governmental recovery of private encryption keys. Forexample, Russia and China recently have implemented new requirements relating to products containing encryption and India has imposed special warrantyand other obligations associated with technology deemed critical. Governmental regulation of encryption technology and regulation of imports or exports, orour failure to obtain required import or export approval for our products, could harm our international and domestic sales and adversely affect our revenues.In addition, failure to comply with such regulations could result in penalties, costs, and restrictions on import or export privileges or adversely affect sales togovernment agencies or government funded projects.We expect gross margin to vary over time, and our recent level of product gross margin may not be sustainable.Our product gross margins will vary from quarter−to−quarter, and the recent level of gross margins may not be sustainable and may be adversely affected inthe future by numerous factors, including product mix shifts, increased price competition in one or more of the markets in which we compete, increases inmaterial or labor costs, excess product component or obsolescence charges from our contract manufacturers, increased costs due to changes in componentpricing or charges incurred due to component holding periods if our forecasts do not accurately anticipate product demand, warranty related issues, or ourintroduction of new products or entry into new markets with different pricing and cost structures.We are dependent on sole source and limited source suppliers for several key components, which makes us susceptible to shortages or price fluctuationsin our supply chain, and we may face increased challenges in supply chain management in the future.During periods of high demand for electronic products, component shortages are possible, and the predictability of the availability of such components maybe limited. In addition, during the recent economic downturn, many component suppliers reduced their workforces and production capacity and may not beable to increase production in the short run as rapidly as demand increases, resulting in increased delivery periods and component shortages. Any futuregrowth in our business and the economy is likely to create greater pressures on us and our suppliers to accurately project overall component demand and toestablish optimal component levels. If shortages or delays persist, the price of these components may increase, or the components may not be available atall. We may not be able to secure enough components at reasonable prices or of acceptable quality to build new products in a timely manner, and ourrevenues and gross margins could suffer until other sources can be developed. For example, from time to time, including the first quarter of 2008, we haveexperienced component shortages that resulted in delays of product shipments. We currently purchase numerous key components, including ASICs, fromsingle or limited sources. The development of alternate sources for those components is time−consuming, difficult, and costly. In addition, the lead timesassociated with certain components are lengthy and preclude rapid changes in quantities and delivery schedules. In the event of a component shortage orsupply interruption from these suppliers, we may not be able to develop alternate or second sources in a timely manner. If, as a result, we are unable to buythese components in quantities sufficient to meet our requirements on a timely basis, we will not be able to deliver product to our customers, which wouldseriously affect present and future sales, which would, in turn, adversely affect our business, financial condition, and results of operations.In addition, the development, licensing, or acquisition of new products in the future may increase the complexity of supply chain management. Failure toeffectively manage the supply of key components and products would adversely affect our business.
68
Table of Contents
If we do not successfully anticipate market needs and opportunities, and develop products and product enhancements that meet those needs andopportunities, or if those products are not made available in a timely manner or do not gain market acceptance, we may not be able to competeeffectively and our ability to generate revenues will suffer.We cannot guarantee that we will be able to anticipate future market needs and opportunities or be able to develop new products or product enhancements tomeet such needs or opportunities in a timely manner or at all. If we fail to anticipate market requirements or fail to develop and introduce new products orproduct enhancements to meet those needs in a timely manner, such failure could substantially decrease or delay market acceptance and sales of our presentand future products, which would significantly harm our business, financial condition, and results of operations. Even if we are able to anticipate, develop,and commercially introduce new products and enhancements, there can be no assurance that new products or enhancements will achieve widespread marketacceptance.For example, in 2008, we announced new products designed to address the Ethernet switching market, a market in which we had not had a historicalpresence. In addition, in 2009, we announced plans to develop and introduce new data center products with our Project Stratus and mobility solutions withour Project Falcon. If these or other new products do not gain market acceptance at a sufficient rate of growth, our ability to meet future financial targetsmay be adversely affected. In addition, if we fail to achieve market acceptance deliver new or announced products to the market in a timely manner, it couldadversely affect the market acceptance of those products and harm our competitive position and our business and financial results.Changes in effective tax rates or adverse outcomes resulting from examination of our income or other tax returns could adversely affect our results.Our future effective tax rates could be subject to volatility or adversely affected by: earnings being lower than anticipated in countries where we have lowerstatutory rates and higher than anticipated earnings in countries where we have higher statutory rates; changes in the valuation of our deferred tax assets andliabilities; expiration of or lapses in the R&D tax credit laws; transfer pricing adjustments related to certain acquisitions including the license of acquiredintangibles under our intercompany R&D cost sharing arrangement; tax effects of share−based compensation; costs related to intercompany restructurings;or changes in tax laws, regulations, accounting principles, or interpretations thereof. In addition, we are subject to the continuous examination of our incometax returns by the Internal Revenue Service (“IRS”) and other tax authorities. We regularly assess the likelihood of adverse outcomes resulting from theseexaminations to determine the adequacy of our provision for income taxes. There can be no assurance that the outcomes from these continuousexaminations will not have an adverse effect on our business, financial condition, and results of operations.For example, in 2009, we received a proposed adjustment from the IRS claiming that we owe additional taxes, plus interest and possible penalties, for the2004 tax year based on a transfer pricing transaction related to the license of acquired intangibles under an intercompany R&D cost sharing arrangement. Asa result of the proposed adjustment, the incremental tax liability would be approximately $807 million excluding interest and penalties. We strongly believethe IRS’ position with regard to this matter is inconsistent with applicable tax laws and existing Treasury regulations, and that our previously reportedincome tax provision for the year in question is appropriate. However, there can be no assurance that this matter will be resolved in our favor. Regardless ofwhether this matter is resolved in our favor, the final resolution of this matter could be expensive and time−consuming to defend and/or settle. While webelieve we have provided adequately for this matter, there is a possibility that an adverse outcome of the matter could have a material effect on our results ofoperations and financial condition.
69
Table of Contents
Telecommunications companies and other large companies generally require more onerous terms and conditions of their vendors. As we seek to sellmore products to such customers, we may be required to agree to terms and conditions that could have an adverse effect on our business or ability torecognize revenues.Telecommunications service provider companies and other large companies, because of their size, generally have greater purchasing power and,accordingly, have requested and received more favorable terms, which often translate into more onerous terms and conditions for their vendors. As we seekto sell more products to this class of customer, we may be required to agree to such terms and conditions, which may include terms that affect the timing ofour ability to recognize revenue and have an adverse effect on our business, financial condition, and results of operations. Consolidation among such largecustomers can further increase their buying power and ability to require onerous terms.For example, many customers in this class have purchased products from other vendors who promised but failed to deliver certain functionality and/or hadproducts that caused problems or outages in the networks of these customers. As a result, this class of customers may request additional features from us andrequire substantial penalties for failure to deliver such features or may require substantial penalties for any network outages that may be caused by ourproducts. These additional requests and penalties, if we are required to agree to them, require us to defer revenue recognition from such sales, which maynegatively affect our business, financial condition, and results of operations.We adopted Accounting Standards Update (“ASU”) No. 2009−13 “Multiple−Deliverable Revenue Arrangements” (“ASU 2009−13”) and ASUNo. 2009−14, “Certain Revenue Arrangements That Include Software Elements” (“ASU 2009−14”) on a prospective basis as of the beginning of fiscal 2010for new and materially modified arrangements originating after December 31, 2009. Under these new rules, we allocate revenue to each element of amultiple element arrangement based on a selling price hierarchy. The selling price for a deliverable is based on its vendor−specific objective evidence(“VSOE”) if available, third party evidence (“TPE”) if VSOE is not available, or estimated selling price if neither VSOE nor TPE is available. We allocateeach separable element of an arrangement to the total arrangement consideration. While the new standards allow us to recognize revenue related to elementsthat have been delivered, we are required to defer revenue allocated to undelivered elements as of the balance sheet date.For multiple element arrangements entered into prior to the first quarter of 2010, our accounting policies require VSOE of selling price of the undeliveredelements to separate the components and to account for elements of the arrangement separately. However, customers may require terms and conditions thatmake it more difficult or impossible for us to maintain VSOE for the undelivered elements to a similar group of customers, the result of which could causeus to defer the entire arrangement fees for a similar group of customers (product, maintenance, professional services, etc.) and recognize revenue only whenthe last element is delivered, or if the only undelivered element is maintenance revenue, we would recognize revenue ratably over the contractualmaintenance period, which is generally one year, but could be substantially longer.If we fail to accurately predict our manufacturing requirements, we could incur additional costs or experience manufacturing delays, which wouldharm our business.We provide demand forecasts to our contract manufacturers and the manufacturers order components and plan capacity based on these forecasts. If weoverestimate our requirements, our contract manufacturers may assess charges, or we may have liabilities for excess inventory, each of which couldnegatively affect our gross margins. Conversely, because lead times for required materials and components vary significantly and depend on factors such asthe specific supplier, contract terms, and the demand for each component at a given time, if we underestimate our requirements, our contract manufacturersmay have inadequate time, materials, and/or components required to produce our products, which could increase costs or could delay or interruptmanufacturing of our products and result in delays in shipments and deferral or loss of revenues.
70
Table of Contents
We are dependent on contract manufacturers with whom we do not have long−term supply contracts, and changes to those relationships, expected orunexpected, may result in delays or disruptions that could cause us to lose revenues and damage our customer relationships.We depend on independent contract manufacturers (each of which is a third−party manufacturer for numerous companies) to manufacture our products.Although we have contracts with our contract manufacturers, those contracts do not require them to manufacture our products on a long−term basis in anyspecific quantity or at any specific price. In addition, it is time−consuming and costly to qualify and implement additional contract manufacturerrelationships. Therefore, if we fail to effectively manage our contract manufacturer relationships or if one or more of them experiences delays, disruptions,or quality control problems in our manufacturing operations, or if we had to change or add additional contract manufacturers or contract manufacturingsites, our ability to ship products to our customers could be delayed. Also, the addition of manufacturing locations or contract manufacturers would increasethe complexity of our supply chain management. Moreover, an increasing portion of our manufacturing is performed in China and other countries and istherefore subject to risks associated with doing business in other countries. Each of these factors could adversely affect our business, financial condition,and results of operations.Our ability to develop, market, and sell products could be harmed if we are unable to retain or hire key personnel.Our future success depends upon our ability to recruit and retain the services of executive, engineering, sales and marketing, and support personnel. Thesupply of highly qualified individuals, in particular engineers in very specialized technical areas, or sales people specializing in the service provider andenterprise markets, is limited and competition for such individuals is intense. None of our officers or key employees is bound by an employment agreementfor any specific term. The loss of the services of any of our key employees, the inability to attract or retain personnel in the future or delays in hiringrequired personnel, particularly engineers and sales people, and the complexity and time involved in replacing or training new employees, could delay thedevelopment and introduction of new products, and negatively impact our ability to market, sell, or support our products.We are a party to lawsuits, which are costly to defend and, if determined adversely to us, could require us to pay damages or prevent us from takingcertain actions, any or all of which could harm our business, financial condition, and results of operations.We and certain of our current and former officers and current and former members of our Board of Directors are subject to various lawsuits. For example,we are a party to a number of patent infringement and other lawsuits. In addition, we have been served with lawsuits related to certain matters related tosecurities, a description of which can be found in Note 15, Commitments and Contingencies, in Notes to Condensed Consolidated Financial Statements ofthis Quarterly Report on Form 10−Q, under the heading “Legal Proceedings.” There can be no assurance that these or any actions that have been or may bebrought against us will be resolved in our favor or that tentative settlements will become final. Regardless of whether they are resolved in our favor, theselawsuits are, and any future lawsuits to which we may become a party will likely be, expensive and time−consuming to defend, settle, and/or resolve. Suchcosts of defense, as well as any losses resulting from these claims or settlement of these claims, could significantly increase our expenses and could harmour business, financial condition, and results of operations.Litigation or claims regarding intellectual property rights may be time−consuming, expensive and require a significant amount of resources toprosecute, defend, or make our products non−infringing.Third parties have asserted and may in the future assert claims or initiate litigation related to patent, copyright, trademark, and other intellectual propertyrights to technologies and related standards that are relevant to our products. The asserted claims and/or initiated litigation may include claims against us orour manufacturers, suppliers, or customers, alleging infringement of their proprietary rights with respect to our products. Regardless of the merit of theseclaims, they have been and can be time−consuming, result in costly litigation, and may require us to develop non−infringing technologies or enter intolicense agreements. Furthermore, because of the potential for high awards of damages or injunctive relief that are not necessarily predictable, even arguablyunmeritorious claims may be settled for significant amounts of money. If any infringement or other intellectual property claim made against us by any thirdparty is successful, if we are required to settle litigation for significant amounts of money, or
71
Table of Contents
if we fail to develop non−infringing technology or license required proprietary rights on commercially reasonable terms and conditions, our business,financial condition, and results of operations could be materially and adversely affected.Integration of acquisitions could disrupt our business and harm our financial condition and stock price and may dilute the ownership of ourstockholders.We have made, and may continue to make, acquisitions in order to enhance our business. For example, in April 2010, we acquired Ankeena Networks, andin 2005, we completed the acquisitions of five other privately−held companies. Acquisitions involve numerous risks, including problems combining thepurchased operations, technologies or products, unanticipated costs, diversion of management’s attention from our core businesses, adverse effects onexisting business relationships with suppliers and customers, risks associated with entering markets in which we have no or limited prior experience, andpotential loss of key employees. There can be no assurance that we will be able to integrate successfully any businesses, products, technologies, orpersonnel that we might acquire. The integration of businesses that we may acquire is likely to be, a complex, time−consuming, and expensive process.Acquisitions may also require us to issue common stock or assume equity awards that dilute the ownership of our current stockholders, assume liabilities,record goodwill and amortizable intangible assets that will be subject to impairment testing on a regular basis and potential periodic impairment charges,incur amortization expenses related to certain intangible assets, and incur large and immediate write−offs and restructuring and other related expenses, all ofwhich could harm our financial condition and results of operations.In addition, if we fail in any acquisition integration efforts and are unable to efficiently operate as a combined organization utilizing common informationand communication systems, operating procedures, financial controls, and human resources practices, our business, financial condition, and results ofoperations may be adversely affected.Our success depends upon our ability to effectively plan and manage our resources and restructure our business through rapidly fluctuating economicand market conditions.Our ability to successfully offer our products and services in a rapidly evolving market requires an effective planning, forecasting, and management processto enable us to effectively scale and adjust our business in response to fluctuating market opportunities and conditions. In periods of market expansion, wehave increased investment in our business by, for example, increasing headcount and increasing our investment in R&D and other parts of our business aswe have in the first half of 2010. Conversely, during 2009, in response to downward trending industry and market conditions, we restructured our business,rebalanced our workforce, and reduced our real estate portfolio. Many of our expenses, such as real estate expenses, cannot be rapidly or easily adjustedbecause of fluctuations in our business or numbers of employees. Moreover, rapid changes in the size of our workforce could adversely affect the ability todevelop and deliver products and services as planned or impair our ability to realize our current or future business objectives.We sell our products to customers that use those products to build networks and IP infrastructure, and if the demand for network and IP systems doesnot continue to grow, then our business, financial condition, and results of operations could be adversely affected.A substantial portion of our business and revenues depends on the growth of secure IP infrastructure and on the deployment of our products by customersthat depend on the continued growth of IP services. As a result of changes in the economy and capital spending or the building of network capacity inexcess of demand, all of which have in the past particularly affected telecommunications service providers, spending on IP infrastructure can vary, whichcould have a material adverse effect on our business, financial condition, and results of operations. In addition, a number of our existing customers areevaluating the build−out of their next generation networks. During the decision−making period when the customers are determining the design of thosenetworks and the selection of the equipment they will use in those networks, such customers may greatly reduce or suspend their spending on secure IPinfrastructure. Such delays in purchases can make it more difficult to predict revenues from such customers, can cause fluctuations in the level of spendingby these customers and, even where our products are ultimately selected, can have a material adverse effect on our business, financial condition, and resultsof operations.
72
Table of Contents
A breach of network security could harm public perception of our security products, which could cause us to lose revenues.If an actual or perceived breach of network security occurs in our network or in the network of a customer of our security products, regardless of whetherthe breach is attributable to our products, the market perception of the effectiveness of our products could be harmed. This could cause us to lose current andpotential end−customers or cause us to lose current and potential value−added resellers and distributors. Because the techniques used by computer hackersto access or sabotage networks change frequently and generally are not recognized until launched against a target, we may be unable to anticipate thesetechniques.We are subject to risks arising from our international operations, which may adversely affect our business and results of operations.We derive a majority of our revenues from our international operations, and we plan to continue expanding our business in international markets in thefuture. We conduct significant sales and customer support operations directly and indirectly through our distributors and value−added resellers in countriesthroughout the world and depend on the operations of our contract manufacturers and suppliers that are located inside and outside of the United States. Inaddition, our R&D and our general and administrative operations are conducted in the United States as well as other countries.As a result of our international operations, we are affected by economic, regulatory, social, and political conditions in foreign countries, including changesin general IT spending, the imposition of government controls, changes or limitations in trade protection laws, other regulatory requirements, which mayaffect our ability to import or export our products from various countries, service provider and government spending patterns affected by politicalconsiderations, unfavorable changes in tax treaties or laws, natural disasters, epidemic disease, labor unrest, earnings expatriation restrictions,misappropriation of intellectual property, military actions, acts of terrorism, political and social unrest and difficulties in staffing and managing internationaloperations. In particular, in some countries, we may experience reduced intellectual property protection. Any or all of these factors could have a materialadverse impact on our business, financial condition, and results of operations.Moreover, local laws and customs in many countries differ significantly from those in the United States. In many foreign countries, particularly in thosewith developing economies, it is common for others to engage in business practices that are prohibited by our internal policies and procedures or UnitedStates regulations applicable to us. Although we implement policies and procedures designed to ensure compliance with these laws and policies, there canbe no assurance that none of our employees, contractors, and agents will take actions in violation of such policies and procedures. Violations of laws or keycontrol policies by our employees, contractors, or agents could result in financial reporting problems, fines, penalties, or prohibition on the importation orexportation of our products and could have a material adverse effect on our business.We are exposed to fluctuations in currency exchange rates, which could negatively affect our financial condition and results of operations.Because a majority of our business is conducted outside the United States, we face exposure to adverse movements in non−U.S. currency exchange rates.These exposures may change over time as business practices evolve and could have a material adverse impact on our financial condition and results ofoperations.The majority of our revenues and expenses are transacted in U.S. Dollars. We also have some transactions that are denominated in foreign currencies,primarily the British Pound, the Euro, Indian Rupee, and Japanese Yen related to our sales and service operations outside of the United States. An increasein the value of the U.S. Dollar could increase the real cost to our customers of our products in those markets outside the United States in which we sell inU.S. Dollars, and a weakened U.S. Dollar could increase the cost of local operating expenses and procurement of raw materials to the extent we mustpurchase components in foreign currencies.
73
Table of Contents
Currently, we hedge only those currency exposures associated with certain assets and liabilities denominated in nonfunctional currencies and periodicallywill hedge anticipated foreign currency cash flows. The hedging activities undertaken by us are intended to offset the impact of currency fluctuations oncertain nonfunctional currency assets and liabilities. However, no amount of hedging can be effective against all circumstances, including long−termdeclines in the value of the U.S. Dollar. If our attempts to hedge against these risks are not successful, or if long−term declines in the value of the U.S.Dollar persist, our financial condition and results of operations could be adversely impacted.If we fail to adequately evolve our financial and managerial control and reporting systems and processes, our ability to manage and grow our businesswill be negatively affected.Our ability to successfully offer our products and implement our business plan in a rapidly evolving market depends upon an effective planning andmanagement process. We will need to continue to improve our financial and managerial control and our reporting systems and procedures in order tomanage our business effectively in the future. If we fail to continue to implement improved systems and processes, our ability to manage our business,financial condition, and results of operations may be negatively affected.Regulation of the telecommunications industry could harm our operating results and future prospects.The telecommunications industry is highly regulated, and our business and financial condition could be adversely affected by changes in the regulationsrelating to the telecommunications industry. Currently, there are few laws or regulations that apply directly to access to or commerce on IP networks. Wecould be adversely affected by regulation of IP networks and commerce in any country where we operate. Moreover, regulations limiting the range ofservices and business models that can be offered by service providers or content providers could adversely affect those customers’ need for productsdesigned to enable a wide range of such services or business models. Such regulations could address matters such as voice over the Internet or using IP,encryption technology, and access charges for service providers. In addition, regulations have been adopted with respect to environmental matters, such asthe Waste Electrical and Electronic Equipment (“WEEE”) Directive, Restriction of Hazardous Substances (“RoHS”), and Registration, Evaluation,Authorization, and Restriction of Chemicals (“REACH”) regulations adopted by the European Union, as well as regulations prohibiting government entitiesfrom purchasing security products that do not meet specified local certification criteria. Similar regulations are in effect or under consideration in otherjurisdictions where we do business. Compliance with such regulations may be costly and time−consuming for us and our suppliers and partners. Theadoption and implementation of such regulations could decrease demand for our products, and at the same time could increase the cost of building andselling our products as well as impact our ability to ship products into affected areas and recognize revenue in a timely manner, which could have a materialadverse effect on our business, financial condition, and results of operations.Our products are highly technical and if they contain undetected errors, our business could be adversely affected, and we may need to defend lawsuitsor pay damages in connection with any alleged or actual failure of our products and services.Our products are highly technical and complex, are critical to the operation of many networks, and, in the case of our security products, provide and monitornetwork security and may protect valuable information. Our products have contained and may contain one or more undetected errors, defects, or securityvulnerabilities. Some errors in our products may only be discovered after a product has been installed and used by end−customers. Any errors, defects, orsecurity vulnerabilities discovered in our products after commercial release could result in loss of revenues or delay in revenue recognition, loss ofcustomers, loss of future business, and increased service and warranty cost, any of which could adversely affect our business, financial condition, and resultsof operations. In addition, in the event an error, defect, or vulnerability is attributable to a component supplied by a third−party vendor, we may not be ableto recover from the vendor all of the costs of remediation that we may incur. In addition, we could face claims for product liability, tort, or breach ofwarranty. Defending a lawsuit, regardless of its merit, is costly and may divert management’s attention. In addition, if our business liability insurancecoverage is inadequate, or future coverage is unavailable on acceptable terms or at all, our financial condition and results of operations could be harmed.
74
Table of Contents
If our products do not interoperate with our customers’ networks, installations will be delayed or cancelled and could harm our business.Our products are designed to interface with our customers’ existing networks, each of which have different specifications and utilize multiple protocolstandards and products from other vendors. Many of our customers’ networks contain multiple generations of products that have been added over time asthese networks have grown and evolved. Our products must interoperate with many or all of the products within these networks as well as future products inorder to meet our customers’ requirements. If we find errors in the existing software or defects in the hardware used in our customers’ networks, we mayneed to modify our software or hardware to fix or overcome these errors so that our products will interoperate and scale with the existing software andhardware, which could be costly and could negatively affect our business, financial condition, and results of operations. In addition, if our products do notinteroperate with those of our customers’ networks, demand for our products could be adversely affected or orders for our products could be cancelled. Thiscould hurt our operating results, damage our reputation, and seriously harm our business and prospects.Our products incorporate and rely upon licensed third−party technology, and if licenses of third−party technology do not continue to be available to usor become very expensive, our revenues and ability to develop and introduce new products could be adversely affected.We integrate licensed third−party technology into certain of our products. From time to time, we may be required to license additional technology from thirdparties to develop new products or product enhancements. Third−party licenses may not be available or continue to be available to us on commerciallyreasonable terms. Our inability to maintain or re−license any third−party licenses required in our products or our inability to obtain third−party licensesnecessary to develop new products and product enhancements, could require us to obtain substitute technology of lower quality or performance standards orat a greater cost, any of which could harm our business, financial condition, and results of operations.Matters related to the investigation into our historical stock option granting practices and the restatement of our financial statements have resulted inlitigation and regulatory proceedings, and may result in additional litigation or other possible government actions.Our historical stock option granting practices and the restatement of our consolidated financial statements have exposed us to risks such as litigation,regulatory proceedings, and government enforcement actions. For more information regarding our current litigation and related inquiries, please see Note15, Commitments and Contingencies, in Notes to Condensed Consolidated Financial Statements under the heading “Legal Proceedings” as well as the otherrisk factors related to litigation set forth in this section. We have provided the results of our internal review and independent investigation to the SEC andthe United States Attorney’s Office for the Northern District of California, and in that regard, we have responded to formal and informal requests fordocuments and additional information. In August 2007, we announced that we entered into a settlement agreement with the SEC in connection with ourhistorical stock option granting practices in which we consented to a permanent injunction against any future violations of the antifraud, reporting,books−and−records and internal control provisions of the federal securities laws. This settlement concluded the SEC’s formal investigation of the Companywith respect to this matter. In addition, while we believe that we have made appropriate judgments in determining the correct measurement dates for ourstock option grants, the SEC may disagree with the manner in which we accounted for and reported, or did not report, the corresponding financial impact.We are also subject to civil litigation related to the stock option matters. In February 2010, we entered into an agreement in principle to settle the classaction litigation claims related to our historical stock option granting practices. Under the proposed settlement, which is subject to the final approval of thecourt, the claims against us and our officers and directors will be dismissed with prejudice and released in exchange for a $169.0 million cash payment byus. No assurance can be given regarding the outcomes from litigation or other possible government actions. The resolution of these matters will betime−consuming, expensive, and may distract management from the conduct of our business and the related costs of defense, as well as any losses resultingfrom these claims or final settlement of these claims, could significantly increase our expenses and could harm our business, financial condition, and resultsof operations.
75
Table of Contents
Our financial condition and results of operations could suffer if there is an additional impairment of goodwill or other intangible assets with indefinitelives.We are required to test annually and review on an interim basis, our goodwill and intangible assets with indefinite lives, including the goodwill associatedwith past acquisitions and any future acquisitions, to determine if impairment has occurred. If such assets are deemed impaired, an impairment loss equal tothe amount by which the carrying amount exceeds the fair value of the assets would be recognized. This would result in incremental expenses for thatquarter, which would reduce any earnings or increase any loss for the period in which the impairment was determined to have occurred. For example, suchimpairment could occur if the market value of our common stock falls below certain levels for a sustained period, or if the portions of our business related tocompanies we have acquired fail to grow at expected rates or decline. In the second quarter of 2006, our impairment evaluation resulted in a reduction of$1,280.0 million to the carrying value of goodwill on our balance sheet for the SLT operating segment, primarily due to the decline in our marketcapitalization that occurred over a period of approximately nine months prior to the impairment review and, to a lesser extent, a decrease in the forecastedfuture cash flows used in the income approach. Recently, economic weakness contributed to extreme price and volume fluctuations in global stock marketsthat reduced the market price of many technology company stocks, including ours. Future declines in our stock price, as well as any marked decline in ourlevel of revenues or gross margins, increase the risk that goodwill and intangible assets may become impaired in future periods. We cannot accuratelypredict the amount and timing of any impairment of assets.While we believe that we currently have adequate internal control over financial reporting, we are exposed to risks from legislation requiring companiesto evaluate those internal controls.Section 404 of the Sarbanes−Oxley Act of 2002 requires our management to report on, and our independent auditors to attest to, the effectiveness of ourinternal control over financial reporting. We have an ongoing program to perform the system and process evaluation and testing necessary to comply withthese requirements. We have and will continue to incur significant expenses and devote management resources to Section 404 compliance on an ongoingbasis. In the event that our CEO, CFO, or independent registered public accounting firm determine in the future that, our internal controls over financialreporting are not effective as defined under Section 404, investor perceptions may be adversely affected and could cause a decline in the market price of ourstock.The investment of our cash balance and our investments in government and corporate debt securities are subject to risks, which may cause losses andaffect the liquidity of these investments.At June 30, 2010, we had $1,660.1 million in cash and cash equivalents and $1,076.1 million in short− and long−term investments. We have invested theseamounts primarily in U.S. government securities, government−sponsored enterprise obligations, foreign government debt securities, corporate notes andbonds, commercial paper, and money market funds meeting certain criteria. Certain of these investments are subject to general credit, liquidity, market, andinterest rate risks, which may be exacerbated by U.S. sub−prime mortgage defaults that have affected various sectors of the financial markets and causedcredit and liquidity issues at many financial institutions. These market risks associated with our investment portfolio may have a negative adverse effect onour liquidity, financial condition, and results of operations.Uninsured losses could harm our operating results.We self−insure against many business risks and expenses, such as intellectual property litigation and our medical benefit programs, where we believe wecan adequately self−insure against the anticipated exposure and risk or where insurance is either not deemed cost−effective or is not available. We alsomaintain a program of insurance coverage for various types of property, casualty, and other risks. We place our insurance coverage with various carriers innumerous jurisdictions. The types and amounts of insurance that we obtain vary from time to time and from location to location, depending on availability,cost, and our decisions with respect to risk retention. The policies are subject to deductibles, policy limits, and exclusions that result in our retention of alevel of risk on a self−insurance basis. Losses not covered by insurance could be substantial and unpredictable and could adversely affect our financialcondition and results of operations.
76
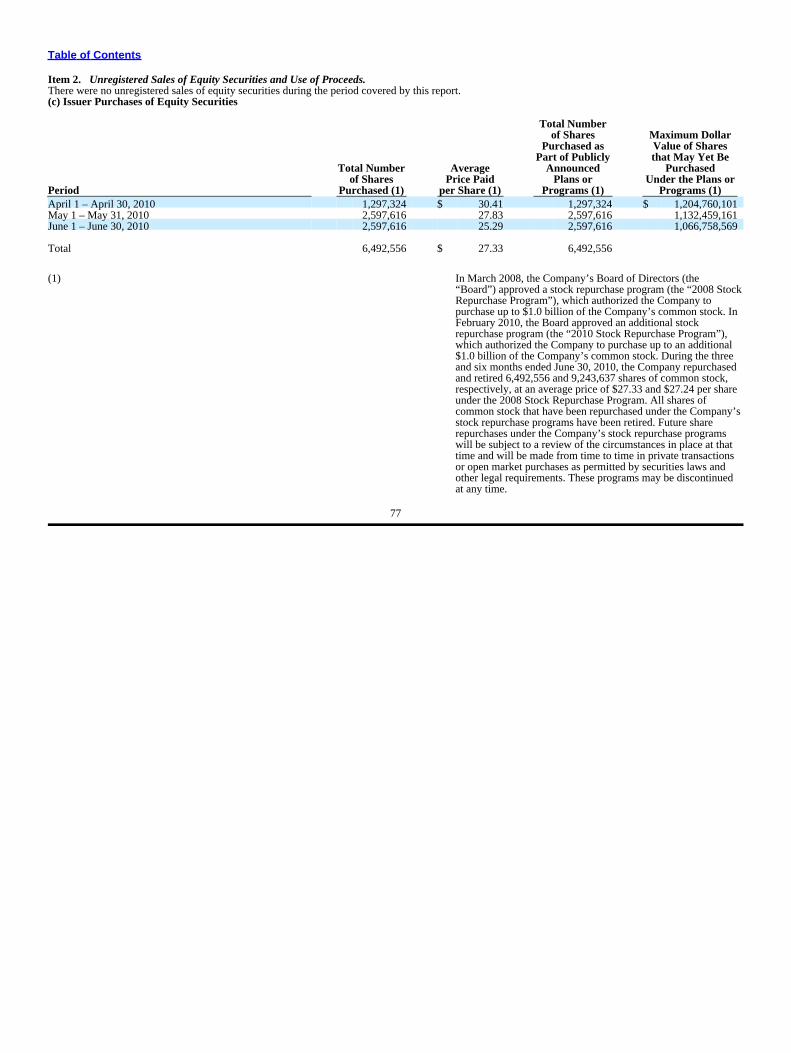
Table of Contents
Item 2. Unregistered Sales of Equity Securities and Use of Proceeds.There were no unregistered sales of equity securities during the period covered by this report.(c) Issuer Purchases of Equity Securities
Total Numberof Shares Maximum Dollar
Purchased as Value of SharesPart of Publicly that May Yet Be
Total Number Average Announced Purchasedof Shares Price Paid Plans or Under the Plans or
Period Purchased (1) per Share (1) Programs (1) Programs (1)April 1 – April 30, 2010 1,297,324 $ 30.41 1,297,324 $ 1,204,760,101May 1 – May 31, 2010 2,597,616 27.83 2,597,616 1,132,459,161June 1 – June 30, 2010 2,597,616 25.29 2,597,616 1,066,758,569
Total 6,492,556 $ 27.33 6,492,556
(1) In March 2008, the Company’s Board of Directors (the“Board”) approved a stock repurchase program (the “2008 StockRepurchase Program”), which authorized the Company topurchase up to $1.0 billion of the Company’s common stock. InFebruary 2010, the Board approved an additional stockrepurchase program (the “2010 Stock Repurchase Program”),which authorized the Company to purchase up to an additional$1.0 billion of the Company’s common stock. During the threeand six months ended June 30, 2010, the Company repurchasedand retired 6,492,556 and 9,243,637 shares of common stock,respectively, at an average price of $27.33 and $27.24 per shareunder the 2008 Stock Repurchase Program. All shares ofcommon stock that have been repurchased under the Company’sstock repurchase programs have been retired. Future sharerepurchases under the Company’s stock repurchase programswill be subject to a review of the circumstances in place at thattime and will be made from time to time in private transactionsor open market purchases as permitted by securities laws andother legal requirements. These programs may be discontinuedat any time.
77
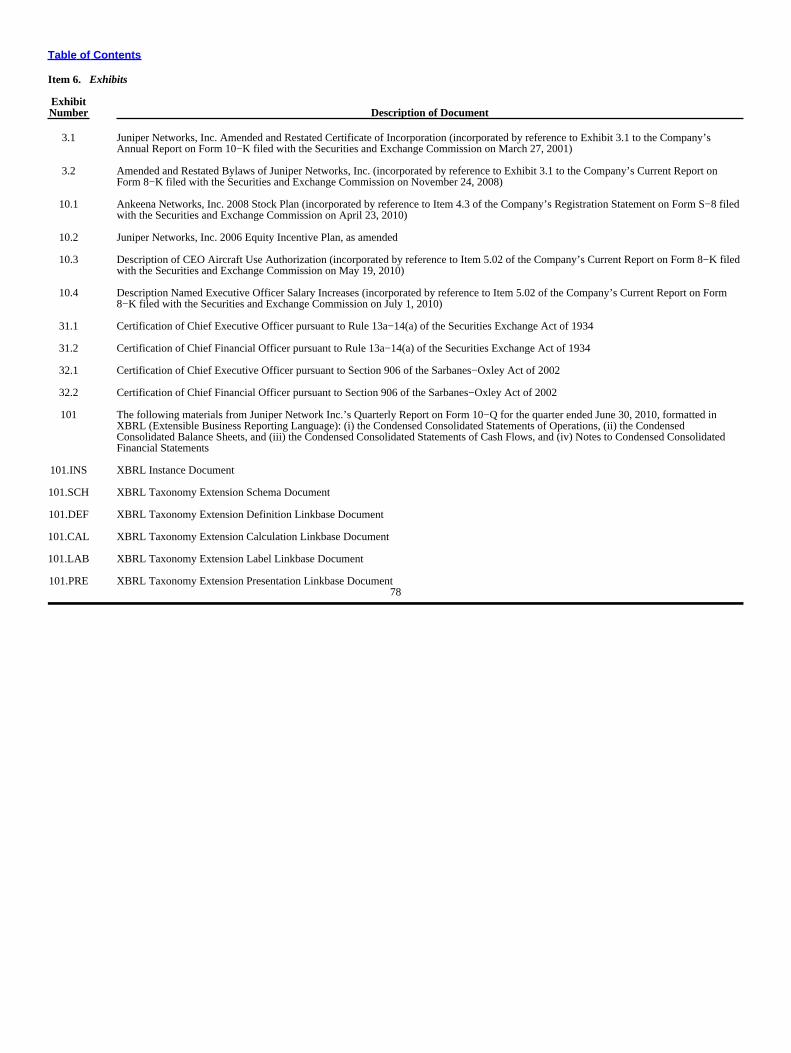
Table of Contents
Item 6. Exhibits
ExhibitNumber Description of Document
3.1 Juniper Networks, Inc. Amended and Restated Certificate of Incorporation (incorporated by reference to Exhibit 3.1 to the Company’sAnnual Report on Form 10−K filed with the Securities and Exchange Commission on March 27, 2001)
3.2 Amended and Restated Bylaws of Juniper Networks, Inc. (incorporated by reference to Exhibit 3.1 to the Company’s Current Report onForm 8−K filed with the Securities and Exchange Commission on November 24, 2008)
10.1 Ankeena Networks, Inc. 2008 Stock Plan (incorporated by reference to Item 4.3 of the Company’s Registration Statement on Form S−8 filedwith the Securities and Exchange Commission on April 23, 2010)
10.2 Juniper Networks, Inc. 2006 Equity Incentive Plan, as amended
10.3 Description of CEO Aircraft Use Authorization (incorporated by reference to Item 5.02 of the Company’s Current Report on Form 8−K filedwith the Securities and Exchange Commission on May 19, 2010)
10.4 Description Named Executive Officer Salary Increases (incorporated by reference to Item 5.02 of the Company’s Current Report on Form8−K filed with the Securities and Exchange Commission on July 1, 2010)
31.1 Certification of Chief Executive Officer pursuant to Rule 13a−14(a) of the Securities Exchange Act of 1934
31.2 Certification of Chief Financial Officer pursuant to Rule 13a−14(a) of the Securities Exchange Act of 1934
32.1 Certification of Chief Executive Officer pursuant to Section 906 of the Sarbanes−Oxley Act of 2002
32.2 Certification of Chief Financial Officer pursuant to Section 906 of the Sarbanes−Oxley Act of 2002
101 The following materials from Juniper Network Inc.’s Quarterly Report on Form 10−Q for the quarter ended June 30, 2010, formatted inXBRL (Extensible Business Reporting Language): (i) the Condensed Consolidated Statements of Operations, (ii) the CondensedConsolidated Balance Sheets, and (iii) the Condensed Consolidated Statements of Cash Flows, and (iv) Notes to Condensed ConsolidatedFinancial Statements
101.INS XBRL Instance Document
101.SCH XBRL Taxonomy Extension Schema Document
101.DEF XBRL Taxonomy Extension Definition Linkbase Document
101.CAL XBRL Taxonomy Extension Calculation Linkbase Document
101.LAB XBRL Taxonomy Extension Label Linkbase Document
101.PRE XBRL Taxonomy Extension Presentation Linkbase Document78

Table of Contents
SIGNATURESPursuant to the requirements of the Securities Exchange Act of 1934, the registrant had duly caused this report to be signed on its behalf by the undersignedthereunto duly authorized.
Juniper Networks, Inc.
August 6, 2010 By: /s/ Robyn M. Denholm Robyn M. Denholm Executive Vice President and Chief Financial Officer(Duly Authorized Officer and Principal Financial Officer)
August 6, 2010 By: /s/ Gene Zamiska Gene Zamiska Vice President, Finance and Corporate Controller(Duly Authorized Officer and Principal Accounting Officer)
79
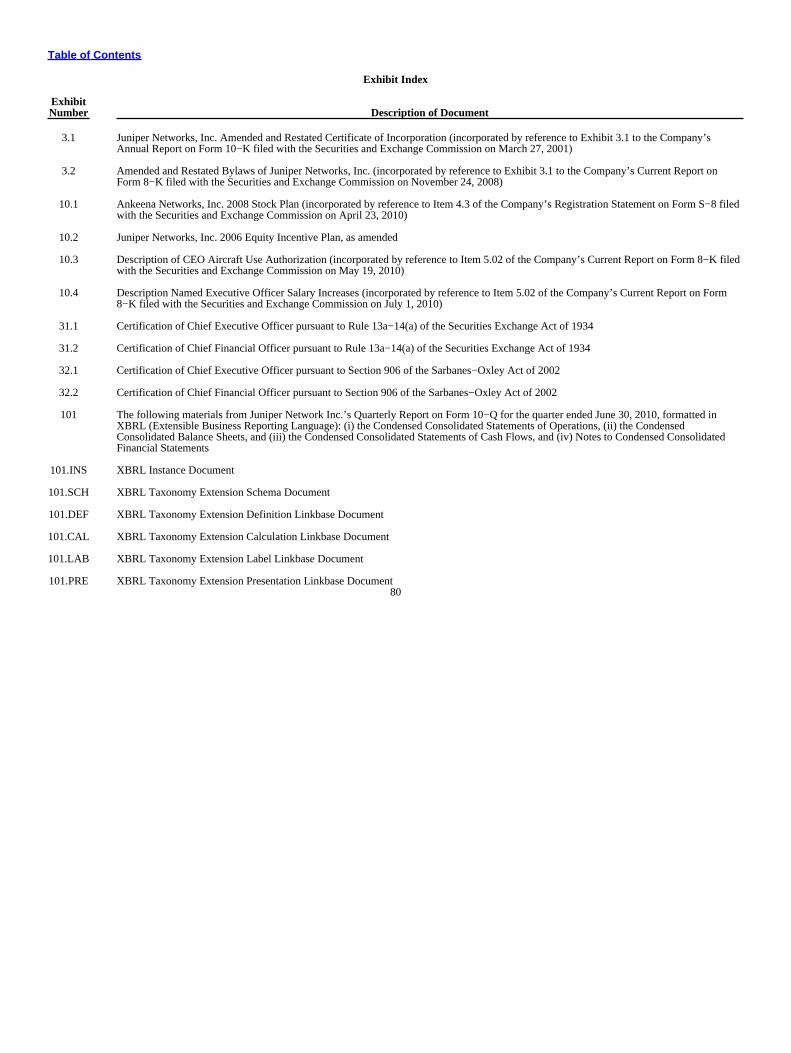
Table of Contents
Exhibit Index
ExhibitNumber Description of Document
3.1 Juniper Networks, Inc. Amended and Restated Certificate of Incorporation (incorporated by reference to Exhibit 3.1 to the Company’sAnnual Report on Form 10−K filed with the Securities and Exchange Commission on March 27, 2001)
3.2 Amended and Restated Bylaws of Juniper Networks, Inc. (incorporated by reference to Exhibit 3.1 to the Company’s Current Report onForm 8−K filed with the Securities and Exchange Commission on November 24, 2008)
10.1 Ankeena Networks, Inc. 2008 Stock Plan (incorporated by reference to Item 4.3 of the Company’s Registration Statement on Form S−8 filedwith the Securities and Exchange Commission on April 23, 2010)
10.2 Juniper Networks, Inc. 2006 Equity Incentive Plan, as amended
10.3 Description of CEO Aircraft Use Authorization (incorporated by reference to Item 5.02 of the Company’s Current Report on Form 8−K filedwith the Securities and Exchange Commission on May 19, 2010)
10.4 Description Named Executive Officer Salary Increases (incorporated by reference to Item 5.02 of the Company’s Current Report on Form8−K filed with the Securities and Exchange Commission on July 1, 2010)
31.1 Certification of Chief Executive Officer pursuant to Rule 13a−14(a) of the Securities Exchange Act of 1934
31.2 Certification of Chief Financial Officer pursuant to Rule 13a−14(a) of the Securities Exchange Act of 1934
32.1 Certification of Chief Executive Officer pursuant to Section 906 of the Sarbanes−Oxley Act of 2002
32.2 Certification of Chief Financial Officer pursuant to Section 906 of the Sarbanes−Oxley Act of 2002
101 The following materials from Juniper Network Inc.’s Quarterly Report on Form 10−Q for the quarter ended June 30, 2010, formatted inXBRL (Extensible Business Reporting Language): (i) the Condensed Consolidated Statements of Operations, (ii) the CondensedConsolidated Balance Sheets, and (iii) the Condensed Consolidated Statements of Cash Flows, and (iv) Notes to Condensed ConsolidatedFinancial Statements
101.INS XBRL Instance Document
101.SCH XBRL Taxonomy Extension Schema Document
101.DEF XBRL Taxonomy Extension Definition Linkbase Document
101.CAL XBRL Taxonomy Extension Calculation Linkbase Document
101.LAB XBRL Taxonomy Extension Label Linkbase Document
101.PRE XBRL Taxonomy Extension Presentation Linkbase Document80
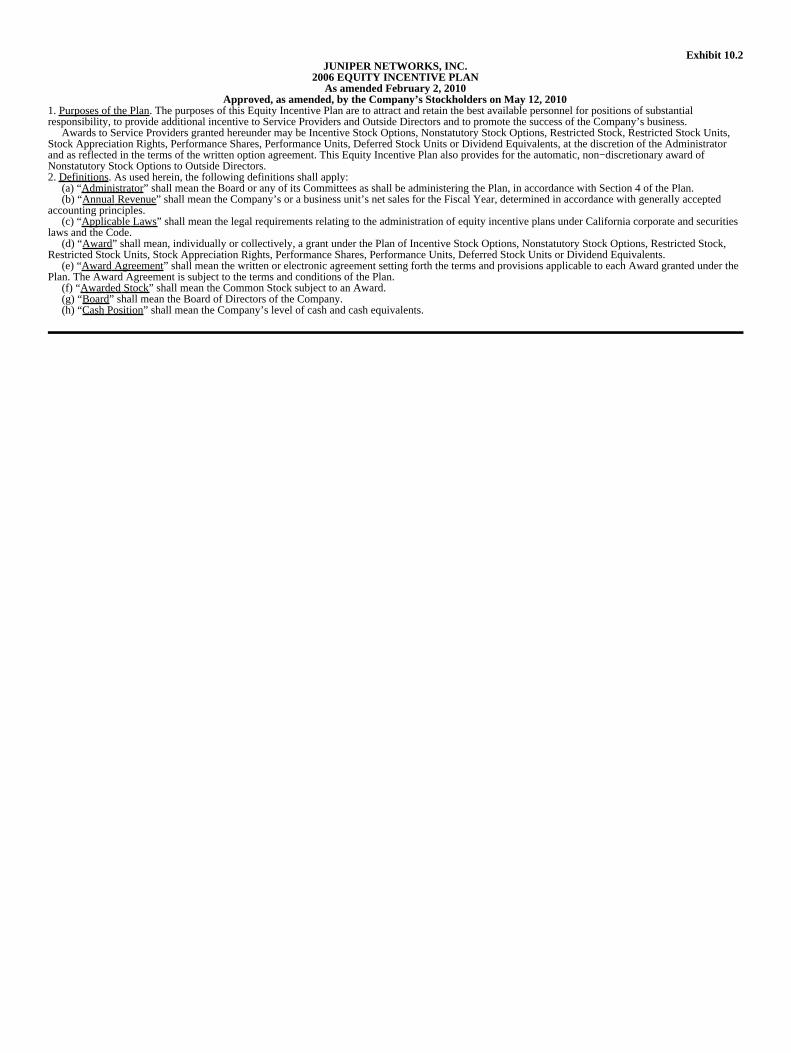
Exhibit 10.2JUNIPER NETWORKS, INC.
2006 EQUITY INCENTIVE PLANAs amended February 2, 2010
Approved, as amended, by the Company’s Stockholders on May 12, 20101. Purposes of the Plan. The purposes of this Equity Incentive Plan are to attract and retain the best available personnel for positions of substantialresponsibility, to provide additional incentive to Service Providers and Outside Directors and to promote the success of the Company’s business. Awards to Service Providers granted hereunder may be Incentive Stock Options, Nonstatutory Stock Options, Restricted Stock, Restricted Stock Units,Stock Appreciation Rights, Performance Shares, Performance Units, Deferred Stock Units or Dividend Equivalents, at the discretion of the Administratorand as reflected in the terms of the written option agreement. This Equity Incentive Plan also provides for the automatic, non−discretionary award ofNonstatutory Stock Options to Outside Directors.2. Definitions. As used herein, the following definitions shall apply: (a) “Administrator” shall mean the Board or any of its Committees as shall be administering the Plan, in accordance with Section 4 of the Plan. (b) “Annual Revenue” shall mean the Company’s or a business unit’s net sales for the Fiscal Year, determined in accordance with generally acceptedaccounting principles. (c) “Applicable Laws” shall mean the legal requirements relating to the administration of equity incentive plans under California corporate and securitieslaws and the Code. (d) “Award” shall mean, individually or collectively, a grant under the Plan of Incentive Stock Options, Nonstatutory Stock Options, Restricted Stock,Restricted Stock Units, Stock Appreciation Rights, Performance Shares, Performance Units, Deferred Stock Units or Dividend Equivalents. (e) “Award Agreement” shall mean the written or electronic agreement setting forth the terms and provisions applicable to each Award granted under thePlan. The Award Agreement is subject to the terms and conditions of the Plan. (f) “Awarded Stock” shall mean the Common Stock subject to an Award. (g) “Board” shall mean the Board of Directors of the Company. (h) “Cash Position” shall mean the Company’s level of cash and cash equivalents.
(i) “Code” shall mean the Internal Revenue Code of 1986, as amended. (j) “Common Stock” shall mean the Common Stock of the Company. (k) “Committee” shall mean the Committee appointed by the Board of Directors or a sub−committee appointed by the Board’s designated committee inaccordance with Section 4(a) of the Plan, if one is appointed. (l) “Company” shall mean Juniper Networks, Inc. (m) “Consultant” shall mean any person, including an advisor, engaged by the Company or a Parent or Subsidiary to render services and who iscompensated for such services; provided, however, that the term “Consultant” shall not include Outside Directors, unless such Outside Directors arecompensated for services to the Company other than through payment of director’s fees and Option grants under Section 11 hereof. (n) “Continuous Status as a Director” means that the Director relationship is not interrupted or terminated. (o) “Deferred Stock Unit” means a deferred stock unit Award granted to a Participant pursuant to Section 16. (p) “Director” shall mean a member of the Board. (q) “Disability” means total and permanent disability as defined in Section 22(e)(3) of the Code. (r) “Dividend Equivalent” shall mean a credit, payable in cash, made at the discretion of the Administrator, to the account of a Participant in an amountequal to the cash dividends paid on one Share for each Share represented by an Award held by such Participant. Dividend Equivalents may be subject to thesame vesting restrictions as the related Shares subject to an Award, at the discretion of the Administrator. (s) “Employee” shall mean any person, including Officers and Directors, employed by the Company or any Parent or Subsidiary of the Company. AnEmployee shall not cease to be an Employee in the case of (i) any leave of absence approved by the Company or (ii) transfers between locations of theCompany or between the Company, its Parent, any Subsidiary, or any successor. For purposes of Incentive Stock Options, no such leave may exceed ninetydays, unless reemployment upon expiration of such leave is guaranteed by statute or contract. If reemployment upon expiration of a leave of absenceapproved by the Company is not so guaranteed, then three (3) months following the 91st day of such leave any Incentive Stock Option held by theParticipant shall cease to be treated as an Incentive Stock Option and shall be treated for tax purposes as a Nonstatutory Stock Option. (t) “Exchange Act” shall mean the Securities Exchange Act of 1934, as amended.
−2−
(u) “Fair Market Value” shall mean, as of any date, the value of Common Stock determined as follows: (i) If the Common Stock is listed on a stock exchange, the fair market value per Share shall be the closing price on such exchange, as reported in theWall Street Journal on the date of determination or, if the date of determination is not a trading day, the immediately preceding trading day; (ii) If there is a public market for the Common Stock, the fair market value per Share shall be the mean of the bid and asked prices, or closing price inthe event quotations for the Common Stock are reported on the National Market System, of the Common Stock on the date of determination, as reported inthe Wall Street Journal (or, if not so reported, as otherwise reported by the National Association of Securities Dealers Automated Quotation(NASDAQ) System); or (iii) In the absence of an established market for the Common Stock, the Fair Market Value shall be determined in good faith by the Administrator. (v) “Fiscal Year” shall mean a fiscal year of the Company. (w) “Full Value Award” shall mean a grant of Restricted Stock, a Restricted Stock Unit, a Performance Share or a Deferred Stock Unit hereunder. (x) “Incentive Stock Option” shall mean an Option intended to qualify as an incentive stock option within the meaning of Section 422 of the Code. (y) “Nonstatutory Stock Option” shall mean an Option not intended to qualify as an Incentive Stock Option. (z) “Officer” shall mean a person who is an officer of the Company within the meaning of Section 16 of the Exchange Act and the rules and regulationspromulgated thereunder. (aa) “Option” shall mean a stock option granted pursuant to the Plan. (bb) “Optioned Stock” shall mean the Common Stock subject to an Option. (cc) “Outside Director” means a Director who is not an Employee or Consultant. (dd) “Parent” shall mean a “parent corporation”, whether now or hereafter existing, as defined in Section 424(e) of the Code. (ee) “Participant” shall mean an Employee or Consultant who receives an Award. (ff) “Performance Goals” shall mean the goal(s) (or combined goal(s)) determined by the Administrator (in its discretion) to be applicable to a Participantwith respect to an Award.
−3−
As determined by the Administrator, the performance measures for any performance period will be any one or more of the following objective performancecriteria, applied to either the Company as a whole or, except with respect to stockholder return metrics, to a region, business unit, affiliate or businesssegment, and measured either on an absolute basis or relative to a pre−established target, to a previous period’s results or to a designated comparison group,and, with respect to financial metrics, which may be determined in accordance with United States Generally Accepted Accounting Principles (“GAAP”), inaccordance with accounting principles established by the International Accounting Standards Board (“IASB Principles”) or which may be adjusted whenestablished to exclude any items otherwise includable under GAAP or under IASB Principles: (i) cash flow (including operating cash flow or free cashflow), (ii) cash position, (iii) revenue (on an absolute basis or adjusted for currency effects), (iv) revenue growth, (v) contribution margin, (vi) gross margin,(vii) operating margin (viii) operating expenses or operating expenses as a percentage of revenue, (ix) earnings (which may include earnings before interestand taxes, earnings before taxes and net earnings), (x) earnings per share, (xi) operating income, (xii) net income, (xiii) stock price, (xiv) return on equity,(xv) total stockholder return, (xvi) growth in stockholder value relative to a specified publicly reported index (such as the S&P 500 Index), (xvii) return oncapital, (xviii) return on assets or net assets, (xix) return on investment, (xx) economic value added, (xxi) operating profit or net operating profit, (xxii)operating margin, (xxiii) market share, (xxiv) contract awards or backlog, (xxv) overhead or other expense reduction, (xxvi) credit rating, (xxvii) objectivecustomer indicators, (xxviii) new product invention or innovation, (xxix) attainment of research and development milestones, (xxx) improvements inproductivity, (xxxi) attainment of objective operating goals, and (xxxii) objective employee metrics. The Performance Goals may differ from Participant toParticipant and from Award to Award. In particular, the Administrator may appropriately adjust any evaluation of performance under a Performance Goal toexclude (a) any extraordinary non−recurring items, (b) the affect of any merger, acquisition, or other business combination or divestiture or (ii) the effect ofany changes in accounting principles affecting the Company’s or a business units’, region’s, affiliate’s or business segment’s reported results. (gg) “Performance Share” shall mean a performance share Award granted to a Participant pursuant to Section 14. (hh) “Performance Unit” means a performance unit Award granted to a Participant pursuant to Section 15. (ii) “Plan” shall mean this 2006 Equity Incentive Plan, as amended. (jj) “Plan Minimum Vesting Requirements” shall mean the minimum vesting requirements for Full Value Awards under Plan Section 4(b)(vi) hereunder. (kk) “Restricted Stock” shall mean a restricted stock Award granted to a Participant pursuant to Section 11. (ll) “Restricted Stock Unit” shall mean a bookkeeping entry representing an amount equal to the Fair Market Value of one Share, granted pursuant toSection 13. Each Restricted Stock Unit represents an unfunded and unsecured obligation of the Company.
−4−
(mm) “Rule 16b−3” shall mean Rule 16b−3 of the Exchange Act or any successor to Rule 16b−3, as in effect when discretion is being exercised withrespect to the Plan. (nn) “Section 16(b)” shall mean Section 16(b) of the Exchange Act. (oo) “Service Provider” means an Employee or Consultant. (pp) “Share” shall mean a share of the Common Stock, as adjusted in accordance with Section 21 of the Plan. (qq) “Stock Appreciation Right” or “SAR” shall mean a stock appreciation right granted pursuant to Section 9 below. (rr) “Subsidiary” shall mean a “subsidiary corporation”, whether now or hereafter existing, as defined in Section 424(f) of the Code.3. Stock Subject to the Plan. Subject to the provisions of Section 21 of the Plan, the maximum aggregate number of shares which may be optioned and soldunder the Plan is 94,500,000 shares of Common Stock plus any Shares subject to any options under the Company’s 2000 Nonstatutory Stock Option Planand 1996 Stock Incentive Plan that are outstanding on the date this Plan becomes effective and that subsequently expire unexercised, up to a maximum of anadditional 75,000,000 Shares. All of the shares issuable under the Plan may be authorized, but unissued, or reacquired Common Stock. Any Shares subject to Options or SARs shall be counted against the numerical limits of this Section 3 as one Share for every Share subject thereto. AnyShares subject to Performance Shares, Restricted Stock or Restricted Stock Units with a per share or unit purchase price lower than 100% of Fair MarketValue on the date of grant shall be counted against the numerical limits of this Section 3 as two and one−tenth Shares for every one Share subject thereto.To the extent that a Share that was subject to an Award that counted as two and one−tenth Shares against the Plan reserve pursuant to the preceding sentenceis recycled back into the Plan under the next paragraph of this Section 3, the Plan shall be credited with two and one−tenth Shares. If an Award expires or becomes unexercisable without having been exercised in full, or, with respect to Restricted Stock, Performance Shares orRestricted Stock Units, is forfeited to or repurchased by the Company at its original purchase price due to such Award failing to vest, the unpurchasedShares (or for Awards other than Options and SARs, the forfeited or repurchased shares) which were subject thereto shall become available for future grantor sale under the Plan (unless the Plan has terminated). With respect to SARs, when an SAR is exercised, the shares subject to a SAR grant agreement shallbe counted against the numerical limits of Section 3 above, as one share for every share subject thereto, regardless of the number of shares used to settle theSAR upon exercise (i.e., shares withheld to satisfy the exercise price of an SAR shall not remain available for issuance under the Plan). Shares that haveactually been issued under the Plan under any Award shall not be returned to the Plan and shall not become available for future distribution under the Plan;provided, however, that if Shares of Restricted Stock, Performance Shares or Restricted Stock Units are repurchased by the Company at their original
−5−
purchase price or are forfeited to the Company due to such Awards failing to vest, such Shares shall become available for future grant under the Plan.Shares used to pay the exercise price of an Option shall not become available for future grant or sale under the Plan. Shares used to satisfy tax withholdingobligations shall not become available for future grant or sale under the Plan. To the extent an Award under the Plan is paid out in cash rather than stock,such cash payment shall not reduce the number of Shares available for issuance under the Plan. Any payout of Dividend Equivalents or Performance Units,because they are payable only in cash, shall not reduce the number of Shares available for issuance under the Plan. Conversely, any forfeiture of DividendEquivalents or Performance Units shall not increase the number of Shares available for issuance under the Plan.4. Administration of the Plan. (a) Procedure. (i) Multiple Administrative Bodies. If permitted by Applicable Laws, the Plan may be administered by different bodies with respect to Directors,Officers who are not Directors, and Employees who are neither Directors nor Officers. (ii) Section 162(m). To the extent that the Administrator determines it to be desirable to qualify Awards granted hereunder as “performance−basedcompensation” within the meaning of Section 162(m) of the Code, the Plan shall be administered by a Committee consisting solely of two or more “outsidedirectors” within the meaning of Section 162(m) of the Code. (iii) Administration With Respect to Officers Subject to Section 16(b). With respect to Option grants made to Employees who are also Officerssubject to Section 16(b) of the Exchange Act, the Plan shall be administered by (A) the Board, if the Board may administer the Plan in compliance withRule 16b−3, or (B) a committee designated by the Board to administer the Plan, which committee shall be constituted to comply with Rule 16b−3. Onceappointed, such Committee shall continue to serve in its designated capacity until otherwise directed by the Board. From time to time the Board mayincrease the size of the Committee and appoint additional members, remove members (with or without cause) and substitute new members, fill vacancies(however caused), and remove all members of the Committee and thereafter directly administer the Plan, all to the extent permitted by Rule 16b−3. (iv) Administration With Respect to Other Persons. With respect to Award grants made to Employees or Consultants who are not Officers of theCompany, the Plan shall be administered by (A) the Board, (B) a committee designated by the Board, or (C) a sub−committee designated by the designatedcommittee, which committee or sub−committee shall be constituted to satisfy Applicable Laws. Once appointed, such Committee shall serve in itsdesignated capacity until otherwise directed by the Board. The Board may increase the size of the Committee and appoint additional members, removemembers (with or without cause) and substitute new members, fill vacancies (however caused), and remove all members of the Committee and thereafterdirectly administer the Plan, all to the extent permitted by Applicable Laws.
−6−
(v) Administration With Respect to Automatic Grants to Outside Directors. Automatic Grants to Outside Directors shall be pursuant to anon−discretionary formula as set forth in Section 11 hereof and therefore shall not be subject to any discretionary administration. (b) Powers of the Administrator. Subject to the provisions of the Plan (including the non−discretionary automatic grant to Outside Director provisions ofSection 11), and in the case of a Committee, subject to the specific duties delegated by the Board to such Committee, the Administrator shall have theauthority, in its discretion: (i) to determine the Fair Market Value in accordance with Section 2(v) of the Plan; (ii) to select the Service Providers to whom Awards may be granted hereunder; (iii) to determine whether and to what extent Awards are granted hereunder; (iv) to determine the number of shares of Common Stock to be covered by each Award granted hereunder; (v) to approve forms of agreement for use under the Plan; (vi) to determine the terms and conditions, not inconsistent with the terms of the Plan, of any Award granted hereunder. Such terms and conditionsinclude, but are not limited to, the exercise price, the time or times when Awards vest or may be exercised (which may be based on performance criteria),any vesting acceleration or waiver of forfeiture restrictions (subject to compliance with applicable laws, including Code Section 409A), and any restrictionor limitation regarding any Award or the shares of Common Stock relating thereto, based in each case on such factors as the Administrator, in its solediscretion, shall determine; provided, however, that with respect to Full Value Awards vesting solely based on continuing as a Service Provider, they willvest in full no earlier (except if accelerated pursuant to Section 21 hereof or pursuant to change of control severance agreements entered into by and betweenthe Company and any Service Provider) than the three (3) year anniversary of the grant date; provided, further, that if vesting is not solely based oncontinuing as a Service Provider, they will vest in full no earlier (except if accelerated pursuant to Section 21 hereof or pursuant to change of controlseverance agreements entered into by and between the Company and any Service Provider) than the one (1) year anniversary of the grant date; (vii) to construe and interpret the terms of the Plan and Awards granted pursuant to the Plan; (viii) to prescribe, amend and rescind rules and regulations relating to the Plan; (ix) to modify or amend each Award (subject to Section 7 and Section 24(c) of the Plan);
−7−
(x) to authorize any person to execute on behalf of the Company any instrument required to effect the grant of an Award previously granted by theAdministrator; (xi) to determine the terms and restrictions applicable to Awards; (xii) to determine whether Awards will be adjusted for Dividend Equivalents and whether such Dividend Equivalents shall be subject to vesting; and (xiii) to make all other determinations deemed necessary or advisable for administering the Plan. (c) Effect of Administrator’s Decision. All decisions, determinations and interpretations of the Administrator shall be final and binding on all Participantsand any other holders of any Awards granted under the Plan. (d) Exception to Plan Minimum Vesting Requirements. (i) Full Value Awards that result in issuing up to 5% of the maximum aggregate number of shares of Stock authorized for issuance under the Plan (the“5% Limit”) may be granted to any one or more employees or Non−employee Directors without respect to the Plan Minimum Vesting Requirements. (ii) All Full Value Awards that have their vesting discretionarily accelerated, and all Options and SARs that have their vesting discretionarilyaccelerated 100%, other than, in either case, pursuant to (A) a merger or asset sale transaction described in Section 21(c) hereof (including vestingacceleration in connection with employment termination following such event), (B) a Participant’s death, or (C) a Participant’s Disability, are subject to the5% Limit. (iii) Notwithstanding the foregoing, the Administrator may accelerate the vesting of Full Value Awards such that the Plan Minimum VestingRequirements are still satisfied, without such vesting acceleration counting toward the 5% Limit. (iv) The 5% Limit applies in the aggregate to Full Value Award grants that do not satisfy Plan minimum vesting requirements and to the discretionaryvesting acceleration of Awards.5. Eligibility. Awards may be granted only to Service Providers. Incentive Stock Options may be granted only to Employees. A Service Provider who hasbeen granted an Award may, if he or she is otherwise eligible, be granted an additional Award or Awards. Outside Directors may only be granted Awards asspecified in Section 11 hereof.6. Code Section 162(m) Provisions. (a) Option and SAR Annual Share Limit. Subject to Section 7 below, no Participant shall be granted, in any Fiscal Year, Options and Stock AppreciationRights to purchase more
−8−
than 2,000,000 Shares; provided, however, that such limit shall be 4,000,000 Shares in the Participant’s first Fiscal Year of Company service. (b) Restricted Stock, Performance Share and Restricted Stock Unit Annual Limit. No Participant shall be granted, in any Fiscal Year, more than1,000,000 Shares in the aggregate of the following: (i) Restricted Stock, (ii) Performance Shares, or (iii) Restricted Stock Units; provided, however, thatsuch limit shall be 2,000,000 Shares in the Participant’s first Fiscal Year of Company service. (c) Performance Units Annual Limit. No Participant shall receive Performance Units, in any Fiscal Year, having an initial value greater than $2,000,000,provided, however, that such limit shall be $4,000,000 in the Participant’s first Fiscal Year of Company service. (d) Section 162(m) Performance Restrictions. For purposes of qualifying grants of Restricted Stock, Performance Shares, Performance Units orRestricted Stock Units as “performance−based compensation” under Section 162(m) of the Code, the Administrator, in its discretion, may set restrictionsbased upon the achievement of Performance Goals. The Performance Goals shall be set by the Administrator on or before the latest date permissible toenable the Restricted Stock, Performance Shares, Performance Units or Restricted Stock Units to qualify as “performance−based compensation” underSection 162(m) of the Code. In granting Restricted Stock, Performance Shares, Performance Units or Restricted Stock Units which are intended to qualifyunder Section 162(m) of the Code, the Administrator shall follow any procedures determined by it from time to time to be necessary or appropriate toensure qualification of the Award under Section 162(m) of the Code (e.g., in determining the Performance Goals). (e) Changes in Capitalization. The numerical limitations in Sections 6(a) and (b) shall be adjusted proportionately in connection with any change in theCompany’s capitalization as described in Section 16(a).7. No Repricing. The exercise price for an Option or SAR may not be reduced without the consent of the Company’s stockholders. This shall include,without limitation, a repricing of the Option or SAR as well as an Option or SAR exchange program whereby the Participant agrees to cancel an existingOption in exchange for an Option, SAR or other Award. If an Option or SAR is cancelled in the same Fiscal Year in which it was granted (other than inconnection with a transaction described in Section 14), the cancelled Option or SAR as well as any replacement Option or SAR will be counted against thelimits set forth in section 6(a) above. Moreover, if the exercise price of an Option or SAR is reduced, the transaction will be treated as a cancellation of theOption or SAR and the grant of a new Option or SAR.8. Stock Options. (a) Type of Option. Each Option shall be designated in the Award Agreement as either an Incentive Stock Option or a Nonstatutory Stock Option.However, notwithstanding such designations, to the extent that the aggregate Fair Market Value of Shares subject to a Participant’s incentive stock optionsgranted by the Company, any Parent or Subsidiary, that
−9−
become exercisable for the first time during any calendar year (under all plans of the Company or any Parent or Subsidiary) exceeds $100,000, such excessOptions shall be treated as Nonstatutory Stock Options. For purposes of this Section 8(a), incentive stock options shall be taken into account in the order inwhich they were granted, and the Fair Market Value of the Shares shall be determined as of the time of grant. (b) Term of Option. The term of each Option shall be stated in the Notice of Grant; provided, however, that the term shall be seven (7) years from thedate of grant or such shorter term as may be provided in the Notice of Grant. Moreover, in the case of an Incentive Stock Option granted to a Participantwho, at the time the Incentive Stock Option is granted, owns stock representing more than ten percent (10%) of the voting power of all classes of stock ofthe Company or any Parent or Subsidiary, the term of the Incentive Stock Option shall be five (5) years from the date of grant or such shorter term as maybe provided in the Notice of Grant. (c) Exercise Price and Consideration. (i) The per Share exercise price for the Shares to be issued pursuant to exercise of an Option shall be such price as is determined by the Administrator,but shall be subject to the following: (A) In the case of an Incentive Stock Option (1) granted to an Employee who, at the time the Incentive Stock Option is granted, owns stock representing more than ten percent (10%) of thevoting power of all classes of stock of the Company or any Parent or Subsidiary, the per Share exercise price shall be no less than 110% of the Fair MarketValue per Share on the date of grant. (2) granted to any Employee, the per Share exercise price shall be no less than 100% of the Fair Market Value per Share on the date of grant. (B) In the case of a Nonstatutory Stock Option, the per Share exercise price shall be no less than 100% of the Fair Market Value per Share on thedate of grant. (ii) Except with respect to automatic stock option grants to Outside Directors, the consideration to be paid for the Shares to be issued upon exercise ofan Option, including the method of payment, shall be determined by the Administrator and may consist entirely of cash; check; delivery of a properlyexecuted exercise notice together with such other documentation as the Committee and the broker, if applicable, shall require to effect an exercise of theoption and delivery to the Company of the sale proceeds required; or any combination of such methods of payment, or such other consideration and methodof payment for the issuance of Shares to the extent permitted under Applicable Law.9. Stock Appreciation Rights. (a) Grant of SARs. Subject to the terms and conditions of the Plan, SARs may be granted to Participants at any time and from time to time as shall bedetermined by the
−10−
Administrator, in its sole discretion. Subject to Section 6(a) hereof, the Administrator shall have complete discretion to determine the number of SARsgranted to any Participant. (b) Exercise Price and other Terms. The per share exercise price for the Shares to be issued pursuant to exercise of an SAR shall be determined by theAdministrator and shall be no less than 100% of the Fair Market Value per share on the date of grant. Otherwise, subject to Section 6(a) of the Plan, theAdministrator, subject to the provisions of the Plan, shall have complete discretion to determine the terms and conditions of SARs granted under the Plan;provided, however, that no SAR may have a term of more than seven(=7) years from the date of grant. (c) Payment of SAR Amount. Upon exercise of a SAR, a Participant shall be entitled to receive payment from the Company in an amount determined bymultiplying: (i) The difference between the Fair Market Value of a Share on the date of exercise over the exercise price; times (ii) The number of Shares with respect to which the SAR is exercised. (d) Payment upon Exercise of SAR. At the discretion of the Administrator, but only as specified in the Award Agreement, payment for a SAR may be incash, Shares or a combination thereof. If the Award Agreement is silent as to the form of payment, payment of the SAR may only be in Shares. (e) SAR Agreement. Each SAR grant shall be evidenced by an Award Agreement that shall specify the exercise price, the term of the SAR, theconditions of exercise, whether it may be settled in cash, Shares or a combination thereof, and such other terms and conditions as the Administrator, in itssole discretion, shall determine. (f) Expiration of SARs. A SAR granted under the Plan shall expire upon the date determined by the Administrator, in its sole discretion, and set forth inthe Award Agreement.10. Exercise of Option or SAR. (a) Procedure for Exercise; Rights as a Shareholder. Any Option or SAR granted hereunder shall be exercisable at such times and under such conditionsas determined by the Administrator, including performance criteria with respect to the Company and/or the Participant, and as shall be permissible under theterms of the Plan. An Option or SAR may not be exercised for a fraction of a Share. An Option or SAR shall be deemed to be exercised when written notice of such exercise has been given to the Company in accordance with the terms ofthe Option or SAR by the person entitled to exercise the Option or SAR and, with respect to Options only, full payment for the Shares with respect to whichthe Option is exercised has been received by the Company. With respect to Options only, full payment may, as authorized by the Administrator, consist ofany consideration and method of payment allowable under Section 8(d) of the Plan. Until the
−11−
issuance (as evidenced by the appropriate entry on the books of the Company or of a duly authorized transfer agent of the Company) of the stock certificateevidencing such Shares, no right to vote or receive dividends or any other rights as a shareholder shall exist with respect to the Optioned Stock,notwithstanding the exercise of the Option. No adjustment will be made for a dividend or other right for which the record date is prior to the date the stockcertificate is issued, except as provided in Section 21 of the Plan. (b) Termination of Status as a Service Provider. If an Employee or Consultant ceases to serve as a Service Provider, he or she may, but only within90 days (or such other period of time as is determined by the Administrator and as set forth in the Option or SAR Agreement) after the date he or she ceasesto be a Service Provider, exercise his or her Option or SAR to the extent that he or she was entitled to exercise it at the date of such termination. To theextent that he or she was not entitled to exercise the Option or SAR at the date of such termination, or if he or she does not exercise such Option or SAR(which he or she was entitled to exercise) within the time specified herein, the Option or SAR shall terminate. (c) Disability. If a Participant ceases to be a Service Provider as a result of the Participant’s Disability, the Participant may exercise his or her Option orSAR within such period of time as is specified in the Award Agreement to the extent the Option or SAR is vested on the date of termination (but in no eventlater than the expiration of the term of such Option or SAR as set forth in the Award Agreement). In the absence of a specified time in the AwardAgreement, the Option or SAR shall remain exercisable for twelve (12) months following the Participant’s termination. If, on the date of termination, theParticipant is not vested as to his or her entire Option or SAR, the Shares covered by the unvested portion of the Option or SAR shall revert to the Plan. If,after termination, the Participant does not exercise his or her Option or SAR within the time specified herein, the Option shall terminate, and the Sharescovered by such Option or SAR shall revert to the Plan. (d) Death of Participant. If a Participant dies while a Service Provider, the Option or SAR may be exercised following the Participant’s death within suchperiod of time as is specified in the Award Agreement (but in no event may the option be exercised later than the expiration of the term set forth in theAward Agreement), by the Participant’s designated beneficiary, provided such beneficiary has been designated prior to Participant’s death in a formacceptable to the Administrator. If no such beneficiary has been designated by the Participant, then such Option or SAR may be exercised by the personalrepresentative of the Participant’s estate or by the person(s) to whom the Option or SAR is transferred pursuant to the Participant’s will or in accordancewith the laws of descent and distribution. In the absence of a specified time in the Award Agreement, the Option or SAR shall remain exercisable for twelve(12) months following Participant’s death. If the Option or SAR is not so exercised within the time specified herein, the Option or SAR shall terminate, andthe Shares covered by such Option or SAR shall revert to the Plan.11. Automatic Stock Option Grants to Outside Directors.
−12−
(a) Procedure for Grants. All grants of Options to Outside Directors under this Plan shall be automatic and non−discretionary and shall be made strictlyin accordance with the following provisions: (i) No person shall have any discretion to select which Outside Directors shall be granted Options or Restricted Stock Units or to determine thenumber of Shares to be covered by Options or Restricted Stock Units granted to Outside Directors. (ii) Each Outside Director shall be automatically granted an Option to purchase 50,000 Shares (the “First Option”) upon the date on which suchperson first becomes a Director, whether through election by the stockholders of the Company or appointment by the Board of Directors to fill a vacancy. (iii) At each of the Company’s annual stockholder meetings (A) each Outside Director who was an Outside Director on the date of the prior year’sannual stockholder meeting shall be automatically granted Restricted Stock Units for a number of Shares equal to the Annual Value, and (B) each OutsideDirector who was not an Outside Director on the date of the prior year’s annual stockholder meeting shall receive a Restricted Stock Unit for a number ofShares determined by multiplying the Annual Value by a fraction, the numerator of which is the number of days since the Outside Director received theirFirst Option, and the denominator of which is 365, rounded down to the nearest whole Share. Each award specified in A and B are generically referred to asan “Annual Award”. The Annual Value means the number equal to $125,000 divided by the average daily closing price over the six month period ending onthe last day of the fiscal year preceding the date of grant (for example, the period from July 1, 2008 — December 31, 2008 for Annual Awards granted inMay 2009). (iv) Notwithstanding the provisions of subsections (ii) and (iii) hereof, in the event that an automatic grant hereunder would cause the number ofShares subject to outstanding Options and Restricted Stock Units plus the number of Shares previously purchased upon exercise of Options or issued uponvesting of Restricted Stock Units to exceed the number of Shares available for issuance under the Plan, then each such automatic grant shall be for thatnumber of Shares determined by dividing the total number of Shares remaining available for grant by the number of Outside Directors on the automaticgrant date. Any further grants shall then be deferred until such time, if any, as additional Shares become available for grant under the Plan. (v) The terms of an Option granted hereunder shall be as follows: (A) the term of the Option shall be seven (7) years. (B) the Option shall be exercisable only while the Outside Director remains a Director of the Company, except as set forth in subsection (c) hereof. (C) the exercise price per Share shall be 100% of the Fair Market Value on the date of grant of the Option.
−13−
(D) the First Option shall vest and become exercisable as to 1/36th of the covered Shares each month following the grant date, with the last 1/36th
vesting on the day prior to the Company’s annual stockholder meeting in the third calendar year following the date of grant, so as to become 100% vestedon the approximately three−year anniversary of the grant date, subject to the Participant maintaining Continuous Status as a Director on each vesting date. (E) the Annual Award shall become 100% vested on the one year anniversary of the grant date, subject to the Participant maintaining ContinuousStatus as a Director on each vesting date. (b) Consideration for Exercising Outside Director Stock Options. The consideration to be paid for the Shares to be issued upon exercise of an automaticOutside Director Option shall consist entirely of cash, check, and to the extent permitted by Applicable Laws, delivery of a properly executed exercisenotice together with such other documentation as the Administrator and the broker, if applicable, shall require to effect an exercise of the Option anddelivery to the Company of the sale proceeds required to pay the exercise price, or any combination of such methods of payment. (c) Post−Directorship Exercisability. If an Outside Director ceases to serve as a Director, (including pursuant to his or her death or Disability) he or shemay, but only within 90 days, after the date he or she ceases to be a Director of the Company, exercise his or her Option to the extent that he or she wasentitled to exercise it at the date of such termination. To the extent that he or she was not entitled to exercise an Option at the date of such termination, or ifhe or she does not exercise such Option (which he was entitled to exercise) within the time specified herein, the Option shall terminate.12. Restricted Stock. (a) Grant of Restricted Stock. Subject to the terms and conditions of the Plan, Restricted Stock may be granted to Participants at any time as shall bedetermined by the Administrator, in its sole discretion. Subject to Section 6(b) hereof, the Administrator shall have complete discretion to determine (i) thenumber of Shares subject to a Restricted Stock award granted to any Participant, and (ii) the conditions that must be satisfied, which typically will be basedprincipally or solely on continued provision of services but may include a performance−based component, upon which is conditioned the grant, vesting orissuance of Restricted Stock. (b) Other Terms. The Administrator, subject to the provisions of the Plan, shall have complete discretion to determine the terms and conditions ofRestricted Stock granted under the Plan; provided that Restricted Stock may only be issued in the form of Shares. Restricted Stock grants shall be subject tothe terms, conditions, and restrictions determined by the Administrator at the time the stock or the restricted stock unit is awarded. The Administrator mayrequire the recipient to sign a Restricted Stock Award agreement as a condition of the award. Any certificates representing the Shares of stock awarded shallbear such legends as shall be determined by the Administrator.
−14−
(c) Restricted Stock Award Agreement. Each Restricted Stock grant shall be evidenced by an agreement that shall specify the purchase price (if any) andsuch other terms and conditions as the Administrator, in its sole discretion, shall determine; provided; however, that if the Restricted Stock grant has apurchase price, such purchase price must be paid no more than seven (7) years following the date of grant.13. Restricted Stock Units. (a) Grant. Restricted Stock Units may be granted at any time and from time to time as determined by the Administrator. After the Administratordetermines that it will grant Restricted Stock Units under the Plan, it shall advise the Participant in writing or electronically of the terms, conditions, andrestrictions related to the grant, including the number of Restricted Stock Units and the form of payout, which, subject to Section 6(b) hereof, may be left tothe discretion of the Administrator. (b) Vesting Criteria and Other Terms. The Administrator shall set vesting criteria in its discretion, which, depending on the extent to which the criteriaare met, will determine the number of Restricted Stock Units that will be paid out to the Participant. The Administrator may set vesting criteria based uponthe achievement of Company−wide, business unit, or individual goals (including, but not limited to, continued employment), or any other basis determinedby the Administrator in its discretion. (c) Earning Restricted Stock Units. Upon meeting the applicable vesting criteria, the Participant shall be entitled to receive a payout as specified in theRestricted Stock Unit Award Agreement. Notwithstanding the foregoing, at any time after the grant of Restricted Stock Units, the Administrator, in its solediscretion, may reduce or waive any vesting criteria that must be met to receive a payout. (d) Form and Timing of Payment. Payment of earned Restricted Stock Units shall be made as soon as practicable after the date(s) set forth in theRestricted Stock Unit Award Agreement. The Administrator, in its sole discretion, but only as specified in the Award Agreement, may pay earnedRestricted Stock Units in cash, Shares, or a combination thereof. If the Award Agreement is silent as to the form of payment, payment of the RestrictedStock Units may only be in Shares. (e) Cancellation. On the date set forth in the Restricted Stock Unit Award Agreement, all unearned Restricted Stock Units shall be forfeited to theCompany.14. Performance Shares. (a) Grant of Performance Shares. Subject to the terms and conditions of the Plan, Performance Shares may be granted to Participants at any time as shallbe determined by the Administrator, in its sole discretion. Subject to Section 6(b) hereof, the Administrator shall have complete discretion to determine(i) the number of Shares subject to a Performance Share award granted to any Participant, and (ii) the conditions that must be satisfied, which typically willbe based principally or solely on achievement of performance milestones but may include a service−
−15−

based component, upon which is conditioned the grant or vesting of Performance Shares. Performance Shares shall be granted in the form of units to acquireShares. Each such unit shall be the equivalent of one Share for purposes of determining the number of Shares subject to an Award. Until the Shares areissued, no right to vote or receive dividends or any other rights as a stockholder shall exist with respect to the units to acquire Shares. (b) Other Terms. The Administrator, subject to the provisions of the Plan, shall have complete discretion to determine the terms and conditions ofPerformance Shares granted under the Plan. Performance Share grants shall be subject to the terms, conditions, and restrictions determined by theAdministrator at the time the stock is awarded, which may include such performance−based milestones as are determined appropriate by the Administrator.The Administrator may require the recipient to sign a Performance Shares Award Agreement as a condition of the award. Any certificates representing theShares of stock awarded shall bear such legends as shall be determined by the Administrator. (c) Performance Share Award Agreement. Each Performance Share grant shall be evidenced by an Award Agreement that shall specify such other termsand conditions as the Administrator, in its sole discretion, shall determine.15. Performance Units. (a) Grant of Performance Units. Performance Units are similar to Performance Shares, except that they shall be settled in a cash equivalent to the FairMarket Value of the underlying Shares, determined as of the vesting date. Subject to the terms and conditions of the Plan, Performance Units may begranted to Participants at any time and from time to time as shall be determined by the Administrator, in its sole discretion. The Administrator shall havecomplete discretion to determine the conditions that must be satisfied, which typically will be based principally or solely on achievement of performancemilestones but may include a service−based component, upon which is conditioned the grant or vesting of Performance Units. Performance Units shall begranted in the form of units to acquire Shares. Each such unit shall be the cash equivalent of one Share of Common Stock. No right to vote or receivedividends or any other rights as a stockholder shall exist with respect to Performance Units or the cash payable thereunder. (b) Number of Performance Units. Subject to Section 6(c) hereof, the Administrator will have complete discretion in determining the number ofPerformance Units granted to any Participant. (c) Other Terms. The Administrator, subject to the provisions of the Plan, shall have complete discretion to determine the terms and conditions ofPerformance Units granted under the Plan. Performance Unit grants shall be subject to the terms, conditions, and restrictions determined by theAdministrator at the time the grant is awarded, which may include such performance−based milestones as are determined appropriate by the Administrator.The Administrator may require the recipient to sign a Performance Unit agreement as a condition of the award. Any certificates representing the unitsawarded shall bear such legends as shall be determined by the Administrator.
−16−
(d) Performance Unit Award Agreement. Each Performance Unit grant shall be evidenced by an agreement that shall specify such terms and conditionsas the Administrator, in its sole discretion, shall determine.16. Deferred Stock Units. (a) Description. Deferred Stock Units shall consist of a Restricted Stock, Restricted Stock Unit, Performance Share or Performance Unit Award that theAdministrator, in its sole discretion permits to be paid out in installments or on a deferred basis, in accordance with rules and procedures established by theAdministrator. Deferred Stock Units shall remain subject to the claims of the Company’s general creditors until distributed to the Participant. (b) 162(m) Limits. Deferred Stock Units shall be subject to the annual 162(m) limits applicable to the underlying Restricted Stock, Restricted Stock Unit,Performance Share or Performance Unit Award as set forth in Section 6 hereof.17. Leaves of Absence. If as a condition to be granted an unpaid leave of absence by the Company, a Participant agrees that vesting shall be suspendedduring all or a portion of such leave of absence, (except as otherwise required by Applicable Laws) vesting of Awards granted hereunder shall cease duringsuch agreed upon portion of the unpaid leave of absence and shall only recommence upon return to active service.18. Part−Time Service. Unless otherwise required by Applicable Laws, if as a condition to being permitted to work on a less than full−time basis, theParticipant agrees that any service−based vesting of Awards granted hereunder shall be extended on a proportionate basis in connection with such transitionto a less than a full−time basis, vesting shall be adjusted in accordance with such agreement. Such vesting shall be proportionately re−adjusted prospectivelyin the event that the Employee subsequently becomes regularly scheduled to work additional hours of service.19. Non−Transferability of Awards. Except as determined otherwise by the Administrator in its sole discretion (but never a transfer in exchange for value),Awards may not be sold, pledged, assigned, hypothecated, transferred, or disposed of in any manner other than by will or by the laws of descent ordistribution and may be exercised, during the lifetime of the Participant, only by the Participant, without the prior written consent of the Administrator.20. Stock Withholding to Satisfy Withholding Tax Obligations. When a Participant incurs tax liability in connection with the exercise, vesting or payout, asapplicable, of an Award, which tax liability is subject to tax withholding under applicable tax laws, and the Participant is obligated to pay the Company anamount required to be withheld under applicable tax laws, the Participant may satisfy the withholding tax obligation by electing to have the Companywithhold from the Shares to be issued upon exercise of the Option or SAR or the Shares to be issued upon payout or vesting of the other Award, if any, thatnumber of Shares having a Fair Market Value equal to the amount required to be withheld. The Fair Market Value of the Shares to be withheld shall bedetermined on the date that the amount of tax to be withheld is to be determined (the “Tax Date”).
−17−
All elections by a Participant to have Shares withheld for this purpose shall be made in writing in a form acceptable to the Administrator and shall besubject to the following restrictions: (a) the election must be made on or prior to the applicable Tax Date; and (b) all elections shall be subject to the consent or disapproval of the Administrator. In the event the election to have Shares subject to an Award withheld is made by a Participant and the Tax Date is deferred under Section 83 of the Codebecause no election is filed under Section 83(b) of the Code, the Participant shall receive the full number of Shares with respect to which the Option or SARis exercised or other Award is vested but such Participant shall be unconditionally obligated to tender back to the Company the proper number of Shares onthe Tax Date.21. Adjustments Upon Changes in Capitalization, Dissolution, Merger or Asset Sale. (a) Changes in Capitalization. Subject to any required action by the shareholders of the Company, the number of shares of Common Stock covered byeach outstanding Award, and the number of shares of Common Stock which have been authorized for issuance under the Plan but as to which no Awardshave yet been granted or which have been returned to the Plan upon cancellation or expiration of an Award, as well as the price per share of Common Stockcovered by each such outstanding Award, the annual share limitations under Sections 6(a) and (b) hereof, and the number of Shares subject to ongoingautomatic First Option and Annual Award grants to Outside Directors under Section 11 hereof shall be proportionately adjusted for any increase or decreasein the number of issued shares of Common Stock resulting from a stock split, reverse stock split, stock dividend, combination or reclassification of theCommon Stock, or any other increase or decrease in the number of issued shares of Common Stock effected without receipt of consideration by theCompany; provided, however, that conversion of any convertible securities of the Company shall not be deemed to have been “effected without receipt ofconsideration.” Such adjustment shall be made by the Board, whose determination in that respect shall be final, binding and conclusive. Except as expresslyprovided herein, no issuance by the Company of shares of stock of any class, or securities convertible into shares of stock of any class, shall affect, and noadjustment by reason thereof shall be made with respect to, the number or price of shares of Common Stock subject to an Award. (b) Dissolution or Liquidation. In the event of the proposed dissolution or liquidation of the Company, the Administrator shall notify each Participant assoon as practicable prior to the effective date of such proposed transaction. The Administrator in its discretion (but not with respect to Options granted toOutside Directors) may provide for a Participant to have the right to exercise his or her Option or SAR until ten (10) days prior to such transaction as to allof the Awarded Stock covered thereby, including Shares as to which the Award would not otherwise be exercisable. In addition, the Administrator mayprovide that any Company repurchase option or forfeiture rights applicable to any Award shall lapse 100%, and that any Award vesting shall accelerate100%, provided the proposed dissolution or liquidation takes place at the time and in the manner contemplated. To the extent it has not been previouslyexercised (with respect to
−18−
Options and SARs) or vested (with respect to other Awards), an Award will terminate immediately prior to the consummation of such proposed action. (c) Merger or Asset Sale. (i) Stock Options and SARs. In the event of a merger of the Company with or into another corporation, or the sale of substantially all of the assets ofthe Company, each outstanding Option and SAR shall be assumed or an equivalent option or SAR substituted by the successor corporation or a Parent orSubsidiary of the successor corporation. In the event that the successor corporation refuses to assume or substitute for the Option or SAR, the Participantshall fully vest in and have the right to exercise the Option or SAR as to all of the Awarded Stock, including Shares as to which it would not otherwise bevested or exercisable. If an Option or SAR becomes fully vested and exercisable in lieu of assumption or substitution in the event of a merger or asset sale,the Administrator shall notify the Participant in writing or electronically that the Option or SAR shall be fully vested and exercisable for a period of thirty(30) days from the date of such notice, and the Option or SAR shall terminate upon the expiration of such period. With respect to Options granted to OutsideDirectors, in the event that the Outside Director is required to terminate his or her position as an Outside Director at the request of the acquiring entitywithin 12 months following such merger or asset sale, each outstanding Option held by such Outside Director shall become fully vested and exercisable,including as to Shares as to which it would not otherwise be exercisable, unless the Board, in its discretion, determines otherwise. (ii) Restricted Stock, Restricted Stock Units, Performance Shares, Performance Units, Deferred Stock Units and Dividend Equivalents. In the event ofa merger of the Company with or into another corporation, or the sale of substantially all of the assets of the Company, each outstanding Restricted Stock,Restricted Stock Unit, Performance Share, Performance Unit, Dividend Equivalent and Deferred Stock Unit award (and any related Dividend Equivalent)shall be assumed or an equivalent Restricted Stock, Restricted Stock Unit, Performance Share, Performance Unit, Dividend Equivalent and Deferred StockUnit award (and any related Dividend Equivalent) substituted by the successor corporation or a Parent or Subsidiary of the successor corporation. In theevent that the successor corporation refuses to assume or substitute for the Restricted Stock, Restricted Stock Unit, Performance Share, Performance Unit,Dividend Equivalent and Deferred Stock Unit award (and any related Dividend Equivalent), the Participant shall fully vest in the Restricted Stock,Restricted Stock Unit, Performance Share, Performance Unit, Dividend Equivalent and Deferred Stock Unit award (and any related Dividend Equivalent),including as to Shares (or with respect to Dividend Equivalents and Performance Units, the cash equivalent thereof) which would not otherwise be vested.For the purposes of this paragraph, a Restricted Stock, Restricted Stock Unit, Performance Share, Performance Unit, Dividend Equivalent and DeferredStock Unit award (and any related Dividend Equivalent) shall be considered assumed if, following the merger or asset sale, the award confers the right topurchase or receive, for each Share (or with respect to Dividend Equivalents and Performance Units, the cash equivalent thereof) subject to the Awardimmediately prior to the merger or asset sale, the consideration (whether stock, cash, or other securities or property) received in the merger or asset sale byholders of the Company’s common stock for each Share held on the effective date of the transaction (and if holders were offered a
−19−
choice of consideration, the type of consideration chosen by the holders of a majority of the outstanding Shares); provided, however, that if suchconsideration received in the merger or asset sale is not solely common stock of the successor corporation or its Parent, the Administrator may, with theconsent of the successor corporation, provide for the consideration to be received, for each Share and each unit/right to acquire a Share subject to the Award(other than Dividend Equivalents and Performance Units) to be solely common stock of the successor corporation or its Parent equal in fair market value tothe per share consideration received by holders of the Company’s common stock in the merger or asset sale.22. Time of Granting Awards. The date of grant of an Award shall, for all purposes, be the date on which the Administrator makes the determinationgranting such Award. Notice of the determination shall be given to each Employee or Consultant to whom an Award is so granted within a reasonable timeafter the date of such grant.23. Term of Plan. The Plan shall continue in effect until March 1, 2016 .24. Amendment and Termination of the Plan. (a) Amendment and Termination. The Board may at any time amend, alter, suspend or terminate the Plan. (b) Shareholder Approval. The Company shall obtain shareholder approval of any Plan amendment to the extent necessary and desirable to comply withRule 16b−3 or with Section 422 of the Code (or any successor rule or statute or other applicable law, rule or regulation, including the requirements of anyexchange or quotation system on which the Common Stock is listed or quoted). Such shareholder approval, if required, shall be obtained in such a mannerand to such a degree as is required by the applicable law, rule or regulation. (c) Effect of Amendment or Termination. No amendment, alteration, suspension or termination of the Plan shall impair the rights of any Participant,unless mutually agreed otherwise between the Participant and the Administrator, which agreement must be in writing and signed by the Participant and theCompany.25. Conditions Upon Issuance of Shares. Shares shall not be issued pursuant to the exercise of an Option unless the exercise of such Option and the issuanceand delivery of such Shares pursuant thereto shall comply with all relevant provisions of law, including, without limitation, the Securities Act, the ExchangeAct, the rules and regulations promulgated thereunder, state securities laws, and the requirements of any stock exchange upon which the Shares may then belisted, and shall be further subject to the approval of counsel for the Company with respect to such compliance. As a condition to the exercise or payout, as applicable, of an Award, the Company may require the person exercising such Option or SAR, or in the caseof another Award (other than a Dividend Equivalent or Performance Unit), the person receiving the Shares upon vesting, to render to the Company a writtenstatement containing such representations and warranties as, in the opinion of counsel for the Company, may be required to ensure compliance with any ofthe
−20−

aforementioned relevant provisions of law, including a representation that the Shares are being purchased only for investment and without any presentintention to sell or distribute such Shares, if, in the opinion of counsel for the Company, such a representation is required.26. Reservation of Shares. The Company, during the term of this Plan, will at all times reserve and keep available such number of Shares as shall besufficient to satisfy the requirements of the Plan. Inability of the Company to obtain authority from any regulatory body having jurisdiction, which authorityis deemed by the Company’s counsel to be necessary to the lawful issuance and sale of any Shares hereunder, shall relieve the Company of any liability inrespect of the failure to issue or sell such Shares as to which such requisite authority shall not have been obtained.
−21−
Exhibit 31.1CERTIFICATION
I, Kevin R. Johnson, certify that:1. I have reviewed this quarterly report on Form 10−Q of Juniper Networks, Inc.;
2. Based on my knowledge, this report does not contain any untrue statement of a material fact or omit to state a material fact necessary to make thestatements made, in light of the circumstances under which such statements were made, not misleading with respect to the period covered by thisreport;
3. Based on my knowledge, the financial statements, and other financial information included in this report, fairly present in all material respects thefinancial condition, results of operations and cash flows of the registrant as of, and for, the periods presented in this report;
4. The registrant’s other certifying officer(s) and I are responsible for establishing and maintaining disclosure controls and procedures (as defined inExchange Act Rules 13a−15(e) and 15d−15(e)) and internal control over financial reporting (as defined in Exchange Act Rules 13a−15(f) and15d−15(f)) for the registrant and have:(a) Designed such disclosure controls and procedures, or caused such disclosure controls and procedures to be designed under our supervision, to
ensure that material information relating to the registrant, including its consolidated subsidiaries, is made known to us by others within thoseentities, particularly during the period in which this report is being prepared;
(b) Designed such internal control over financial reporting, or caused such internal control over financial reporting to be designed under oursupervision, to provide reasonable assurance regarding the reliability of financial reporting and the preparation of financial statements forexternal purposes in accordance with generally accepted accounting principles;
(c) Evaluated the effectiveness of the registrant’s disclosure controls and procedures and presented in this report our conclusions about theeffectiveness of the disclosure controls and procedures, as of the end of the period covered by this report based on such evaluation; and
(d) Disclosed in this report any change in the registrant’s internal control over financial reporting that occurred during the registrant’s most recentfiscal quarter (the registrant’s fourth fiscal quarter in the case of an annual report) that has materially affected, or is reasonably likely tomaterially affect, the registrant’s internal control over financial reporting; and
5. The registrant’s other certifying officer(s) and I have disclosed, based on our most recent evaluation of internal control over financial reporting, to theregistrant’s auditors and the audit committee of the registrant’s board of directors (or persons performing the equivalent functions):(a) All significant deficiencies and material weaknesses in the design or operation of internal control over financial reporting which are reasonably
likely to adversely affect the registrant’s ability to record, process, summarize, and report financial information; and(b) Any fraud, whether or not material, that involves management or other employees who have a significant role in the registrant’s internal control
over financial reporting.Date: August 6, 2010
/s/ Kevin R. Johnson
Kevin R. JohnsonChief Executive Officer
Exhibit 31.2CERTIFICATION
I, Robyn M. Denholm, certify that:1. I have reviewed this quarterly report on Form 10−Q of Juniper Networks, Inc.;
2. Based on my knowledge, this report does not contain any untrue statement of a material fact or omit to state a material fact necessary to make thestatements made, in light of the circumstances under which such statements were made, not misleading with respect to the period covered by thisreport;
3. Based on my knowledge, the financial statements, and other financial information included in this report, fairly present in all material respects thefinancial condition, results of operations and cash flows of the registrant as of, and for, the periods presented in this report;
4. The registrant’s other certifying officer(s) and I are responsible for establishing and maintaining disclosure controls and procedures (as defined inExchange Act Rules 13a−15(e) and 15d−15(e)) and internal control over financial reporting (as defined in Exchange Act Rules 13a−15(f) and15d−15(f)) for the registrant and have:(a) Designed such disclosure controls and procedures, or caused such disclosure controls and procedures to be designed under our supervision, to
ensure that material information relating to the registrant, including its consolidated subsidiaries, is made known to us by others within thoseentities, particularly during the period in which this report is being prepared;
(b) Designed such internal control over financial reporting, or caused such internal control over financial reporting to be designed under oursupervision, to provide reasonable assurance regarding the reliability of financial reporting and the preparation of financial statements forexternal purposes in accordance with generally accepted accounting principles;
(c) Evaluated the effectiveness of the registrant’s disclosure controls and procedures and presented in this report our conclusions about theeffectiveness of the disclosure controls and procedures, as of the end of the period covered by this report based on such evaluation; and
(d) Disclosed in this report any change in the registrant’s internal control over financial reporting that occurred during the registrant’s most recentfiscal quarter (the registrant’s fourth fiscal quarter in the case of an annual report) that has materially affected, or is reasonably likely tomaterially affect, the registrant’s internal control over financial reporting; and
5. The registrant’s other certifying officer(s) and I have disclosed, based on our most recent evaluation of internal control over financial reporting, to theregistrant’s auditors and the audit committee of the registrant’s board of directors (or persons performing the equivalent functions):(a) All significant deficiencies and material weaknesses in the design or operation of internal control over financial reporting which are reasonably
likely to adversely affect the registrant’s ability to record, process, summarize, and report financial information; and
(b) Any fraud, whether or not material, that involves management or other employees who have a significant role in the registrant’s internal controlover financial reporting.
Date: August 6, 2010
/s/ Robyn M. Denholm
Robyn M. DenholmExecutive Vice President and Chief Financial Officer

Exhibit 32.1Certification of Chief Executive Officer
Pursuant to 18 U.S.C. Section 1350 As AdoptedPursuant to Section 906 of the Sarbanes−Oxley Act of 2002
I, Kevin R. Johnson, certify, pursuant to 18 U.S.C. Section 1350, as adopted pursuant to Section 906 of the Sarbanes−Oxley Act of 2002, that theQuarterly Report of Juniper Networks, Inc. on Form 10−Q for the three months ended June 30, 2010, fully complies with the requirements of Section 13(a)or 15(d) of the Securities Exchange Act of 1934 and that information contained in such Quarterly Report on Form 10−Q fairly presents, in all materialrespects, the financial condition and results of operations of Juniper Networks, Inc.
/s/ Kevin R. Johnson
Kevin R. JohnsonChief Executive OfficerAugust 6, 2010

Exhibit 32.2Certification of Chief Financial Officer
Pursuant to 18 U.S.C. Section 1350 As AdoptedPursuant to Section 906 of the Sarbanes−Oxley Act of 2002
I, Robyn M. Denholm, certify, pursuant to 18 U.S.C. Section 1350, as adopted pursuant to Section 906 of the Sarbanes−Oxley Act of 2002, that theQuarterly Report of Juniper Networks, Inc. on Form 10−Q for the three months ended June 30, 2010, fully complies with the requirements of Section 13(a)or 15(d) of the Securities Exchange Act of 1934 and that information contained in such Quarterly Report on Form 10−Q fairly presents, in all materialrespects, the financial condition and results of operations of Juniper Networks, Inc.
/s/ Robyn M. Denholm
Robyn M. DenholmExecutive Vice President and ChiefFinancial OfficerAugust 6, 2010