jpm guide to markets
TRANSCRIPT

8/8/2019 JPM Guide to Markets
http://slidepdf.com/reader/full/jpm-guide-to-markets 1/58
As of September 30, 2010

8/8/2019 JPM Guide to Markets
http://slidepdf.com/reader/full/jpm-guide-to-markets 2/58
1
8/8/2019 JPM Guide to Markets
http://slidepdf.com/reader/full/jpm-guide-to-markets 3/58
2
Jan-10 Mar-10 May -10 Jul-10 Sep-101,000
1,050
1,100
1,150
1,200
1,250
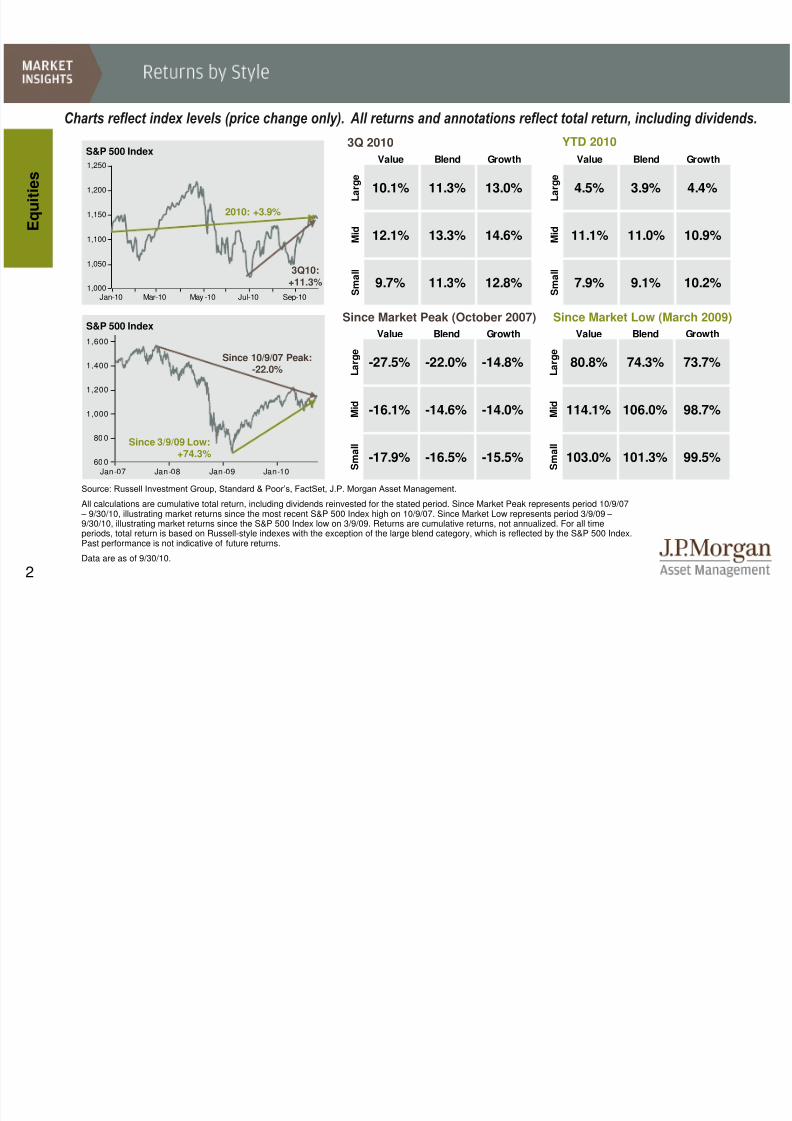
Source: Russell Investment Group, Standard & Poor’s, FactSet, J.P. Morgan Asset Management.
All calculations are cumulative total return, including dividends reinvested for the stated period. Since Market Peak represents period 10/9/07 – 9/30/10, illustrating market returns since the most recent S&P 500 Index high on 10/9/07. Since Market Low represents period 3/9/09 – 9/30/10, illustrating market returns since the S&P 500 Index low on 3/9/09. Returns are cumulative returns, not annualized. For all timeperiods, total return is based on Russell-style indexes with the exception of the large blend category, which is reflected by the S&P 500 Index.Past performance is not indicative of future returns.
Data are as of 9/30/10.
E q u i t i e s
Jan-07 Jan-08 Jan-09 Jan-1060 0
80 0
1,000
1,200
1,400
1,600
S&P 500 Index
S&P 500 Index
2010: +3.9%
3Q10:+11.3%
Since 10/9/07 Peak:-22.0%
3Q 2010
Since Market Low (March 2009)
YTD 2010
Since Market Peak (October 2007)
Charts reflect index levels (price change only). All returns and annotations reflect total return, including dividends.
Since 3/9/09 Low:+74.3%
Value Blend Growth Value Blend Growth
L a r g e
10.1% 11.3% 13.0% L a r g e
4.5% 3.9% 4.4%
M i d 12.1% 13.3% 14.6% M
i d 11.1% 11.0% 10.9%
S m a l l
9.7% 11.3% 12.8% S m a l l
7.9% 9.1% 10.2%
Value Blend Growth Value Blend Growth
L a r g e
-27.5% -22.0% -14.8% L a r g e
80.8% 74.3% 73.7%
M
i d
-16.1% -14.6% -14.0% M
i d
114.1% 106.0% 98.7%
S m a l l
-17.9% -16.5% -15.5% S m a l l
103.0% 101.3% 99.5%
8/8/2019 JPM Guide to Markets
http://slidepdf.com/reader/full/jpm-guide-to-markets 4/58
3
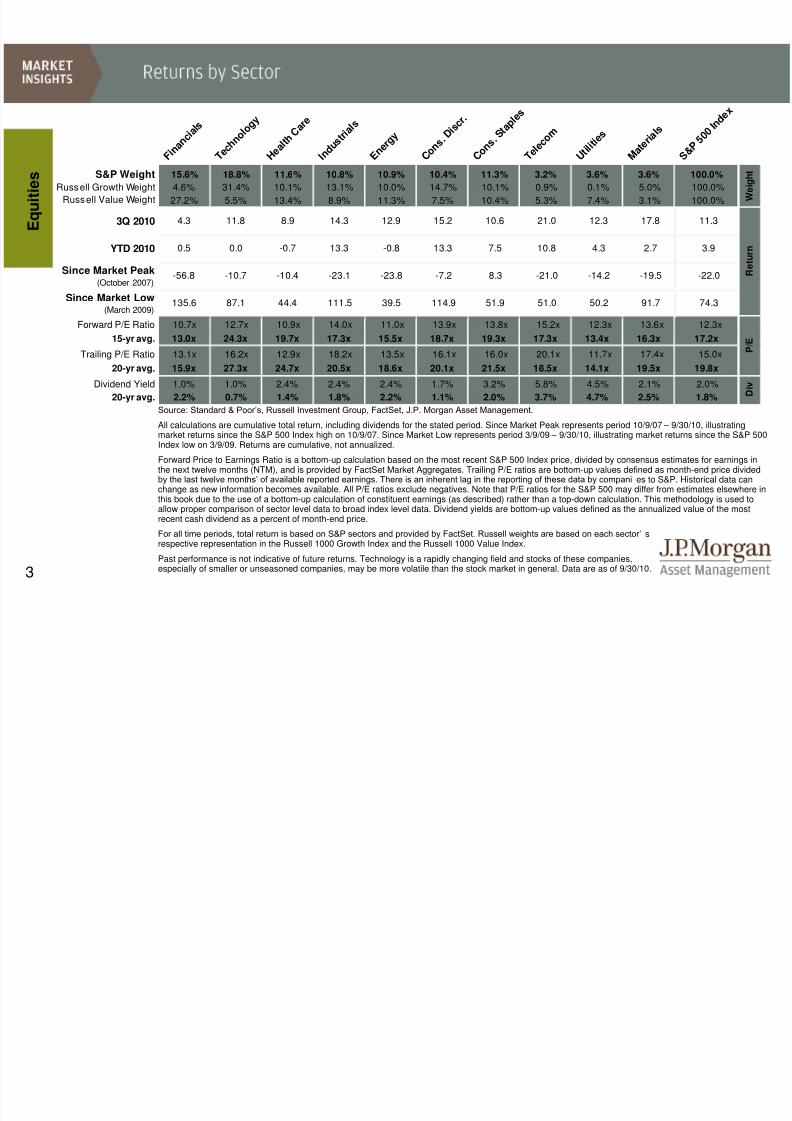
Source: Standard & Poor’s, Russell Investment Group, FactSet, J.P. Morgan Asset Management. All calculations are cumulative total return, including dividends for the stated period. Since Market Peak represents period 10/9/07 – 9/30/10, illustratingmarket returns since the S&P 500 Index high on 10/9/07. Since Market Low represents period 3/9/09 – 9/30/10, illustrating market returns since the S&P 500Index low on 3/9/09. Returns are cumulative, not annualized.
Forward Price to Earnings Ratio is a bottom-up calculation based on the most recent S&P 500 Index price, divided by consensus estimates for earnings inthe next twelve months (NTM), and is provided by FactSet Market Aggregates. Trailing P/E ratios are bottom-up values defined as month-end price dividedby the last twelve months’ of available reported earnings. There is an inherent lag in the reporting of these data by compani es to S&P. Historical data canchange as new information becomes available. All P/E ratios exclude negatives. Note that P/E ratios for the S&P 500 may differ from estimates elsewhere inthis book due to the use of a bottom-up calculation of constituent earnings (as described) rather than a top-down calculation. This methodology is used toallow proper comparison of sector level data to broad index level data. Dividend yields are bottom-up values defined as the annualized value of the mostrecent cash dividend as a percent of month-end price.
For all time periods, total return is based on S&P sectors and provided by FactSet. Russell weights are based on each sector’ srespective representation in the Russell 1000 Growth Index and the Russell 1000 Value Index.
Past performance is not indicative of future returns. Technology is a rapidly changing field and stocks of these companies,especially of smaller or unseasoned companies, may be more volatile than the stock market in general. Data are as of 9/30/10.
E q u i t i e s
F i n a n c i
a l s
T e c h n o
l o g y
H e a l t h
C a r e
I n d u s t r
i a l s
E n e r g y
C o n s . D
i s c r .
C o n s . S
t a p l e s
T e l e c o m
U t i l i t i e s
M a t e r i a
l s
S & P 5 0
0 I n d e x
S&P Weight 15.6% 18.8% 11.6% 10.8% 10.9% 10.4% 11.3% 3.2% 3.6% 3.6% 100.0%
Russell Growth Weight 4.6% 31.4% 10.1% 13.1% 10.0% 14.7% 10.1% 0.9% 0.1% 5.0% 100.0%
Russell Value Weight 27.2% 5.5% 13.4% 8.9% 11.3% 7.5% 10.4% 5.3% 7.4% 3.1% 100.0%
3Q 2010 4.3 11.8 8.9 14.3 12.9 15.2 10.6 21.0 12.3 17.8 11.3
YTD 2010 0.5 0.0 -0.7 13.3 -0.8 13.3 7.5 10.8 4.3 2.7 3.9
Since Market Peak(October 2007) -56.8 -10.7 -10.4 -23.1 -23.8 -7.2 8.3 -21.0 -14.2 -19.5 -22.0
Since Market Low(March 2009)
135.6 87.1 44.4 111.5 39.5 114.9 51.9 51.0 50.2 91.7 74.3
Forward P/E Ratio 10.7x 12.7x 10.9x 14.0x 11.0x 13.9x 13.8x 15.2x 12.3x 13.6x 12.3x
15-yr avg. 13.0x 24.3x 19.7x 17.3x 15.5x 18.7x 19.3x 17.3x 13.4x 16.3x 17.2x
Trailing P/E Ratio 13.1x 16.2x 12.9x 18.2x 13.5x 16.1x 16.0x 20.1x 11.7x 17.4x 15.0x
20-yr avg. 15.9x 27.3x 24.7x 20.5x 18.6x 20.1x 21.5x 18.5x 14.1x 19.5x 19.8x
Dividend Yield 1.0% 1.0% 2.4% 2.4% 2.4% 1.7% 3.2% 5.8% 4.5% 2.1% 2.0%
20-yr avg. 2.2% 0.7% 1.4% 1.8% 2.2% 1.1% 2.0% 3.7% 4.7% 2.5% 1.8%
P / E
W e i g h t
R e t u r n
D i v
8/8/2019 JPM Guide to Markets
http://slidepdf.com/reader/full/jpm-guide-to-markets 5/58
4
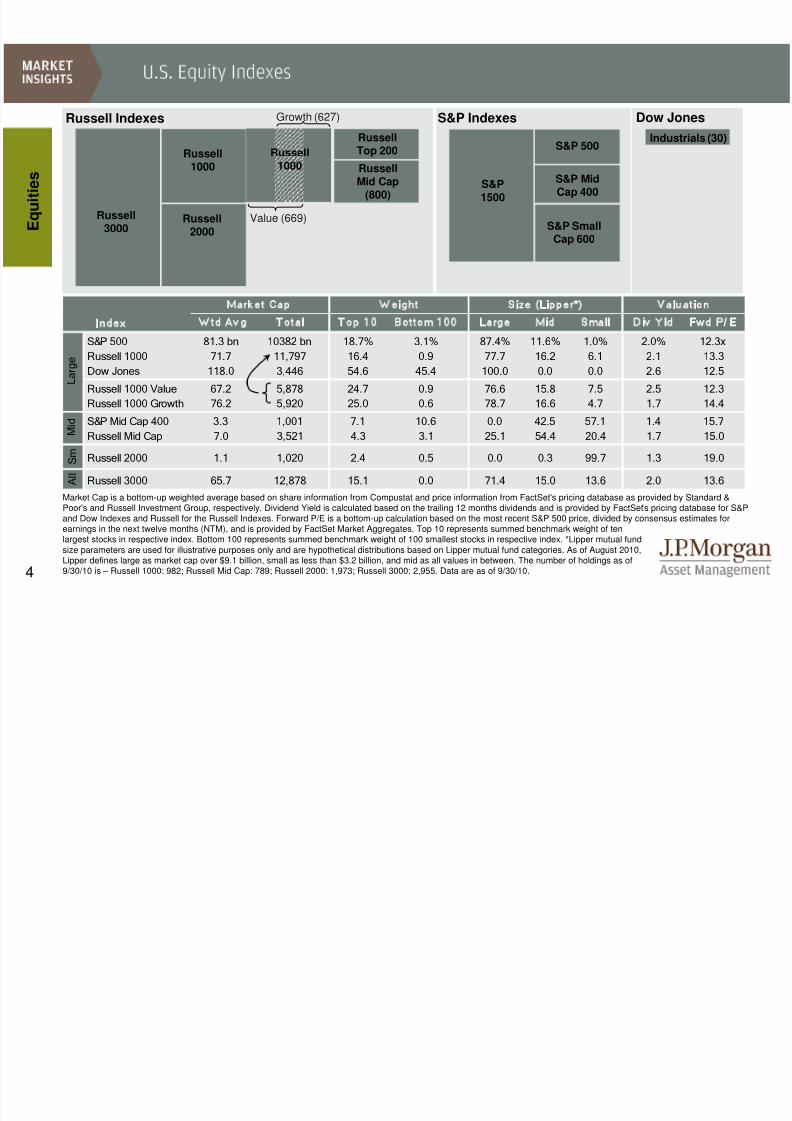
Index Wtd Avg Total Top 10 Bottom 100 Large Mid Small Div Yld Fwd P/ E
S&P500 81.3bn 10382bn 18.7% 3.1% 87.4% 11.6% 1.0% 2.0% 12.3x
Russell1000 71.7 11,797 16.4 0.9 77.7 16.2 6.1 2.1 13.3
DowJones 118.0 3,446 54.6 45.4 100.0 0.0 0.0 2.6 12.5
Russell1000Value 67.2 5,878 24.7 0.9 76.6 15.8 7.5 2.5 12.3
Russell1000Growth 76.2 5,920 25.0 0.6 78.7 16.6 4.7 1.7 14.4
S&PMidCap400 3.3 1,001 7.1 10.6 0.0 42.5 57.1 1.4 15.7
RussellMidCap 7.0 3,521 4.3 3.1 25.1 54.4 20.4 1.7 15.0
S mRussell2000 1.1 1,020 2.4 0.5 0.0 0.3 99.7 1.3 19.0
A l l
Russell3000 65.7 12,878 15.1 0.0 71.4 15.0 13.6 2.0 13.6
Size (Lipper*) Valuationeight
L a r g e
M i d
Market Cap
Russell1000
Russell Indexes
Russell1000
Russell2000
RussellTop 200
RussellMid Cap
(800)
S&P Indexes
Russell3000
S&P1500
S&P 500
S&P MidCap 400
S&P SmallCap 600
Industrials
Value (669)
Growth (627)
Russell1000
Industrials (30)
Dow Jones
E q u i t i e s
Market Cap is a bottom-up weighted average based on share information from Compustat and price information from FactSet's pricing database as provided by Standard &Poor's and Russell Investment Group, respectively. Dividend Yield is calculated based on the trailing 12 months dividends and is provided by FactSet ’s pricing database for S&Pand Dow Indexes and Russell for the Russell Indexes. Forward P/E is a bottom-up calculation based on the most recent S&P 500 price, divided by consensus estimates forearnings in the next twelve months (NTM), and is provided by FactSet Market Aggregates. Top 10 represents summed benchmark weight of tenlargest stocks in respective index. Bottom 100 represents summed benchmark weight of 100 smallest stocks in respective index. *Lipper mutual fund
size parameters are used for illustrative purposes only and are hypothetical distributions based on Lipper mutual fund categories. As of August 2010,Lipper defines large as market cap over $9.1 billion, small as less than $3.2 billion, and mid as all values in between. The number of holdings as of9/30/10 is – Russell 1000: 982; Russell Mid Cap: 789; Russell 2000: 1,973; Russell 3000: 2,955. Data are as of 9/30/10.
8/8/2019 JPM Guide to Markets
http://slidepdf.com/reader/full/jpm-guide-to-markets 6/58
5
'97 '98 '99 '00 '01 '02 '03 '04 '05 '06 '07 '08 '09 '10
600
800
1,000
1,200
1,400
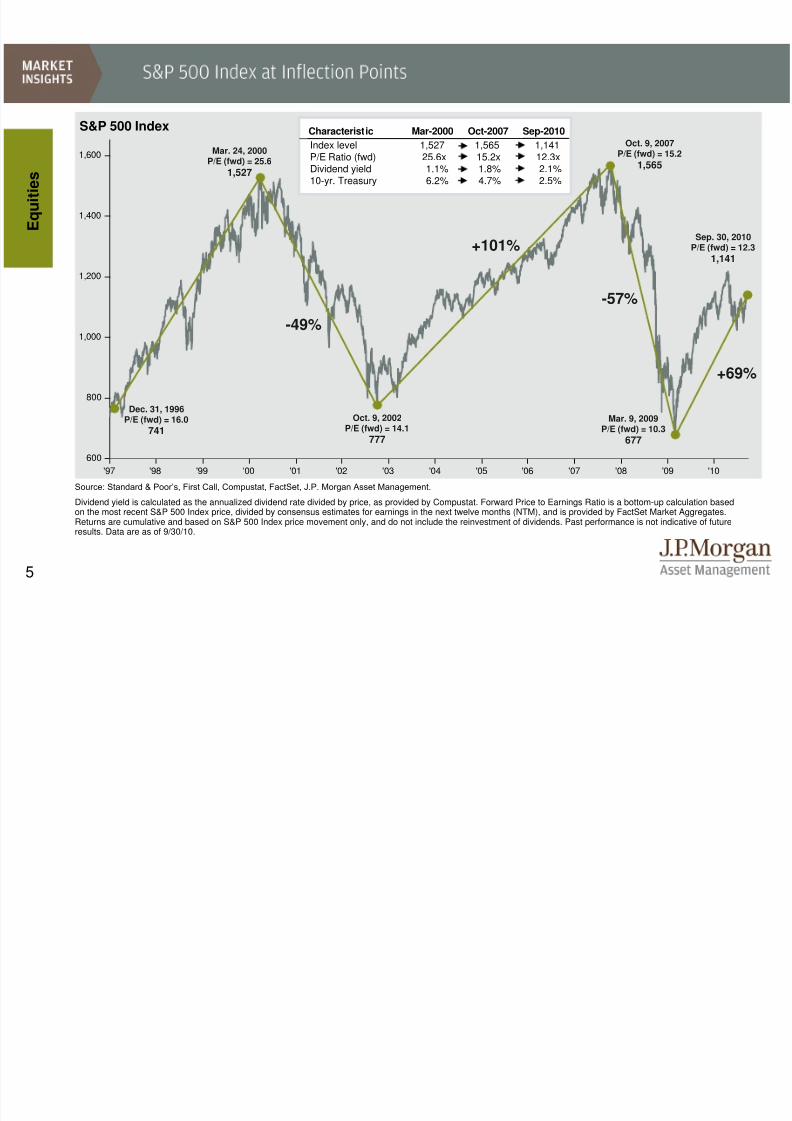
1,600Index level 1,527 1,565 1,141P/E Ratio (fwd) 25.6x 15.2x 12.3xDividend yield 1.1% 1.8% 2.1%10-yr. Treasury 6.2% 4.7% 2.5%
Source: Standard & Poor’s, First Call, Compustat, FactSet, J.P. Morgan Asset Management.
Dividend yield is calculated as the annualized dividend rate divided by price, as provided by Compustat. Forward Price to Earnings Ratio is a bottom-up calculation basedon the most recent S&P 500 Index price, divided by consensus estimates for earnings in the next twelve months (NTM), and is provided by FactSet Market Aggregates.Returns are cumulative and based on S&P 500 Index price movement only, and do not include the reinvestment of dividends. Past performance is not indicative of futureresults. Data are as of 9/30/10.
S&P 500 Index
-49%
E q u i t i e s
Oct. 9, 2002P/E (fwd) = 14.1
777
Mar. 24, 2000P/E (fwd) = 25.6
1,527
Dec. 31, 1996P/E (fwd) = 16.0
741
Sep. 30, 2010P/E (fwd) = 12.3
1,141+101%
Oct. 9, 2007P/E (fwd) = 15.2
1,565
-57%
Mar. 9, 2009P/E (fwd) = 10.3
677
+69%
Characteristic Mar-2000 Oct-2007 Sep-2010
8/8/2019 JPM Guide to Markets
http://slidepdf.com/reader/full/jpm-guide-to-markets 7/586
39.7%
19.6%
13.6%
10.7%
9.0%
7.9%
7.1%
6.5%
6.1%
5.7%
1 Yrs
2 Yrs
3 Yrs
4 Yrs
5 Yrs
6 Yrs
7 Yrs
8 Yrs
9 Yrs
10 Yrs
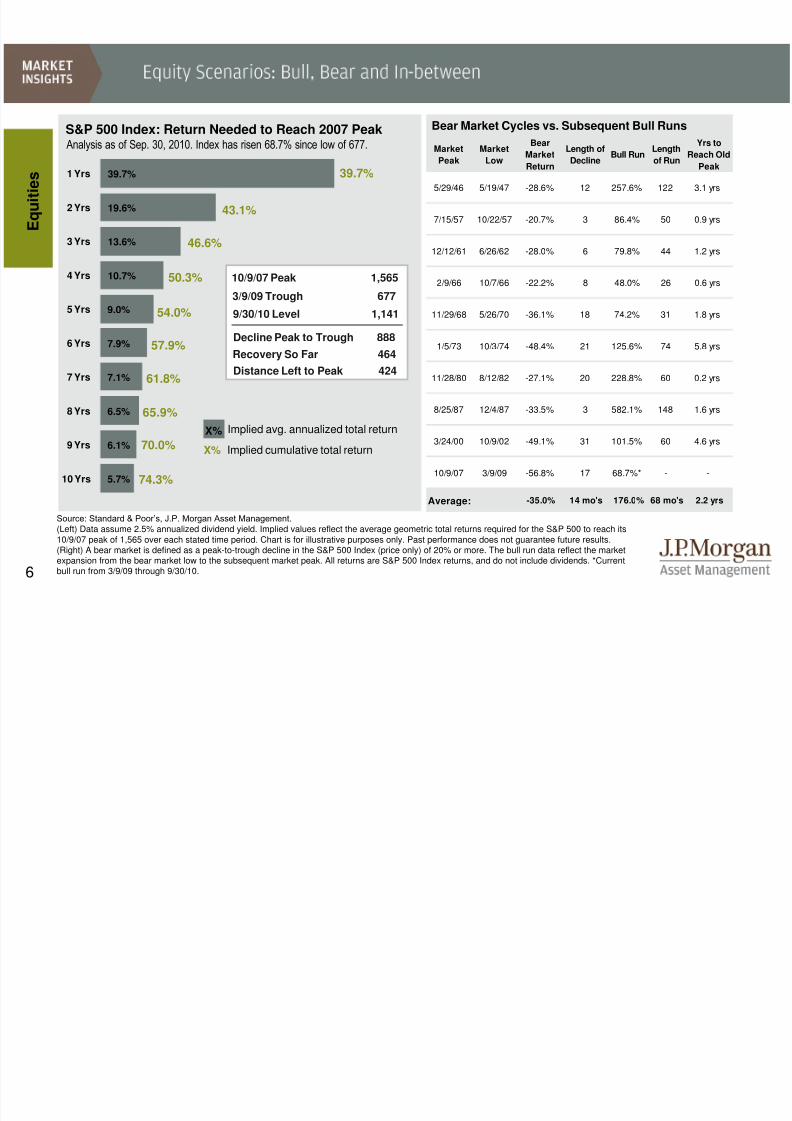
10/9/07 Peak 1,565
Distance Left to Peak 424
E q u i t i e s
S&P 500 Index: Return Needed to Reach 2007 Peak
Source: Standard & Poor’s, J.P. Morgan Asset Management.
(Left) Data assume 2.5% annualized dividend yield. Implied values reflect the average geometric total returns required for the S&P 500 to reach its10/9/07 peak of 1,565 over each stated time period. Chart is for illustrative purposes only. Past performance does not guarantee future results.
(Right) A bear market is defined as a peak-to-trough decline in the S&P 500 Index (price only) of 20% or more. The bull run data reflect the marketexpansion from the bear market low to the subsequent market peak. All returns are S&P 500 Index returns, and do not include dividends. *Currentbull run from 3/9/09 through 9/30/10.
Implied avg. annualized total return
Implied cumulative total returnX%
Analysis as of Sep. 30, 2010. Index has risen 68.7% since low of 677.
X%
39.7%
43.1%
46.6%
50.3%
54.0%
57.9%
61.8%
65.9%
70.0%
74.3%
Recovery So Far 464
Decline Peak to Trough 888
9/30/10 Level 1,141
3/9/09 Trough 677
Bear Market Cycles vs. Subsequent Bull Runs
Market
Peak
Market
Low
Bear
Market
Return
Length of
DeclineBull Run
Length
of Run
Yrs to
Reach Old
Peak
5/29/46 5/19/47 -28.6% 12 257.6% 122 3.1 yrs
7/15/57 10/22/57 -20.7% 3 86.4% 50 0.9 yrs
12/12/61 6/26/62 -28.0% 6 79.8% 44 1.2 yrs
2/9/66 10/7/66 -22.2% 8 48.0% 26 0.6 yrs
11/29/68 5/26/70 -36.1% 18 74.2% 31 1.8 yrs
1/5/73 10/3/74 -48.4% 21 125.6% 74 5.8 yrs
11/28/80 8/12/82 -27.1% 20 228.8% 60 0.2 yrs
8/25/87 12/4/87 -33.5% 3 582.1% 148 1.6 yrs
3/24/00 10/9/02 -49.1% 31 101.5% 60 4.6 yrs
10/9/07 3/9/09 -56.8% 17 68.7%* - -
Average: -35.0% 14 mo's 176.0% 68 mo's 2.2 yrs
8/8/2019 JPM Guide to Markets
http://slidepdf.com/reader/full/jpm-guide-to-markets 8/587
'01 '02 '03 '04 '05 '06 '07 '08 '09 '10$0
$2 0
$4 0
$6 0
$8 0
$100
$120
'94 '96 '98 '00 '02 '04 '06 '08 '108x
12 x
16 x
20 x
24 x
28 x
E q u i t i e s
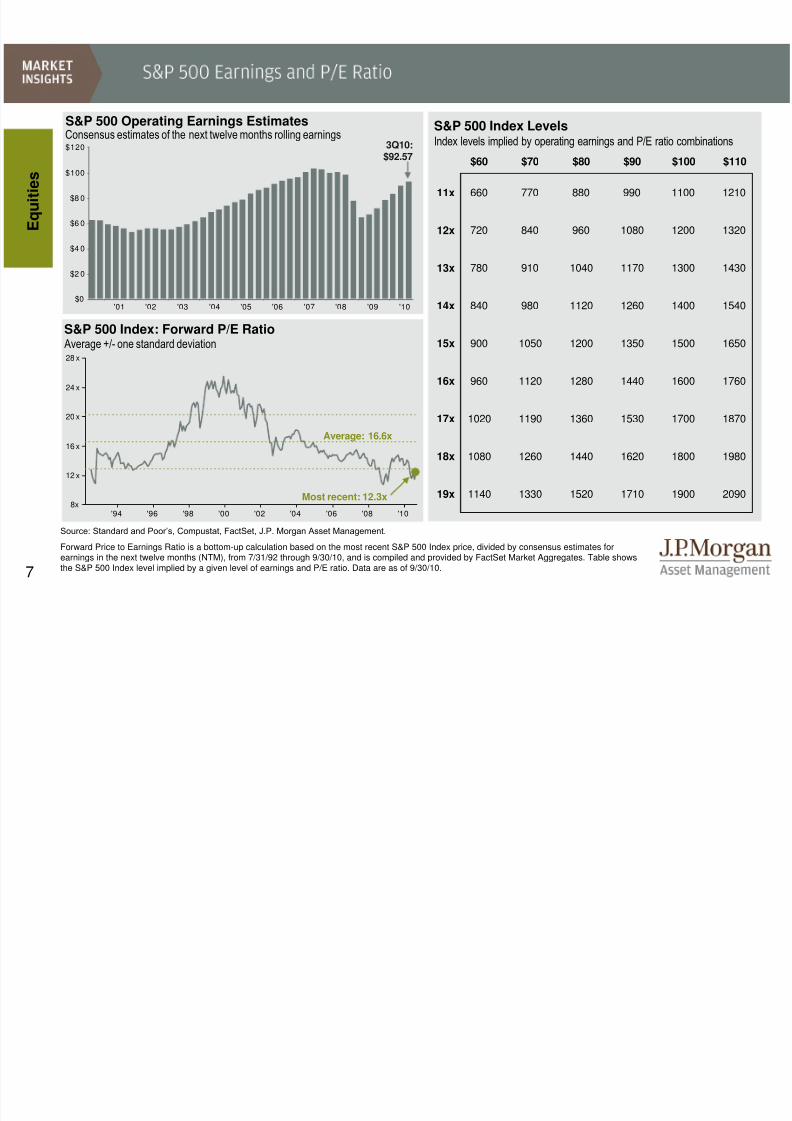
Source: Standard and Poor’s, Compustat, FactSet, J.P. Morgan Asset Management.
Forward Price to Earnings Ratio is a bottom-up calculation based on the most recent S&P 500 Index price, divided by consensus estimates forearnings in the next twelve months (NTM), from 7/31/92 through 9/30/10, and is compiled and provided by FactSet Market Aggregates. Table showsthe S&P 500 Index level implied by a given level of earnings and P/E ratio. Data are as of 9/30/10.
S&P 500 Index: Forward P/E Ratio
S&P 500 Operating Earnings Estimates S&P 500 Index Levels
Index levels implied by operating earnings and P/E ratio combinations
Average: 16.6x
3Q10:$92.57
Consensus estimates of the next twelve months rolling earnings
Most recent: 12.3x
Average +/- one standard deviation
$60 $70 $80 $90 $100 $110
11x 660 770 880 990 1100 1210
12x 720 840 960 1080 1200 1320
13x 780 910 1040 1170 1300 1430
14x 840 980 1120 1260 1400 1540
15x 900 1050 1200 1350 1500 1650
16x 960 1120 1280 1440 1600 1760
17x 1020 1190 1360 1530 1700 1870
18x 1080 1260 1440 1620 1800 1980
19x 1140 1330 1520 1710 1900 2090
8/8/2019 JPM Guide to Markets
http://slidepdf.com/reader/full/jpm-guide-to-markets 9/588
$
$20
$40
$60
$80
$100
$120
'10'09'08'07'06'05'04'03'02'01'00'99'98'97'96'95'94'93
'93 '94 '95 '96 '97 '98 '99 '00 '01 '02 '03 '04 '05 '06 '07 '08 '09 '10
12x
16x
20x
24x
60
80
100
120
E q u i t i e s
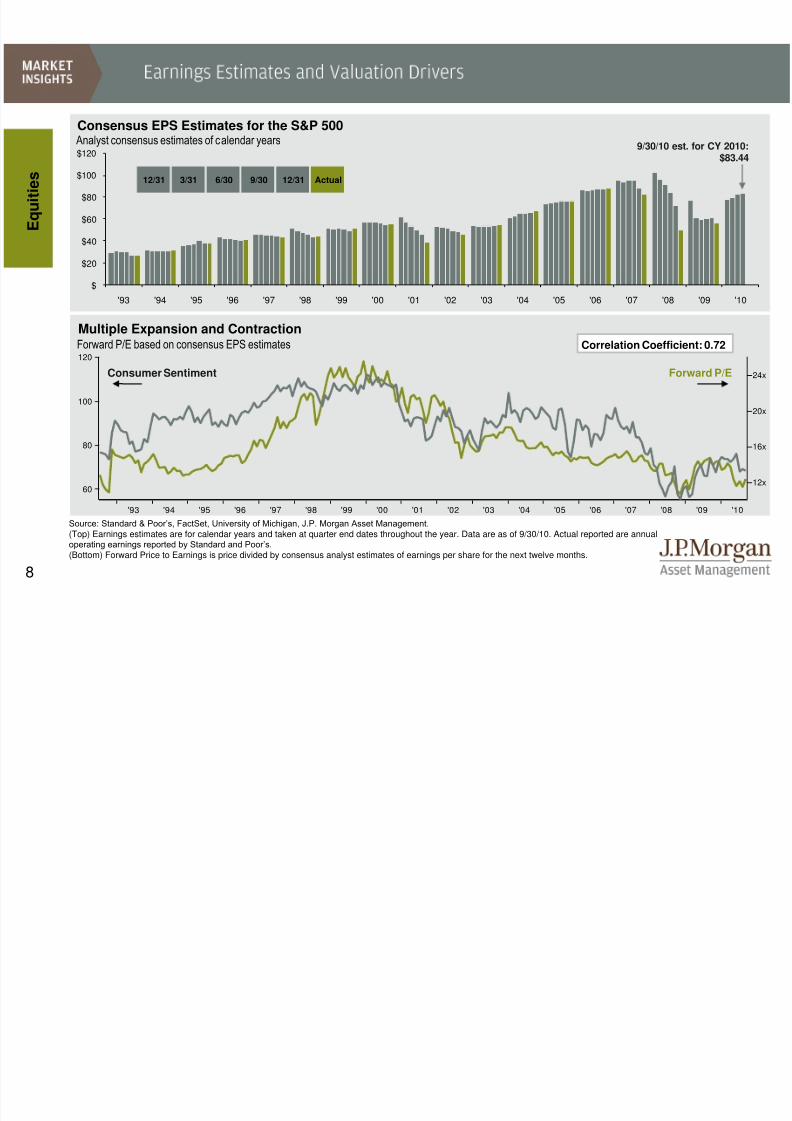
Consensus EPS Estimates for the S&P 500
Analyst consensus estimates of calendar years
Source: Standard & Poor’s, FactSet, University of Michigan, J.P. Morgan Asset Management.
(Top) Earnings estimates are for calendar years and taken at quarter end dates throughout the year. Data are as of 9/30/10. Actual reported are annualoperating earnings reported by Standard and Poor’s.
(Bottom) Forward Price to Earnings is price divided by consensus analyst estimates of earnings per share for the next twelve months.
Forward P/EConsumer Sentiment
Multiple Expansion and ContractionForward P/E based on consensus EPS estimates Correlation Coefficient: 0.72
9/30/10 est. for CY 2010:$83.44
12/31 3/31 6/30 9/30 12/31 Actual

8/8/2019 JPM Guide to Markets
http://slidepdf.com/reader/full/jpm-guide-to-markets 10/589
S&P 500 Index: Valuation Measures Historical Averages
ValuationMeasure Description
Latest 1-yearago
3-yearavg.
5-yearavg.
10-yearavg.
15-yearavg.
P/E Price to Earnings 12.3x 14.7x 13.2x 13.8x 15.8x 17.2x
P/B Price to Book 2.1 2.1 2.2 2.4 2.8 3.2
P/CF Price to Cash Flow 8.3 8.7 8.5 9.3 10.8 11.2
P/S Price to Sales 1.1 1.1 1.1 1.2 1.4 1.5
Div. Yield Dividend Yield 2.1% 2.1% 2.3% 2.2% 1.9% 1.9%
'94 '96 '98 '00 '02 '04 '06 '08 '103%
4%
5%
6%
7%
8%
9%
10%
'70 '75 '80 '85 '90 '95 '00 '05 '100.0x
0.5x
1.0x
1.5x
2.0x
E q u i t i e s
Q-Ratio: Stock Price Relative to Company Assets
M or e
A t t r a c t i v e
L e s s A t t r a c t i v e
Price to net asset value, all U.S. non-financial corporationsS&P 500 Earnings Yield vs. Baa Bond Yield
S&P 500 Earnings Yield:(Inverse of fwd. P/E) 8.1%
Moody’s Baa Yield: 5.6%
Source: (Top) Standard & Poor’s, FactSet, J.P. Morgan Asset Management.
Price to Earnings is price divided by consensus analyst estimates of earnings per share for the next twelve months. Price to Book is price divided by book value per share. Datapost-1992 include intangibles and are provided by Standard & Poor’s. Price to Cash Flow is price divided by consensus analyst es timates of cash flow per share for the nexttwelve months. Price to Sales is calculated as price divided by consensus analyst estimates of sales per share for the next twelve months. Dividend Yield is calculated asconsensus analyst estimates of dividends for the next twelve months divided by price. All consensus analyst estimates are provided by FactSet. (Bottom left) Q-Ratio based ondata from the Federal Reserve, table B.102. 3Q10 is an estimate provided by J.P. Morgan Asset Management as of 9/30/10.(Bottom right) Standard & Poor’s, Moody’s, J.P. Morgan Asset Management.
Data are as of 9/30/10.
Most recent:1.0x
40-yr. avg. = 0.8x
8/8/2019 JPM Guide to Markets
http://slidepdf.com/reader/full/jpm-guide-to-markets 11/5810
'96 '98 '00 '02 '04 '06 '08 '10$12
$16
$20
$24
$28
$32
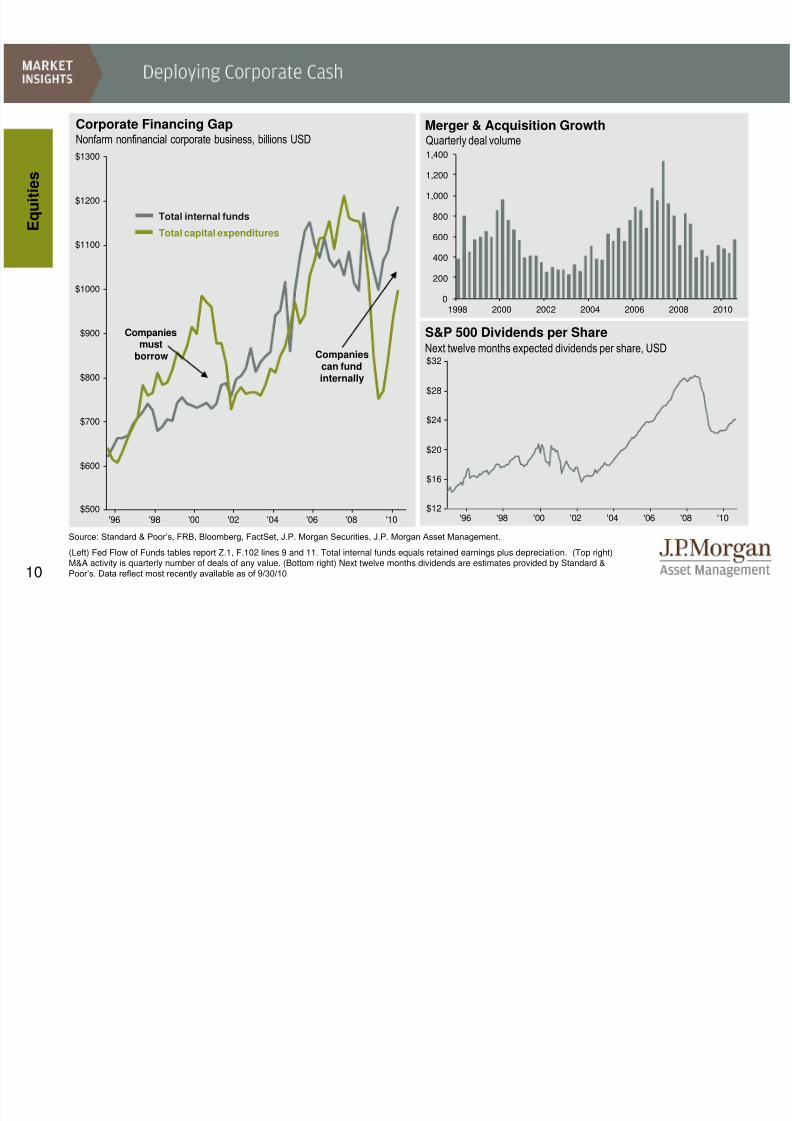
S&P 500 Dividends per Share
Merger & Acquisition Growth
Quarterly deal volume
Next twelve months expected dividends per share, USD
Source: Standard & Poor’s, FRB, Bloomberg, FactSet, J.P. Morgan Securities, J.P. Morgan Asset Management.
(Left) Fed Flow of Funds tables report Z.1, F.102 lines 9 and 11. Total internal funds equals retained earnings plus depreciation. (Top right)M&A activity is quarterly number of deals of any value. (Bottom right) Next twelve months dividends are estimates provided by Standard &Poor’s. Data reflect most recently available as of 9/30/10.
E q u i t i e s
'96 '98 '00 '02 '04 '06 '08 '10$500
$600
$700
$800
$900
$1000
$1100
$1200
$1300
Corporate Financing Gap
Nonfarm nonfinancial corporate business, billions USD
Total internal funds
Total capital expenditures
Companiesmust
borrow Companiescan fundinternally
0
200
400
600
800
1,000
1,200
1,400
1998 2000 2002 2004 2006 2008 2010
8/8/2019 JPM Guide to Markets
http://slidepdf.com/reader/full/jpm-guide-to-markets 12/5811
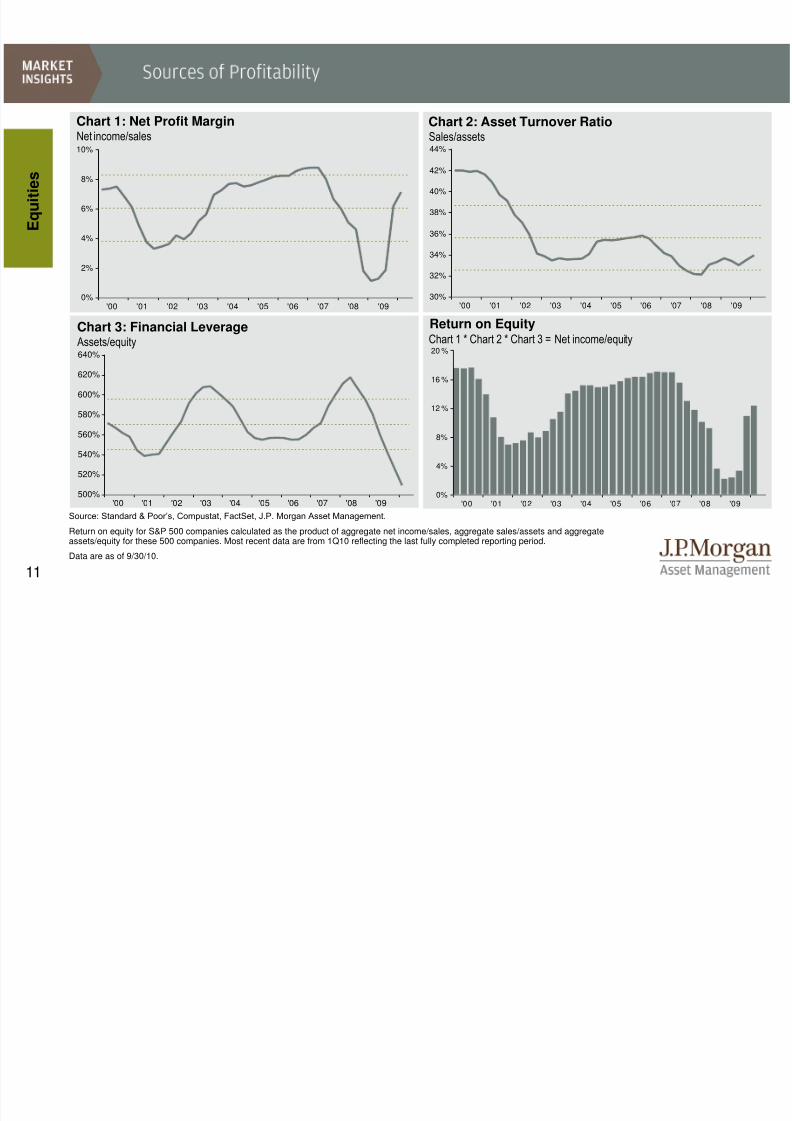
Chart 2: Asset Turnover Ratio
Source: Standard & Poor’s, Compustat, FactSet, J.P. Morgan Asset Management.
Return on equity for S&P 500 companies calculated as the product of aggregate net income/sales, aggregate sales/assets and aggregateassets/equity for these 500 companies. Most recent data are from 1Q10 reflecting the last fully completed reporting period.
Data are as of 9/30/10.
Sales/assetsNet income/sales
Chart 1: Net Profit Margin
Return on EquityChart 1 * Chart 2 * Chart 3 = Net income/equity
Chart 3: Financial Leverage Assets/equity
E q u i t i e s
'00 '01 '02 '03 '04 '05 '06 '07 '08 '090%
4%
8%
12 %
16 %
20 %
'00 '01 '02 '03 '04 '05 '06 '07 '08 '0930%
32%
34%
36%
38%
40%
42%
44%
'00 '01 '02 '03 '04 '05 '06 '07 '08 '09500%
520%
540%
560%
580%
600%
620%
640%
'00 '01 '02 '03 '04 '05 '06 '07 '08 '090%
2%
4%
6%
8%
10%
8/8/2019 JPM Guide to Markets
http://slidepdf.com/reader/full/jpm-guide-to-markets 13/5812
'95 '96 '97 '98 '99 '00 '01 '02 '03 '04 '05 '06 '07 '08 '09 '100
10
20
30
40
50
60
70
8090
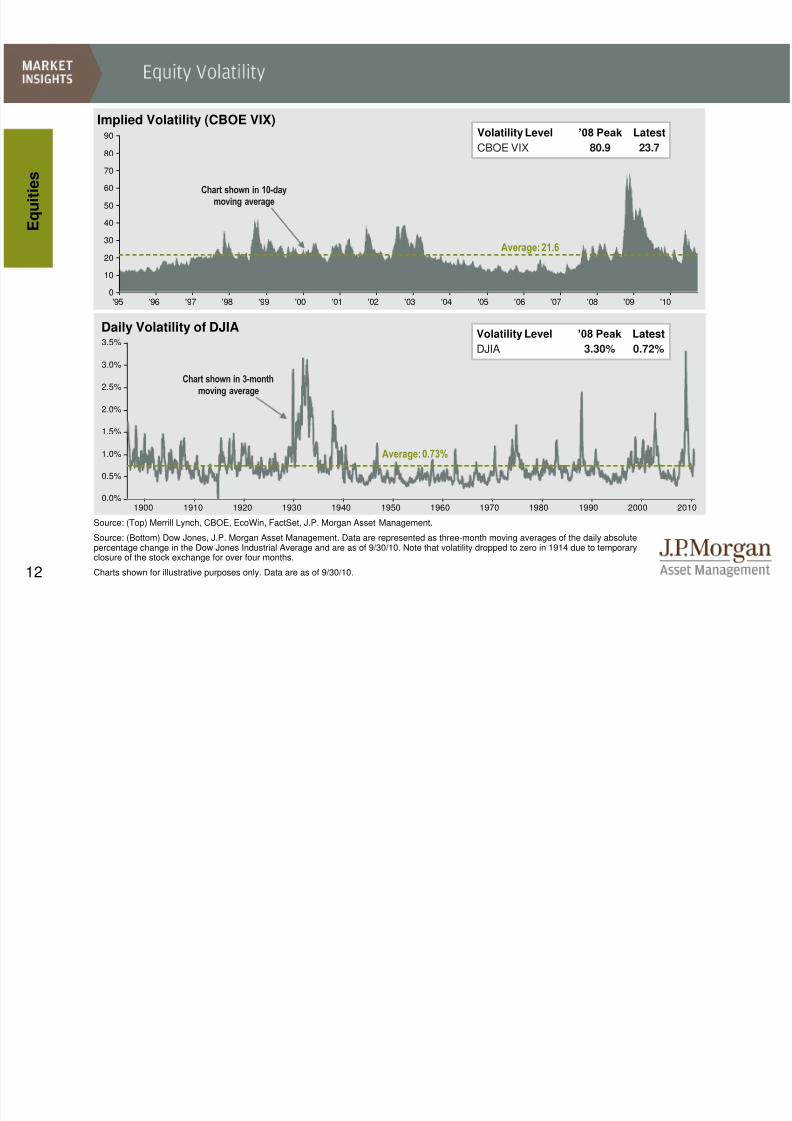
Daily Volatility of DJIA
Source: (Top) Merrill Lynch, CBOE, EcoWin, FactSet, J.P. Morgan Asset Management.
Source: (Bottom) Dow Jones, J.P. Morgan Asset Management. Data are represented as three-month moving averages of the daily absolutepercentage change in the Dow Jones Industrial Average and are as of 9/30/10. Note that volatility dropped to zero in 1914 due to temporaryclosure of the stock exchange for over four months.
Charts shown for illustrative purposes only. Data are as of 9/30/10.
1900 1910 1920 1930 1940 1950 1960 1970 1980 1990 2000 20100.0%
0.5%
1.0%
1.5%
2.0%
2.5%
3.0%
3.5%
Chart shown in 3-month
moving average
Average: 0.73%
Volatility Level ’08 Peak Latest
DJIA 3.30% 0.72%
E q u i t i e s
Implied Volatility (CBOE VIX)
Average: 21.6
Chart shown in 10-daymoving average
Volatility Level ’08 Peak Latest
CBOE VIX 80.9 23.7

8/8/2019 JPM Guide to Markets
http://slidepdf.com/reader/full/jpm-guide-to-markets 14/5813
0
25
50
75
100
125
1900 1912 1921 1933 1949 1961 1980 2001
The Great Depression and Post-War RecessionsLength and severity of recession
Great Depression:
26.7% decline in real GDP
Most Recent Recession:
4.1% decline in real GDP E c o n o m y
Source: NBER, BEA, J.P. Morgan Asset Management.
Bubble size reflects the severity of the recession, which is calculated as the decline in realGDP from the peak quarter to the trough quarter except in the case of the GreatDepression, where it is calculated from the peak year (1929) to the trough year (1933),due to a lack of available quarterly data. Data are as of 9/30/10.
Source: NBER, J.P. Morgan Asset Management.
*Chart assumes current expansion continued through September 2010.
Data for length of economic expansions and recessions obtained from the NationalBureau of Economic Research (NBER). This data can be found at www.nber.org/cycles/ and reflects information through September 2010.
For illustrative purposes only.
Length of Economic Expansions and Recessions
Average Length (months):
Expansions: 43 months
Recessions: 15 months
*
-3.2%
-0.6%
-2.2%
-2.9%
-1.6%-2.6%
-3.7%
-1.7%
-1.4%
-0.3%
-4.1%
-26.7%
0 yrs
1 yrs
2 yrs
3 yrs
4 yrs
5 yrs
1910 1930 1950 1970 1990 2010
L e n g t h o f R e c e s s i o n
i n Y e a r s
8/8/2019 JPM Guide to Markets
http://slidepdf.com/reader/full/jpm-guide-to-markets 15/58
14
-$2,000
$0
$2,000
$4,000
$6,000
$8,000
$10,000
$12,000
$14,000
$16,000
'92 '94 '96 '98 '00 '02 '04 '06 '08 '10-8%
-6%
-4%
-2%
0%
2%
4%
6%
8%
10%
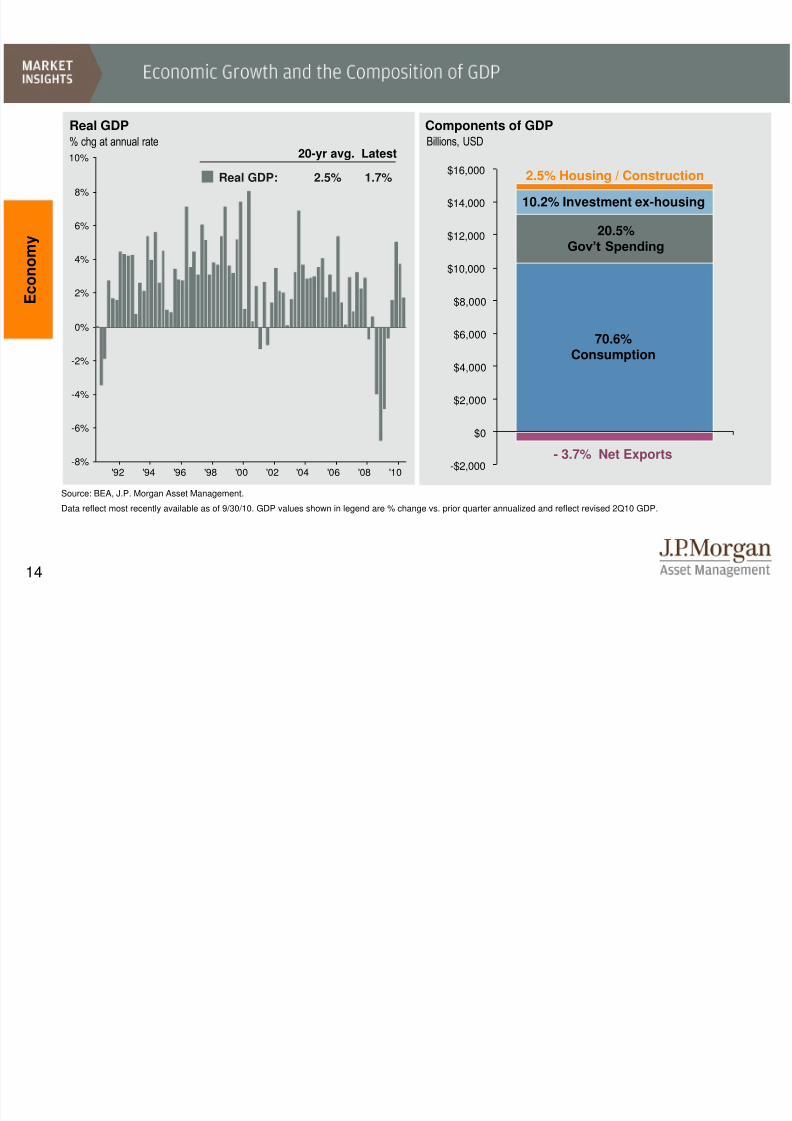
Source: BEA, J.P. Morgan Asset Management.
Data reflect most recently available as of 9/30/10. GDP values shown in legend are % change vs. prior quarter annualized and reflect revised 2Q10 GDP.
Real GDP
% chg at annual rate
E c o n o m y
20-yr avg. Latest
Real GDP: 2.5% 1.7%
Components of GDP
10.2% Investment ex-housing
70.6%Consumption
20.5%Gov’t Spending
Billions, USD
2.5% Housing / Construction
- 3.7% Net Exports

8/8/2019 JPM Guide to Markets
http://slidepdf.com/reader/full/jpm-guide-to-markets 16/58
15
E c o n o m y
Source: BEA, NBER, J.P. Morgan Asset Management.
Last 50 Years are from 2Q60 – 2Q10. Last 7 Recessions are measured from peak real GDP to trough real GDP. Last 7 Recoveries are defined as the four quarters followingthe NBER-designated trough quarter. Most Recent Recession is defined from peak real GDP in 4Q07 to trough real GDP in 2Q09.
Note that contribution numbers are approximations due to the use of chain-weighted GDP, which is not designed to sum exactly. Most recent data as of 9/30/10.
Percent Share Percent Share Percent Share Percent Share Percent Share
Overall GDP Growth 3.2 100.0% -1.8 100.0% 5.0 100.0% -4.1 100.0% 3.0 100.0%
Less Cyclical Components 2.6 81.2% 0.7 -39.9% 2.0 40.1% 0.6 -15.5% -0.0 -0.8%
Consumption Ex-Autos 2.1 66.6% 0.1 -4.0% 2.4 47.9% -1.0 23.4% 1.1 35.6%
Commercial Construction 0.1 1.9% -0.1 3.8% -0.1 -2.3% -0.6 14.6% -0.4 -14.8%
Net Exports -0.1 -2.5% 0.4 -23.8% -0.6 -12.7% 1.5 -37.4% -0.8 -26.1%
Government 0.5 15.2% 0.3 -15.9% 0.4 7.2% 0.7 -16.1% 0.1 4.4%
More Cyclical Components 0.6 18.8% -2.5 139.9% 3.0 59.9% -4.8 115.5% 3.0 100.8%
Auto Consumption 0.1 3.1% -0.2 11.4% 0.4 7.7% -0.6 15.2% 0.1 3.3%
Residential Construction 0.1 2.2% -0.5 27.3% 0.7 14.5% -1.3 32.4% 0.1 4.4%
Equipment 0.4 12.9% -0.3 15.7% 0.5 9.1% -1.6 38.0% 1.1 36.1%
Change in Inventories 0.0 0.6% -1.5 85.5% 1.4 28.6% -1.2 29.9% 1.7 57.0%
Current Recovery(1st Yr)
Last 50 Years Last 7 Recessions Last 7 Recoveries(1st Yr)
Most RecentRecession
8/8/2019 JPM Guide to Markets
http://slidepdf.com/reader/full/jpm-guide-to-markets 17/58
16
'70 '75 '80 '85 '90 '95 '00 '05 '10-200
-150
-100
-50
0
50
100
150
'75 '80 '85 '90 '95 '00 '05 '100
400
800
1,200
1,600
2,000
2,400
'96 '98 '00 '02 '04 '06 '08 '1040
45
50
55
60
65
70
75
'85 '90 '95 '00 '05 '108
10
12
14
16
18
20
22
24
E c o n o m y
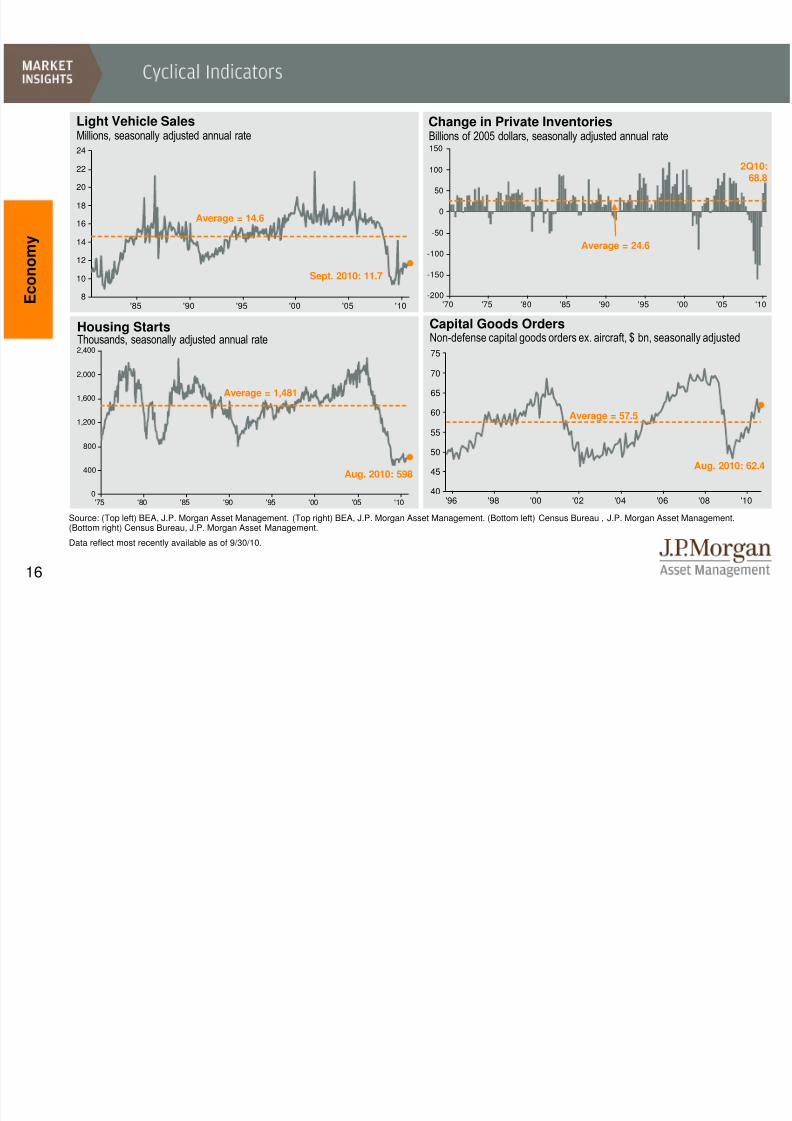
Change in Private Inventories
Source: (Top left) BEA, J.P. Morgan Asset Management. (Top right) BEA, J.P. Morgan Asset Management. (Bottom left) Census Bureau , J.P. Morgan Asset Management.(Bottom right) Census Bureau, J.P. Morgan Asset Management.
Data reflect most recently available as of 9/30/10.
Billions of 2005 dollars, seasonally adjusted annual rateMillions, seasonally adjusted annual rate
Light Vehicle Sales
Capital Goods OrdersNon-defense capital goods orders ex. aircraft, $ bn, seasonally adjusted
Aug. 2010: 598
Housing StartsThousands, seasonally adjusted annual rate
Average = 14.6 Average = 24.6
Average = 57.5
Aug. 2010: 62.4
2Q10:68.8
Sept. 2010: 11.7
Average = 1,481
8/8/2019 JPM Guide to Markets
http://slidepdf.com/reader/full/jpm-guide-to-markets 18/58
17
10%
11%
12%
13%
14%
15%
'80 '82 '84 '86 '88 '90 '92 '94 '96 '98 '00 '02 '04 '06 '08 '10$0
$10
$20
$30
$40
$50
$60
$70
Personal Savings Rate
'60 '65 '70 '75 '80 '85 '90 '95 '00 '05 '100%
2%
4%
6%
8%
10%
12% Annual, % of disposable income
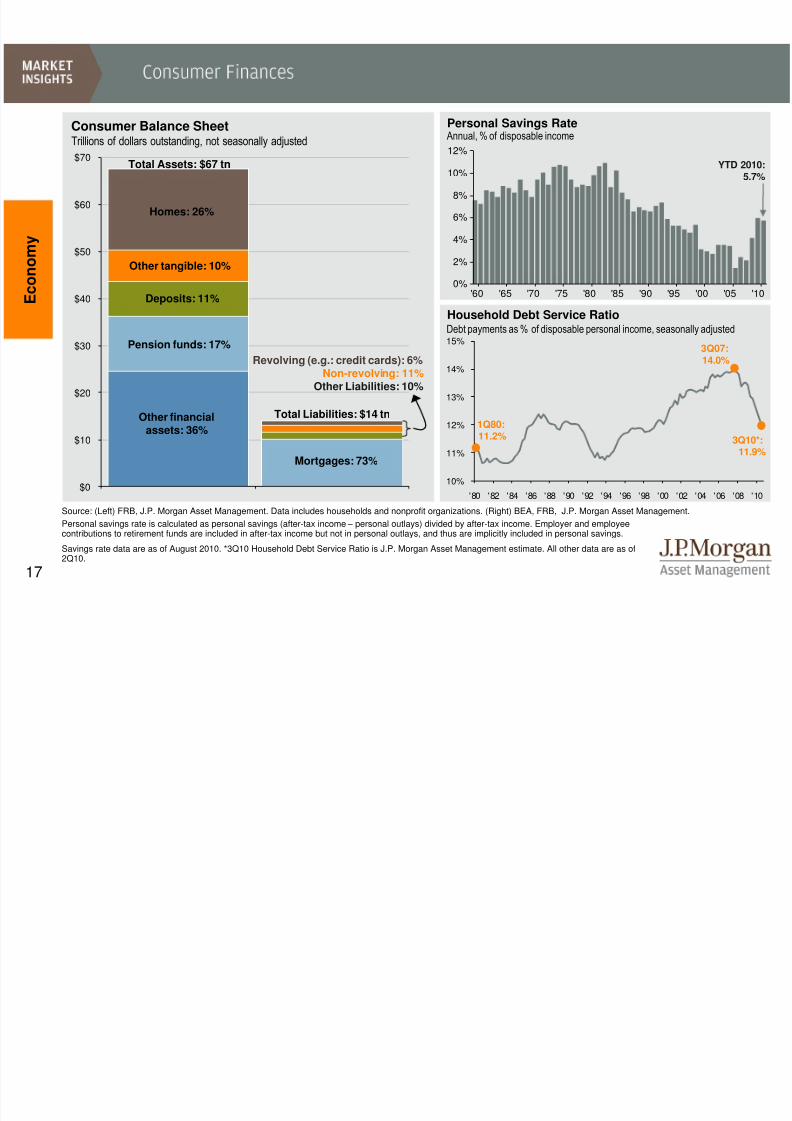
Consumer Balance Sheet
Trillions of dollars outstanding, not seasonally adjusted
Source: (Left) FRB, J.P. Morgan Asset Management. Data includes households and nonprofit organizations. (Right) BEA, FRB, J.P. Morgan Asset Management.
Household Debt Service RatioDebt payments as % of disposable personal income, seasonally adjusted
Total Assets: $67 tn
Total Liabilities: $14 tn
Homes: 26%
Deposits: 11%
Pension funds: 17%
Other financialassets: 36%
Other tangible: 10%
Mortgages: 73%
Revolving (e.g.: credit cards): 6%Non-revolving: 11%
Other Liabilities: 10%
E c o n o m y
YTD 2010:5.7%
1Q80:11.2% 3Q10*:
11.9%
3Q07:14.0%
Personal savings rate is calculated as personal savings (after-tax income – personal outlays) divided by after-tax income. Employer and employeecontributions to retirement funds are included in after-tax income but not in personal outlays, and thus are implicitly included in personal savings.
Savings rate data are as of August 2010. *3Q10 Household Debt Service Ratio is J.P. Morgan Asset Management estimate. All other data are as of2Q10.
8/8/2019 JPM Guide to Markets
http://slidepdf.com/reader/full/jpm-guide-to-markets 19/58
18
0%
25%
50%
75%
100%
125%
1940 1950 1960 1970 1980 1990 2000 2010 2020
-35%
-25%
-15%
-5%
5%
1940 1950 1960 1970 1980 1990 2000 2010 2020
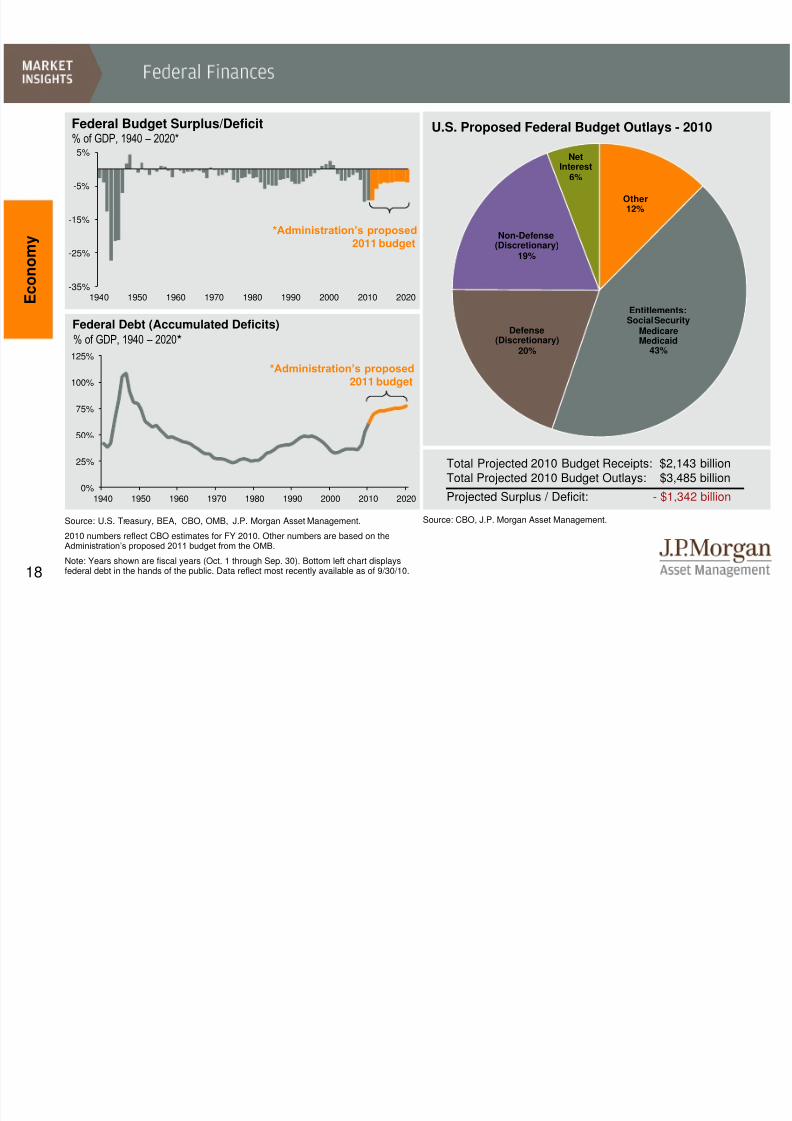
% of GDP, 1940 – 2020*
E c o n o m y
Federal Debt (Accumulated Deficits)
% of GDP, 1940 – 2020*
Source: U.S. Treasury, BEA, CBO, OMB, J.P. Morgan Asset Management.
2010 numbers reflect CBO estimates for FY 2010. Other numbers are based on theAdministration’s proposed 2011 budget from the OMB.
Note: Years shown are fiscal years (Oct. 1 through Sep. 30). Bottom left chart displaysfederal debt in the hands of the public. Data reflect most recently available as of 9/30/10.
Federal Budget Surplus/Deficit
*Administration’s proposed2011 budget
Total Projected 2010 Budget Receipts: $2,143 billionTotal Projected 2010 Budget Outlays: $3,485 billion
Projected Surplus / Deficit: - $1,342 billion
Source: CBO, J.P. Morgan Asset Management.
U.S. Proposed Federal Budget Outlays - 2010
*Administration’s proposed2011 budget
Other12%
Entitlements:Social Security
MedicareMedicaid
43%
Defense(Discretionary)
20%
Non-Defense(Discretionary)
19%
NetInterest
6%
8/8/2019 JPM Guide to Markets
http://slidepdf.com/reader/full/jpm-guide-to-markets 20/58
19
40%
50%
60%
70%
80%
1939 1949 1959 1969 1979 1989 1999 2009
E c o n o m y
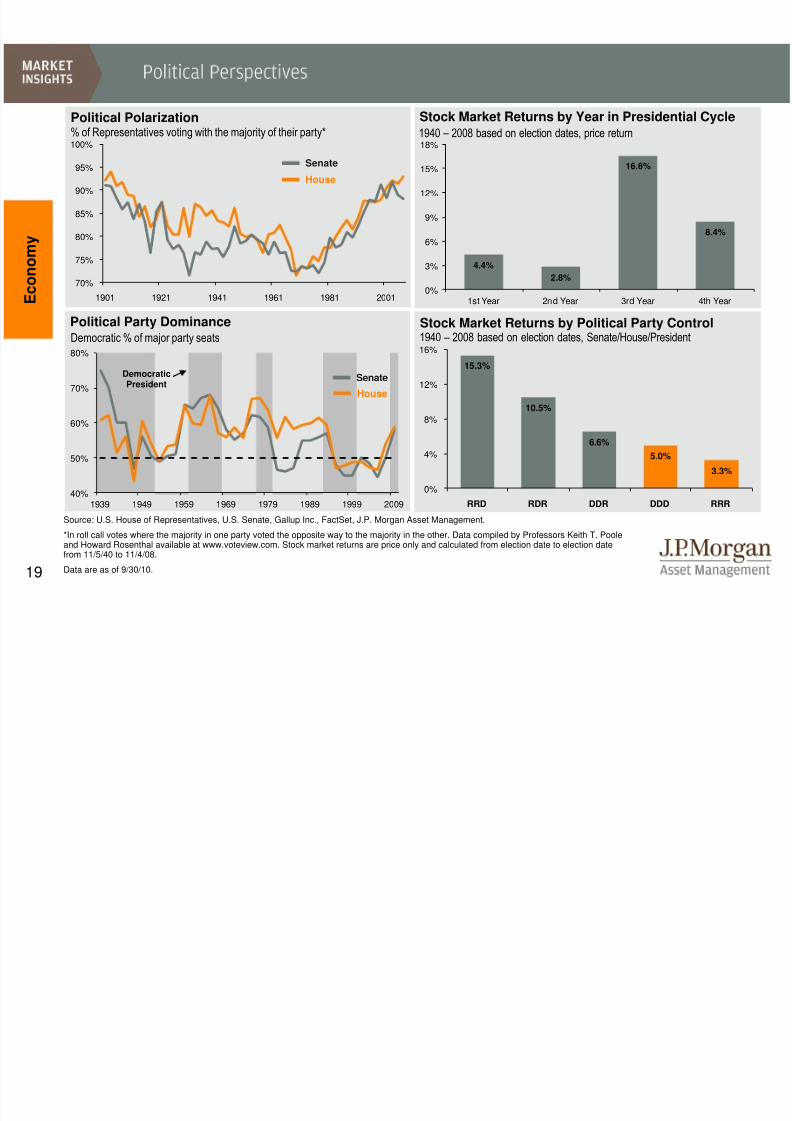
Source: U.S. House of Representatives, U.S. Senate, Gallup Inc., FactSet, J.P. Morgan Asset Management.
*In roll call votes where the majority in one party voted the opposite way to the majority in the other. Data compiled by Professors Keith T. Pooleand Howard Rosenthal available at www.voteview.com. Stock market returns are price only and calculated from election date to election date
from 11/5/40 to 11/4/08.Data are as of 9/30/10.
Political Polarization
Stock Market Returns by Political Party ControlPolitical Party Dominance 1940 – 2008 based on election dates, Senate/House/President
% of Representatives voting with the majority of their party*
DemocraticPresident
Senate
House
Senate
House
Democratic % of major party seats
70%
75%
80%
85%
90%
95%
100%
1901 1921 1941 1961 1981 2001
Stock Market Returns by Year in Presidential Cycle 1940 – 2008 based on election dates, price return
15.3%
10.5%
6.6%
5.0%
3.3%
0%
4%
8%
12%
16%
RRD RDR DDR DDD RRR
4.4%
2.8%
16.6%
8.4%
0%
3%
6%
9%
12%
15%
18%
1st Year 2nd Year 3rd Year 4th Year
8/8/2019 JPM Guide to Markets
http://slidepdf.com/reader/full/jpm-guide-to-markets 21/58
20
'95 '00 '05 '103
4
5
6
7
8
9
'95 '00 '05 '1080
100
120
140
160
180
200
220
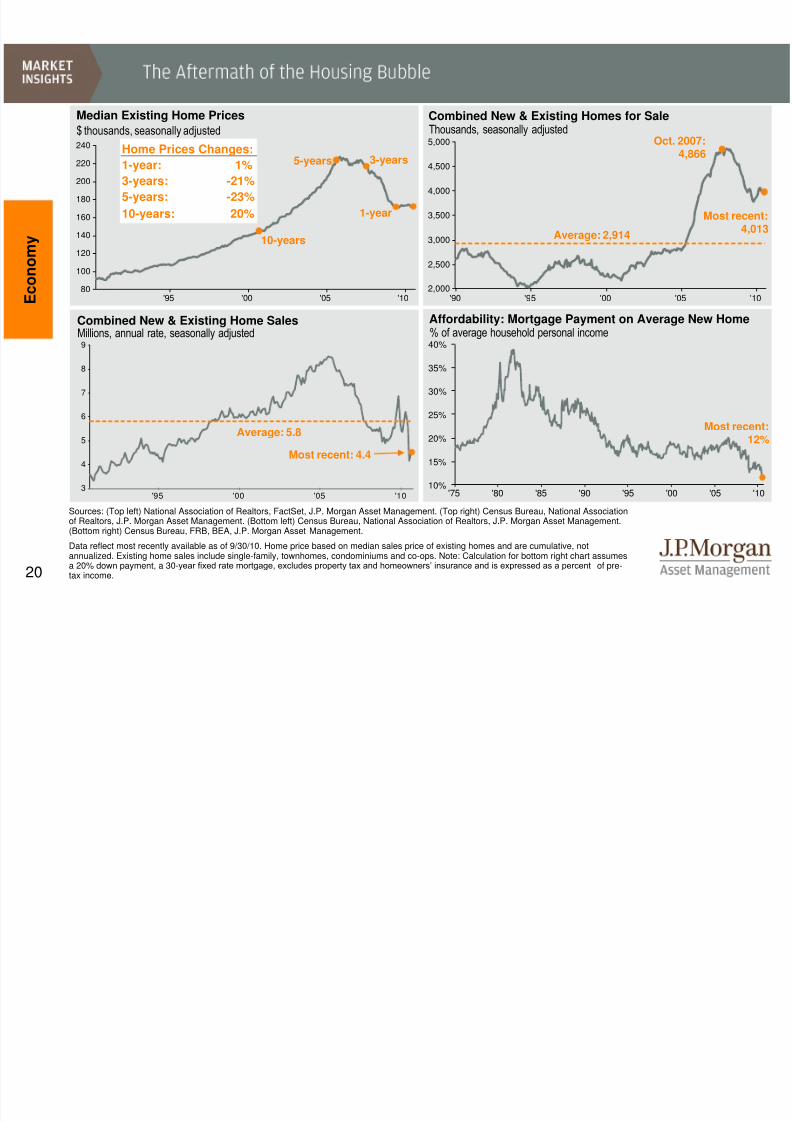
240 Home Prices Changes:
1-year: 1%
3-years: -21%
5-years: -23%
10-years: 20%
10%
15%
20%
25%
30%
35%
40%
'75 '80 '85 '90 '95 '00 '05 '10
'90 '95 '00 '05 '102,000
2,500
3,000
3,500
4,000
4,500
5,000
$ thousands, seasonally adjustedCombined New & Existing Homes for SaleThousands, seasonally adjusted
E c o n o m y
Sources: (Top left) National Association of Realtors, FactSet, J.P. Morgan Asset Management. (Top right) Census Bureau, National Associationof Realtors, J.P. Morgan Asset Management. (Bottom left) Census Bureau, National Association of Realtors, J.P. Morgan Asset Management.(Bottom right) Census Bureau, FRB, BEA, J.P. Morgan Asset Management.
Data reflect most recently available as of 9/30/10. Home price based on median sales price of existing homes and are cumulative, not
annualized. Existing home sales include single-family, townhomes, condominiums and co-ops. Note: Calculation for bottom right chart assumesa 20% down payment, a 30-year fixed rate mortgage, excludes property tax and homeowners’ insurance and is expressed as a percent of pre-tax income.
Affordability: Mortgage Payment on Average New Home% of average household personal income
Median Existing Home Prices
10-years
5-years 3-years
1-year
Most recent:12%
Combined New & Existing Home SalesMillions, annual rate, seasonally adjusted
Most recent:4,013
Oct. 2007:4,866
Most recent: 4.4
Average: 5.8
Average: 2,914
8/8/2019 JPM Guide to Markets
http://slidepdf.com/reader/full/jpm-guide-to-markets 22/58
21
'01 '02 '03 '04 '05 '06 '07 '08 '09 '10-1,000
-800
-600
-400
-200
0
200
400
600
'60 '70 '80 '90 '00 '103%
4%
5%
6%
7%
8%
9%
10%
11%
12%
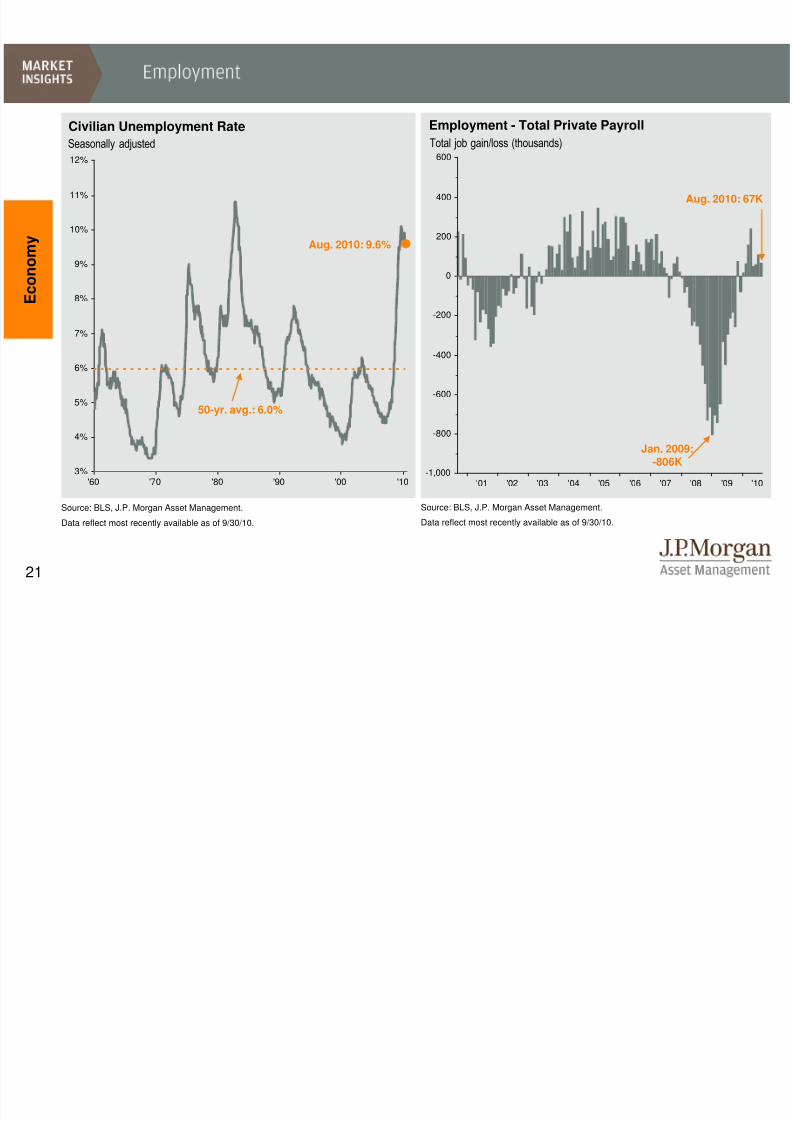
Source: BLS, J.P. Morgan Asset Management.
Data reflect most recently available as of 9/30/10.
Civilian Unemployment Rate Employment - Total Private Payroll
E c o n o m y
50-yr. avg.: 6.0%
Source: BLS, J.P. Morgan Asset Management.
Data reflect most recently available as of 9/30/10.
Seasonally adjusted Total job gain/loss (thousands)
Jan. 2009:-806K
Aug. 2010: 67K
Aug. 2010: 9.6%
8/8/2019 JPM Guide to Markets
http://slidepdf.com/reader/full/jpm-guide-to-markets 23/58
22
0%
5%
10%
15%
20%
25%
30%
35%
0.0% 1.0% 2.0% 3.0% 4.0% 5.0%
0.0%
1.0%
2.0%
3.0%
4.0%
5.0%
6.0%
7.0%
8.0%
0.0% 1.0% 2.0% 3.0% 4.0% 5.0%
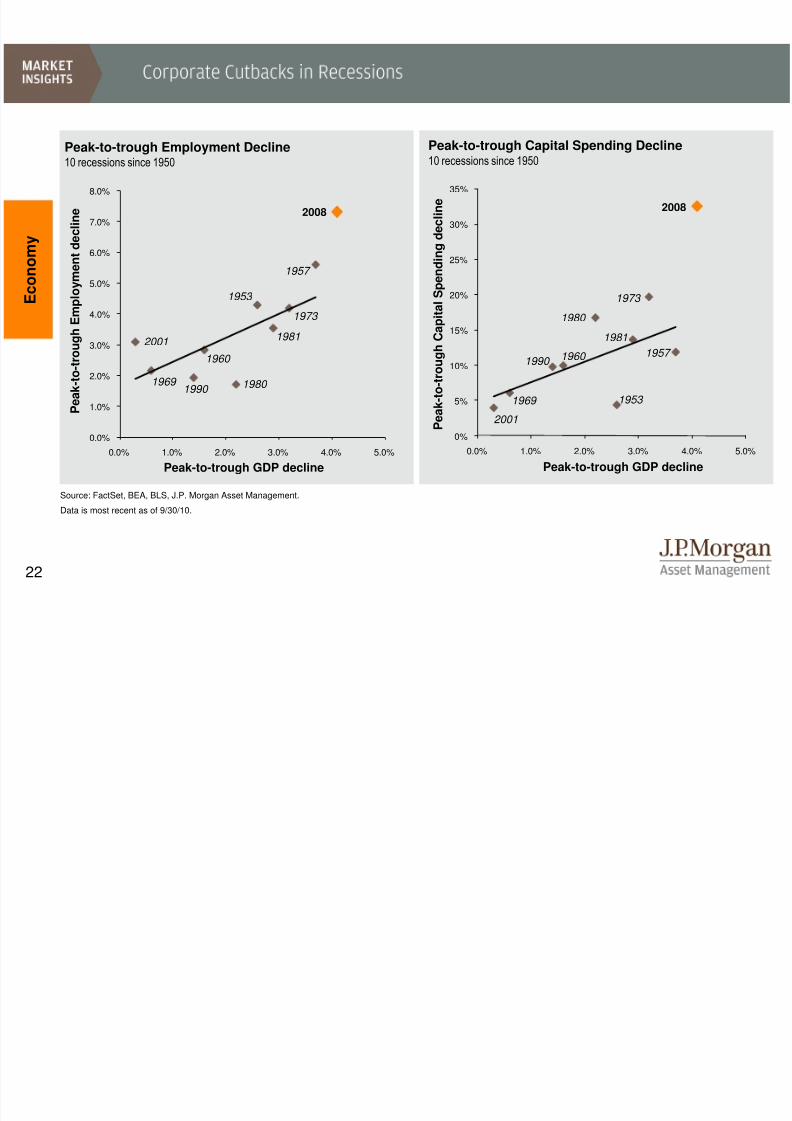
Source: FactSet, BEA, BLS, J.P. Morgan Asset Management.
Data is most recent as of 9/30/10.
Peak-to-trough Employment Decline10 recessions since 1950
Peak-to-trough Capital Spending Decline10 recessions since 1950
Peak-to-trough GDP decline
P e a k - t o - t r o u g h E m p l o y m
e n t d e c l i n e
Peak-to-trough GDP decline
P e a k - t o - t r o u g h C a p i t a l S p e
n d i n g d e c l i n e
2008 2008
2001
1957
1973
1981
1953
1980
1960
1990 1969
1957
2001
1973
1981
1953
1980
1960 1990
1969
E c o
n o m y
8/8/2019 JPM Guide to Markets
http://slidepdf.com/reader/full/jpm-guide-to-markets 24/58
23
-$1
$2
$5
$8
$11
$14
$17
$20
$23
$26
'10'08'06'04'02'00
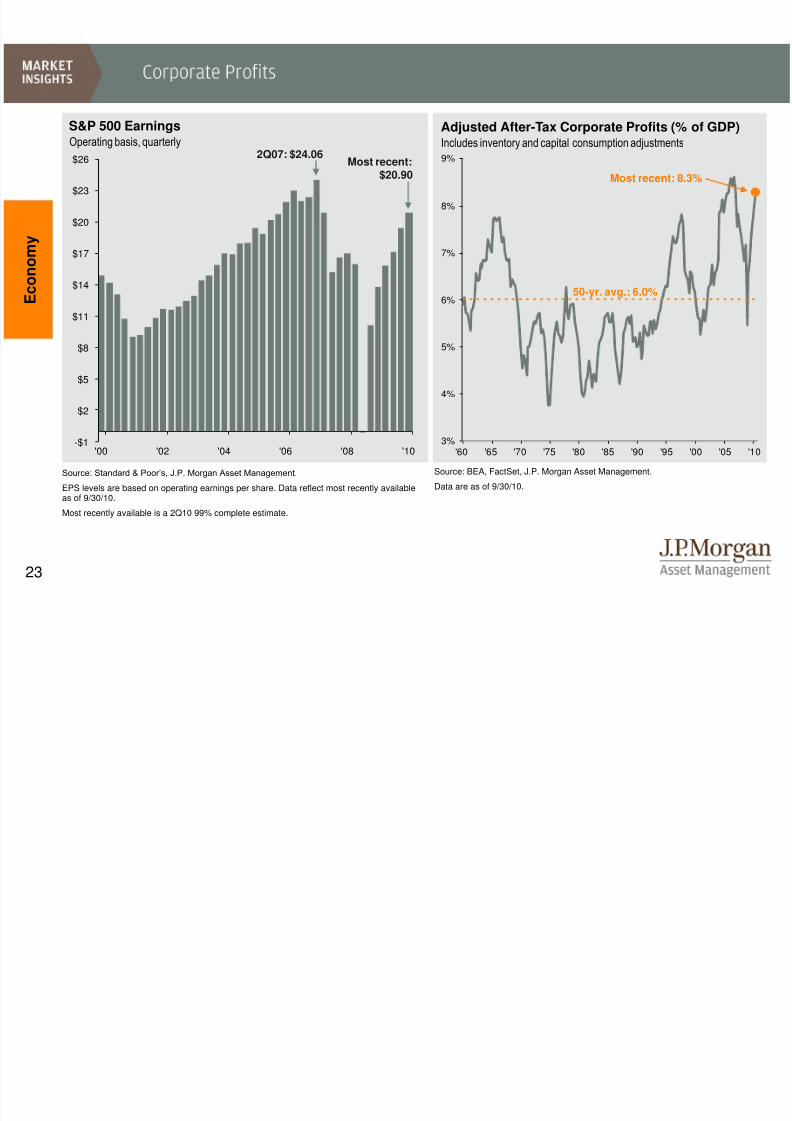
Source: BEA, FactSet, J.P. Morgan Asset Management.
Data are as of 9/30/10.
Adjusted After-Tax Corporate Profits (% of GDP)
Includes inventory and capital consumption adjustments
E c o
n o m y
S&P 500 Earnings
Operating basis, quarterly
Source: Standard & Poor’s, J.P. Morgan Asset Management.
EPS levels are based on operating earnings per share. Data reflect most recently availableas of 9/30/10.
Most recently available is a 2Q10 99% complete estimate.
Most recent:$20.90
'60 '65 '70 '75 '80 '85 '90 '95 '00 '05 '103%
4%
5%
6%
7%
8%
9%
50-yr. avg.: 6.0%
2Q07: $24.06
Most recent: 8.3%

8/8/2019 JPM Guide to Markets
http://slidepdf.com/reader/full/jpm-guide-to-markets 25/58
24
'60 '65 '70 '75 '80 '85 '90 '95 '00 '05 '10-3%
0%
3%
6%
9%
12%
15%
Source: BLS, J.P. Morgan Asset Management.
Data reflect most recently available as of 9/30/10. CPI values shown are % change vs. 1 year ago and reflect August2010 CPI data. CPI component weights are as of Dec. 2009 and 12-month change reflects data through August2010. Core CPI is defined as CPI excluding food and energy prices.
E c o
n o m y
CPI and Core CPI
50-yr. Avg. LatestHeadline CPI: 4.0% 1.2%
Core CPI: 4.0% 1.0%
% chg vs. prior year
CPI
Components
Weight in
CPI
12-month
Change
Food & Bev. 14.8% 1.0%
Housing 42.0% -0.2%
Apparel 3.7% -0.3%
Transportation 16.7% 4.8%
Medical Care 6.5% 3.2%
Recreation 6.4% -1.1%
Educ. & Comm. 6.4% 1.9%
Other 3.5% 3.0%
Headline CPI 100.0% 1.2%
Less:
Energy 8.6% 3.8%
Food 13.7% 1.0%
Core CPI 77.7% 1.0%
8/8/2019 JPM Guide to Markets
http://slidepdf.com/reader/full/jpm-guide-to-markets 26/58
25
+32.3%
+18.6%
+21.4%
+45.0%
+35.8%+25.8%
+33.0%+35.7%
+32.6%
+17.6%+28.5%
+23.1%+30.4%+31.5%
+31.0%+23.3%
+25.0%+19.2%+25.2%+23.5%
+50.3%
+18.3%
+0.0%
+2.0%
+4.0%
+6.0%
+8.0%
+10.0%
May'49
Jul'49
Oct'49
Dec'53
Mar'54
Nov'57
Jan'58
Feb'58
Apr'58
Mar'60
Oct'60
Dec'60
Nov'74
Dec'74
Jan'75
Mar'75
Apr'80
May'80
Feb'86
Dec'08
Feb'09
May'09
'75 '80 '85 '90 '95 '00 '05 '1040
50
60
70
80
90
100
110
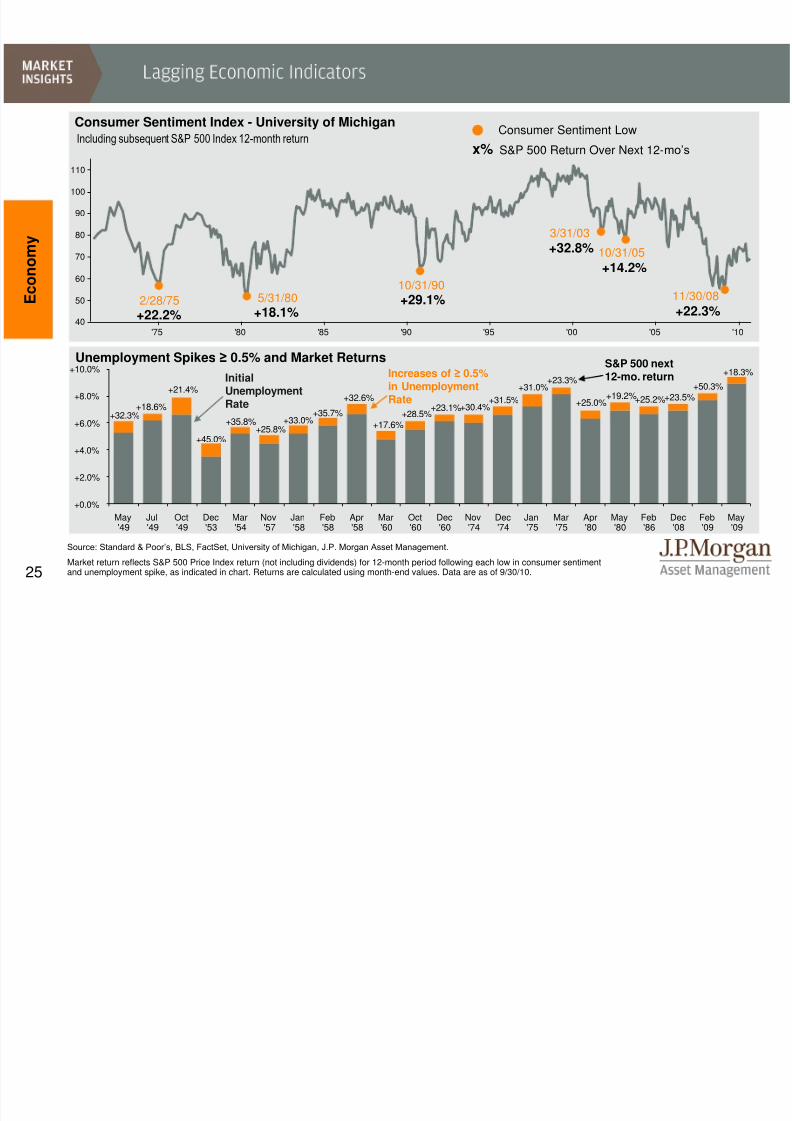
Source: Standard & Poor’s, BLS, FactSet, University of Michigan, J.P. Morgan Asset Management.
Market return reflects S&P 500 Price Index return (not including dividends) for 12-month period following each low in consumer sentimentand unemployment spike, as indicated in chart. Returns are calculated using month-end values. Data are as of 9/30/10.
Consumer Sentiment Index - University of Michigan
2/28/75 5/31/80
3/31/03
+22.2%
Consumer Sentiment Low
10/31/90
E c o
n o m y
Including subsequent S&P 500 Index 12-month return
+18.1% +29.1%
+32.8%
x% S&P 500 Return Over Next 12-mo’s
Unemployment Spikes ≥ 0.5% and Market ReturnsIncreases of ≥ 0.5%in UnemploymentRate
InitialUnemploymentRate
S&P 500 next12-mo. return
10/31/05
+14.2%
11/30/08
+22.3%
8/8/2019 JPM Guide to Markets
http://slidepdf.com/reader/full/jpm-guide-to-markets 27/58
26
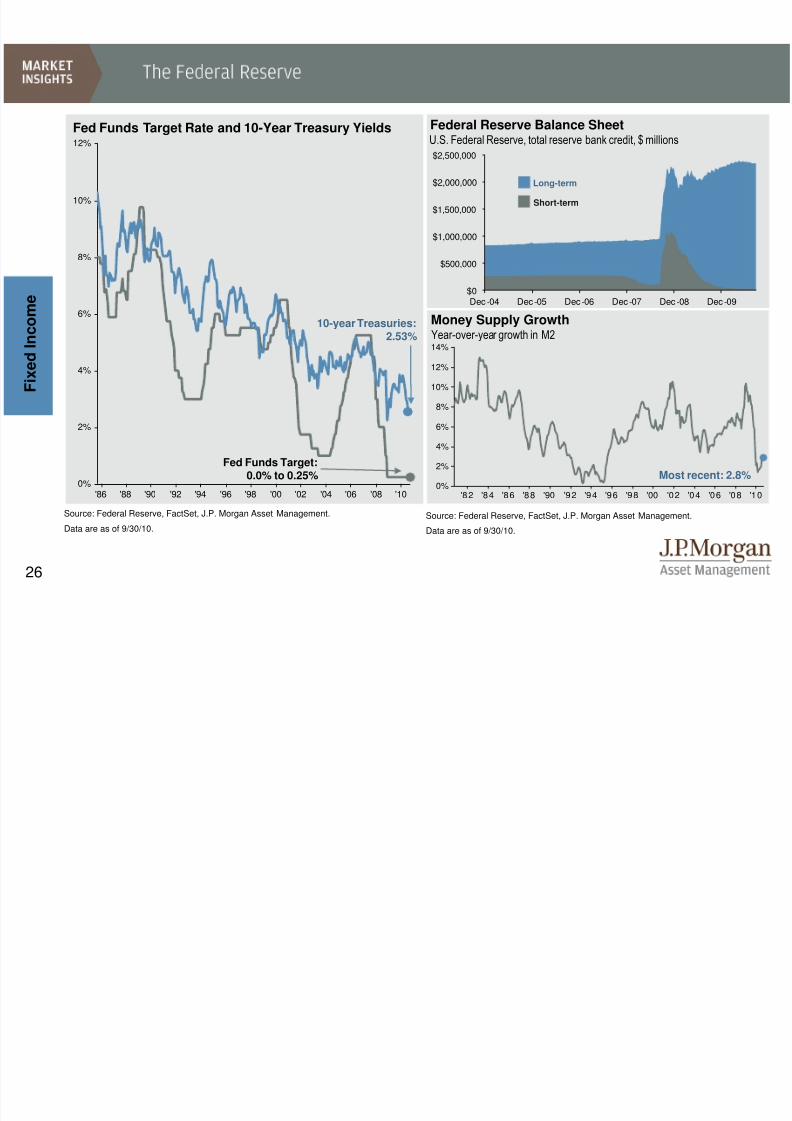
'86 '88 '90 '92 '94 '96 '98 '00 '02 '04 '06 '08 '100%
2%
4%
6%
8%
10%
12%
'82 '84 '86 '88 '90 '92 '94 '96 '98 '00 '02 '04 '06 '08 '100%
2%
4%
6%
8%
10%
12%
14%
Source: Federal Reserve, FactSet, J.P. Morgan Asset Management.
Data are as of 9/30/10.
F i x e d I n c o m e
Fed Funds Target Rate and 10-Year Treasury Yields
Source: Federal Reserve, FactSet, J.P. Morgan Asset Management.
Data are as of 9/30/10.
Money Supply GrowthYear-over-year growth in M2
Federal Reserve Balance Sheet
U.S. Federal Reserve, total reserve bank credit, $ millions
Most recent: 2.8%
Long-term
Short-term
Fed Funds Target:0.0% to 0.25%
10-year Treasuries:2.53%
$0
$500,000
$1,000,000
$1,500,000
$2,000,000
$2,500,000
Dec -04 Dec -05 Dec -06 Dec -07 Dec -08 Dec -09
8/8/2019 JPM Guide to Markets
http://slidepdf.com/reader/full/jpm-guide-to-markets 28/58
27
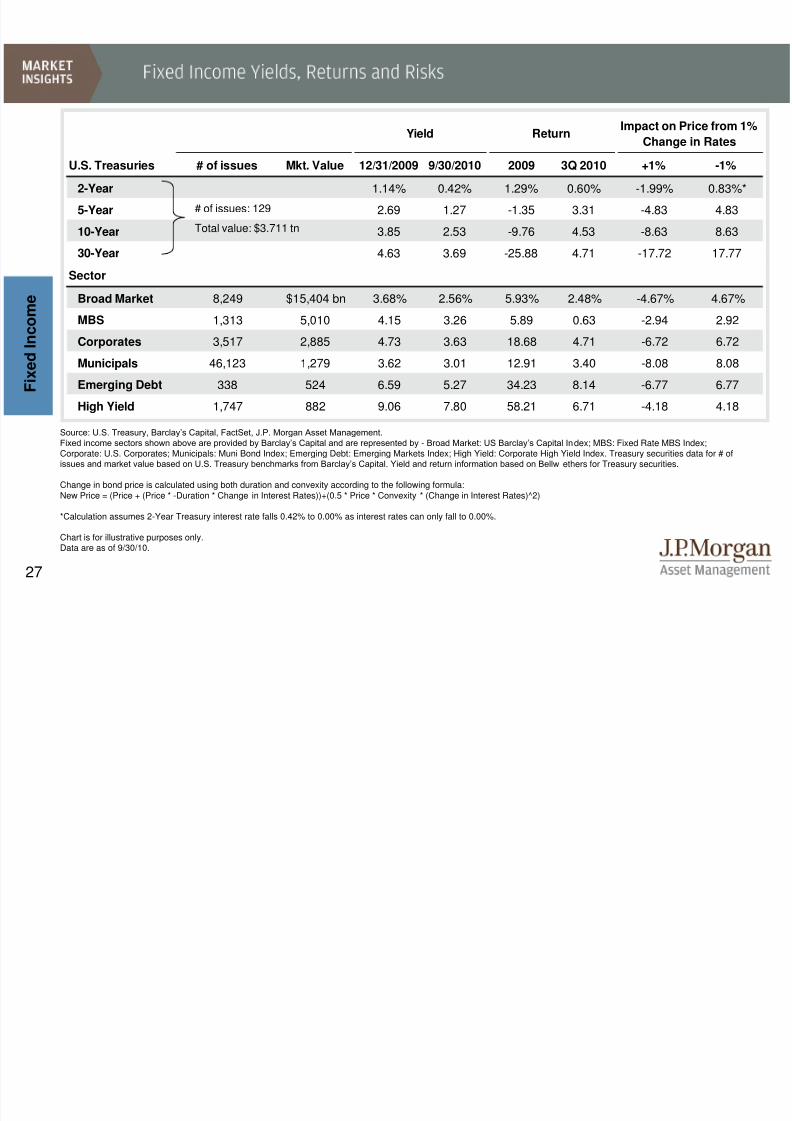
U.S. Treasuries # of issues Mkt. Value 12/31/2009 9/30/2010 2009 3Q 2010 +1% -1%
2-Year 1.14% 0.42% 1.29% 0.60% -1.99% 0.83%*
5-Year 2.69 1.27 -1.35 3.31 -4.83 4.83
10-Year 3.85 2.53 -9.76 4.53 -8.63 8.63
30-Year 4.63 3.69 -25.88 4.71 -17.72 17.77
SectorBroad Market 8,249 $15,404 bn 3.68% 2.56% 5.93% 2.48% -4.67% 4.67%
MBS 1,313 5,010 4.15 3.26 5.89 0.63 -2.94 2.92
Corporates 3,517 2,885 4.73 3.63 18.68 4.71 -6.72 6.72
Municipals 46,123 1,279 3.62 3.01 12.91 3.40 -8.08 8.08
Emerging Debt 338 524 6.59 5.27 34.23 8.14 -6.77 6.77
High Yield 1,747 882 9.06 7.80 58.21 6.71 -4.18 4.18
Yield ReturnImpact on Price from 1%
Change in Rates
F i x e d I n c o m e
Source: U.S. Treasury, Barclay’s Capital, FactSet, J.P. Morgan Asset Management. Fixed income sectors shown above are provided by Barclay’s Capital and are represented by- Broad Market: US Barclay’s Capital Index; MBS: Fixed Rate MBS Index;Corporate: U.S. Corporates; Municipals: Muni Bond Index; Emerging Debt: Emerging Markets Index; High Yield: Corporate High Yield Index. Treasury securities data for # ofissues and market value based on U.S. Treasury benchmarks from Barclay’s Capital. Yield and return information based on Bellwethers for Treasury securities.
Change in bond price is calculated using both duration and convexity according to the following formula:New Price = (Price + (Price * -Duration * Change in Interest Rates))+(0.5 * Price * Convexity * (Change in Interest Rates)^2)
*Calculation assumes 2-Year Treasury interest rate falls 0.42% to 0.00% as interest rates can only fall to 0.00%.
Chart is for illustrative purposes only.Data are as of 9/30/10.
# of issues: 129
Total value: $3.711 tn
8/8/2019 JPM Guide to Markets
http://slidepdf.com/reader/full/jpm-guide-to-markets 29/58
28
'96 '98 '00 '02 '04 '06 '08 '10
0%
1%
2%
3%
4%
5%
'92 '94 '96 '98 '00 '02 '04 '06 '08 '10
2%
4%
6%
8%
10%
12%
Consumer Loans
Residential Mortgages
'97 '98 '99 '00 '01 '02 '03 '04 '05 '06 '07 '08 '09 '10-40%
-20%
0%
20%
40%
60%
80%
100%
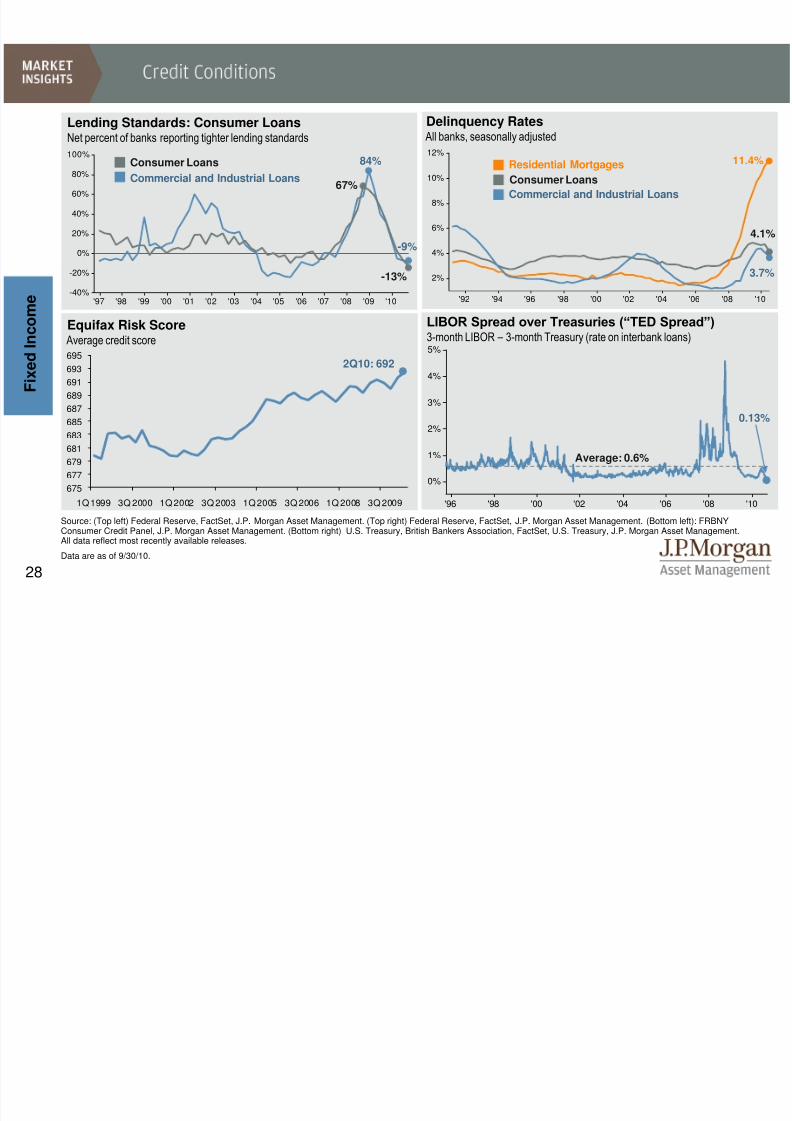
Source: (Top left) Federal Reserve, FactSet, J.P. Morgan Asset Management. (Top right) Federal Reserve, FactSet, J.P. Morgan Asset Management. (Bottom left): FRBNYConsumer Credit Panel, J.P. Morgan Asset Management. (Bottom right) U.S. Treasury, British Bankers Association, FactSet, U.S. Treasury, J.P. Morgan Asset Management.All data reflect most recently available releases.
Data are as of 9/30/10.
Lending Standards: Consumer Loans
Net percent of banks reporting tighter lending standards
Equifax Risk Score Average credit score
Delinquency Rates
All banks, seasonally adjusted
Commercial and Industrial Loans
Consumer Loans
F i x e d I n c o m e
-9%
-13%
67%
84%
LIBOR Spread over Treasuries (“TED Spread”)3-month LIBOR – 3-month Treasury (rate on interbank loans)
Commercial and Industrial Loans
11.4%
3.7%
4.1%
675
677
679
681
683
685
687
689
691
693
695
1Q 1999 3Q 2000 1Q 2002 3Q 2003 1Q 2005 3Q 2006 1Q 2008 3Q 2009
2Q10: 692
0.13%
Average: 0.6%
8/8/2019 JPM Guide to Markets
http://slidepdf.com/reader/full/jpm-guide-to-markets 30/58
29
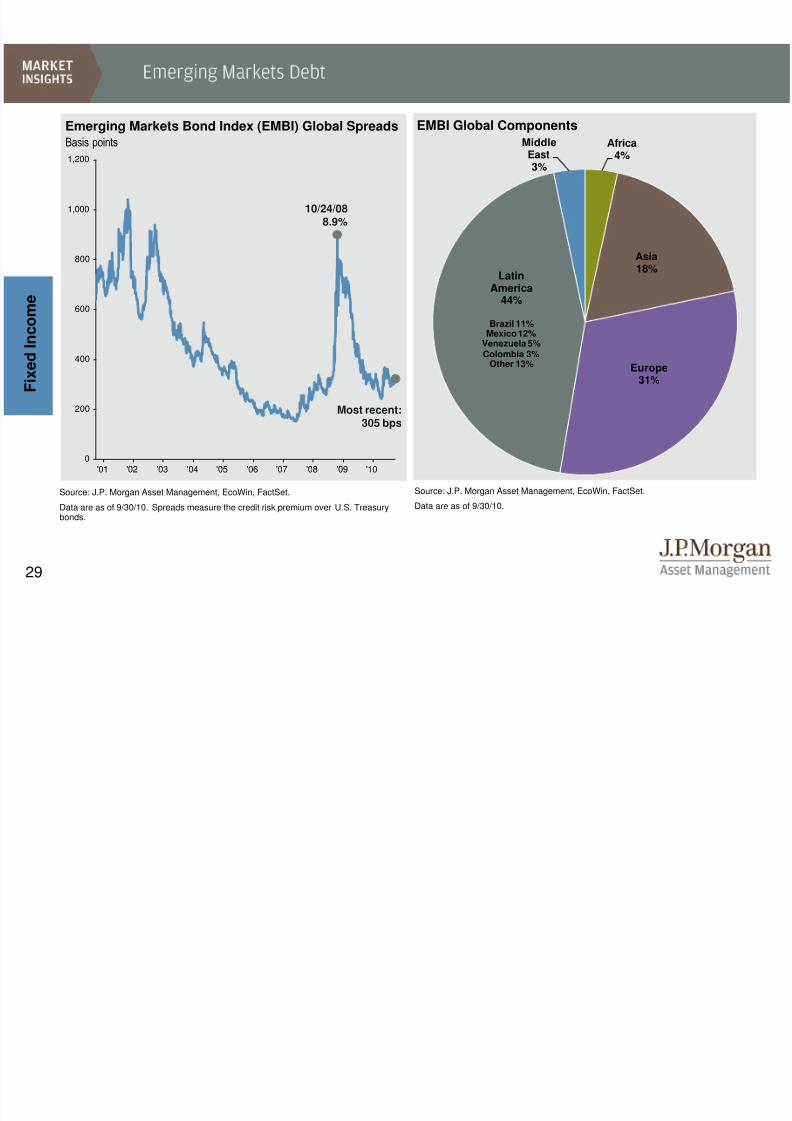
Source: J.P. Morgan Asset Management, EcoWin, FactSet.
Data are as of 9/30/10. Spreads measure the credit risk premium over U.S. Treasurybonds.
F i x e d I n c o m e
Emerging Markets Bond Index (EMBI) Global Spreads EMBI Global Components
Source: J.P. Morgan Asset Management, EcoWin, FactSet.
Data are as of 9/30/10.
'01 '02 '03 '04 '05 '06 '07 '08 '09 '100
200
400
600
800
1,000
1,200Basis points
Most recent:
305 bps
10/24/088.9%
Africa4%
Asia18%
Europe31%
LatinAmerica44%
Brazil 11%Mexico 12%
Venezuela 5%Colombia 3%
Other 13%
MiddleEast3%
8/8/2019 JPM Guide to Markets
http://slidepdf.com/reader/full/jpm-guide-to-markets 31/58
30
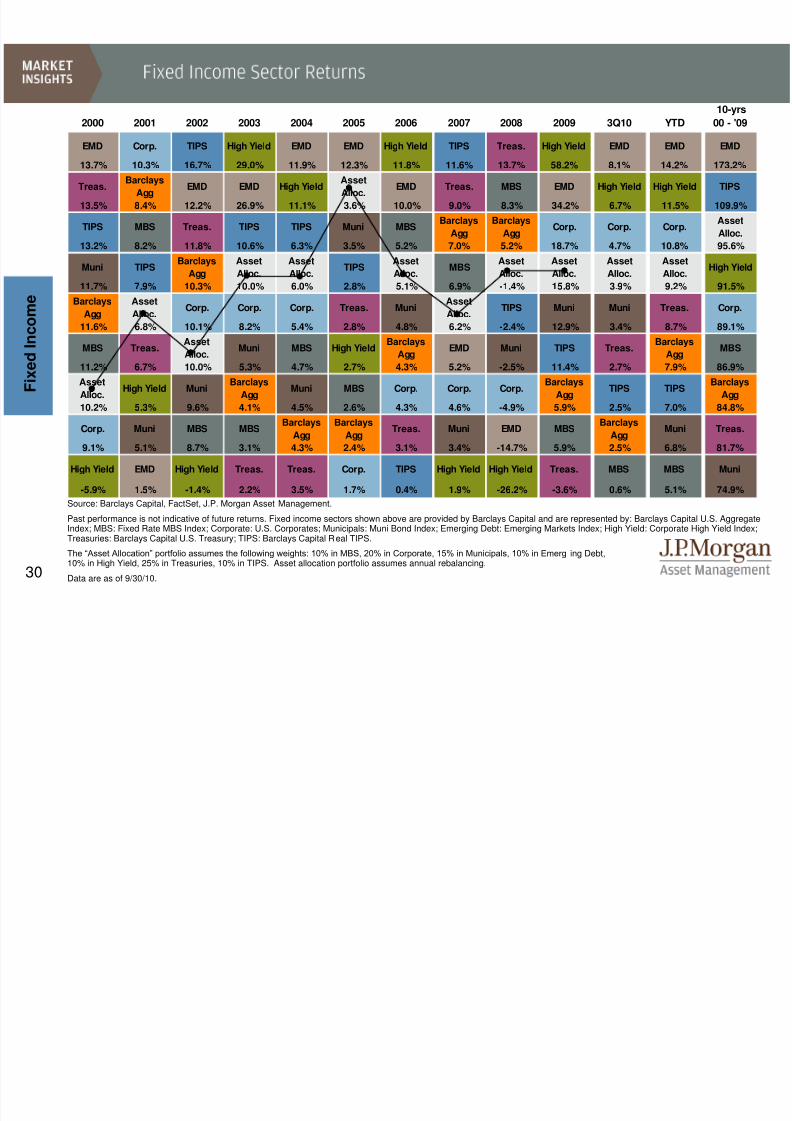
10-yrs
2000 2001 2002 2003 2004 2005 2006 2007 2008 2009 3Q10 YTD 00 - '09
EMD Corp. TIPS High Yield EMD EMD High Yield TIPS Treas. High Yield EMD EMD EMD
13.7% 10.3% 16.7% 29.0% 11.9% 12.3% 11.8% 11.6% 13.7% 58.2% 8.1% 14.2% 173.2%
Treas.Barclays
AggEMD EMD High Yield
Asset
Alloc.EMD Treas. MBS EMD High Yield High Yield TIPS
13.5% 8.4% 12.2% 26.9% 11.1% 3.6% 10.0% 9.0% 8.3% 34.2% 6.7% 11.5% 109.9%
TIPS MBS Treas. TIPS TIPS Muni MBSBarclays
Agg
Barclays
AggCorp. Corp. Corp.
Asset
Alloc.
13.2% 8.2% 11.8% 10.6% 6.3% 3.5% 5.2% 7.0% 5.2% 18.7% 4.7% 10.8% 95.6%
Muni TIPSBarclays
Agg
Asset
Alloc.
Asset
Alloc.TIPS
Asset
Alloc.MBS
Asset
Alloc.
Asset
Alloc.
Asset
Alloc.
Asset
Alloc.High Yield
11.7% 7.9% 10.3% 10.0% 6.0% 2.8% 5.1% 6.9% -1.4% 15.8% 3.9% 9.2% 91.5%
Barclays
Agg
Asset
Alloc.Corp. Corp. Corp. Treas. Muni
Asset
Alloc.TIPS Muni Muni Treas. Corp.
11.6% 6.8% 10.1% 8.2% 5.4% 2.8% 4.8% 6.2% -2.4% 12.9% 3.4% 8.7% 89.1%
MBS Treas.Asset
Alloc.Muni MBS High Yield
Barclays
AggEMD Muni TIPS Treas.
Barclays
AggMBS
11.2% 6.7% 10.0% 5.3% 4.7% 2.7% 4.3% 5.2% -2.5% 11.4% 2.7% 7.9% 86.9%
Asset
Alloc.High Yield Muni
Barclays
AggMuni MBS Corp. Corp. Corp.
Barclays
AggTIPS TIPS
Barclays
Agg
10.2% 5.3% 9.6% 4.1% 4.5% 2.6% 4.3% 4.6% -4.9% 5.9% 2.5% 7.0% 84.8%
Corp. Muni MBS MBSBarclays
Agg
Barclays
AggTreas. Muni EMD MBS
Barclays
AggMuni Treas.
9.1% 5.1% 8.7% 3.1% 4.3% 2.4% 3.1% 3.4% -14.7% 5.9% 2.5% 6.8% 81.7%
High Yield EMD High Yield Treas. Treas. Corp. TIPS High Yield High Yield Treas. MBS MBS Muni
-5.9% 1.5% -1.4% 2.2% 3.5% 1.7% 0.4% 1.9% -26.2% -3.6% 0.6% 5.1% 74.9%
Source: Barclays Capital, FactSet, J.P. Morgan Asset Management.
Past performance is not indicative of future returns. Fixed income sectors shown above are provided by Barclays Capital and are represented by: Barclays Capital U.S. AggregateIndex; MBS: Fixed Rate MBS Index; Corporate: U.S. Corporates; Municipals: Muni Bond Index; Emerging Debt: Emerging Markets Index; High Yield: Corporate High Yield Index;Treasuries: Barclays Capital U.S. Treasury; TIPS: Barclays Capital Real TIPS.
The “Asset Allocation” portfolio assumes the following weights: 10% in MBS, 20% in Corporate, 15% in Municipals, 10% in Emerg ing Debt,10% in High Yield, 25% in Treasuries, 10% in TIPS. Asset allocation portfolio assumes annual rebalancing.
Data are as of 9/30/10.
F i x e d I n c o m e
8/8/2019 JPM Guide to Markets
http://slidepdf.com/reader/full/jpm-guide-to-markets 32/58
31
'90 '92 '94 '96 '98 '00 '02 '04 '06 '08 '100%
1%
2%
3%
4%
5%
6%
7%
8%
9%
10%
'92 '94 '96 '98 '00 '02 '04 '06 '08 '100%
1%
2%
3%
4%
5%
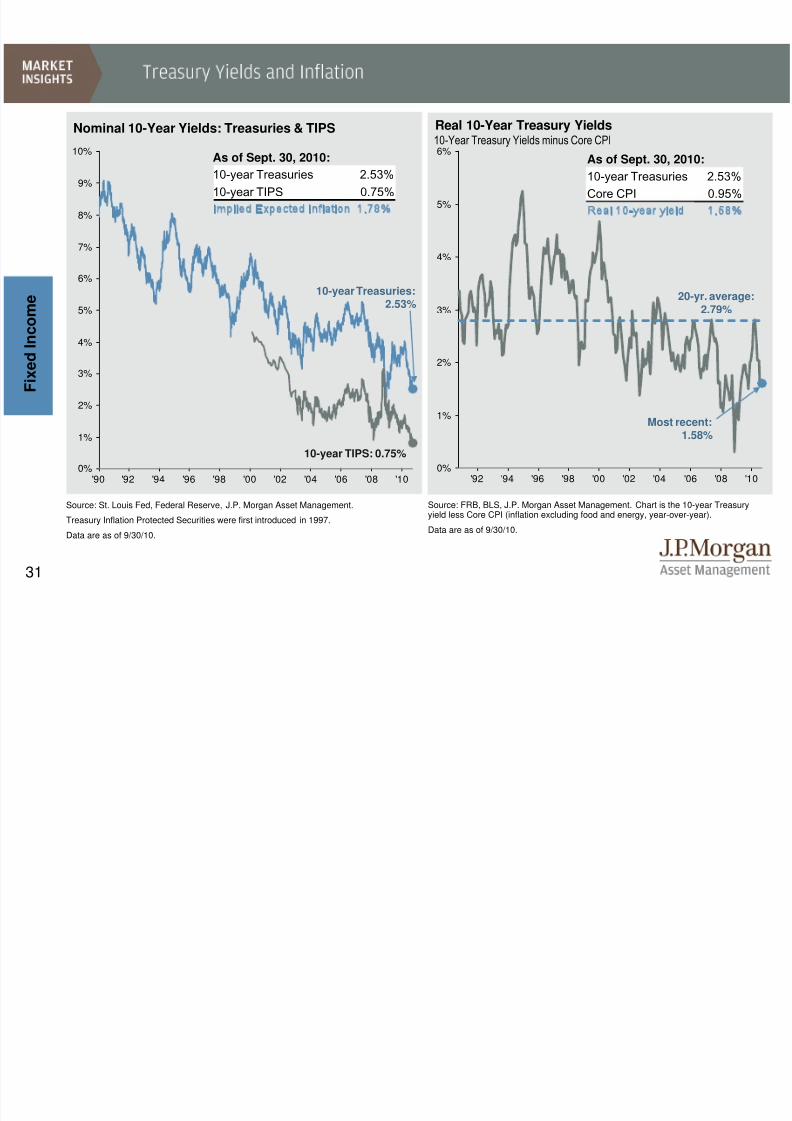
6%As of Sept. 30, 2010:
10-year Treasuries 2.53%
Core CPI 0.95%
Real 10-year yield 1.58%
Source: FRB, BLS, J.P. Morgan Asset Management. Chart is the 10-year Treasuryyield less Core CPI (inflation excluding food and energy, year-over-year).
Data are as of 9/30/10.
Real 10-Year Treasury Yields
F i x e d I n c o m e
Nominal 10-Year Yields: Treasuries & TIPS
20-yr. average:2.79%
10-year Treasuries:2.53%
10-year TIPS: 0.75%
Source: St. Louis Fed, Federal Reserve, J.P. Morgan Asset Management.
Treasury Inflation Protected Securities were first introduced in 1997.
Data are as of 9/30/10.
Most recent:1.58%
10-Year Treasury Yields minus Core CPIAs of Sept. 30, 2010:
10-year Treasuries 2.53%
10-year TIPS 0.75%
Implied Expected Inflation 1.78%
8/8/2019 JPM Guide to Markets
http://slidepdf.com/reader/full/jpm-guide-to-markets 33/58
32
12%14%
22%
19%
35%
41%
46%
51%52%52%
57%
61%
57%
0%
10%
20%
30%
40%
50%
60%
'78 '84 '89 '94 '00 '02 '03 '04 '05 '06 '07 '08 '09
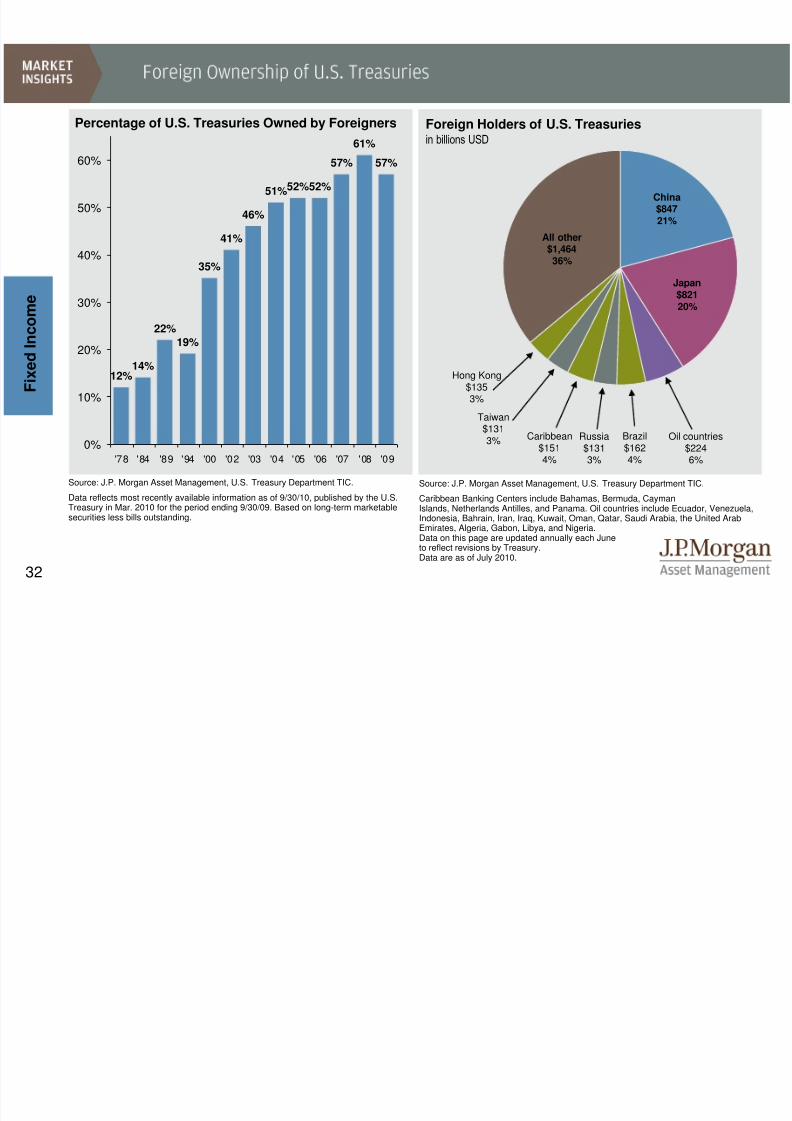
Source: J.P. Morgan Asset Management, U.S. Treasury Department TIC.
Data reflects most recently available information as of 9/30/10, published by the U.S.Treasury in Mar. 2010 for the period ending 9/30/09. Based on long-term marketablesecurities less bills outstanding.
Percentage of U.S. Treasuries Owned by Foreigners
F i x e d I n c o m e
Foreign Holders of U.S. Treasuries
in billions USD
All other$1,46436%
Japan$82120%
China$84721%
Brazil$1624%
Oil countries$2246%
Russia$1313%
Hong Kong$1353%
Caribbean$1514%
Source: J.P. Morgan Asset Management, U.S. Treasury Department TIC.
Caribbean Banking Centers include Bahamas, Bermuda, CaymanIslands, Netherlands Antilles, and Panama. Oil countries include Ecuador, Venezuela,Indonesia, Bahrain, Iran, Iraq, Kuwait, Oman, Qatar, Saudi Arabia, the United ArabEmirates, Algeria, Gabon, Libya, and Nigeria.Data on this page are updated annually each Juneto reflect revisions by Treasury.
Data are as of July 2010.
Taiwan$1313%
8/8/2019 JPM Guide to Markets
http://slidepdf.com/reader/full/jpm-guide-to-markets 34/58
33
0%
5%
10%
15%
20%
'88 '90 '92 '94 '96 '98 '00 '02 '04 '06 '08 '10
'96 '98 '00 '02 '04 '06 '08 '1060%
90%
120%
150%
180%
210%
240%
'01 '02 '03 '04 '05 '06 '07 '08 '09 '101%
2%
3%
4%
5%
6%
7%
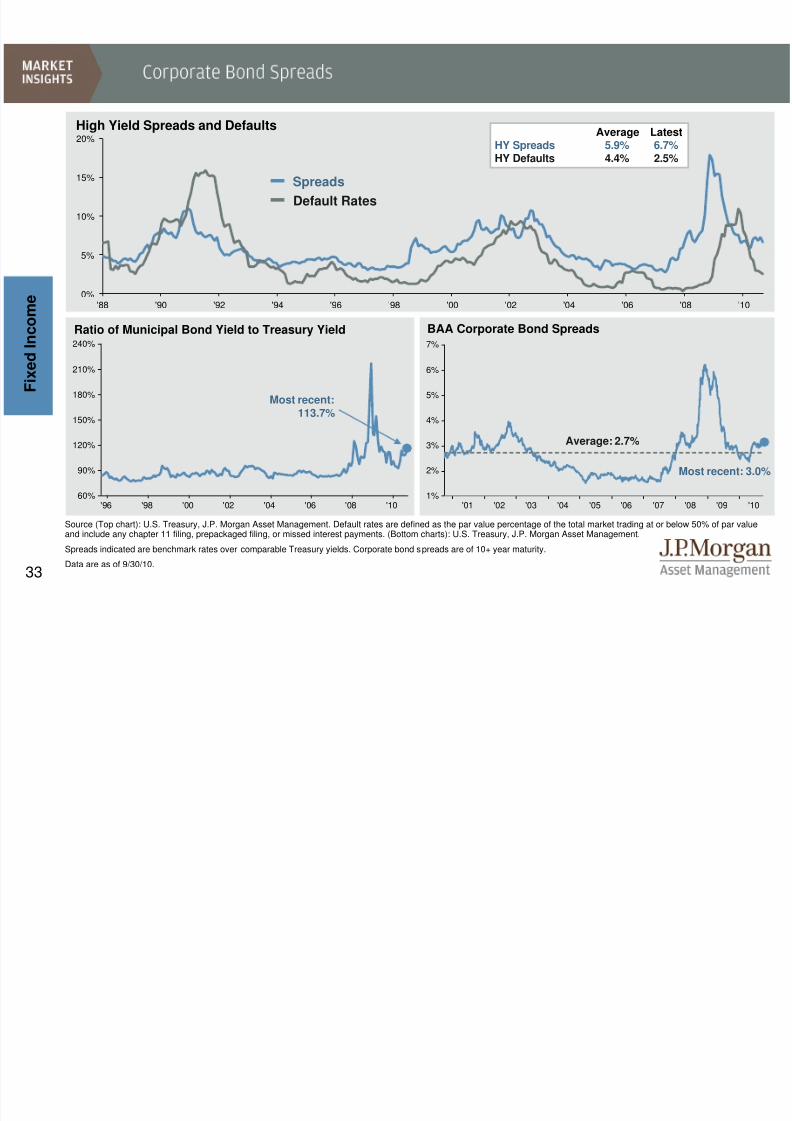
Source (Top chart): U.S. Treasury, J.P. Morgan Asset Management. Default rates are defined as the par value percentage of the total market trading at or below 50% of par valueand include any chapter 11 filing, prepackaged filing, or missed interest payments. (Bottom charts): U.S. Treasury, J.P. Morgan Asset Management.
Spreads indicated are benchmark rates over comparable Treasury yields. Corporate bond spreads are of 10+ year maturity.
Data are as of 9/30/10.
F i x e d I n c o m e
High Yield Spreads and Defaults
Ratio of Municipal Bond Yield to Treasury Yield BAA Corporate Bond Spreads
Most recent:113.7%
Most recent: 3.0%
Average: 2.7%
Average Latest
HY Spreads 5.9% 6.7%HY Defaults 4.4% 2.5%
Spreads
Default Rates
8/8/2019 JPM Guide to Markets
http://slidepdf.com/reader/full/jpm-guide-to-markets 35/58
34
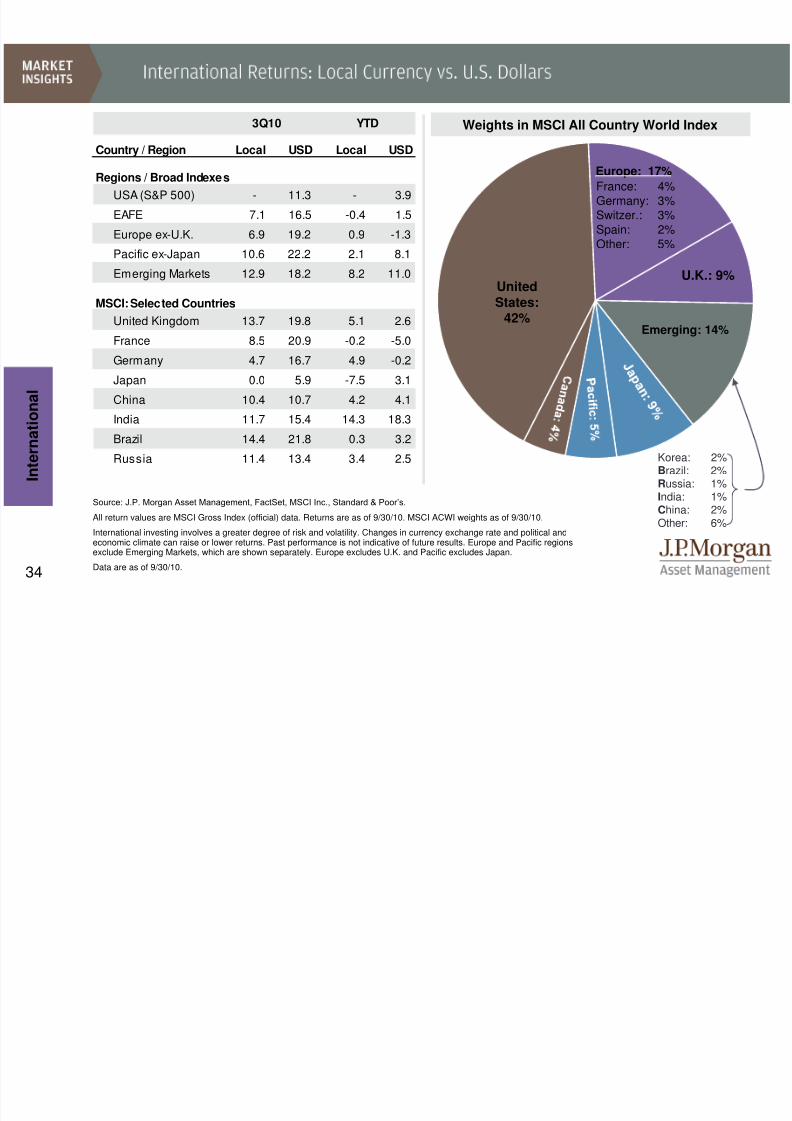
Source: J.P. Morgan Asset Management, FactSet, MSCI Inc., Standard & Poor’s.
All return values are MSCI Gross Index (official) data. Returns are as of 9/30/10. MSCI ACWI weights as of 9/30/10.
International investing involves a greater degree of risk and volatility. Changes in currency exchange rate and political andeconomic climate can raise or lower returns. Past performance is not indicative of future results. Europe and Pacific regionsexclude Emerging Markets, which are shown separately. Europe excludes U.K. and Pacific excludes Japan.
Data are as of 9/30/10.
I n t e r n a t i o
n a l
Weights in MSCI All Country World Index
UnitedStates:
42%
U.K.: 9%
France: 4%Germany: 3%Switzer.: 3%Spain: 2%Other: 5%
Korea: 2%Brazil: 2%Russia: 1%India: 1%China: 2%Other: 6%
Europe: 17%
Emerging: 14%
Country / Region
Regions / Broad Indexes
USA (S&P 500) - 11.3 - 3.9
EAFE 7.1 16.5 -0.4 1.5
Europe ex-U.K. 6.9 19.2 0.9 -1.3
Pacific ex-Japan 10.6 22.2 2.1 8.1
Emerging Markets 12.9 18.2 8.2 11.0
MSCI: Selected Countries
United Kingdom 13.7 19.8 5.1 2.6
France 8.5 20.9 -0.2 -5.0
Germany 4.7 16.7 4.9 -0.2
Japan 0.0 5.9 -7.5 3.1
China 10.4 10.7 4.2 4.1
India 11.7 15.4 14.3 18.3Brazil 14.4 21.8 0.3 3.2
Russia 11.4 13.4 3.4 2.5
3Q10 YTD
Local USD Local USD
8/8/2019 JPM Guide to Markets
http://slidepdf.com/reader/full/jpm-guide-to-markets 36/58
35
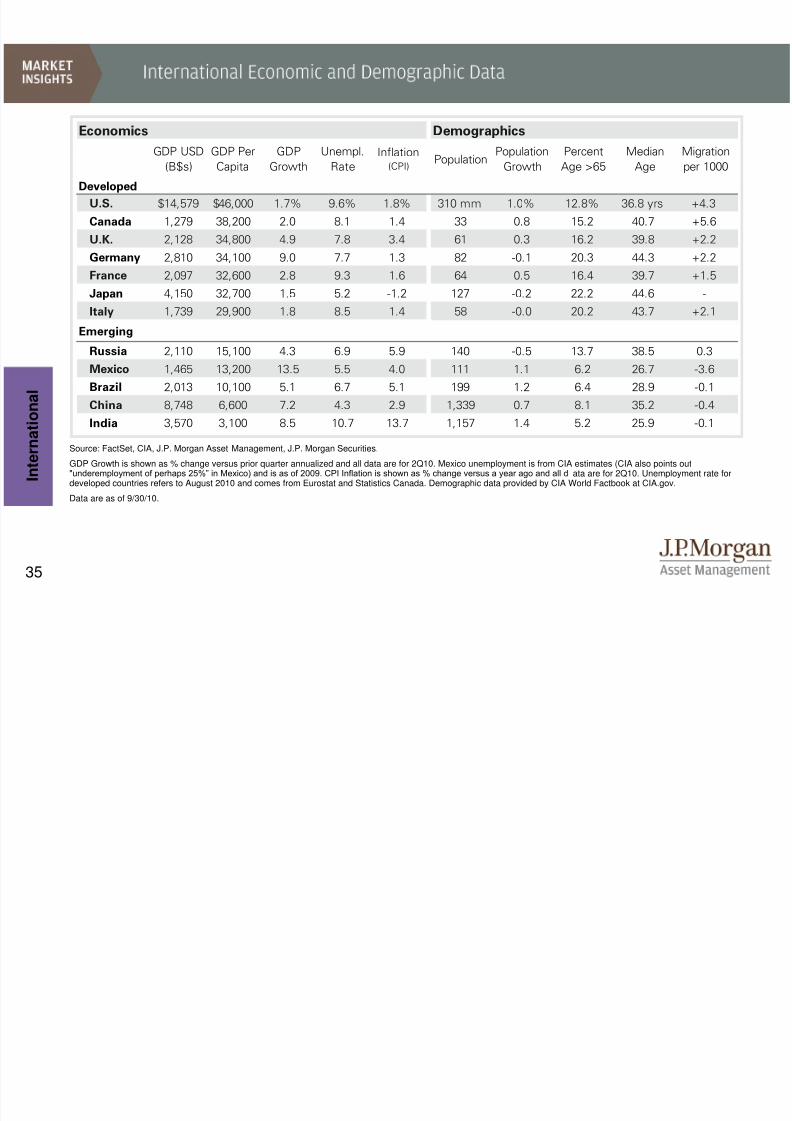
Source: FactSet, CIA, J.P. Morgan Asset Management, J.P. Morgan Securities.
GDP Growth is shown as % change versus prior quarter annualized and all data are for 2Q10. Mexico unemployment is from CIA estimates (CIA also points out"underemployment of perhaps 25%” in Mexico) and is as of 2009. CPI Inflation is shown as % change versus a year ago and all d ata are for 2Q10. Unemployment rate fordeveloped countries refers to August 2010 and comes from Eurostat and Statistics Canada. Demographic data provided by CIA World Factbook at CIA.gov.
Data are as of 9/30/10.
I n t e r n a t i o
n a l
Economics Demographics
GDP USD
(B$s)
GDP Per
Capita
GDP
Growth
Unempl.
RateInflation
(CPI)Population
Population
Growth
Percent
Age >65
Median
Age
Migration
per 1000
Developed
U.S. $14,579 $46,000 1.7% 9.6% 1.8% 310 mm 1.0% 12.8% 36.8 yrs +4.3
Canada 1,279 38,200 2.0 8.1 1.4 33 0.8 15.2 40.7 +5.6
U.K. 2,128 34,800 4.9 7.8 3.4 61 0.3 16.2 39.8 +2.2
Germany 2,810 34,100 9.0 7.7 1.3 82 -0.1 20.3 44.3 +2.2
France 2,097 32,600 2.8 9.3 1.6 64 0.5 16.4 39.7 +1.5
Japan 4,150 32,700 1.5 5.2 -1.2 127 -0.2 22.2 44.6 -
Italy 1,739 29,900 1.8 8.5 1.4 58 -0.0 20.2 43.7 +2.1
Emerging
Russia 2,110 15,100 4.3 6.9 5.9 140 -0.5 13.7 38.5 0.3
Mexico 1,465 13,200 13.5 5.5 4.0 111 1.1 6.2 26.7 -3.6
Brazil 2,013 10,100 5.1 6.7 5.1 199 1.2 6.4 28.9 -0.1
China 8,748 6,600 7.2 4.3 2.9 1,339 0.7 8.1 35.2 -0.4
India 3,570 3,100 8.5 10.7 13.7 1,157 1.4 5.2 25.9 -0.1
8/8/2019 JPM Guide to Markets
http://slidepdf.com/reader/full/jpm-guide-to-markets 37/58
36
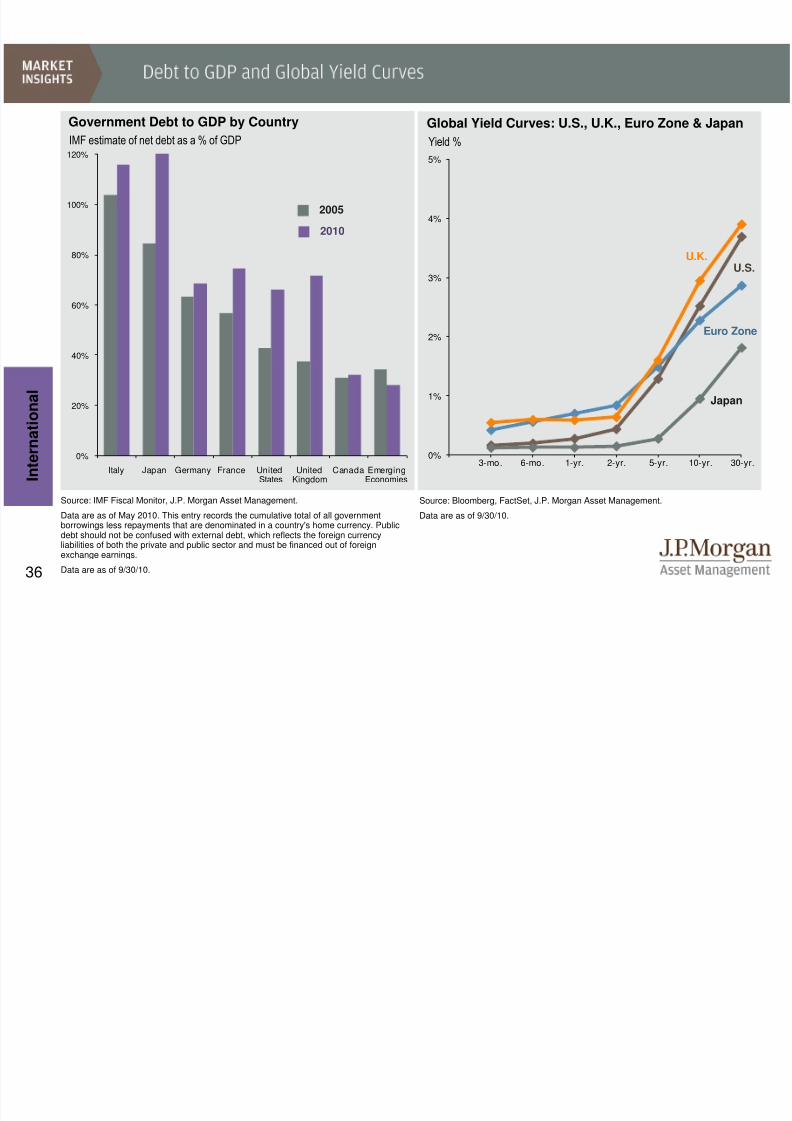
Source: IMF Fiscal Monitor, J.P. Morgan Asset Management.
Data are as of May 2010. This entry records the cumulative total of all governmentborrowings less repayments that are denominated in a country's home currency. Publicdebt should not be confused with external debt, which reflects the foreign currencyliabilities of both the private and public sector and must be financed out of foreign
exchange earnings.Data are as of 9/30/10.
I n t e r n a t i o
n a l
IMF estimate of net debt as a % of GDP
Government Debt to GDP by Country
2005
2010
0%
20%
40%
60%
80%
100%
120%
Italy Japan Germany France UnitedStates
UnitedKingdom
Canada EmergingEconomies
Global Yield Curves: U.S., U.K., Euro Zone & Japan
Yield %
U.S.
Japan
U.K.
Euro Zone
Source: Bloomberg, FactSet, J.P. Morgan Asset Management.
Data are as of 9/30/10.
0%
1%
2%
3%
4%
5%
3-mo. 6-mo. 1-yr. 2-yr. 5-yr. 10-yr. 30-yr.

8/8/2019 JPM Guide to Markets
http://slidepdf.com/reader/full/jpm-guide-to-markets 38/58
37
Source: FactSet, IMF’s April Global Financial Stability Report, J.P. Morgan Asset Management.
The Structural Deficit represents what the deficit would be if the economy were operating at its potential. Net government debt is equal to grossgovernment debt less government assets.
Data are as of 9/30/10.
I n t e r n a t i o
n a l
Fiscal and Debt Fundamentals
10-yr. Note
Yield
9/30/10
10-yr. Note
Yield
9/30/09
Stuctural
Govt. Deficit
Net
Govt. Debt
Govt. Debt
< 1 yr. to
Maturity
Current
Account
Balance
Govt. Debt
Held Abroad
Developed (G7) % %
Canada 2.8 3.3 3.0 31.8 14.1 -2.6 14.1
France 2.6 3.5 4.6 74.5 17.2 -1.9 48.7
Germany 2.3 3.2 3.8 68.6 15.8 5.5 40.3
Italy 3.9 4.0 3.5 116.0 24.5 -2.8 56.4
Japan 0.9 1.3 7.5 121.7 48.7 2.8 13.7
United Kingdom 2.9 3.6 7.6 71.6 6.6 -1.7 17.9
United States 2.5 3.3 9.2 66.2 17.9 -3.3 24.7
Distressed Sovereigns
Greece 10.4 4.2 8.9 104.3 15.9 -9.7 99.0
Ireland 6.7 4.5 7.9 47.8 3.3 0.4 47.2Portugal 6.2 3.6 7.1 81.6 13.0 -9.0 60.2
Spain 4.1 3.8 7.3 57.5 12.4 -5.3 26.9
External Funding
% of 2010 GDP % of 2010 GDP
Market Interest Rates
8/8/2019 JPM Guide to Markets
http://slidepdf.com/reader/full/jpm-guide-to-markets 39/58
38
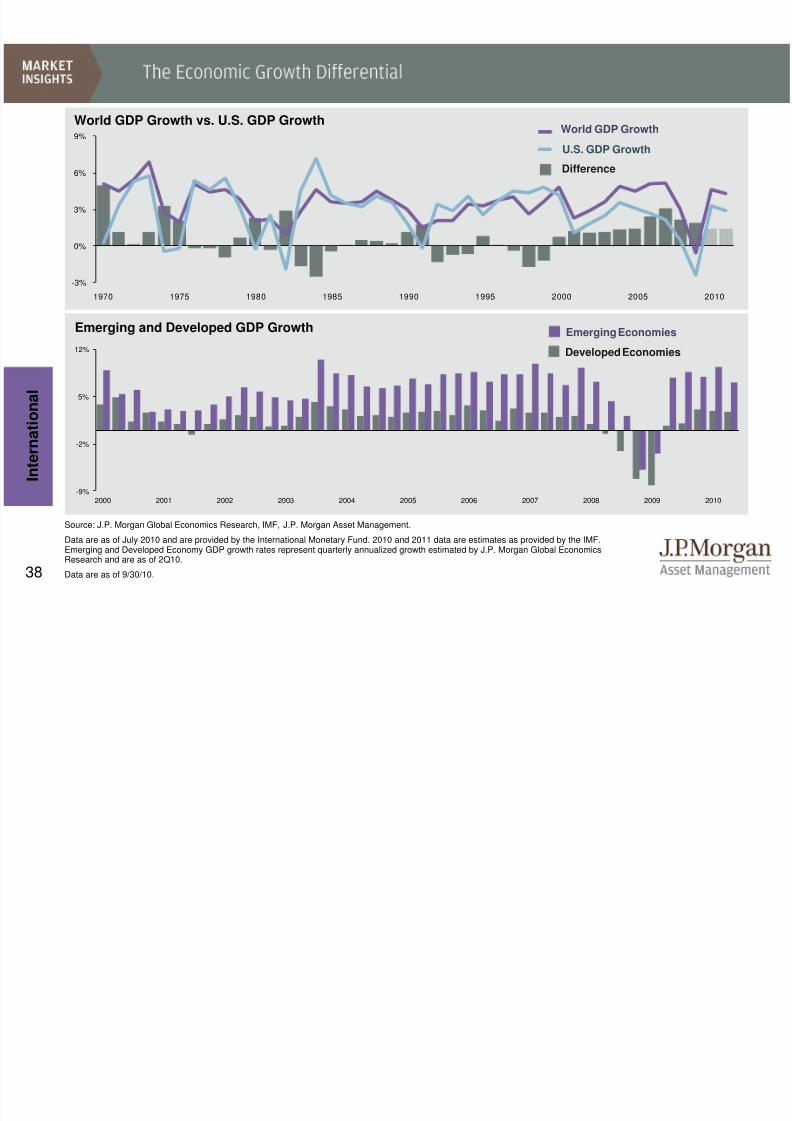
Source: J.P. Morgan Global Economics Research, IMF, J.P. Morgan Asset Management.
Data are as of July 2010 and are provided by the International Monetary Fund. 2010 and 2011 data are estimates as provided by the IMF.Emerging and Developed Economy GDP growth rates represent quarterly annualized growth estimated by J.P. Morgan Global Economics
Research and are as of 2Q10.
Data are as of 9/30/10.
I n t e r n a t i o
n a l
U.S. GDP Growth
World GDP Growth
Difference
World GDP Growth vs. U.S. GDP Growth
Emerging and Developed GDP Growth Emerging Economies
Developed Economies
-3%
0%
3%
6%
9%
1970 1975 1980 1985 1990 1995 2000 2005 2010
-9%
-2%
5%
12%
2000 2001 2002 2003 2004 2005 2006 2007 2008 2009 2010
8/8/2019 JPM Guide to Markets
http://slidepdf.com/reader/full/jpm-guide-to-markets 40/58
39
'92 '94 '96 '98 '00 '02 '04 '06 '08 '1065
70
75
80
85
90
95
100
105
110
115
'92 '94 '96 '98 '00 '02 '04 '06 '08 '10
-8%
-6%
-4%
-2%
0%
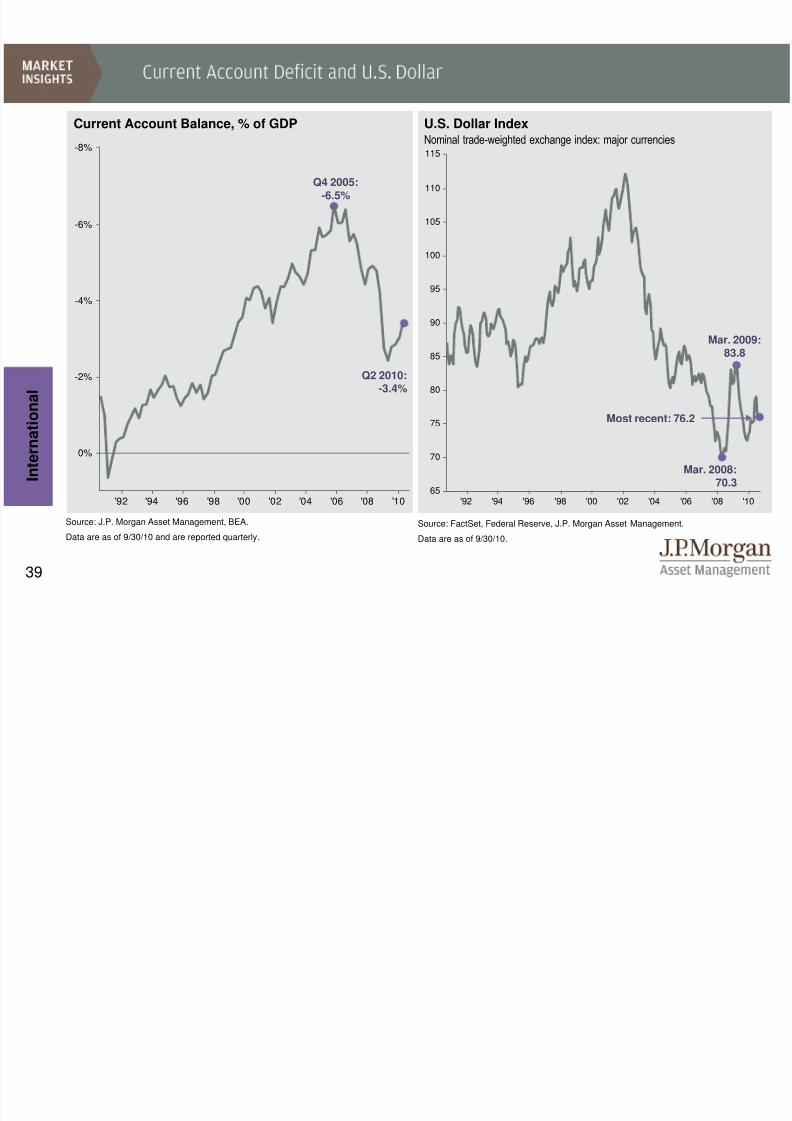
Source: J.P. Morgan Asset Management, BEA.
Data are as of 9/30/10 and are reported quarterly.
Current Account Balance, % of GDP
I n t e r n a t i o
n a l
Source: FactSet, Federal Reserve, J.P. Morgan Asset Management.
Data are as of 9/30/10.
U.S. Dollar Index
Q2 2010:-3.4%
Nominal trade-weighted exchange index: major currencies
Q4 2005:-6.5%
Mar. 2009:83.8
Mar. 2008:70.3
Most recent: 76.2
8/8/2019 JPM Guide to Markets
http://slidepdf.com/reader/full/jpm-guide-to-markets 41/58
40
'95 '96 '97 '98 '99 '00 '01 '02 '03 '04 '05 '06 '07 '08 '09 '10
I n t e r n a t i o n a l
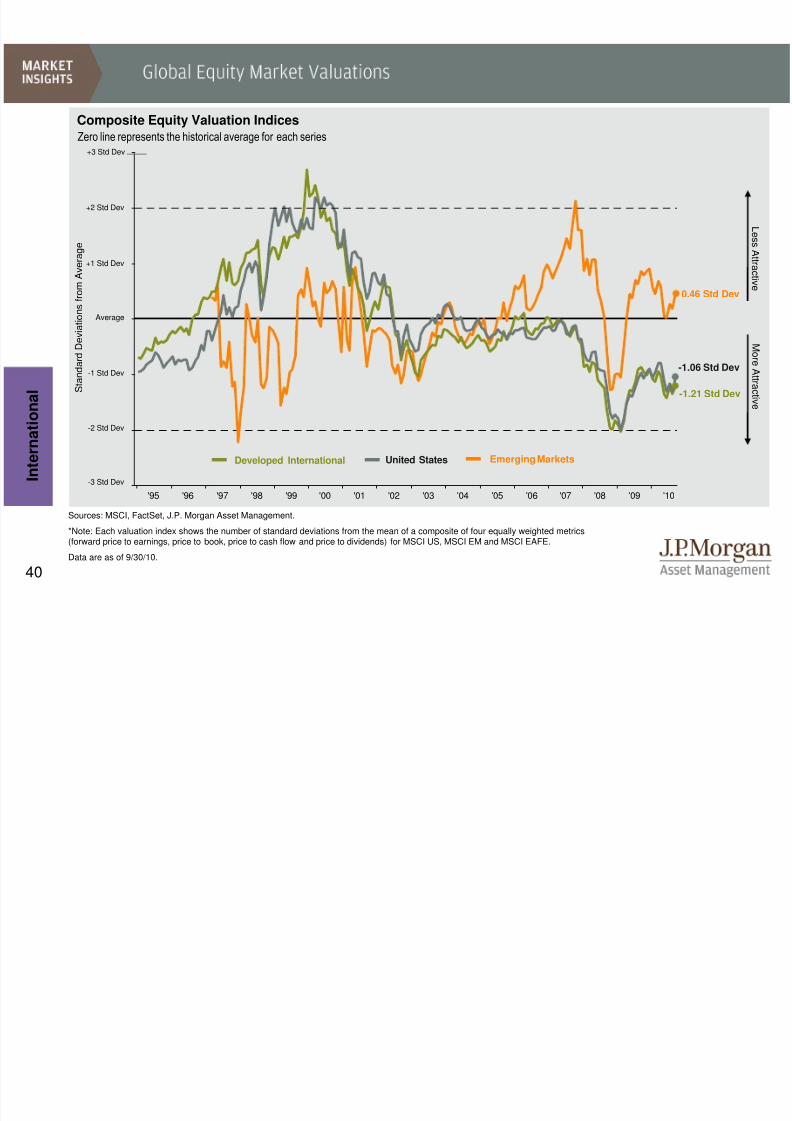
Sources: MSCI, FactSet, J.P. Morgan Asset Management.
*Note: Each valuation index shows the number of standard deviations from the mean of a composite of four equally weighted metrics(forward price to earnings, price to book, price to cash flow and price to dividends) for MSCI US, MSCI EM and MSCI EAFE.
Data are as of 9/30/10.
-1.21 Std Dev
-1.06 Std Dev
Composite Equity Valuation Indices
0.46 Std Dev
Zero line represents the historical average for each series
M or eA t t r a c t i v e
L e s s A t t r a c
t i v e
S t a n d a r d D e v i a t i o n s f r o m
A v e r a g e
Developed International United States Emerging Markets
+3 Std Dev
+2 Std Dev
+1 Std Dev
Average
-1 Std Dev
-2 Std Dev
-3 Std Dev
8/8/2019 JPM Guide to Markets
http://slidepdf.com/reader/full/jpm-guide-to-markets 42/58
41
-$60
-$40
-$20
$0
$20
Aug '07 Feb '08 Aug '08 Feb '09 Aug '09 Feb '10 Aug '10
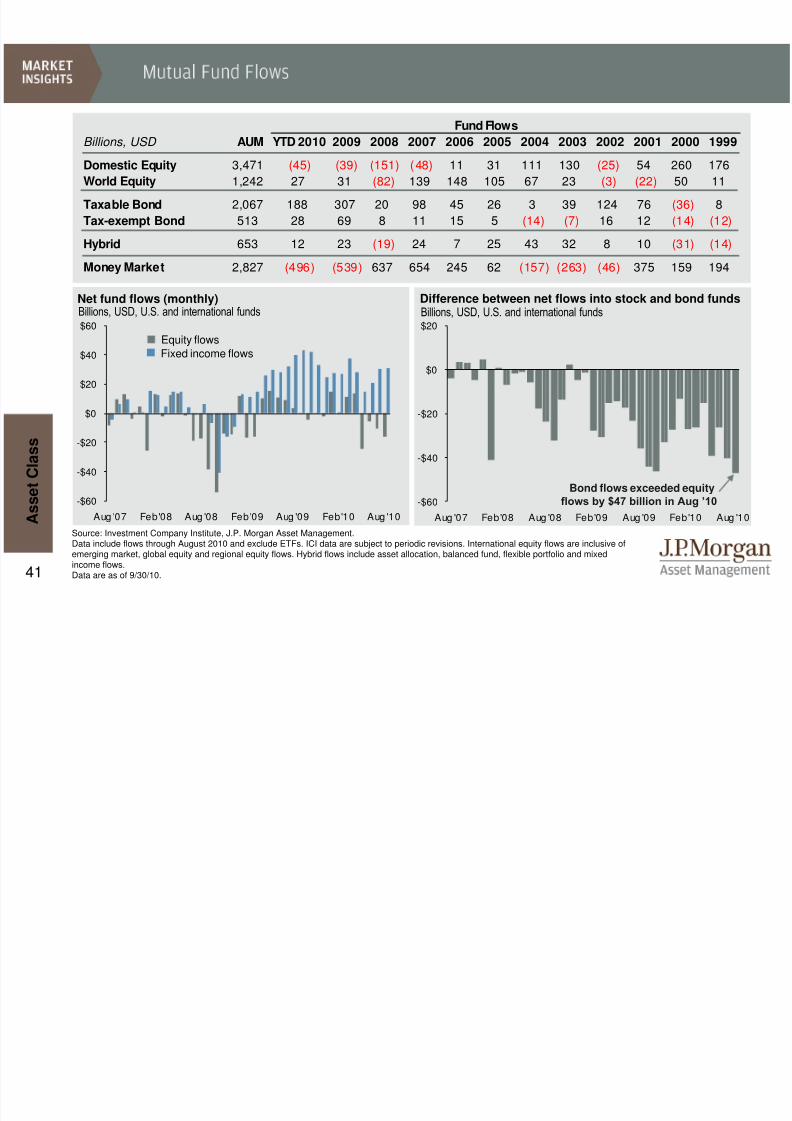
Source: Investment Company Institute, J.P. Morgan Asset Management.Data include flows through August 2010 and exclude ETFs. ICI data are subject to periodic revisions. International equity flows are inclusive ofemerging market, global equity and regional equity flows. Hybrid flows include asset allocation, balanced fund, flexible portfolio and mixedincome flows.Data are as of 9/30/10.
Difference between net flows into stock and bond fundsNet fund flows (monthly)Billions, USD, U.S. and international fundsBillions, USD, U.S. and international funds
Equity flows
Fixed income flows
Bond flows exceeded equityflows by $47 billion in Aug ’10
A s s e t C l a s s
Fund Flows
Billions, USD AUM YTD 2010 2009 2008 2007 2006 2005 2004 2003 2002 2001 2000 1999
Domestic Equity 3,471 (45) (39) (151) (48) 11 31 111 130 (25) 54 260 176
World Equity 1,242 27 31 (82) 139 148 105 67 23 (3) (22) 50 11
Taxable Bond 2,067 188 307 20 98 45 26 3 39 124 76 (36) 8
Tax-exempt Bond 513 28 69 8 11 15 5 (14) (7) 16 12 (14) (12)
Hybrid 653 12 23 (19) 24 7 25 43 32 8 10 (31) (14)
Money Market 2,827 (496) (539) 637 654 245 62 (157) (263) (46) 375 159 194
-$60
-$40
-$20
$0
$20
$40
$60
Aug '07 Feb '08 Aug '08 Feb '09 Aug '09 Feb '10 Aug '10
8/8/2019 JPM Guide to Markets
http://slidepdf.com/reader/full/jpm-guide-to-markets 43/58
42
Equity Dividend Yields
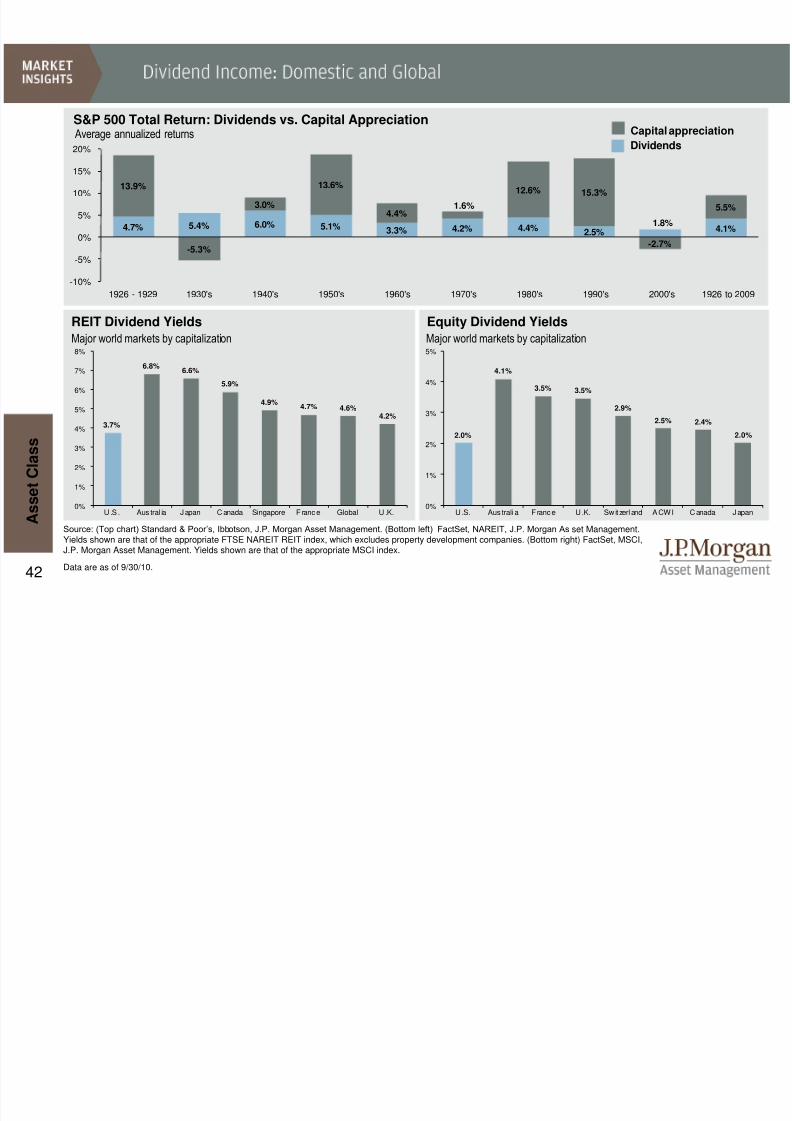
Source: (Top chart) Standard & Poor’s, Ibbotson, J.P. Morgan Asset Management. (Bottom left) FactSet, NAREIT, J.P. Morgan Asset Management.Yields shown are that of the appropriate FTSE NAREIT REIT index, which excludes property development companies. (Bottom right) FactSet, MSCI,J.P. Morgan Asset Management. Yields shown are that of the appropriate MSCI index.
Data are as of 9/30/10.
S&P 500 Total Return: Dividends vs. Capital Appreciation
REIT Dividend Yields
Major world markets by capitalization Major world markets by capitalization
A s s e t C l a s s
4.7% 5.4% 6.0% 5.1% 3.3% 4.2% 4.4% 2.5%1.8%
4.1%
13.9%
-5.3%
3.0%
13.6%
4.4%1.6%
12.6% 15.3%
-2.7%
5.5%
-10%
-5%
0%
5%
10%
15%
20%
1926 - 1929 1930's 1940's 1950's 1960's 1970's 1980's 1990's 2000's 1926 to 2009
Average annualized returns Capital appreciation
Dividends
2.0%
4.1%
3.5% 3.5%
2.9%
2.5% 2.4%
2.0%
0%
1%
2%
3%
4%
5%
U .S. Aus trali a F rance U .K. Sw it zerland ACWI C anada Japan
3.7%
6.8%6.6%
5.9%
4.9%4.7% 4.6%
4.2%
0%
1%
2%
3%
4%
5%
6%
7%
8%
U .S . Aus tral ia Japan C anada Singapore F rance Global U .K.
8/8/2019 JPM Guide to Markets
http://slidepdf.com/reader/full/jpm-guide-to-markets 44/58
43
7%
9%
11%
13%
15%
1947 1957 1967 1977 1987 1997 2007
0%
20%
40%
60%
80%
100%
1930's 1940's 1950's 1960's 1970's 1980's 1990's 2000's Current
0%
20%
40%
60%
80%
1980 1983 1986 1989 1992 1995 1998 2001 2004 2007
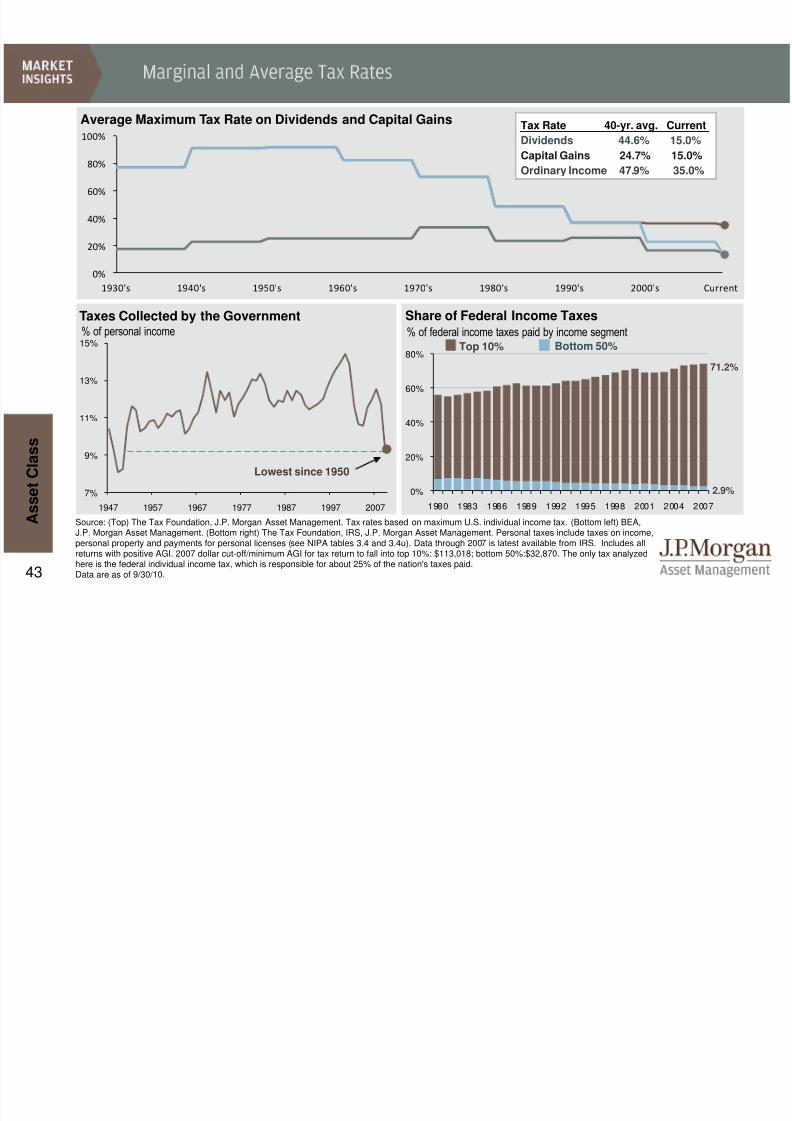
Average Maximum Tax Rate on Dividends and Capital Gains Tax Rate 40-yr. avg. Current
Dividends 44.6% 15.0%Capital Gains 24.7% 15.0%
Ordinary Income 47.9% 35.0%
A s s e t C l a s s
Source: (Top) The Tax Foundation, J.P. Morgan Asset Management. Tax rates based on maximum U.S. individual income tax. (Bottom left) BEA,J.P. Morgan Asset Management. (Bottom right) The Tax Foundation, IRS, J.P. Morgan Asset Management. Personal taxes include taxes on income,personal property and payments for personal licenses (see NIPA tables 3.4 and 3.4u). Data through 2007 is latest available from IRS. Includes allreturns with positive AGI. 2007 dollar cut-off/minimum AGI for tax return to fall into top 10%: $113,018; bottom 50%:$32,870. The only tax analyzedhere is the federal individual income tax, which is responsible for about 25% of the nation's taxes paid.Data are as of 9/30/10.
Taxes Collected by the Government% of personal income
Lowest since 1950
Share of Federal Income Taxes
Bottom 50%Top 10%
% of federal income taxes paid by income segment
2.9%
71.2%
8/8/2019 JPM Guide to Markets
http://slidepdf.com/reader/full/jpm-guide-to-markets 45/58
44
'00 '01 '02 '03 '04 '05 '06 '07 '08 '09 '10$4,000
$5,000
$6,000
$7,000
$8,000
$9,000
$10,000
$11,000
A s s e t C l a s s
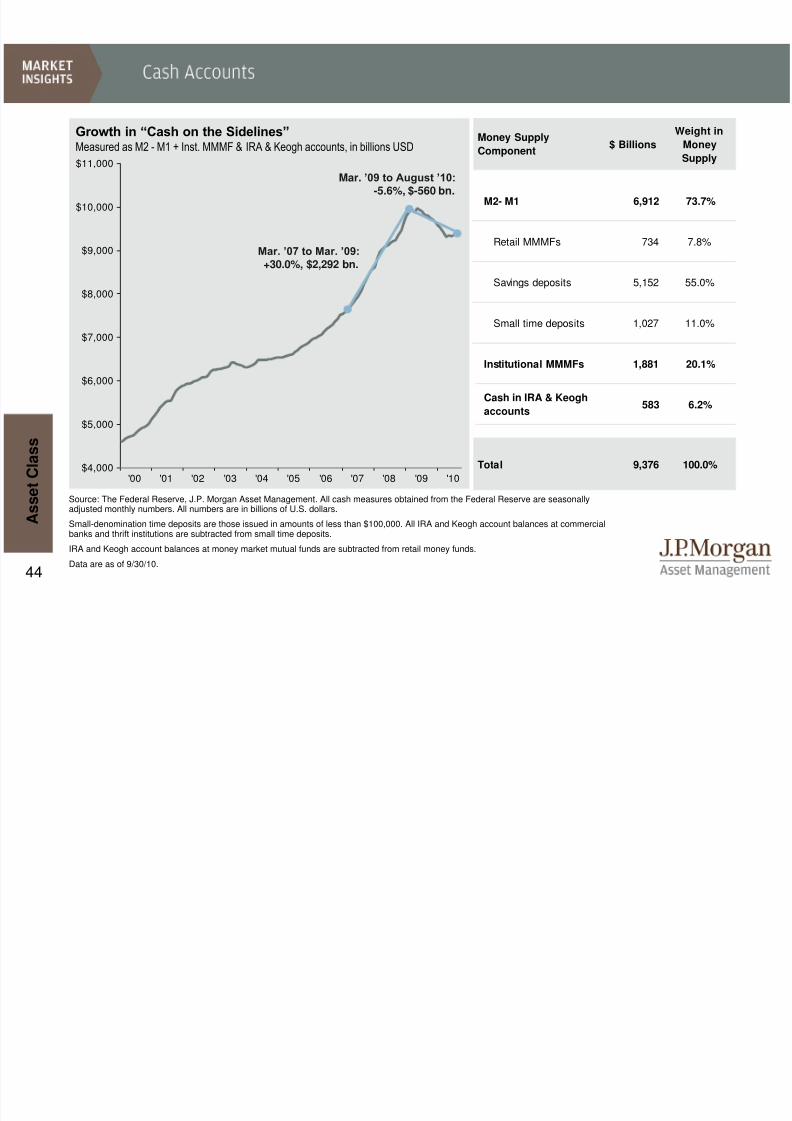
Source: The Federal Reserve, J.P. Morgan Asset Management. All cash measures obtained from the Federal Reserve are seasonallyadjusted monthly numbers. All numbers are in billions of U.S. dollars.
Small-denomination time deposits are those issued in amounts of less than $100,000. All IRA and Keogh account balances at commercialbanks and thrift institutions are subtracted from small time deposits.
IRA and Keogh account balances at money market mutual funds are subtracted from retail money funds.
Data are as of 9/30/10.
Measured as M2 - M1 + Inst. MMMF & IRA & Keogh accounts, in billions USD
Growth in “Cash on the Sidelines”
Mar. ’09 to August ’10:-5.6%, $-560 bn.
Mar. ’07 to Mar. ’09:+30.0%, $2,292 bn.
$ Billions
Weight in
MoneySupply
M2- M1 6,912 73.7%
Retail MMMFs 734 7.8%
Savings deposits 5,152 55.0%
Small time deposits 1,027 11.0%
Institutional MMMFs 1,881 20.1%
583 6.2%
Total 9,376 100.0%
Money Supply
Component
Cash in IRA & Keogh
accounts
8/8/2019 JPM Guide to Markets
http://slidepdf.com/reader/full/jpm-guide-to-markets 46/58
45
'70 '75 '80 '85 '90 '95 '00 '05 '10$0
$200
$400
$600
$800
$1,000
$1,200
$1,400
'70 '75 '80 '85 '90 '95 '00 '05 '10$0
$20
$40
$60
$80
$100
$120
$140
$160
-3%
-2%
-1%
0%
1%
2%
3%
4%
2000 2001 2002 2003 2004 2005 2006 2007 2008 2009
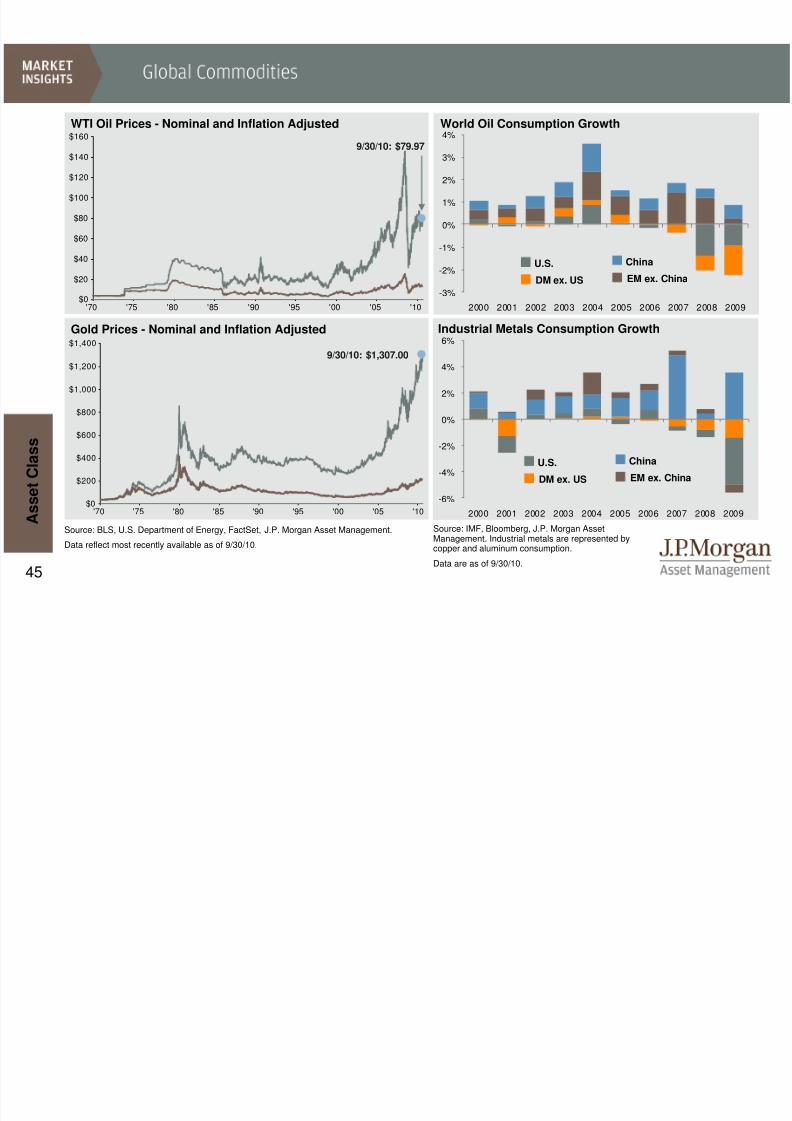
Source: BLS, U.S. Department of Energy, FactSet, J.P. Morgan Asset Management.
Data reflect most recently available as of 9/30/10.
Source: IMF, Bloomberg, J.P. Morgan AssetManagement. Industrial metals are represented bycopper and aluminum consumption.
Data are as of 9/30/10.
World Oil Consumption Growth
Industrial Metals Consumption Growth
-6%
-4%
-2%
0%
2%
4%
6%
2000 2001 2002 2003 2004 2005 2006 2007 2008 2009
EM ex. China
China
DM ex. US
U.S.
A s s e t C l a s s
EM ex. China
China
DM ex. US
U.S.
Gold Prices - Nominal and Inflation Adjusted
WTI Oil Prices - Nominal and Inflation Adjusted
9/30/10: $79.97
9/30/10: $1,307.00
8/8/2019 JPM Guide to Markets
http://slidepdf.com/reader/full/jpm-guide-to-markets 47/58
46
10-yrs
2000 2001 2002 2003 2004 2005 2006 2007 2008 2009 3Q10 YTD '00 - '09
RealEstate
RealEstate
DJ UBSCmdty
MSCIEM E
RealEstate
MSCIEM E
RealEstate
MSCIEM E
BarclaysAgg
MSCIEM E
MSCIEM E
RealEstate
RealEstate
26.4% 13.9% 23.9% 56.3% 31.6% 34.5% 35.1% 39.8% 5.2% 79.0% 18.2% 19.1% 174.5%
DJ UBSCmdty
MarketNeutral
BarclaysAgg
Russell2000
MSCIEM E
DJ UBSCmdty
MSCIEM E
MSCIEAFE
MarketNeutral
MSCIEAFE
MSCIEAFE
MSCIEM E
MSCIEM E
24.2% 9.3% 10.3% 47.3% 26.0% 17.6% 32.6% 11.6% 1.1%* 32.5% 16.5% 11.0% 162.0%
MarketNeutral
BarclaysAgg
MarketNeutral
MSCIEAFE
MSCIEAFE
MSCIEAFE
MSCIEAFE
DJ UBSCmdty
AssetAlloc.
RealEstate
RealEstate
Russell2000
MarketNeutral
15.0% 8.4% 7.4% 39.2% 20.7% 14.0% 26.9% 11.1% -23.8% 28.0% 12.8% 9.1% 108.7%
BarclaysAgg
Russell2000
RealEstate
RealEstate
Russell2000
RealEstate
Russell2000
MarketNeutral
Russell2000
Russell2000
DJ UBSCmdty
BarclaysAgg
BarclaysAgg
11.6% 2.5% 3.8% 37.1% 18.3% 12.2% 18.4% 9.3% -33.8% 27.2% 11.6% 7.9% 84.8%
AssetAlloc.
MSCIEM E
AssetAlloc.
S&P500
AssetAlloc.
AssetAlloc.
S&P500
AssetAlloc.
DJ UBSCmdty
S&P500
S&P500
AssetAlloc.
AssetAlloc.
0.6% -2.4% -5.4% 28.7% 12.5% 8.0% 15.8% 7.3% -36.6% 26.5% 11.3% 6.0% 60.8%
Russell2000
AssetAlloc.
MSCIEM E
AssetAlloc.
S&P500
MarketNeutral
AssetAlloc.
BarclaysAgg
S&P500
AssetAlloc.
Russell2000
S&P500
DJ UBSCmdty
-3.0% -3.4% -6.0% 25.2% 10.9% 6.1% 14.9% 7.0% -37.0% 22.5% 11.3% 3.9% 50.9%
S&P500
S&P500
MSCIEAFE
DJ UBSCmdty
DJ UBSCmdty
S&P500
MarketNeutral
S&P500
RealEstate
DJ UBSCmdty
AssetAlloc.
MSCIEAFE
Russell2000
-9.1% -11.9% -15.7% 22.7% 7.6% 4.9% 11.2% 5.5% -37.7% 18.7% 9.3% 1.5% 41.3%
MSCIEAFE MSCIEAFE Russell2000 MarketNeutral MarketNeutral Russell2000 BarclaysAgg Russell2000 MSCIEAFE BarclaysAgg BarclaysAgg DJ UBSCmdty MSCIEAFE
-14.0% -21.2% -20.5% 7.1% 6.5% 4.6% 4.3% -1.6% -43.1% 5.9% 2.5% 0.8% 17.0%
MSCIEM E
DJ UBSCmdty
S&P500
BarclaysAgg
BarclaysAgg
BarclaysAgg
DJ UBSCmdty
RealEstate
MSCIEM E
MarketNeutral
MarketNeutral
MarketNeutral
S&P500
-30.6% -22.3% -22.1% 4.1% 4.3% 2.4% -2.7% -15.7% -53.2% 4.1% 0.1% -0.6% -9.1%
A s s e t C l a s s
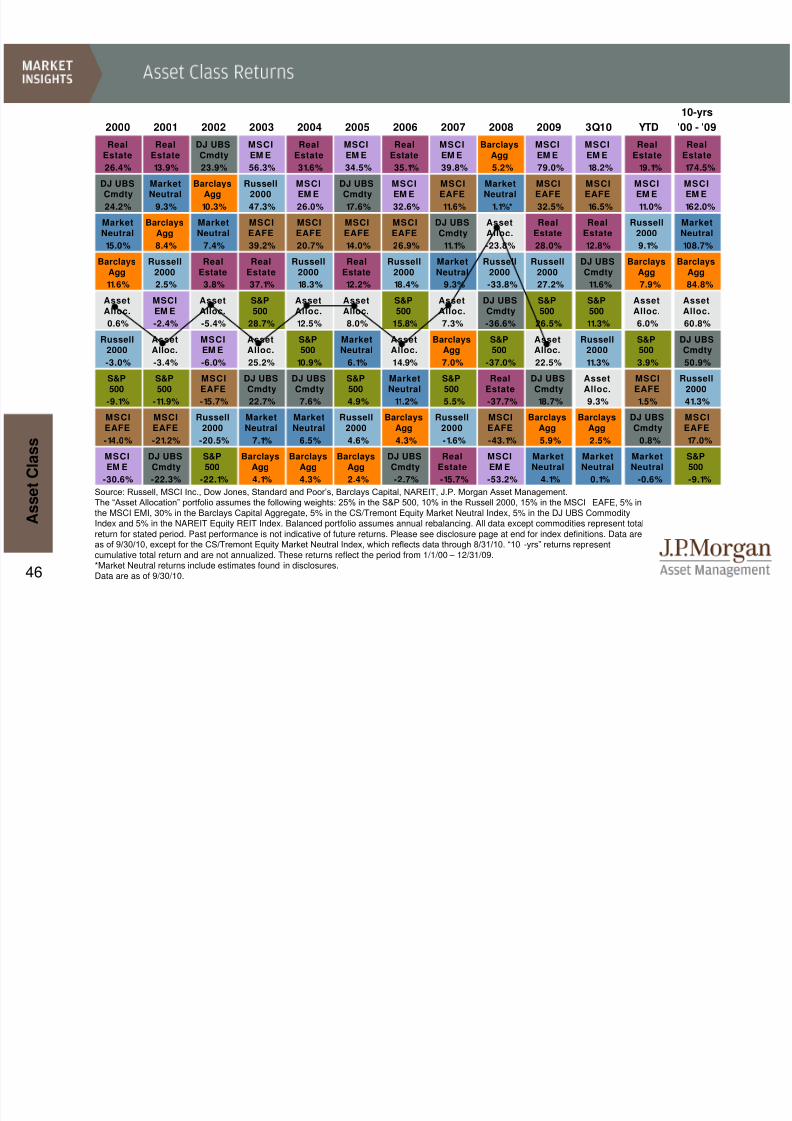
Source: Russell, MSCI Inc., Dow Jones, Standard and Poor’s, Barclays Capital, NAREIT, J.P. Morgan Asset Management.
The “Asset Allocation” portfolio assumes the following weights: 25% in the S&P 500, 10% in the Russell 2000, 15% in the MSCI EAFE, 5% inthe MSCI EMI, 30% in the Barclays Capital Aggregate, 5% in the CS/Tremont Equity Market Neutral Index, 5% in the DJ UBS CommodityIndex and 5% in the NAREIT Equity REIT Index. Balanced portfolio assumes annual rebalancing. All data except commodities represent totalreturn for stated period. Past performance is not indicative of future returns. Please see disclosure page at end for index definitions. Data areas of 9/30/10, except for the CS/Tremont Equity Market Neutral Index, which reflects data through 8/31/10. “10 -yrs” returns repr esentcumulative total return and are not annualized. These returns reflect the period from 1/1/00 – 12/31/09.*Market Neutral returns include estimates found in disclosures.Data are as of 9/30/10.

8/8/2019 JPM Guide to Markets
http://slidepdf.com/reader/full/jpm-guide-to-markets 48/58
47
Source: Standard & Poor’s, Russell, Barclays Capital Inc., MSCI Inc., Credit Suisse/Tremont, NCREIF, DJ UBS, J.P. Morgan Asse t Management.
Indexes used – Large Cap: S&P 500 Index; Small Cap: Russell 2000; EAFE: MSCI EAFE; EME: MSCI Emerging Markets; Bonds: BarclaysCapital Aggregate; Corp HY: Barclays Capital Corporate High Yield; EMD: Barclays Capital Emerging Market; Cmdty.: DJ UBS Commodity Index;Real Estate: NCREIF Property Index; Hedge Funds: CS/Tremont Multi-Strategy Index; Equity Market Neutral: CS/Tremont Equity Market NeutralIndex. *Market Neutral returns include estimates found in disclosures.
All correlation coefficients calculated based on quarterly total return data for period 6/30/00 to 6/30/10.
This chart is for illustrative purposes only.Data are as of 9/30/10.
A s s e t C l a s s
Large
Cap
Small
Cap EAFE EME
Core
Bonds
Corp.
HY EMD Cmdty.
Real
Estate
Hedge
Funds
Eq
Market
Neutral*
Large Cap 1.00 0.94 0.91 0.86 -0.37 0.73 0.68 0.36 0.18 0.75 0.34
Small Cap 1.00 0.85 0.82 -0.39 0.67 0.61 0.27 0.16 0.68 0.34
EAFE 1.00 0.90 -0.28 0.69 0.61 0.48 0.17 0.80 0.50
EME 1.00 -0.30 0.77 0.68 0.48 0.11 0.79 0.36
Core Bonds 1.00 -0.13 0.07 -0.16 -0.12 -0.18 0.07
Corp. HY 1.00 0.83 0.45 -0.08 0.74 0.32
EMD 1.00 0.44 0.03 0.64 0.27
Commodities 1.00 0.28 0.64 0.43
Real Estate 1.00 0.27 0.28
Hedge Funds 1.00 0.51
Eq Market Neutral* 1.00
8/8/2019 JPM Guide to Markets
http://slidepdf.com/reader/full/jpm-guide-to-markets 49/58
48
-37%
-8%
-15%
0.1% -2% -2% 1% 1%-1%
1% 2% 0.5%
6%
1%
5%
0.3%
51%
43%
32%
14%
28%
23%21%
11%
19%
16% 17%
9%
18%
12%14%
7%
-40%
-30%
-20%
-10%
0%
10%
20%
30%
40%
50%
60%
1-yr. 5-yr. rolling 10-yr. rolling 20-yr. rolling
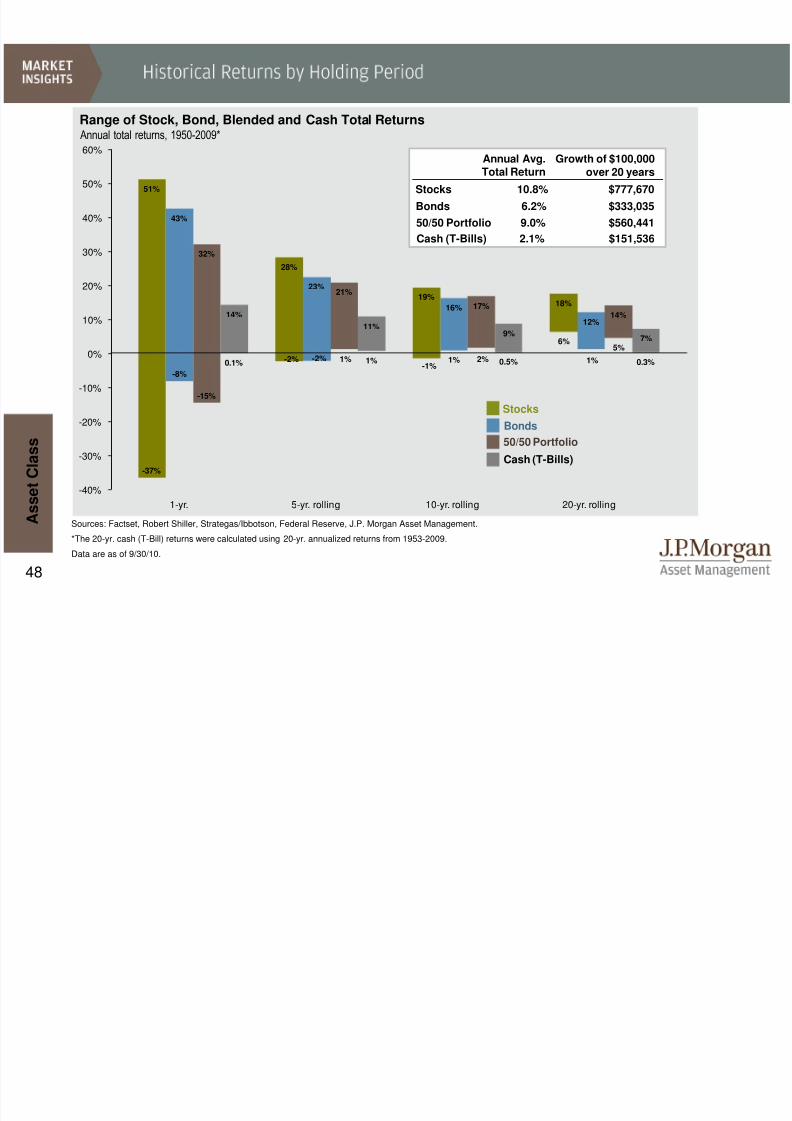
Annual total returns, 1950-2009*Range of Stock, Bond, Blended and Cash Total Returns
A s s e t C l a s s
Sources: Factset, Robert Shiller, Strategas/Ibbotson, Federal Reserve, J.P. Morgan Asset Management.
*The 20-yr. cash (T-Bill) returns were calculated using 20-yr. annualized returns from 1953-2009.
Data are as of 9/30/10.
50/50 Portfolio 9.0% $560,441
Bonds 6.2% $333,035
Stocks 10.8% $777,670
Annual Avg.Total Return
50/50 Portfolio
Bonds
Stocks
Cash (T-Bills)
Cash (T-Bills) 2.1% $151,536
Growth of $100,000over 20 years
8/8/2019 JPM Guide to Markets
http://slidepdf.com/reader/full/jpm-guide-to-markets 50/58
49
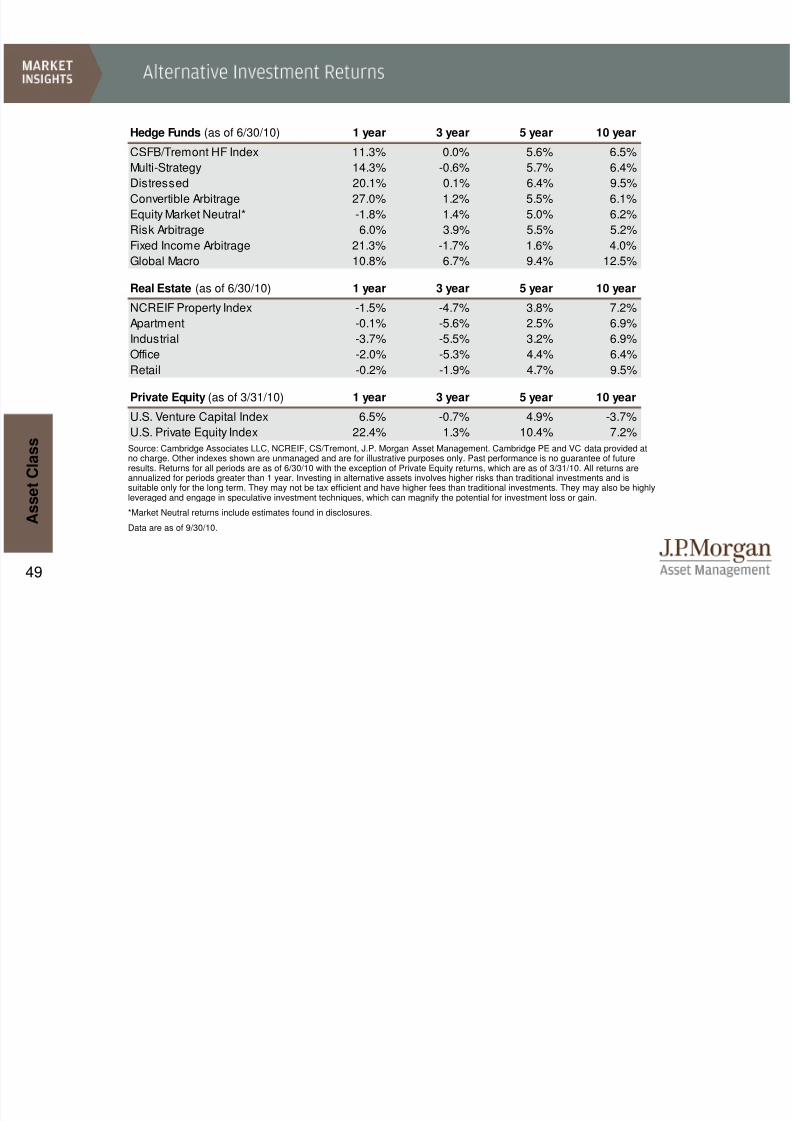
Source: Cambridge Associates LLC, NCREIF, CS/Tremont, J.P. Morgan Asset Management. Cambridge PE and VC data provided atno charge. Other indexes shown are unmanaged and are for illustrative purposes only. Past performance is no guarantee of futureresults. Returns for all periods are as of 6/30/10 with the exception of Private Equity returns, which are as of 3/31/10. All returns areannualized for periods greater than 1 year. Investing in alternative assets involves higher risks than traditional investments and issuitable only for the long term. They may not be tax efficient and have higher fees than traditional investments. They may also be highlyleveraged and engage in speculative investment techniques, which can magnify the potential for investment loss or gain.
*Market Neutral returns include estimates found in disclosures.
Data are as of 9/30/10. A s s e t C l a s s
Hedge Funds (as of 6/30/10) 1 year 3 year 5 year 10 year
CSFB/Tremont HF Index 11.3% 0.0% 5.6% 6.5%
Multi-Strategy 14.3% -0.6% 5.7% 6.4%
Distressed 20.1% 0.1% 6.4% 9.5%
Convertible Arbitrage 27.0% 1.2% 5.5% 6.1%
Equity Market Neutral* -1.8% 1.4% 5.0% 6.2%
Risk Arbitrage 6.0% 3.9% 5.5% 5.2%
Fixed Income Arbitrage 21.3% -1.7% 1.6% 4.0%
Global Macro 10.8% 6.7% 9.4% 12.5%
Real Estate (as of 6/30/10) 1 year 3 year 5 year 10 year
NCREIF Property Index -1.5% -4.7% 3.8% 7.2%
Apartment -0.1% -5.6% 2.5% 6.9%
Industrial -3.7% -5.5% 3.2% 6.9%
Office -2.0% -5.3% 4.4% 6.4%
Retail -0.2% -1.9% 4.7% 9.5%
Private Equity (as of 3/31/10) 1 year 3 year 5 year 10 year
U.S. Venture Capital Index 6.5% -0.7% 4.9% -3.7%U.S. Private Equity Index 22.4% 1.3% 10.4% 7.2%
8/8/2019 JPM Guide to Markets
http://slidepdf.com/reader/full/jpm-guide-to-markets 51/58
50
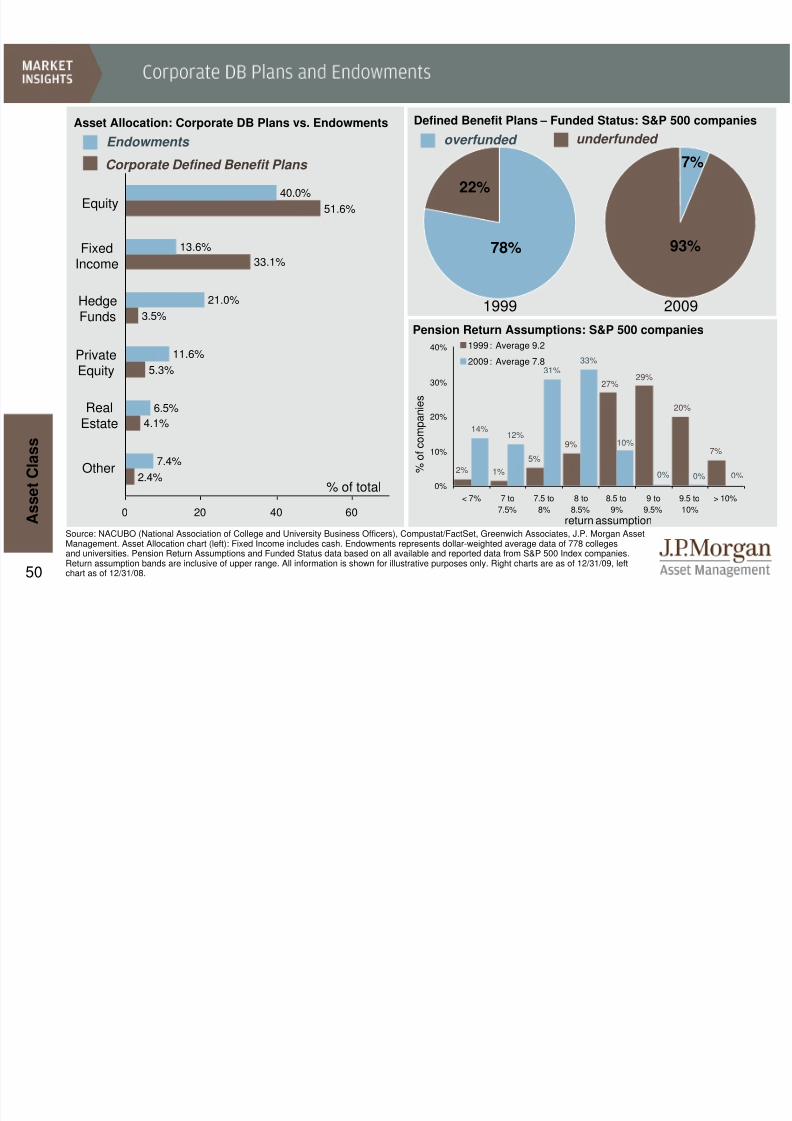
2.4%
4.1%
5.3%
3.5%
33.1%
51.6%
7.4%
6.5%
11.6%
21.0%
13.6%
40.0%
0 20 40 60
Pension Return Assumptions: S&P 500 companies
return assumption
% o
f c o m p a n i e s
Source: NACUBO (National Association of College and University Business Officers), Compustat/FactSet, Greenwich Associates, J.P. Morgan AssetManagement. Asset Allocation chart (left): Fixed Income includes cash. Endowments represents dollar-weighted average data of 778 collegesand universities. Pension Return Assumptions and Funded Status data based on all available and reported data from S&P 500 Index companies.
Return assumption bands are inclusive of upper range. All information is shown for illustrative purposes only. Right charts are as of 12/31/09, leftchart as of 12/31/08.
underfunded
Defined Benefit Plans – Funded Status: S&P 500 companies
93%
7%
2009
overfunded
1999
A s s e t C l a s s
78%
22%
% of total
Asset Allocation: Corporate DB Plans vs. Endowments
Equity
FixedIncome
HedgeFunds
PrivateEquity
Real
Estate
Other
Corporate Defined Benefit Plans Endowments
2% 1%
5%
9%7%
14%12%
31%33%
20%
29%27%
0%0%0%
10%
0%
10%
20%
30%
40%
< 7% 7 to
7.5%
7.5 to
8%
8 to
8.5%
8.5 to
9%
9 to
9.5%
9.5 to
10%
> 10%
1999: Average 9.2
2009: Average 7.8

8/8/2019 JPM Guide to Markets
http://slidepdf.com/reader/full/jpm-guide-to-markets 52/58
51
Balanced Portfolio Weights Through Market Turmoil
20-year Annualized Returns by Asset Class (1990 – 2009)
(Top) The indexes and weights ofstarting portfolio is as follows:U.S. stocks: 25% S&P 500, 10%
Russell 2000. U.S. bonds: 30%Barclays Capital Aggregate.International stocks: 15% MSCIEAFE and 5% MSCI EMI. Other:5% CS/Tremont Equity MarketNeutral, 5% NAREIT Equity REITIndex and 5% DJ UBSCommodity Index. The marketpeak and market low are basedon S&P 500 peak on 10/9/07 andS&P 500 low on 3/9/09. Portfolioassumes no rebalancing.
Charts are shown for illustrativepurposes only. Past returns areno guarantee of future results.
(Bottom) The indexes used are asfollows: REITS: NAREIT EquityREIT Index, EAFE: MSCI EAFE,Oil: WTI Index, Bonds: BarclaysCapital U.S. Aggregate Index,Homes: median sales price ofexisting single-family homes,Gold: USD/troy oz, Inflation: CPI.Average asset allocation investorreturn is based on an analysis byDalbar Inc. which utilizes the net
of aggregate mutual fund sales,redemptions and exchanges eachmonth as a measure of investorbehavior. All returns areannualized (and total returnwhere applicable) and representthe 20-year period ending12/31/09 to match Dalbar’s most
recent analysis.
Data are as of 9/30/10. A s s e t C l a s s
StartingPortfolio
MarketPeak
MarketLow Current
9.9%
8.2%
7.0%6.7%
5.2%4.4%
3.2%2.8%
2.3%
0%
2%
4%
6%
8%
10%
12%
REITS S&P 500 Bonds Oil Gold EAFE Homes Inflation Avg.
Investor
35% 35%24% 30%
30% 28% 47% 38%
20% 22% 15% 19%
15% 14% 14% 13%
0%
20%
40%
60%
80%
100%
1/1/07 10/9/07 3/9/09 9/30/10
Other
Int'l Stocks
U.S. Bonds
U.S. Stocks
8/8/2019 JPM Guide to Markets
http://slidepdf.com/reader/full/jpm-guide-to-markets 53/58
52
70
75
80
85
1965 1970 1975 1980 1985 1990 1995 2000 2005 2010 2015 2020 2025 2030 2035 2040
Probability of Surviving to Age…
Life Expectancy at Birth
A s s e t C l a s s
Source: Centers for Disease Control and Prevention, J.P. Morgan Asset Management.
(Top) Projections assume a continuation of improvement observed in survival rates between 1990 and 2004. (Bottom) Graph uses historical data
until 2005. Years 2006 through 2045 represent projections assuming a continuation of improvement observed in survival rates.Data are as of 9/30/10.
2005: 77.4 Years
Projected 2045: 83.2 Years
65 70 75 80 85 90 95 100
50 90.9% 85.7% 78.4% 67.5% 52.3% 34.8% 19.2% 6.8%55 92.5% 86.8% 78.9% 67.2% 51.5% 33.6% 17.9% 6.1%60 95.1% 88.8% 80.1% 67.6% 51.1% 32.6% 16.8% 5.5%65 100.0% 92.8% 83.1% 69.4% 51.7% 32.3% 16.1% 5.1%70 100.0% 88.8% 73.3% 53.8% 32.9% 15.8% 4.7%75 100.0% 81.6% 58.9% 35.1% 16.2% 4.6%80 100.0% 71.0% 41.3% 18.2% 4.9%85 100.0% 56.7% 23.9% 6.1%90 100.0% 40.2% 9.8%
95 100.0% 22.8%100 100.0%
C u r r e n t A g e
Survival Age
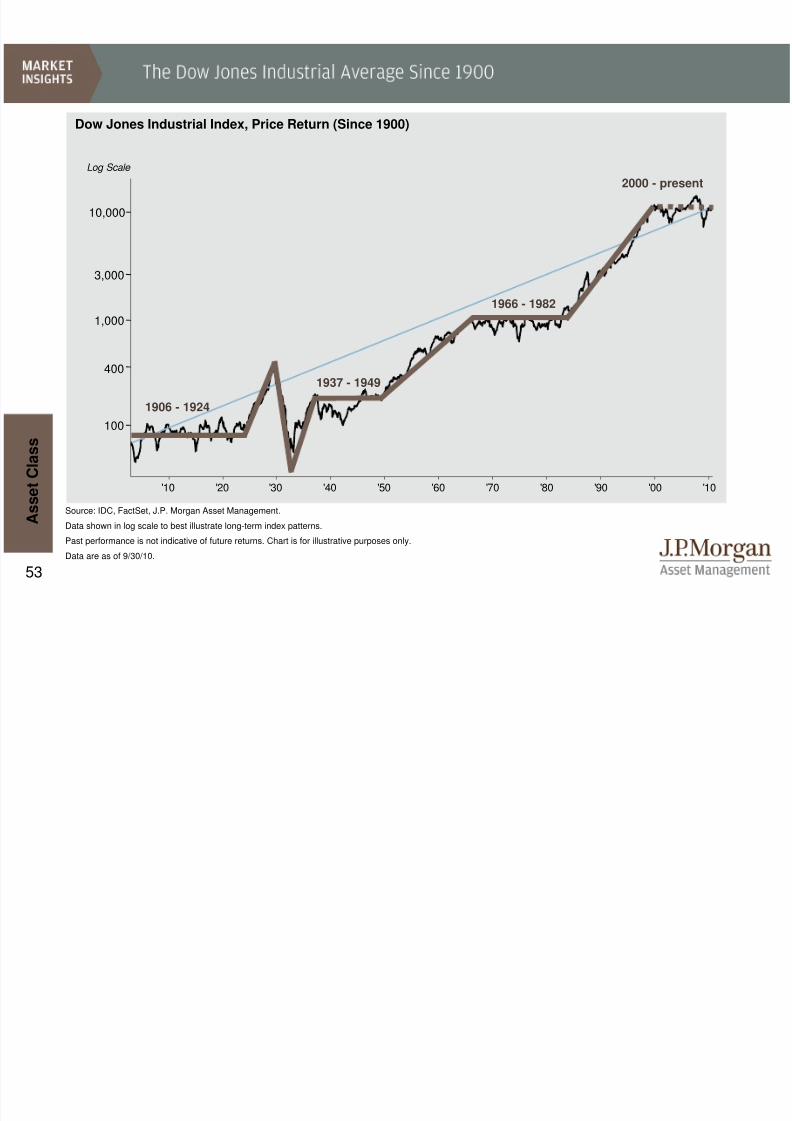
8/8/2019 JPM Guide to Markets
http://slidepdf.com/reader/full/jpm-guide-to-markets 54/58
53
'10 '20 '30 '40 '50 '60 '70 '80 '90 '00 '10
Dow Jones Industrial Index, Price Return (Since 1900)
Log Scale
Source: IDC, FactSet, J.P. Morgan Asset Management.
Data shown in log scale to best illustrate long-term index patterns.
Past performance is not indicative of future returns. Chart is for illustrative purposes only.
Data are as of 9/30/10.
A s s e t C l a s s
10,000
3,000
1,000
400
100
1906 - 1924
1937 - 1949
1966 - 1982
2000 - present
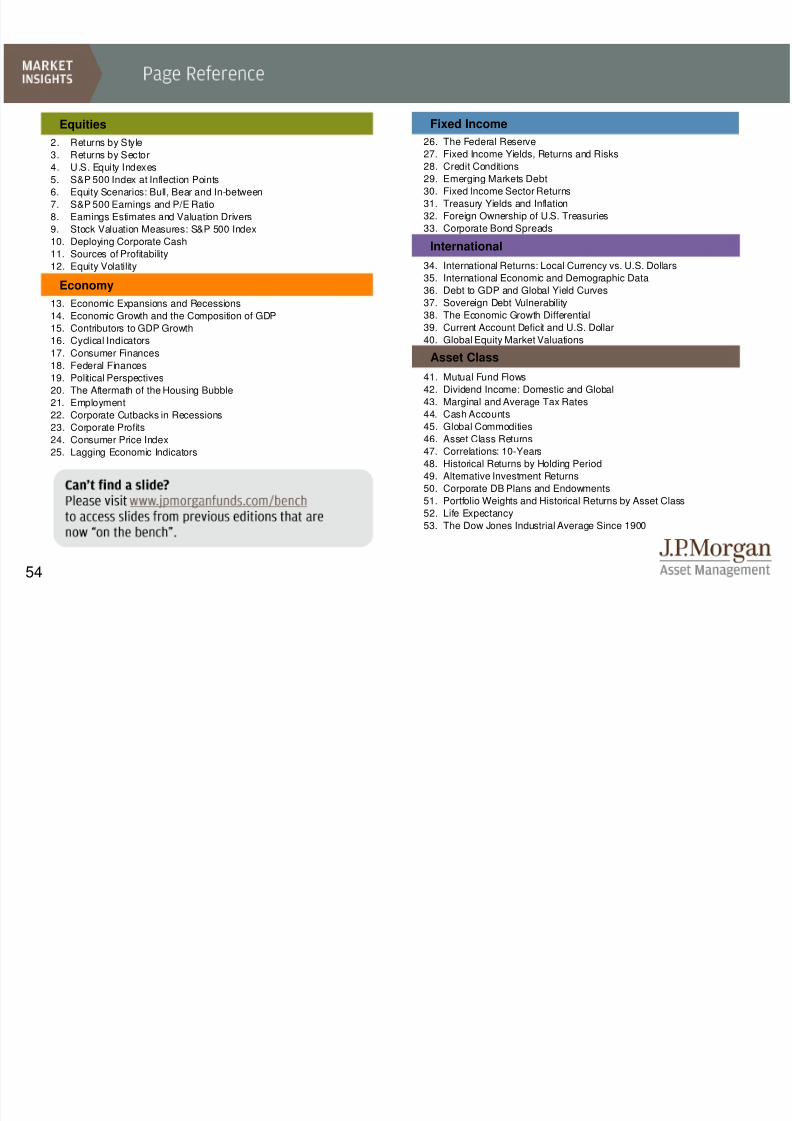
8/8/2019 JPM Guide to Markets
http://slidepdf.com/reader/full/jpm-guide-to-markets 55/58
54
2. Returns by Style3. Returns by Sector
4. U.S. Equity Indexes
5. S&P 500 Index at Inflection Points
6. Equity Scenarios: Bull, Bear and In-between
7. S&P 500 Earnings and P/E Ratio
8. Earnings Estimates and Valuation Drivers
9. Stock Valuation Measures: S&P 500 Index
10. Deploying Corporate Cash
11. Sources of Profitability
12. Equity Volatility
13. Economic Expansions and Recessions
14. Economic Growth and the Composition of GDP
15. Contributors to GDP Growth
16. Cyclical Indicators
17. Consumer Finances
18. Federal Finances
19. Political Perspectives
20. The Aftermath of the Housing Bubble
21. Employment
22. Corporate Cutbacks in Recessions
23. Corporate Profits
24. Consumer Price Index
25. Lagging Economic Indicators
26. The Federal Reserve27. Fixed Income Yields, Returns and Risks
28. Credit Conditions
29. Emerging Markets Debt
30. Fixed Income Sector Returns
31. Treasury Yields and Inflation
32. Foreign Ownership of U.S. Treasuries
33. Corporate Bond Spreads
34. International Returns: Local Currency vs. U.S. Dollars
35. International Economic and Demographic Data
36. Debt to GDP and Global Yield Curves
37. Sovereign Debt Vulnerability
38. The Economic Growth Differential
39. Current Account Deficit and U.S. Dollar
40. Global Equity Market Valuations
41. Mutual Fund Flows
42. Dividend Income: Domestic and Global
43. Marginal and Average Tax Rates
44. Cash Accounts
45. Global Commodities46. Asset Class Returns
47. Correlations: 10-Years
48. Historical Returns by Holding Period
49. Alternative Investment Returns
50. Corporate DB Plans and Endowments
51. Portfolio Weights and Historical Returns by Asset Class
52. Life Expectancy
53. The Dow Jones Industrial Average Since 1900
Equities
Economy
Fixed Income
International
Asset Class
8/8/2019 JPM Guide to Markets
http://slidepdf.com/reader/full/jpm-guide-to-markets 56/58
55
All indexes are unmanaged and an individual cannot invest directly in an index. Index returns do notinclude fees or expenses.
The S&P 500 Index is widely regarded as the best single gauge of the U.S. equities market. This world-renownedindex includes a representative sample of 500 leading companies in leading industries of the U.S. economy. Although the S&P 500 Index focuses on the large-cap segment of the market, with approximately 75% coverageof U.S. equities, it is also an ideal proxy for the total market. An investor cannot invest directly in an index.
The S&P 400 Mid Cap Index is representative of 400 stocks in the mid-range sector of the domestic stockmarket, representing all major industries.
The Russell 3000 Index® measures the performance of the 3,000 largest U.S. companies based on total marketcapitalization.
The Russell 1000 Index ® measures the performance of the 1,000 largest companies in the Russell 3000.
The Russell 1000 Growth Index ® measures the performance of those Russell 1000 companies with higher price-to-book ratios and higher forecasted growth values.
The Russell 1000 Value Index ® measures the performance of those Russell 1000 companies with l ower price-to-book ratios and lower forecasted growth values.
The Russell Midcap Index ® measures the performance of the 800 smallest companies in the Russell 1000Index.
The Russell Midcap Growth Index ® measures the performance of those Russell Midcap companies with higher price-to-book ratios and higher forecasted growth values. The stocks are also members of t he Russell 1000Growth index.
The Russell Midcap Value Index ® measures the performance of those Russell Midcap companies with lower price-to-book ratios and lower forecasted growth values. The stocks are also members of t he Russell 1000 Valueindex.
The Russell 2000 Index ® measures the performance of the 2,000 smallest companies in the Russell 3000Index.
The Russell 2000 Growth Index ® measures the performance of those Russell 2000 companies with higher price-to-book ratios and higher forecasted growth values.
The Russell 2000 Value Index ® measures the performance of those Russell 2000 companies with l ower price-to-book ratios and lower forecasted growth values.
The MSCI® EAFE (Europe, Australia, Far East) Net Index is recognized as the pre-eminent benchmark in theUnited States to measure international equity performance. It comprises 21 MSCI country indexes, representingthe developed markets outside of North America.
The MSCI Emerging Markets IndexSM is a free float-adjusted market capitalization index that is designed tomeasure equity market performance in the global emerging markets. As of June 2007, the MSCI EmergingMarkets Index consisted of the following 25 emerging market country indices: Argentina, Brazil, Chile, China,Colombia, Czech Republic, Egypt, Hungary, India, Indonesia, Israel, Jordan, Korea, Malaysia, Mexico, Morocco,Pakistan, Peru, Philippines, Poland, Russia, South Africa, Taiwan, Thailand, and Turkey.
The MSCI ACWI (All Country World Index) Index is a free float-adjusted market capitalization weighted indexthat is designed to measure the equity market performance of developed and emerging markets. As of June 2009the MSCI ACWI consisted of 45 country indices comprising 23 developed and 22 emerging market country indices.
The MSCI Small Cap IndicesSM target 40% of the eligible Small Cap universe within each industry group, withineach country. MSCI defines the Small Cap universe as all listed securities that have a market capitalization in therange of USD200-1,500 million.
The MSCI Value and Growth IndicesSM cover the full range of developed, emerging and All Country MSCI Equityindexes. As of the close of May 30, 2003, MSCI implemented an enhanced methodology for the MSCI GlobalValue and Growth Indices, adopting a two dimensional framework for style segmentation in which value andgrowth securities are categorized using different attributes - three for value and five for growth including forward-looking variables. The objective of the index design is to divide constituents of an underlying MSCI StandardCountry Index into a value index and a growth index, each targeting 50% of the free float adjusted marketcapitalization of the underlying country index. Country Value/Growth indices are then aggregated into regionalValue/Growth indices. Prior to May 30, 2003, the indices used Price/Book Value (P/BV) ratios to divide thestandard MSCI country indices into value and growth indices. All securities were classified as either "value"securities (low P/BV securities) or "growth" securities (high P/BV securities), relative to each MSCI country index.
The following MSCI Total Return IndicesSM are calculated with gross dividends: This series approximates the maximum possible dividend reinvestment. The amount reinvested is the dividenddistributed to individuals resident in the country of the company, but does not include tax credits.
The MSCI Europe IndexSM is a free float-adjusted market capitalization index that is designed to measure
developed market equity performance in Europe. As of June 2007, the MSCI Europe Index consisted of thefollowing 16 developed market country indices: Austria, Belgium, Denmark, Finland, France, Germany, Greece,Ireland, Italy, the Netherlands, Norway, Portugal, Spain, Sweden, Switzerland and the United Kingdom.
The MSCI Pacific IndexSM is a free float-adjusted market capitalization index that is designed to measure equitymarket performance in the Pacific region. As of June 2007, the MSCI Pacific Index consisted of the following 5Developed Market countries: Australia, Hong Kong, Japan, New Zealand, and Singapore.
8/8/2019 JPM Guide to Markets
http://slidepdf.com/reader/full/jpm-guide-to-markets 57/58
56
Municipal Bond Index: To be included in the index, bonds must be rated investment-grade (Baa3/BBB- or higher)by at least two of the following ratings agencies: Moody's, S&P, Fitch. If only two of the three agencies rate thesecurity, the lower rating is used to determine index eligibility. If only one of the three agencies rates a security, the
rating must be investment-grade. They must have an outstanding par value of at least $7 million and be issued aspart of a transaction of at least $75 million. The bonds must be fixed rate, have a dated-date after December 31,1990, and must be at least one year from their maturity date. Remarketed issues, taxable municipal bonds, bondswith floating rates, and derivatives are excluded from the benchmark.
The Barclays Capital Emerging Markets Index includes USD-denominated debt from emerging markets in t hefollowing regions: Americas, Europe, Middle East, Africa, and Asia. As with other fixed income benchmarksprovided by Barclays Capital, the index is rules-based, which allows for an unbiased view of t he marketplace andeasy replicability.
The Barclays Capital Corporate Bond Index is the Corporate component of the U.S. Credit index.
The Barclays Capital TIPS Index consists of Inflation-Protection securities issued by the U.S. Treasury.
The NAREIT EQUITY REIT Index is designed to provide the most comprehensive assessment of overall industryperformance, and includes all tax-qualified real estate investment trusts (REITs) that are listed on the NYSE, the American Stock Exchange or the NASDAQ National Market List.
The J.P. Morgan EMBI Global Index includes U.S. dollar denominated B rady bonds, Eurobonds, traded loansand local market debt instruments issued by sovereign and quasi-sovereign entities.
The J.P. Morgan Domestic High Yield Index is designed to mirror the investable universe of the U.S. dollar domestic high yield corporate debt market.
The CS/Tremont Equity Market Neutral Index takes both long and short positions in stocks with the aim of minimizing exposure to the systematic risk of the market (i.e., a beta of zero).
The CS/Tremont Multi-Strategy Index consists of funds that allocate capital based on perceived opportunitiesamong several hedge fund strategies. Strategies adopted in a multi-strategy fund may include, but are not limitedto, convertible bond arbitrage, equity long/short, statistical arbitrage and merger arbitrage.
*Market Neutral returns for November 2008 are estimates by J.P. Morgan Funds Market Strategy, and are basedon a December 8, 2008 published estimate for November returns by CS/Tremont in which the Market Neutralreturns were estimated to be +0.85% (with 69% of all CS/Tremont constituents having reported return data).Presumed to be excluded from the November return are three funds, which were later marked to $0 by
CS/Tremont in connection with the Bernard Madoff scandal. J.P. Morgan Funds believes this distortion is not anaccurate representation of returns in the category. CS/Tremont later published a finalized November return of -40.56% for the month, reflecting this mark-down. CS/Tremont assumes no responsibility for these estimates.
All indexes are unmanaged and an individual cannot invest directly in an index. Index returns do notinclude fees or expenses.
Credit Suisse/Tremont Hedge Fund Index is compiled by Credit Suisse Tremont Index, LLC. It is an asset-weighted hedge fund index and includes only f unds, as opposed to separate accounts. The Index uses the CreditSuisse/Tremont database, which tracks over 4500 funds, and consists only of funds with a minimum of US$50million under management, a 12-month track record, and audited financial statements. It is calculated andrebalanced on a monthly basis, and shown net of all performance fees and expenses. It is the exclusive property of Credit Suisse Tremont Index, LLC.
The NCREIF Property Index is a quarterly time series composite total rate of return measure of investmentperformance of a very large pool of individual commercial real estate properties acquired in the private market for investment purposes only. All properties in the NPI have been acquired, at least in part, on behalf of tax-exemptinstitutional investors - the great majority being pension funds. As such, all properties are held in a fiduciaryenvironment.
The Dow Jones-UBS Commodity Index is composed of futures contracts on physical commodities andrepresents nineteen separate commodities traded on U.S. exchanges, with the exception of aluminum, nickel, andzinc.
The Barclays Capital U.S. Aggregate Index represents securities that are SEC-registered, taxable, and dollar denominated. The index covers the U.S. investment grade fixed rate bond market, with index components for government and corporate securities, mortgage pass-through securities, and asset-backed securities. These major sectors are subdivided into more specific indexes that are calculated and reported on a regular basis.This U.S. Treasury Index is a component of the U.S. Government index.West Texas Intermediate (WTI) is the underlying commodity for t he New York Merchantile Exchange's oil futurescontracts.
The Barclays Capital High Yield Index covers the universe of fixed rate, non -investment grade debt. Pay-in-kind(PIK) bonds, Eurobonds, and debt issues from countries designated as emerging markets (e.g., Argentina, Brazil,Venezuela, etc.) are excluded, but Canadian and global bonds (SEC registered) of issuers in non-EMG countriesare included. Original issue zeroes, step-up coupon structures, and 144-As are also included.
8/8/2019 JPM Guide to Markets
http://slidepdf.com/reader/full/jpm-guide-to-markets 58/58
Derivatives may be riskier than other types of investments because they may be more sensitive to changes ineconomic or market conditions than other types of investments and could result in losses that significantlyexceed the original investment. The use of derivatives may not be successful, resulting in investment losses,
and the cost of such strategies may reduce investment returns.There is no guarantee that the use of long and short positions will succeed in limiting an investor's exposureto domestic stock market movements, capitalization, sector swings or other risk factors. Investing usinginvolving long and short selling strategies may have higher portfolio turnover rates. Short selling involvescertain risks, including additional costs associated with covering short positions and a possibility of unlimitedloss on certain short sale positions.
Opinions and estimates offered constitute our judgment and are subject to change without notice, as arestatements of financial market trends, which are based on current market conditions. We believe theinformation provided here is reliable, but do not warrant its accuracy or completeness. This material is notintended as an offer or solicitation for the purchase or sale of any financial instrument. The views and strategiesdescribed may not be suitable for all investors. This material has been prepared for informational purposesonly, and is not intended to provide, and should not be relied on for accounting, legal or tax advice. Referencesto future returns are not promises or even estimates of actual returns a client portfolio may achieve. Anyforecasts contained herein are for illustrative purposes only and are not to be relied upon as advice or interpreted as a recommendation.
The views expressed are those of J.P. Morgan Asset Management. They are subject to change at any time.These views do not necessarily reflect the opinions of any other firm.
Contact J.P. Morgan Funds Distribution Services at 1-800-480-4111 for a fund prospectus. You can alsovisit us at www.jpmorganfunds.com. Investors should carefully consider the investment objectives and risks as well as charges and expenses of the mutual fund before investing. The prospectus containsthis and other information about the mutual fund. Read the prospectus carefully before investing.
J.P. Morgan Asset Management is the marketing name for the asset management businesses of JPMorganChase & Co. Those businesses include, but are not limited to, J.P. Morgan Investment Management Inc.,Security Capital Research & Management Incorporated and J.P. Morgan Alternative Asset Management, Inc.
JPMorgan Distribution Services Inc.
© JPMorgan Chase & Co., October 2010.
Unless otherwise stated, all data are as of September 30, 2010 or most recently available.
Prepared by:
Andrew D. Goldberg, Joseph S. Tanious, David M. Lebovitz, Brandon D. Odenath, and David Kelly.
NOT FDIC INSURED ı NO BANK GUARANTEE ı MAY LOSE VALUE
JP-LITTLEBOOK
Past performance is no gu arantee of comparable future results. Diversification does not guarantee investment returns and does not eliminate the risk of loss.
Bonds are subject to interest rate risks. Bond prices generally fall when interest rates rise.The price of equity securities may rise, or fall because of changes in the broad market or changes in a company’sfinancial condition, sometimes rapidly or unpredictably. These price movements may result from factors affectingindividual companies, sectors or industries, or the securities market as a whole, such as changes in economic or political conditions. Equity securities are subject to “stock market risk” meaning that stock prices in general maydecline over short or extended periods of time.
Small-capitalizationinvesting typically carries more risk than investing in well-established "blue-chip" companiessince smaller companies generally have a higher risk of failure. Historically, smaller companies' stock hasexperienced a greater degree of market volatility than the average stock.
Mid-capitalization investing typically carries more risk than investing in well-established "blue-chip" companies.Historically, mid-cap companies' stock has experienced a greater degree of market volatility than the averagestock.
Real estate investments may be subject to a higher degree of market risk because of concentration in a specificindustry, sector or geographical sector. Real estate investments may be subject to risks including, but not limitedto, declines in the value of real estate, risks related to general and economic conditions, changes in the value of the underlying property owned by the trust and defaults by borrower.
International investing involves a greater degree of risk and increased volatility. Changes in currency exchangerates and differences in accounting and taxation policies outside the U.S. can raise or lower returns. Also, someoverseas markets may not be as politically and economically stable as the United States and other nations.Investments in emerging markets can be more volatile. As mentioned above, the normal risks of investing inforeign countries are heightened when investing in emerging markets. In addition, the small size of securitiesmarkets and the low trading volume may lead to a lack of liquidity, which leads to increased volatility. Also,emerging markets may not provide adequate legal protection for private or foreign investment or private property.
Investments in commodities may have greater volatility than investments in traditional securities, particularly if the instruments involve leverage. The value of commodity-linked derivative instruments may be affected bychanges in overall market movements, commodity index volatility, changes in interest rates, or factors affecting a
particular industry or commodity, such as drought, floods, weather, livestock disease, embargoes, tariffs andinternational economic, political and regulatory developments. Use of leveraged commodity-linked derivativescreates an opportunity for increased return but, at the same time, creates the possibility for greater loss.