journal of sciences implications of sequence stratigraphic ... · pdf fileimplications of...
TRANSCRIPT
International Journal of Science and Technology Volume 4 No. 5, May, 2015
IJST © 2015– IJST Publications UK. All rights reserved. 235
Implications of Sequence Stratigraphic Technique to Petroleum Exploration
and Production: A Case Study of XP Field, Onshore Niger Delta, Nigeria
Prince Suka Momta and Minapuye I. Odigi O.B Lulu Briggs Chair, Centre for Petroleum Geosciences, Institute of Petroleum Studies, University of Port Harcourt, Nigeria.
ABSTRACT
This work builds on the detailed sequence stratigraphic analysis that has been carried out on the XP Field. It highlights the
implications of the technique to exploration and production potentials in the XP field. Well logs and biostratigraphic data integrated
revealed key Maximum Flooding Surfaces (MFS1, MFS2, and MFS3) and sequence boundaries designated SB1, SB2 and SB3,
between the intervals of 3140 and 4232m. Maximum Flooding Surfaces are intervals showing high abundance and diversity of
foraminifera which represent three regional marker shales identified, and act as seals to the hydrocarbon-bearing sands. The
erosional surfaces coincide with intervals that are barren in faunal activity and are interpreted as sequence boundaries. The delineated
sequences show three depositional patterns (progradation, retrogradation and aggradation) resulting from fluctuation in sea level
(regression and transgression).Three systems tracts recognized include lowstand systems tracts (LST), transgressive systems
tracts(TST) and highstand systems tracts (HST). The LST has excellent reservoir quality compared to TST (heterolithic reservoirs),
and forms an exploration target during subsurface mapping. The stratigraphic positions of sequences with highest prospect falls
within 4232m to 3140m (productive interval) and can be penetrated at approximately the same depth range across the field, except
for fault interception. The youngest sequence has more water-bearing reservoirs, which provides a potential for water injection at the
depleting stage of the reservoirs when natural drive mechanism can no longer be effective.
Keywords: Sequence, Progradation, Aggradation, Prospect, Exploration, Production
1. INTRODUCTION
Sequence stratigraphy is the study of sedimentary rock
relationships within a chronostratigraphic framework
(Wheeler, 1958; Fairbridge, 1961; Sloss, 1963; Van Wagoner
et al., 1990; Neal and Vail, 1993). Predicting the lateral and
vertical distribution of depositional sequences and their
component systems tracts and facies plays an important role
in exploration for and development of sandstone reservoirs
(Slatt, 2006).
The Niger Delta sedimentary basin situated in the Gulf of
Guinea comprises of traditionally three stratigraphic units of
variable geologic characteristics. These can be classified as
topset beds, foresets and bottomset as revealed from seismic
stratigraphy. The topset portion is a regressive continental
unit called the Benin Formation; the foreset unit forms the
prograding Agbada Formation, whereas the marine clay/shale
of the Akata Formation is the bottomset portion of the delta
depositional system. Several works carried out by researchers
have revealed the stratigraphy, Sedimentology, structural
styles and the petroleum potential of the basin (Adesida eta
al; 1977; Avbovbo, 1978; Reijers, 2011).
The Niger Delta (Fig. 1) has been the focus of hydrocarbon
exploration since 1937. Now it is Africa’s leading oil
province. The delta has been penetrated by more than 5,000
wells. Recently, there is a paradigm shift in exploration
activity towards the offshore part of the basin in a bid to
increase oil and gas reserves. The evolution of the delta is
controlled by pre- and synsedimentary tectonics as described
by Evamy et al. (1978), Ejedawe (1981), Knox & Omatsola
(1987) and Stacher (1995). The shape of the Cretaceous coast
line (Reijers et al., 1997) gradually changed with the growth
of the Niger Delta. A bulge developed due to delta growth.
This changing coastline interacted with the palaeo-circulation
pattern and controlled the extent of incursions of the sea
(Reijers et al., 1997). Other factors that controlled the growth
of the delta are change in climate, the proximity and nature of
sediment source areas. Due to slow thermal cooling of the
underlying lithosphere, the delta subsides gradually. During
the Middle-Late Eocene, sediments were deposited west of
the inverted Cretaceous Abakaliki High and south of the
Anambra Basin in what became the northern depobelt of the
Niger Delta. The first coarse clastic deposits have been dated
on the basis of microfloral units (Evamy et al., 1978) as Early
Eocene. Studies by Weber & Daukuro (1975), Ejedawe
(1981) and Ejedawe et al. (1984) clarified that the embryonic
delta subsided during the Late Eocene to Middle Oligocene
<700 m/Ma and prograded approx. 2 km/Ma along three
depositional axes that fed irregular, early delta lobes that
eventually coalesced. Thick sandy sediment accumulations
thus formed in the active Greater Ughelli depobelt.
Stratigraphically, the delta-top Benin Group (Reijers, 2011)
overlies the delta-front Agbada Group and the pro-delta
Akata Group. The composition of the subsurface Benin
Group reflects the present-day Quaternary land and swamp
outcrops; the Agbada Group reflects the beach ridges and the
Akata Group the offshore sands, silts and clays.
Previous sedimentological, biostratigraphical and sequence-
stratigraphic studies (Ladipo, 1992; Stacher, 1995; Reijers et
al., 1997) revealed the combined influence of eustatic
cyclicity and local tectonics. Depositional sequences consist

International Journal of Science and Technology (IJST) – Volume 4 No. 5, May, 2015
IJST © 2015– IJST Publications UK. All rights reserved. 236
of strata bounded by unconformities and their lateral
equivalents are only recognized in specific sectors of the
delta, and in contrast, delta - wide genetic sequences as
defined by Galloway (1989) are more readily identifiable in
the Niger Delta (Reijers, 2011).
Sequence stratigraphic technique applied in several
sedimentary basins in the world has led to the discovery and
recovery of more hydrocarbon reserves. In the north Central
Gulf of Mexico this technique has improved reservoir
development and management strategies, provided insights
into basin fill history, and contributing to the ongoing
exploration successes in the basins (Meckel, 2003). In the
outer continental shelf Gulf of Mexico, 61% of proved
reserves, 40% of produced hydrocarbon and 40% of
remaining reserves were identified using high frequency
sequence stratigraphic technique (Rassi, 2002; Rassi and
Hentz, 2003; Hentz et al, 2002). The highest permeability
reservoirs in the East Sakhalin Shelf, Russia, were identified
by mapping 3rd order shoreface deposits (Mathew et al, 2003).
The application of sequence stratigraphic concept in studying
the various oil fields in the Niger Delta sedimentary basin is
relevant to improved exploration techniques and the
discovery of unidentified resources. The technique serves as a
tool for both local and regional mapping and correlation of
stratal units. The division of depositional packages into
genetic units is well understood through the concept of
sequence stratigraphy. The main objectives of this study
involve applying the sequence stratigraphic technique in the
prediction of depositional facies to identify potential source
sediments, reservoirs and sealing potentials, and to identify
exploration and production potentials and capabilities within
the field.
2. GEOLOGICAL SETTING OF TERTIARY
NIGER DELTA
The Niger Delta sedimentary basin evolved following the
Early Cretaceous break up between the South American and
the African plates. The tectonic framework, stratigraphy and
sedimentation pattern of the Niger Delta sedimentary basin is
well reported in several literatures (Weber and Daukoru,
1975; Short and Stauble, 1967; Whiteman, 1982, Doust and
Omatsola, 1990, Reijers, 2011). Several episodes of
transgressions and regressions accounted for the sedimentary
units in both the Cretaceous and Tertiary Southern Nigerian
sedimentary basins (Odigi, 2007). The delta covers an area
extent of about 100,000 km2 and represents the regressive
phase of the third cycle of deposition in the southern Nigeria
sedimentary basins, which began during the Paleocene and
has continued to the present day.
3. STUDY LOCATION
The field is located in the onshore portion of the Tertiary
Niger Delta sedimentary basin (Figure 1), and falls within the
Greater Ughelli Depobelt. The three wells (A,B and C)
studied in the area are separated at a distance of about 8km
between A and B, and B and C, and about 15.2km between A
and C covering an area extent of about 18.9 Sq.km.
Fig.1: Map of Niger Delta showing the Study Area

International Journal of Science and Technology (IJST) – Volume 4 No. 5, May, 2015
IJST © 2015– IJST Publications UK. All rights reserved. 237
4. MATERIALS AND METHOD
The datasets issued for the three wells (A, B and C) include;
a suit of well logs comprising of Gamma Ray, Resistivity,
Sonic, Neutron and Density logs; biostratigraphic data
contains information on foraminifera abundance and
diversity, F-zonation and paleobathymetric data. Niger delta
chronostratigraphic chart, an adaptation of the global
chronostratigraphic chart of Haq et al., (1988) was used with
the biostratigraphic data to assign ages to the bounding
surfaces.
The top and base of major shale units that have significant
paleontological record were correlated. The reservoirs fall
within the shales. The stacking patterns of the systems tracts
and their relationship with key chronosurfaces coupled with
biostratigraphic information help in the subdivision of the
entire stratigraphic section in the field into several
depositional sequences using the Vail et al., 1977 approach.
The biofacies plots involving foraminiferal diversity versus
depth, foraminifera abundance with depth, and environment
versus depth were performed using Microsoft Excel and
integrated into the log for detail interpretation.
4. RESULTS AND DISCUSSION
Integration of both well logs and biostratigraphic data has
revealed hydrocarbon exploration and production potentials
in the XP field. Two depositional sequences with its internal
geometric elements have been reconstructed from three key
dated unconformities and major flooding surfaces (Momta
and Odigi, 2014).
LITHOLOGIC DESCRIPTION FROM WELL
LOGS Two major lithologic types are inferred from the gamma ray
log motif as seen in Fig.3a and 3b. The key
chronostratigraphic surfaces correlated below are based on
time but also revealed
International Journal of Science and Technology (IJST) – Volume 4 No. 5, May, 2015
IJST © 2015– IJST Publications UK. All rights reserved. 238
MD
150
GR LLD
WELL LOG WELL B
SB3
SB2
SB1
MFS – 26.2 Ma
MFS2 – 28.1 Ma
MFS1 – 31.3 Ma
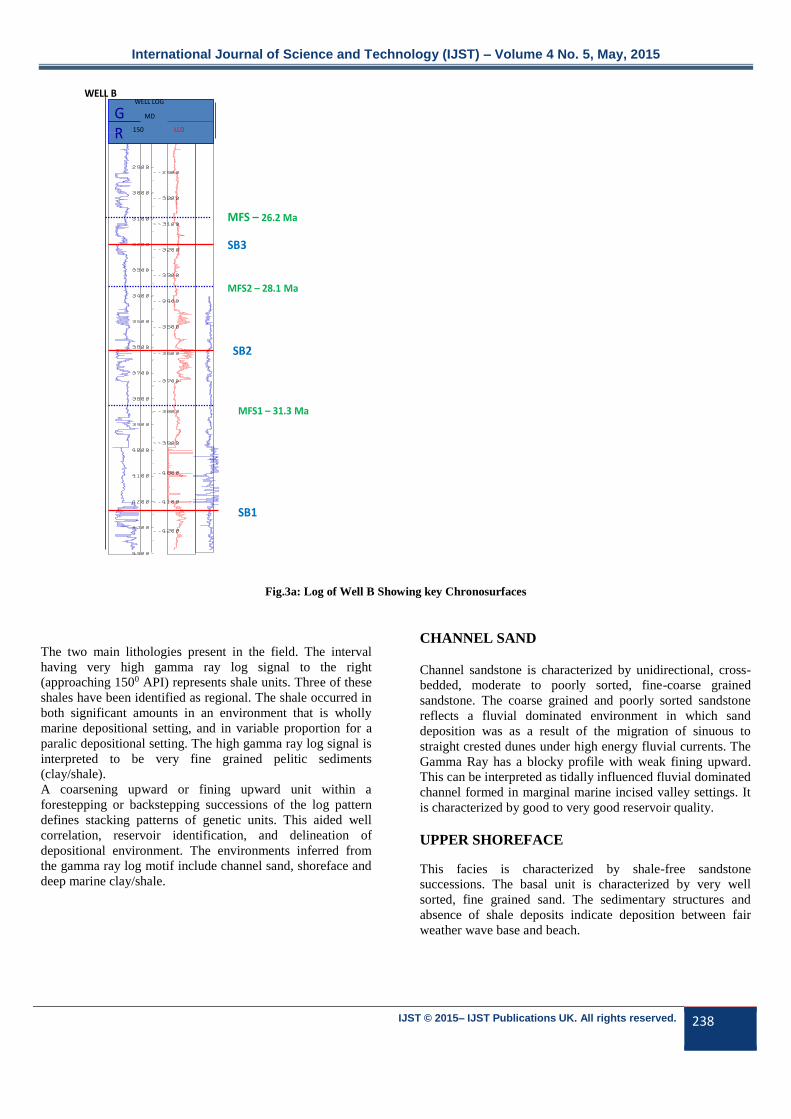
Fig.3a: Log of Well B Showing key Chronosurfaces
The two main lithologies present in the field. The interval
having very high gamma ray log signal to the right
(approaching 1500 API) represents shale units. Three of these
shales have been identified as regional. The shale occurred in
both significant amounts in an environment that is wholly
marine depositional setting, and in variable proportion for a
paralic depositional setting. The high gamma ray log signal is
interpreted to be very fine grained pelitic sediments
(clay/shale).
A coarsening upward or fining upward unit within a
forestepping or backstepping successions of the log pattern
defines stacking patterns of genetic units. This aided well
correlation, reservoir identification, and delineation of
depositional environment. The environments inferred from
the gamma ray log motif include channel sand, shoreface and
deep marine clay/shale.
CHANNEL SAND
Channel sandstone is characterized by unidirectional, cross-
bedded, moderate to poorly sorted, fine-coarse grained
sandstone. The coarse grained and poorly sorted sandstone
reflects a fluvial dominated environment in which sand
deposition was as a result of the migration of sinuous to
straight crested dunes under high energy fluvial currents. The
Gamma Ray has a blocky profile with weak fining upward.
This can be interpreted as tidally influenced fluvial dominated
channel formed in marginal marine incised valley settings. It
is characterized by good to very good reservoir quality.
UPPER SHOREFACE
This facies is characterized by shale-free sandstone
successions. The basal unit is characterized by very well
sorted, fine grained sand. The sedimentary structures and
absence of shale deposits indicate deposition between fair
weather wave base and beach.
International Journal of Science and Technology (IJST) – Volume 4 No. 5, May, 2015
IJST © 2015– IJST Publications UK. All rights reserved. 239
LOWER SHOREFACE
This facie shows a coarsening upward from intensely
bioturbated sandy and muddy heterolithics to hummocky
cross-stratified and rippled sandy heterolithics. Vertically it
displays a progressive increase in sand/shale ratio. Shoreface
sands are interpreted to be wave-dominated with ripples and
hummocky cross stratification. The intensely of bioturbation
often indicates reduced sedimentation rates on a low energy,
or more slowly prograding shoreface. The hummocky cross
stratification units reflect sedimentation under conditions of
alternating storm and quiet water conditions between storm
and fair weather base. The lower shoreface is characterized
by poor reservoir quality at the heavily bioturbated units. It
represents a thin-bedded shoreface reservoir. The deep marine
environment is composed of majorly shale displaying very
high gamma ray values.
BIOSTRATIGRAPHIC DATA
INTERPRETATION
Biostratigraphy uses the chronostratigraphic range of fossil
species to correlate stratigraphic sections (Emery and Myers,
1997), and their paleo-environmental preference to provide
information on depositional settings. It is an important tool in
the identification of sequences and systems tracts, dating of
sequence boundaries and maximum flooding surfaces (MFS).
The biofacies data provided for this study shows abundance
and diversity of foraminifera microfossils of which three were
recognized as index fossils used in dating and identifying
marker shales. Table 1 shows the depth interval where the
foraminifera zones occur. The youngest (between 2790 and
2910m) marker shale is not dated here (Table 1), and may fall
within Late Oligocene to Early Miocene. The Uvigerinella 5
zone, which is the oldest major flooding surface, occurs
between 3870-3740m and the F-zone is F7600/F7800. The
age of the sediments in the field dates between 26.2 – 31.3Ma
(Early- Late Oligocene) and falls within the Greater Ughelli
depobelt (Table 2).
Table 1: Microfaunal zonation of XP-Field
Top depth(m) Bottom Depth (m) F.Zone Remarks
2790 2910 F7800 No data
3050 3110 F7800 Alabamina 1
3230 3450 F7800 Bolivina 27
3740 3870 F7600/F7800 Uvigerinella 8
Table 2: Biostratigraphic Data Table
Well
name
Chronosurface Depth
(m)
Marker Shale Age
(Ma)
F Zones P Zone Epoch Remark
B MFS 3 3080 Alabamina 1 26.2 7800 580 Oligocene Greater
Ughelli
depobelt
B MFS 2 3420 Bolivina 27 28.1 7800 550 Oligocene Greater
Ughelli
depobelt
B MFS 1 3840 Uvigerinella 5 31.3 7600/
7800
560 Oligocene Greater
Ughelli
depobelt
DEPOSITIONAL SEQUENCES AND RECOGNITION
OF KEY SURFACES
Two major depositional sequences have been reconstructed
from three regional unconformities and three major maximum
flooding surfaces (Fig.3b). Three sequence boundaries form
the two major depositional cycles. The third sequence has an
undated boundary and may be dated Early Miocene. Each
sequence is recognized using the top and basal
chronostratigraphic surface (SB) and the position of the
systems tracts that stack to form the sequence.

International Journal of Science and Technology (IJST) – Volume 4 No. 5, May, 2015
IJST © 2015– IJST Publications UK. All rights reserved. 240
Fig.3b: Well Log Showing Three Wells Studied and Key Chronosurfaces
SEQUENCE BOUNDARIES
Sequence boundaries mark the transition from a reservoir to
shale, or change in facies of different ages. They are
significant surfaces that represent a time in which sediments
were not deposited, or were deposited but have been eroded.
The three regional unconformities designated SB1, SB2 and
SB3 subdivide the stratigraphic section into two depositional
sequences with the third sequence not dated. The sequence
boundaries fall within the sand-bearing intervals (Fig.3b) and
correspond to the horizon that is barren in foraminiferal
abundance and diversity (Fig.7). These surfaces were also
recognized on well logs using log motifs and their consequent
stacking patterns (Fig.4, 5). In the stratigraphic section, SB1
occurred at 4232m, SB2 at 3638m and the youngest dated
boundary, SB3 occurs at 3140m (Fig. 3b).
International Journal of Science and Technology (IJST) – Volume 4 No. 5, May, 2015
IJST © 2015– IJST Publications UK. All rights reserved. 241
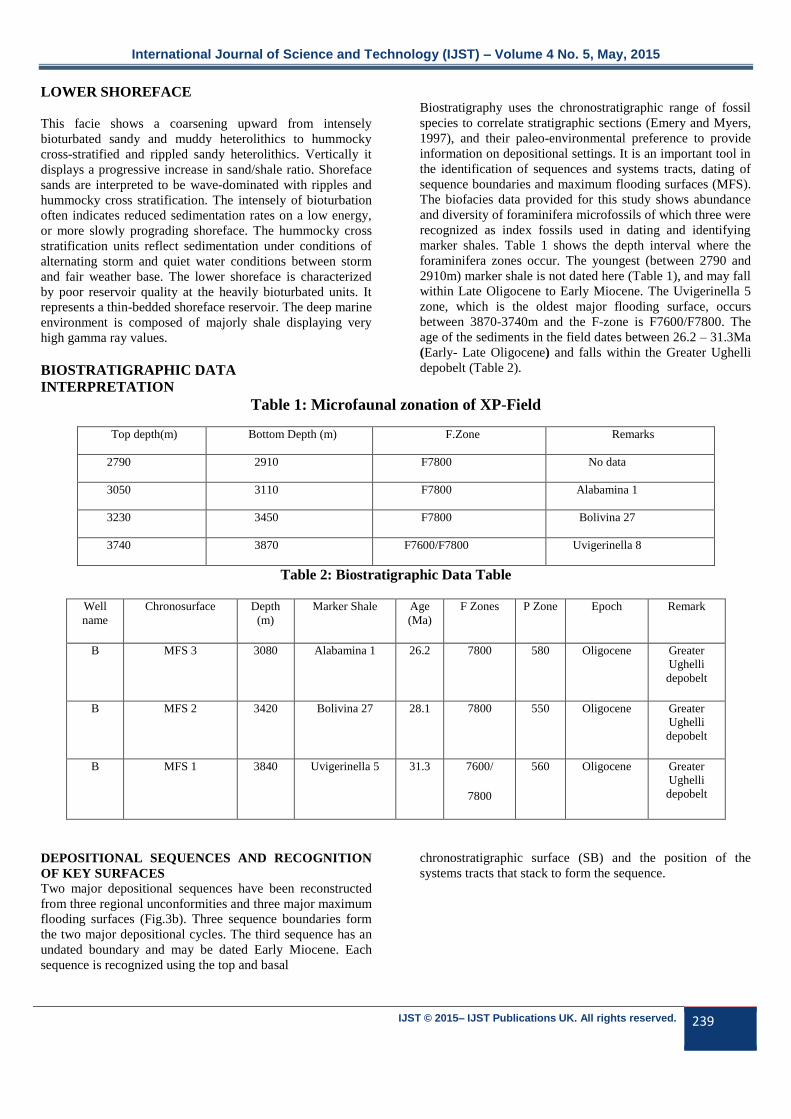
Fig. 4: A portion of Well B showing SB2, LST, TST, MFS2 and HST. LST and HST are charged with hydrocarbons.
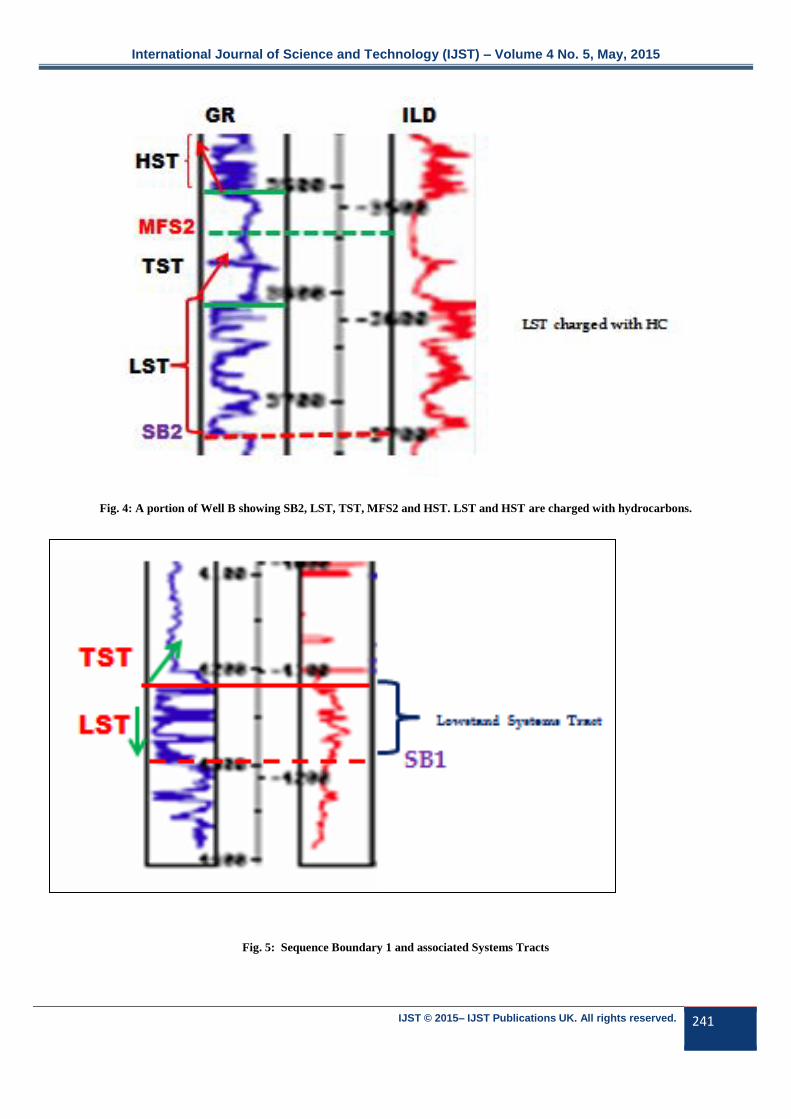
Fig. 5: Sequence Boundary 1 and associated Systems Tracts
International Journal of Science and Technology (IJST) – Volume 4 No. 5, May, 2015
IJST © 2015– IJST Publications UK. All rights reserved. 242
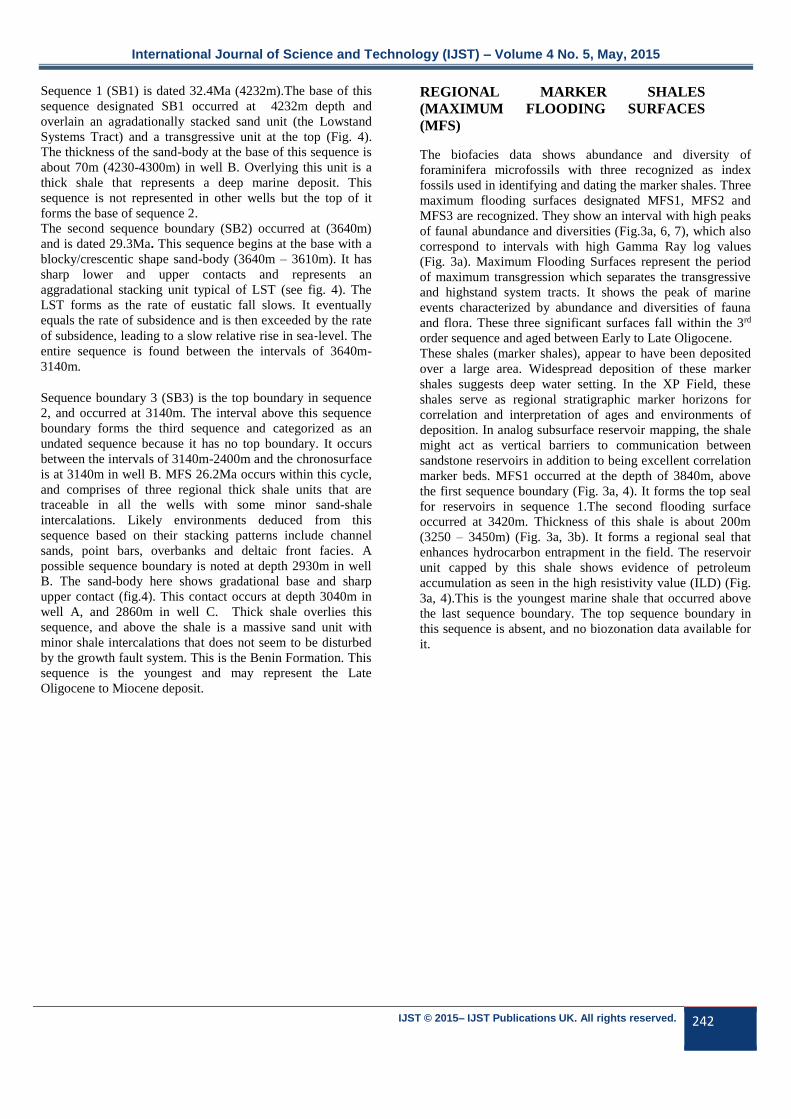
Sequence 1 (SB1) is dated 32.4Ma (4232m).The base of this
sequence designated SB1 occurred at 4232m depth and
overlain an agradationally stacked sand unit (the Lowstand
Systems Tract) and a transgressive unit at the top (Fig. 4).
The thickness of the sand-body at the base of this sequence is
about 70m (4230-4300m) in well B. Overlying this unit is a
thick shale that represents a deep marine deposit. This
sequence is not represented in other wells but the top of it
forms the base of sequence 2.
The second sequence boundary (SB2) occurred at (3640m)
and is dated 29.3Ma. This sequence begins at the base with a
blocky/crescentic shape sand-body (3640m – 3610m). It has
sharp lower and upper contacts and represents an
aggradational stacking unit typical of LST (see fig. 4). The
LST forms as the rate of eustatic fall slows. It eventually
equals the rate of subsidence and is then exceeded by the rate
of subsidence, leading to a slow relative rise in sea‐level. The
entire sequence is found between the intervals of 3640m-
3140m.
Sequence boundary 3 (SB3) is the top boundary in sequence
2, and occurred at 3140m. The interval above this sequence
boundary forms the third sequence and categorized as an
undated sequence because it has no top boundary. It occurs
between the intervals of 3140m-2400m and the chronosurface
is at 3140m in well B. MFS 26.2Ma occurs within this cycle,
and comprises of three regional thick shale units that are
traceable in all the wells with some minor sand-shale
intercalations. Likely environments deduced from this
sequence based on their stacking patterns include channel
sands, point bars, overbanks and deltaic front facies. A
possible sequence boundary is noted at depth 2930m in well
B. The sand-body here shows gradational base and sharp
upper contact (fig.4). This contact occurs at depth 3040m in
well A, and 2860m in well C. Thick shale overlies this
sequence, and above the shale is a massive sand unit with
minor shale intercalations that does not seem to be disturbed
by the growth fault system. This is the Benin Formation. This
sequence is the youngest and may represent the Late
Oligocene to Miocene deposit.
REGIONAL MARKER SHALES
(MAXIMUM FLOODING SURFACES
(MFS)
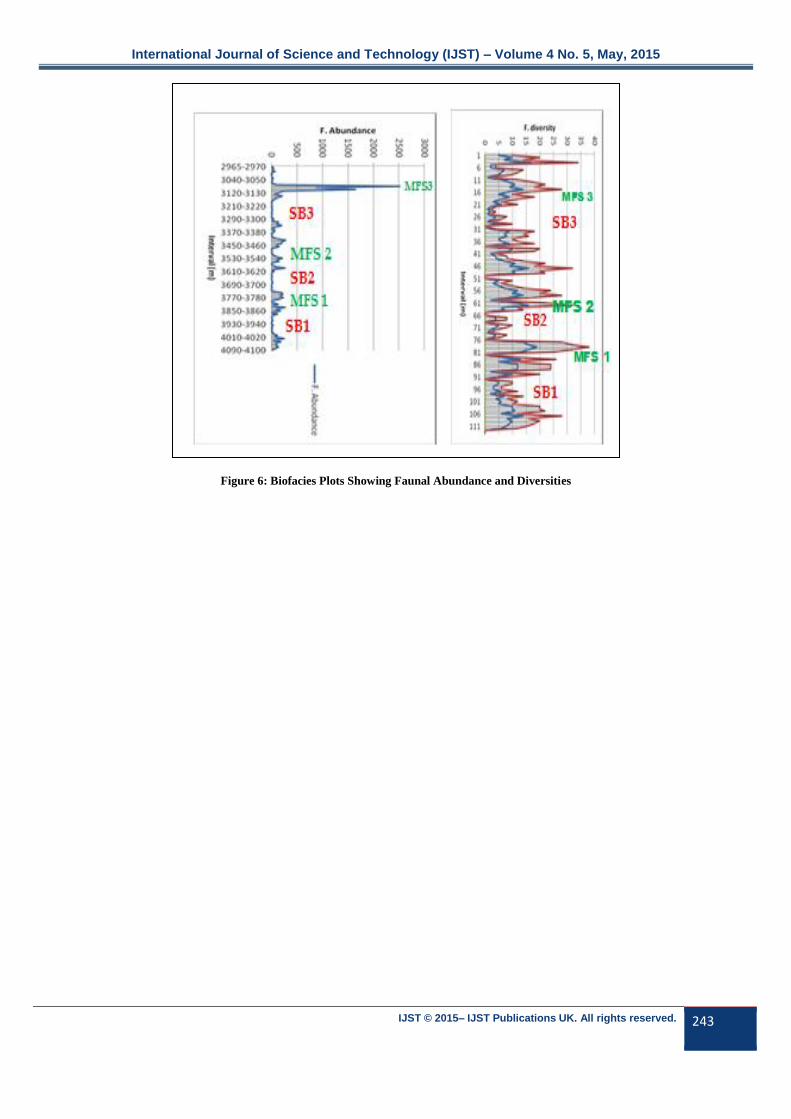
The biofacies data shows abundance and diversity of
foraminifera microfossils with three recognized as index
fossils used in identifying and dating the marker shales. Three
maximum flooding surfaces designated MFS1, MFS2 and
MFS3 are recognized. They show an interval with high peaks
of faunal abundance and diversities (Fig.3a, 6, 7), which also
correspond to intervals with high Gamma Ray log values
(Fig. 3a). Maximum Flooding Surfaces represent the period
of maximum transgression which separates the transgressive
and highstand system tracts. It shows the peak of marine
events characterized by abundance and diversities of fauna
and flora. These three significant surfaces fall within the 3rd
order sequence and aged between Early to Late Oligocene.
These shales (marker shales), appear to have been deposited
over a large area. Widespread deposition of these marker
shales suggests deep water setting. In the XP Field, these
shales serve as regional stratigraphic marker horizons for
correlation and interpretation of ages and environments of
deposition. In analog subsurface reservoir mapping, the shale
might act as vertical barriers to communication between
sandstone reservoirs in addition to being excellent correlation
marker beds. MFS1 occurred at the depth of 3840m, above
the first sequence boundary (Fig. 3a, 4). It forms the top seal
for reservoirs in sequence 1.The second flooding surface
occurred at 3420m. Thickness of this shale is about 200m
(3250 – 3450m) (Fig. 3a, 3b). It forms a regional seal that
enhances hydrocarbon entrapment in the field. The reservoir
unit capped by this shale shows evidence of petroleum
accumulation as seen in the high resistivity value (ILD) (Fig.
3a, 4).This is the youngest marine shale that occurred above
the last sequence boundary. The top sequence boundary in
this sequence is absent, and no biozonation data available for
it.
International Journal of Science and Technology (IJST) – Volume 4 No. 5, May, 2015
IJST © 2015– IJST Publications UK. All rights reserved. 243
Figure 6: Biofacies Plots Showing Faunal Abundance and Diversities

International Journal of Science and Technology (IJST) – Volume 4 No. 5, May, 2015
IJST © 2015– IJST Publications UK. All rights reserved. 244
TST – Transgressive Systems Tract
LST- Lowstand systems tract
SN – Shallow Inner Neritic
MFS - Maximum Flooding Surfaces
HST – Highstand System Tract
PC – Prograding Complex
SF- Slope Fan
CD – Coastal Deltaic
fw - forestepping
Bw – backsteppin
MD
150
GR
RES LLD
0 5 10 15 20
2965-2970
2990-3000
3020-3030
3060-3060
3080-3090
3110-3120
3140-3150
3170-3180
3200-3210
3230-3240
3260-3270
3290-3300
3320-3330
3350-3360
3380-3390
3410-3420
3440-3450
3470-3480
3500-3510
3540-3550
3570-3580
3600-3610
3630-3640
3660-3670
3690-3700
3720-3730
3750-3760
3780-3790
3810-3820
3840-3850
3870-3880
3900-3910
3930-3940
3960-3970
3995-4000
4020-4030
4050-4060
4080-4090
4410-4420
0 500 1000 1500 2000 2500 3000
INTERVAL [M ]
2980-2990
3010-3020
3050-3050
3070-3080
3100-3110
3130-3140
3160-3170
3190-3200
3220-3230
3250-3260
3280-3290
3310-3320
3340-3350
3370-3380
3400-3410
3430-3440
3460-3470
3490-3500
3520-3540
3560-3570
3590-3600
3620-3630
3650-3660
3680-3690
3710-3720
3740-3750
3770-3780
3800-3810
3830-3840
3860-3870
3895-3900
3920-3930
3950-3960
3980-3990
4010-4020
4040-4050
4070-4080
4100-4110
4430-4440
4460-4470
TOTAL FORAM ABUNDANCE TOTAL FORAM DIVERSITY SYSTEMS TRACT PALEOBATHYMETRY
C SN IN MN ON
BIOVENTS LEGEND
MFS 3080
SB 3260
MFS 3410
SB 3638
MFS 3840
SB 4232
SB -Sequence Boundary
D
ON – Outer Neritic
ALABUMINA 1
BO LIVINA 27
UVIGERINELLA 8
WELL LOG
Olig
oce
ne
- e
arl
y M
ioce
ne
GEOLOGIC AGE
WELL B
TST bw
TST Bw
TST bw
HST fw
HST fw
HST fw
LST
LST
pc
pc LST
sf
53
Fig. 7: Biostratigraphic Interpretation and Well Log Integration
SYSTEMS TRACTS
Three systems tracts common in the XP - Field include;
Highstand Systems Tract (HST), Transgressive Systems Tract
(TST) and Lowstand Systems Tract (LST) (Fig.5). Systems
tracts are genetically associated stratigraphic units that were
deposited during specific phases of the relative sea‐level
cycle and represented in the rock record as three‐dimensional
facies assemblages. They are defined on the basis of
bounding surfaces, position within a sequence, and
parasequence stacking pattern.
The Highstand Systems Tract (HST) displays a coarsening
upward (Fig.5) trend and it downlaps the maximum flooding
surface. Four of this unit occurs in Well B, and forms the
dominant stacking pattern in the field typical of a deltaic
progradational depositional setting.
TRANSGRESSIVE SYSTEMS TRACT (TST)
Transgressive System Tract can be recognized by its position
in a sequence and stacking pattern. It occurs between the
Maximum Flooding Surface the Transgressive Surface. On
well log it shows a fining upward trend of increasing water
depth, a retrogradational parasequence stacking. Net
sandstone and sandstone reservoir quality of each
parasequence within the retrogradational parasequence set
(TSTs) will decrease upward (Fig. 4).
LOWSTAND SYSTEMS TRACT (LST)
The Lowstand Systems Tract is made up of three sub-
depositional units; the prograding complex, slope fan and the
basin floor fans. The unit forms a prograding to aggradational
stacking pattern. Parasequences are not recognized in the
lowstand basin floor and slope fans, possibly because facies
International Journal of Science and Technology (IJST) – Volume 4 No. 5, May, 2015
IJST © 2015– IJST Publications UK. All rights reserved. 245
in bathyal and deeper water depths are not sufficiently
sensitive to minor changes in sea level which produce
parasequences in shallow marine environments (Posamentier
et al., 1988., Van Wagoner et al., 1988). Lowstand System
Tracts are recognized in a type 1 sequence. In a type 2 setting,
the equivalence of LST is the Shelf Margin System Tract
(SMST). The LST lies directly on the lower sequence
boundary and is overlain by the Transgressive System Tract.
LST occurs in well B between 3040 to 3115m just above
SB3, and between 2485 and 2500m in well C. Lowstand
systems Tracts contain coarse grained sands/sandstone with
good reservoir characteristics showing the presence of
hydrocarbon saturation with its high resistivity values (Fig.
4,5). The LST has excellent reservoir quality compared to
TST (heterolithic reservoirs). It is an exploration target within
the field.
Transgressive systems tract (TST) helps to determine
production mechanism. High-frequency parasequences –
which are composed of laterally continuous shale, and of
sandstones that have laterally and vertically variable reservoir
quality and continuity – can have a major effect on reservoir
performance. Thus, they should be identified as early as
possible in the life of a field by sequence stratigraphic
analysis (Slatt, 2006). This unit displays a fining upward
gamma ray motif and occurred at the top of lowstand system
tract.
IMPLICATIONS FOR HYDROCARBON
EXPLORATION AND PRODUCTION
The study reveals excellent plans for drilling campaign in the
field. Sequence 1 and 2 possess high prospect for
hydrocarbon exploitation. The stratigraphic positions of
sequences with highest prospects falls within 4232m to
3140m (productive interval) and can be penetrated at
approximately the same depth across the field, except for
fault interception. The sequence boundaries mark the
transition from a reservoir to shale. This help to decide casing
landing depth, well total drill depth, completion zones for
drain hole, and the decision for gravel packing/sand control
during production. They represent intervals with high
porosity and permeability, and help in reservoir
compartmentalization and flow units demarcation.
The various Maximum Flooding Surfaces serve as regional
seals and source sediments. They act as vertical baffles or
seals, and occur in association with faunal abundance and
diversity peaks, and often correspond to abrupt change in
incremental overpressure (Meckel, 2003). This will be useful
in identifying the various pressure regimes during drilling
exploratory, appraisal and production wells.
The various systems Tracts, LST, TST and HST serve as
reservoirs with variable petrophysical characteristics. The
HST and LST form good reservoirs with higher reservoir
quality than the TST. They form exploration prospects and
should be targeted during subsurface mapping. Identifying
TST helps to determine production mechanism. High-
frequency parasequences – which are composed of laterally
continuous shale and sandstones that have laterally and
vertically variable reservoir quality and continuity – can have
a major effect on reservoir performance. Thus, they should be
identified as early as possible in the life of a field by sequence
stratigraphic analysis (Slatt, 2006).
The Early Oligocene interval (sequence) has higher
hydrocarbon potential. Late Oligocene to Early Miocene is
the youngest sequence with little hydrocarbon potential,
probably due to low thermal regime and shallow depth or that
hydrocarbon migration may not have been completed in this
sequence. In the offshore locations, Miocene successions
have high hydrocarbon prospect. Youngest sequence has
more water-bearing reservoirs, which provides a potential for
water injection at the depleting stage of the wells when
natural drive mechanism can no longer be effective.
5. SUMMARY AND CONCLUSIONS
Well log and biostratigraphic data integrated to study XP
Field onshore Niger Delta reveal three depositional cycles in
the study area, with the last sequence boundary not dated.
Three regional dated unconformities and flooding surfaces
are recognized. The unconformities provide conduits for
hydrocarbon entrapment and accumulation. The regional
shales (MFS) provide excellent seal and source rock
potentials in the field. The XP Field reservoirs consist of
several 3rd order stacked regressive and transgressive units.
The sedimentary fills in this field are majorly regressive
deposits of two main depositional cycles that took place
during the Oligocene time of delta development. The
maximum flooding surfaces (shales) are laterally extensive
and may form vertical barriers between parasequence
sandstones. The highstand systems tract (HST), will prograde
basin-ward with a decrease in reservoir quality (decrease in
porosity and permeability) because of the basin-ward
decrease in net sandstone and probable decrease in sandstone
grain size within the field. Net sandstone and sandstone
reservoir quality of each parasequence within the
retrogradational parasequence set (TST) will decrease upward
(Figs.4, 5). The Lowstand Systems Tracts show high
hydrocarbon prospect and should be targeted within the field.
ACKNOWLEDGEMENT
The management of Moni Pulo Limited, Port Harcourt, and
the O.B Lulu Briggs Chair in Petroleum Geoscience, Institute
of Petroleum Studies, University of Port Harcourt, Nigeria, is
well appreciated for giving us the opportunity to present this
paper at the first Round-Table Conference on Petroleum
Exploration and Production, at the Presidential Hotels 2013,
Port Harcourt, Nigeria. Prof. John O. Etu-Efeotor, the Vice
Chancellor of the Federal University of Petroleum Resources,
Effurun, Nigeria, is also acknowledged for his technical
inputs in this study.

International Journal of Science and Technology (IJST) – Volume 4 No. 5, May, 2015
IJST © 2015– IJST Publications UK. All rights reserved. 246
REFERENCES
Adesida, A.A., T.J.A. Reijers, C.S. Nwajide, (1977) Sequence
stratigraphic framework of the Niger Delta Basin. Vienna,
Austria, AAPG International Conference and Exhibition v.
81, p.1359.
Avbovbo, A. A. (1978) Tertiary lithostratigraphy of Niger
Delta: American Association of Petroleum Geologists
Bulletin, v. 62, p. 295–300.
Doust, H., and E. Omatsola, (1990) Niger delta: in J. D.
Edwards and P.A. Santogrossi, Eds. Divergent/passive
margin basins: AAPG Memoir 48, p. 239-248.
Emery, D. and Myers, K. (1997) Sequence Stratigraphy.
Blackwell, London, 297 p.
Ejedawe, J.E., (1981) Patterns of incidence of oil reserves in
Niger Delta Basin. American Association of Petroleum
Geologists Bulletin 65, 1574–1585.
Ejedawe, J.E., Coker, S.J.L., Lambeth-Aikhionabare, D.O.,
Alofe, K.B. & Adoh, E.O., (1984). Evolution of oil
generative window and oil and gas occurrence in Tertiary
Niger Delta Basin. American Association of Petroleum
Geologists Bulletin 68, 1744–1751.
Evamy, D.D.J., Haremboure, P., Kamerling, W.A., Knaap,
F.Molloy, A. & Rowlands, M.H., (1978). Hydrocarbon
habitat of the Tertiary Niger Delta. American Association of
Petroleum Geologists Bulletin 62, 1–39.
Galloway, W.E., (1989). Genetic stratigraphic sequences in
basin analysis 1: Architecture and Genesis of flooding-
surface bounded depositional units. American Association of
Petroleum Geologists Bulletin 73, 125–142.
Fairbridge, R.W, (1961) ‘Eustatic Changes in Sea Level’ in
Ahrens L.H, Press F, Rankama K and Runcom SK (eds):
‘Physics and Chemistry of the Earth’, vol. 4, London,
England: Pergamon Press Ltd, p.99 – 185.
Haq, B.U., Hardenbol, J.,Vail, P.R., (1988) Mesozoic and
Cenozoic Chronostratigraphy and Cycles of Sea-Level
Change, In: Wilgus, C., Hastings, C.B.S., Kendall, C.G.,
Posamentier, H.W., Ross, C.A and Van Wagoner, J.C., Eds.,
Sea Level Changes: An Integrated Approach, Vol. 42, SEPM
Special Publication, 1988, pp. 72-108.
Hentz, T.F., Hongliu, Z and Kilic, C.O. (2002) “Sequence
Stratigraphy, Depositional Framework and Resource Potential
of Mature Gas Reservoirs, Offshore Louisiana (abs.)” AAPG
Annual Convention Program.
Knox, G.J. & Omatsola, M.E., (1987). Development of the
Cenozoic Niger Delta in terms of the escalator regression
model. [In:] Proceedings of the KNGMG Symposium
‘Coastal Lowlands – Geology and Geotechnology’. Kluwer
Academic Publishers, 181–202.
Ladipo, K.O. (1992). Sequence stratigraphic analysis: an
example of applications to prospect Appraisal in the
Northern (western) Niger Delta, Nigeria. Nigerian
Association of Petroleum Explorationists Bulletin 7, 153–
158.
Matthew, B.S; Flint, J.B, (2003) Stratigraphic Reservoir
Prediction in a Strikes-Slip System:Miocene of the East
Sakhalin Shelf, Russia. AAPG Intl. Conference, Barcelona,
Spain.
Meckel, L.D. (2003). Fourth-Order Deep Water Genetic
Stratigraphy, Stratigraphic Architecture and Reservoir
Stacking Patterns. AAPG Intl. Conference, Barcelona.
Momta, PS and Odigi MI, 2014. Sequence Stratigraphic
Analysis of the XP Field, Onshore Niger Delta, Nigeria.
Elixir International Journal, Elixir Geoscience 77 (2014)
29004-29009
Neal, J., David, R.., Vail, P.R, (1993). Sequence Stratigraphy,
a Global Theory for Local Success. Oilfield Review.
Odigi M.I, (2007). Facies Architecture and Sequence
Stratigraphy of 280 J. Geol. Min. Res. Cretaceous
Formations, Southeastern Benue Trough, Nigeria.
Unpublished PhD Thesis University of Port Harcourt. p. 312.
Posamentier, H.W. and Vail, P.R., (1988) Eustatic controls on
clastic deposition II – Sequence and Systems tract models, in
Wilgus, C.K., Hastings, B.S., Kendall, and C.G.S.J.C.
Rassi, C. and Hentz, T.F, (2003) ‘Production Prediction and
Reservoir Characterization of Systems Tracts of Fourth-Order
Sequence in the Miocene Offshore Louisiana (abs)’’,
American Association of Petroleum Geologists Annual
Convention, Offshore program, v.10, p.A164.
Rassi,C. (2002) in press. “Assessment of Production
Predictability of Fourth-Order Systems tracts In the Miocene
Offshore Louisiana”, Gulf Coast association of Geological
Societies, v.52.
Reijers, T.J.A. (2011). Stratigraphy and Sedimentology of the
Niger Delta. Geologos, The Netherlands, 17(3), p.133-162.
Reijers, T.J.A., Petters, S.W. & Nwajide, C.S. (1997).The
Niger Delta Basin. [In:] R.C. Selley (Ed.): African basins.
Sedimentary Basins of the World (Elsevier, Amsterdam) 3,
145–168.
Short, K. C., and Stauble, A.J. (1967) Outline of Geology of
Niger delta: American Association of Petroleum Geologists
Bulletin v. 51, p. 761-779.

International Journal of Science and Technology (IJST) – Volume 4 No. 5, May, 2015
IJST © 2015– IJST Publications UK. All rights reserved. 247
Slatt, R.M. (2006) Stratigraphic Reservoir Characterization,
Handbook of Petroleum Exploration and Production,
Elsevier, The Netherlands. P.379-422.
Sloss, L.L (1963) Sequences in the Cratonic Interior of North
America, Geological Society of America Bulletin 74; p. 93-
113.
Stacher, P., (1995). Present understanding of the Niger Delta
hydrocarbon habitat. [In:] M.N. Oti & G. Postma (Eds):
Geology of deltas. Balkema, Rotterdam, 257–268.
Van Wagoner, J.C., Posamentier, H.W., Mitchum, R.M.,
Vail, P.R., Sarg, J.F., Loutit, T.S., and
Hardenbol, J., (1988) An over view of the fundamentals of
sequence stratigraphy and key Definitions, in Wilgus, C.K.,
and al., e., eds., Sea-Level Changes -- An Integrated
Approach, Volume Special Publication #42: Tulsa, SEPM, p.
39-46.
Van Wagoner, J.C., Mitchum, R.M., Campion, K.M., and
Rahmanian, V.D., (1990) Siliciclastic Sequence stratigraphy
in well logs, core, and outcrops: concepts for high resolution
Correlation of time and facies, 55 p.
Vail, P.R. and Mitchum, R.M., (1977), Seismic stratigraphy
and global changes of sea level, Part1—Overview: AAPG
Memoir 26, p.51-52
Weber, K.J. and E.M. Daukoru, (1975), Petroleum geology of
the Niger delta: Proceedings of the 9th World Petroleum
Congress, Tokyo, v. 2, p. 202-221.
Whiteman, A. J., (1982) Nigeria, its petroleum, geology,
resources and potential. v. I and II, Edinburgh,Graham and
Trotman.
Wheeler, H.E, (1958).Time Stratigraphy, “American
Association of Petroleum Geologists Bulletin
42, no.5, May 1958.