journal of oil, gas and alternative energy sources ... · eperimental comparison for the...
TRANSCRIPT
EXPERIMENTAL COMPARISON FOR THE CALCULATION OF ROCK WETTABILITY USING THE AMOTT-HARVEY METHOD
CT&F - Ciencia, Tecnología y Futuro - Vol. 5 Num. 5 Dec. 2014 5
EXPERIMENTAL COMPARISON FOR THE CALCULATION
OF ROCK WETTABILITY USING THE AMOTT-HARVEY METHOD AND A NEW VISUAL METHOD
John-Alexander León-Pabón1*, Tito-Javier Mejía-Pilonieta1, Luis-Felipe Carrillo-Moreno1, Hernando Buendía-Lombana1, José-Francisco Zapata2 and Carlos-Andrés Díaz-Prada3
1Universidad Industrial de Santander, Bucaramanga, Santander, Colombia2Ecopetrol S.A., Bogotá, Cundinamarca, Colombia
3Ecopetrol S.A. - Instituto Colombiano del Petróleo (ICP), A.A. 4185 Bucaramanga, Santander, Colombia
e-mail: [email protected]
(Received: Jun. 26, 2014; Accepted: Nov. 26, 2014)
*To whom correspondence should be addressed
CT&F - Ciencia, Tecnología y Futuro - Vol. 5 Num. 5 Dec. 2014 Pag. 5 - 22
This article provides the results of the implementation of the Amott-Harvey method (quantitative) and the visual method (qualitative) to determine the wettability of the rock in core samples from the Mugrosa Formation of the Colorado Field, in order to learn about the distribution of fluids in the reservoir, as
this property affects various aspects of the production performance thereof.
Wettability is determined first by restoring the wettability of the samples, for 200 hours and 1000 hours at reservoir conditions (T = 144°F and P = 1350 psi). After that, rock wettability is calculated using the Amott-Harvey method, obtaining results of neutral wettability. It is then determined by the visual method for comparison purposes, in order to conclude that rock wettability is neutral.
It is important to emphasize that the visual method is of great relevance, because it provides a real view of how the fluids are distributed within the rock to obtain representative results, in order to make decisions that optimizes the production of the field under study.
ABSTRACT
How to cite: León-Pabón, J. A., Mejía-Pilonieta, T. J., Carrillo-Moreno, L. F., Buendía-Lombana, H., Zapata, J. F. & Díaz-Prada, C. A. (2014). Experimental comparison for the calculation of rock wettability using the Amott-Harvey method and a new visual method. CT&F - Ciencia, Tecnología y Futuro, 5(5), 5-22.
COMPARACIÓN EXPERIMENTAL PARA EL CÁLCULO DE LA MOJABILIDAD DE LA ROCA POR MEDIO DEL MÉTODO AMOTT-HARVEY
Y UN NUEVO MÉTODO VISUAL
ISSN (Print) 0122-5383ISSN (Online) 2382-4581
Journal of oil, gas and alternative energy sources
Keywords: Wettability, Hearts (Rock), Flow in porous media, Permeability, Method Amott-Harvey, Visual method, Neuter wettability.
CT&F - Ciencia, Tecnología y Futuro - Vol. 5 Num. 5 Dec. 2014
JOHN-ALEXANDER LEÓN-PABÓN et al.
6
Este artigo apresenta os resultados da implantação do método Amott-Harvey (quantitativo) e do método visual (qualitativo) para a determinação da molhabilidade da rocha em amostras de corações da formação Mugrosa do campo Colorado, e desta forma conhecer como é a distribuição de fluídos dentro
da jazida; já que dita propriedade incide em numerosos aspectos do desempenho de produção da jazida.
Inicialmente, a determinação da molhabilidade é realizada restaurando a molhabilidade das amostras; umas a 200 horas e outras a 1000 horas com relação às condições da jazida (T = 144°F e P = 1350 psi). Posteriormente, a molhabilidade da rocha é calculada com o método Amott-Harvey, obtendo resultados de uma molhabilidade neutra. Logo, é realizada a determinação da molhabilidade pelo método visual para gerar uma comparação e desta forma poder concluir que a molhabilidade da rocha é de tipo neutra.
É importante ressaltar que o método visual é de grande aplicabilidade, pois permite visualizar de forma real como são distribuídos os fluídos dentro da rocha e obter resultados representativos, para assim poder tomar decisões na hora de aperfeiçoar a produção do campo em estudo.
Este artículo presenta los resultados de la implementación del método Amott-Harvey (cuantitativo) y el método visual (cualitativo) para la determinación de la mojabilidad de la roca en muestras de corazones de la formación Mugrosa del campo Colorado, y de esta forma conocer como es la distribución de
fluidos dentro del yacimiento; ya que dicha propiedad incide en numerosos aspectos del desempeño de producción del yacimiento.
La determinación de la mojabilidad se realiza en primera medida restaurando la mojabilidad de las muestras; unas a 200 horas y otras a 1000 horas con respecto a las condiciones de yacimiento (T = 144°F y P = 1350 psi). Posteriormente se calcula la mojabilidad de la roca con el método Amott-Harvey, obteniendo resultados de una mojabilidad neutra. Luego se realiza la determinación de la mojabilidad por el método visual para generar una comparación y de esta forma poder concluir que la mojabilidad de la roca es de tipo neutra.
Es importante resaltar que el método visual es de gran aplicabilidad, pues nos permite visualizar de forma real como se distribuyen los fluidos dentro de la roca y obtener resultados representativos, para así poder tomar decisiones a la hora de optimizar la producción del campo en estudio.
Palabras clave: Mojabilidad, Corazones (roca), Flujo en medios porosos, Permeabilidad, Método Amott-Harvey, Método visual, Mojabilidad neutra.
Palavras-chave: Molhabilidade, Corações (rocha), Fluxo em meios porosos, Permeabilidade, Método Amott-Harvey, Método visual, Molhabilidade neutra.
RESUMEN
RESUMO
EXPERIMENTAL COMPARISON FOR THE CALCULATION OF ROCK WETTABILITY USING THE AMOTT-HARVEY METHOD
CT&F - Ciencia, Tecnología y Futuro - Vol. 5 Num. 5 Dec. 2014 7
1. INTRODUCTION
This study was conducted to highlight the importance of wettability, since accurate knowledge of a Rock/Fluid system is of great interest for all the decisions to be made in a reservoir engineering. It is well known that rock wettability is the factor with the greatest impact on the residual saturation and distribution of the fluids in the porous medium, as well as the ease with which each fluid flows in said medium. It is defined as a fluid's tendency to adhere to a solid surface in the presence of other immiscible fluids. Therefore, it is a physical phenomenon that not only acts in an oil reservoir, but it is also a phenomenon that is acting in our surroundings on a permanent basis (Abdallah et al., 2007).
The wetting conditions of a reservoir affect transport properties, such as: relative permeability, capillary pressure, behavior of injection with water, tertiary recovery, irreducible water saturation and residual oil saturation (Anderson, 1986).
This article presents the results of a study conducted on core samples, which determines the wettability of the Mugrosa Formation of the Colorado Field using one quantitative and one qualitative technique, showing results of neutral wettability.
2. THEORETICAL FRAMEWORK
Rock WettabilityWettability is defined as "a fluid's tendency to adhere
to a solid surface in the presence of other immiscible fluids". In a rock/oil/brine system, wettability can be defined as the measure of a rock's preference for oil or water. In a rock-fluid system, this is highly important because it is the main factor in the control of location, flow and distribution of fluids in a reservoir (Abdallah et al., 2007).
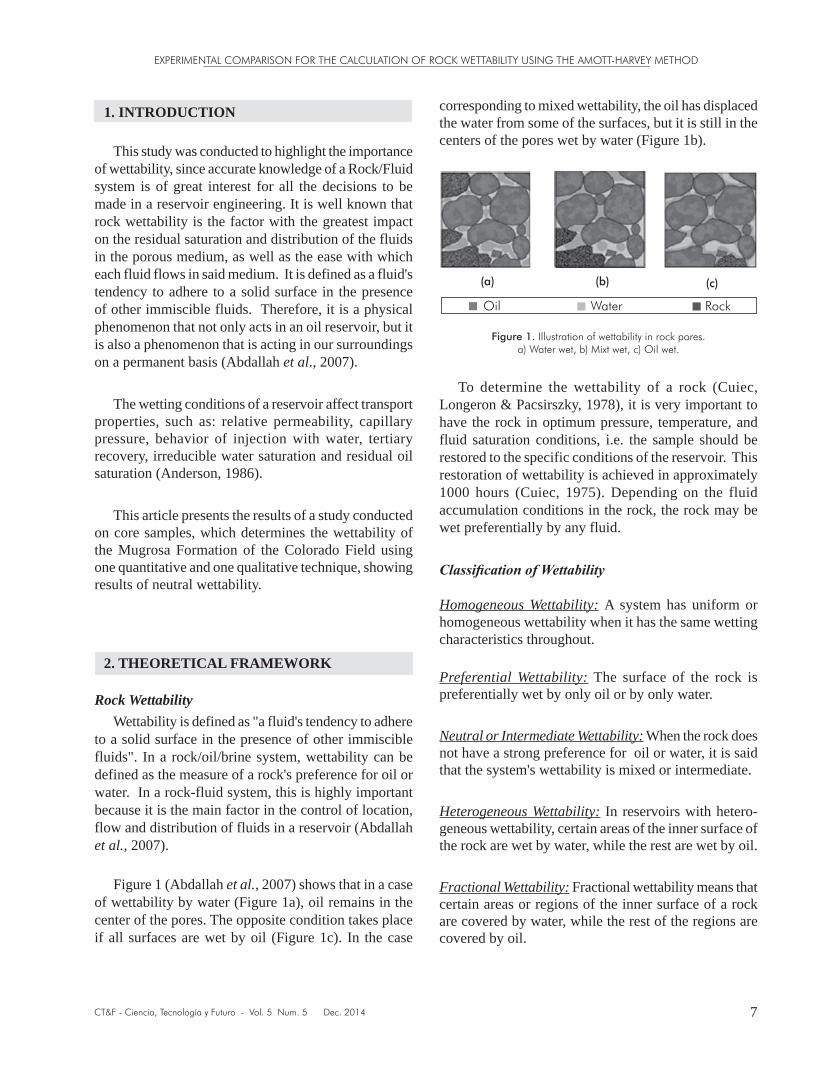
Figure 1 (Abdallah et al., 2007) shows that in a case of wettability by water (Figure 1a), oil remains in the center of the pores. The opposite condition takes place if all surfaces are wet by oil (Figure 1c). In the case
corresponding to mixed wettability, the oil has displaced the water from some of the surfaces, but it is still in the centers of the pores wet by water (Figure 1b).
Figure 1. Illustration of wettability in rock pores.a) Water wet, b) Mixt wet, c) Oil wet.
To determine the wettability of a rock (Cuiec, Longeron & Pacsirszky, 1978), it is very important to have the rock in optimum pressure, temperature, and fluid saturation conditions, i.e. the sample should be restored to the specific conditions of the reservoir. This restoration of wettability is achieved in approximately 1000 hours (Cuiec, 1975). Depending on the fluid accumulation conditions in the rock, the rock may be wet preferentially by any fluid.
Classification of Wettability
Homogeneous Wettability: A system has uniform or homogeneous wettability when it has the same wetting characteristics throughout.
Preferential Wettability: The surface of the rock is preferentially wet by only oil or by only water.
Neutral or Intermediate Wettability: When the rock does not have a strong preference for oil or water, it is said that the system's wettability is mixed or intermediate.
Heterogeneous Wettability: In reservoirs with hetero-geneous wettability, certain areas of the inner surface of the rock are wet by water, while the rest are wet by oil.
Fractional Wettability: Fractional wettability means that certain areas or regions of the inner surface of a rock are covered by water, while the rest of the regions are covered by oil.
CT&F - Ciencia, Tecnología y Futuro - Vol. 5 Num. 5 Dec. 2014
JOHN-ALEXANDER LEÓN-PABÓN et al.
8
Mixed Wettability: This is a special type of heterogeneous wettability in which the surfaces wet by oil form continuous paths through the larger pores. The small pores remain wet by water and contain no oil.
Restoration of WettabilityRestoration is carried out to restore the wetting
conditions of the rock to reservoir temperature and pressure conditions. The restoration procedure first consists of the cleaning of samples. After that, the samples are dried and saturated with fluids from the reservoir (crude oil, mineral oil and synthetic brine) to obtain a fluid distribution as close as possible to the distribution existing in situ (Cuiec, 1975). The system is then restored based on reservoir temperature and pressure conditions during the time required.
Methods to Determine Rock WettabilityQuantitative Methods
Conventional quantitative methods used to determine the wettability of a system (Donaldson, 1981) include:
● Contact Angle Method.
● Amott Method.
● Amott-Harvey Method.
● USBM Method.
The Amott-Harvey method was used in conducting this study, as it is endorsed by API RP 40, which is the most widely used in the oil industry.
Contact Angle Method: The contact angle is the best method to determine wettability when using pure fluids and artificial cores, since there is no possibility that the surfactants or other compounds will alter wettability. The method is also used to determine whether a crude oil can alter wettability and to examine the effects of temperature, pressure and the chemistry of the brine.
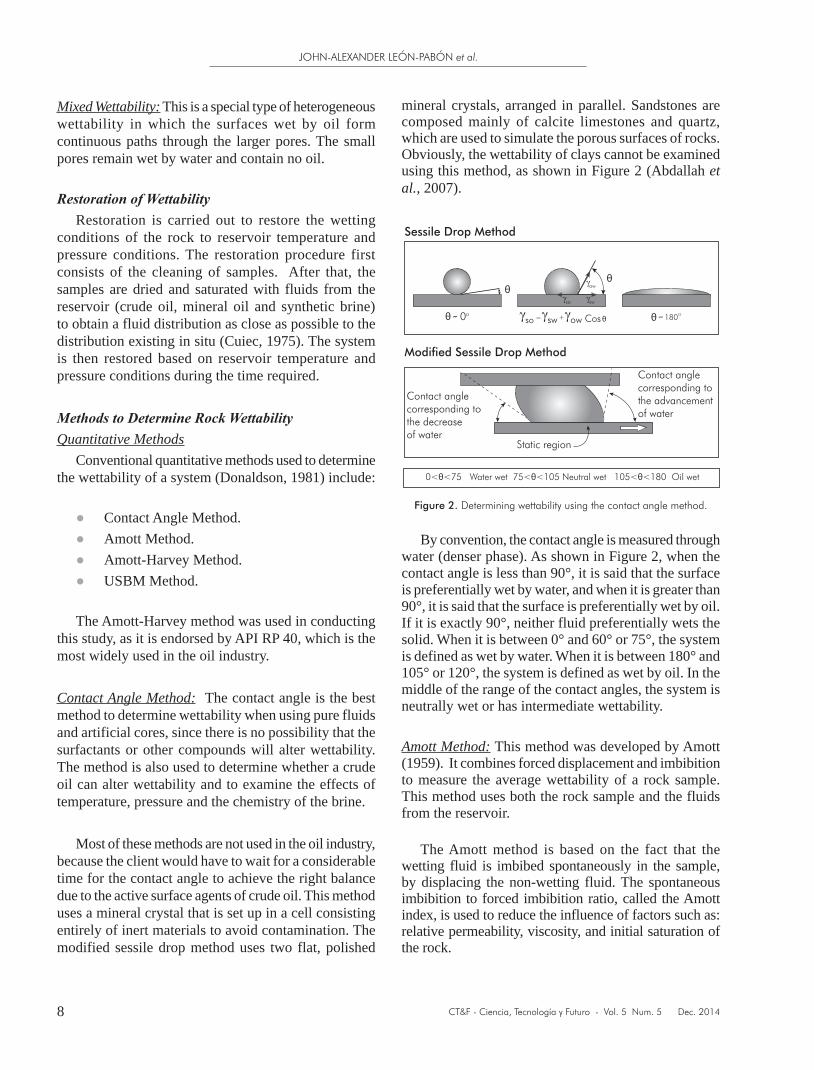
Most of these methods are not used in the oil industry, because the client would have to wait for a considerable time for the contact angle to achieve the right balance due to the active surface agents of crude oil. This method uses a mineral crystal that is set up in a cell consisting entirely of inert materials to avoid contamination. The modified sessile drop method uses two flat, polished
mineral crystals, arranged in parallel. Sandstones are composed mainly of calcite limestones and quartz, which are used to simulate the porous surfaces of rocks. Obviously, the wettability of clays cannot be examined using this method, as shown in Figure 2 (Abdallah et al., 2007).
Figure 2. Determining wettability using the contact angle method.
By convention, the contact angle is measured through water (denser phase). As shown in Figure 2, when the contact angle is less than 90°, it is said that the surface is preferentially wet by water, and when it is greater than 90°, it is said that the surface is preferentially wet by oil. If it is exactly 90°, neither fluid preferentially wets the solid. When it is between 0° and 60° or 75°, the system is defined as wet by water. When it is between 180° and 105° or 120°, the system is defined as wet by oil. In the middle of the range of the contact angles, the system is neutrally wet or has intermediate wettability.
Amott Method: This method was developed by Amott (1959). It combines forced displacement and imbibition to measure the average wettability of a rock sample. This method uses both the rock sample and the fluids from the reservoir.
The Amott method is based on the fact that the wetting fluid is imbibed spontaneously in the sample, by displacing the non-wetting fluid. The spontaneous imbibition to forced imbibition ratio, called the Amott index, is used to reduce the influence of factors such as: relative permeability, viscosity, and initial saturation of the rock.
EXPERIMENTAL COMPARISON FOR THE CALCULATION OF ROCK WETTABILITY USING THE AMOTT-HARVEY METHOD
CT&F - Ciencia, Tecnología y Futuro - Vol. 5 Num. 5 Dec. 2014 9
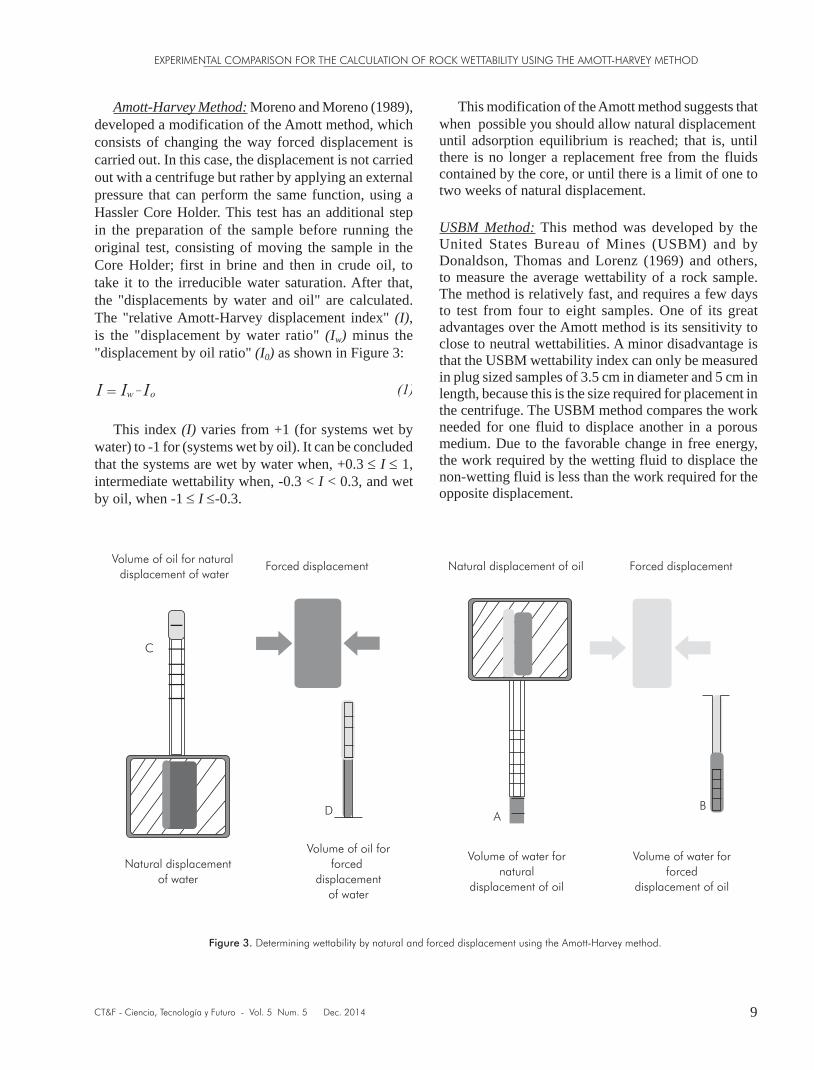
Amott-Harvey Method: Moreno and Moreno (1989), developed a modification of the Amott method, which consists of changing the way forced displacement is carried out. In this case, the displacement is not carried out with a centrifuge but rather by applying an external pressure that can perform the same function, using a Hassler Core Holder. This test has an additional step in the preparation of the sample before running the original test, consisting of moving the sample in the Core Holder; first in brine and then in crude oil, to take it to the irreducible water saturation. After that, the "displacements by water and oil" are calculated. The "relative Amott-Harvey displacement index" (I), is the "displacement by water ratio" (Iw) minus the "displacement by oil ratio" (I0) as shown in Figure 3:
This index (I) varies from +1 (for systems wet by water) to -1 for (systems wet by oil). It can be concluded that the systems are wet by water when, +0.3 ≤ I ≤ 1, intermediate wettability when, -0.3 < I < 0.3, and wet by oil, when -1 ≤ I ≤-0.3.
This modification of the Amott method suggests that when possible you should allow natural displacementuntil adsorption equilibrium is reached; that is, until there is no longer a replacement free from the fluids contained by the core, or until there is a limit of one to two weeks of natural displacement.
USBM Method: This method was developed by the United States Bureau of Mines (USBM) and by Donaldson, Thomas and Lorenz (1969) and others, to measure the average wettability of a rock sample. The method is relatively fast, and requires a few days to test from four to eight samples. One of its great advantages over the Amott method is its sensitivity to close to neutral wettabilities. A minor disadvantage is that the USBM wettability index can only be measured in plug sized samples of 3.5 cm in diameter and 5 cm in length, because this is the size required for placement in the centrifuge. The USBM method compares the work needed for one fluid to displace another in a porous medium. Due to the favorable change in free energy, the work required by the wetting fluid to displace the non-wetting fluid is less than the work required for the opposite displacement.
Volume of oil for natural displacement of water
Natural displacementof water
C
D AB
Volume of oil forforced
displacementof water
Volume of water fornatural
displacement of oil
Volume of water forforced
displacement of oil
Forced displacement Natural displacement of oil Forced displacement
Figure 3. Determining wettability by natural and forced displacement using the Amott-Harvey method.
CT&F - Ciencia, Tecnología y Futuro - Vol. 5 Num. 5 Dec. 2014
JOHN-ALEXANDER LEÓN-PABÓN et al.
10
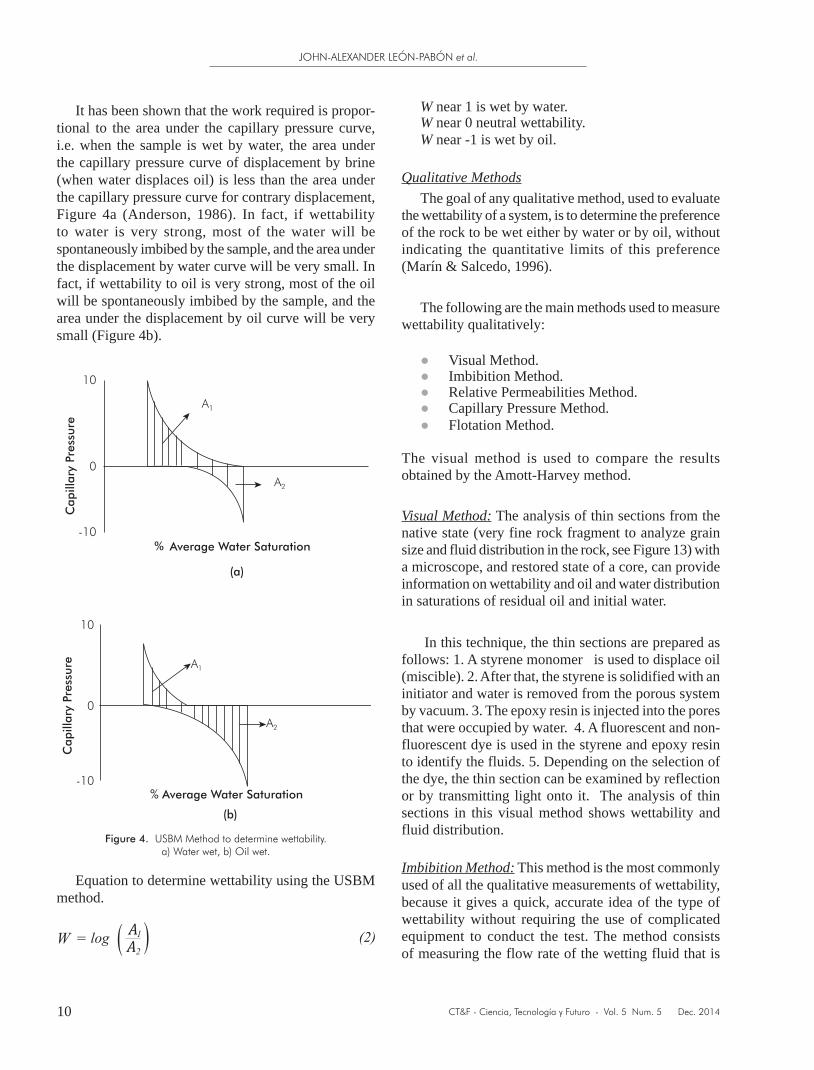
It has been shown that the work required is propor-tional to the area under the capillary pressure curve, i.e. when the sample is wet by water, the area under the capillary pressure curve of displacement by brine (when water displaces oil) is less than the area under the capillary pressure curve for contrary displacement, Figure 4a (Anderson, 1986). In fact, if wettability to water is very strong, most of the water will be spontaneously imbibed by the sample, and the area under the displacement by water curve will be very small. In fact, if wettability to oil is very strong, most of the oil will be spontaneously imbibed by the sample, and the area under the displacement by oil curve will be very small (Figure 4b).
Figure 4. USBM Method to determine wettability.a) Water wet, b) Oil wet.
Equation to determine wettability using the USBM method.
W near 1 is wet by water.W near 0 neutral wettability. W near -1 is wet by oil.
Qualitative MethodsThe goal of any qualitative method, used to evaluate
the wettability of a system, is to determine the preference of the rock to be wet either by water or by oil, without indicating the quantitative limits of this preference (Marín & Salcedo, 1996).
The following are the main methods used to measure wettability qualitatively:
● Visual Method.● Imbibition Method.● Relative Permeabilities Method.● Capillary Pressure Method.● Flotation Method.
The visual method is used to compare the results obtained by the Amott-Harvey method.
Visual Method: The analysis of thin sections from the native state (very fine rock fragment to analyze grain size and fluid distribution in the rock, see Figure 13) with a microscope, and restored state of a core, can provide information on wettability and oil and water distribution in saturations of residual oil and initial water.
In this technique, the thin sections are prepared as follows: 1. A styrene monomer is used to displace oil (miscible). 2. After that, the styrene is solidified with an initiator and water is removed from the porous system by vacuum. 3. The epoxy resin is injected into the pores that were occupied by water. 4. A fluorescent and non-fluorescent dye is used in the styrene and epoxy resin to identify the fluids. 5. Depending on the selection of the dye, the thin section can be examined by reflection or by transmitting light onto it. The analysis of thin sections in this visual method shows wettability and fluid distribution.
Imbibition Method: This method is the most commonly used of all the qualitative measurements of wettability, because it gives a quick, accurate idea of the type of wettability without requiring the use of complicated equipment to conduct the test. The method consists of measuring the flow rate of the wetting fluid that is
Cap
illar
y Pr
essu
re
Average Water Saturation%
A1
A2
(a)
10
-10
0
10
-10
Cap
illar
y Pr
essu
re A1
A2
(b)
% Average Water Saturation
0
EXPERIMENTAL COMPARISON FOR THE CALCULATION OF ROCK WETTABILITY USING THE AMOTT-HARVEY METHOD
CT&F - Ciencia, Tecnología y Futuro - Vol. 5 Num. 5 Dec. 2014 11
displaced naturally in a rock sample, replacing the non-wetting fluid by the mere action of capillary forces.
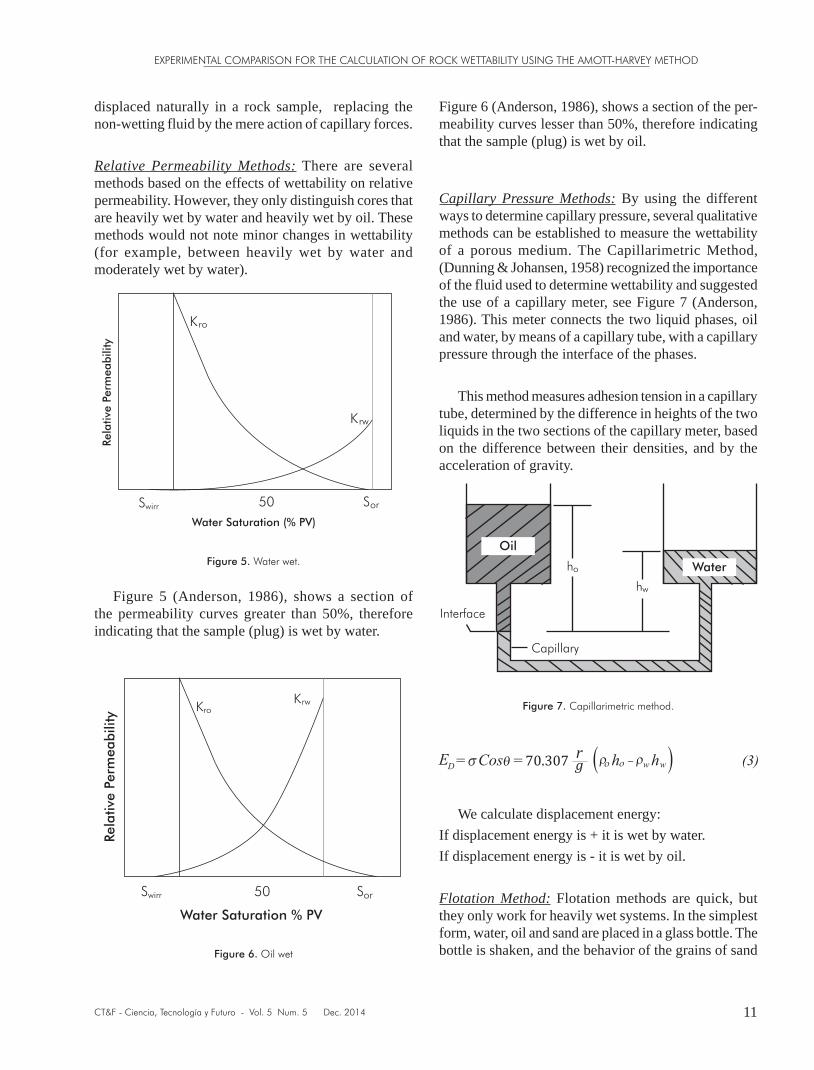
Relative Permeability Methods: There are several methods based on the effects of wettability on relative permeability. However, they only distinguish cores that are heavily wet by water and heavily wet by oil. These methods would not note minor changes in wettability (for example, between heavily wet by water and moderately wet by water).
Figure 5. Water wet.
Figure 5 (Anderson, 1986), shows a section of the permeability curves greater than 50%, therefore indicating that the sample (plug) is wet by water.
Figure 6. Oil wet
Figure 6 (Anderson, 1986), shows a section of the per-meability curves lesser than 50%, therefore indicating that the sample (plug) is wet by oil.
Capillary Pressure Methods: By using the different ways to determine capillary pressure, several qualitative methods can be established to measure the wettability of a porous medium. The Capillarimetric Method, (Dunning & Johansen, 1958) recognized the importance of the fluid used to determine wettability and suggested the use of a capillary meter, see Figure 7 (Anderson, 1986). This meter connects the two liquid phases, oil and water, by means of a capillary tube, with a capillary pressure through the interface of the phases.
This method measures adhesion tension in a capillary tube, determined by the difference in heights of the two liquids in the two sections of the capillary meter, based on the difference between their densities, and by the acceleration of gravity.
Figure 7. Capillarimetric method.
We calculate displacement energy:
If displacement energy is + it is wet by water.
If displacement energy is - it is wet by oil.
Flotation Method: Flotation methods are quick, but they only work for heavily wet systems. In the simplest form, water, oil and sand are placed in a glass bottle. The bottle is shaken, and the behavior of the grains of sand
Water
Oil
Interface
Capillary
ho
hw
CT&F - Ciencia, Tecnología y Futuro - Vol. 5 Num. 5 Dec. 2014
JOHN-ALEXANDER LEÓN-PABÓN et al.
12
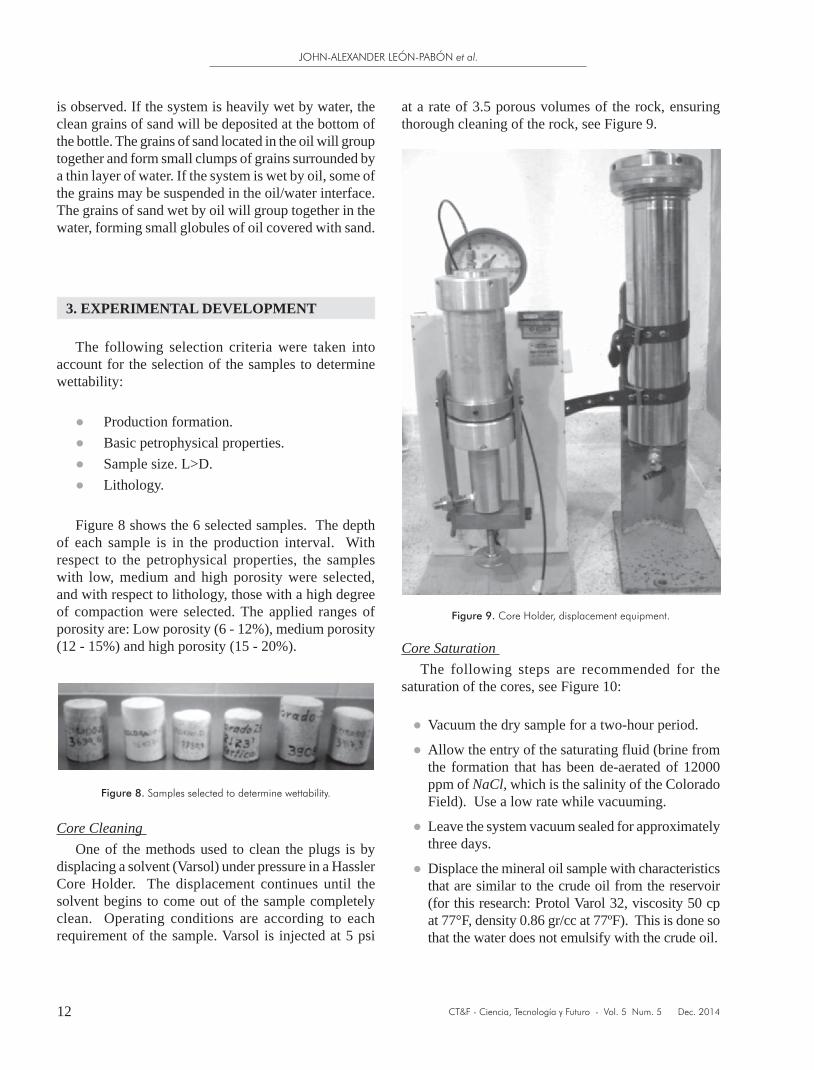
at a rate of 3.5 porous volumes of the rock, ensuring thorough cleaning of the rock, see Figure 9.
Figure 9. Core Holder, displacement equipment.
Core Saturation The following steps are recommended for the
saturation of the cores, see Figure 10:
● Vacuum the dry sample for a two-hour period.
● Allow the entry of the saturating fluid (brine from the formation that has been de-aerated of 12000 ppm of NaCl, which is the salinity of the Colorado Field). Use a low rate while vacuuming.
● Leave the system vacuum sealed for approximately three days.
● Displace the mineral oil sample with characteristics that are similar to the crude oil from the reservoir (for this research: Protol Varol 32, viscosity 50 cp at 77°F, density 0.86 gr/cc at 77ºF). This is done so that the water does not emulsify with the crude oil.
is observed. If the system is heavily wet by water, the clean grains of sand will be deposited at the bottom of the bottle. The grains of sand located in the oil will group together and form small clumps of grains surrounded by a thin layer of water. If the system is wet by oil, some of the grains may be suspended in the oil/water interface. The grains of sand wet by oil will group together in the water, forming small globules of oil covered with sand.
3. EXPERIMENTAL DEVELOPMENT
The following selection criteria were taken into account for the selection of the samples to determine wettability:
● Production formation.
● Basic petrophysical properties.
● Sample size. L>D.
● Lithology.
Figure 8 shows the 6 selected samples. The depth of each sample is in the production interval. With respect to the petrophysical properties, the samples with low, medium and high porosity were selected, and with respect to lithology, those with a high degree of compaction were selected. The applied ranges of porosity are: Low porosity (6 - 12%), medium porosity (12 - 15%) and high porosity (15 - 20%).
Figure 8. Samples selected to determine wettability.
Core Cleaning One of the methods used to clean the plugs is by
displacing a solvent (Varsol) under pressure in a Hassler Core Holder. The displacement continues until the solvent begins to come out of the sample completely clean. Operating conditions are according to each requirement of the sample. Varsol is injected at 5 psi
EXPERIMENTAL COMPARISON FOR THE CALCULATION OF ROCK WETTABILITY USING THE AMOTT-HARVEY METHOD
CT&F - Ciencia, Tecnología y Futuro - Vol. 5 Num. 5 Dec. 2014 13
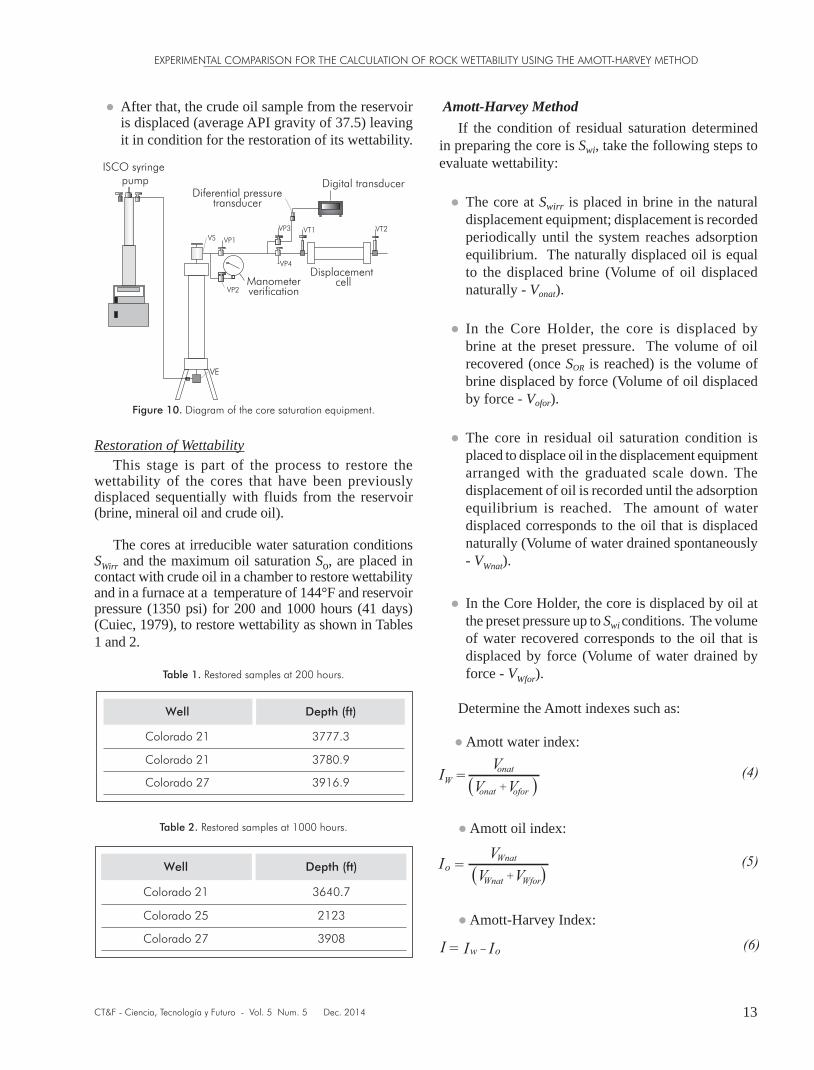
● After that, the crude oil sample from the reservoir is displaced (average API gravity of 37.5) leaving it in condition for the restoration of its wettability.
Figure 10. Diagram of the core saturation equipment.
Restoration of WettabilityThis stage is part of the process to restore the
wettability of the cores that have been previously displaced sequentially with fluids from the reservoir (brine, mineral oil and crude oil).
The cores at irreducible water saturation conditions SWirr and the maximum oil saturation So, are placed in contact with crude oil in a chamber to restore wettability and in a furnace at a temperature of 144°F and reservoir pressure (1350 psi) for 200 and 1000 hours (41 days) (Cuiec, 1979), to restore wettability as shown in Tables 1 and 2.
Table 1. Restored samples at 200 hours.
Table 2. Restored samples at 1000 hours.
Amott-Harvey MethodIf the condition of residual saturation determined
in preparing the core is Swi, take the following steps to evaluate wettability:
● The core at Swirr is placed in brine in the natural displacement equipment; displacement is recorded periodically until the system reaches adsorption equilibrium. The naturally displaced oil is equal to the displaced brine (Volume of oil displaced naturally - Vonat).
● In the Core Holder, the core is displaced by brine at the preset pressure. The volume of oil recovered (once SOR is reached) is the volume of brine displaced by force (Volume of oil displaced by force - Vofor).
● The core in residual oil saturation condition is placed to displace oil in the displacement equipment arranged with the graduated scale down. The displacement of oil is recorded until the adsorption equilibrium is reached. The amount of water displaced corresponds to the oil that is displaced naturally (Volume of water drained spontaneously - VWnat).
● In the Core Holder, the core is displaced by oil at the preset pressure up to Swi conditions. The volume of water recovered corresponds to the oil that is displaced by force (Volume of water drained by force - VWfor).
Determine the Amott indexes such as:
● Amott water index:
● Amott oil index:
● Amott-Harvey Index:
ISCO syringe pump
Diferential pressuretransducer
Digital transducer
Displacement cellManometer
verification
VE
VS VP1
VP2
VP3
VP4
VT1 VT2
Colorado 21 3777.3
3780.9
3916.9
Well Depth (ft)
Colorado 27
Colorado 21
Colorado 21 3640.7
2123
3908
Well Depth (ft)
Colorado 27
Colorado 25
CT&F - Ciencia, Tecnología y Futuro - Vol. 5 Num. 5 Dec. 2014
JOHN-ALEXANDER LEÓN-PABÓN et al.
14
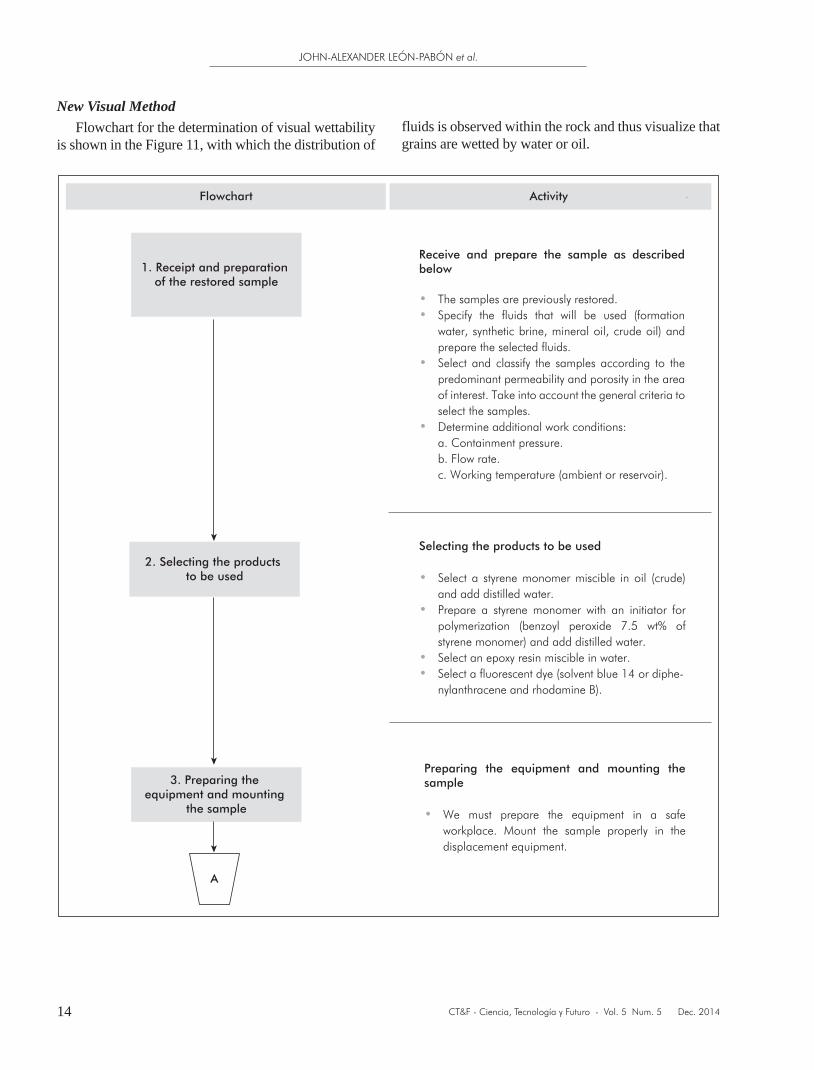
New Visual Method Flowchart for the determination of visual wettability
is shown in the Figure 11, with which the distribution of
1. Receipt and preparation of the restored sample
Flowchart Activity
2. Selecting the products to be used
A
3. Preparing the equipment and mounting
the sample
Receive and prepare the sample as described below
• The samples are previously restored.• Specify the fluids that will be used (formation
water, synthetic brine, mineral oil, crude oil) and prepare the selected fluids.
• Select and classify the samples according to the predominant permeability and porosity in the area of interest. Take into account the general criteria to select the samples.
• Determine additional work conditions: a. Containment pressure.
b. Flow rate.c. Working temperature (ambient or reservoir).
Preparing the equipment and mounting the sample
• We must prepare the equipment in a safe workplace. Mount the sample properly in the displacement equipment.
Selecting the products to be used
• Select a styrene monomer miscible in oil (crude) and add distilled water.
• Prepare a styrene monomer with an initiator for polymerization (benzoyl peroxide 7.5 wt% of styrene monomer) and add distilled water.
• Select an epoxy resin miscible in water.• Select a fluorescent dye (solvent blue 14 or diphe- nylanthracene and rhodamine B).
fluids is observed within the rock and thus visualize that grains are wetted by water or oil.
EXPERIMENTAL COMPARISON FOR THE CALCULATION OF ROCK WETTABILITY USING THE AMOTT-HARVEY METHOD
CT&F - Ciencia, Tecnología y Futuro - Vol. 5 Num. 5 Dec. 2014 15
5. Solidification of the styrene monomer
4. Displace the styrene monomer through the samp
6. Inject the epoxy resin
8. Make a thin section
9. Examine the thin section in transmitted or
reflected light
10. Illustrate wettability
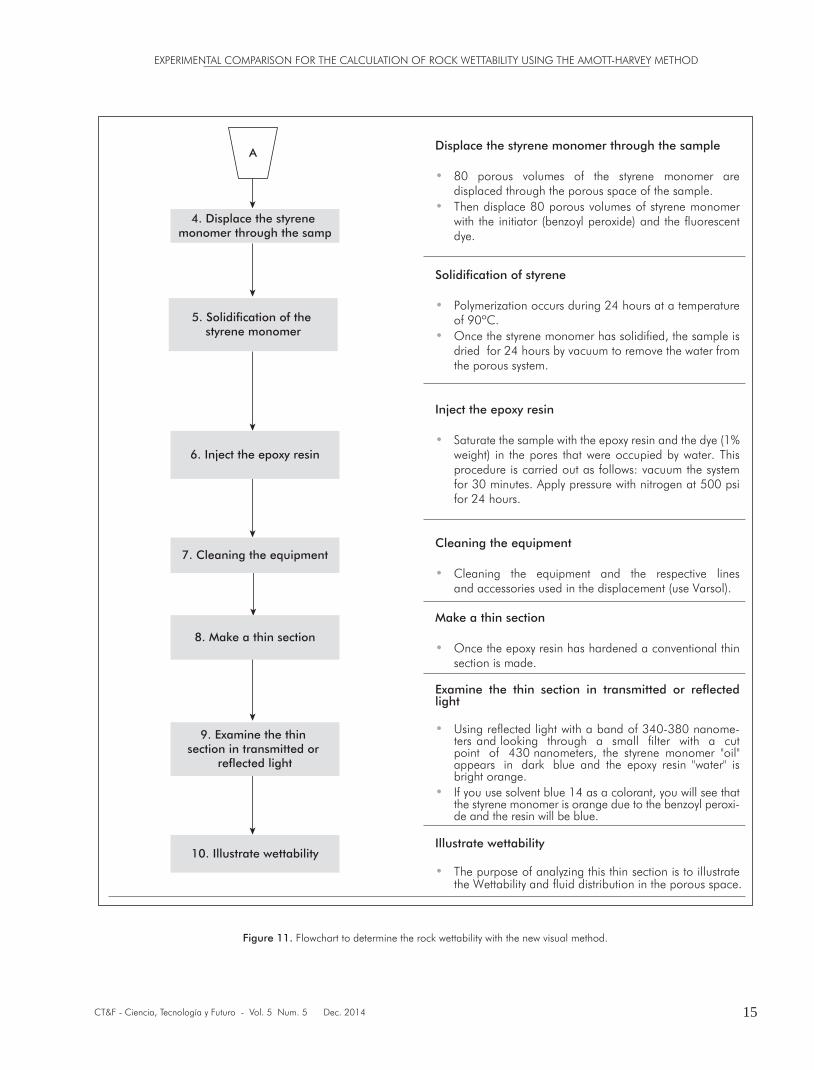
Displace the styrene monomer through the sample
• 80 porous volumes of the styrene monomer are displaced through the porous space of the sample.
• Then displace 80 porous volumes of styrene monomer with the initiator (benzoyl peroxide) and the fluorescent dye.
Solidification of styrene
• Polymerization occurs during 24 hours at a temperature of 90ºC.
• Once the styrene monomer has solidified, the sample is dried for 24 hours by vacuum to remove the water from the porous system.
Inject the epoxy resin
• Saturate the sample with the epoxy resin and the dye (1% weight) in the pores that were occupied by water. This procedure is carried out as follows: vacuum the system for 30 minutes. Apply pressure with nitrogen at 500 psi for 24 hours.
Cleaning the equipment
• Cleaning the equipment and the respective lines and accessories used in the displacement (use Varsol).
Make a thin section
• Once the epoxy resin has hardened a conventional thin section is made.
Examine the thin section in transmitted or reflected light
• Using reflected light with a band of 340-380 nanome-ters and looking through a small filter with a cut point of 430 nanometers, the styrene monomer "oil" appears in dark blue and the epoxy resin "water" is bright orange.
• If you use solvent blue 14 as a colorant, you will see that the styrene monomer is orange due to the benzoyl peroxi-de and the resin will be blue.
Illustrate wettability
• The purpose of analyzing this thin section is to illustrate the Wettability and fluid distribution in the porous space.
A
7. Cleaning the equipment
Figure 11. Flowchart to determine the rock wettability with the new visual method.
CT&F - Ciencia, Tecnología y Futuro - Vol. 5 Num. 5 Dec. 2014
JOHN-ALEXANDER LEÓN-PABÓN et al.
16
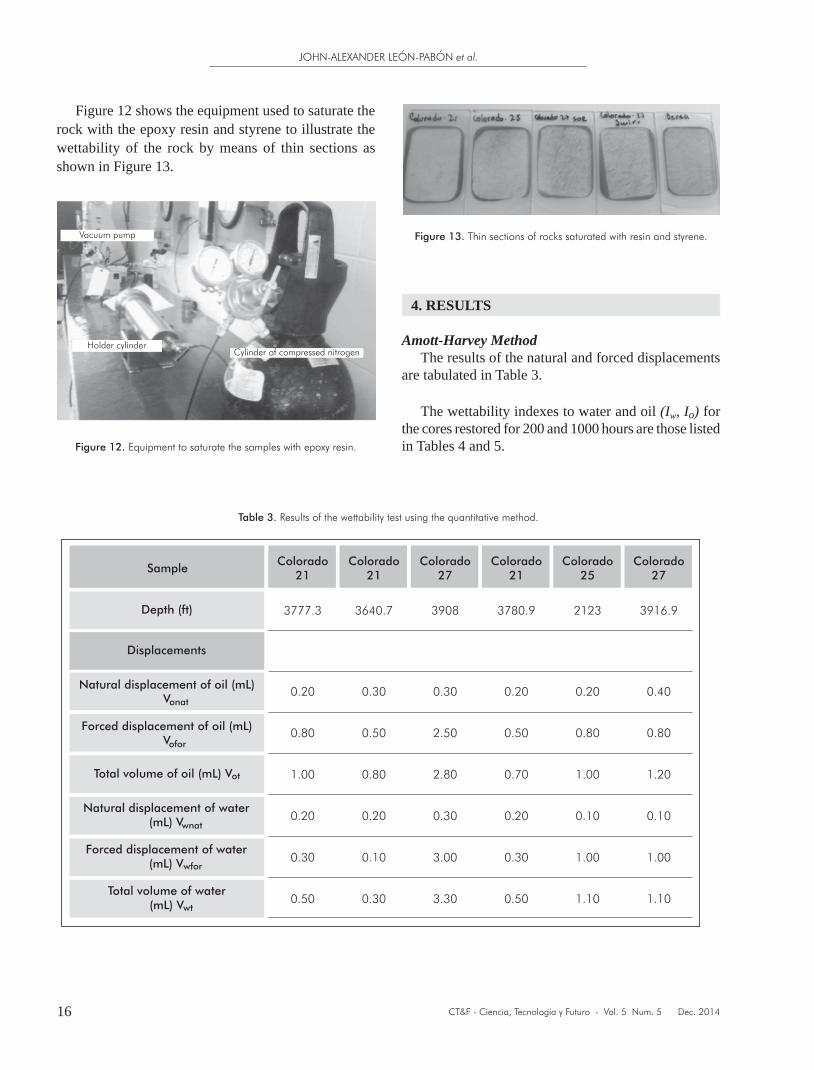
Figure 12 shows the equipment used to saturate the rock with the epoxy resin and styrene to illustrate the wettability of the rock by means of thin sections as shown in Figure 13.
Figure 12. Equipment to saturate the samples with epoxy resin.
Figure 13. Thin sections of rocks saturated with resin and styrene.
4. RESULTS
Amott-Harvey MethodThe results of the natural and forced displacements
are tabulated in Table 3.
The wettability indexes to water and oil (Iw, Io) for the cores restored for 200 and 1000 hours are those listed in Tables 4 and 5.
Table 3. Results of the wettability test using the quantitative method.
EXPERIMENTAL COMPARISON FOR THE CALCULATION OF ROCK WETTABILITY USING THE AMOTT-HARVEY METHOD
CT&F - Ciencia, Tecnología y Futuro - Vol. 5 Num. 5 Dec. 2014 17
intermediate wettability because the values are within the range (-0.3 ≤ I ≤ 0.3).
Table 6. Results of the Amott-Harvey displacement index for the samples from the Colorado Field of the Mugrosa Formation.
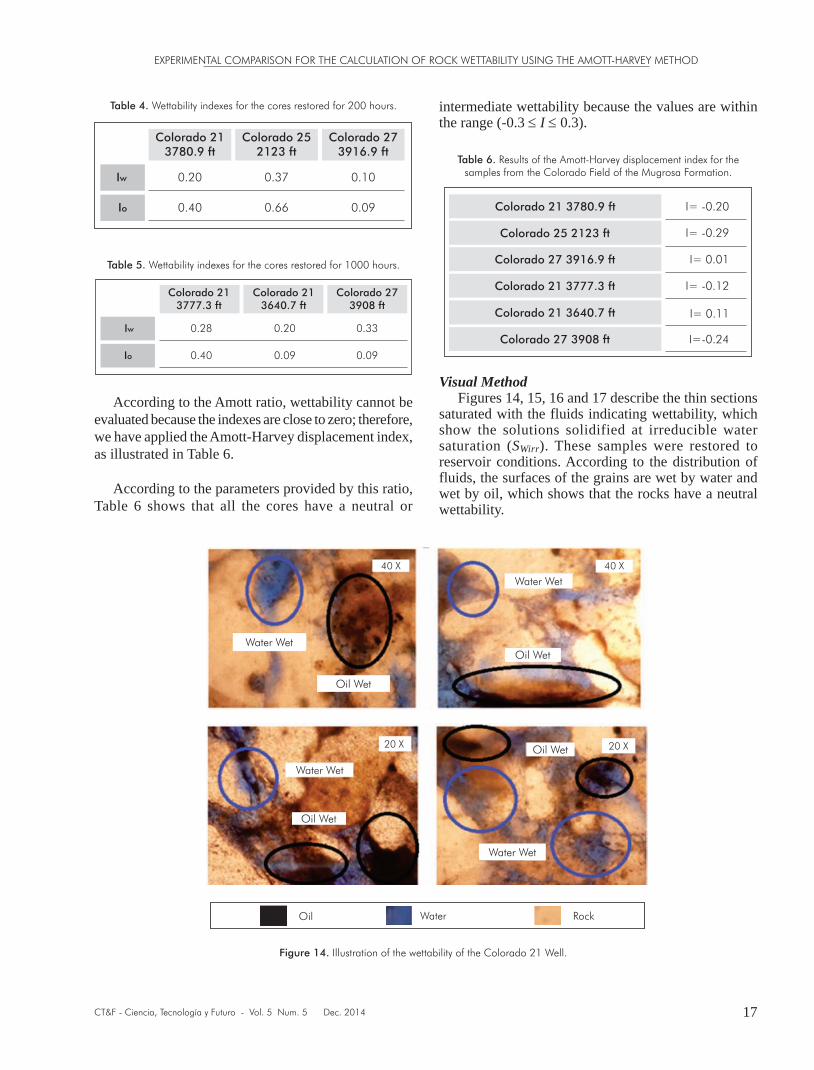
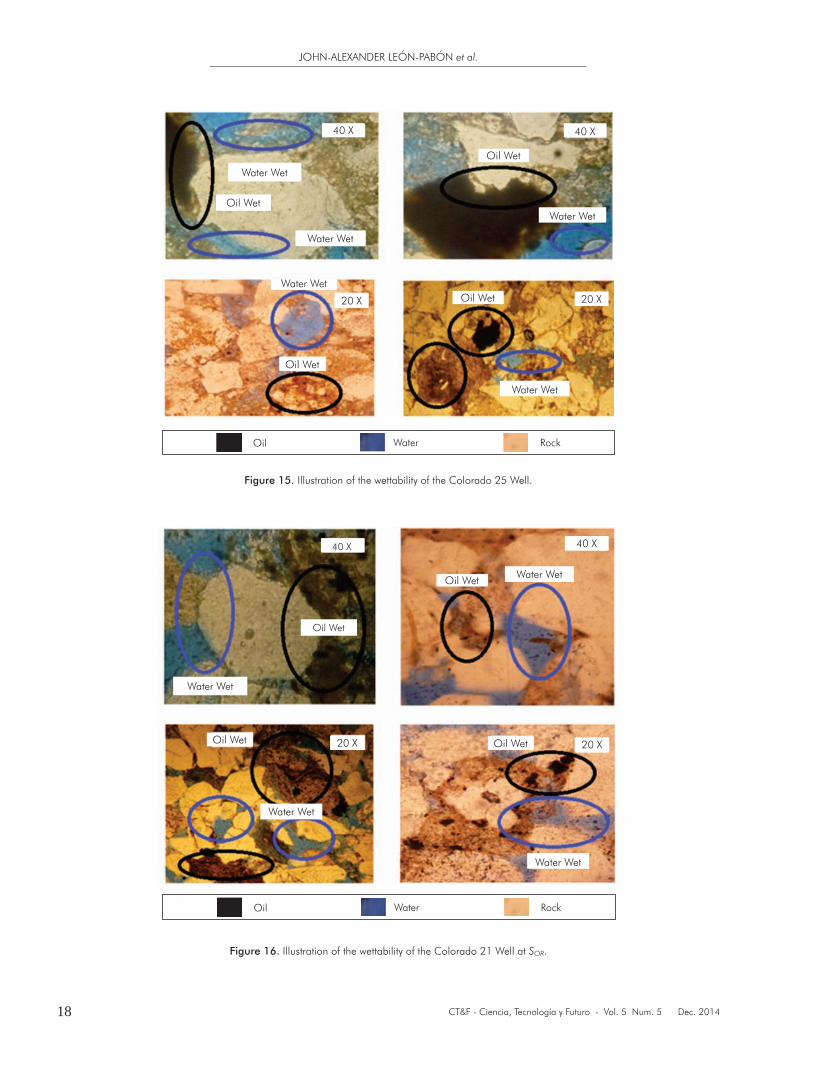
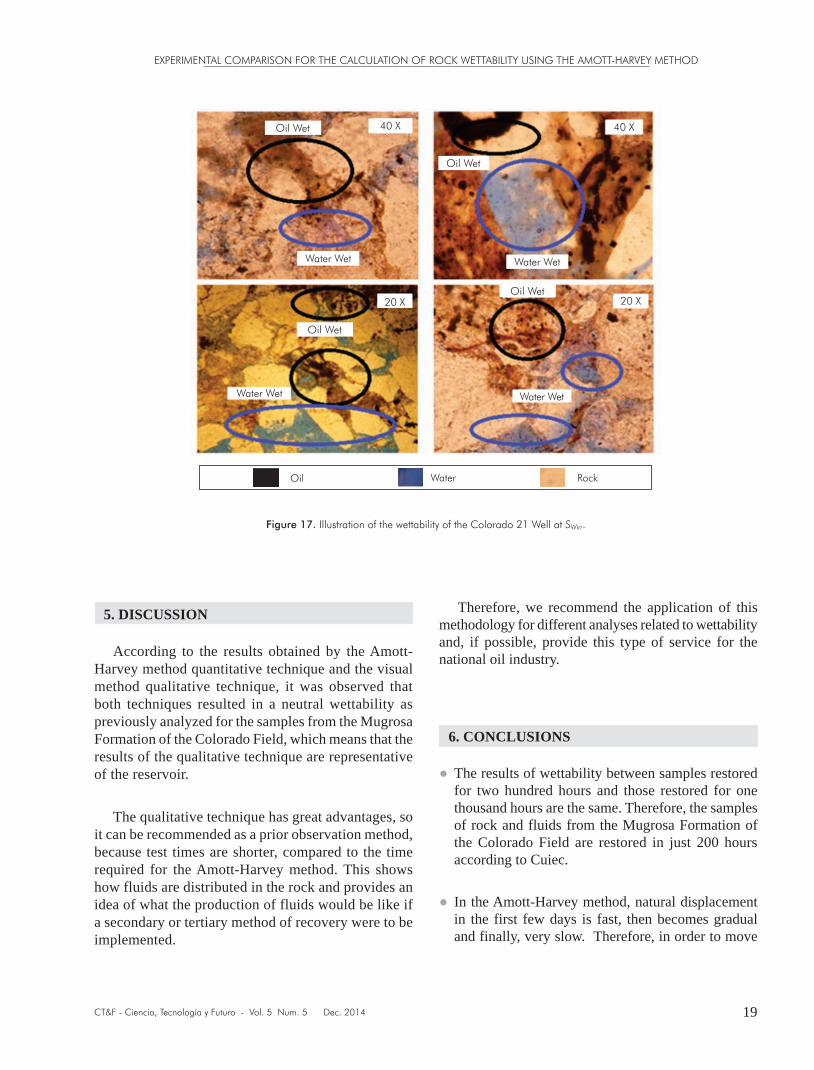
Visual MethodFigures 14, 15, 16 and 17 describe the thin sections
saturated with the fluids indicating wettability, which show the solutions solidified at irreducible water saturation (SWirr). These samples were restored to reservoir conditions. According to the distribution of fluids, the surfaces of the grains are wet by water and wet by oil, which shows that the rocks have a neutral wettability.
Table 4. Wettability indexes for the cores restored for 200 hours.
Table 5. Wettability indexes for the cores restored for 1000 hours.
According to the Amott ratio, wettability cannot be evaluated because the indexes are close to zero; therefore, we have applied the Amott-Harvey displacement index, as illustrated in Table 6.
According to the parameters provided by this ratio, Table 6 shows that all the cores have a neutral or
Iw 0.20 0.37 0.10
Io 0.40 0.66 0.09
Colorado 213780.9 ft
Colorado 252123 ft
Colorado 273916.9 ft
Iw 0.28 0.20 0.33
Io 0.40 0.09 0.09
Colorado 213777.3 ft
Colorado 213640.7 ft
Colorado 273908 ft
Figure 14. Illustration of the wettability of the Colorado 21 Well.
CT&F - Ciencia, Tecnología y Futuro - Vol. 5 Num. 5 Dec. 2014
JOHN-ALEXANDER LEÓN-PABÓN et al.
18
Figure 15. Illustration of the wettability of the Colorado 25 Well.
Figure 16. Illustration of the wettability of the Colorado 21 Well at SOR.
EXPERIMENTAL COMPARISON FOR THE CALCULATION OF ROCK WETTABILITY USING THE AMOTT-HARVEY METHOD
CT&F - Ciencia, Tecnología y Futuro - Vol. 5 Num. 5 Dec. 2014 19
Figure 17. Illustration of the wettability of the Colorado 21 Well at SWirr.
5. DISCUSSION
According to the results obtained by the Amott-Harvey method quantitative technique and the visual method qualitative technique, it was observed that both techniques resulted in a neutral wettability as previously analyzed for the samples from the Mugrosa Formation of the Colorado Field, which means that the results of the qualitative technique are representative of the reservoir.
The qualitative technique has great advantages, so it can be recommended as a prior observation method, because test times are shorter, compared to the time required for the Amott-Harvey method. This shows how fluids are distributed in the rock and provides an idea of what the production of fluids would be like if a secondary or tertiary method of recovery were to be implemented.
Therefore, we recommend the application of this methodology for different analyses related to wettability and, if possible, provide this type of service for the national oil industry.
6. CONCLUSIONS
● The results of wettability between samples restored for two hundred hours and those restored for one thousand hours are the same. Therefore, the samples of rock and fluids from the Mugrosa Formation of the Colorado Field are restored in just 200 hours according to Cuiec.
● In the Amott-Harvey method, natural displacement in the first few days is fast, then becomes gradual and finally, very slow. Therefore, in order to move
CT&F - Ciencia, Tecnología y Futuro - Vol. 5 Num. 5 Dec. 2014
JOHN-ALEXANDER LEÓN-PABÓN et al.
20
Amott, E. (1959). Observations relating to the wettability of porous rock. Trans. AIME, 216: 156-162.
Anderson, W. G. (1986). Wettability literature survey – Part 2: Wettability measurement. J. Petrol. Technol., 38(11), 1246-1262.
Cuiec, L. (1975). Restoration of the natural state of core samples. Fall Meeting of the Society of Petroleum Engineers of AIME, Dallas, USA. SPE-5634.
Cuiec, L. (1979). On the necessity of respecting reservoir conditions in laboratory displacement studies. Middle East Technical Conference and Exhibition, Bahrain. SPE-7785.
Cuiec, L., Longeron, D. & Pacsirszky, J. (1978). Recommendations for the determination of the wettability of a specimen of reservoir rock. Rev. Inst. Franc. Du Petrole., 33(6), 907-914.
Donaldson, E. C. (1981). Oil – water – rock wettability measurement. Symposium of Chemistry of Enhanced Oil Recovery, Atlanta.
Donaldson, E. C. Thomas, R. D. & Lorenz, P. B. (1969). Wettability determination and its effect on recovery efficiency. SPE J., 9(1), 13-20.
Dunning, H. N. & Johansen. R. T. (1958). Capillarimetric method for measurement of crude oil wetting tendency. Petrol. Eng., 30(7), B26-B27.
Marín-Hurtado, J. & Salcedo-Vega, O. (1996). Aplicación de la mojabilidad en la Ingeniería de Petróleos: Estado del Arte. Tesis de pregrado, Ingeniería de Petróleos, Universidad Industrial de Santander. Bucaramanga, Colombia. 246pp.
Moreno, A. & Moreno, N. (1989). Mojabilidad en medios porosos y su determinación por una modificación del método Amott. Tesis de pregrado, Ingeniería de Petróleos, Universidad Industrial de Santander. Bucaramanga, Colombia. 189pp.
AUTHORS
John-Alexander León-PabónAffiliation: Universidad Industrial de SantanderPetroleum Engineer, Universidad Industrial de SantanderM. Sc. in Engineering Hydrocarbons, Universidad Industrial de Santandere-mail: [email protected]
forward in conducting the test, 8 to 10 days is suggested as a reasonable time to suspend natural displacement, deduced on average from the 6 cores analyzed, without largely altering the volumes obtained.
● The application of the Amott-Harvey method in this research to calculate the wettability of the Mugrosa Formation of the Colorado Field, obtained results of neutral wettability for the 6 samples that were used in this test, because the values are within the range (-0.3 ≤ I ≤ 0.3).
● The methodology used to illustrate wettability using the qualitative technique (visual method) yielded representative results, which were used to validate the wettability of the Mugrosa Formation of the Colorado Field with the quantitative technique, resulting in neutral wettability.
● The methodology of the visual method has been established as a procedure at the Petrophysical Analysis Laboratory of the Universidad Industrial de Santander to perform or provide services to determine the wettability of any field in the country and also, to be able to conduct further studies on wettability.
ACKNOWLEDGEMENTS
The authors would like to thank the School of Petroleum Engineering of the Universidad Industrial de Santander (UIS) and Ecopetrol S.A. - Instituto Colombiano del Petróleo (ICP) for providing the laboratory information necessary to conduct this research. They would also like to thank the reviewers of this paper for their corrections and suggestions.
REFERENCES
Abdallah, W., Buckley, J., Carnegie, A., Edwards, J., Herold, B., Fordhman, E., Graue, A., Habashy, T., Seleznev, N., Signer, C., Hussain, H., Montaron, B. & Ziauddin, M. (2007). Los fundamentos de mojabilidad. Oilfield Review, 19: 48-67.
EXPERIMENTAL COMPARISON FOR THE CALCULATION OF ROCK WETTABILITY USING THE AMOTT-HARVEY METHOD
CT&F - Ciencia, Tecnología y Futuro - Vol. 5 Num. 5 Dec. 2014 21
Tito-Javier Mejía-PilonietaAffiliation: Universidad Industrial de SantanderPetroleum Engineer, Universidad Industrial de Santandere-mail: [email protected]
Luis-Felipe Carrillo-MorenoAffiliation: Universidad Industrial de SantanderChemist, Universidad Industrial de SantanderM. Sc. Engineering, The University of Tulsae-mail: [email protected]
Hernando Buendia-LombanaAffiliation: Universidad Industrial de SantanderChemist, Universidad Industrial de SantanderM.Sc. in Business Administration, Universidad Santo Tomáse-mail: [email protected]
José-Francisco ZapataAffiliation: Ecopetrol S.A.Chemical Engineer, Universidad Industrial de SantanderM. Sc. in Petroleum Engineering, Texas A&M Universitye-mail: [email protected] Carlos-Andrés Díaz-PradaAffiliation: Ecopetrol S.A.-Instituto Colombiano del Petróleo (ICP)Petroleum Engineer, Universidad Industrial de SantanderM. Sc. in Engineering Hydrocarbons, Universidad Industrial de Santandere-mail: [email protected]
CT&F - Ciencia, Tecnología y Futuro - Vol. 5 Num. 5 Dec. 2014
JOHN-ALEXANDER LEÓN-PABÓN et al.
22
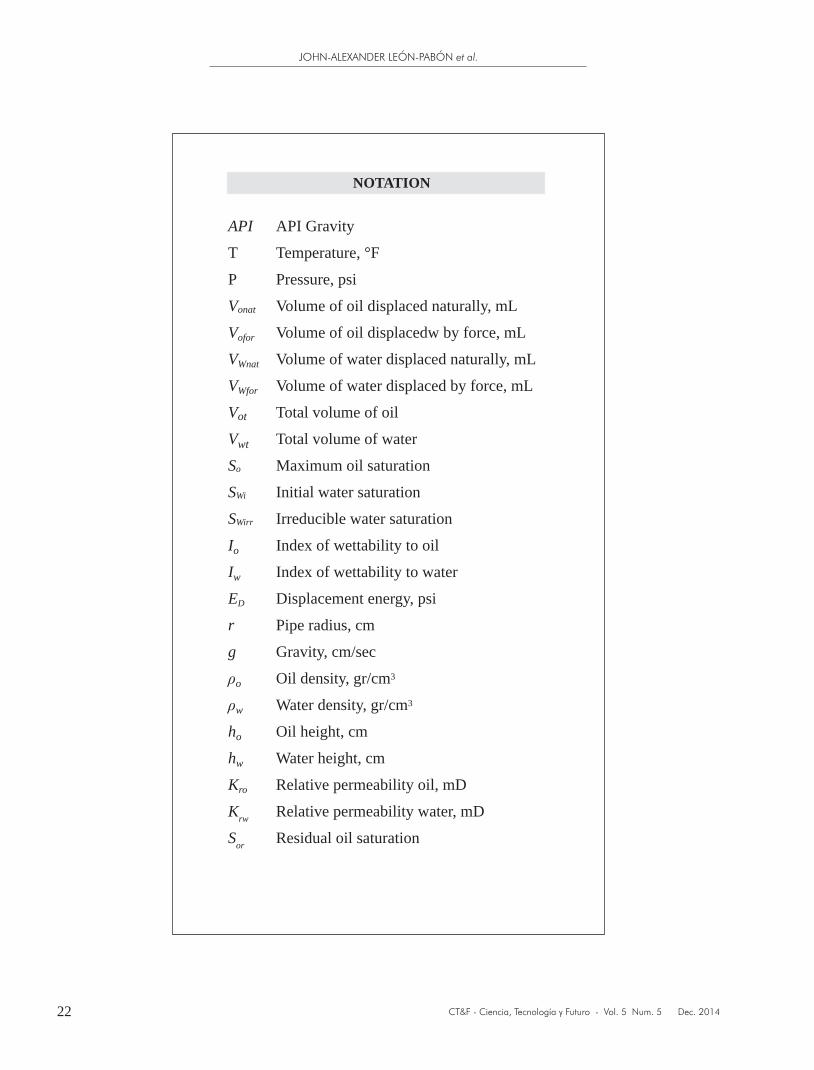
NOTATION
API API Gravity
T Temperature, °F
P Pressure, psi
Vonat Volume of oil displaced naturally, mL
Vofor Volume of oil displacedw by force, mL
VWnat Volume of water displaced naturally, mL
VWfor Volume of water displaced by force, mL
Vot Total volume of oil
Vwt Total volume of water
So Maximum oil saturation
SWi Initial water saturation
SWirr Irreducible water saturation
Io Index of wettability to oil
Iw Index of wettability to water
ED Displacement energy, psi
r Pipe radius, cm
g Gravity, cm/sec
ρo Oil density, gr/cm3
ρw Water density, gr/cm3
ho Oil height, cm
hw Water height, cm
Kro Relative permeability oil, mD
Krw Relative permeability water, mD
Sor Residual oil saturation