journal of management, marketing & logistics · i about the journal journal of management,...
TRANSCRIPT

2148-6670ISSN
PressAcademia publishes journals, books,case studies, conference proceedings andorganizes international conferences.
JMMLJournal of Management,Marketing & Logistics
PressAcademia

__________________________________________________________________________________ i
ABOUT THE JOURNAL Journal of Management, Marketing and Logistics (JMML) is a scientific, academic, peer-reviewed, quarterly and
open-access online journal. The journal publishes four issues a year. The issuing months are March, June,
September and December. The publication languages of the Journal are English and Turkish. JMML aims to
provide a research source for all practitioners, policy makers, professionals and researchers working in the area
of economics, finance, accounting and auditing. The editor in chief of JMML invites all manuscripts that cover
theoretical and/or applied researches on topics related to the interest areas of the Journal.
Editor-in-Chief Prof. Dilek Teker
Editorial Assistant
İnan Tunc
JMML is currently indexed by
EconLit, EBSCO-Host, Ulrich’s Directiroy, ProQuest, Open J-Gate,
International Scientific Indexing (ISI), Directory of Research Journals Indexing (DRJI), International Society for
Research Activity(ISRA), InfoBaseIndex, Scientific Indexing Services (SIS), TUBITAK-DergiPark, International
Institute of Organized Research (I2OR)
Ethics Policy
JMML applies the standards of Committee on Publication Ethics (COPE). JMML is committed to the academic
community ensuring ethics and quality of manuscripts in publications. Plagiarism is strictly forbidden and the
manuscripts found to be plagiarised will not be accepted or if published will be removed from the publication.
Author Guidelines
All manuscripts must use the journal format for submissions.
Visit www.pressacademia.rog/journals/jmml/guidelines for details.
CALL FOR PAPERS The next issue of JMML will be published in September 2019.
Submit manuscripts to
http://www.pressacademia.org/submit-manuscript/
Web: www.pressacademia.org/journals/jmml

__________________________________________________________________________________ ii
EDITORIAL BOARD
Klaus Haberich, Franklin University Chieh-Jen Huang, Providence University
Meltem Kiygi Calli, Okan University Muge Klein, Turkish-German University
Gary S. Lynn, Stevens Institute of Technology Selime Sezgin, Bilgi University
Semih Soran, Ozyigin University Husniye Ors, Gazi University
Mehmet Tanyas, Maltepe University Tugba Orten Tugrul, Izmir University of Economics
Nimet Uray, Kadir Has University Nan-yu Wang, Ta Hwa University of Science and Technolgy Fu-Yun Wang, Ta Hwa University of Science and Technology
Ugur Yozgat, Marmara University
REFEREES FOR THIS ISSUE
Oylum Korkut Altuna, Istanbul University, Turkey Müge Arslan, Marmara University, Turkey
Ezgi Uzel Aydınocak, Beykoz University, Turkey Banu Elmadağ Baş, Istanbul Technical University, Turkey
Emrah Cengiz, Istanbul University, Turkey Pınar Falcıoğlu, Isık University, Turkey
Bahtışen Kavak, Hacettepe University, Turkey Ramazan Nacar, Bursa Technical University, Turkey
John Octavios Palina, Saint Mary's University, Philippines Tabassam Raza, Philippine School of Business Administration, Philippines
Cristina R. Salvosa, Nueva Vizcaya State University, Philippines Erdoğan Taşkın, Beykent University, Turkey

__________________________________________________________________________________ iii
CONTENT
Title and Author/s Page
1. Customer experience quality dimensions in health care: Perspectives of industry experts
Ayse Bengi Ozcelik, Sebnem Burnaz………………………………………………….………..…….…………………………………...………….. 62-72
DOI: 10.17261/Pressacademia.2019.1034 JMML-V.6-ISS.2-2019(1)-p.62-72
2. Marketing channel of pineapple in Isabela, Philippines
Dolores B. Galvez.……………………………………..……………………………..................………………….……………..….…………………… 73-83 DOI: 10.17261/Pressacademia.2019.1035 JMML-V.6-ISS.2-2019(2)-p.73-83
3. Positioning of crowdfunding platforms: Turkey as an emerging market case
Melek Demiray, Sebnem Burnaz ………………….………………………………………………….…………………………………………..………. 84-94 DOI: 10.17261/Pressacademia.2019.1036 JMML-V.6-ISS.2-2019(3)-p.84-94
4. Localization based dynamics in the renewable energy sector
Anıl Şerifsoy, Murat Ferman…………………………………………………………………………………………………………….…………………. 95-102
DOI: 10.17261/Pressacademia.2019.1037 JMML-V.6-ISS.2-2019(4)-p.95-102
5. The effect of cultural dimensions on conspicuous consumption and online compulsive buying behavior : a comparative study among Turkish and American consumers Berk Benli, Murat Ferman……………………………..………………………………………………………………………….………..……..…… 103-127
DOI: 10.17261/Pressacademia.2019.1038 JMML-V.6-ISS.2-2019(5)-p.103-127
Journal of Management, Marketing and Logistics -JMML (2019), Vol.6(2). p.62-72 Ozcelik, Burnaz
_____________________________________________________________________________________________________ DOI: 10.17261/Pressacademia.2019.1034 62
CUSTOMER EXPERIENCE QUALITY DIMENSIONS IN HEALTH CARE: PERSPECTIVES OF INDUSTRY EXPERTS
DOI: 10.17261/Pressacademia.2019.1034
JMML- V.6-ISS.2-2019(1)-p.62-72
Ayse Bengi Ozcelik¹*, Sebnem Burnaz²
¹Istanbul Bilgi University, Istanbul, Turkey
[email protected], ORCID ID: https://orcid.org/0000-0001-8205-603X
*PhD Candidate at Istanbul Technical University
²Istanbul Technical University, Istanbul, Turkey
[email protected], ORCID ID: https://orcid.org/0000-0002-4845-4031
Date Received: May 2, 2019 Date Accepted: June 9, 2019
To cite this document Ozcelik, A. B., Burnaz, S. (2019). Customer experience quality dimensions in health care: perspectives of industry experts. Journal of Management, Marketing and Logistics (JMML), V.6(2), p.62-72, DOI: 10.17261/Pressacademia.2019.1034 Permemant link to this document: http://doi.org/10.17261/Pressacademia.2019.1034. Copyright: Published by PressAcademia and limited licenced re-use rights only.
ABSTRACT Purpose – In an era which patients are acting as consumers, this paper aims to emphasize the importance of patient experience and reveal the
key concepts for patient experience according to industry experts’ perspectives. Seven key concepts are presented as the critical dimensions of
patient experience.
Methodology - A qualitative study is designed and conducted following the phenomenological approach. 15 experts are interviewed about the
patient experience and content analysis is conducted to the answers in texts. Results are grouped under certain concepts which address to key
concepts of patient experience.
Findings- The results show that experts agree on certain critical dimensions for patient experience which are: provider type, function, patient
type, preference, touchpoint diversity, psychology, interaction, and environment.
Conclusion-This study is about the expert approach of patient experience which intersects marketing and health care. The results contribute to
the literature with its novel approach considering industry expert opinions, and also act as a guide for health care managers to improve patient
experience.
Keywords: Patient experience, customer experience, healthcare marketing, hospital experience, experience marketing
JEL Codes: M31, I12, L80
1. INTRODUCTION
For the last 30 years, marketing has been continuously evolving into new perspectives in order to attract the transforming consumers. The focus of exchanging the goods has been turned to exchanging relationships (Bowden et al., 2015; Hunt, 1983) and creating, improving and sustaining the relationships have been accepted as the core marketing activities (Morgan and Hunt, 1994). The transactional perspective of traditional marketing, so called goods-dominant logic, is converted into a relationship-based marketing, so called service dominant (S-D) logic (Vargo and Lusch, 2004; 2008). The S-D logic opened a perspective, which suggests that consumers interactively co-create value within organizations (Brodie et al., 2011). Customers develop relationships with the sellers and this relationship creates the value bilaterally (Harmeling et al., 2017) instead of buying goods and exiting the system unilaterally. Recently, this perspective leads to a new era in the marketing literature with its impact on transforming passive consumers into empowered ones. Empowered consumers are actively connected and informed, and aware of their ability to co-create value for the firms (Prahalad and Ramaswamy, 2004).
Journal of Management, Marketing and Logistics -JMML (2019), Vol.6(2). p.62-72 Ozcelik, Burnaz
_____________________________________________________________________________________________________ DOI: 10.17261/Pressacademia.2019.1034 63
Along these lines, patients have been also transformed and have started to behave like traditional customers, who are rationally evaluating the alternatives before making a purchase decision, since they have the chance to choose between different health service alternatives, especially by searching online and by being informed with the data gathered online (Mazurenko et al., 2016). They evaluate their alternatives of hospitals although switching costs may not be inexpensive for them (Otani et al., 2009). Hence, satisfying and retaining the patients, so treating them as consumers by providing better medical service have been a critical issue for health care organizations (Amin and Nasharuddin, 2013; Alhashem et al., 2011; Arasli et al., 2008), since better experience scores have some positive value co-creative results such as decreased churn rates (Colgate and Hedge, 2001), increased loyalty (Kessler and Mylod, 2011), recommendation (Long, 2012; Otani et al. 2010), and revisit intention (Otani et al., 2010; Swan et al., 1985). The challenge for healthcare organizations in such a competitive environment is to be able to win the hearts of patients by seeing the service from patients’ eyes and focusing on providing high quality service experience and excellent patient satisfaction ratings (Deshwal and Bhuyan, 2018; Otani et al., 2009).
Apart from medical solutions, today’s patient is searching for a memorable experience instead of a competent one (Gilmore and Pine, 2002; Lemke, Clark, and Wilson, 2011). This creates a competitive challenge for organizations in order to keep the patient satisfied and engaged in value co-creation process. Hence, engaging the patient into the co-creation process is possible with providing a satisfying service resulting with a high experience quality. The experience is considered as a holistic process in the co-creation perspective, including a series of all interactions (Klaus and Maklan, 2013) including communication, service, and usage quality (Lemke et al., 2011) which should be taken as a whole instead of distinct elements. This study aims to understand what the critical touch points are to serve higher patient experience quality in a health care organization. Expert interview findings are used to reveal critical points to build a positive and memorable patient experience.
2. LITERATURE REVIEW
Creating high quality experience value is one of the main objectives of service organizations (Maklan and Klaus, 2011; Verhoef et al., 2009). Customer experience quality is conceptualized as the “perceived judgement about the excellence or superiority of the customer experience” (Lemke et al., 2011). There is a significantly positive relationship between customers’ experiences and evaluations of a particular service (Otto and Ritchie, 1995). The experience and the service are two complementary assets of an organization because good customer experience can be achieved by a good customer service (Berry, Shankar, and Parish, 2006). Besides, the customers do not only consider the product and service quality; they evaluate the whole experience quality proposed by the organization, in parallel with the attribution theory (Lemke et al., 2011).
Experience is being formed personally and subjectively in a holistic set of interactions with any contact across certain touchpoints of the organization (Gentile et al., 2007; Lemke et al., 2011; Meyer and Schwager, 2007). Verhoef (2009) states that it can be considered a total set of experiences including the steps of search, purchase, consumption, and after-sale service. However, search is not the very first step of the set. Being exposed to marketing communication activities should be considered as a step-in customer experience. For instance, if it is a hotel service, the trip between the visitor’s house and the hotel is an effective step in the experience (Tribe and Snaith, 1998). Hence, the perceived value is created in any single touchpoint and in their combination. Bitner’s (1990) model of servicescape includes four dimensions: (1) atmospherics, (2) social factors, (3) physical design, and (4) layout and orientation. Although these dimensions seem to be applicable to all consumer behavior contexts (Suess and Mody, 2018), healthcare should have a specific approach because of its complex system which includes thousands of processes (al-Assaf, 1999). Thus, as a system-oriented business, identifying the key components of processes and analyzing them in flowcharts is necessary (Deming, 1986). Early identification of opportunities for improvements in these processes is critical for initiating early interventions.
In this sense, designing and evaluating the patient experience need a process perspective. To illustrate, the experience of a patient may start with an online search of a good physician. After searching for the physician online or offline, the patient finds the hospital and gets an appointment. In the appointment day, he/she reaches the hospital by car or public transportation. Some personal perception is created in the patient’s mind after entering the hospital triggered by the smell, the physical evidence, the crowdedness, the atmosphere in general. The interactions with the employee in the desk, with the employee in the waiting area, and with the physician in the consulting room continue shaping the experience. The service quality delivered in this whole process, the competence of the physician, and the responsiveness of the employees are additional factors to form the experience. Treatment result and the following attitude of the physician can be counted as further steps for the patient experience. In this example, several touchpoints can be determined: webpage, physical atmosphere, employee interaction (staff and physician), patient follow-up. Each touchpoint, whether it is under the control of the company or not, gives some clues about the journey of the customer and helps exploring the experience (Verhoef et al., 2009; Swinyard, 1993). In parallel with this illustration, patient experience is defined as “the sum of all interactions, shaped by an organization’s culture that influence

Journal of Management, Marketing and Logistics -JMML (2019), Vol.6(2). p.62-72 Ozcelik, Burnaz
_____________________________________________________________________________________________________ DOI: 10.17261/Pressacademia.2019.1034 64
patient perceptions across the continuum of care” (The Beryl Institute, 2018). It is critical to determine the relevant touchpoints in that continuum in order to offer a memorable experience to the patient.
John’s (1996) study shows how healthcare setting might include different dimensions leading to a complex structure to manage. He analyzes the physician-patient encounter dramaturgically and finds three different regions: (1) Actor’s (physician’s) region: medical training, physician approach, past experience, (2) Setting and performance – physician and patient front regions: relationship with patient, medical encounter (performance), medical condition, (3) Audience’s (patient’s) back region: cultural values, patient expectations, past experience. It is evident that there is a need to focus on the service experience which has a complicated set of interactions. Since patients are not just patients anymore, and they are the consumers of health services (Levine, 2015), healthcare service experience become more critical to gain the acceptance and engagement of the patient. Hence, a strong healthcare system is a must in order to deliver quality and value to patients (Camgoz-Akdag and Zineldin, 2010) by treating them as consumers. As a first step to build a strong healthcare system, this study gathered the expert opinions about the main patient experience points with an aim of understanding the perspective of the healthcare playmakers about patients. The qualitative study is expected to shed light on the current situation and provide a clear focus about critical touchpoints upon which further quantitative studies may be conducted on improving experience quality levels.
3. METHODOLOGY
Following Mazurenko et al. (2015), who used phenomenological approach suggested by Starks and Trinidad (2007), a qualitative study was designed and conducted to find out the critical dimensions of patient experience. This method deals with analyzing the content about experience collected by observing and interviewing, and clusters the identifications to describe the meaning of a related phenomenon (Starks and Trinidad, 2007).
In order to specify the critical experience points, expert opinions were collected face-to-face. For the interviews, top and mid-level managers or physicians at private hospitals, and academic researchers having expertise on the field were selected for the in-depth interviews. In total, fifteen interviews were conducted. The demographic characteristics of the interviewees are shown in Table 1.
Table 1: Characteristics of the Interviews
Note:
*SSI: Social security institution (SGK) **Guest relations is the same position as patient relations. However, using the term “guest” instead of “patient” is an indicator of the experience approach of the hospital. ***She is the only hospital top manager without a medical background.
Number Position Hospital Scale Hospital Type
1 Assistant Prof. - -
2 Researcher - -
3 Physician Large Private / SSI*
4 Prof. Dr. - -
5 Assistant Strategy Director Large Private
6 Dr / Hospital manager Large Private / SSI
7 Prof Dr - -
8 Dr / Hospital manager Small Private / SSI
9 Patient relations Small Private / SSI
10 Guest relations* Large Private
11 Hospital manager*** Large Private
12 Head physician Large Private
13 Patient relations Large SSI
14 Head physician Large SSI
15 Assoc. Prof. Large SSI

Journal of Management, Marketing and Logistics -JMML (2019), Vol.6(2). p.62-72 Ozcelik, Burnaz
_____________________________________________________________________________________________________ DOI: 10.17261/Pressacademia.2019.1034 65
The semi-structured interviews with hospital employee started with the question of: “Can you name a unit where patients meet your hospital and after the experience in that unit, they select the same hospital for other needs?”. Then, a discussion was conducted about the patient experience or satisfaction measurement methods used in that hospital. The participants were requested to name a unit of the hospital where a research may provide an overall insight in terms of patient experience, in order to discuss the importance of touch point diversity in patient experience. Each interview approximately took one hour. The answers to interview questions were written in text format and a content analysis was conducted through the text. The three-step analysis process was adopted as it is shown in Figure 1. First, themes cited in highest frequency (e.g. state insurance contract, customer type, location etc.) were listed. Second, the themes were classified in terms of some pre-defined concepts (e.g. function, interaction, environment, etc.). Finally, the concepts were grouped under more specified categories based on the extent to which they comprise the subconcepts. This three-step categorization allowed to figure out the most critical points for better patient experience from the management perspective.
Figure 1: Process of Analyzing the Expert Interview Results
4. FINDINGS
After analyzing the interviews with health care experts, the critical concepts for patient experience were acquired. Mainly; the type and function of the private hospital, type of the patient based on the reason why he/she is in the hospital, preference of the patient, touchpoint diversity in the organization, patient psychology, interaction with physicians and staff, and hospital environment are found as the key concepts to evaluate the experience in a hospital. Designing a better patient experience hinges upon those key concepts in a private health care organization.
4.1. Key Concepts of Patient Experience
The key concepts are the themes which become prominent in the interviews. The interviewees mainly talk about the effective factors for better patient experience, and their words are organized as a list of themes with a list of themes. After the list of the themes are written down, they are considered as subconcepts and grouped under broader concepts. Subconcepts, concepts, and their definitions are listed in Table 2.
Table 2: Key Concepts of Patient Experience
Step 1:
Highly mentioned themes are listed as subconcepts
Step 2:
The subconcepts are categorized in more general
subconcepts
Step 3:
The concepts are categorized under specified
concepts
Subconcepts Concepts Concept definitions
1. State insurance contract Provider type Defines the type of the private hospital
2. Treatment Function
Defines the main objective of establishment of the healthcare provider
3. Area of specialization
4. The ability of providing rapid and accurate solution
5. Treatment type Patient type Defines the one who evaluates the experience
6. Customer type
7. Preference of a physician Preference
Defines the behavior whether the patient chooses a specific unit/doctor or randomly enters the hospital 8. Variety of the process
9. Process management Touchpoint diversity Defines how many different points that a patient touches through the journey
10. Supporting the patient psychologically Psychology Defines a patient's feeling of safety
11. Personnel directions
12. Physician communication Interaction
Defines the main information gathering and information giving activities between the patient and the personnel 13. Staff communication
Journal of Management, Marketing and Logistics -JMML (2019), Vol.6(2). p.62-72 Ozcelik, Burnaz
_____________________________________________________________________________________________________ DOI: 10.17261/Pressacademia.2019.1034 66
Hospital type
Hospital type is the class of the health care provider in terms of territorial legal practice. In Turkey, Ministry of Health, Social Insurance Institution (SSI-SGK), and Private Sector provide healthcare services (Camgoz-Akdag and Zineldin, 2010), and the hospitals are grouped under two classes: state or private hospitals. This system creates a segment difference between patients as customers. Since the scope of this research is limited to only private hospitals, these hospitals were included in the sample of the interviews. However, private hospitals are separated into two groups: the hospitals that do or do not accept the state insurance. The customers of these two groups seem to have different characteristics. For instance, a hospital manager indicates that they have lost a group of patients after they signed a contract with Social Insurance Organization to accept state insurance in their hospital:
“Some people, especially the premium segment customers, do not want to enter an organization by walking under a signboard indicating the state insurance contract. They do not feel like they belong there.”.
Although the state insurance allows lower-income patients to be treated in private hospitals, which offers a social opportunity, some premium patients feel like the hospital is not special enough to be treated in.
Function
Function defines the main objectives of the healthcare provider. This concept has different dimensions:
(1) Treatment: Some healthcare organizations provide only check-up, blood tests, or dialysis. Some others provide a general package of treatment in various areas. Hence, the experience differentiates in different types of hospitals. An academician among the interviewees indicates that talking to check-up patients may not provide an idea about the hospital experience, because the main objective of a hospital is not a check-up test:
“The function of a hospital is not diagnosis, it is treatment. Check-up patients do not see any treatment process, so they cannot have a whole experience quality perception”.
(2) Area of specialization: There are some hospitals which are specialized in Oncology, or Cardiology, etc. The area of specialization could be critical in choosing the hospital. For instance, a manager of an Oncology-focused hospital says that their patients first visit the hospital about oncological reasons, while a Cardiology-focused hospital manager answers about cardiological reasons. Thus, the results indicate that some hospitals have an area of specialization and the experience of the patients are formed mainly under this perception of specialization.
(3) The ability of providing rapid and accurate solution: This theme is the other main objective of a hospital. It is in parallel with one of dimensions in healthcare developed by Zineldin (2006) as quality of processes. This dimension includes the functional quality about the healthcare provider’s core services. One of the managers reports:
“Addition to treatment, the ability of providing the accurate treatment solution rapidly is critical for a hospital to serve a good experience. The solution must exactly finish the problem and must have to be found as soon as possible. The patient does not want to wait or lose time with weak treatment types.”
Patient type
Patient type can be grouped under two different classifications: (1) treatment type, and (2) customer type. Treatment type is related with the field in which the patient is treated. This means that departments are organized based on the medical needs of patients. However, apart from medical needs, some psychological needs may be differentiated for different departments. Thus, the patients consider various points while evaluating the experience. To illustrate, Pediatrics and Rheumatology include different dynamics. In Pediatrics, the patient is the child. But, the anxiety level of the mother, who is the actual consumer, may be high. On the other hand, Rheumatology is generally the second visiting point after a general inspection. Here, the anxiety level may increase because of some disease that cannot be found in the first round. Different from all, emergency service has its own anxiety level because of the need for rapidity. Hence, the needs of patients in different departments has its own frame, which makes patients diversified.
On the other hand, patients are grouped as their customer types: inpatients and outpatients. Since outpatients do not stay at the hospital, their experience is different than inpatients. Health organizations consider these two types separately in terms of experience. Another grouping may be made as patients and their relatives. However, it is seen that patients’ relatives are never

Journal of Management, Marketing and Logistics -JMML (2019), Vol.6(2). p.62-72 Ozcelik, Burnaz
_____________________________________________________________________________________________________ DOI: 10.17261/Pressacademia.2019.1034 67
considered as separate actors in the healthcare system based on the interview findings. The relatives and the patients are making the decisions together, so they may constitute a single decision-making unit.
Preference
Patients sometimes prefer some specific physicians and choose the hospitals just for that physician. For instance, gynecology is a sensitive area for women, and they do not randomly select their gynecologist.
“A woman can visit other hospital units instantly when she visits her gynecologist, but she does not visit gynecology instantly when she is in hospital for some other unit”
says a physician. Additionally, patients visit the well-known physicians no matter in which hospital they work. If the physician changes the hospital where he/she works, the patient also changes the hospital. Thus, experience perception of a patient may differ with his/her preference. Furthermore, patients may have a negative perception about the hospital, but they may still go to that hospital only for the physician. One of the interviewees who is also an oncology patient tells her story:
“I never choose that hospital because I know that they are not good at their work. However, I went there for my chemotherapy, only for the physician. He was the assistant of my surgeon, so his suggestion is important.”
Hence, physician preference becomes critical for the experience. If there is a special preference, they mention the physician especially when talking about the hospital experience.
Touchpoint diversity
Health organizations have various touchpoints and this makes the health care system complex. Since the experience inside the organization is considered in this paper, the touchpoints start from the reception and end with payment desk. Between these two touchpoints, there are many different points such as departmental reception, inspection, waiting areas, other patients, etc. An example shows that, in some cases, the patients are even affected by the parking areas of the hospitals:
“A woman and her husband came into the hospital. It was obvious that a problem in the parking lot came out. The husband said: ‘Is this the hospital you praised a lot?’”
It is obvious that the parking problem is attributed to the hospital. On the other hand, as it is mentioned above, the patient’s relative affects the decisions made by the patient. Additionally, process management is a critical dimension for patient experience. A head physician says:
“Hospitals design the process from the entrance to the exit. However, the process should not be broken if the patient enters from the side door. Employees should have the practical intelligence to create solutions for such instant situations.”
Mood/Feelings/Psychology
Patient mood dimensions are highly mentioned in interviews. The staff is the most effective factor on patient’s mood. One of the managers reports,
“The patient expects to be supported emotionally when he/she enters the hospital. He/she is full of questions. The critical thing is metaphorically keeping holding the hand of the patient from the beginning till the end.”
In order to improve patient experience, the patients should be welcomed positively and sent with a helping hand. This helping hand can only be provided by the personnel. Since the patient expects special attention to him/herself, the medical and administrative personnel play a vital role in patient’s feelings. When a patient enters the hospital, the personnel directs him/her to the relevant unit. These directions are critical for the patient’s journey in the organization. As a physician indicates,
“The satisfaction may come from the administrative staff. Patients have a general idea about the organizations by evaluating even only the staff”.
Thus, the interaction with the patient becomes critical for experience quality.
Interaction
Service consumption includes a set of interactions between the customer and the provider. Expert interviews show that the communication between the patient and the employee is the most critical interaction in the healthcare consumption process. The employees, so-called the medical staff, have a great impact on healthcare. The medical staff can be physician, nurse, or
Journal of Management, Marketing and Logistics -JMML (2019), Vol.6(2). p.62-72 Ozcelik, Burnaz
_____________________________________________________________________________________________________ DOI: 10.17261/Pressacademia.2019.1034 68
administrative personnel as caregivers, and they have distinct interaction points. All those interactions are mentioned as the effective experience points in the interviews. Although the physician interaction may be thought as the most critical one, nurse is as important as the physician is.
“All of the operational support such as diaper changing is made by the nurse and administrative personnel. Since a physician does not and actually cannot do that, managers should concentrate on hiring talented staff.”
says one of the physicians in the interviews. Remembering a patient during his/her second visit and asking him/her how he/she is, creates positive outcomes as several interviewees say.
Environment
Environment includes the location, proximity, physical design, and other patients. Location and transportation are two of the elements about the hospital facility. One of the managers tells that they lost some of their patients after they moved to a location that is close to a more prestigious area and far from major transportation lines. Similarly, another manager says that since their hospital is in a high prestige area, their patients are more sensitive to experience quality issues. In addition, the inclusion of insurance contract can lead to different perceptions among the patient groups. If a healthcare organization has a state insurance contract, that organization directly holds a different patient segment. The remarkable note by a manager about the insurance, mentioned in provider type, can be also considered as an environmental theme. The effect of “other patients” comes out when the state insurance contract is applied. Since the presence of state insurance indicates the hospital type, the patients coming to the facility can be important for other patients in terms of the created atmosphere.
5. CONCLUSION
Considering patients as empowered consumers in today’s marketing world, this study reveals eight points critical for patient experience by interviewing fifteen different industry experts including physicians, managers, and academicians. The results do not include any clue about the medical outcomes but reveal that healthcare experts accept patients as decision-makers who have a voice in the market. Provider type, function, patient type, preference, touchpoint diversity, psychology, interaction, and environment are extracted as the key critical points of patient experience. A patient or patient relative in various psychological states considers the type and function of the provider, the interaction between the employee and the environment of that provider and the previous information heard before the visit while evaluating the experience. Among these dimensions extracted, provider type, function and touchpoint diversity are the ones, which are not flexible in terms of organizational structure. These are the institutional characteristics of the healthcare organization. However, interaction, preference, psychology, and environment can be adjusted considering the patient type. In particular, it is found that by constituting a proper interaction schema, organizations can have a preferred profile with the help of a well-designed environment, which makes patients feel better. Yet, the most critical point is found as the interpersonal interaction between the patient and the employee and the discussion therefore should focus on the interaction dimension.
Previous literature revealed various dimensions for patient experience. Cleanliness, quality, and accessibility are found as effective layers for designing a better service environment for patients (Suess and Mody, 2018). Additionally, patient experience is examined under five factors: environmental, emotional, behavioral, comfort, and social experience (Deshwall and Bhuyan, 2018). In other studies, six major experience episodes are stated shaping the overall patient experience, namely admission process, nursing care, physician care, staff care, food, and room (Otani, 2009; 2010; 2012). Trust, general communication, first-contact accessibility, whole-person care, and respectfulness are also identified as patient experience dimensions in primary care service (Brauer et al., 2018). Majority of the previous research have focused on selected specific departments of a hospital and revealed human-related factors for a better patient experience. This study offers a novel framework comprising a general approach to hospital instead of being branch-specific, through the analysis of experts’ opinions. Experience quality in healthcare services includes functional and technical sides of the services (Brady et al., 2006; Gronroos, 1984). Technical sides include the medical treatment points (Mazurenko et al., 2015) such as, existence of post-operative complications (Danforth et al., 2014), achievement of the surgery or treatment goals (Biggs, et al., 2015), patient-nurse ratios (Jha et al., 2008), or the type of medical intervention (Marks et al., 2015). Functional sides include the operations excluding medical services, such as process management, operational excellence, managerial decisions. In previous studies, clinicians’ perspective suggests that functional skills are critical for patient experience while patients’ perspective focuses on interpersonal skills (Kim et al., 2004; Safran et al., 2003). However, this study presents that experts including physicians are now aware of the importance of interpersonal skills. The most critical point of patient experience is found as the interaction. Since the interaction with physicians and also nurses have an impact on overall satisfaction of a hospital (Vinagre and Neves, 2008), the experience focus of the health care organization should be the communicational skills of the employees in all levels.
Journal of Management, Marketing and Logistics -JMML (2019), Vol.6(2). p.62-72 Ozcelik, Burnaz
_____________________________________________________________________________________________________ DOI: 10.17261/Pressacademia.2019.1034 69
In healthcare services, patients have some anxiety or stress because of the lack of knowledge or control about medical treatment (Klaus 2018; Berry et al., 2015). Since hospital experience is held under stress (Hultman et al., 2012; Tanja-Dijkstra, 2011), an environment which reduces the stress level should be provided (Andrade and Devlin, 2015). Ulrich’s theory of supportive design (Ulrich, 1991) suggests that a physical environment supports the patients’ well-being with its positive nature. According to the theory, environment with positive conditions and resources such as social interactions, sense of control over the environment, and positive distraction may be used to reduce the stress level (Andrade and Devlin, 2015; Ulrich, 1991). According to distraction theory (Shirey and Reynolds, 1988), positive distractions such as photographs, newspapers, etc. or smiling and talking people around the waiting room can help patients forget about their anxiety (Andrade and Delvin, 2015; Berman et al., 2008) However, physical environment is just one layer of the service design (Andrade and Devlin, 2015). Social elements of the service environment should also have a supportive characteristic in order to foster the patient’s well-being (Andrade and Devlin, 2015; Ulrich, 1991). in addition to the physical service environment, the interaction with physicians, nurses and administrative staff has a critical effect on experience quality perception (Gill and White, 2009). Patients even prefer only one provider for all health issues if they are familiar with the provider, thus avoid the need for building an effective communication (Needham, 2012; Lathrop, 1993). Positive interaction increases the patients’ confidence on medical advices (Sandoval et al., 2006). However, the satisfying interaction requires engaged employees who are aware of their contribution to the experience perception of patients and continuously work for delivering excellent service. Perpetual controls and disciplinary checks should be used as effective tools for internal marketing in order to have engaged employees (Fortenberry and McGoldrick, 2016). Although it is rather difficult to create such a culture, not only managerial staff but also the frontline employees have to care about patient experience feedback in order to foster creating the patient experience centered environment (Graham et al., 2015). Patients are consciously or unconsciously affected by the process they experience in the hospital. Although Shostack (1982) warns that leaving services to individual talent will lead an ineffective flow, in this study, individual talent is expected to be able to rule the whole system. The leaders should leverage their teams in terms of better interaction with the patients by taking the actions which provides the continuum of care at all touch points (Wolf, 2016).
A patient-centered approach, which suggests the increased interaction quality with patients and their families, will lead higher positive outcomes (Anderson et al., 2018), and can be effective for patient satisfaction in a nervous and stressful environment (Hutton and Richardson, 1995) by overcoming patient’s negative feelings (Suess and Mody, 2018). Thus, interaction can be considered as an umbrella dimension for patient experience for affecting on having a better environment, accordingly on moods of the patients in all types positively. Further studies may additionally analyze patients’ opinions and may compare and contrast the results from two perspectives. Besides, some quantitative studies may clarify the effects of experience quality on behavioral and attitudinal outcomes of patients.

Journal of Management, Marketing and Logistics -JMML (2019), Vol.6(2). p.62-72 Ozcelik, Burnaz
_____________________________________________________________________________________________________ DOI: 10.17261/Pressacademia.2019.1034 70
REFERENCES
Al-Assaf, A. F. (1999). Introducing Quality in Healthcare: An International Perspective. Journal for Healthcare Quality, 21(1), 4-15.
Alhashem, A.M., Alquraini, H. and Chowdhury, R.I. (2011). Factors influencing patient satisfaction in primary healthcare clinics in Kuwait. International Journal of Health Care Quality Assurance, 24(3), 249‐262.
Amin, M. and Nasharuddin, S. Z. (2013) Hospital service quality and its effects on patient satisfaction and behavioural intention. Clinical Governance: An International Journal, 18(3), 238-254
Anderson, S., Nasr, L. and Rayburn, S. W. (2018). Transformative service research and service design: synergistic effects in healthcare. The Service Industries Journal, 38(1-2), 99-113.
Andrade, C. C. and Devlin, A. S. (2015). Stress reduction in the hospital room: Applying Ulrich's theory of supportive design. Journal of Environmental Psychology, 41, 125-134.
Arasli, H., Ekiz, E.H. and Katircioglu, S.T. (2008). Gearing service quality into public and private hospitals in small islands. International Journal of Health Care Quality Assurance, 21(1), 8‐23.
Berry, L. L., Davis, S. W., and Wilmet, J. (2015). When the customer is stressed. Harvard Business Review, 93, 86–94.
Berman, M. G., Jonides, J. and Kaplan, S. (2008). The cognitive benefits of interacting with nature. Psychological Science, 19,1207-1212. http://dx.doi.org/10.1111/ j.1467-9280.2008.02225.x
Biggs, T., Fraser, L., Ward, M., Sunkaraneni, V., Harries, R, and Salib, R. (2015). Patient reported outcome measures in septorhinoplasty surgery. Annals of The Royal College of Surgeons of England, 57(1), 63-65.
Bitner, M. J. (1990). Evaluating Service Encounters: The Effects of Physical Surroundings and Employee Responses. Journalof Marketing, 54(2), 69-82.
Bowden, J. L. H., Gabbott, M., and Naumann, K. (2015). Service relationships and the customer disengagement-engagement conundrum. Journal of Marketing Management, 31(7–8), 774–806.
Brady, M. K., Voorhees, C., Cronin, J. J. and Bourdeau, B. L. (2006). The good guys don't always win: The effect of valence on service perceptions and consequences. Journal of Services Marketing, 20(2), 83-91.
Brauer, P. Royall, D., Kaethler, A., Mayhew, A. and Israeloff-Smith, M. (2018). Development of a patient experience
questionnaire to improve lifestyle services in primary care. Primary Health Care Research and Development, 19(6),
542-552.
Brodie, R. J., Hollebeek, L. D., Juric, B., and Ilic, A. (2011). Customer engagement: Conceptual domain, fundamental propositions, and implications for research. Journal of Service Research, 14(3), 252–271.doi:10.1177/1094670511411703
Camgoz-Akdag, H. and Zineldin, M. (2010). Quality of Health Care and Patient Satisfaction: An exploratory investigation of the 5Qs model at Turkey, Clinical Governance: An International Journal, Emerald Publications, 15(2), 2010.
Colgate, M. and Hedge, R. (2001). An investigation into the switching process in retail banking services. InternationalJournal of Bank Marketing, 19(5), 201-212
Danforth, R. M., Pitt, H. A., Flanagan, M. E., Brewster, B. D„ Brand, E. W., and Frankel, R. M. (2014). Surgical inpatient satisfaction: What are the real drivers? Surgery, 156(2), 328-335.
Deming, W.E. (1986). Out of the crisis, Cambridge, MA: MIT Press.
Deshwal, P. and Bhuyan, P. (2018). Cancer patient service experience and satisfaction. International Journal of Healthcare Management, 11(2), 88-95.
Fortenberry, J. L. and McGoldrick, P. J. (2015). Internal marketing: A pathway for healthcare facilities to improve the patient experience. International Journal of Healthcare Management, 9(1), 28-33.
Gentile, C., Spiller, N., and Noci, G. (2007). How to sustain the customer experience: an overview of experience components that co-create value with the customer. European Management Journal, 25, 395–410.
Gill, L. and White, L. (2009). A critical review of patient satisfaction. Leadership in Health Services, 22 (1), 8-19
Gilmore, J. H. and Pine, B. J. (2002). Differentiating Hospitality Operations via Experiences: Why Selling Services is Not Enough. Cornell Hotel and Restaurant Administration Quarterly, 43(3), 87-96.
Journal of Management, Marketing and Logistics -JMML (2019), Vol.6(2). p.62-72 Ozcelik, Burnaz
_____________________________________________________________________________________________________ DOI: 10.17261/Pressacademia.2019.1034 71
Graham, C., Flott, K., King, J., Gibbons, E., Jenkinson, C., Fitzpatrick, R. (2015). Strategies and challenges for monitoring patient experience at the local level. International Journal of Healthcare Management, 8(1), 1-3
Grönroos, C. (2004). The relationship marketing process: Communication, interaction, dialog, value. Journal of Business andIndustrial Marketing, 19(2), 99–113.
Harmeling, C. M., Moffett, J. W., Arnold, M. J., and Carlson, B. D. (2017). Toward a theory of customer engagement marketing. Journal of the Academy of Marketing Science, 45(3), 312–335.
Hultman, T., Coakley, A. B., Annese, C. D. and Bouvier, S. (2012). Exploring the Sleep Experience of Hospitalized Adult Patients. Creative Nursing, 18(3), 135-139
Hunt, M. H. (1983). The making of a special relationship: The United States and China to 1914. New York, NY: Columbia University Press.
Hutton, J. D. and Richardson, L. D. (1995). Healthscapes: The role of the facility and physical environment on consumer attitudes, satisfaction, quality assessments, and behaviors. Health Care Management Review, 20(2), 48-61.
Jha, A., Orav, E., Zheng, J., and Epstein, A. (2008). Patients' perception of hospital care in the United States. The New England Journal of Medicine, 359(18), 1921-1931.
John, J. (1996). A dramaturgical view of the health care service encounter: Cultural value-based impression management guidelines for medical professional behavior. European Journal of Marketing, 30(9), 60-74.
Kessler, D. P. and Mylod, D. (2011). Does patient satisfaction affect patient loyalty? International Journal of Health Care Quality Assurance, 24(4), pp.266-273
Kim, S. S., Kaplowitz, S., and Johnston, M. V. (2004). The effects of physician empathy on patient satisfaction and compliance. Evaluation and the Health Professions, 27(3), 237-251.
Klaus, P. (2018) Luxury patient experience (LPX): review, conceptualization, and future research directions. The Service Industries Journal, 38(1-2), 87-98.
Klaus, P. and Maklan, S. (2013). Towards A Better Measure of Customer Experience. International. Journal of Market Research, 55(2), 227-246.
Lathrop, P. J. 1993. Restructuring Health Gare: The Patient Focused Paradigm. San Francisco: Jossey-Bass.
Lemke, F., Clark, M. and Wilson, H. (2011). Customer experience quality: an exploration in business and consumer contexts using repertory grid technique. Journal of the Academy of Marketing Science, 39, 846-869.
Levine, S. (2015). We Are All Patients, We Are All Consumers. NEJM Catalyst. Retrieved from: https://catalyst.nejm.org/we-are-all-patients-we-are-all-consumers/
Long, L. (2012). Impressing patients with improving HCAHPS. Nursing Management, 43(12), 32-37
Maklan, S. and Klaus. P. (2011). Customer Experience Are We Measuring the Right Things? International Journal of Market Research, 53(6), 771-792.
Marks, M., Audige, L„ Reissner, L„ Herren, D. B., Schindele, S„ and Vlieland, T. P. V. (2015). Determinants of patient satisfaction after surgery or corticosteroid injection for trapeziometacarpal osteoarthritis: Results of a prospective cohort study. Archives of Orthopaedic and Trauma Surgery, 135(1), 141-147.
Mazurenko, O., Zemke, D. M., Lefforge, N., Shoemaker, S. and Menachemi N. (2015). What Determines the Surgical Patient Experience? Exploring the Patient, Clinical Staff, and Administration Perspectives. Journal of Healthcare Management, 60(5), 332-346.
Mazurenko, O., Zemke, D. M., and Lefforge, N. (2016). Who Is a Hospital's "Customer"? Journal of Healthcare Management,61(5), 319-333.
Meyer, C. and Schwager, A. (2007). Understanding Customer Experience. Harvard Business Review, 85(2), 116-126.
Morgan, R. M., and Hunt, S. D. (1994). The commitment-trust theory of relationship marketing. Journal of Marketing, 58(3),20–38. doi:10.2307/1252308.
Needham, B. R. (2012). The Truth About Patient Experience: What We Can Learn from Other Industries, and How Three Ps Can Improve Health Outcomes, Strengthen Brands, and Delight Customers. Journal of Healthcare Management,57(4), 255-263.
Otani, K., Waterman, B., Faulkner, K. M., Boslaugh, S. and Dunagan, W. C. (2009). Patient Satisfaction: Focusing on "Excellent". Journal of Healthcare Management, 54(2), 93-103.
Otani, K., Waterman, B., Faulkner, K. M., Boslaugh, S. and Dunagan, W. C. (2010). How Patient Reactions to Hospital Care Attributes Affect the Evaluation of Overall Quality of Care, Willingness to Recommend, and Willingness to Return. Journal of Healthcare Management, 55(1), 25-37.
Journal of Management, Marketing and Logistics -JMML (2019), Vol.6(2). p.62-72 Ozcelik, Burnaz
_____________________________________________________________________________________________________ DOI: 10.17261/Pressacademia.2019.1034 72
Otani, K. Waterman, B. Claiborne, W. (2012). Patient Satisfaction: How Patient Health Conditions Influence Their Satisfaction. Journal of Healthcare Management, 57(4), 276-292.
Otto, E.J. and Ritchie, B. J. (1996). The service experience in tourism. Tourism Management, 17(3), 165–74.
Prahalad, C., and Ramaswamy, V. (2004). Co-Creating Unique Value with Customers. Strategy and Leadership, 32(3), 4-9.
Safran, D. G., Montgomery, J. E., Chang, H., Murphy,J., and Rogers, W. H. (2003). Switching doctors: Predictors of voluntary disenrollment in Medicare managed care. Health Care Finance Review, 25(2), 55-66.
Sandoval, G. A., Brown, A. D., Sullivan, T. and Green, E. (2006). Factors that influence cancer patients' overall perceptions of the quality of care. International Journal for Quality in Health Care, 18(4), 266-274.
Shirey, L. L. and Reynolds, R. E. (1988). Effect of Interest on Attention and Learning. Journal of Educational Psychology,80(2), 159-166.
Shostack, L. (1982). How to Design a Service. European Journal of Marketing, 16(1), 49-63.
Suess, C. and Mody, M. (2018). Hospitality healthscapes: A conjoint analysis approach to understanding patient responses to hotel-like hospital rooms. International Journal of Hospitality Management, 61, 59-72.
Starks, H., and Trinidad, S. B. (2007). Choose your method: A comparison of phenomenology, discourse analysis, and grounded theory. Qualitative Health Research, 17(10), 1372-1380.
Swan, J. E., Sawyer, J. C., van Matre, J. G. and Gee, G. W. (1985). Deepening the understanding of hospital patient satisfaction: Fulfillment and equity effects. Journal of Health Care Marketing, 5(3), 7-18
Swinyard, W. R. (1993). The effects of mood, involvement, and quality of store experience on shopping intentions. Journal of Consumer Research, 20, 271–280.
Tanja-Dijkstra, K. (2011). The impact of bedside technology on patients' well-being. Health Environments Research andDesign Journal, 5(1), 43-51.
The Beryl Institute. (n.d). Defining patient experience. Retrieved from www.theberylinstitute.org/?page=DefiningPatientExp
Tribe, J. and Snaith, T. (1998). From SERVQUAL to HOLSAT: Holiday Satisfaction in Varadero, Cuba. Tourism Management,19(1), 25-34.
Ulrich, R. S. (1991). Effects of interior design on wellness: Theory and recent scientific research. Journal of Health Care Interior Design, 3, 97-109.
Vargo, S. L., and Lusch, R. F. (2004). Evolving to a new dominant logic for marketing. Journal of Marketing, 68, 1–17.doi:10.1509/jmkg.68.1.1.24036
Vargo, S. L., and Lusch, R. F. (2008). Service-dominant logic: Continuing the evolution. Journal of the Academy of MarketingScience, 36(1), 1–10. doi:10.1007/s11747-007- 0069-6
Verhoef, P., Lemon, K. N., Parasuraman, A., Roggeveen, A., Tsiros, M., and Schlesinger, L. A. (2009). Customer experience creation: determinants, dynamics and management strategies. Journal of Retailing, 85, 31–41.
Vinagre, M. H. and Neves, J. (2008). The influence of service quality and patients' emotions on satisfaction. International Journal of Health Care Quality Assurance, 21(1), 87-103,
Wolf, J. A. (2016). Critical Considerations for the Future of Patient Experience. Journal of Healthcare Management, 62(1), 9-12.
Zineldin, M. (2006). The quality of health care and patient satisfaction: An exploratory investigation of the 5Qs model at some Egyptian and Jordanian medical clinics. International Journal of Health Care Quality Assurance, 19(1), 60-92.
Journal of Management, Marketing and Logistics -JMML (2019), Vol.6(2). p.73- 83 Galvez
_____________________________________________________________________________________________________ DOI: 10.17261/Pressacademia.2019.1035 73
MARKETING CHANNEL OF PINEAPPLE IN ISABELA, PHILIPPINES
DOI: 10.17261/Pressacademia.2019.1035
JMML- V.6-ISS.2-2019(2)-p.73-83
Dolores B. Galvez Nueva Vizcaya State University, College of Business Education, Business Administration Department, Philippines.
[email protected], ORCID 0000-0002-1872-5486
Date Received: April 22, 2019 Date Accepted: June 15, 2019
Galvez, D. B. (2019). Marketing channel of pineapple in Isabela, Philippines. Journal of Management, Marketing and Logistics (JMML), V.6(2), p.73-83, DOI: 10.17261/Pressacademia.2019.1035 Permemant link to this document: http://doi.org/10.17261/Pressacademia.2019.1035 Copyright: Published by PressAcademia and limited licenced re-use rights only.
ABSTRACT Purpose - The study determined the key production area, farming practices, average production volume, marketing channels, and marketing practices of pineapple farmers in Isabela, Philippines. Methodology- Primary and secondary data were used. Through multistage sampling, eighty -four pineapple farmers were chosen to be the respondents as they answered closed and open- ended questions. Findings- Municipalities with pineapple farms are Echague, San Guillermo, Sto. Tomas, Jones, and Angadanan. Pineapple farmers fertilized their farm and covered the fruit with hay to protect it from the sun. Their average production volume was about 23,588 pieces per cropping. The four intermediaries in the channel were canvassers, traders, processors, and retailers. Their marketing practices involved their reasons for choosing the type of buyers, basis in determining the quality of fruit, reasons for product rejection, price monitoring, and negotiation. Conclusion- Most farmers did not have the capacity of marketing their produce. They just waited for their buyers to come in their area.
Keywords: Farmers, Farm activities, Marketing channel, Marketing practices, Pineapple JEL Codes: M19, M30, M39
1. INTRODUCTION
Philip Kotler defined marketing as the science and art of exploring, creating, and delivering value different from competitor to satisfy the needs of the target market at a profit. Marketing is everywhere: in the academe, hospital, agriculture, bank, food, any type of industry you name it, marketing is important. Marketing is composed of 4P’s, the marketing mix, namely product, price, promotion, and place. Products refer to the goods or services. Price refers to the amount purchased by the seller in exchange of the goods or service. Promotion is creating a strategy so that customers would be aware of the product. Lastly, place is the distribution of goods or services. Promotion and place, (distribution or marketing channels) are the focused of this study. The product is useless if the people are not aware of it. Even though people would be aware of the products, but if they would not be available in their area, it would be useless. Thus, promotion and place (distribution or marketing channels) are also important in every industry. There is a great demand on food. Food is the basic necessity of every person, moreover, food business is also the source of income of many Filipinos. If there was demand, there should be enough supply, but how would one satisfy the demand? How would one bring the product to the consumers? In order to reach the goods to the ultimate consumers, marketing channel should be included in the scenario. According to Blunt (2019), the types of marketing channels are manufacturer direct to customer, manufacturer to retailer to customer, manufacturer to wholesaler to customer, and manufacturer to agent to wholesaler to retailer to customer. However, in the case of agricultural industry specifically in farming, the manufacturers are the farmers. Farmers who plant fruits or vegetables then used different marketing channels for them to sell their produce.

Journal of Management, Marketing and Logistics -JMML (2019), Vol.6(2). p.73- 83 Galvez
_____________________________________________________________________________________________________ DOI: 10.17261/Pressacademia.2019.1035 74
The more intermediaries in the distribution system, the higher the selling price, thus, consumers are the most affected in the marketing chain. Agarwal (nd) mentioned four levels in distribution. In zero level channel, there is no intermediary involved. The producer directly sells products to consumers. One level channel involves one intermediary who is the retailer. Thus, the manufacturer sells products to retailers. Two level channel obviously involves two intermediaries who are wholesaler and retailer. In this event, the wholesaler purchases the products from the manufacturer and sells them to retailers. In three level channel, the other intermediary is the jobber. To complete the chain, the manufacturer sells products to wholesaler, then the jobber will purchase the products from the wholesaler and sells them to the retailer. Retailers are the last intermediary before the consumer, thus, they are the most powerful in the chain.
Marketing channel’s choice is based on farmers’ decision. The four factors affecting their choice are price, quantity and quality of product, distance between farm and selling, and service rendered by buyers (Apandi, et al, 2017). The Philippines is a tropical country and rich in agricultural lands, thus, one of the livelihood of Filipinos is farming. Based on the data of PSA 2010-2014 the major crops in the country are palay, corn, coconut, sugarcane, banana, pineapple, coffee, mango, tobacco, abaca, peanut, mongo, cassava, sweet potato, tomato, garlic, onion, cabbage, eggplant, calamansi and rubber. However, palay and corn represent 60 percent of the total crop production. When it comes to fruit export, banana, pineapple, mango, papaya, and calamondin are the champions (Rodeo, 2016). Pineapple is a tropical fruit which belongs to bromeliad family and one of the few bromeliads to produce edible fruit (Szalay, 2018). The fruit’s scientific name is Ananas Comosus and it is divided into four categories: Smooth Cayenne, Queen, Abacaxi, and Red Spanish. Rodeo (2016) mentioned that Smooth Cayenne and Queen or Formosa are the two major cultivars of pineapple for fresh consumption and processing in the country. Based on the study of Joy (2010) the fruit contains calcium, potassium, fiber, and vitamin C. Moreover, it is considered a digestive aid and a natural anti-inflammatory fruit. Pineapple is also used for tenderizing meat since it is rich in bromelain. The fruit is also rich in fiber that is why people suffering from constipation and irregular bowel movement may eat pineapple.
Costa Rica is the leading producer of pineapple in the world with annual production of 26853.12 thousand metric tons per year. Its tropical climate is suitable for the heavy growth of the fruit. Next to Costa Rica is Brazil with 2500 thousand metric tons in production. Third in the list is Philippines with a production of approximately 2400 thousand metric tons in the past year. Philippines is also the 3
rd largest pineapple exporter (Khan, 2018). Santiago (2017) reported that South Korea, Japan, China,
United Arab Emirates, Iran, Saudi Arabia, Taiwan, Hong Kong, New Zealand, and United States bought 97.7% of all Filipino pineapple exports in 2016. Based on the record of Philippine Statistics Authority (PSA) April to June 2018, the highest pineapple producer in the Philippines was Northern Mindanao (50.6%) followed by SOCCSKSARGEN (25.8%), other regions (13.9%) and Calabarzon (9.7%). On October to December 2018, pineapple production had an increment of 1.0%, reaching 706.46 thousand metric tons. Almost two-thirds of pineapple production in the country was from Northern Mindanao (PSA, October-December 2018).
Cagayan Valley represents small portion in Philippine Pineapple Industry with only 720 MT produced in 2015 (PSA, 2016). The region ranked 8
th among the 17 pineapple producers in the country. In Region 02, Nueva Vizcaya, Isabela, and Cagayan are the
top 3 producers of pineapple. Based on the record of the Office of Provincial Agriculturist-Isabela (2016) Echague, Jones, San Guillermo, Angadanan, and Sto. Tomas are the municipalities with most number of pineapple farmers. This study determined the (1) key production area, (2) farming practices, (3) average production volume, (4) different marketing channels, and (5) marketing practices of pineapple farmers in Isabela, Philippines.
Key production area refers to the specific area where pineapples are planted. What are pineapple farmers farming practices that is unique from other pineapple farmers? In marketing, good quality product is important, thus, pineapple farmers’ farming practices entail an effect to the quality of their produce. Demand should be satisfied, hence, this study determined the average production volume per farmer. As discussed earlier, marketing is everywhere. This research would determine the marketing channels and marketing practices used by pineapple farmers. This study would help pineapple farmers to improve their decision in choosing marketing channels. Further, those farmers who do not have marketing skills may now have an idea on how to improve and market their products.
2. LITERATURE REVIEW
Yusi (2016) mentioned that pineapple contributes eight percent of the world fresh fruit production. Further, it is a proven commodity which has market opportunities domestically and abroad. Pineapple farming generate employment for rural people (Das et al, 2016). Most pineapple farmers belong to marginal sector, hence, they cannot undertake value addition operations (Arcelo, nd). Likewise, agricultural development’s purpose in Indonesia is to reduce poverty of villagers, meet the food needs of
Journal of Management, Marketing and Logistics -JMML (2019), Vol.6(2). p.73- 83 Galvez
_____________________________________________________________________________________________________ DOI: 10.17261/Pressacademia.2019.1035 75
the society, the needs of raw materials in the country, prevent migration, increase foreign exchange through export, expand employment opportunities, increase the income of the society, and support the distribution development results (Yusi, 2016).
2.1. Culture and Management
Arcelo (nd) stated in her study, pineapple requires mild and relative temperature about 24 to 30 degree Celsius, evenly distributed rainfall (100-150 cm / year), and a very short dry season. Suckers, slips, and crowns are used as planting materials for propagation. These should be exposed to sunlight for one week or more depending on the weather conditions. Suckers which will bear in 16 to 18 months form at the base and axil of the leaves. Slips develop at the base or above the ground which bears 18 – 20 months. Crowns form on top of the fruit which will bear in 22 – 24 months. Before planting, land and soil must be prepared thoroughly. For commercial farms, crowns are commonly used while slips and suckers are planted in small farms. In small scale planting, farmers intercropped pineapples with coconut, papaya, coffee, or banana. Weeds compete with pineapple for nutrients and sunlight, thus, weed management is one of the major constraints in harvesting high yield. Harvesting the fruit depends upon the maturity. In small farms, pineapples are harvested manually. They are placed on a well shaded and clean area to minimize weight loss and microbial contamination. In transporting the fruits, they should be arranged lying on their sides in an alternate crown-to-base fashion to reduce physical damage.
2.2. Marketing Channels
Based on the study of Das et al (2016) there are six marketing channels in West Bengal, India. The channels are: Channel I- Producer →Wholesaler →Outside Markets→*Consumer; Channel II- Producer →Trader agent → Wholesaler → Outside market → * Consumer; Channel III – Producer → Wholesaler →Retailer →Consumer; Channel IV- Producer → Trader agent → Wholesaler → Retailer → Consumer; Channel V- Producer → Wholesaler → Factory → Outside Market → *Consumer; and Channel VI – Producer → Wholesaler →Middle agent → Outside market → Consumer. Those with asterisk (*) are incomplete channel, meaning, channels are extended to the markets outside states. Channel 1 depicts the shortest while channel II is the most prominent among the channels. Pineapples are passed on from one intermediary to another. The fruits are graded through visual inspection according to size and vigor. Pineapples are graded into three categories namely: Grade I- fruit with less than one kilogram; Grade II- fruit with 1kg – 1.5 kg; and Grade III- fruit with more than 1.5 kg. The retail shop owners sell the produce as raw fruit and juice of raw pineapple. As agricultural product, pineapple needs more attention either in terms of its quantity or marketing system (Yusi, 2016). Marketing system is important for the product to last long. With a good support from marketing system, pineapple farmers are motivated to increase their production. Hence, efficient marketing has effect on the farmer’s passion to be more active in production.
2.3. Marketing Practices
In West Bengal, small and marginal farmers sell their produce through trade agents (wholesalers) at the village level. This constitutes the 90% share of pineapple marketing. Moreover, farmers also brought their produce to various marketing functionaries through own arrangements. Due to its high perishability, marketing of fresh pineapple entails serious problems. Almost forty-eight percent (48%) spoilage is experienced while in transit from Agartala to Kolkata. Further, pricing system of pineapple is not yet developed (Das et al 2016). Nevertheless, farmers cannot determine their products’ price freely due to lack of capital and have less information about the market. When they are challenged with urgent needs, they tend to avail loan from middlemen either in cash or in kind. At the end, among the intermediaries along the channel, farmers get the smallest part of the price paid by the consumers (Yusi, 2016). Das et al (2016) enumerated five major constraints in marketing system; (1) weak forward and backward linkages, (2)supply of quality pineapple is for a short period due to poor storage and cool-chain facilities, (3) infrastructure for grading and standardization not available, (4) pricing mechanism is not scientific since it is based on visual inspection only, and (5) lack of cooperative approach for improving bargaining power. Based on the study of Keerthi (2008) marketing is part and parcel of production. Pineapple farmers neither have the time nor the skills to undertake marketing activities. Local fresh fruit markets and processors prefer bigger fruits and medium size fruits (1.3-1.5kg) respectively (Arcelo, nd). Pineapples must be prepared for marketing in a packinghouse protected by sunlight and rain. A quality control system is suggested to meet the customer’s requirements, hence, final sorting and grading should be done in the packinghouse. The basis of pricing for local market is based on size or kilogram.
3. DATA AND METHODOLOGY
This study used primary and secondary data. Primary data was used in determining the farm activities, average production volume, marketing channels, and marketing practices. Moreover, secondary data was used to determine the key production
Journal of Management, Marketing and Logistics -JMML (2019), Vol.6(2). p.73- 83 Galvez
_____________________________________________________________________________________________________ DOI: 10.17261/Pressacademia.2019.1035 76
area of pineapple in the province. The data came from the Office of the Provincial Agriculturist (OPAG), Isabela. The primary respondents of the study were the pineapple farmers. Multistage sampling using slovins formula with 10% margin of error was used in determining the samples. The researcher identified the top three highest municipalities then top three barangays per municipality with the greatest number of farmers.
Table 1: Number of Pineapple Farmers in Isabela
Municipality No. of Farmer
Echague 266
Jones 35
San Guillermo 162
Angadanan 5
Sto. Tomas 118
Total 586
Source: OPAG Isabela, Status of Pineapple Production in the Province of Isabela CY 2016
Table 2: Sample Size of Pineapple Farmers per Barangay
Municipality Barangay Population Sample
San Guillermo
Dingading 90 15
Centro 2 83 14
Estrella 68 12
Echague
Magleticia 96 16
Mabbayad 36 6
Villa Rey 33 5
Santo Tomas
San Rafael Alto 49 8
San Vicente 41 7
Ammugauan 8 1
Total 504 84 Source: OPAG Isabela, Status of Pineapple Production in the Province of Isabela CY 2016
Based on table 1, the top three municipalities were Echague, San Guillermo, and Sto. Tomas. Table 2 depicts the sample size per barangay. For Echague, its top three barangays were Brgy. Magleticia, Brgy. Mabbayad, and Brgy. Villarey; for San Guillermo, its top three barangays were Brgy. Dingading, Brgy. Centro Dos, Brgy. Estrella; and for Santo Tomas, there were only two barangays identified namely Brgy. San Rafael Abajo, and San Vicente. Quantitative method was used in objective three where mean, standard deviation, frequency and percentages were identified. Moreover, for objectives two, four and five, open ended questions were used. The questionnaire was validated by the expert before the conduct of the survey.
4. FINDINGS AND DISCUSSIONS
Key Production Area of Pineapple
Among 34 municipalities in Isabela, there were only five municipalities which produced pineapple namely; Echague, Jones, San Guillermo, Angadanan, and Sto. Tomas (See Appendix 1). Isabela had a total land area of 425.66 hectares for pineapple production which was located in 5 municipalities (Table 1). Echague had the largest area which was 287.75 hectares followed by San Guillermo which was 86.87 hectares. The third largest area of production which was 27.89 hectares was found in Sto. Tomas, however, during the conduct of the study, it was found out that most producers were backyard farmers. Furthermore, Jones, and Angadanan had 18.65 hectares and 4.50 hectares respectively.
Table 3: Area Planted Per Municipality Municipality Area Planted(Has)
Echague 287.75
Jones 18.65
San Guillermo 86.87
Angadanan 4.50
Sto. Tomas 27.89
Total 425.66
Source: OPAG Isabela, Status of Pineapple Production in the Province of Isabela CY 2016
Journal of Management, Marketing and Logistics -JMML (2019), Vol.6(2). p.73- 83 Galvez
_____________________________________________________________________________________________________ DOI: 10.17261/Pressacademia.2019.1035 77
Farm Activities
Pineapple farmers planted, grew, and harvested their produce for an average of twenty-four (24) months. Farm activities were the following:
Land clearing. Farmers sprayed herbicide then plowed the soil. In some instances, if they had very limited time, some farmers did not plow the soil as long as they sprayed herbicide.
Planting. After plowing, it was now time to plant the suckers. Months of September – December was their planting season. Twenty-five thousand (25, 000) suckers were planted per hectare. Some farmers mostly intercropped it with banana (See Appendix 2) or in minimal instances they intercropped pineapple with corn.
Fertilizer application. They applied fertilizer to the main stem three times per cropping. If they planted in September, first application would be December- January (after three months from planting). Then second application was July the following year (after seven months from first application) and the last application was January (six months after second application).
Weed management. Farmers visited their farms, removed and controlled the weeds by spraying herbicide.
Cover hay – In April (22 months from planting) they covered the fruits with hay for protection from the sun (See Appendix 3) because weather in Isabela was very hot during this month.
Harvest. – In May, they regularly visited the farms to check if the fruits were ready for harvest. The peak of their harvest was during the months of June till July. During harvest, they placed their produce in “kariton” (Appendix 4) to transport the fruits nearby the road then classified pineapples (Appendix 5) according to size like: “premera” which was P 25.00/pc (2.5kg -3kg), “segunda” which was P 20.00pc (1.5kg – 2.5kg), “tersera” which was P15.00/pc (1kg-1.5kg), and “buraot” which was 3 for P 100.00 / P 10.00 (below 1kg). A truck of trader (Appendix 6) would be waiting during sorting then put the sorted fruits in the truck to be delivered to different destinations.
Average Production Volume
Table 4 shows the production volume of pineapple growers in Isabela particularly in the municipality of Echague, San Guillermo, and Sto. Tomas. Out of 84 farmers, 25% of them harvested more than 25,000 pcs of pineapple which means that their production area was more than one hectare. Though, 22.6% harvested below 5,000 pcs, 19% pineapple farmers produced 5,000-9,000 pcs, 11.9% produced 10,000-14,999 pcs, and 7.1% produced 15,000-19,999 pcs. According to farmers, the average production per hectare was around 24,000-25,000. This data would not be far from the 23, 588.13 mean as shown in table 2.
Table 4: Production Volume of Pineapple Growers in Isabela (in pcs.)
Production f %
below 5,000 19 22.6
5,000 to 9, 999 16 19.0
10,000 to 14,999 10 11.9
15,000 to 19,999 6 7.1
20,000 to 24,999 8 9.5
25,000 and above 21 25.0
No response 4 4.8
Total 84 100
Mean 23, 588.13
Sd 30, 259.34
Marketing Channel
The marketing channel of pineapple in Isabela is composed of four intermediaries namely: canvassers, traders, processors, and retailers. Canvassers are agents/assemblers who go to different farmers to buy/gather their produce and sell it to traders; traders are those who sell pineapples to processors or retailers; processors are those who process pineapple into vinegar, jam, and dried pineapple or in any product forms; retailers are the last intermediary in the marketing chain.
Journal of Management, Marketing and Logistics -JMML (2019), Vol.6(2). p.73- 83 Galvez
_____________________________________________________________________________________________________ DOI: 10.17261/Pressacademia.2019.1035 78
Figure 1: Marketing Channels of Pineapple in Isabela
Figure 1 depicts the six marketing channels of pineapple in Isabela. Marketing channel 1 was the simplest in which no intermediary was involved. In distribution management, this is called zero (0) level. The farmers directly sell their produce to consumers. The second channel had one intermediary who are the retailers. Retailers are the last middlemen before the consumers. Further, the third marketing channel involved traders and retailers. In marketing channel 4, canvassers entered in the scenario before traders and retailers. Marketing channel 5 had two intermediaries who were processors and retailers. The last channel would likely be complicated. From farmers, pineapples were bought by canvassers then sold them to traders then the next intermediary were the processors then passed on to retailers. Further, farmers would sell the fruits to traders then these traders would sell them to processors then passed to retailers until it would reach the consumers. Farmers sold their produce to canvassers, traders, and retailers as fresh fruit. Canvassers added P 1.00 mark-up per fruit when they sold their produce to traders. Other farmers were traders and/or retailers at the same time. Some of them transported their produce to different destinations, however, some traders picked-up the produce in the place of the farmers. Most buyers were their regular buyers or “suki”. Buyers mode of purchase and payment was wholesale and cash basis respectively, though, very few farmers sold produce at retail price. In some instances, few farmers accepted credit or consignment basis.
Pineapples in Isabela were sold in Cagayan Valley particularly in the different municipalities in Isabela like: San Guillermo, Echague, Roxas, Santiago City, Cabagan, Sto. Tomas, Luna, and Alicia; Central Luzon (Nueva Ecija, Bulacan, Tarlac, Pampanga, Bataan and Zambales); Ilocos Region (Urdaneta Pangasinan); and National Capital Region (Balintawak, Quezon City and Taguig City). To those farmers who were traders and/or retailers at the same time, they transported and sold the fruit at Riverview Market and Juliana Market, Balintawak, Quezon City. There were also “pure” retailers in the said public market in which they sold pineapple all year round. All pineapple farmers sell fresh fruit. Very few processed the reject fruit as vinegar. Most reject pineapples were given to animals as their food or they just simply disposed them. Hi-Las Marketing is one of the processors of dried pineapples. The company gets their supply from Isabela as well as Cagayan. All dried pineapple manufactured by HiLas Marketing Corporation were transported to Japan and United Kingdom. Aside from Isabela, the company’s other source of pineapple is in Mindanao.
Marketing Practices
The heart of the business is the consumers whose demand have to be fulfilled. In this study, consumers are referred to as buyers of pineapple. Buyers could be customers who purchase pineapple; consumers who eat pineapple; canvassers who purchase pineapple then sell them to another intermediary; processors purchase pineapple to further process it; and retailers purchase pineapple and sell them to consumers. Pineapple farmers are the sellers of pineapple. Hence, they need to satisfy the
Farmers Channel 1 Consumers
Channel 2 Consumers Retailers
Channel 3
Canvassers
Traders Consumers
Channel 4 Consumers
Channel 6
Traders Processors
Consumers
Canvassers
Channel 5
Retailers
Retailers
Retailers
Farmers
Farmers
Farmers Traders Retailers
Farmers
Farmers
Processors
Consumers
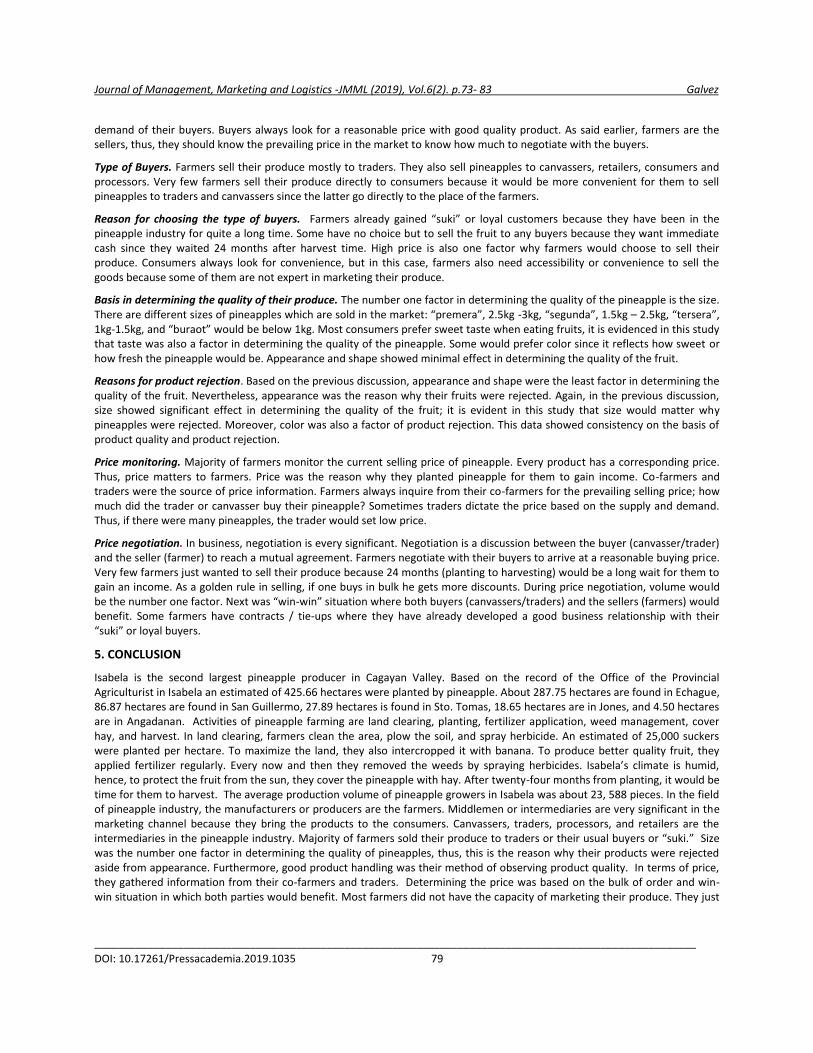
Journal of Management, Marketing and Logistics -JMML (2019), Vol.6(2). p.73- 83 Galvez
_____________________________________________________________________________________________________ DOI: 10.17261/Pressacademia.2019.1035 79
demand of their buyers. Buyers always look for a reasonable price with good quality product. As said earlier, farmers are the sellers, thus, they should know the prevailing price in the market to know how much to negotiate with the buyers.
Type of Buyers. Farmers sell their produce mostly to traders. They also sell pineapples to canvassers, retailers, consumers and processors. Very few farmers sell their produce directly to consumers because it would be more convenient for them to sell pineapples to traders and canvassers since the latter go directly to the place of the farmers.
Reason for choosing the type of buyers. Farmers already gained “suki” or loyal customers because they have been in the pineapple industry for quite a long time. Some have no choice but to sell the fruit to any buyers because they want immediate cash since they waited 24 months after harvest time. High price is also one factor why farmers would choose to sell their produce. Consumers always look for convenience, but in this case, farmers also need accessibility or convenience to sell the goods because some of them are not expert in marketing their produce.
Basis in determining the quality of their produce. The number one factor in determining the quality of the pineapple is the size. There are different sizes of pineapples which are sold in the market: “premera”, 2.5kg -3kg, “segunda”, 1.5kg – 2.5kg, “tersera”, 1kg-1.5kg, and “buraot” would be below 1kg. Most consumers prefer sweet taste when eating fruits, it is evidenced in this study that taste was also a factor in determining the quality of the pineapple. Some would prefer color since it reflects how sweet or how fresh the pineapple would be. Appearance and shape showed minimal effect in determining the quality of the fruit.
Reasons for product rejection. Based on the previous discussion, appearance and shape were the least factor in determining the quality of the fruit. Nevertheless, appearance was the reason why their fruits were rejected. Again, in the previous discussion, size showed significant effect in determining the quality of the fruit; it is evident in this study that size would matter why pineapples were rejected. Moreover, color was also a factor of product rejection. This data showed consistency on the basis of product quality and product rejection.
Price monitoring. Majority of farmers monitor the current selling price of pineapple. Every product has a corresponding price. Thus, price matters to farmers. Price was the reason why they planted pineapple for them to gain income. Co-farmers and traders were the source of price information. Farmers always inquire from their co-farmers for the prevailing selling price; how much did the trader or canvasser buy their pineapple? Sometimes traders dictate the price based on the supply and demand. Thus, if there were many pineapples, the trader would set low price.
Price negotiation. In business, negotiation is every significant. Negotiation is a discussion between the buyer (canvasser/trader) and the seller (farmer) to reach a mutual agreement. Farmers negotiate with their buyers to arrive at a reasonable buying price. Very few farmers just wanted to sell their produce because 24 months (planting to harvesting) would be a long wait for them to gain an income. As a golden rule in selling, if one buys in bulk he gets more discounts. During price negotiation, volume would be the number one factor. Next was “win-win” situation where both buyers (canvassers/traders) and the sellers (farmers) would benefit. Some farmers have contracts / tie-ups where they have already developed a good business relationship with their “suki” or loyal buyers.
5. CONCLUSION
Isabela is the second largest pineapple producer in Cagayan Valley. Based on the record of the Office of the Provincial Agriculturist in Isabela an estimated of 425.66 hectares were planted by pineapple. About 287.75 hectares are found in Echague, 86.87 hectares are found in San Guillermo, 27.89 hectares is found in Sto. Tomas, 18.65 hectares are in Jones, and 4.50 hectares are in Angadanan. Activities of pineapple farming are land clearing, planting, fertilizer application, weed management, cover hay, and harvest. In land clearing, farmers clean the area, plow the soil, and spray herbicide. An estimated of 25,000 suckers were planted per hectare. To maximize the land, they also intercropped it with banana. To produce better quality fruit, they applied fertilizer regularly. Every now and then they removed the weeds by spraying herbicides. Isabela’s climate is humid, hence, to protect the fruit from the sun, they cover the pineapple with hay. After twenty-four months from planting, it would be time for them to harvest. The average production volume of pineapple growers in Isabela was about 23, 588 pieces. In the field of pineapple industry, the manufacturers or producers are the farmers. Middlemen or intermediaries are very significant in the marketing channel because they bring the products to the consumers. Canvassers, traders, processors, and retailers are the intermediaries in the pineapple industry. Majority of farmers sold their produce to traders or their usual buyers or “suki.” Size was the number one factor in determining the quality of pineapples, thus, this is the reason why their products were rejected aside from appearance. Furthermore, good product handling was their method of observing product quality. In terms of price, they gathered information from their co-farmers and traders. Determining the price was based on the bulk of order and win-win situation in which both parties would benefit. Most farmers did not have the capacity of marketing their produce. They just

Journal of Management, Marketing and Logistics -JMML (2019), Vol.6(2). p.73- 83 Galvez
_____________________________________________________________________________________________________ DOI: 10.17261/Pressacademia.2019.1035 80
waited for their buyers to come in their area. Marketing was not their number one concern, however, marketing channel is still important in every product. Intermediaries are still involved along the chain. In 2016, 97.7% of all Filipino pineapple exports were sold to other countries (Santiago, 2017). International market serves as window for Filipino pineapple farmers. Pineapples in Isabela are sweet and tasty. It could compete in international business, however, they could not supply the huge demand in the market. It would be of great advantage to increase the production area to increase the harvest.
REFERENCES
Apandi, F.H. et al (2017). Factors Influencing the Choice of Pineapple Marketing Channel in Samarahan, Sarawak. Journal of Fundamentals and Applied Science, 9 (7S), 571-583.
Das, B. et al (2016). Study on Marketing System and Value Addition of Pineapple Fruit (Ananus comosus) in West Bengal. Agricultural Economics Research Review, 29 (2), 279-285.
Yusi, M.S. (2016). The Analysis of Production Function and Farm Marketing efficiency of pineapple (Ananas comosus L Merr) in South Sumatera Province, Indonesia. African Journal of Agricultural Research, 11 (23), 1990-1998.
Agarwal, R. (n.d). Distribution Channel: Functions and Levels (With Diagram). Retrieved from http://www.yourarticlelibrary.com/retailing/distribution-channel-functions-and-levels-with-diagram/48299
Arcelo, M. (nd). Production Guide for Pineapple. Retrieved from http://bpi.da.gov.ph/bpi/images/Production_guide/pdf/Pineapple%20.pdf
Blunt, L. (2019). Types of Marketing Channels. Retrieved March 25, 2019 from https://smallbusiness.chron.com/types-marketing-channels-21627.html
Joy, P.P (2010). Benefits and Uses of Pineapple. Retrieved from https://www.researchgate.net/publication/306017037_Benefits_and_uses_of_pineapple
Khan, H. (2018). Top 10 Largest Pineapple Producing Countries in the World. Retrieved from https://www.worldblaze.in/pineapple-producing-countries/
Rodeo, AJ D. (2016). The Philippine Fruit Industry: An Overview. Retrieved from https://www.researchgate.net/publication/311067359_The_Philippine_Fruit_Industry_An_Overview
Philippine Statistics Authority. www.psa.gov.ph Santiago, D. (2017). Philippines Pineapples Exports by Country. Retrieved from: http://www.philippinesaroundtheworld.com/philippines-pineapples-exports-by-country/ Szalay, J. (2018). Pineapple: Health Benefits, Risks & Nutrition Facts. Retrieved from https://www.livescience.com/45487-pineapple-nutrition.html
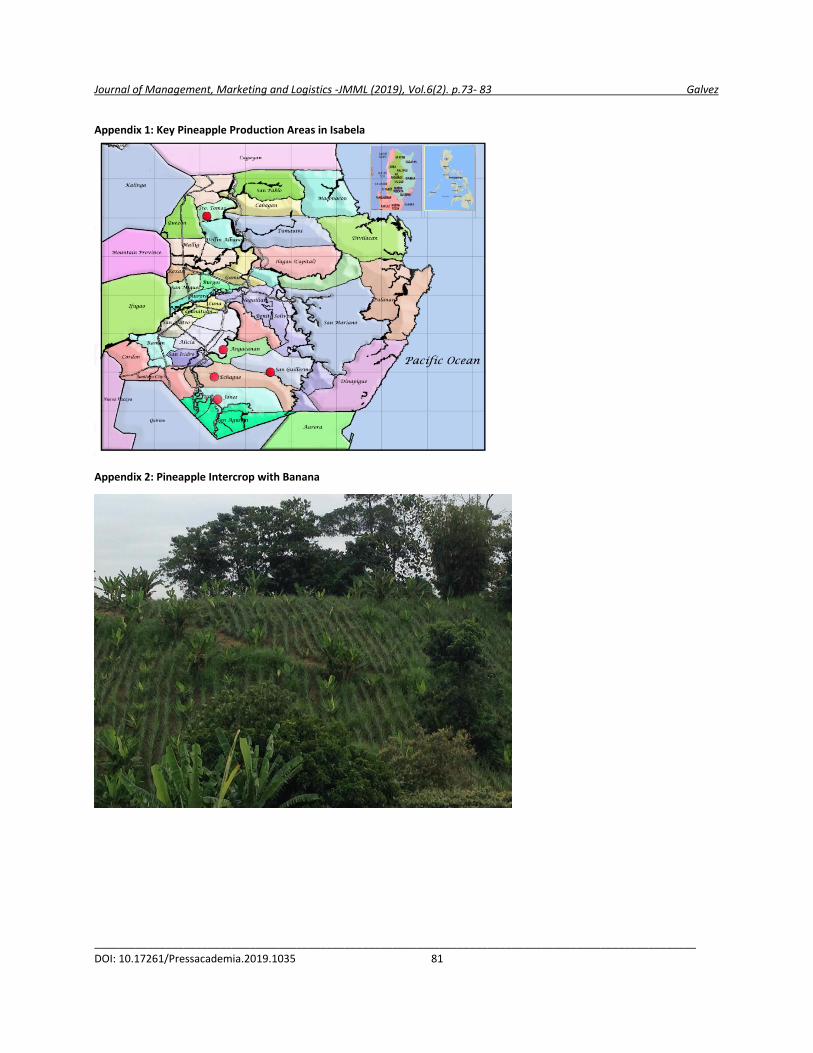
Journal of Management, Marketing and Logistics -JMML (2019), Vol.6(2). p.73- 83 Galvez
_____________________________________________________________________________________________________ DOI: 10.17261/Pressacademia.2019.1035 81
Appendix 1: Key Pineapple Production Areas in Isabela
Appendix 2: Pineapple Intercrop with Banana

Journal of Management, Marketing and Logistics -JMML (2019), Vol.6(2). p.73- 83 Galvez
_____________________________________________________________________________________________________ DOI: 10.17261/Pressacademia.2019.1035 82
Appendix 3: Pineapple covered with Hay
Appendix 4: Kariton
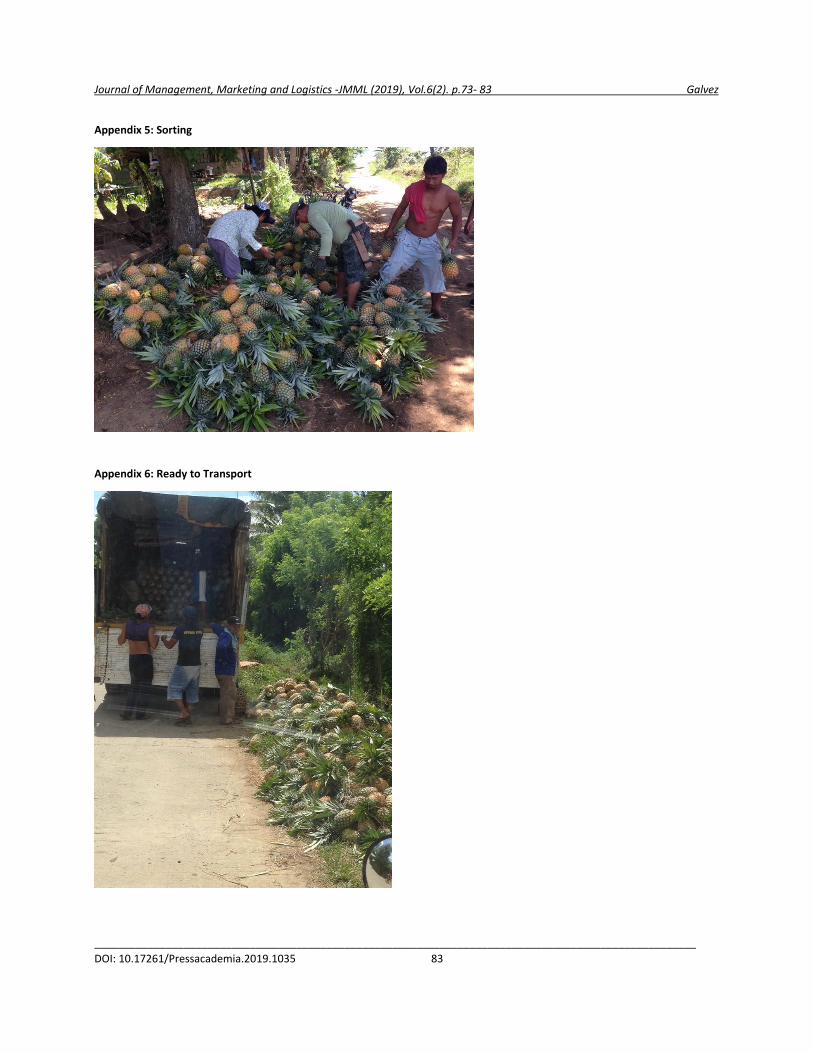
Journal of Management, Marketing and Logistics -JMML (2019), Vol.6(2). p.73- 83 Galvez
_____________________________________________________________________________________________________ DOI: 10.17261/Pressacademia.2019.1035 83
Appendix 5: Sorting
Appendix 6: Ready to Transport

Journal of Management, Marketing and Logistics -JMML (2019), Vol.6(2). p. 84-94 Demiray, Burnaz
________________________________________________________________________________________________ DOI: 10.17261/Pressacademia.2019.1036 84
POSITIONING OF CROWDFUNDING PLATFORMS: TURKEY AS AN EMERGING MARKET CASE
DOI: 10.17261/Pressacademia.2019.1036
JMML- V.6-ISS.2-2019(3)-p.84-94
Melek Demiray1, Sebnem Burnaz
2
1Istanbul Technical University, Department of Management Engineering, Istanbul, Turkey
[email protected] , ORCID: 0000-0002-5147-0809 2Istanbul Technical University, Department of Management Engineering, Istanbul, Turkey
[email protected] , ORCID: 0000-0002-4845-4031
Date Received: May 10, 2019 Date Accepted: June 12, 2019
To cite this document Demiray, M., Burnaz, S. (2019). Positioning of crowdfunding platforms: Turkey as an emerging market case. Journal of Management, Marketing and Logistics (JMML), V.6(2), p.84-94 DOI: 10.17261/Pressacademia.2019.1036
Permenant link to this document: http://doi.org/10.17261/Pressacademia.2019.1036 Copyright: Published by PressAcademia and limited licenced re-use rights only.
ABSTRACT Purpose - Crowdfunding, as a novel concept, offers an alternative funding method that enables entrepreneurs to realize their original ideas. The
aim of this study is to understand how crowdfunding platforms can be positioned in an emerging crowdfunding market.
Methodology - Turkey was chosen as a developing market which presents a real potential with newly regulated crowdfunding environment and
rapidly flourishing entrepreneurship ecosystem. The analysis proposes a positioning map of crowdfunding platforms depending on two main
dimensions: the level of complexity based on regulatory procedures and the level of expertise based on project categories.
Findings- Introducing positioning concept into crowdfunding literature broadens understanding of this phenomenon and contributes to the
development of assessment criteria for crowdfunding platforms.
Conclusion- Platform managers who desire to develop their positioning strategy upon gaps in the crowdfunding market by differentiating their
features in order to get advantages over their rivals can benefit using the proposed positioning map analysis.
Keywords: Crowdfunding, crowdfunding platform, positioning, emerging market, entrepreneurship
JEL Codes: M13, M30, M31
1. INTRODUCTION
Sharing economy and community effect have changed the way of doing business in the digital era. The concepts of ‘co-creation’, ‘co-funding’ and ‘peer-to-peer’ become inevitable parts of sustainable innovation and entrepreneurship. Crowdfunding, as a novel financial system, has emerged to facilitate accessing funds and democratize the entrepreneurial ecosystem. Crowdfunding is basically gathering a small amount of money from a large number of people, namely the ‘crowd’ in a community or in a society to realize a specific project. Especially, social entrepreneurs and early stage start-up organizations that generally face with difficulties in raising capital from traditional funding mechanisms including banks, angel investors and venture capitals (VCs), can effectively and efficiently benefit from this newly emerging financial system. Due to the power of collectivism through the sense of community, crowdfunding provides much more than capital for enterprises. Indeed, individuals, entrepreneurs and start-ups can find the opportunity to use crowdfunding as a marketing research tool by asking their prospective customers for their opinion about certain project or product, testing features and market acceptance of the project or new product as well. Crowdfunding market has rapidly spread around the world in recent years rising from $34.4 billion in 2015 (Massolution’s 2015 CF Industry Report, 2015) to almost $73 billion in 2018 (Technavio, 2018), increasing by more than twice within three years. This

Journal of Management, Marketing and Logistics -JMML (2019), Vol.6(2). p. 84-94 Demiray, Burnaz
________________________________________________________________________________________________ DOI: 10.17261/Pressacademia.2019.1036 85
growth has initially depended upon the emergence and enhancement of crowdfunding platforms which operate as online settings to create relationships, enable connectivity and coordinate transactions among all actors of the system. Due to the vital role of the platform, to select the appropriate medium is crucial for the success of the crowdfunding campaign (European Commission Report, 2013). Despite the significance of the crowdfunding platform selection, there is a lack of studies on evaluation criteria of the crowdfunding platforms. To address this research gap, this paper proposes a positioning map to serve to assess crowdfunding platforms. Two main distinctive features of the crowdfunding platforms are presented as dimensions of the positioning map. This study represents the first effort to provide a holistic view in an emerging crowdfunding market. Turkey is an emerging market case because of its newly regulated and developing crowdfunding market based on rapidly growing entrepreneurial ecosystem.
The following section reviews the relevant literature by elaborating on the crowdfunding concept and various models. The third section provides information and data about the progress of the global crowdfunding market and emerging crowdfunding market in Turkey. Then, the methodology of the study is clarified by offering a positioning map for the crowdfunding platforms for a certain market. Also, the conceptualizing of the positioning map is explained through the distinctive attributes of the platforms. In the next section, the positioning map of crowdfunding platforms in Turkey is offered based on the evaluation of each platform using secondary data. The final section concludes with theoretical and managerial implications through the discussion of the findings and limitations and future research suggestions are presented as well.
2. CROWDFUNDING CONCEPT AND MODELS
Crowdfunding concept originates from the broader approach of crowdsourcing in which ‘crowd’ is used for the sources of creative ideas, feedbacks, comments and suggestions for the design and improvement of innovative products or business processes (Belleflamme, Lambert and Schwienbacher, 2014). Lambert and Schwienbacher (2010, p. 6) identify crowdfunding as: “An open call, essentially through the Internet, for the provision of financial resources either in form of donations or in exchange for some form of reward and/or voting rights in order to support initiatives for specific purposes.” (cited in Macht and Weatherston, 2014). The actors of the crowdfunding mechanism are regarded as project owners (entrepreneurs or initiators of the campaigns), funders (donors, backers or investors of the projects) and platform managers (Gerber, Hui and Kuo, 2013, 2013; Ordanini, Meceli, Pizeli and Parasuraman, 2011). The crowdfunding platforms bring members together to raise capital and provide required information about projects through online settings. Project creators have the chance to introduce their initiatives to prospective supporters and get funded. Thanks to the digitalization, a great number of individuals can effectively benefit from platforms at a low cost as creators and/or supporters (Kuti and Madarasz, 2014). The framework of crowdfunding models is grouped into two primary categories as the nonfinancial return models and the financial return models, each including two types (European Commission Report, 2013). These crowdfunding models are described as donation-based, reward-based, lending-based and equity-based depending on the type of return offered to potential funders (Buysere, Gajda, Kleverlaan and Marom, 2012; Bretschneider, Knaub and Wieck, 2014).
Donation-based crowdfunding includes the projects where funders do not have any expectation including financial or non-financial return (Kuti and Madarasz, 2014; Mollick, 2014). Crowdfunding projects can range from pure charity-based to the ones based on personal reasons such as education, research, art and travel. The achievement of a donation-based crowdfunding project is closely associated with emotional factors or common good (European Commission Report, 2013). The major motive of the funders is philanthropy since they do not receive a material return for their financial support in this type (Marom and Sade, 2014). Considering the psychological aspect, when a funder receives a thank-you note from a campaign owner, he/she gets personal satisfaction (Meric, Bouiass and Maque, 2015) since the funder has the opportunity to make a difference in one’s life. In addition, non-governmental organizations (NGOs) generally launch this type of crowdfunding campaigns to raise money for specific causes. If the donors believe the benefit of the projects, they are willing to give large amounts of money. Also, when the NGO regularly informs the donors about the progress of the project, it has more loyal donors since providing up-to-date information is critical to create long-term and strong relationship with funders (Buysere et al., 2012). Gofundme, top crowdfunding platform in the world, operates as a donation-based model and has more than 50 million funders and total $5 billion funding volume. As for another non-financial return model, in reward-based crowdfunding, funders finance a campaign by expecting tangible or intangible offerings in exchange. The reward can be in the way of nonmonetary material like the actual product, DIY kit, creative experiences (e.g., a visit to the film set, a phone call from the writer, lunch with the band) or immaterial such as providing reputation and giving supporter’s name to a hero in a game (Cholakova and Clarysse, 2015; Kuppuswamy and Bayus, 2014). Additionally, reward-based crowdfunding gives an opportunity to the supporters as first buyers, providing them receive created products by supported projects in the earlier stages, at a reduced price and/or with other extra
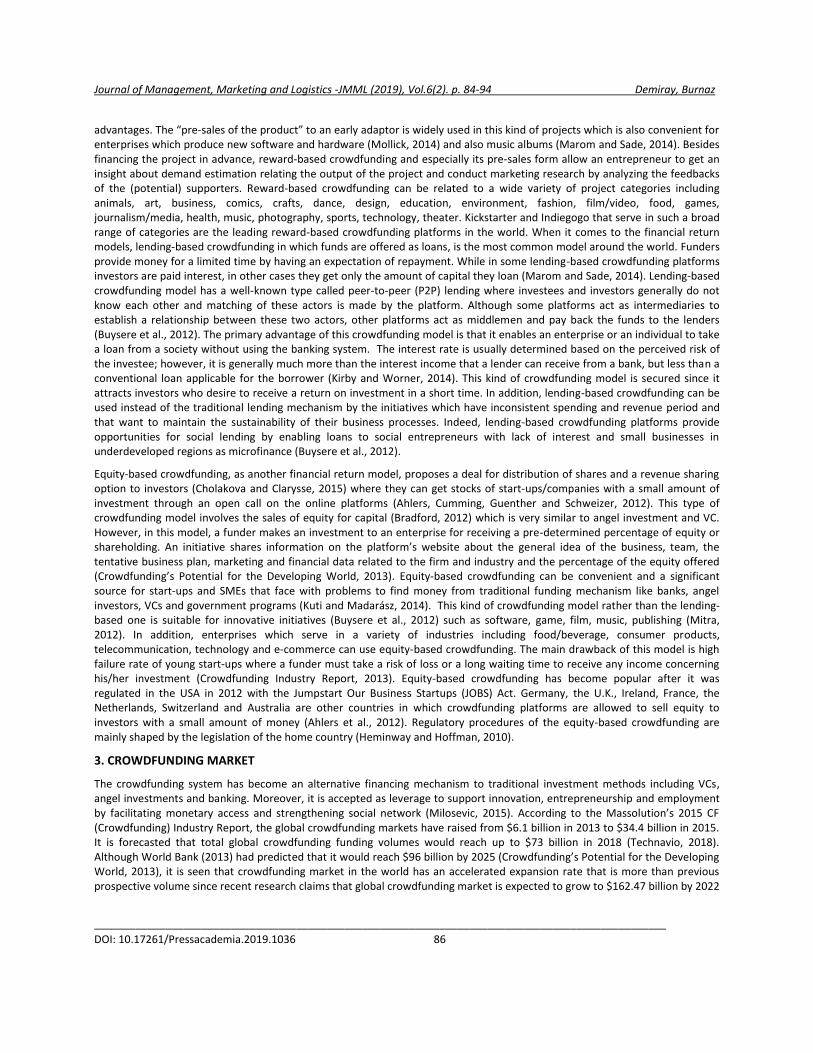
Journal of Management, Marketing and Logistics -JMML (2019), Vol.6(2). p. 84-94 Demiray, Burnaz
________________________________________________________________________________________________ DOI: 10.17261/Pressacademia.2019.1036 86
advantages. The “pre-sales of the product” to an early adaptor is widely used in this kind of projects which is also convenient for enterprises which produce new software and hardware (Mollick, 2014) and also music albums (Marom and Sade, 2014). Besides financing the project in advance, reward-based crowdfunding and especially its pre-sales form allow an entrepreneur to get an insight about demand estimation relating the output of the project and conduct marketing research by analyzing the feedbacks of the (potential) supporters. Reward-based crowdfunding can be related to a wide variety of project categories including animals, art, business, comics, crafts, dance, design, education, environment, fashion, film/video, food, games, journalism/media, health, music, photography, sports, technology, theater. Kickstarter and Indiegogo that serve in such a broad range of categories are the leading reward-based crowdfunding platforms in the world. When it comes to the financial return models, lending-based crowdfunding in which funds are offered as loans, is the most common model around the world. Funders provide money for a limited time by having an expectation of repayment. While in some lending-based crowdfunding platforms investors are paid interest, in other cases they get only the amount of capital they loan (Marom and Sade, 2014). Lending-based crowdfunding model has a well-known type called peer-to-peer (P2P) lending where investees and investors generally do not know each other and matching of these actors is made by the platform. Although some platforms act as intermediaries to establish a relationship between these two actors, other platforms act as middlemen and pay back the funds to the lenders (Buysere et al., 2012). The primary advantage of this crowdfunding model is that it enables an enterprise or an individual to take a loan from a society without using the banking system. The interest rate is usually determined based on the perceived risk of the investee; however, it is generally much more than the interest income that a lender can receive from a bank, but less than a conventional loan applicable for the borrower (Kirby and Worner, 2014). This kind of crowdfunding model is secured since it attracts investors who desire to receive a return on investment in a short time. In addition, lending-based crowdfunding can be used instead of the traditional lending mechanism by the initiatives which have inconsistent spending and revenue period and that want to maintain the sustainability of their business processes. Indeed, lending-based crowdfunding platforms provide opportunities for social lending by enabling loans to social entrepreneurs with lack of interest and small businesses in underdeveloped regions as microfinance (Buysere et al., 2012).
Equity-based crowdfunding, as another financial return model, proposes a deal for distribution of shares and a revenue sharing option to investors (Cholakova and Clarysse, 2015) where they can get stocks of start-ups/companies with a small amount of investment through an open call on the online platforms (Ahlers, Cumming, Guenther and Schweizer, 2012). This type of crowdfunding model involves the sales of equity for capital (Bradford, 2012) which is very similar to angel investment and VC. However, in this model, a funder makes an investment to an enterprise for receiving a pre-determined percentage of equity or shareholding. An initiative shares information on the platform’s website about the general idea of the business, team, the tentative business plan, marketing and financial data related to the firm and industry and the percentage of the equity offered (Crowdfunding’s Potential for the Developing World, 2013). Equity-based crowdfunding can be convenient and a significant source for start-ups and SMEs that face with problems to find money from traditional funding mechanism like banks, angel investors, VCs and government programs (Kuti and Madarasz, 2014). This kind of crowdfunding model rather than the lending-based one is suitable for innovative initiatives (Buysere et al., 2012) such as software, game, film, music, publishing (Mitra, 2012). In addition, enterprises which serve in a variety of industries including food/beverage, consumer products, telecommunication, technology and e-commerce can use equity-based crowdfunding. The main drawback of this model is high failure rate of young start-ups where a funder must take a risk of loss or a long waiting time to receive any income concerning his/her investment (Crowdfunding Industry Report, 2013). Equity-based crowdfunding has become popular after it was regulated in the USA in 2012 with the Jumpstart Our Business Startups (JOBS) Act. Germany, the U.K., Ireland, France, the Netherlands, Switzerland and Australia are other countries in which crowdfunding platforms are allowed to sell equity to investors with a small amount of money (Ahlers et al., 2012). Regulatory procedures of the equity-based crowdfunding are mainly shaped by the legislation of the home country (Heminway and Hoffman, 2010).
3. CROWDFUNDING MARKET
The crowdfunding system has become an alternative financing mechanism to traditional investment methods including VCs, angel investments and banking. Moreover, it is accepted as leverage to support innovation, entrepreneurship and employment by facilitating monetary access and strengthening social network (Milosevic, 2015). According to the Massolution’s 2015 CF (Crowdfunding) Industry Report, the global crowdfunding markets have raised from $6.1 billion in 2013 to $34.4 billion in 2015. It is forecasted that total global crowdfunding funding volumes would reach up to $73 billion in 2018 (Technavio, 2018). Although World Bank (2013) had predicted that it would reach $96 billion by 2025 (Crowdfunding’s Potential for the Developing World, 2013), it is seen that crowdfunding market in the world has an accelerated expansion rate that is more than previous prospective volume since recent research claims that global crowdfunding market is expected to grow to $162.47 billion by 2022
Journal of Management, Marketing and Logistics -JMML (2019), Vol.6(2). p. 84-94 Demiray, Burnaz
________________________________________________________________________________________________ DOI: 10.17261/Pressacademia.2019.1036 87
(Technavio, 2018). Concerning the crowdfunding platform quantity, although there is no precise information, it is predicted that more than 2000 crowdfunding platforms currently operate in the world. As for the global crowdfunding market by models, lending-based crowdfunding reached the vast majority of market share as 76% in 2017, while the percentage of reward and donation-based crowdfunding market in total was 16% and equity-based crowdfunding had relatively small market share with 8% (Statistica, 2017). Market share and growth rate of equity-based crowdfunding is expected to rise rapidly since the number of countries which organize regulations on this kind of crowdfunding model has increased and also some European Union countries are planning to set rules in order to enable equity-based crowdfunding platforms can operate across other EU regions. According to Technavio (2018), there are three key countries holding the majority share of the global crowdfunding market in 2017. US is the global leader with the dominant market share (45%), followed by China and the UK.
3.1.Crowdfunding in Turkey as an Emerging Market
Entrepreneurship is rapidly increasing and presents a huge potential in Turkey since it is regarded as a stimulant of innovation and a provider of steady employment opportunity (Global Entrepreneurship Monitor Report, 2019). In addition, it is seen as one of the main drivers of economic growth based on the fact that improving the conditions for entrepreneurship by 10% could raise $331 billion to the economy (Global Entrepreneurship Index Report, 2017). Therefore, entrepreneurship is encouraged and supported by government, universities and many stakeholders in Turkey. However, the low accessibility of capital is one of the significant problems for entrepreneurs. Although Turkey has a variety of financial mechanisms including banks, angel investors and VCs, entrepreneurs encounter difficulties in getting fund to realize and maintain their projects. Government funds have the dominant market share by the funding volume of $71 million whereas angel investments and VCs have less volume by the amount of $25.7 million for funding early phase startups in 2018 (Startups.watch, 2019).
Crowdfunding, as a novel concept, offers an alternative funding method that enables entrepreneurs to access capital in a feasible manner. Although crowdfunding as a mechanism launched in 2010 in Turkey, it is in its nascent phase in comparison to developed crowdfunding markets in the USA and Europe. Crowdfunding activities in Turkey had been relatively limited since the issue of crowdfunding was not characterized by the Capital Market Board (SPK) which is the authorized governmental institution to regulate financial systems. In 2017, Crowdfunding Association in Turkey was established to accelerate the process concerning the regulation and encourage widespread use of crowdfunding platforms that provide alternative funding opportunities for the entrepreneurship ecosystem. With the contribution of Crowdfunding Association, on December 5, 2017, crowdfunding was legally accepted under the Capital Market Law and crowdfunding platforms were entitled to act as intermediate in crowdfunding activities by getting a license from Capital Market Board in Turkey. On the other hand, the scope of this regulation was limited since only the description of the crowdfunding concept and fundamental characteristics of a crowdfunding platform had been given. Therefore, it is necessary to publish secondary legislation to clarify rules and procedures with regard to crowdfunding. As an effort to accomplish this requirement, Draft Communique on Equity-Based Crowdfunding was released for one-month public comment and review period by the Capital Market Board on January 3, 2019. While equity-based crowdfunding platforms are regulated under the Draft Communique, lending-based crowdfunding and also real estate crowdfunding in Turkey are firmly forbidden. However, Draft Communique does not enact rules and procedures concerning donation and reward-based crowdfunding activities and platforms.
Draft Communique on Equity-Based Crowdfunding provides most of the crucial key points for platform managers, entrepreneurs and investors who are the main actors of this novel funding system. From the platform management perspective, the Draft Communique sets the rules and procedures about how a platform gets the license, establishes committees for supervising the activities and selecting crowdfunding projects, conducts required membership activities, organizes fund collection and transfer and provides detailed information concerning the activities to the Capital Market Board. Moreover, this Draft Communique regulates activities and responsibilities of entrepreneurs such as what kind of information they have to submit to their potential investors, the duration of crowdfunding campaign, the requirements of launching a company and reaching target funding amount, the usage of the funds, the scope and frequency of the announcements about their start-ups activities and tax issues. As for the investor aspect, Draft Communique regulates investments activities by making a distinction between qualified and non-qualified investors to be able to adequately protect the rights of investors. While there is no limit about the investment amount for qualified investors, non-qualified investors can annually invest maximum TR 20,000. Moreover, all investors have to sign risk agreement since the nature of start-up investment includes risk due to high start-up business failure rate. On the other hand, a notable criticism to Draft Communique on Equity-Based Crowdfunding is the uncertainty regarding the secondary market which might discourage potential investors to invest their money to the crowdfunding projects.

Journal of Management, Marketing and Logistics -JMML (2019), Vol.6(2). p. 84-94 Demiray, Burnaz
________________________________________________________________________________________________ DOI: 10.17261/Pressacademia.2019.1036 88
As of today, donation and reward-based crowdfunding platforms has been actively operating in Turkey. These are Arıkovanı, Buluşum, Crowdfon, Fonbulucu, Fongogo and Ideanest. Bi’Ayda, Ortagız and ProjemeFon were platforms that exited from the crowdfunding market in Turkey. However, ProjemeFon was purchased and has named as Crowdfon in 2013. Until the end of 2017, 867 crowdfunding projects had been published in these platforms and the crowdfunding market size was TR 20.149.365.000 (Unsal, 2017). By the end of 2018, approximately 300 projects were successfully funded out of more than 900 published crowdfunding projects and almost TL 8 million was pledged. Based on this information, it can be seen that the success rate of crowdfunding projects is 30% in Turkey. As a developing crowdfunding market, there are a few equity-based crowdfunding platforms that have been established as informal and waiting for finalizing the legislative process of equity-based crowdfunding by Capital Market Board to launch officially and actively their operations in Turkey. These platforms are StartupFon, Fongogo Pro and Fonbulucu.com Invest. Detailed information will be given about platforms in Turkey in the following section.
3.2.Proposed Positioning Map for Crowdfunding Market in Turkey
The concept of positioning which is critical component in marketing, branding and strategy (Aaker, 1996; Hooley, Piercy and Nicoulaud, 2008; Kapferer, 2012; Keller, 2012; Porter, 1996) can be used for crowdfunding platforms to clarify the perception that certain platforms create in the minds of actors of this novel system including entrepreneurs as potential project creators, funders/investors and managers of other platforms. In addition, a positioning strategy that ensures competitive superiority is a key point to the success of a company or a brand (platform here) (Wen and Yeh, 2010). Crowdfunding platforms that properly build their positioning strategy against their competitors can take advantages by differentiating their attributes from other platforms. Positioning map can be used by platform managers to discover gaps in the market and guide their activities. In this study, platforms are displayed as points assessed based on two distinct attributes as dimensions shown in the positioning map (Figure 1). These main dimensions offered by authors of this study to conceptualize positioning of the crowdfunding platforms are the level of complexity based on regulatory procedures and the level of expertise based on project categories. Since Turkey was selected as an emerging market case in this study, all types of crowdfunding models cannot be displayed in a positioning map. As a result of the upcoming legal crowdfunding arrangement in Turkey in which lending-based crowdfunding is forbidden, there is no platform adopting lending-based crowdfunding model. Besides, equity-based crowdfunding platforms that have not actively operated in Turkey due to incomplete legislation process are displayed based on information that is provided through their beta-version websites and declarations of platform managers about the objectives of their platforms.
The first dimension of the positioning map, represented on the X-axis, is determined as the complexity level of regulatory procedures. Crowdfunding models have different levels of complexity concerning funding processes, procedures and regulatory arrangements related financial transaction structure (Hemer, 2011). While the donation-based model has the simplest procedure and process in comparison to the others, equity-based crowdfunding is the most complicated among all other kinds of models. Moreover, lending-based crowdfunding is more sophisticated than reward-based due to its tight capital acquiring mechanism. The X-axis of the positioning map provides critical insights about platforms such as a platform’s target market depending on the typology of project creators and funders, motivational aspect, the stage of entrepreneurial activity, the amount of capital need, the degree of risk perception and the type of funding mechanism. In the donation-based model including the simplest procedures, project creator of crowdfunding campaigns are mostly individuals, charities and non-profit organizations. Therefore, in the less sophisticated level, funders desire to help the (social) causes and philanthropy is the main motivation for funding. Despite non-financial characteristic of reward-based crowdfunding models, generally, some tangible rewards such as products produced as the outcome (i.e. a DIY tool, an album, or a gala ticket for a supported film) are delivered to funders in this model (Mollick, 2014). Although both lending-based and equity-based models are used to receive the maximum financial return, the degree of risk perception in equity-based crowdfunding model is more than of lending-based one (Kuppuswamy and Bayus, 2014). In general, while the level of complexity is increasing, the monetary return expectancy and risk perception are getting high from the funders’ perspective. In addition, less complex crowdfunding models are adopted in the early phases of entrepreneurial projects where less amount of capital is required (Braet, Spek and Pauwels, 2013). In fact, less sophisticated crowdfunding models can benefit from both “keep-it-all” funding mechanism which allows project creators to keep any amount of pledged money regardless of whether the funding goal is met at the end of project duration and the “all-or-nothing” funding mechanism where entrepreneurs target a certain amount of fund that must be raised within a project period and the creator gets no money unless the funding goal is not reached (Gerber et al., 2013).
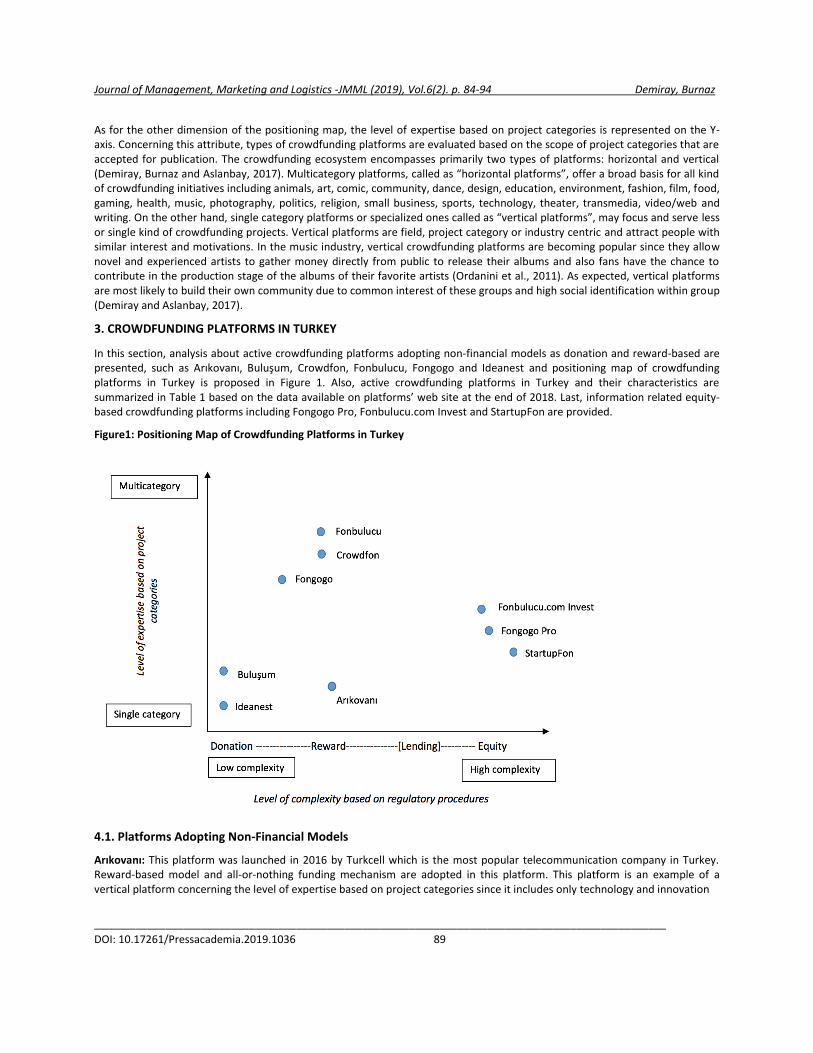
Journal of Management, Marketing and Logistics -JMML (2019), Vol.6(2). p. 84-94 Demiray, Burnaz
________________________________________________________________________________________________ DOI: 10.17261/Pressacademia.2019.1036 89
As for the other dimension of the positioning map, the level of expertise based on project categories is represented on the Y-axis. Concerning this attribute, types of crowdfunding platforms are evaluated based on the scope of project categories that are accepted for publication. The crowdfunding ecosystem encompasses primarily two types of platforms: horizontal and vertical (Demiray, Burnaz and Aslanbay, 2017). Multicategory platforms, called as “horizontal platforms”, offer a broad basis for all kind of crowdfunding initiatives including animals, art, comic, community, dance, design, education, environment, fashion, film, food, gaming, health, music, photography, politics, religion, small business, sports, technology, theater, transmedia, video/web and writing. On the other hand, single category platforms or specialized ones called as “vertical platforms”, may focus and serve less or single kind of crowdfunding projects. Vertical platforms are field, project category or industry centric and attract people with similar interest and motivations. In the music industry, vertical crowdfunding platforms are becoming popular since they allow novel and experienced artists to gather money directly from public to release their albums and also fans have the chance to contribute in the production stage of the albums of their favorite artists (Ordanini et al., 2011). As expected, vertical platforms are most likely to build their own community due to common interest of these groups and high social identification within group (Demiray and Aslanbay, 2017).
3. CROWDFUNDING PLATFORMS IN TURKEY
In this section, analysis about active crowdfunding platforms adopting non-financial models as donation and reward-based are presented, such as Arıkovanı, Buluşum, Crowdfon, Fonbulucu, Fongogo and Ideanest and positioning map of crowdfunding platforms in Turkey is proposed in Figure 1. Also, active crowdfunding platforms in Turkey and their characteristics are summarized in Table 1 based on the data available on platforms’ web site at the end of 2018. Last, information related equity-based crowdfunding platforms including Fongogo Pro, Fonbulucu.com Invest and StartupFon are provided.
Figure1: Positioning Map of Crowdfunding Platforms in Turkey
4.1. Platforms Adopting Non-Financial Models
Arıkovanı: This platform was launched in 2016 by Turkcell which is the most popular telecommunication company in Turkey. Reward-based model and all-or-nothing funding mechanism are adopted in this platform. This platform is an example of a vertical platform concerning the level of expertise based on project categories since it includes only technology and innovation

Journal of Management, Marketing and Logistics -JMML (2019), Vol.6(2). p. 84-94 Demiray, Burnaz
________________________________________________________________________________________________ DOI: 10.17261/Pressacademia.2019.1036 90
focused projects with prototypes and targeting end users are accepted. As of at the end of 2018, 34 projects were successfully funded out of 66 launched initiatives and approximately TL 4,600,000 has been raised (Ertopuz, 2018). ApeX Drone project, the most successfully funded crowdfunding project in Turkey, was launched through Arıkovanı and raised TL 783,955. This crowdfunding platform is ranked number one in terms of total funding volume in Turkey.
Buluşum: This platform was launched in 2015 by Boyner Foundation where donation-based model and “keep it all” funding mechanism are used. It is a vertical platform which concentrates on social entrepreneurship and projects offering public good. Twelve projects were successfully funded out of 14 published campaigns and TL 288,300 have been collected as of today.
Crowdfon: Although Crowdfon was officially launched in 2013, it is identified as the oldest platform since it purchased the first crowdfunding platform, established in 2010, called ‘Projemefon’ and changed its name to Crowdfon. Reward-based model and all-or-nothing funding mechanism are adopted in this platform which represents an example of the horizontal platform since it has ten project categories including art, technology, film and video, photography, music, publishing, design, environment and mobile. Eighteen projects were successfully funded out of 185 launched initiatives and almost TL 84,000 have been raised by 2017 (Çubukçu, 2017).
Fonbulucu: Fonbulucu, launched in 2017, is a reward-based crowdfunding platform. It has multiple funding mechanisms such that ‘all-or-nothing’ and ‘keep it all’ are used by project creators. While ‘all-or-nothing’ campaigns are published by individuals and companies, ‘keep it all’ option is offered for non-profit organizations. This platform is an example of horizontal platform and located as the least specialized in the positioning map (shown in Figure 1) since it has 15 project categories including energy, animals, science and technology, design, education, environment, health, women plus, sports, culture and art, film, music, publishing and social responsibility. Concerning the project categories, science and technology have the largest percentage with 18%, followed by social responsibility with 13%, culture and art with 10%. Eleven projects were successfully completed out of 24 published campaigns and TL 283,740 have been pledged.
Fongogo: The platform, founded in 2013, adopts both reward- and donation-based models. While reward-based crowdfunding campaigns with ‘all-or-nothing’ funding mechanism are launched by individuals and companies, donation-based ones with ‘keep it all’ funding mechanism can be used by non-profit organizations. Although it represents an example of the horizontal platform due to its wide range of project categories including environment, dance, education, film, food, culture and art, music, health, sports, design and architecture, technology and tourism, film category is the most outstanding one among all categories which constitute almost 40% of published projects. It can be seen that the platform is gaining expertise in the film category and is increasing its popularity by promoting the growth of this category. Also, Fongogo makes a significant contribution to the film industry by enabling filmmakers to realize their projects. Especially, producers of many short films and documentaries find the opportunity to attend national and international festivals and win prizes. By the end of 2018, 130 projects have been successfully completed out of 422 published campaigns, TL 2,444,599 has been raised, 12,232 people have supported a single project and there are 25,655 members in this platform. Fongogo is the largest platform in terms of quantity of campaigns launched and the number of members in Turkey.
Ideanest: This platform in which donation-based model and ‘keep it all’ funding mechanisms are used, was launched in 2017 by TTGV (Technology Development Foundation in Turkey). It is a pure vertical platform which focuses on technological projects offering public good. Indeed, early stage technological and innovative initiative even in idea generation and research phase can be launched in this platform. Nine projects were successfully funded out of 10 published campaigns and TL 335,154 have been collected as of today.

Journal of Management, Marketing and Logistics -JMML (2019), Vol.6(2). p. 84-94 Demiray, Burnaz
________________________________________________________________________________________________ DOI: 10.17261/Pressacademia.2019.1036 91
Table1: Active Crowdfunding Platforms in Turkey and Their Characteristics
Platform Date of
Inception Crowdfunding
Model Number of Launched
Projects Number of Successfully
Funded Projects Total Raised (1000 TL)
Arıkovanı 2016 Reward-based 66 34 4,600
Buluşum 2015 Donation-based 14 12 288
Crowdfon 2013 Reward-based 185 18 84
Fonbulucu 2017 Reward-based 24 11 284
Fongogo 2013 Donation and Reward-based
422 130 2,447
Ideanest 2017 Donation-based 10 9 335
4.2. Equity-based Crowdfunding Platforms
As the crowdfunding market develops, a few equity-based crowdfunding platforms have been informally established and are looking forward to the finalization of the legal process of Equity-Based Crowdfunding by Capital Market Board in Turkey. These platforms are FongogoPro, Fonbulucu.com Invest and StartupFon which are expected to launch officially their operations soon.
Fongogo Pro: Fongogo Pro will operate as equity-based crowdfunding platform. The managers of Fongogo Pro have a great crowdfunding experience which comes from operating Fongogo platforms for a long time. They intend to use their current members to provide market penetration concerning this newly emerging crowdfunding model in Turkey. In addition, they get into partnerships with many seeds and early stage incubation centers, universities and angel investor networks to attract entrepreneurs, individuals, non-qualified and qualified investors. The platform believes that everyone has the opportunity to become an angel investor and therefore aims to target individuals as potential funders who want to use their savings.
Fonbulucu.com Invest: This platform is the equity-based version of Fonbulucu.com which is reward-based crowdfunding platform. The managers of this platform consider that equity-based crowdfunding democratizes financing industry from perspectives of both entrepreneurs and investors to support the collective financial system. This platform aims to offer a marketplace to bring together project creators who seek investors and funders who want to get a financial return with a small amount of capital. In fact, the platform intends to actualize a culturally traditional collective concept in helping (called ‘imece’) in the scope of equity-based framework and even aims to attract savings of housewives to make real the dreams of entrepreneurs. That is why this platform is located as less specialized in the positioning map (illustrated in Figure 1) among current equity-based crowdfunding platforms in Turkey.
StartupFon: This platform is launched by Istanbul Startup Angels, which is an accredited angel investment network established in 2012. The managers of the platform propose to transfer offline investor community to online settings. This may be seen as an important competitive advantage since digitalization enables traditional angel investor community to increase its effectiveness and to be able to access more successful entrepreneurs by having less operational costs without geographic constraints. This platform has a project evaluation process ranging from 3 to 6 months and if the project is accepted by at least three qualified investors, it can be launched in the platform. Therefore, this detailed due diligence process will take more time compared to other equity-based crowdfunding platforms. The platform aims to concentrate on technological projects such as software, high-tech, blockchain, AI, IoT and mobile which are in their seed or early investment stage. The platform is planning to make investments to more than a hundred startups with approximately $30 million in funding volume within 5 years. The platform has almost 250 members and targets potential angel investors and managers in traditional companies. In addition, the platform offers individuals, who have not enough knowledge about startup investment, an option called common investment funding in which certain start-ups are selected by StartupFon (Çıracı, 2019). Therefore, this platform is located in the area of less expertise project category and more sophisticated procedures in the positioning map (shown in Figure 1).
Journal of Management, Marketing and Logistics -JMML (2019), Vol.6(2). p. 84-94 Demiray, Burnaz
________________________________________________________________________________________________ DOI: 10.17261/Pressacademia.2019.1036 92
5.CONCLUSION
Crowdfunding, as a novel form of funding mechanism for supporting creativity, innovation and entrepreneurship, has gained an increasing popularity. Crowdfunding market has expanded due to evolving legal arrangements around the world. Crowdfunding platforms are critical components of this market growth. This study aims to introduce key success factors that contribute to platforms in gaining competitive advantage by proposing a positioning map in an emerging market. This paper proposes two significant attributes to generate a map that demonstrates the relative positioning of crowdfunding platforms in a developing market. Crowdfunding market in Turkey is investigated as a case where entrepreneurship ecosystem has rapidly improved and legal regulations relating this novel funding system have been enacted. This study intends to make theoretical and managerial contributions to not only crowdfunding knowledge but also marketing and entrepreneurship literatures. Introducing the positioning of the crowdfunding platforms into crowdfunding literature broadens this phenomenon and contributes to the development of platforms’ assessment criteria by providing better understands about crowdfunding market segments and identifying target markets of the platforms. Also, positioning map of a certain crowdfunding market presents a holistic view for the current and potential actors of the crowdfunding market including platform managers, project creators and funders. Two main features of this novel funding system are offered as dimensions of positioning map in this study: level of complexity based on regulatory procedures and level of expertise based on project categories. The first dimension has a strong relationship with crowdfunding models since regulatory arrangements are primarily applied based on crowdfunding models. Also, this dimension gives clues about motivational factors, funding mechanism, risk perception, the phase in the enterprise life cycle and amount of money required. Whereas creators who have early stage entrepreneurial projects that need less amount of capital can use platforms in the low complexity level based on regulatory procedures, funders who are willing to take high risk and also have high monetary return expectancy can be targeted by platforms in the high level of complexity. When it comes to the other dimension, platforms that serve in multicategory level (horizontal) might have more volume compared to ones that operate as less or single category (vertical) platform. However, single category platforms like Arıkovanı in Turkey might have the opportunity to build a community having similar interest (e.g. technology focused) and high level of identification within the group. It can be foreseen that the smaller crowdfunding platforms are the more expertise based on project categories they will possess and be able to distinguish themselves among other platforms in the market. Platform managers who desire to develop their positioning strategy upon gaps in the crowdfunding market by differentiating their features in order to get advantages over their rivals can benefit from the proposed positioning map analysis. Moreover, project creators, entrepreneurs or start-ups can choose the most suitable platform for their crowdfunding campaign to be able to access the proper potential supporters. Thanks to the positioning map, perception of the supporters about the platform can be managed easily and decision making processes of funders can be facilitated. For instance, if a supporter has high level of monetary return and is willing to pay a high amount of capital, he/she can engage in the appropriate crowdfunding platform on the right side of the positioning map.
This study has a few limitations. First, this study only concentrates on one crowdfunding market. Also, the positoning map cannot include all kind of crowdfunding models since lending-based crowdfunding is illegal in Turkey. Last, due to evolving regulatory crowdfunding structure in Turkey, features of the equity-based platforms, which should not officially be launched, were determined based on platforms’ own web sites that are in beta version and declaration of the managers rather than collecting primary data on their crowdfunding activities. Future research might be conducted to reveal the continuing expansion of the crowdfunding economy in an emerging market since it is expected that the number of equity-based crowdfunding platforms and the total crowdfunding market size have rapidly increased as a result of developing legal regulations and growing attention of financial market actors in Turkey. In addition, further research is essential because this regulated market, which plays a role on the penetration and acceptance of donation and reward-based platforms, might have a positive impact on the increase of the number of such platforms, hence, the positioning of the existing platforms may shift depending on their strategy.
Acknowledgment: Melek Demiray gratefully acknowledges financial support from the Scientific and Technological Research Council of Turkey (TUBITAK) under the program 2214/A.

Journal of Management, Marketing and Logistics -JMML (2019), Vol.6(2). p. 84-94 Demiray, Burnaz
________________________________________________________________________________________________ DOI: 10.17261/Pressacademia.2019.1036 93
REFERENCES
Aaker, D.A. (1996), Building Strong Brands, The Free Press, New York, NY.
Ahlers, G. K. C., Cumming, D. J., Guenther, C. and Schweizer, D. (2012). Signaling in equity crowdfunding. Retrieved from http://ssrn.com/abstract=2161587
Belleflamme, P., Lambert, T.and Schwienbacher, A. (2014). Crowdfunding: Tapping the right crowd. Journal of Business Venturing, 29(5), 585–609. doi:10.1016/j.jbusvent.2013.07.003
Bradford, C. S. (2012). Crowdfunding and the Federal Securities Laws. Columbia Business Law Review, 1, 1–150.
Braet, O., Spek, S. and Pauwels, C. (2013). Crowdfunding the movies: A Business Analysis of Crowdfinanced Moviemaking in Small Geographical Markets. Journal of Media Business Studies, 10(1), 1–23. doi:10.1080/16522354.2013.11073557
Bretschneider, U., Knaub, K. and Wieck, E. (2014). Motivations for crowdfunding: What drives the crowd to invest in start-ups? Twenty Second European Conference on Information Systems.
Buysere, K. D., Gajda, O., Kleverlaan, R. and Marom, D. (2012). A framework for European crowdfund- ing. Retrieved from www.crowdfundingframework.eu
Cholakova, M.and Clarysse, B. (2015). Does the possibility to make equity investments in crowd- funding projects crowd out reward-based investments?. Entrepreneurship Theory and Practice, 145-172.
Crowdfunding Industry Report. (2013). Retrieved from http://www.buzzacott.co.uk/getattach- ment/a4e47539-1038-40c9-b90d-8709e3f4e4f/crowdfunding-industry-report-1.pdf.aspx
Crowdfunding’s Potential for the Developing World. (2013). infoDev, Finance and Private Sector Development Department. Washington, DC: World Bank.
Çıracı, G. (2019). Erken aşama yatırımcılık nedir? Retrieved from https://www.youtube.com/watch?v=TrKL3Mq5s9Eandfeature=youtu.be
Çubukçu, C. (2017). Kitlesel fonlama: Türkiye’deki kitlesel fonlama platformları üzerinden bir değerlendirme, Girişimcilik ve İnovasyon Yönetimi Dergisi, 6(2), 155-172.
Demiray, M. and Aslanbay, Y. (2017). The crowdfunding communities and the value of identification for sustainability of co-creation. In Crowdfunding for Sustainable Entrepreneurship and Innovation (pp. 155-174). IGI Global.
Demiray, M., Burnaz, S. and Aslanbay, Y. (2017). The crowdfunding market, models, platforms and projects. In Crowdfunding for Sustainable Entrepreneurship and Innovation (pp. 90-126). IGI Global.
Ertopuz, A. (2018) Turkcell, Girişimcileri 4,6 Milyon Tl Fonla Buluşturdu Retrieved from https://www.arti49.com/turkcell-girisimcileri-46-milyon-tl-fonla-bulusturdu-1388334h.htm
European Commission Report (2013). Crowdfunding innovative ventures in Europe - The financial ecosystem and regulatory landscape (Final Report). Retrieved from https://ec.europa.eu/digitalagenda/en/news/crowdfunding-innovative-ventures-europe-financial-ecosystem-and-regulatorylandscape-smart
Gerber, E. M., Hui, J. S. and Kuo, P. Y. (2013). Crowdfunding: Why people are motivated to post and fund Projects on crowdfunding platforms. Retrieved from http://www.juliehui.org/wp-content/uploads/2013/04/CSCW_Crowdfunding_Final.pdf
Global Entrepreneurship Index Report. (2017) Retrieved from https://thegedi.org/wp-content/uploads/dlm_uploads/2017/11/GEI-2018-1.pdf
Global Entrepreneurship Monitor Report. (2019). Retrieved from https://www.gemconsortium.org/report/50213
Hemer, J. (2011). A snapshot on crowdfunding. Working papers firms and region, No. R2/2011. Retrieved from http://hdl.handle.net/10419/52302
Heminway, J. M. and Hoffman, S. R. (2010). Proceed at your peril: crowdfunding and the securities act of 1933. Tenn. L. Rev., 78, 879.
Hooley, G., Piercy, N.F. and Nicoulaud, B. (2008), Marketing Strategy and Competitive Positioning, FT Prentice Hall, Harlow.
Kapferer, J.N. (2012), The New Strategic Brand Management, Kogan Page, London.
Keller, K.L. (2012), Strategic Brand Management, FT Prentice-Hall, Upper Saddle River, NJ.
Kirby, E. and Worner, S. (2014). Crowdfunding: An infant industry growing fast. Staff Working Paper of the International Organisation of Securities Commissions Research Department. Retrieved from http://www.memofin.fr/uploads/library/pdf/Crowd-funding-An-Infant-Industry-Growing- Fast[1].pdf
Journal of Management, Marketing and Logistics -JMML (2019), Vol.6(2). p. 84-94 Demiray, Burnaz
________________________________________________________________________________________________ DOI: 10.17261/Pressacademia.2019.1036 94
Kuppuswamy, V. and Bayus, B. L. (2014). Crowdfunding Creative Ideas: The Dynamics of Project Backers in Kickstarter. UNC Kenan-Flagler Research Paper. Retrieved from http://funginstitute. berkeley.edu/wp-content/uploads/2013/11/Crowdfunding_Creative_Ideas.pdf
Kuti, M. and Madarasz, G. (2014). Crowdfunding. Public Finance Quarterly, 3, 355–366.
Macht, S. A. and Weatherston, J. (2014). The benefits of online crowdfunding for fund-seeking business ventures. Strategic Change, 23(1-2), 1–14. doi:10.1002/jsc.1955
Marom, D. and Sade, O. (2014). Are the life and death of an early stage venture indeed in the power of the tongue? Lessons from online crowdfunding pitches. Retrieved from http://www. researchgate.net/publication/256060198
Massolution’s 2015 CF Industry Report (2015). Retrieved from http://www.crowdsourc- ing.org/editorial/global-crowdfunding-market-to-reach-344b-in-2015-predicts-massolutions-2015cf- industry-report/45376
Meric, J., Bouiass, K. and Maque, I. (2015). More than three’s a crowd... in the best interest of companies: Crowdfunding as zeitgeist or ideology? Society and Business Review, 10(1), 23–39. doi:10.1108/ SBR-09-2014-0042
Milosevic, M. (2015). Crowdfunding as an innovation booster factor and its dependence on information systems. Retrieved from https://hal-paris1.archives-ouvertes.fr/hal-01158238/document
Mitra, D. (2012). The role of crowdfunding in entrepreneurial finance. Delhi Business Review, 13(2), 67–72.
Mollick, E. (2014). The dynamics of crowdfunding: An exploratory study. Journal of Business Venturing, 29(1), 1–16. doi:10.1016/j.jbusvent.2013.06.005
Ordanini, A., Miceli, L., Pizzetti, M. and Parasuraman, A. (2011). Crowdfunding: Transforming customers into investors through innovative service platforms. Journal of Service Management, 22(4), 443–470. doi:10.1108/09564231111155079
Porter, M.E. (1996), “What is strategy?”, Harvard Business Review, Vol. 74 No. 6, pp. 61-78.
Startups.watch. (2019). Türkiye Girişim Ekosistemi 2018/2019 Raporu. Retrieved from https://startups.watch
Statistica. (2017). Crowdfunding volume worldwide in 2017, by type. Retrieved from https://www.statista.com/statistics/946668/global-crowdfunding-volume-worldwide-by-type/
Technavio. (2018). Global Crowdfunding Market 2018-2022. Retrieved from https://www.technavio.com/report/global-crowdfunding-market-analysis-share?ctrly
Unsal, S. (2017). Kitlesel Fonlama: İş Yapma Yöntemini Değiştirecek Yeni Sistem, İstanbul, Ceres Yayınevi.
Wen, C. H. and Yeh, W. Y. (2010). Positioning of international air passenger carriers using multidimensional scaling and correspondence analysis. Transportation Journal, 7-23.
https://arikovani.com/
https://ideanest.org/
https://fonbulucu.com/
https://invest.fonbulucu.com/
https://startupfon.com/
https://www.bulusum.biz/
https://www.crowdfon.com/
https://www.fongogo.com/
https://www.fongogopro.com/
http://www.spk.gov.tr/Duyuru/Goster/20190103/0

Journal of Management, Marketing and Logistics -JMML (2019), Vol.6(2) p.95-102 Serifsoy, Ferman
_____________________________________________________________________________________________________ DOI: 10.17261/Pressacademia.2019.1037 95
LOCALIZATION BASED DYNAMICS IN THE RENEWABLE ENERGY SECTOR DOI: 10.17261/Pressacademia.2019.1037 JMML- V.6-ISS.2-2019(4)-p.95-102 Anil Serifsoy1, Murat Ferman2 1Işık University, Maslak Campus, Istanbul, Turkey. [email protected] ORCID: 0000-0002-7930-8045 2Beykent University, Maslak, Istanbul, Turkey. [email protected] ORCID: 0000-0003-4019-0219
Date Received: May 1, 2019 Date Accepted: June 19, 2019
To cite this document Serifsoy, A., Ferman, M. (2019). Localization based dynamics in the renewable energy sector. Journal of Management, Marketing and Logistics (JMML), V.6(2), p.95-102, DOI: 10.17261/Pressacademia.2019.1037
Permemant link to this document: http://doi.org/10.17261/Pressacademia.2019.1037 Copyright: Published by PressAcademia and limited licenced re-use rights only.
ABSTRACT Purpose - This paper examines the upwards trend of utilizing localization as a strategy by Multinational Enterprises in the energy sector. It is a sector that is driven by the governments, due to the ever-growing need for survivability and sustainability in a world increasingly dependent on energy. Methodology - In-depth interview is the chosen method to obtain the critical opinions of small number of respondents who play a crucial role for decision-making in a leading company that prefers to utilize localization. This data is collated into a content analysis to determine the factors influencing it. Findings- Localization from a global company engaging in renewable energy sector can be desirable, and indeed, profitable, insomuch as the right conditions outlined by the interviewees are created. Conclusion- It is the intent of the author to build the first step of a guide to attract more positive attention from MNEs to encourage more technology transfer.
Keywords: Renewable energy, multinational corporation strategies, localization, government policies JEL Codes: M38, F13, P28
1. INTRODUCTION
Globalization strategy has been one of the most important strategies of the Multinational Enterprises (henceforth MNEs) for years. The term international strategy has been more concerned with the article of “The Globalization of Markets” by Theodore Levitt. Thodore Levitt, who coined the term globalization (Feder, 2006), explains the importance of the global strategies that should be applied by the MNEs focusing on the permanent growth. “Which strategy is better is not a matter of opinion but of necessity” (Levitt, 1983). Albeit not easy to implement, these strategies are vital enough for these MNEs to take the risk and spend their resources to improve their financial and non-financial conditions or even for survival in the harsh market environment. With the help of easier international business and less economic obstacles between the countries let MNEs that aimed higher expand their potential markets and allowed them to have more profit by not only making business in their own country but also worldwide. According to Sachs Goldman (2003) and Vaclav (2012) emerging markets such as BRIC countries would become more attractive for the MNEs located in developed markets. With the “expanding consumer bases, rising income level and gradual opening to global trade” the MNEs provide a better potential and guarantee their future successes (Maha , Ignat, & Maha , 2010). Along with this strategy, the great benefits provided with the localization make it more attractive and applicable for the MNEs. It has been argued that companies should emphasize localization strategies because adaptation to
Journal of Management, Marketing and Logistics -JMML (2019), Vol.6(2) p.95-102 Serifsoy, Ferman
_____________________________________________________________________________________________________ DOI: 10.17261/Pressacademia.2019.1037 96
local norms is essential for the success of a new subsidiary, and in this context numerous benefits have been attributed to localization in its various forms (Johri & Petison, 2008). Utilizing localization as a strategy has increased especially in the energy sector, due to the ever-growing need for survivability and sustainability. Energy is defined as something essential that cannot be substituted. With the developing technology and its irreplaceable products which causes all of us to dependent on them, energy becomes more essential every day. It has turned into a vital element that is impossible to survive in the absence of it. Therefore, governments have started to take energy needs into consideration when planning for the future and finding local sources of energy as well as managing them became a priority in this context (Pamir, 2005). Hence, to provide the required level of energy, not only MNEs but also governments have been working on the localization process for their energy needs. Following this framework, renewable energy production is a new trend to provide a clean and sustainable energy. It appeals to both the governments and entrepreneurs with a shorter pay-back time and longer lifetime of the investments, grabbing the attention of private and governmental sectors alike (Serifsoy, 2019). This article aims to be an exploratory study that showcases the dynamics of the localization strategy on the renewable energy sector. The MNEs’ strategies on the localization front will be examined through one of the more well-known companies in the sector; ABB. Its approach to localization in renewable energy sector and the governmental actions to prompt these responses will be highlighted. ABB as a company has had a long history in electrification and various other forms of energy production, as well as a documented preference for localization where it is possible, company interests permitting.
There are two different phases for the conducting of the research. The first phase is collecting all the necessary information about the energy market of Turkey and the governmental position on the renewable energy with relevant policies. Primary and secondary data is used in this stage to set the correct data. In the second stage, ABB is evaluated to ascertain how willing it is to comply with localization strategy in a new and developing market; Turkey having been selected as the case study. ABB executives who are directly involved and one of the determinants to achieve the success for the adaptation of the localization in the renewable energy market in Turkey, are interviewed to accomplish this objective. In-depth interview is the chosen method to get the critical opinions and the perspective of the small number of respondents who play a critical role for the determination of the strategy of the aforementioned MNE. This data is collated into a content analysis to determine the behavior of a giant in energy sector regarding localization. Also its counterpart, in this case the government, is examined as far as its behavior to ensure that localization occurs. As ABB’s inner dynamics when countered with the Turkish government’s approach regarding localization of renewable energy is examined in Serifsoy’s dissertation, one point remains partially incomplete: governmental predictions for attracting investment from MNEs.
This article highlights the actions for the governments to consider the steps that need to be taken to secure foreign investments coming through MNEs. Traditionally, governments offer incentives and tariffs to secure a MNEs interest in building plants and producing with locally sourced materials, immaterial of the sector. In renewable energy sector, through shedding light on the actions of ABB in regard to localization on this matter, this article is intended to be the first step of a guide for the government to take appropriate actions in the future concerning the particular matter of localization in renewable energy sector. While creating new regulations such as YEKA, understanding the preferences of MNEs and tailoring the incentives accordingly would, no doubt, bring forth more of the investment that is aimed through these programs.
2. DATA AND METHODOLOGY
With an inductive approach, the article aims to clarify the dynamics of the localization from different sources with different experiences. The strategy to have the data includes both primary and secondary. With the secondary data, the literature will be reviewed to get initial knowledge not only about the strategy but also about the market and the sector. The strategy that is used to get all the necessary data is determined as interview to get it from the primary sources. The most essential information is taken from the managers of a global company that experiences the localization strategy in many ways. Due to the limitation of the dedicated managers who play an active role in the decision-making stage of the localization strategy of the selected MNE, unstructured in-depth interview plays an important role to get all that essential information in detail. As it is mentioned in the Research Onion (Saunders, Lewis, & Thornhill, 2009), strategy should be defined to collect the required data. As it is an inductive study and the main aim is to create an exploratory research, survey is a good way to collect the data from the primary sources in detail. A structured short question and answer survey is not fully suitable to get all the information on this topic, because the main aim is to clarify the path of the localization strategy in renewable energy market and provide inductive approach. Unstructured interview is generally used for the exploratory studies to get more detailed information instead of receiving short answers for the same questions. Instead of the quantity of the informants, quality matters to get the correct information. The information is taken from the experienced informants by asking the questions according to the answers. Even though the main

Journal of Management, Marketing and Logistics -JMML (2019), Vol.6(2) p.95-102 Serifsoy, Ferman
_____________________________________________________________________________________________________ DOI: 10.17261/Pressacademia.2019.1037 97
idea underneath the questions are similar, they vary. Although the interview is unstructured, and it needs to be like a face to face conversation, some processes should be covered in advance.
The in-depth interviews that were conducted with the aforementioned managers occupying both global and local positions in ABB, as well as a governmental employee of Turkish Republic, are collated into Tables 1 through 3 that are displayed below. These executives are selected for the interviews due to the positions they occupy in ABB hierarchy, both on a local and on a global level. Of the seven executives that are interviewed, all of them have localization experience on multiple levels on multiple fronts. The executives that report to a global level, explored as a section, have experiences that encompass multiple countries, such as Brazil and China, in their efforts of localization in renewable energy sector. Therefore, for them to analyze the compare Turkey’s policies that of the other countries’ in this sector is a crucial part of the article. It is one of the points that this article aims to prove that if the government indeed is looking for localization in the renewable energy sector; consequently, technology transfer, there are steps that need to be taken in accordance with these executives’ vast experiences in other countries in relevant positions. Tables 1 through 3 display the data gathered from the interviews to build the basis for later content analysis. In these tables, the information on the interviewees, such as their attitude towards renewable energy or what they consider success factors for strategies they applied in renewable energy sector are put into a matrix. These tables later on are turned into a seven part content analysis. The content collected from these interviews is divided into seven different categories across every interviewee with two sub-groups for each category in order to acquire a clear picture as to their concept of localization in renewable energy industry and in turn, as to how necessary they consider it is (Erlingsson & Brysiewicz, 2017). The implications inferred from each interview are gathered using the answers the interviewees have for the questions, defined in Appendix A, and the points they intersected are highlighted throughout this section using the categories as a template to formulate upon. In each category, the interviewees are divided into the sub-categories according to certain facts that have in common (e.g. the type of engineering degree each interviewee has, whether or not they are Turkish citizens, or the level of reporting they do in their respective organizations) as well as what can be inferred as common ground according to the answers they come up with to same type of questions that are indicative of their mindsets and the relative levels they occupy in management. The following parts explains in detail of all the seven categories and each sub category that they contain.
Table 1: Summary of Semi-Structured in-depth Interviews

Journal of Management, Marketing and Logistics -JMML (2019), Vol.6(2) p.95-102 Serifsoy, Ferman
_____________________________________________________________________________________________________ DOI: 10.17261/Pressacademia.2019.1037 98
Table 2: Summary of Semi-Structured in-depth Interviews
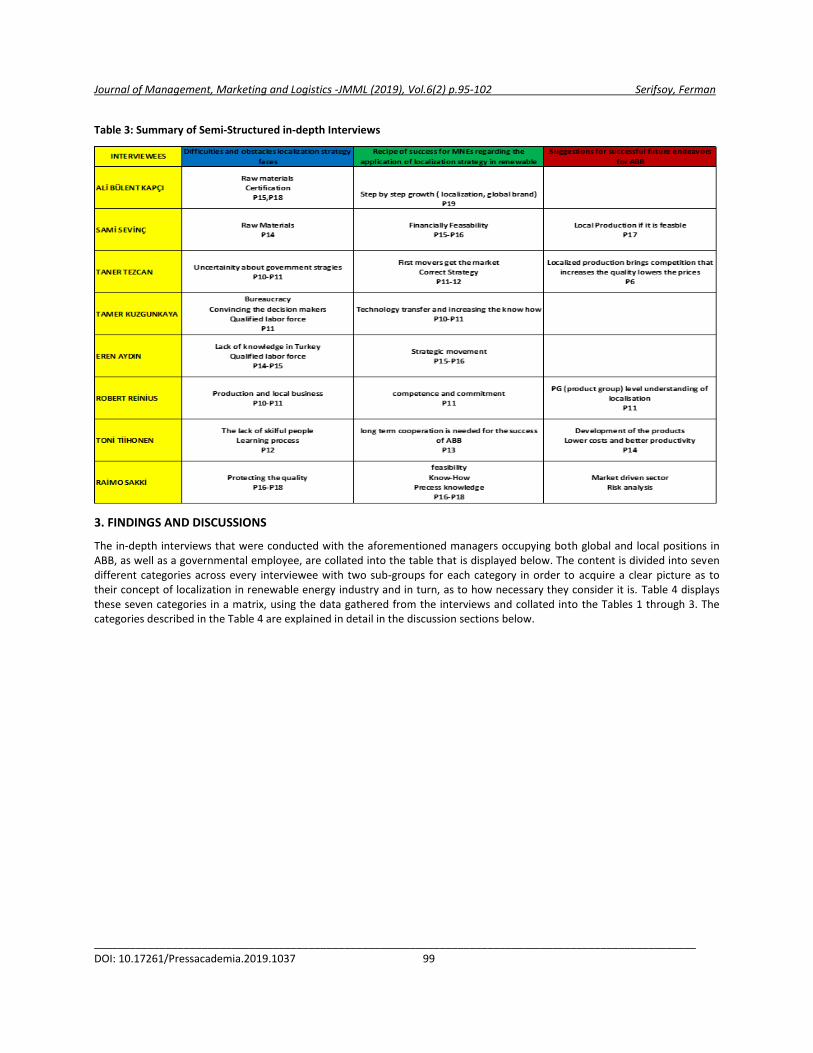
Journal of Management, Marketing and Logistics -JMML (2019), Vol.6(2) p.95-102 Serifsoy, Ferman
_____________________________________________________________________________________________________ DOI: 10.17261/Pressacademia.2019.1037 99
Table 3: Summary of Semi-Structured in-depth Interviews
3. FINDINGS AND DISCUSSIONS
The in-depth interviews that were conducted with the aforementioned managers occupying both global and local positions in ABB, as well as a governmental employee, are collated into the table that is displayed below. The content is divided into seven different categories across every interviewee with two sub-groups for each category in order to acquire a clear picture as to their concept of localization in renewable energy industry and in turn, as to how necessary they consider it is. Table 4 displays these seven categories in a matrix, using the data gathered from the interviews and collated into the Tables 1 through 3. The categories described in the Table 4 are explained in detail in the discussion sections below.

Journal of Management, Marketing and Logistics -JMML (2019), Vol.6(2) p.95-102 Serifsoy, Ferman
_____________________________________________________________________________________________________ DOI: 10.17261/Pressacademia.2019.1037 100
Table 4: Classification of Content Analysis
3.1. Schooling/Career Path
The first category indicates the department the executives of ABB, and the government employee have studied in and specialized on. Although all engineers in trade, the managers interviewed differ in the departments they graduated from and the topics they pursued later in their career paths. There are five electrical and or electrical/electronical engineers among the interviewees, with three of them following other career paths such as a mechanical engineering specialization. When examined, the interviews conducted by the five electrical and or electrical/electronical engineers display a tendency to focus on the more technical side of the job and being concerned with the productivity along with the technical specifications of the renewable energy issues. They are also the ones that have a more in-depth insight into renewable energy types and appear to discuss the individual categories of wind, geothermal, solar, etc. energy more in detail. Of the three that have chosen to follow career paths other than electrical and/or electrical engineering display a readier broader focus on renewable energy in general, rather than the energy types and various technical focal points that inevitably arise.
3.2. Level of Reporting
The interviewees’ level of reporting was chosen as the second category to analyze the date gathered in the in-depth interviews. Four of them work on a global scale rather than local, and as such, their primary reporting is done on a global basis. The other four have positions that place them firmly within a certain country’s purview, in this case Turkey both for the ABB employees interviewed and the YEGEM one. The differences in the reporting levels also demonstrate the angle they could look at the various issues regarding localization question in renewable energy. The ones that work on a global level tend to look at the bigger picture, with a broader understanding about how bottom line needs to be maintained in a company, as well as being concerned about the potential losses that said company might suffer from in case of any mishaps regarding any technological transfers, which have happened before as it was outlined on the China example of localization on renewable energy by Sakki. In layperson’s terms, one might even say that the managers that are positioned more globally and higher up the food chain as it were, have a less emotional outlook into losses and gains both for the country that localization would happen –in this case Turkey- and the company in question, which happens to be ABB. The managers that have more local positions, i.e. reporting to superiors still within the hierarchy of a specific country (in this case Turkey, such as Tezcan or Aydın) tend to have a perspective that supports technology transfer in order to have Turkey gain more in long term. With this in mind, they support localization outright for the development of highly technological products manufacturing as it will help the country to reach its industrial aims of becoming more independent with locally sourced and produced goods.

Journal of Management, Marketing and Logistics -JMML (2019), Vol.6(2) p.95-102 Serifsoy, Ferman
_____________________________________________________________________________________________________ DOI: 10.17261/Pressacademia.2019.1037 101
3.3. Nationality of The Interviewees
The third category to be discussed in detail is whether these managers are Turkish or foreigners. This affects the approach to localization. Turkish people naturally have more at stake for benefact the country’s industrialization process, while the foreigners gravitate to a more neutral perspective that favors whatever would help the company financially. So, if profitable, localization would be pursued by this category, and not just because it is seen as a good thing for Turkish industry. As opposed to this less emotional viewpoint, the Turkish managers in general (other than Sami Sevinç, who by the virtue of his more global position has a broader outlook into business) uniformly support the localization efforts.
3.4. Place of Employment
There are seven managers employed by ABB in the interview roster, while one interviewee is employed in a governmental institution. Kapçı, as a governmental employee, unilaterally is in favor of localization. In fact, none of the other interviewees’ words on the topic rival his emphasizing of the issue. The ABB managers, in contrast, while in favor of localization to certain extent (depending on the other factors such as the global/local positioning on the company hierarchy) while still being concerned with the bottom line for the company and other financial constructs inherent in running a business. Also, technology transfer is still considered an issue by ABB managers, independent from the side of the line they stand regarding the situation. For instance, for Sakki, technology transfer presents a real complication in localization efforts; but remaining ABB managers, through different degrees, are cautiously optimistic or outright in favor of localization.
3.5. Relative Levels of The Executives
Another category is chosen as the level of the executives that conducted the interviews. While similar in nature to the second category, this one separates itself from the other categories by offering insight into the perspective of managers by examining their relative advancements in management. High level executives would have been thought to offer less support for localization, as they tend to look into matters more broadly and less emotionally, while more of a medium level executive would have been thought to have a more biased look due to not being able to see the bigger picture. The outliers here are Tiihonen and Tezcan, seemingly departing from the level in management and the correlation it has with the supporting of localization. A higher-level executive, Mr. Tezcan is firmly in the corner of the localization, while Tiihonen has more of a neutral outlook that cautiously supports it, as long as it does not interfere with the profitability of the company. These outliers could be linked to the nationalities of the men in question. As mentioned in the third category, the nationality tends to affect one’s outlook into localization and its effects on the host country, whereas Tiihonen’s being a global level manager effects his perspective of localization, as depicted in the second category.
3.6. Mindset of Executives
The sixth category shows the difference in thinking for the executives. The kind of mindset they have carry into their perspective on localization. The managers with more technical mindset, focusing more on the technical aspects of the renewable energy production as well as its types are equally divided in number with the ones that have more of a managerial mindset that necessitates a different response. Again, in this category Sakki appears to be an outlier, supporting localization less optimistically than the rest of the executives with technical mindset, which can be linked back to him being a foreigner and a global level executive more than anything else. As for Kapçı, despite being more managerial in his attitude than the rest, he fervently supports localization, which still is very much in tune with him being a government employee and his nationality.
3.7. Focus on the Renewable Energy
The last category to be discussed is the focus of the interviewees into renewable energy as a whole. While three executives have chosen renewable energy as a career path, five of them are still using their expertise on other fields as well and this reflects in their approach to the localization. The ones that focus on renewable energy exclusively have a narrower focus, resulting a corresponding narrower perspective. For them, it is more about the market and becoming a supplier for everyone than investing in a country as an individual company that has bids in the local renewable energy projects. The executives who have not followed renewable energy as a career path but are at the forefront of running parts of a company that does get involved in it have a broader vision regarding the topic. They are not just concerned with the sales but also government regulations, investment opportunities and energy politics. From careful review of the existing literature on the subject and the analysis conducted on the contents of the interviews, it can be inferred that localization is found beneficial for MNEs under right conditions. When it is implemented as intended, the strategy can bring immense benefit to a company, as it is considered by the executives of ABB. Nevertheless, it is conditional, not absolute, and does not have de facto set rules of application that can be
Journal of Management, Marketing and Logistics -JMML (2019), Vol.6(2) p.95-102 Serifsoy, Ferman
_____________________________________________________________________________________________________ DOI: 10.17261/Pressacademia.2019.1037 102
implemented in every country by every company, hence the cautious but optimistic answer from most of the interviewees as “yes, if profitable”. The conditions under which the profitability is achieved are covered in the sections for the categories the interviewees and their views are examined. While literature showcases that localization, when applied correctly, can bring out a lot of benefits; as a contrast, the executives interviewed have varied in their answers. While the ones that report on a local level have answered with a resounding yes, the global level executives employed a more cautious outlook and identified the special conditions where engaging in localization prove to be beneficial to their company. The factors that encourage the MNEs to apply localization strategy have been extensively reviewed in the literature. The benefits of a steady and loyal supply chain, cost cutting due to employing local personnel, the flexibility achieved with local R&D are just but a few selected advantages that companies enjoy with well-applied localization strategy (Johri & Petison, 2008). The analysis of the interview content, while supporting these findings, also cautions against the pitfalls of localization, such as the loss of valuable R&D data and knowledgeable personnel via the inevitable technology transfer that Sakki emphasizes in his interview.
The disadvantages that localization brings about are a concern in regard to both the literature and the analysis of the interview content. The crucial points that the MNEs should be concerned with are clarified as the R&D and personnel loss, as well as the expatriates that work for the local branches in a different country. These issues, by and large, are touched upon the interviewees with more managerial mindset and those who report at a global level. Government policies affect the localization process in renewable energy sector greatly. With the incentives governments offer to MNEs comes the opportunity to thrive as a company, but there are documented drawbacks if the localization process is not undertaken carefully, and it has the potential to harm the company in different ways. All the managers interviewed also have mentioned the government policies and how it shapes the efforts of the MNEs structure when penetrating the market.
4. CONCLUSION
Localization from a global company engaging in renewable energy sector can be desirable, and indeed, profitable, insomuch as the right conditions outlined by the interviewees are created. In which sphere the company operates is needed to be constructed carefully to create the right conditions under which a company penetrates a market and establishes dominance thereof. These considerations that are established in the article are meant to become a guide for the future governmental decisions that are taken to encourage localization in renewable energy sector. As pointed out extensively by the interviewees, the governments are concerned with ensuring localization in renewable energy sector for a variety of reasons, most of which are tied with the need to bring much needed technology transfer and boosting local economy with the added labor. In order to achieve this aim, governments have an obligation to create ideal conditions under which global companies operate; so that they consider investing locally in a country. The best way to achieve this is seen as bringing out tariffs and other capitulations a country may provide global companies. And while this approach has seen a considerable amount of success in Turkey, the new tariff policies that are to be crafted after 2020 should be more in tune with the needs and requirements of MNEs that operate in this sector. This article, in this way, is intended as a first step of a guide for the government for policy making. To be able to attract more investment from global companies in the renewable energy sector and encourage more technology transfer despite the misgivings regarding the issue, the government should be more amenable to the perspective presented by the global companies. This topic will benefit from more analysis pertaining to the relation between the government policies and the private sector perspective, and further studies can shed light on the outline that the author of this article intends for the policy making in renewable energy sector.
Journal of Management, Marketing and Logistics -JMML (2019), Vol.6(2) p.95-102 Serifsoy, Ferman
_____________________________________________________________________________________________________ DOI: 10.17261/Pressacademia.2019.1037 103
REFERENCES
Ataseven, M. (2017, september 28). Rüzgâr Enerjisinin Geleceği ve YEKA. Türkiye Rüzgar Enerjisi Birliği.
Blazev, A. (2016). Global Energy Market Trends. The Fairmont Press, Inc.
Boyce, C., & Neale, P. (2006). Conducting In-Depth Interviews: A Guide for Designing and Conducting In-Depth Interviews for Evaluation Input. Pathfinder International.
Demirbaş, A. (2001). Energy balance, energy sources, energy policy, future developments and energy investments in Turkey.
Index, p. 5.
Erlingsson, C., & Brysiewicz, P. (2017). A hands-on Guide to Doing Content Analysis. ScienceDirect
Feder, B. J. (2006). Theodore Levitt, 81, Who Coined the Term 'Globalization', Is Dead. The New York Times.
Goldman, S. (2003). Dreaming with BRICs: The Path to 2050. Retrieved from http://www.goldmansachs.com/our-thinking/archive/brics-dream.html
GWEC. (2018, April). Global Wind Report. Annual Market Update.
İzgi, M. F. (2017, October). Renewable Energy Turkey. Retrieved from Renewable Energy Turkey: https://gettingthedealthrough.com/area/99/jurisdiction/54/renewable-energy-2018-turkey/
Johri, L. M., & Petison, P. (2008). Value-based localization localization strategies automobile subsidiaries in Thailand. International Journal of Emerging Markets, 141.
Levitt, T. (1983). The Globalization of Markets. Harward Business Review.
Maha , L., Ignat, I., & Maha , S. (2010). The impact of business localization on the international trade.
Pamir, N. (2005). "Enerji Politikaları ve Küresel Gelişmeler", Stratejik Analiz.
Saunders, M., Lewis, P., & Thornhill, A. (2009). Research Methods for Business Students.
Serifsoy, A. (2019, June). An Explatory Study on the Dynamics of Localization of Renewable Energy Industry Among the Managers of a Leading Company . İstanbul, Turkey.
Vaclav, K. (2012). Seeking real causes of the European crisis. A Journal of Public Policy
APPENDIX A: IN-DEPTH INTERVIEW PROTOCOL
An Explatory Study on the Dynamics of Localization of Renewable Energy Industry Among the Managers of a Leading Company. 1) Acknowledgement for the participation 2) Introducing the interviewer 3) General information about the interviewee 4) Main purpose of the study 5) Note Taking / Taping permission 6) Summary of renewable energy issue (why, how and how much) regarding the world and specifically Turkey 7) Attitude towards renewable energy use 8) Strategy of the governments for renewable energy (tariffs, incentives and projects) 9) Renewable energy and localization strategy 10) ABB’s approach to renewable energy issue 11) ABB’s approach to localization strategy regarding renewable energy 12) Positive and negative consequences of localization strategy 13) Measure of success factors 14) Difficulties and obstacles localization strategy faces 15) Recipe of success for MNEs regarding the application of localization strategy in renewable energy Suggestions for
successful future endeavors for ABB
Journal of Management, Marketing and Logistics -JMML (2019), Vol.6(2). p.103-127 Benli, Ferman
_____________________________________________________________________________________________________ DOI: 10.17261/Pressacademia.2019.1038 103
THE EFFECT OF CULTURAL DIMENSIONS ON CONSPICUOUS CONSUMPTION AND ONLINE COMPULSIVE BUYING BEHAVIOR: A COMPARATIVE STUDY AMONG TURKISH AND AMERICAN CONSUMERS DOI: 10.17261/Pressacademia.2019.1038 JMML- V.6-ISS.2-2019(5)-p.103 – 127 1 Berk Benli1, Murat Ferman2 Isik University, Maslak Campus, Istanbul, Turkey. [email protected] , ORCID: 0000-0002-7515-0623 2 Beykent University, Maslak, Istanbul, Turkey.
[email protected] , ORCID: 0000-0003-4019-0219
Date Received: May 17, 2019 Date Accepted: June 19, 2019
To cite this document Benli, B., Ferman, M. (2019). The effect of cultural dimensions on conspicuous consumption and online compulsive buying behavior: a comparative study among Turkish and American consumers. Journal of Management, Marketing and Logistics (JMML), V.6(2), p.103-127, DOI: 10.17261/Pressacademia.2019.1038 Permemant link to this document: http://doi.org/10.17261/Pressacademia.2019.1038 Copyright: Published by PressAcademia and limited licenced re-use rights only.
ABSTRACT Purpose - The study investigates the influence of cultural dimensions on the two important outcomes of today’s consumer society; conspicuous consumption and online compulsive buying behavior. Also, another aspect of this research is to see if conspicuous consumption orientation has connections with online compulsive buying behavior. Lastly, it attempts to show whether conspicuous consumption and online compulsive buying behavior varies across cultures and the role of demographics. Methodology - The study employed two samples from two nations (Turkey and The United States) that have distinct cultural orientations. 663 participants from Istanbul and 597 participants from Washington D.C were used in analysis. Findings - Based on the models tested in two samples, the findings show that collectivism, power distance and masculinity have significant effect on conspicuous consumption in both nations yet the most impactful cultural dimensions vary based on the nation. Also, it has been discovered that collectivism, power distance and uncertainty avoidance were in relation with online compulsive buying behavior in both nations yet masculinity was not. Finally, conspicuous consumption and online compulsive behavior were found to be positively correlated. Conclusion - The study contains valuable information and managerial implications for marketing professionals who want to implement different marketing strategies in different cultural setting. Future studies should focus on the link between cultural dimensions at the individual level and other important elements within consumer behavior literature such as impulse buying, brand loyalty, fashion orientation, advertisement and brand attitude.
Keywords: Conspicuous consumption, cultural dimensions, online compulsive buying behaviour JEL Codes: M30, M31
1. INTRODUCTION
Culture has been deemed a core mechanism that drive people’s behavioral patterns and the need for understanding consumer’s cultural orientations and their effects on consumer behavior becomes even more crucial every day. Conspicuous consumption and online compulsive buying behavior as the two important outcomes of today’s consumer society are becoming more prominent and their relations with cultural dimensions are yet to be examined thoroughly. Conspicuous Consumption has been considered as an unnecessary consumption that serves no purpose but today it became one of the main acts of everyday consumer society as the middle-class all around the world became wealthier and the income distribution became more even. On the other hand, online compulsive buying behavior has been getting a lot of attention in clinical studies since online shopping was
Journal of Management, Marketing and Logistics -JMML (2019), Vol.6(2). p.103-127 Benli, Ferman
_____________________________________________________________________________________________________ DOI: 10.17261/Pressacademia.2019.1038 104
introduced as another tool for consumption, however; its’ examination in marketing literature is lacking. Previous studies have focused only on one cultural dimension (individualism/collectivism) at the national level and lack the theoretical model that describes the relationship between each cultural dimension at the individual level and consumer’s conspicuous consumption orientation (CCO) and online compulsive buying behavior (OCBB). Also, compulsive buying behavior as a broader concept has been paid attention largely in psychological investigations and lacks the necessary focus in consumer behavior literature. The primary objective of the study is to understand the impact of cultural dimensions on two important outcomes of consumer society; conspicuous consumption and online compulsive buying behavior. Secondly, this study also aims to fill the gap in compulsive buying behavior literature by examining the relation between conspicuous consumption orientation and online compulsive buying behavior. Furthermore, the third purpose is to discover and compare the number of compulsive buyer among online consumers in Turkey and The United States. Lastly, the study examines whether cultural dimensions at the individual level, conspicuous consumption and online compulsive buying behavior varies across Turkish and American consumers and demonstrates if demographics such as gender, age, income and education has significance in consumer’s conspicuousness and compulsiveness. This study provides a valuable information for the academics and marketing professionals by filling the gap in the literature of cultural dimensions and its’ relation with conspicuous consumption and online compulsive buying behavior. The study also acts as the first cross-cultural comparison between two nations that encompasses culture, conspicuous consumption orientation and online compulsive buying behavior.
2. LITERATURE REVIEW
2.1. Conspicuous Consumption
Conspicuous consumption is a phrase very often used by economists, marketers, sociologists and psychologists; however, this phrase is frequently applied in a not very clearly expressed sense in order to explain any type of non-utilitarian consumers’ behavior, which is therefore valued as extravagant, luxurious, or wasteful (Campbell, 1995). However, the lack of appropriate and precise definition can be a result of lack of scientific empirical studies that examined conspicuous consumption and its correlates. The introduction of conspicuous consumption into scientific literature in the 19th century tells us that it is not a recent phenomenon; however, conspicuous consumption and its origins go much further into the past. More precisely, it was present in everyday lives of people from ancient civilizations such as Old Greece and Roman Empire, and it changed and evolved in parallel with political and economic systems (Memushi, 2013). Specifically, throughout the history, our society and the ways of producing things changed, and so did the definition of luxury goods; hence, although the conspicuous consumptions was the same in principle, its manifestation forms changed from one epoch to another (Chaudhuri & Majumdar, 2006). With the expansion of capitalistic production and values, the luxury goods became expensive products that were reserved for nobility and upper middle class. This group of products included diamonds, luxury cars, and other expensive and unique objects. The main drive for conspicuous consumption was still vanity and pretentiousness; however, its main goals were changed, and people engage in it to showcase their social power, status, and to stand out as unique in front of their reference group (Chaudhuri & Majumdar, 2006). Finally, in post-modern times (the late 20th and 21st century), image and experience became luxury goods. With the rise of educational level of an average person and social wealth, conspicuous consumption became available to the middle class and great “masses” of the people. The main motives for conspicuous consumption became self-actualization, self-expression, and self- image. However, the goal of conspicuous consumption became somewhat self-contradictory. More precisely, as Chaudhuri and Majumdar 2006 pointed out, today many people engage in conspicuous consumption to comply with the social norm of proving one’s own uniqueness to the world in order to prove them their value as a human being. On the other hand, some people do it because they do not want to be thought different and odd.
Some authors argued that conspicuous consumption is not only a form of consumers’ behavior but a deeper part of human nature and personality. More specifically, Vohra (2016) argued that conspicuous consumption is a stable personality trait that is significantly influenced by globalization, consumer demographics, and culture. In addition, an average conspicuous consumer tends to fit a particular personality profile, which consists of high materialism with high expression of possessiveness, non-generosity, and envy (Chacko and Ramanathan, 2015).Today, the most significant correlate of conspicuous consumption is social status display. More precisely, many people believe that social status influences and shapes one’s self-image; consequently, people tend to display it in order to present better self-image in front of other people and leave positive impression on them (Souiden, M’Saad, & Pons, 2011). This behavior is culturally universal and can be detected in both eastern and western countries. However, surprisingly, conspicuous consumption appears more often in individualistic or western cultures than in collective or eastern ones, which is contradictory to the discovery that show connection between social status display and self-image is significantly higher in collectivistic cultures (Souiden, et al., 2011). However, this contradiction can be explained with significant difference in socio-economic status between people from eastern and western countries. Specifically, conspicuous consumption
Journal of Management, Marketing and Logistics -JMML (2019), Vol.6(2). p.103-127 Benli, Ferman
_____________________________________________________________________________________________________ DOI: 10.17261/Pressacademia.2019.1038 105
is behavior that is in most of the cases displayed among the people from the middle class (Frank, 1999), and western countries are on average significantly richer than eastern countries; also the differences between the poor and the rich are lower in the western countries; hence, in terms of relative measures, a greater percentage of people in the western countries fells into the middle class group. In addition, the middle class in the western countries is significantly richer than the middle class in the eastern countries, which means that it has more disposable money for luxury and unnecessary goods.
As our society changed through the centuries, it influenced the relationship between gender, gender roles, and conspicuous consumption. Veblen’s work from the end of the 19th century showed that, at that time, a majority of women were more focused on their role to enhance social status of their husbands. Specifically, men earned the money that they gave to their wives who engaged themselves in conspicuous consumption so that they can be later used for presentation of social status of their husbands (Gilman, 1999). Hence, according to Veblen (1899), women’s consumption served as a mean to show wealth and social status. At that time, the items that women most frequently purchased for conspicuous purposes included household appliances, jewelry, perfumes, and clothes. In general, today, the population of young men is the one that engages in conspicuous consumption the most. However, women also tend to engage themselves in conspicuous consumption, but their motivation and the products that they purchase conspicuously are somewhat different when compared to men. First, in the act of conspicuous consumption, women tend to buy clothes significantly more than men and use them as status and identity items (O’Cass, 2001); however, men use conspicuously bought clothes to communicate power while women use it to communicate delicacy (McCracken, 1986).
2.2. Cultural Dimensions
Culture operates on all levels in one society and its rules regulate social roles and communication from the individual point up to the business and state leadership. Because culture with its values, attitudes, and desirable behaviors determines the rules of communication, it can be used for prediction of mainstream tendencies regarding some social phenomena (e.g. moral issues, popularity of some type of music, dynamics of its politics, etc.). Hofstede, Hofstede, and Minkov, (2010) suggested that culture has onion layer structure that consists of two main parts: 1) values and 2) practices, while the latter is consisted of rituals, heroes and symbols. Symbols include words, gestures, pictures, and objects that have specific meaning in one culture. More specifically, they include jargon, clothes, hairstyles, flags and status symbols. Culture influences all levels of one society (e. g., nation, groups, and individuals); however, its roles are somewhat different on different levels. Up to this day, scientific studies investigated three cultural orientation levels. The first level was macro level, or investigation of cultures as collective phenomenon on levels of geographical areas and ethnic groups (Hofstede and Bond, 1984). Although this perspective gave insights into how lingual or religious similarities between cultures are formed, it could not explain some phenomena such as multilingual countries (Bouchet, 1995). The second cultural orientation level that was investigated is the level of social groups (Parsons, 1977), and the studies that researched this level gave us insights into how social realities, lifestyles, and consumption patterns are formed. Finally, cultures were studied on micro or individual level, which gave us insights how culture influences individual behavior. Specifically, these studies found how culture is represented in the minds of individuals, and how that shapes intra-psychological dynamics of people (Mennicken, 2000). In other words, they helped us determine the “background effect” of culture, and how culture unconsciously shapes cognitions, emotions, and behavior of its members (Kroeber‐Riel, Weinberg, & Gröppel‐Klein, 2009).
Hofstede’s Cultural Dimensions
Culture is a factors that significantly influence and shape how consumers process information (Schmitt & Pan, 1994). Among the others, some of the most important factors are national wealth and incomes (De Mooij, 2004); however, cultures also shape national economies because entrepreneurs adapt their business to the cultures in which they operate in order to maximize their efficacy and profitability. When one researches customers’ behavior, one has to study cultural dimensions too because the way people behave and what motivates them is significantly determined and influenced by culture. Culture defines how people communicate with each other in buying process, it defines how people behave in critical points of decision making (e.g., do people prefer making decisions by themselves or they like to ask other important people or relevant associates when making business and consuming decisions). Furthermore, depending on their culture, people tend to make more or less emotional decisions regarding their purchases (De Mooij, 1998); hence, cultural dimensions at national level may influence consumers’ behavior significantly (Dawar, Parker, & Price, 1996; Shim & Gehrt 1996).
Individualism / Collectivism – IND / COLL

Journal of Management, Marketing and Logistics -JMML (2019), Vol.6(2). p.103-127 Benli, Ferman
_____________________________________________________________________________________________________ DOI: 10.17261/Pressacademia.2019.1038 106
Individualism and collectivism (IND and COLL) are cultural dimensions that are highly correlated to and significantly influence the self-concept of the members of that culture. In other words, how people experience and express their self-concept is highly determined by their culture (Markus & Kitayama, 1991). These two dimensions show how a particular culture balances between the needs of individuals and groups and to which of these two it gives more importance (Matsumoto and Juang, 2004). Based on their place on IND-COLL dimension, cultures differ significantly in terms of their members’ typical everyday behavior. Specifically, in highly collectivistic cultures, the relevance of personal opinion is very low, and opinion of the group is always more important and forced on the disagreeing members. In contrast, in individualistic cultures, everyone, even small children are encouraged to form and retain their own opinions because lack of personal opinion is evaluated as a lack of character (Hofstede et al., 2010). In addition, individualistic cultures stimulate behaviors that will make one’s uniqueness prominent and stimulate one’s autonomy, while collectivistic cultures tend to reward behaviors that will facilitate sense of belonging and group affiliation (Matsumoto & Juang, 2004). Like all other behaviors, purchasing habits of all members of one culture are significantly influenced by this dimension. For example, in individualistic cultures, people sometimes tend to buy things because that is a fun thing to do; hence, this construct of “fun shopping” is motivated by search for pleasure which is a highly valued and very frequent behavior in individualistic cultures. The study of Nicholls, Li, Mandokovic, Roslow, and Kranendonk (2000) noted that people from collectivistic cultures tend to often plan their shopping in advance and for longer periods of time, while people from individualistic cultures tend to do more frequent, spontaneous, and recreational shopping. IND-COLL dimension influences consumers’ behavior indirectly through different lifestyles that it facilitates. More specifically, in individualistic cultures, majority of people live or tend to live a self-supporting lifestyle while in collectivistic cultures people tend to depend on others. Consequently, their purchasing habits, decisions, and products that they typically buy are significantly different (Hofstede et al., 2010). De Mooij (2010), showed that people from individualistic cultures tend to make their purchasing decisions on their own or with very few consultations with other people; however, in collectivistic cultures, people tend to rely on opinions of many other in-group members when making the same decisions. This dimension also significantly influences the speed of decision making and consumers’ impulsiveness. While highly individualistic people tend to impulsively purchase things just because it makes them feel good, in collectivistic cultures majority of people avoid doing that because behavioral and emotional control are highly valued there and impulsivity and lack of control is frowned upon (Kacen & Lee, 2002).
Masculinity / Femininity – MASC / FEM
According to Hofstede et al. (2010), there are two types of cultures on this dimension: 1) predominantly masculine cultures where majority of men are strong and tough figures that earn the money for them and their families and where majority of women tend to be warm, gentle, hurting, and highly preoccupied with quality of their lives and 2) predominantly feminine cultures, where both male and females are self-effacing, warm, gentle and preoccupied with the quality of life. Furthermore, in masculine societies, majority of members pay attention to their success, and tend to be inflexible and live a life guided by materialistic values. In contrast, in feminine societies, people are further focused on modesty, empathy, and non-materialistic values (De Mooij, 1998). The aspects of consumers’ behavior that are most affected by this dimension are: 1) purchasing habits or luxury goods, 2) purchasing habits of goods that display social status, 3) independence in purchase-related decision-making process, 4) need for social classification, 5) new product adoption, 6) complaint behavior of consumers, 7) roles that males and females take in purchasing process, 8) the preference towards particular types of products or brands. Although purchases of luxury and status-displaying products are highly influenced by person’s income, people from masculine cultures, who buy things to show them, tend to buy these goods significantly more when compared to people from feminine cultures, who mostly buy things because they have a need to use them (De Mooij & Hofstede, 2011). The findings of Stockmann are, according to De Mooij (2004), in concordance with this hypothesis and they show that masculinity dimension is in positive correlation with purchases of luxury sports cars and brand loyalty. Innovativeness or readiness to adopt new products is in direct correlation with one’s ambition; hence, it is highly influenced by one’s masculinity. More precisely, masculine cultures are more focused on success and achievement, which pull consumers to new experiences and products because people want to be seen as special and different from everybody else (Steenkamp et al., 1999).
Power Distance - PD
Power-distance (PD) reflects what type of stance members of one culture have towards authority (Inkeles and Levinson, 1969). More specifically, this dimension shows how people handle the problem of human inequality and how they think the problem should be handled. Hofstede et al. (2010), argue that when PD is small, individuals are very little dependent on power holders; hence, people prefer interdependence and consultations in all aspects of social functioning between all members of society regardless of whether individuals are in position of power or not. In contrast, when PD is large, people that are not in power positions are highly dependent on people who govern the country. In these societies a small number of people govern all
Journal of Management, Marketing and Logistics -JMML (2019), Vol.6(2). p.103-127 Benli, Ferman
_____________________________________________________________________________________________________ DOI: 10.17261/Pressacademia.2019.1038 107
relationships in the society among the people who have the benefit of power and other members. This principle is applied to all types of relationships (for example, financial, social, political, and scientific, etc.). How much people accept inequality and how they handle it is one of the main indicators of this dimension. While in the cultures with large PD inequality is implicitly assumed, also at times even desired, in the cultures with small PD inequality considered as something that the majority of people fight against and try to minimize it (Hofstede et al., 2010). Hofstede et al., (2010) showed that majority of members in one society share the same beliefs regarding PD, and the position that they hold in that culture does not influence that belief. In other words, it is not important whether they are leaders (power holders) or those that are led (subordinates). Power distance significantly influences the following aspects of consumer behavior: 1) decision making style 2) purchase dominance 3) brand-oriented purchases 4) status related purchasing 5) interest to purchase and use special groups of products, and 6) evaluation system. Within nations with large PD, people like to rely on other people to make important decisions for them. In these cultures, purchasing decisions are made almost always by the elders and superiors, while in the low PD cultures all consumers engage in the decision making process. Purchase dominance is also influenced by PD. More precisely, in cultures with high PD, children and women are brought up and thought that they must follow certain standards and rules in purchasing situations and leave all decisions to the dominant members of the family, usually to the father or the grandfather (Rose et al., 2002). In contrast, when PD is low, all family members are thought to express their own opinions and make decisions for themselves. Consequently, variety seeking, and brand orientation are significantly more frequent in these cultures (Rose et al., 2002).
Uncertainty Avoidance - UA
Uncertainty avoidance is a dimension that is completely subjective, cultural and learned. The way we handle it is not innate or hereditary, thus we are not born with it. There are great differences between cultures on this dimension. More precisely, in cultures which are highly positioned on the scale on uncertainty avoidance, a majority of people tend to strictly follow the rules, they like the structure, display lower levels of cognitive flexibility, they are more pessimistic, and less emotionally stable. The same as the previous dimensions, uncertainty avoidance influences several aspects of consumers’ behavior. More specifically, it influences: 1) preference for creativity, innovation and change, 2) decision making, 3) adoption rate of new products and brands, 4) brand loyalty, 5) information search, and 6) purchase of specific type or variety of products. Preference for creativity, innovation, and change is significantly influenced by this dimension. More specifically, people from the cultures that has high UA like routine, rules, and old habits. Consequently, within these cultures innovativeness and openness to change are very low. In contrast, in cultures that score low on this dimension, people are highly innovative and creative in their purchasing behavior; hence they tend to buy new products more often. When it comes to decision making, people with low uncertainty avoidance tend to attribute management of their lives to themselves, and they see themselves as masters of their own lives and decisions. In contrast, people who has high UA tend to procrastinate when making purchasing decisions and prefer to think that somebody or something else makes or should make these decisions for them (De Mooij & Hofstede, 2011). Hence, in population with high uncertainty avoidance behaviors such as variety seeking, switching, and impulsive purchasing is significantly reduced. In the similar manner, this dimension influences brand loyalty. So, people who score high on uncertainty avoidance do not like insecurity and unpredictability, and they try to minimize it as much as they can; hence, while purchasing, they do that by lowering purchasing risks and choosing familiar brands and products. Contrarily, people who mark low on uncertainty avoidance tend to take some risks because they are curious, and they find new experiences interesting, and challenging (Baumgartner and Steenkamp, 1996; De Mooij, 2004).
2.2. Online Compulsive Buying Behavior - OCBB
We reside in a world that is more and better connected than ever before. Shopping malls are everywhere and products from all around the world are available to us all the time. Hence, today, compulsive buying is more easily triggered than ever before, and it can have very serious consequences on one’s life and his social surroundings. In its more extreme form, when a person completely loses control over his buying patterns, compulsive buying becomes a psychological disorder. Compulsive buying disorder (CBD) which is part of a group of impulse control disorders, although its accurate position in the American and European classification of psychological disorders is still a matter of debate (Black, 2007). People diagnosed with CBD cannot control their buying behavior and because of that they are very distressed and display impaired functioning in other dimensions of their life such as social, and professional. In the US population, 5.8 % of the people are affected by this disorder. The prevalence of CBD is higher among females (Black, 2007). Some findings show that majority of compulsive buyers are women because they use different semantic frame for defining shopping. While, majority of men associate shopping with work, majority of women associate shopping with fun, socialization, and leisure time. In addition, shopping of men is usually goal oriented and they tend to do it with as little effort as possible (Campbell, 2000). When it comes to age differences, the study of Neuner, Raab and Reisch (2005) showed that younger people are more affected by CBD than older people. This can be related to the general lack of impulse
Journal of Management, Marketing and Logistics -JMML (2019), Vol.6(2). p.103-127 Benli, Ferman
_____________________________________________________________________________________________________ DOI: 10.17261/Pressacademia.2019.1038 108
control that adolescents display because their brain is still not fully developed. Of all compulsive buyers, 11 % are adolescents (Roberts & Manolis, 2000). Compulsive buyers do not have cognitive schemes to control their buying behavior (O’Guinn & Faber, 1989). However, although there is no exact profile of compulsive buyer, low self-esteem is a common personality trait in this population (O’Guinn & Faber, 1989; Roberts & Manolis, 2000). The products that are usually bought by compulsive buyers are clothing, jewelry, makeup, electronic equipment and collectible things (Black, 2007), and Faber, O’Guinn, and Krych, R. (1987) argue that these products are usually bought by compulsive buyers because they boost their self-esteem by influencing their self-image positively. Many studies have performed explorations linking materialistic values and Compulsive Buying Behavior (CBB); however, the results were rather contradicting. Specifically, Dittmar (2005) found that materialism is a significant predictor of and positively correlated to CBB. On the other hand, D’Astous (1990) showed that materialism is not significantly correlated to compulsive buying. Specifically, the study showed that the products that are acquired in the act of buying are not relevant to the buyer, and the only thing that is important for the buyer is the mere process of buying things. In addition, compulsive buyers do not attach to the products that they bought, and they do not care about them or use them after the buying act (O’Guinn & Faber, 1989).
CBD is different from regular buying in the following aspects: 1) intrinsic value of the purchased good is totally irrelevant to the buyer, 2) the buyer negates all negative aspects of his compulsive purchases, 3) the buyer has a lack of the ability to control purchasing behaviors, 4) person has a constant urge to acquire things (Krueger 1988; O'Guinn and Faber, 1989; Valence and colleagues., 1988). Similarly to people with compulsive hoarding disorder, who accumulate useless things, for compulsive buyers, storing unneeded products and services acquired in shopping binges is very common. This led some scientists to the conclusion that compulsive buyers only buy things because of psychological effect that it has on them, or in other words, because of emotional and mental relief that the act of buying causes (O'Guinn & Faber, 1989). In its extreme form CBD can have very serious consequences such as marital problems and divorce, accumulation of debt, misappropriation, and sometimes it may end with the suicide attempt of the affected person (Lejoyeux, Ades, Tassain, & Solomon, 1996). Although it may seem to the marketers and economists that promotion of compulsive purchasing behavior and targeting of people vulnerable to CBD is a good strategy, in long term, the problem of CBD has great consequences on directs social environment of the people affected by this disorders and generally on global economy (Kerin, Hartley & Rudelius, 2011). Specifically, CBB unfortunately leads to the accumulation of uncollectable debt because people with CBD irrationally buy things and usually fall out from their purchasing power limits several dozen times, which cannot later even be repaid by the members of their families (Bragg, 2009). Empirical studies have shown that people who have problems with compulsive buying and CBD are generally inclined towards addiction. This hypothesis is confirmed multiple times in the studies that showed that people with CBD diagnosis usually have at least one other addiction or compulsion problem such as alcoholism (Glatt & Cook, 1987; Valence, D’Astous, & Fortier, 1988), kleptomania (McElroy et al., 1991; 1994), bulimia and shoplifting (Mitchell, Hatsukami, Eckert, & Pyle, 1985), drug abuse (Mitchell et al., 1985), and binge eating disorder and bulimia nervosa (Faber, Christenson, De Zwaan, & Mitchell, 1995).
Materialism can also be a significant correlate of compulsive buying; however, the literature suggests that there are two different mechanism of compulsive buying and according to one of them materialism cannot be a relevant factor. More specifically, materialism is a set of values that ranks possession of things and material success as the greatest achievements in one’s life. According to Rindfleisch, Burroughs, and Denton (1997), people who are compulsive consumers usually score up in materialism scale and they compulsively buy things because they think that possessions reflects their success and because they live by the motto that more is always better. Specifically, their study showed that the amount of disposable income and endorsement of compulsive buying inside the immediate family are two most significant predictors of CBD. In concordance with this view are the findings of Richins and Dawson (1992), who found a significant positive correlation between materialism and low self-esteem (which is usual traits of compulsive buyers). Contrary, according to the other perspective of compulsive buying, materialism is not a significant factor in this behavior. More specifically, to a materialist, or a person who scores high on materialism dimension, acquired material goods are very important. Also, people who score high on materialism tend to use the products that they bought and tend to show them to other significant people in order to attract their attention and social approval. However, the some findings indicate that the value of the products and its’ main purpose or the role that the products have in the presentation of self-image is totally irrelevant to compulsive buyers shortly following the behavior of compulsive buying is finished (O’Guinn and Faber, 1989).
Interestingly, some studies indicate that the age is the variable that can explain and reconcile the differences between the two perspectives about materialism’s function in compulsive buying. More specifically, younger compulsive buyers (e. g., adolescents and young adults) tend to practice this behavior because of materialistic goals. However, in older age, development of CBD is usually a result of lack of coping mechanisms for handling negative emotions and low self-esteem (Xu, 2008; Dittmar, 2005). Looking at the demographics, sex is the most significant indicator that affects compulsive consumption. Since the beginning of the
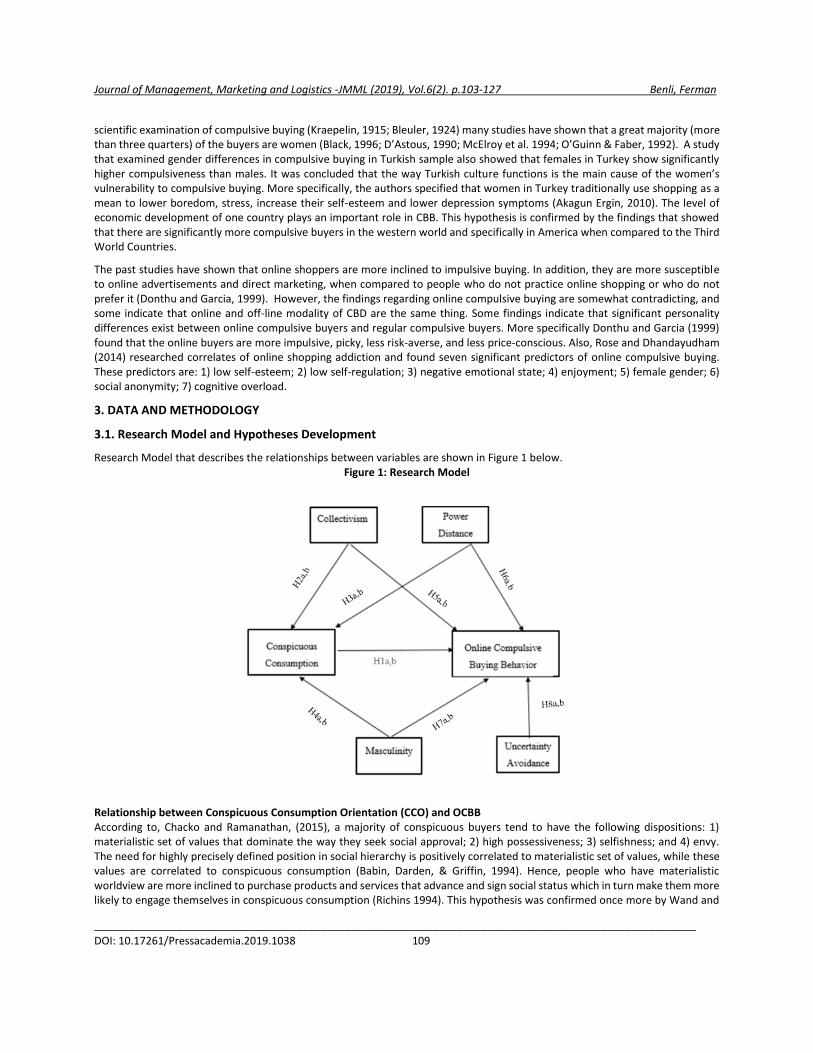
Journal of Management, Marketing and Logistics -JMML (2019), Vol.6(2). p.103-127 Benli, Ferman
_____________________________________________________________________________________________________ DOI: 10.17261/Pressacademia.2019.1038 109
scientific examination of compulsive buying (Kraepelin, 1915; Bleuler, 1924) many studies have shown that a great majority (more than three quarters) of the buyers are women (Black, 1996; D’Astous, 1990; McElroy et al. 1994; O’Guinn & Faber, 1992). A study that examined gender differences in compulsive buying in Turkish sample also showed that females in Turkey show significantly higher compulsiveness than males. It was concluded that the way Turkish culture functions is the main cause of the women’s vulnerability to compulsive buying. More specifically, the authors specified that women in Turkey traditionally use shopping as a mean to lower boredom, stress, increase their self-esteem and lower depression symptoms (Akagun Ergin, 2010). The level of economic development of one country plays an important role in CBB. This hypothesis is confirmed by the findings that showed that there are significantly more compulsive buyers in the western world and specifically in America when compared to the Third World Countries.
The past studies have shown that online shoppers are more inclined to impulsive buying. In addition, they are more susceptible to online advertisements and direct marketing, when compared to people who do not practice online shopping or who do not prefer it (Donthu and Garcia, 1999). However, the findings regarding online compulsive buying are somewhat contradicting, and some indicate that online and off-line modality of CBD are the same thing. Some findings indicate that significant personality differences exist between online compulsive buyers and regular compulsive buyers. More specifically Donthu and Garcia (1999) found that the online buyers are more impulsive, picky, less risk-averse, and less price-conscious. Also, Rose and Dhandayudham (2014) researched correlates of online shopping addiction and found seven significant predictors of online compulsive buying. These predictors are: 1) low self-esteem; 2) low self-regulation; 3) negative emotional state; 4) enjoyment; 5) female gender; 6) social anonymity; 7) cognitive overload.
3. DATA AND METHODOLOGY
3.1. Research Model and Hypotheses Development
Research Model that describes the relationships between variables are shown in Figure 1 below. Figure 1: Research Model
Relationship between Conspicuous Consumption Orientation (CCO) and OCBB According to, Chacko and Ramanathan, (2015), a majority of conspicuous buyers tend to have the following dispositions: 1) materialistic set of values that dominate the way they seek social approval; 2) high possessiveness; 3) selfishness; and 4) envy. The need for highly precisely defined position in social hierarchy is positively correlated to materialistic set of values, while these values are correlated to conspicuous consumption (Babin, Darden, & Griffin, 1994). Hence, people who have materialistic worldview are more inclined to purchase products and services that advance and sign social status which in turn make them more likely to engage themselves in conspicuous consumption (Richins 1994). This hypothesis was confirmed once more by Wand and
Journal of Management, Marketing and Logistics -JMML (2019), Vol.6(2). p.103-127 Benli, Ferman
_____________________________________________________________________________________________________ DOI: 10.17261/Pressacademia.2019.1038 110
Wallendorf (2006). Based on the previous findings, it is logical to reason that materialism, as the system of values that is typical for conspicuous buyers is significantly correlated to compulsive buying. Precisely, materialism is a worldview that puts material success and possessions at the top of the hierarchy of important life achievements. Interestingly, some findings show that materialism is in significant positive correlation to compulsive buying because compulsive buyers presume that having more is better than having less (Rindfleisch, Burroughs, & Denton 1997). These findings are supported by the results of Richins and Dawson (1992), which showed CBB has significant correlation with materialism and low self-esteem. Moreover, Elliot (1994) showed that buyers who scored high on compulsive buying had self-esteem that is significantly below the average. Furthermore, that research discovered compulsive buyers are significantly more inclined towards purchasing products that will make them more socially visible. Likewise, Roberts (1998) showed a correlation between perceived social status of buying and CBB. In the same manner, Roberts and Manolis (2000) implied and found evidence that status consumption can become compulsive if people lose control over their purchasing habits.
In conclusion, with the firm support from the literature on materialism, self-esteem, status consumption, and their relation with CBB, it can be hypothesized that there should be a direct connection between conspicuous consumption and OCBB in both American and Turkish consumers.
H1a: There is a statistically significant relationship between CCO and OCBB in American consumers H1b: There is a statistically significant relationship between CCO and OCBB in Turkish consumers
Relationship between COLL and CCO
Cultural values shape the views on conspicuous consumption. There are several theoretical explanations of these variations across cultures. Materialism is dominant set of values in individualistic societies. Confirming this view, Belk (1988) and Browne and Kaldenberg (1997) specified that conspicuous consumption is positively correlated to materialism and self-enhancement in dominantly individualistic countries. In contrast, in collectivistic cultures, materialism is in negative correlation to cultural values (Burroughs and Rindfleisch 2002). A cross-cultural study that encompassed samples from Mexico, China, and the USA showed that materialism is in positive correlation with consumption of brands that reflect social status (Eastman, Calvert, Campbell, & Fredenberger, 1997). Also, Souiden et al (2011) found that conspicuous consumption is higher in an individualistic culture (Canada) than in a collectivist one (Tunis), which they attributed to different levels of materialism in the two cultures. Studies showed that individualistic cultures value materialism more so than collectivist cultures. Also, materialism and conspicuousness are in interrelationship, thus it would be reasonable to assume that individualistic cultures would be more inclined to conspicuous behavior than collectivist cultures. Another significant variable that explains conspicuous consumption is desire for uniqueness. People who have more prominent desire for uniqueness tend to buy products that are rare and exclusive more often (Verhallen, 1982). Furthermore, achieving uniqueness is even more facilitated if the wanted brand is perceived as an expensive one (Verhallen & Robben, 1994). What is more important is that the magnitude of desire for uniqueness significantly varies in relation to individualism-collectivism cultural dimension. More precisely, Teimourpour and Hanzaee (2011) found that collectivism and desire for uniqueness are negatively correlated; hence, the opposite could also be correct. However, interestingly some argued that collectivistic cultures are more prone to positive evaluations of publicly displayable goods when compared to consumers who are from individualist cultures (Wong & Ahuvia, 1998).
In conclusion, because there is no consensus among scientists regarding the role of individualism-collectivism in determination of conspicuous consumption, below hypotheses will be tested.
H2a: There is a statistically significant relationship between COLL and CCO in American consumers H2b: There is a statistically significant relationship between COLL and CCO in Turkish consumers
Relationship between PD and CCO Societies with a large power distance are more rigid and have lover flexibility in terms of social mobility. (Hofstede 2010; Usunier, Lee, & Lee 2005). The large PD in these societies may facilitate the role of self-importance in people’s self-concept (Keltner, Gruenfeld, & Anderson 2003). This can be especially prominent in third world countries where people gravitate towards publicly showing their possessions in order to present themselves as more successful than others (Chaudhuri &Majumdar 2006). More specifically, the middle class in these countries is the most inclined towards this behavior. It is highly probable that conspicuous consumption is a socially desirable way to converse affluence and social position in societies with a large PD (Piron, 2000). In the same manner, Moon and Chan (2005) demonstrated positive correlation between conspicuous consumption of branded items and PD. Hence, in those cultures, conspicuous consumption is a method of demonstration of one’s class in society (Varman & Vikas 2005). Kim and Zhang (2014) noted that buyers who show high power-distance are more inclined to choose goods that
Journal of Management, Marketing and Logistics -JMML (2019), Vol.6(2). p.103-127 Benli, Ferman
_____________________________________________________________________________________________________ DOI: 10.17261/Pressacademia.2019.1038 111
showcase status when compared to people with low level of power-distance belief. Hence, based on the presented findings the next hypotheses are developed.
H3a: There is a statistically significant relationship between PD and CCO in American consumers H3b: There is a statistically significant relationship between PD and CCO in Turkish consumers
Relationship between MASC and CCO In cultures that have high masculinity, the most prized things are success, money, and material possessions, and that is because the main focus in masculine societies is on performance and achievement (De Mooij & Hofstede, 2011). Because of its main focus, in masculine societies, expensive, unique, and luxury goods are important means that one uses to show one’s success (Bezzaouia, & Joanta, 2016). Hofstede, (2001) argued that in high-masculinity cultures, money and material possessions are of top importance. Thus, these cultures tend to be significantly more dominated by materialistic values than countries that score low on this dimension; hence, high masculinity creates more conspicuous consumption (Shoham, Gavish, & Segev, 2015). Thus, this study will test the hypothesis below.
H4a: There is a statistically significant relationship between MASC and CCO in American consumers H4b: There is a statistically significant relationship between MASC and CCO in Turkish consumers
Relationship between COLL and OCBB Caldwell-Harris and Aycicegi (2006) demonstrated that individualism is correlated to more personality pathology including obsessive-compulsive disorders when compared to collectivism. Moreover, gambling is found to be more prevalent in individualistic cultures. Furthermore, Ciarrocchi, Kirschner, & Fallik, 1991 noted that individualistic societies positively evaluate active risk-taking, and are less retraining towards gambling, which has been identified as highly addictive and a form of compulsive behavior. Hence, based on these results, below hypotheses were developed.
H5a: There is a statistically significant relationship between COLL and OCBB in American consumers H5b: There is a statistically significant relationship between COLL and OCBB in Turkish consumers
Relationship between PD and OCBB Power Distance is a cultural dimension which measures how much lives of people on lower positions in the social hierarchy are influenced and dependable on the people from the higher positions (Hofstede 2010). Looking at the relation between OCBB and PD, there is a lack in literature that showcased and explained the essence of this relationship on cultural level; however, there are findings that show a relationship between PD and impulse buying tendency (Ali and Sudan, 2018). Moreover, it has been found that consumer impulsiveness is in moderate correlation with compulsiveness (Shoham, Gavish, & Segev, 2015). Hence, because previous studies indicate a sign of positive relationship between OCBB and PD, below hypothesis will be tested.
H6a: There is a statistically significant relationship between PD and OCBB in American consumers H6b: There is a statistically significant relationship between PD and OCBB in Turkish consumers
Relationship between MASC and OCBB In nations with high masculinity, consumers more frequently display materialistic values than in low-masculinity nations (Hofstede 2010). Additionally, Mowen and Spears (1999) showed a positive correlation between materialism and compulsiveness. Li et al., 2009 suggested that males may be more inclined to engage in consumption of expensive, luxury goods which could trigger more compulsive buying. Hence, built upon that information, the following hypotheses were formed.
H7a: There is a statistically significant relationship between MASC and OCBB in American consumers H7b: There is a statistically significant relationship between MASC and OCBB in Turkish consumers
Relationship between Uncertainty Avoidance and OCBB Hofstede (2010) defined this dimension as the way people handle unpredictability of everyday life. In addition, he argued that this dimension reflects dominant emotions that people experience in uncertain or unknown situations. On individual level, men and women with high uncertainty avoidance levels, seem to feel anxious and stressed in unknown and unstructured situations (Ayoun & Moreo, 2008). Hence, in this case, it is reasonable to assume that buyers that has high UA would also lean towards avoiding risks (Hwa-Froelich & Vigil, 2004; Yildirim & Barutçu, 2016).In addition, Park and Burns (2005) showed that pathological gambling, which is a compulsive behavior, is in negative correlation to uncertainty avoidance. In addition, previous studies showed that compulsive consumption is positively correlated to risk-taking (Campbell 1976; Wallach & Kogan 1961). Supporting that view, Ozorio, Lam and Fong (2010) found that people who have low uncertainty avoidance are more risk-tolerant. Likewise, Demaree.

Journal of Management, Marketing and Logistics -JMML (2019), Vol.6(2). p.103-127 Benli, Ferman
_____________________________________________________________________________________________________ DOI: 10.17261/Pressacademia.2019.1038 112
DeDonno, Burns, Feldman & Everhart (2009) stated uncertainty avoidance lowers the negative effects of compulsive gambling-related risk-taking. Thus, below hypotheses will be tested.
H8a: There is a statistically significant relationship between UA and OCBB in American consumers H8b: There is a statistically significant relationship between UA and OCBB in Turkish consumers Additionally, below hypotheses are formed to test the significance of demographics on CCO and OCBB.
H9a: Conspicuous Consumption Orientation statistically significantly differs based on gender in American consumers H9b: Conspicuous Consumption Orientation statistically significantly differs based on gender in Turkish consumers H10a: Conspicuous Consumption Orientation statistically significantly differs based on age groups in American consumers H10b: Conspicuous Consumption Orientation statistically significantly differs based on age groups in Turkish consumers H11a: Conspicuous Consumption Orientation statistically significantly differs based on income groups in American consumers H11b: Conspicuous Consumption Orientation statistically significantly differs based on income groups in Turkish consumers H12a: Conspicuous Consumption Orientation statistically significantly differs based on education in American consumers H12b: Conspicuous Consumption Orientation statistically significantly differs based on education in Turkish consumers H13a: Online Compulsive Buying Behavior statistically significantly differs based on gender in American consumers H13b: Online Compulsive Buying Behavior statistically significantly differs based on gender in Turkish consumers H14a: Online Compulsive Buying Behavior statistically significantly differs based on age groups in American consumers H14b: Online Compulsive Buying Behavior statistically significantly differs based on age groups in Turkish consumers H15a: Online Compulsive Buying Behavior statistically significantly differs based on income groups in American consumers H15b: Online Compulsive Buying Behavior statistically significantly differs based on income groups in Turkish consumers H16a: Online Compulsive Buying Behavior statistically significantly differs based on education in American consumers H16b: Online Compulsive Buying Behavior statistically significantly differs based on education in Turkish consumers
3.2. Sampling and Data Collection
To understand and compare the relation between cultural dimensions at the individual level and two outcomes of consumer society; conspicuous consumption and online compulsive buying behavior in Turkey and the United States of America, samples from Istanbul and Washington D.C were chosen. For this study, more than 900 data were gathered for each country and after subtracting the people who answered ‘No’ to disqualification questions such as citizenship and online shopping frequency, 663 participants from Istanbul and 597 participants from Washington D.C were used in further analysis. Data were gathered through online surveys and because of the budget and time constraints, snowball convenience sampling method was chosen. This method is very practical because it can be applied on the internet and social networks and a great amount of data can be collected in very short time. Also, active users of Internet and who have active profiles on social networks very probably engage themselves in online consumption.
Surveys were designed based on the extensive literature review conducted on each variable. Each item in each scale has been translated to Turkish by sworn translator and later, back-translated from Turkish to English using a second translator. The translations were examined and cleared from problems in meaning that could possible cause issues in later stages. Both surveys had 6 sections and 51 questions each where first section containing the consent form, second section containing the qualification questions such as citizenship, city and age. Third section had 11 questions measuring Conspicuous Consumption Orientation using 6-point Likert scale. Fourth section had 7 questions that measure Online Compulsive Buying Behavior using 5-point Likert scale and fifth section had 20 questions to measure cultural dimension at the individual level using 5-point Likert scale. Lastly, sixth section was containing demographics questions such as gender, marital status, income, education. Table 1 contains the measurement scales used for COLL, PD, MASC, UA, CCO and OCBB. Table 1: Variables and Measurement Scales
Online Compulsive Buying Behavior(OCBB) Lee and Park (2008) – Derived from Compulsive Buying Scale originally developed by Faber and O’Guinn (1992)
Cultural Values Scale (CVSCALE) Yoo, Donthu & Lenartowicz (2011)
Conspicuous Consumption Orientation(CCO) Chaudhuri et al. (2011)

Journal of Management, Marketing and Logistics -JMML (2019), Vol.6(2). p.103-127 Benli, Ferman
_____________________________________________________________________________________________________ DOI: 10.17261/Pressacademia.2019.1038 113
All data were processed in IBM’s statistical software SPSS. Before the main analysis data screening for univariate and multivariate outliers and data cleaning were conducted. Univariate outliers were detected with inspection of standardized z-scores (values lower and higher than +/- 3.29 were classified as outliers and removed) and multivariate outliers were detected with Mahalanobis’s distances (values significant at alpha level .001 were removed). After removals, further analysis conducted with 663 respondents from Turkey and 597 from the U.S.
Demographics
In Turkish sample, 50.2% of respondents were male and 49.8% of respondents were female whereas in U.S.A sample, 49.2% was male and 50.8% was female. In Turkish sample, 40.7% was single and 59.3% was married whereas in the U.S, 50.4% of respondents were single and 49.6% married. In Turkish sample, 26.1% of respondents were in 31-38 age group, 21.8% were 23-30, 16.6% were 55+, 14.6% were 47-54, 14.3% were 39-46, and 6.5% were 15-22. In U.S.A sample, 25.3% of respondents were 55+, 20.4% were 23-30, 18.3% were 31-38, 18.1% are 39-46, 11.2% are 47-54 and 6.7% are 15-22. In Turkish sample, 41.1% of respondent are in the Highest Fifth (5001 TL+) income group, 21.4% are in the 4th Fifth (3501 TL – 5000 TL), 14.0% are in 3rd Fifth (2,501 TL -3,500TL), 13.5 in Lowest Fifth (O TL-1500 TL) and 10.0% is in the 2nd Fifth (1,501 TL – 2,500 TL) income group. In U.S.A, 28.6% of respondents are in the 3rd Fifth ($40,001-$70,000) income group, 24.3% are 4th Fifth ($70,000-$100,000), 20.8% are Lowest Fifth ($0-$20,000), 13.2% in Highest Fifth ($100.001+) and 13.1% are in 2nd Fifth ($20,001-$40,000) income group. In Turkish sample, 54.3% of respondents are Bachelor’s degree holders, 17.1% has Master’s degree, 14.0% are high school graduates, 7.3% has 2 year university degree, 4.0 % has 5-8 years education, 1.9 has 1-5 years education and 1.4% has Ph.D. degree. Table 17 shows in American sample, 40.9 % of respondents have Bachelor’s degree, 17.3% attended college with no degree, 16.4% has Graduate Degree, 10.1% has High school degree, 8.9% Associate Degree, 3% Doctoral degree and 2.5% has less than high school education. Lastly, MANOVA analysis showed that there are no significant differences among gender and age groups between Turkish and American samples which indicates that samples are good fit for cross-comparison.
4. FINDINGS AND DISCUSSIONS
4.1 Factor and Reliability Analysis
In order to check construct validity and reliability of the scales exploratory factor analysis and reliability analysis were applied in both samples (Kim & Mueller, 1978; Bolarinwa, 2015).
Factor and Reliability Analyses of Conspicuous Consumption Orientation (CCO) Scale in American and Turkish sample Kaiser-Meyer-Olkin test of sampling adequacy was .93(U.S) and .91(Turkey) which indicates that data fit factor analysis. Factor analysis of CCO Scale showed that the scale measures one factor in both samples with Eigenvalue 5.83 that explains 52.97 % of the data variability in American sample and Eigenvalue 5.14 that explains 46.76 % of the data variability in Turkish sample. Result of the factor analysis showed that all items were significantly correlated to the factor and all items had moderate to high correlation with the factor. Hence, based on the results provided by factor analysis it can be concluded that CCO Scale is one-dimensional, homogenous, scale that measures conspicuous consumption and has high construct validity. Reliability analysis of the scale showed that the scale has excellent internal consistency with Cronbach’s α = .91(U.S) and Cronbach’s α = .88(Turkey). The results of the factor analysis in both samples are in parallel with the original scale development study (Chaudhuri et al. ,2011) where only one factor was found to be explanatory.
Factor and Reliability Analyses of Cultural Values Scale (CVSCALE) in American and Turkish sample Kaiser-Meyer-Olkin test of sampling adequacy was .85(U.S and Turkey) which indicates that data fit factor analysis. Factor analysis of CVSCALE showed that the scale measures four factors in both sample that explain 65 % of the data variability in American sample and 60% of the variability in Turkish sample. Results of the factor analysis showed that all items were significantly correlated to their adequate factors. Furthermore, the analysis confirmed that this questionnaire measures four following dimensions: COLL, UA, PPD, and MASC. In addition all items had moderate to high correlation with the factor that they represent. Moreover, there were no significant item cross-loadings on multiple factors. Hence, based on the results provided by factor analysis it can be concluded that CVSCALE is four-dimensional, it measures cultural dimensions and has high construct validity. Reliability analysis of the scales showed the following Cronbach’s α values: MASC α = .86(U.S) and α = .80(Turkey); COLL α = .88(U.S) and α = .85; UA α = .85(U.S) and α = .85(Turkey); PD α = .84(U.S) and α = .80(Turkey); which indicate that all scales have good internal consistency. The results of the factor analysis in both samples are found to be consistent with the original scale development study conducted by Yoo et al., 2011 and many other researches in the United States, Brazil and South Korea (Yoo et al. 2011).
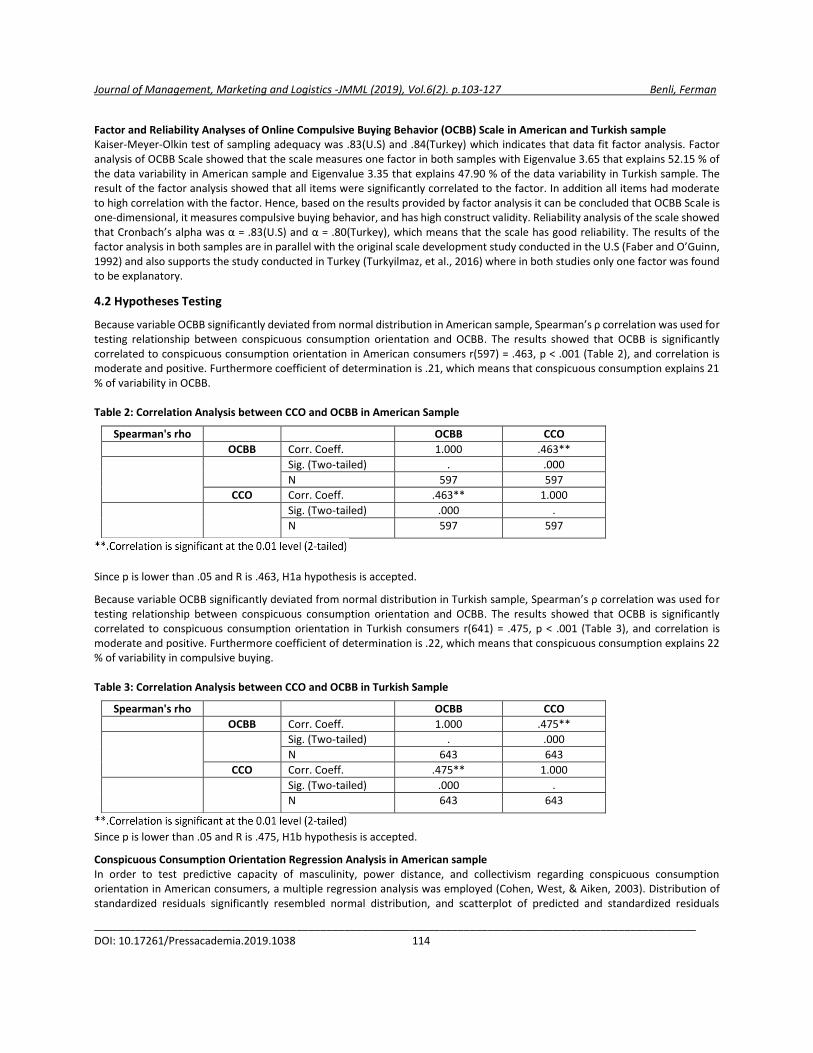
Journal of Management, Marketing and Logistics -JMML (2019), Vol.6(2). p.103-127 Benli, Ferman
_____________________________________________________________________________________________________ DOI: 10.17261/Pressacademia.2019.1038 114
Factor and Reliability Analyses of Online Compulsive Buying Behavior (OCBB) Scale in American and Turkish sample Kaiser-Meyer-Olkin test of sampling adequacy was .83(U.S) and .84(Turkey) which indicates that data fit factor analysis. Factor analysis of OCBB Scale showed that the scale measures one factor in both samples with Eigenvalue 3.65 that explains 52.15 % of the data variability in American sample and Eigenvalue 3.35 that explains 47.90 % of the data variability in Turkish sample. The result of the factor analysis showed that all items were significantly correlated to the factor. In addition all items had moderate to high correlation with the factor. Hence, based on the results provided by factor analysis it can be concluded that OCBB Scale is one-dimensional, it measures compulsive buying behavior, and has high construct validity. Reliability analysis of the scale showed that Cronbach’s alpha was α = .83(U.S) and α = .80(Turkey), which means that the scale has good reliability. The results of the factor analysis in both samples are in parallel with the original scale development study conducted in the U.S (Faber and O’Guinn, 1992) and also supports the study conducted in Turkey (Turkyilmaz, et al., 2016) where in both studies only one factor was found to be explanatory.
4.2 Hypotheses Testing
Because variable OCBB significantly deviated from normal distribution in American sample, Spearman’s ρ correlation was used for testing relationship between conspicuous consumption orientation and OCBB. The results showed that OCBB is significantly correlated to conspicuous consumption orientation in American consumers r(597) = .463, p < .001 (Table 2), and correlation is moderate and positive. Furthermore coefficient of determination is .21, which means that conspicuous consumption explains 21 % of variability in OCBB. Table 2: Correlation Analysis between CCO and OCBB in American Sample
Spearman's rho OCBB CCO
OCBB Corr. Coeff. 1.000 .463**
Sig. (Two-tailed) . .000
N 597 597
CCO Corr. Coeff. .463** 1.000
Sig. (Two-tailed) .000 .
N 597 597
Since p is lower than .05 and R is .463, H1a hypothesis is accepted.
Because variable OCBB significantly deviated from normal distribution in Turkish sample, Spearman’s ρ correlation was used for testing relationship between conspicuous consumption orientation and OCBB. The results showed that OCBB is significantly correlated to conspicuous consumption orientation in Turkish consumers r(641) = .475, p < .001 (Table 3), and correlation is moderate and positive. Furthermore coefficient of determination is .22, which means that conspicuous consumption explains 22 % of variability in compulsive buying. Table 3: Correlation Analysis between CCO and OCBB in Turkish Sample
Spearman's rho OCBB CCO
OCBB Corr. Coeff. 1.000 .475**
Sig. (Two-tailed) . .000
N 643 643
CCO Corr. Coeff. .475** 1.000
Sig. (Two-tailed) .000 .
N 643 643
Since p is lower than .05 and R is .475, H1b hypothesis is accepted.
Conspicuous Consumption Orientation Regression Analysis in American sample In order to test predictive capacity of masculinity, power distance, and collectivism regarding conspicuous consumption orientation in American consumers, a multiple regression analysis was employed (Cohen, West, & Aiken, 2003). Distribution of standardized residuals significantly resembled normal distribution, and scatterplot of predicted and standardized residuals

Journal of Management, Marketing and Logistics -JMML (2019), Vol.6(2). p.103-127 Benli, Ferman
_____________________________________________________________________________________________________ DOI: 10.17261/Pressacademia.2019.1038 115
indicated that homoscedasticity assumption was met. In addition, VIF of every variable in the model was significantly lower than five, so we may conclude that all assumptions for this analysis were met (Paul, 2006).
Table 4: Regression Analysis for CCO Model with Adjusted R Square in American Sample
R R Sq. Adjusted R Sq.
1 .422a .178 .174
Predictors: (Constant), Masculinity, Collectivism, Power Distance
Table 5: Regression Analysis for CCO Model with Significance Levels in American Sample
Model β t Sig. Coll. Toleran. VIF
(Constant) 14.341 .000
Power Distance .244 6.094 .000 .865 1.156
Collectivism -.268 -7.154 .000 .988 1.012
Masculinity .106 2.660 .008 .867 1.154
Dependent Variable: CCO The results of the regression analysis on Table 4 and Table 5 show that the regression model is statistically significant F(3, 593) = 42.92, p < .001, adjusted R² = .17. In addition, masculinity (β = .106, p < .05), power distance (β = .244, p < .001) and collectivism (β = -.268, p < .001) significantly predict conspicuous consumption orientation in American consumers.
In conclusion, the data showed that the model explains 17 % of conspicuous consumption which is statistically significant. Finally, because collectivism has the highest β-coefficient, we may conclude that this variable has the greatest impact on conspicuous consumption in American consumers. As a result, H2a, H3a and H4a hypotheses are accepted.
Conspicuous Consumption Orientation Regression Analysis in Turkish sample In order to test predictive capacity of masculinity, power distance, and collectivism regarding conspicuous consumption in Turkish consumers, a multiple regression analysis was employed (Cohen, West, & Aiken, 2003). Distribution of standardized residuals significantly resembled normal distribution, and scatterplot of predicted and standardized residuals indicated that homoscedasticity assumption was met. In addition, VIF of every variable in the model was significantly lower than five, so we may conclude that all assumptions for this analysis were met (Paul, 2006). Table 6: Regression Analysis for CCO Model with Adjusted R Square in Turkish Sample
R R Sq. Adjusted R Sq.
1 .441a .195 .191
a. Predictors: (Constant), Masculinity, Collectivism, Power Distance
Table 7: Regression Analysis for CCO Model with Significance Levels in Turkish Sample
Model β t Sig. Coll. Toleran. VIF
(Constant) 13.131 .000
Power Distance .297 7.890 .000 .895 1.117
Collectivism -.196 -5.414 .000 .969 1.032
Masculinity .176 4.693 .000 .899 1.112
Dependent Variable: CCO The results of regression analysis on Table 6 and Table 7 show that regression model is statistically significant F(3, 636) = 51.26, p < .001, adjusted R² = .20. In addition, masculinity (β = .176, p < .05), power distance (β =.297 p < .001), and collectivism (β = -.196, p < .001) significantly predict conspicuous consumption in Turkish consumers. In conclusion, the data showed that the model explains 20 % of conspicuous consumption which is statistically significant. Finally, because power distance has the highest β-coefficient we may conclude that this variable has the greatest impact on conspicuous consumption in Turkish consumers. As a result, H2b, H3b and H4b hypotheses are accepted. Regression analysis showed that the model significantly predict conspicuous consumption in both American and Turkish samples. Furthermore, the model explains 17 % of conspicuous consumption in

Journal of Management, Marketing and Logistics -JMML (2019), Vol.6(2). p.103-127 Benli, Ferman
_____________________________________________________________________________________________________ DOI: 10.17261/Pressacademia.2019.1038 116
American sample and collectivism had the greatest impact on conspicuous consumption whereas in Turkish sample, the model explained 20% of conspicuous consumption and power distance had the greatest impact on conspicuous consumption. These findings can be valuable for marketing managers where they want to market certain status products in both nations. In Turkey, to make the brands and products more conspicuously consumed, marketing efforts can be more geared in a way that it promotes and clearly distinguishes one’s social status whereas in America, that emphasis can be more on the uniqueness, rareness and exclusivity of that product.
Online Compulsive Buying Behavior Regression Analysis in American sample:
In order to test predictive capacity of masculinity, power distance, uncertainty avoidance, and collectivism regarding on OCBB in American consumers, a multiple regression analysis was employed. Distribution of standardized residuals significantly resembled normal distribution, and scatterplot of predicted and standardized residuals indicated that homoscedasticity assumption was met. In addition, VIF of every variable in the model was significantly lower than five, so we may conclude that all assumptions for this analysis were met (Paul, 2006).
Table 8: Regression Analysis for OCBB Model with Adjusted R Square in American Sample
R R Sq. Adjusted R Sq.
1 .402a .161 .156
a. Predictors: (Constant), Masculinity, Collectivism, Power Distance, Uncertainty Avoidance Table 9 - Regression Analysis for OCBB Model with Significance Levels in American Sample
Model β t Sig. Coll. Toleran. VIF
(Constant) 1.012 .000
Power Distance .226 5.494 .000 .840 1.190
Collectivism -.242 -6.078 .000 .895 1.118
Masculinity -.044 -1.086 .278 .865 1.156
Uncertainty Avoidance
-.133 -3.305 .001 .874 1.145
Dependent Variable: OCBB The results of regression analysis on Table 8 and Table 9 show that the regression model is statistically significant F(4, 592) = 28.47, p < .001, adjusted R² = .16. In addition, power distance (β = .226, p < .001), collectivism (β = -.242, p < 001), uncertainty avoidance (β = -.133, p < .001) significantly predict OCBB whereas masculinity (β = -.044, p > .05) does not.
In conclusion, the data showed that the model explains 16 % of OCBB which is statistically significant. Finally, because collectivism has the highest β-coefficient we may conclude that this variable has the greatest impact on OCBB in American consumers. As a result, H5a, H6a, H7a and H8a hypotheses are accepted.
Online Compulsive Buying Behavior Regression Analysis in Turkish sample
In order to test predictive capacity of masculinity, power distance, uncertainty avoidance, and collectivism regarding on OCBB in Turkish consumers, a multiple regression analysis was employed. Distribution of standardized residuals significantly resembled normal distribution, and scatterplot of predicted and standardized residuals indicated that homoscedasticity assumption was met. In addition, VIF of every variable in the model was significantly lower than five, so we may conclude that all assumptions for this analysis were met (Paul, 2006). Table 10: Regression Analysis for OCBB Model with Adjusted R Square in Turkish Sample
R R Sq. Adjusted R Sq.
1 .382a .146 .140
a. Predictors: (Constant), Masculinity, Collectivism, Power Distance, Uncertainty Avoidance
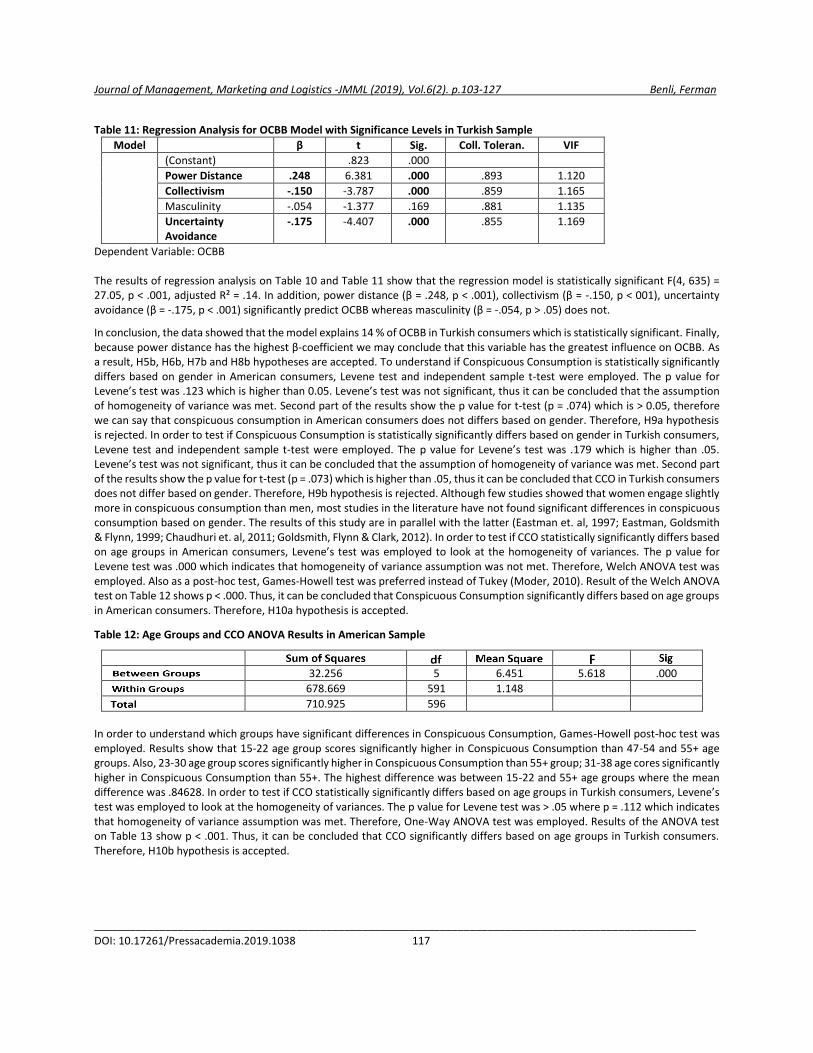
Journal of Management, Marketing and Logistics -JMML (2019), Vol.6(2). p.103-127 Benli, Ferman
_____________________________________________________________________________________________________ DOI: 10.17261/Pressacademia.2019.1038 117
Table 11: Regression Analysis for OCBB Model with Significance Levels in Turkish Sample
Model β t Sig. Coll. Toleran. VIF
(Constant) .823 .000
Power Distance .248 6.381 .000 .893 1.120
Collectivism -.150 -3.787 .000 .859 1.165
Masculinity -.054 -1.377 .169 .881 1.135
Uncertainty Avoidance
-.175 -4.407 .000 .855 1.169
Dependent Variable: OCBB The results of regression analysis on Table 10 and Table 11 show that the regression model is statistically significant F(4, 635) = 27.05, p < .001, adjusted R² = .14. In addition, power distance (β = .248, p < .001), collectivism (β = -.150, p < 001), uncertainty avoidance (β = -.175, p < .001) significantly predict OCBB whereas masculinity (β = -.054, p > .05) does not.
In conclusion, the data showed that the model explains 14 % of OCBB in Turkish consumers which is statistically significant. Finally, because power distance has the highest β-coefficient we may conclude that this variable has the greatest influence on OCBB. As a result, H5b, H6b, H7b and H8b hypotheses are accepted. To understand if Conspicuous Consumption is statistically significantly differs based on gender in American consumers, Levene test and independent sample t-test were employed. The p value for Levene’s test was .123 which is higher than 0.05. Levene’s test was not significant, thus it can be concluded that the assumption of homogeneity of variance was met. Second part of the results show the p value for t-test (p = .074) which is > 0.05, therefore we can say that conspicuous consumption in American consumers does not differs based on gender. Therefore, H9a hypothesis is rejected. In order to test if Conspicuous Consumption is statistically significantly differs based on gender in Turkish consumers, Levene test and independent sample t-test were employed. The p value for Levene’s test was .179 which is higher than .05. Levene’s test was not significant, thus it can be concluded that the assumption of homogeneity of variance was met. Second part of the results show the p value for t-test (p = .073) which is higher than .05, thus it can be concluded that CCO in Turkish consumers does not differ based on gender. Therefore, H9b hypothesis is rejected. Although few studies showed that women engage slightly more in conspicuous consumption than men, most studies in the literature have not found significant differences in conspicuous consumption based on gender. The results of this study are in parallel with the latter (Eastman et. al, 1997; Eastman, Goldsmith & Flynn, 1999; Chaudhuri et. al, 2011; Goldsmith, Flynn & Clark, 2012). In order to test if CCO statistically significantly differs based on age groups in American consumers, Levene’s test was employed to look at the homogeneity of variances. The p value for Levene test was .000 which indicates that homogeneity of variance assumption was not met. Therefore, Welch ANOVA test was employed. Also as a post-hoc test, Games-Howell test was preferred instead of Tukey (Moder, 2010). Result of the Welch ANOVA test on Table 12 shows p < .000. Thus, it can be concluded that Conspicuous Consumption significantly differs based on age groups in American consumers. Therefore, H10a hypothesis is accepted.
Table 12: Age Groups and CCO ANOVA Results in American Sample
32.256 5 6.451 5.618 .000
678.669 591 1.148
710.925 596
In order to understand which groups have significant differences in Conspicuous Consumption, Games-Howell post-hoc test was employed. Results show that 15-22 age group scores significantly higher in Conspicuous Consumption than 47-54 and 55+ age groups. Also, 23-30 age group scores significantly higher in Conspicuous Consumption than 55+ group; 31-38 age cores significantly higher in Conspicuous Consumption than 55+. The highest difference was between 15-22 and 55+ age groups where the mean difference was .84628. In order to test if CCO statistically significantly differs based on age groups in Turkish consumers, Levene’s test was employed to look at the homogeneity of variances. The p value for Levene test was > .05 where p = .112 which indicates that homogeneity of variance assumption was met. Therefore, One-Way ANOVA test was employed. Results of the ANOVA test on Table 13 show p < .001. Thus, it can be concluded that CCO significantly differs based on age groups in Turkish consumers. Therefore, H10b hypothesis is accepted.

Journal of Management, Marketing and Logistics -JMML (2019), Vol.6(2). p.103-127 Benli, Ferman
_____________________________________________________________________________________________________ DOI: 10.17261/Pressacademia.2019.1038 118
Table 13: Age Groups and CCO ANOVA results in Turkish Sample
18.191 5 3.638 4.029 .001
575.225 637 .903
593.416 642
In order to understand which groups have significant differences in Conspicuous Consumption, Tukey post-hoc test was employed. Results show that 23-30 age group scores significantly higher in Conspicuous Consumption than 47-54 and 55+ age groups. Also, 31-38 age group scores significantly higher in Conspicuous Consumption than 47-54 group. No significant differences were found between 15-22, 39-46 and all the other age groups. The highest difference was between 23-30 and 47-54 age groups where mean difference was .580477. Results indicate that in both cultures, young adults are more inclined to conspicuous consumption in both American and Turkish consumers. In order to test if CCO statistically significantly differs based on income groups in American consumers, Levene’s test was employed to look at the homogeneity of variances. p value for Levene test was .042 which indicates that homogeneity of variance assumption was not met (p < .05). Therefore, Welch ANOVA test was employed. Also as a post-hoc test, Games-Howell test was preferred instead of Tukey (Moder, 2010). Results of the Welch ANOVA test on Table 14 show p < .05 where p = .028. Thus, it can be concluded that Conspicuous Consumption significantly differs based on income groups in American consumers. Therefore, H11a hypothesis is accepted. Table 14: Income Groups and CCO ANOVA results in American Sample
15.650 4 3.912 3.331 .028
695.275 592 1.174
710.925 596
In order to understand which income groups have significant differences in Conspicuous Consumption, Games-Howell post-hoc test was employed. Results show that Highest Fifth ($100,000+) income group scores significantly higher in Conspicuous Consumption than Lowest Fifth ($0 - $20,000) and 2nd Fifth ($20,000 - $40,000). No significant differences were seen in 3rd Fifth ($40,001 - $70,000), and 4th Fifth ($70,001 - $100,000) compare to all other income groups. In order to test if Conspicuous Consumption statistically significantly differs based on income groups in Turkish consumers, Levene’s test was employed to look at the homogeneity of variances. The p value for Levene test was .001 which indicates that homogeneity of variance assumption was not met (p < .05). Therefore, Welch ANOVA test was employed. Also as a post-hoc test, Games-Howell test was preferred instead of Tukey (Moder, 2010). Results of the Welch ANOVA test on Table 15 show p < .05 where p = .043. Thus, it can be concluded that Conspicuous Consumption significantly differs based on income groups in Turkish consumers. Therefore, H11b hypothesis is accepted. Table 15: Income Groups and CCO ANOVA results in Turkish Sample
7.105 4 1.776 1.904 .043
583.217 625 .933
590.323 629
In order to understand which income groups have significant differences in Conspicuous Consumption, Games-Howell post-hoc test was employed. Results show that Highest fifth (5001 TL+) income group scores significantly higher in Conspicuous Consumption than 3rd Fifth (25001 TL - 3500 TL) income group. Also Highest fifth (5001 TL+) income group has a non-significant but considerably higher Conspicuous Consumption score compared to Lowest fifth (O TL - 1500 TL) and 2nd Fifth (15001 TL - 2500 TL) income groups. No significant differences were seen in other income groups. Even though there are studies that show conspicuous consumption with low priced products and services, our results indicate that the more disposable income a person has, the more they are inclined to engage in conspicuous consumption in both cultures. ANOVA analysis conducted to test if CCO statistically significantly differs based on education in both samples, Results showed that Conspicuous Consumption does not statistically significantly differ based on education in both American and Turkish samples. OCBB and Gender:
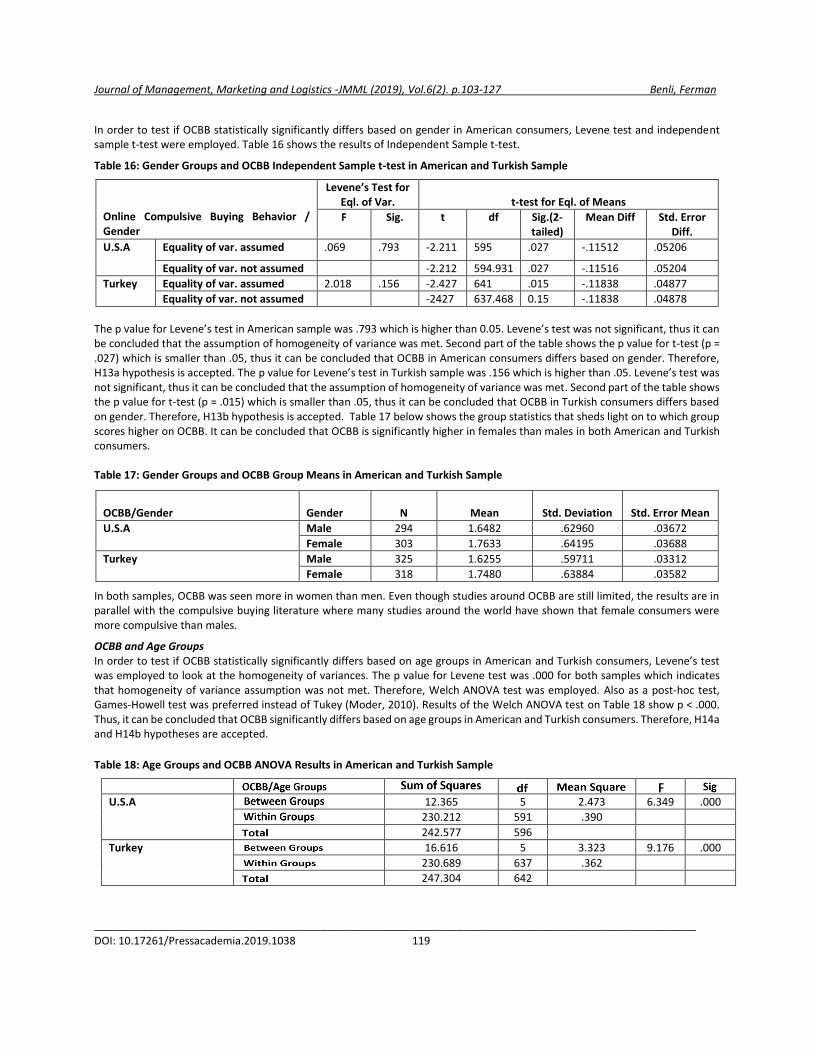
Journal of Management, Marketing and Logistics -JMML (2019), Vol.6(2). p.103-127 Benli, Ferman
_____________________________________________________________________________________________________ DOI: 10.17261/Pressacademia.2019.1038 119
In order to test if OCBB statistically significantly differs based on gender in American consumers, Levene test and independent sample t-test were employed. Table 16 shows the results of Independent Sample t-test.
Table 16: Gender Groups and OCBB Independent Sample t-test in American and Turkish Sample
Online Compulsive Buying Behavior / Gender
Levene’s Test for Eql. of Var.
t-test for Eql. of Means
F Sig. t df Sig.(2-tailed)
Mean Diff Std. Error Diff.
U.S.A
Equality of var. assumed .069 .793 -2.211 595 .027 -.11512 .05206
Equality of var. not assumed -2.212 594.931 .027 -.11516 .05204
Turkey Equality of var. assumed 2.018 .156 -2.427 641 .015 -.11838 .04877
Equality of var. not assumed -2427 637.468 0.15 -.11838 .04878
The p value for Levene’s test in American sample was .793 which is higher than 0.05. Levene’s test was not significant, thus it can be concluded that the assumption of homogeneity of variance was met. Second part of the table shows the p value for t-test (p = .027) which is smaller than .05, thus it can be concluded that OCBB in American consumers differs based on gender. Therefore, H13a hypothesis is accepted. The p value for Levene’s test in Turkish sample was .156 which is higher than .05. Levene’s test was not significant, thus it can be concluded that the assumption of homogeneity of variance was met. Second part of the table shows the p value for t-test (p = .015) which is smaller than .05, thus it can be concluded that OCBB in Turkish consumers differs based on gender. Therefore, H13b hypothesis is accepted. Table 17 below shows the group statistics that sheds light on to which group scores higher on OCBB. It can be concluded that OCBB is significantly higher in females than males in both American and Turkish consumers. Table 17: Gender Groups and OCBB Group Means in American and Turkish Sample
OCBB/Gender Gender N Mean Std. Deviation Std. Error Mean
U.S.A Male 294 1.6482 .62960 .03672
Female 303 1.7633 .64195 .03688
Turkey Male 325 1.6255 .59711 .03312
Female 318 1.7480 .63884 .03582
In both samples, OCBB was seen more in women than men. Even though studies around OCBB are still limited, the results are in parallel with the compulsive buying literature where many studies around the world have shown that female consumers were more compulsive than males.
OCBB and Age Groups In order to test if OCBB statistically significantly differs based on age groups in American and Turkish consumers, Levene’s test was employed to look at the homogeneity of variances. The p value for Levene test was .000 for both samples which indicates that homogeneity of variance assumption was not met. Therefore, Welch ANOVA test was employed. Also as a post-hoc test, Games-Howell test was preferred instead of Tukey (Moder, 2010). Results of the Welch ANOVA test on Table 18 show p < .000. Thus, it can be concluded that OCBB significantly differs based on age groups in American and Turkish consumers. Therefore, H14a and H14b hypotheses are accepted.
Table 18: Age Groups and OCBB ANOVA Results in American and Turkish Sample
U.S.A 12.365 5 2.473 6.349 .000
230.212 591 .390
242.577 596
Turkey 16.616 5 3.323 9.176 .000
230.689 637 .362
247.304 642
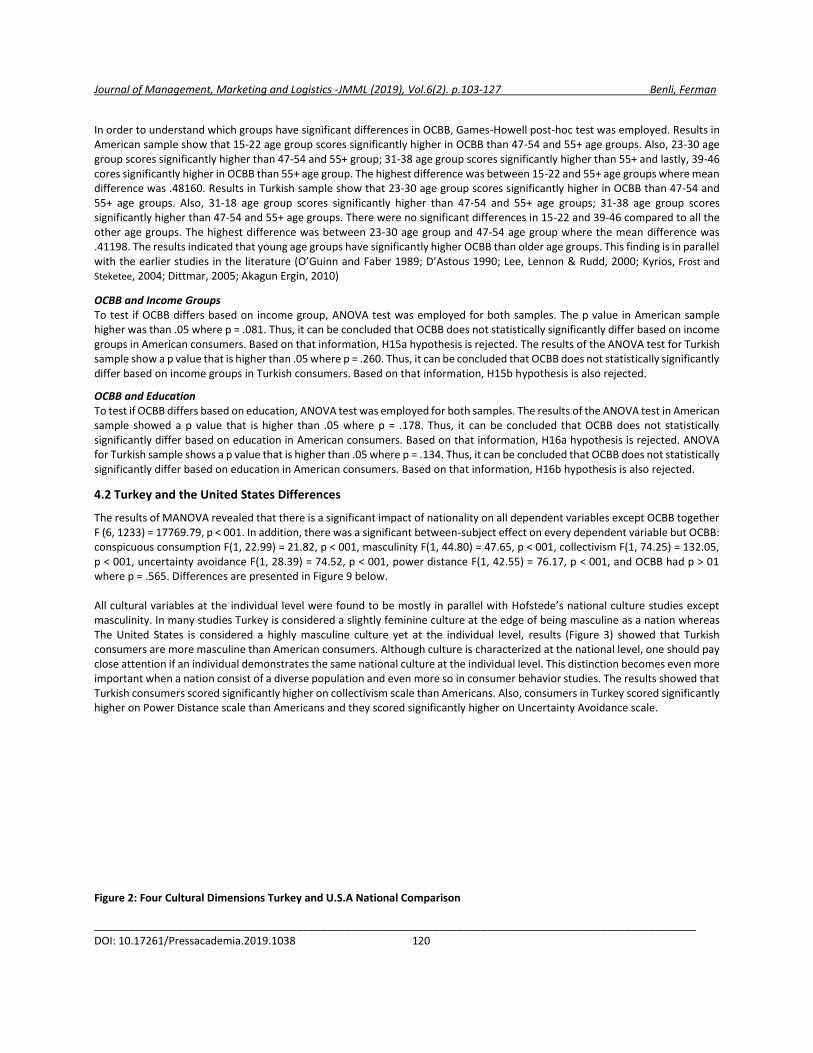
Journal of Management, Marketing and Logistics -JMML (2019), Vol.6(2). p.103-127 Benli, Ferman
_____________________________________________________________________________________________________ DOI: 10.17261/Pressacademia.2019.1038 120
In order to understand which groups have significant differences in OCBB, Games-Howell post-hoc test was employed. Results in American sample show that 15-22 age group scores significantly higher in OCBB than 47-54 and 55+ age groups. Also, 23-30 age group scores significantly higher than 47-54 and 55+ group; 31-38 age group scores significantly higher than 55+ and lastly, 39-46 cores significantly higher in OCBB than 55+ age group. The highest difference was between 15-22 and 55+ age groups where mean difference was .48160. Results in Turkish sample show that 23-30 age group scores significantly higher in OCBB than 47-54 and 55+ age groups. Also, 31-18 age group scores significantly higher than 47-54 and 55+ age groups; 31-38 age group scores significantly higher than 47-54 and 55+ age groups. There were no significant differences in 15-22 and 39-46 compared to all the other age groups. The highest difference was between 23-30 age group and 47-54 age group where the mean difference was .41198. The results indicated that young age groups have significantly higher OCBB than older age groups. This finding is in parallel with the earlier studies in the literature (O’Guinn and Faber 1989; D’Astous 1990; Lee, Lennon & Rudd, 2000; Kyrios, Frost and
Steketee, 2004; Dittmar, 2005; Akagun Ergin, 2010)
OCBB and Income Groups To test if OCBB differs based on income group, ANOVA test was employed for both samples. The p value in American sample higher was than .05 where p = .081. Thus, it can be concluded that OCBB does not statistically significantly differ based on income groups in American consumers. Based on that information, H15a hypothesis is rejected. The results of the ANOVA test for Turkish sample show a p value that is higher than .05 where p = .260. Thus, it can be concluded that OCBB does not statistically significantly differ based on income groups in Turkish consumers. Based on that information, H15b hypothesis is also rejected.
OCBB and Education To test if OCBB differs based on education, ANOVA test was employed for both samples. The results of the ANOVA test in American sample showed a p value that is higher than .05 where p = .178. Thus, it can be concluded that OCBB does not statistically significantly differ based on education in American consumers. Based on that information, H16a hypothesis is rejected. ANOVA for Turkish sample shows a p value that is higher than .05 where p = .134. Thus, it can be concluded that OCBB does not statistically significantly differ based on education in American consumers. Based on that information, H16b hypothesis is also rejected.
4.2 Turkey and the United States Differences
The results of MANOVA revealed that there is a significant impact of nationality on all dependent variables except OCBB together F (6, 1233) = 17769.79, p < 001. In addition, there was a significant between-subject effect on every dependent variable but OCBB: conspicuous consumption F(1, 22.99) = 21.82, p < 001, masculinity F(1, 44.80) = 47.65, p < 001, collectivism F(1, 74.25) = 132.05, p < 001, uncertainty avoidance F(1, 28.39) = 74.52, p < 001, power distance F(1, 42.55) = 76.17, p < 001, and OCBB had p > 01 where p = .565. Differences are presented in Figure 9 below. All cultural variables at the individual level were found to be mostly in parallel with Hofstede’s national culture studies except masculinity. In many studies Turkey is considered a slightly feminine culture at the edge of being masculine as a nation whereas The United States is considered a highly masculine culture yet at the individual level, results (Figure 3) showed that Turkish consumers are more masculine than American consumers. Although culture is characterized at the national level, one should pay close attention if an individual demonstrates the same national culture at the individual level. This distinction becomes even more important when a nation consist of a diverse population and even more so in consumer behavior studies. The results showed that Turkish consumers scored significantly higher on collectivism scale than Americans. Also, consumers in Turkey scored significantly higher on Power Distance scale than Americans and they scored significantly higher on Uncertainty Avoidance scale. Figure 2: Four Cultural Dimensions Turkey and U.S.A National Comparison

Journal of Management, Marketing and Logistics -JMML (2019), Vol.6(2). p.103-127 Benli, Ferman
_____________________________________________________________________________________________________ DOI: 10.17261/Pressacademia.2019.1038 121
Figure 3: Comparison of American and Turkish Sample on all Variables
Looking at CCO and OCBB, Turkish consumers scored significantly higher on conspicuous consumption than Americans whereas American consumers scored significantly higher on OCBB than Turks. Conspicuous Consumption literature provides little information about why a certain culture would engage more in Conspicuous Consumption than another culture, however, there are studies suggesting individualist cultures are more inclined to consume conspicuously (Souiden et al, 2011; Teimourpour and Hanzaee, 2011). Also those studies have noted that desire for uniqueness, is known to be a core descriptive element of conspicuous consumption is correlated negatively with collectivism. On the other hand, others showed that collectivistic cultures are more prone to positive evaluations of publicly visible possessions than consumers from individualistic cultures (Wong & Ahuvia, 1998). Therefore, it is difficult to attribute the difference in conspicuousness levels just to individualism/collectivism dimension. Studies (Piron, 2000; Moon and Chan 2005; Kim and Zhang, 2014; Varman and Vikas 2005) have showed conspicuous consumption as a socially desirable way to converse affluence and social position in societies with a large power distance and also those studies showed that consumers with high power-distance belief are more inclined towards status brands when compared to people with low level of power-distance belief. The main reasons behind status purchases are demonstration of power and position; hence status purchases are more frequent in cultures with large power distance. Furthermore, in these cultures, power distance is used to explain importance of being different (De Mooij & Hofstede, 2011); therefore, people believe that one should show his or her social status clearly and without disambiguation, because only then will other people show the respect that the person really deserves (De Mooij & Hofstede, 2011). To remind, Turkey scored significantly higher on Power Distance in both at the national level and individual level which could be one of the explanations why Conspicuous Consumption Orientation was higher in Turkish consumers than Americans. Also in people with high masculine orientation, expensive, unique, and luxury goods are important means that one uses to showcase success (Bezzaouia and Joanta, 2016) and high masculinity creates more conspicuous consumption (Shoham, et al., 2015). Turkish consumers scored significantly higher on masculinity at the individual level compared to Americans as well and this could also shed light to the difference in conspicuousness among Turkish and
0 10 20 30 40 50 60 70 80 90 100
Masculinity
Power Distance
Individualism
Uncertainty Avoidance
Hofstede's 4 Cultural DimensionsTurkey and U.SA Comparison
Turkey United States of America
0 1 2 3 4 5
Online Compulsive Buying…
Conspicuous Consumption
Masculinity
Power DIstance
Collectivism
Uncertainty Avoidance
Mean
Var
iab
le
Turkey
United States of America

Journal of Management, Marketing and Logistics -JMML (2019), Vol.6(2). p.103-127 Benli, Ferman
_____________________________________________________________________________________________________ DOI: 10.17261/Pressacademia.2019.1038 122
American consumers. On the other hand, one should not neglect the fact that there could be other factors such as personal and physiological traits that could potentially play role in CCO that were not part of the scope of this study. The amount of compulsive buyers in each sample was calculated based on Faber and O’Guinn’s formula that is provided below;
“Scoring equation = -9.69 + (Q1 * 0.33) + (Q2 * 0.34) + (Q3 * 0.50) + (Q4 * 0.47) + (Q5 * 0.33) + (Q6 * 0.38) + (Q7 * .31) where an overall score higher negative score than -1.34, would classify that person as a compulsive buyer.” (Faber and O’Guinn, 1992).
In, Turkish sample, 41 participants out of 643 were compulsive buyers which equates to 6.38% whereas in American sample, 53 participants out of 597(8.88%) were compulsive buyers. These numbers are in parallel with the study of O’Guinn and Faber (1989) where they have found 6% compulsiveness in American consumers and with a later study of Faber and O’Guinn (1992) conducted in American consumers where they have found 8% compulsiveness. There are other studies conducted in Canada and India (Hassay and Smith, 1996) that have shown considerably higher compulsiveness values between 10% - 18%, however, those results are not surprising at all because they were conducted only on young university students and previous studies had shown that age is a significant indicator of CBB, where younger people are more prone to this behavior than older people. (O’Guinn and Faber, 1989; Dittmar, 2005). Therefore, the results are in parallel with the literature. This result is also in parallel with the findings in the literature where Caldwell-Harris and Aycicegi (2006) noted that individualism is correlated to more personality pathology including obsessive-compulsive disorders when compared to collectivism. Moreover, gambling, is known to be more prevalent in individualistic cultures. Also, individualistic societies and consumers positively evaluate active risk-taking, and are less retraining towards gambling, which is an addictive and compulsive behavior (Ciarrocchi, Kirschner, & Fallik, 1991). Therefore, it can be said that the findings of this research are supporting the literature.
5. CONCLUSION
The study was successful in discovering the relationships between cultural dimensions at the individual level and two important outcomes of consumer society which have not been closely examined in the literature. Specifically, the study successfully showcased the influence of cultural dimensions (COLL, PD, MASC and UA) on conspicuous consumption orientation and online compulsive buying behavior in both American and Turkish consumers with differences in the power of each variables’ effect on dependent variables. More specifically, PD was found to be the dominant dimension affecting conspicuousness and online compulsive buying behavior in Turkish sample, whereas COLL/IND had the greatest impact in American sample. Also, COLL, PD and UA were discovered to be in relation with OCBB, but MASC was not. The research model tested for each country were found to be explanatory. Also, the study demonstrated that there is a moderate and positive correlation between consumer’s conspicuous consumption orientation and online compulsive buying behavior which can be considered as another contribution to the body of knowledge despite the general belief that compulsive buyers are just addicted consumers that have no interest in displaying their possessions. Furthermore, the study showed and discussed the variations in cultural dimensions at the individual level, conspicuous consumption orientation and online compulsive buying behavior across Turkish and American consumers and demonstrated how demographics play a significant role in consumer’s conspicuousness and compulsiveness.
This study contains valuable information and managerial implications for marketing professionals who want to implement different marketing strategies in different cultural settings. The greatest impact on conspicuous consumption orientation was power distance in Turkey and collectivism/individualism in The United States. Thus, one of the important recommendations would be to consider designing marketing strategies where the effort is more geared towards a way that the product promotes and clearly distinguishes one’s social status in Turkish market whereas in the U.S, that emphasis can be put more on the uniqueness, rareness and exclusivity of the product. This approach can be useful when a certain brand desire to position itself as a consciously consumed brand or product which in turn can increase their customer base in the corresponding culture. On the other hand, as an unwanted outcome of consumer society, online compulsive buying behavior was found to be directly correlated with conspicuous consumption which shows that the construct should be examined more closely. Future studies should study online compulsive buying behavior by introducing more variables into the model in an attempt to understand if online compulsive buying differs from regular compulsive behavior and uncover more about the nature of compulsiveness in online realm. That way, the findings can become even more valuable to be used in marketing promotions, online shopping website designs and consumer educations when targeting Americans and Turkish consumers. Study showed that young adults are more inclined to both conspicuous consumption and online compulsive buying behavior and women engage more in OCBB which could be another opportunity to further focus the study on young adults and pay more attention to a comparison among younger generations. Based on Faber and O’Guinn (1992) formula, 41 participants out of 643 were compulsive buyers in Turkish sample which equates to 6.38% whereas in American sample, 53 participants out of 597(8.88%) were compulsive buyers. These numbers are in parallel with the study of O’Guinn and Faber (1989) where they have found 6% compulsiveness in American consumers and with a later

Journal of Management, Marketing and Logistics -JMML (2019), Vol.6(2). p.103-127 Benli, Ferman
_____________________________________________________________________________________________________ DOI: 10.17261/Pressacademia.2019.1038 123
study of Faber and O’Guinn (1992) conducted in American consumers where they have found 8% compulsiveness reminding that those studies were not conducted specifically for internet shopper. Therefore, it is another contribution to the literature to showcase the amount of compulsive consumers among online shoppers in Turkey and the U.S.
All cultural variables at the individual level were found to be mostly in parallel with Hofstede’s national culture studies except masculinity. In many studies Turkey is considered a slightly feminine culture at the edge of being masculine as a nation whereas The United States is considered a highly masculine culture yet at the individual level, the study showed Turkish consumers are more masculine than American consumers. Although culture is characterized at the national level, it is crucial to see if an individual demonstrates the same national culture at the individual level. This distinction is even more important when a nation consists of a diverse population and even more so in consumer behavior studies. Despite the fact that cultural orientations can differ at the individual level compared to the nation’s culture, American consumers scoring significantly lower in masculinity dimension than Turkish consumers might indicate that a different scale could be a better fit in future research because the questions in masculinity questionnaire was gender and workplace focused and the shift in American culture towards more gender inclusive language might have hindered the results.
Other limitations of the study should not be ruled out when analyzing the findings. The primary limitation is that convenience sampling was employed because of the budget and time constraints of the research. Also, only one city from each country (Istanbul and Washington DC) were included in the study. Therefore one should consider these limitations when generalizing the findings to Turkey and The United States. Thus, it would be beneficial to replicate the study in other areas of each country. This approach would also provide additional insight into comparing different parts of each nation and help marketing managers target certain parts of each country differently based on various cultural orientations, conspicuousness and compulsiveness that might exist. Also, since it is known that cultural dimensions can influence the group of product or services chosen, future studies may include an investigation of products that people consume which could shed light into which product group is predominantly used conspicuously and compulsively in different cultures. Also since the study showed that in Turkish sample, PD had the greatest impact on conspicuous consumption orientation and online compulsive buying whereas in American sample it was IND/COLL dimension, comparing the choice of products consumed conspicuously and compulsively in each culture can not only have great managerial implications but also can lead to development of better consumer education programs in the society. Moreover, in Turkish sample majority of respondents were married (59.3%) whereas in the U.S sample, majority of respondents were single (50.4%) which is not surprising considering the cultural differences and importance put into marriage in each culture. Even though there were no significant differences in gender and age groups among samples, there were some differences in income groups which indicates that the findings containing age groups should be generalized carefully. In future research, quota sampling might be introduced to make sure that there is no significant differences occur in income groups among samples.
Furthermore, the literature review hinted that cultural dimensions can impact many behavioral patterns in purchasing decision and this study successfully showcased the impact of cultural dimensions on two important outcomes of consumer society (CCO and OCBB). Therefore it is reasonable to suspect that cultural dimensions at the individual level may also be linked with other important elements within consumer behavior literature. Although it was not part of the scope of this research, it would be of significant interest to stretch this study further and with a thorough literature review include relevant variables such as impulse buying, brand loyalty, fashion orientation, advertisement and brand attitude, etc., and investigate the impact of cultural dimensions at the individual level on each of them in a cross-cultural setting which in turn would be a great addition to the body of knowledge and can further assist marketing professionals develop better strategies for different cultures. Lastly, the cultural orientation scale (CVSCALE) used in this study considers each orientation as unidimensional constructs, yet some indicators suggest that more than one dimension for each orientation can exist at the individual level even though those scales have not been thoroughly tested in cross-cultural settings. For instance, evidence shows that individualism/collectivism tendencies can coexist in one person (Sharma, 2010). Also, the same study suggests masculinity can have a sub-dimension called gender equality. Therefore, using a scale that does not treat each cultural orientation as unidimensional constructs should be a consideration in later studies.
REFERENCES
Akagun Ergin, E. (2010). Compulsive buying behavior tendencies: The case of Turkish consumers. African Journal of Business Management. 4. 333-338.
Ali, S. & Sudan, S. (2018). Influence of Cultural Factors on Impulse Buying Tendency: A Study of Indian Consumers. Vision: The Journal of Business Perspective. 22. 097226291775024. 10.1177/0972262917750247.
Journal of Management, Marketing and Logistics -JMML (2019), Vol.6(2). p.103-127 Benli, Ferman
_____________________________________________________________________________________________________ DOI: 10.17261/Pressacademia.2019.1038 124
Ayoun, M.B., & Moreo, P. (2008). The influence of the cultural dimension of uncertainty avoidance on business strategy development: A cross-national study of hotel managers. International Journal of Hospitality Management. 27. 65-75. 10.1016/j.ijhm.2007.07.008.
Babin, B. J., Darden. W. R., Griffin, M. (1994). Work and/or Fun: Measuring Hedonic and Utilitarian Shopping Value, Journal of Consumer Research, Volume 20, Issue 4, March 1994, Pages 644–656.
Baumgartner, H., & Steenkamp. J. B. (1996), “Exploratory consumer buying behavior: conceptualization and measurement”, International Journal of Research in Marketing, Vol. 13, pp. 121-137.
Belk, R. (1988). Possessions as the Extended Self. Journal of Consumer Research. 15. 139-68. 10.1086/209154.
Bezzaouia, M., & Joanta, A. R. (2016). The relationships between cultural values and consumer motivations for purchasing luxury brands. Ecoforum Journal, 5(1), 150-161.
Black, D. W. (2007). A review of compulsive buying disorder. World Psychiatry, 6(1), 14- 18.
Bleuler E (1924) Textbook of Psychiatry, translated by AA Brill. London: Allen and Unwin; originally published as Lehrbuch der Psychiatrie, 4th edition.
Bolarinwa, O. (2016). Principles and methods of validity and reliability testing of questionnaires used in social and health science researches. The Nigerian postgraduate medical journal. 22. 195-201. 10.4103/1117-1936.173959.
Bouchet, D. (1995). Marketing and the redefinition of ethnicity in: Marketing in a Multicultural World, (Eds.) Janeen A. Costa B., and Gary B., London UK: Sage, London, pp. 68-94.
Bragg, J. (2009). Digging Out From $80,000 in Debt. Retrieved from: CNN.com.
Browne, B. A., Kaldenberg, D. O., (1997) Conceptualizing self‐monitoring: links to materialism and product involvement, Journal of Consumer Marketing, Vol. 14 Issue: 1, pp. 31-44.
Burroughs, J., & Rindfleisch, A. (2002). Materialism and Well‐Being: A Conflicting Values Perspective. Journal of Consumer Research, 29(3), 348-370. doi:10.1086/344429.
Caldwell-Harris, C. L., & Aycicegi, A. (2006). When personality and culture clash: The psychological distress of allocentrics in an individualist culture and idiocentrics in a collectivist culture. Transcultural Psychiatry, 43(3), 331-361.
Campbell, A. (1976). Subjective measures of well-being. American psychologist, 31(2), 117-174.
Campbell, C. (1995). Conspicuous confusion? A critique of Veblen’s theory of conspicuous consumption. Sociological Theory 13(1): 37-47.
Campbell, C. (2000). Shopaholics, spendaholics, and the question of gender. In A. Benson (Ed.), I shop, therefore I am: Compulsive buying and the search for self (pp. 57–75). New York: Aronson.
Chacko, P. S., Ramanathan, H. N. (2015). Materialism and Conspicuous Consumption– The Extend Matters. A Study among Consumers in Kerala. International Journal of Emerging Research in Management &Technology, 4(5), 381-387.
Chaudhuri, H. R., & Majumdar, S. (2006). Of diamonds and desires: understanding conspicuous consumption from a contemporary marketing perspective. Academy of Markeing Science Review, 2006, 11, 1-18.
Chaudhuri, H., R., Majumdar, S., & Ghoshal, A. (2011). Conspicuous consumption orientation: Conceptualisation, scale development and validation. Journal of Consumer Behaviour, 10(4), 216-224.
Ciarrocchi, J. W., Kirschner, N. M., & Fallik, F. (1991). Personality dimensions of male pathological gamblers, alcoholics, and dually addicted gamblers. Journal of Gambling Studies, 7(2), 133-141. http://dx.doi.org/10.1007/BF01014528
Cohen, J., Cohen, P., West, S. G., & Aiken, L. S. (2003). Applied multiple regression/correlation analysis for the behavioral sciences (3rd ed.). Mahwah, NJ, US: Lawrence Erlbaum Associates Publishers.
D’Astous, A. (1990). An Inquiry into the Compulsive Side of Normal Consumers. Journal of Consumer Policy, 13 (1), 15-32
Dawar N., Parker P., & Price L. J. (1996). A cross-cultural study of interpersonal information exchange, Journal of International Business Studies, 27(3), 497-516.
De Mooij, M. (2010). Global marketing and advertising: Understanding cultural paradoxes, (3rd Edition). Thousand Oaks, CA: Sage.
De Mooij, M. (1998). Global marketing and advertising: Understanding cultural paradoxes. Thousand Oaks, CA: Sage.
De Mooij, M. (2004). Consumer behavior and culture: Consequences for global marketing and advertising. London, UK: Sage Publications.
Journal of Management, Marketing and Logistics -JMML (2019), Vol.6(2). p.103-127 Benli, Ferman
_____________________________________________________________________________________________________ DOI: 10.17261/Pressacademia.2019.1038 125
De Mooij, M., & Hofstede, G. (2011). Cross-cultural consumer behavior: A review of research findings. Journal of International Consumer Marketing, 23(3-4), 181-192.
Demaree, H. A., DeDonno, M. A., Burns, K. J., Feldman, P., & Everhart, D. E. (2009). Trait dominance predicts risk-taking. Personality and Individual Differences, 47(5), 419-422.
Dittmar, H. (2005). Compulsive buying – a growing concern? An examination of gender, age, and endorsement of materialistic values as predictors. British Journal of Psychology, 96, 467-491.
Donthu, N. & Garcia, A. (1999). The Internet shopper. Journal of Advertising Research, 39, 52– 58.
Eastman, J. K., Calvert, S., Campbell, D. & Fredenberger, B. (1997). The relationship between status consumption and materialism: A cross-cultural comparison of Chinese, Mexican and American students. Journal of Marketing Theory and Practice, 5, 52–66.
Faber, R. J., & O’Guinn, T. O. Krych. R. (1987). Compulsive consumption. Advances in Consumer Research, 14(1), 132-135.
Faber, R. J., & O'Guinn, T. C. (1992). A clinical screener for compulsive buying. Journal of Consumer Research, 19(3), 459-469.
Faber, R. J., Christenson, G. A., De Zwaan, M., & Mitchell, J. (1995). Two forms of compulsive consumption: Comorbidity of compulsive buying and binge eating. Journal of Consumer Research, 22(3), 296-304.
Frank, R. H. (1999). Luxury fever: Money and happiness in an era of excess. Princeton, NJ: Princeton University Press.
Gilman, N. (1999). Thorstein Veblen’s neglected feminism. Journal of Economic Issues, 32, 689–711.
Glatt, M. M., & Cook, C. C. (1987). Pathological spending as a form of psychological dependence. British Journal of Addiction, 82(11), 1257-1258.
Goldsmith R., Flynn L., Clark, R., (2012). Motivators of market mavenism in the retail environment. Journal of Retailing and Consumer Services. 19. 390–397. 10.1016/j.jretconser.2012.03.005.
Hassay, D. N., & Smith, M. C. (1996). Compulsive buying: An examination of the consumption motive. Psychology & Marketing, 13(8), 741-752.
Hofstede, G., & Bond, M. H. (1984). Hofstede's culture dimensions: An independent validation using Rokeach's Value Survey. Journal of Cross-Cultural Psychology, 15(4), 417-433.
Hofstede G., Hofstede G. J., Minkov M. (2010). Cultures and organizations: Software of the mind (3rd. edition). New York, NY: McGraw-Hill.
Hwa-Froelich, D. A., & Vigil, D. C. (2004). Three aspects of cultural influence on communication: A literature review. Communication Disorders Quarterly, 25(3), 107-118.
Inkeles, A., & Levinson, D. J. (1969). National character: The study of modal personality and sociocultural systems. In: Lindzey, G. and Aronson, E. (eds), The handbook of social psychology, 4. Addison-Wesley, MA.
Jan-Benedict E. M. Steenkamp, Hofstede, F., & Wedel, M. (1999). A Cross-National Investigation into the Individual and National Cultural Antecedents of Consumer Innovativeness. Journal of Marketing, 63(2), 55-69. DOI:10.2307/1251945
Kacen, J. J. & Lee, J. A. (2002). The influence of culture on consumer impulsive buying behavior, Journal of Consumer Psychology, 12(2), 163–176.
Keltner, D., Gruenfeld, D. H., & Anderson, C. (2003). Power, approach, and inhibition. Psychological Review, 110(2), 265-284.
Kerin, R. A., Hartley, S. W., & Rudelius, W. (2011). Marketing, 10th ed. Irvin, NY:McGraw-Hill.
Kim, Y., & Zhang, Y. (2014). The impact of power-distance belief on consumers’ preference for status brands. Journal of Global Marketing, 27(1), 13-29.
Kim, J., & Mueller, C. W. (1978).Quantitative Applications in the Social Sciences: Factor analysis. Thousand Oaks, CA: SAGE Publications, Inc. doi: 10.4135/9781412984256
Kraepelin E. (1915). Psychiatrie, 8th ed. Leipzig, DE: Barth.
Kroeber‐Riel, W., Weinberg, P., Gröppel‐Klein, A. (2009). Konsumentenverhalten, 9. Aufl, München, DE: Vahlen.
Krueger, D. W. (1988). On compulsive shopping and spending: A psychodynamic inquiry. American Journal of Psychotherapy, 42(4), 574-584.
Kyrios, M., Frost, R.O., & Steketee, G. (2004). Cognitions in compulsive buying and acquisition. Cognitive Therapy and Research.;28:241–258

Journal of Management, Marketing and Logistics -JMML (2019), Vol.6(2). p.103-127 Benli, Ferman
_____________________________________________________________________________________________________ DOI: 10.17261/Pressacademia.2019.1038 126
Lee, S. & Lennon, S., & Rudd, N. (2000). Compulsive Consumption Tendencies Among Television Shoppers. Family and Consumer Sciences Research Journal. 28. 463 - 488. 10.1177/1077727X00284003.
Lejoyeux, M., Ades, J., Tassain, V., & Solomon, J. (1996). Phenomenology and psychopathology of uncontrolled huying. American Joumal of Psychiatry, 153, 1524-1529
Li D., Jiang Y., An S., Shen Z., Jin W. (2009) The influence of money attitudes on young Chinese consumers’ compulsive buying. Young Consumers: Insight and Ideas for Responsible Marketers, 10(2): 98–109
Markus, H., Kitayama, S. (1991). Culture and the self: implications for cognition, emotion, and motivation, Psychological Review, 98(2), 224-253.
Matsumoto, D., Juang, L. (2004). Culture and psychology (3rd edition). Belmont, CA: Wadsworth
McCracken, G. (1986). Culture and consumption: a theoretical account of the structure and movement of the cultural meaning of consumer goods. Journal of Consumer Research, 13, 71–84.
McElroy, S. L., Keck, P. E., Pope, H. G., Smith, J. M. R., & Strakowski, S. M. (1994). Compulsive buying: A report of 20 cases. The Journal of Clinical Psychiatry, 55(6), 242-248.
McElroy, S. L., Pope, H. G., Hudson, J. I., Keck, P. E., & White, K. L. (1991). Kleptomania: A report of 20 cases. The American Journal of Psychiatry, 148, 652-657.
Memushi, A. (2013). Conspicuous consumption of luxury goods: literature review of theoretical and empirical evidences. International Journal of Scientific & Engineering Research, 4(12), 250-255.
Mennicken, C. (2000). Interkulturelles Marketing: Wirkungszusammenhänge zwischen Kultur, Konsumverhalten und Marketing. Wiesbaden DE: Wirtschaftswissenschaft.
Mitchell, J. E., Hatsukami, D., Eckert, E. D., & Pyle, R. L. (1985). Characteristics of 275 patients with bulimia. The American Journal of Psychiatry, 142, 482-485.
Moon, Y., & Chan, K. (2005). Advertising appeals and cultural values in television commercials: A comparison of Hong Kong and Korea, International Marketing Review, Vol. 22 Issue: 1, pp.48-66, https://doi.org/10.1108/02651330510581172
Neuner, M., Raab, G. & Reisch, L. (2005). Compulsive buying in maturing consumer societies: an empirical re-inquiry. Journal of Economic Psychology, 26 (4), 509 – 522.
Nicholls, J., Li, F., Mandokovic, T., Roslow, S., & Kranendonk, C. (2000). U.S. Chilean mirrors: Shoppers in two countries, Journal of Consumer Marketing, 17(2), 106-119.
O’Cass, A. (2001). Consumer self-monitoring, materialism and involvement in fashion clothing. Australasian Marketing Journal, 9, 46–60.
O'Guinn, T. C., & Faber, R. J. (1989). Compulsive buying: A phenomenological exploration. Journal of Consumer Research, 16(2), 147-157.
Park, H. J., & Davis Burns, L. (2005). Fashion orientation, credit card use, and compulsive buying. Journal of Consumer Marketing, 22(3), 135-141.
Parsons, T. (1977). Der Stellenwert des Identitätsbegriffs in der allgemeinen Handlungstheorie, In: Dobert, R., Habernas, J., & Nunner-Winkler, G., (Hg.): Entwicklung des Ichs, Koln, 68-88.
Piron, F. (2000). Consumers’ perceptions of the country-of-origin effect on purchasing intentions of (in) conspicuous products. Journal of consumer marketing, 17(4), 308-321.
Richins, M. (1994). Special Possessions and the Expression of Material Values. Journal of Consumer Research, 21(3), 522-533.
Richins, M. L., & Dawson, S. (1992). A consumer values orientation for materialism and its measurement: Scale development and validation. Journal of Consumer Research, 19(3), 303-316.
Roberts, J. A. (1998). Compulsive buying among college students: an investigation of its antedecents, consequences, and implications for public policy. Journal of Consumer Affairs, 32(2), 295-319.
Roberts, J.A. & Manolis, C. (2000). Baby boomers and busters: an exploratory investigation of attitudes toward marketing, advertising and consumerism. Journal of Consumer Marketing, 17 (6), 481-497.
Rose, G. M., Boush, D., & Shoham, A. (2002) “Family communication and children's purchasing influence: A cross-national examination” Journal of Business Research, Vol. 55, pp. 867-873.
Rose, S., & Dhandayudham, A. (2014). Towards an understanding of Internet-based problem shopping behaviour: The concept of online shopping addiction and its proposed predictors. Journal of behavioral addictions, 3(2), 83–89. doi:10.1556/JBA.3.2014.003
Schmitt, B. H., Y. Pan, (1994). Managing corporate and brand identities in the Asia-Pacific Region, California Management Review, 36, 32-48
Journal of Management, Marketing and Logistics -JMML (2019), Vol.6(2). p.103-127 Benli, Ferman
_____________________________________________________________________________________________________ DOI: 10.17261/Pressacademia.2019.1038 127
Shim, S., Gehrt, K. (1996). Hispanic and Native American adolescents: an exploratory study of their approach to shopping, Journal of Retailing, 72(3), 307-324.
Shoham, A., Gavish, Y., Segev, S.. (2015). A Cross-Cultural Analysis of Impulsive and Compulsive Buying Behaviors among Israeli and U.S. Consumers: The Influence of Personal Traits and Cultural Values. Journal of International Consumer Marketing. 27. 187-206. DOI:10.1080/08961530.2014.1000507.
Souiden, N., M’Saad, B., Pons, F. (2011). A cross-cultural analysis of consumers’ conspicuous consumption of branded fashion access, Journal of International Consumer Marketing, 23, 329–343.
Teimourpour, B., & Heidarzadeh Hanzaee, K. (2011). The impact of culture on luxury consumption behavior among Iranian consumers. Journal of Islamic Marketing, 2(3), 309-328.
Turkyilmaz, C. A., Kocamaz, I. & Uslu, A. (2016), Materialism and Brand Resonance as Drivers of Online Compulsive Buying Behavior, International Journal of Social Science, Number: 43 , p. 91-107, Spring I 2016
Usunier, J. C., Lee, J. A., & Lee, J. (2005). Marketing across cultures. London, UK: Pearson Education.
Valence, G., d'Astous, A., & Fortier, L. (1988). Compulsive buying: Concept and measurement. Journal of Consumer Policy, 11(4), 419-433.DOI: 10.1007/BF00411854.
Varman, R., & Vikas, R. M. (2005).Media, rising consumer culture and the working class. Proceedings of the Critical Management Studies, 42, 1-7.
Veblen, T. B. (1899). The Theory of the Leisure Class. Boston, MA: Houghton Mifflin
Verhallen, T. & Robben, H. (1994). Scarcity and Preference: An Experiment on Unavailability and Product Evaluation. Journal of Economic
Verhallen, T. (1982), Scarcity and consumer choice behavior, Journal of Economic Psychology, 2, issue 4, p. 299-322, https://EconPapers.repec.org/RePEc:eee:joepsy:v:2:y:1982:i:4:p:299-322.
Wallach, M. A., & Kogan, N. (1961). Aspects of judgment and decision making: Interrelationships and changes with age. Behavioral science, 6(1), 23-36.
Wang, J., & Wallendorf, M. (2006). Materialism, Status Signaling, and Product Satisfaction. Journal of the Academy of Marketing Science, 34(4), 494–505. https://doi.org/10.1177/0092070306289291
Wong, N. & Ahuvia, A. (1998). Personal taste and family face: Luxury consumption in Confucian and Western societies. Psychology and Marketing. 15. 423 - 441.
Xu, Y. (2008). The influence of public self-consciousness and materialism on young consumers' compulsive buying. Young consumers, 9(1), 37-48.
Yildirim, E., & Barutçu, M. T. (2016). How uncertainty avoidance, power distance and indulgence affect social commerce expenditure? An investigation based on Facebook. International Journal of Science Culture and Sport, 4(4), 403-421.
Yoo, B., Donthu, N., & Lenartowicz, T. (2011). Measuring Hofstede's five dimensions of cultural values at the individual level: Development and validation of CVSCALE. Journal of International Consumer Marketing, 23(3-4), 193-210.