journal article reporting standards for quantitative … article reporting standards for...
TRANSCRIPT

Journal Article Reporting Standards for Quantitative Research inPsychology: The APA Publications and Communications Board Task
Force Report
Mark AppelbaumUniversity of California, San Diego
Harris CooperDuke University
Rex B. KlineConcordia University, Montréal
Evan Mayo-WilsonJohns Hopkins University
Arthur M. NezuDrexel University
Stephen M. RaoCleveland Clinic, Cleveland, Ohio
Following a review of extant reporting standards for scientific publication, and reviewing 10years of experience since publication of the first set of reporting standards by the AmericanPsychological Association (APA; APA Publications and Communications Board WorkingGroup on Journal Article Reporting Standards, 2008), the APA Working Group on Quanti-tative Research Reporting Standards recommended some modifications to the original stan-dards. Examples of modifications include division of hypotheses, analyses, and conclusionsinto 3 groupings (primary, secondary, and exploratory) and some changes to the section onmeta-analysis. Several new modules are included that report standards for observationalstudies, clinical trials, longitudinal studies, replication studies, and N-of-1 studies. In addition,standards for analytic methods with unique characteristics and output (structural equationmodeling and Bayesian analysis) are included. These proposals were accepted by the Publicationsand Communications Board of APA and supersede the standards included in the 6th edition of thePublication Manual of the American Psychological Association (APA, 2010).
Keywords: reporting standards, research methods, meta-analysis, APA Style
The involvement of the American Psychological Associ-ation (APA) in the establishment of journal article reportingstandards began as part of a mounting concern with trans-
parency in science. The effort of the APA was contempo-raneous with the development of reporting standards inother fields, such as the Consolidated Standards of Report-
Mark Appelbaum, Department of Psychology, University of California,San Diego; Harris Cooper, Department of Psychology and Neuroscience,Duke University; Rex B. Kline, Department of Psychology, ConcordiaUniversity, Montréal, Quebec, Canada; Evan Mayo-Wilson, BloombergSchool of Public Health, Johns Hopkins University; Arthur M. Nezu,Department of Psychology, Drexel University; Stephen M. Rao, Neuro-logical Institute, Cleveland Clinic, Cleveland, Ohio.
The authors comprise the APA Publications and Communications BoardWorking Group on Quantitative Research Reporting Standards (MarkAppelbaum, Chair). The order of authorship is alphabetical. This reportwas prepared with assistance from David Kofalt, Emily Leonard Ayubi,and Anne Woodworth. The group thanks Scott Maxwell, Arthur Stone, andKenneth J. Sher for their contributions to the 2008 Working Group onJournal Article Reporting Standards that served as the foundation for thisarticle. We also thank David Rindskopf, who authored the reportingstandards for the use of Bayesian statistical approaches. We also acknowl-
edge Rick Hoyle, whose 2013 paper with Jennifer Isherwood serves as thebasis for the structural equation modeling reporting standards; Robyn Tate(Tate, Perdices, Rosenkoetter, McDonald, et al., 2016), lead author of “TheSingle-Case Reporting Guideline In BEhavioural Interventions (SCRIBE)2016 Statement: Explanation and Elaboration” that is the basis of theN-of-1 reporting standards; Pamela Cole and others from the Society forResearch in Child Development, who advised on the reporting standardsfor longitudinal designs; Graeme Porte for his comments on the reportingstandards for replication studies; Bruce Thompson, Cecil Reynolds, andRonald Livingston for their comments on reporting standards about psy-chometrics; and members of the Society for Research Synthesis Method-ology for advice on the meta-analysis reporting standards.
Correspondence concerning this article should be addressed to MarkAppelbaum, Department of Psychology, University of California, San Diego,9500 Gilman Drive, La Jolla, CA 92093-0109. E-mail: [email protected]
American Psychologist© 2018 American Psychological Association 2018, Vol. 73, No. 1, 3–250003-066X/18/$12.00 http://dx.doi.org/10.1037/amp0000191
3

ing Trials (CONSORT; see http://www.consort-statement.org/) in the medical sciences. Work on the APA standardsbegan with the appointment of the first Working Group onJournal Article Reporting Standards (JARS) by the Publi-cations and Communications (P&C) Board of APA in 2006.The report of that committee was received by the P&CBoard and subsequently published in the American Psychol-ogist (APA Publications and Communications Board Work-ing Group on Journal Article Reporting Standards, 2008).The content of that report and the article was also incorpo-rated into the sixth edition of the Publication Manual of theAmerican Psychological Association (hereinafter referred toas the Publication Manual; APA, 2010).
In May 2015, the P&C Board of APA authorized theappointment of two working groups: one to revisit andexpand the work of the original JARS (JARS–Quant Work-ing Group or Working Group) and the other to establish newstandards for reporting qualitative research (JARS–QualWorking Group). This report is the result of the delibera-tions of the JARS–Quant Working Group and both updatesthe 2008 article and extends its scope.
Developing New Reporting Standards
The development of reporting standards is an ongoingprocess. In selecting the reporting standards to include inthis report, the Working Group tried to balance severalfactors. These included perceptions of the frequency ofresearch involving a particular research strategy, experi-mental design, or analytic strategy; the extent to which anapproach needed a separate set of reporting standards; andthe state of technical development in the publishing–archiving domains that would allow for the recommendedstandards. The Working Group made judgments that a dif-ferent group of individuals may not have made and expectsthat future groups will continue to develop new standardsand modify some that are in the current document. The listof uncovered topics is long, and the next JARS–QuantWorking Group may venture into domains that are now justbeing developed. One example is the development of re-porting standards for secondary data analysis. Changes inattitudes about data sharing, new technologies for data shar-ing, and emerging ideas about the responsible conduct ofdata-sharing ventures make it likely that reporting standardsfor secondary data analysis may appear in future versions ofreporting standards. The development of reporting stan-dards spans many fields and is an international undertaking.In the process of developing the new standards, the WorkingGroup took into account standards that had been developedin many areas and aspired to utilize features of the existingstandards that could be adapted into the scientific needs ofthe field.
Between Then and Now
Since about the year 2000, many organizations have createdor further refined their own sets of reporting standards. Wherework on these reporting standards overlap with the work oftendone by those in the behavioral, social, and psychologicalsciences, the Working Group has chosen to cite (and, onoccasion, incorporate) those standards into JARS–Quant ratherthan try to develop a complementary set of reporting standards.For example, a few words from the Animal Research: Report-ing of In Vivo Experiments (ARRIVE; Kilkenny et al., 2010)guidelines have been incorporated into JARS–Quant to makethe two sets of standards for reporting studies using nonhumanliving organisms consistent. In the case of reporting standardswhen neuropsychological measurements are used, recent workon standards for reporting work that includes functional MRI(fMRI; e.g., Nichols et al., 2017), event-related potential (ERP;e.g., Picton et al., 2000), and other neuropsychological mea-sures was cited. On other occasions, sections of other pub-lished standards have been adapted into the tables, as in thecase of reporting standards for structural equation modeling(SEM) and N-of-1 studies. Finally, other groups, including theSociety for Research in Child Development and the Society forResearch Synthesis Methodology on longitudinal studies andmeta-analysis, respectively, provided input, as did individualswith special expertise and insights into a particular issue,including David Rindskopf for standards for reporting theresults of studies using Bayesian analyses. For those lookingfor guidelines for study types not covered in JARS–Quant butwith health outcomes, the Enhancing the QUAlity and Trans-parency Of health Research (EQUATOR) network (http://www.equator-network.org/) currently lists more than 300 differentsets of guidelines, including some similar to JARS. TheEQUATOR set contains some guidelines that are general (e.g.,CONSORT) and some that are very narrowly construed, suchas guidelines for reporting studies specific to disease types.
During the same period, there has been a gatheringmovement to register or preregister randomized controltrials and randomized clinical trials (Cybulski, Mayo-Wilson, & Grant, 2016). Although these registrations aremost commonly found in the medical domain, increas-ingly they are appearing for trials with psychoeduca-tional, psychotherapeutic, or related studies. In JARS–Quant, guidance on where to report the registrationinformation for studies that are registered is provided.Some APA journals, at the discretion of their editors, arenow requiring registration of some kinds of clinical trialsto qualify for publication. Routine registration of psycho-logical studies that involve controlled trials is encouragedin JARS–Quant. There are several ways that studies canbe registered, particularly using ClinicalTrials.gov (http://www.clinicaltrials.gov), a registry and results database ofpublicly and privately supported clinical studies usinghuman participants conducted around the world.
4 APPELBAUM ET AL.

The Structure of JARS–Quant
Recommendations in both the JARS–Quant and the originalJARS follow the same basic structure. These recommendationsare stated in a series of tables that apply either singly or incombination to cover varying designs of empirical studies.Over time, additional tables (and modules within tables) maybe added as new reporting standards emerge.
In the current version, there are three general groups oftables: Tables 1–6, the uses of which are determined by thenature of the inquiry being reported; Tables 7 and 8, the usesof which are dictated by specific statistical–quantitative anal-yses being reported; and Table 9, which contains reportingstandards for research syntheses and meta-analysis. Tableshave been designed to be comprehensive and to apply widely.For any individual report, the authors would be expected toselect those items that apply to the particular study. Effortswere made to minimize overlap among tables; however, insome cases, this was not always possible or even desirable.Certain items, such as reporting the flow of participants andparticipant attrition from studies, appear in multiple tables.This was done because the implications of reporting this in-formation may vary over different kinds of studies (e.g., clin-ical trials vs. longitudinal studies). Figure 1 provides a flow-chart that shows the decisions that are made in determiningwhich tables, among Tables 1–6, apply for a particular study.All tables presume that Table 1 has been completed by thereporters of the research. The structure for reporting the flow of
participants through each stage of an experiment or quasi-experiment can be found in the appendix of the PublicationManual of the American Psychological Association (6th ed.;APA, 2010).
The JARS–Quant tables do not specify where this informa-tion should be reported. The intent is for the information to bepresented without compromising the readability of the paper.Information that is needed by the reader to understand thecontent of the report and evaluate the credibility of the resultsand conclusions should be immediately available to the reader(i.e., in the print version or online main text of the article).When possible, well-constructed tables can be used to presentthis information without disturbing the flow of the text. Moredetailed information that would be needed to allow replicationof the empirical data collection or fine-grained understandingof the content of the article can be successfully provided in thesupplemental materials provided by publishers. These supple-mental materials however, should be ones freely open to allreaders of the journal article, not just for subscribers.
Providing the information specified in the JARS–Quanttables is expected to become routine and minimally burden-some because these data are (or should be) regularly col-lected in the process of conducting empirical research; thus,JARS–Quant only represents guidelines for presenting thealready-available data.
Table 1 remains the master table in the JARS–Quanthierarchy. All other tables involve detailed reporting expec-
Step 1
Step 2
Step 3
Step 4
Step 5
If your study involved an experimental manipulation
Follow Table 2
If your study did not involve an experimental
manipulation
Follow Table 3
If your study was conducted on a single
individual
Follow Table 5
If your study used random assignment to place participants
in conditions
Follow Table 2, Module A
If your study did not use random assignment to place participants in
conditions
Follow Table 2, Module B
If your study collected data on more than one occasion
Follow Table 4
If your study was intended to be a replication of an earlier study
Follow Table 6
If your study qualifies as a clinical trial
Follow Table 2, Module C
For all studies
Follow Table 1
Figure 1. A flowchart describing the steps in choosing the JARS–Quant tables to complete depending onresearch design.
5QUANTITATIVE RESEARCH REPORTING STANDARDS
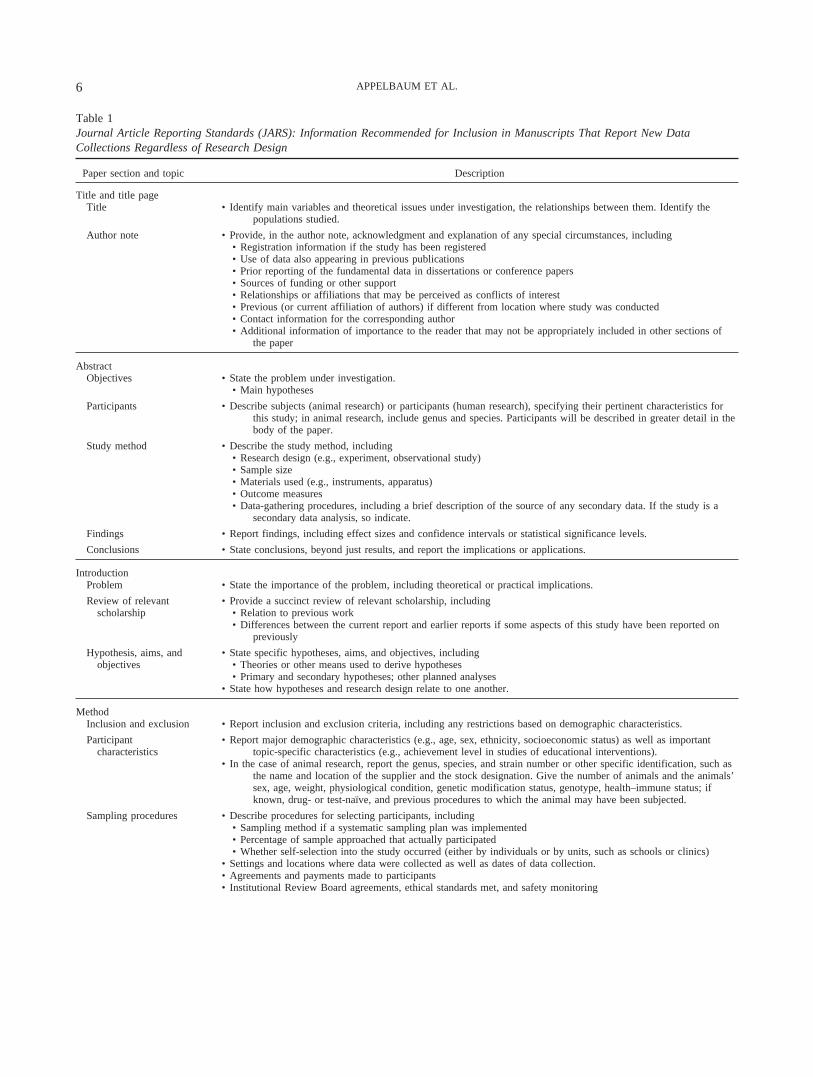
Table 1Journal Article Reporting Standards (JARS): Information Recommended for Inclusion in Manuscripts That Report New DataCollections Regardless of Research Design
Paper section and topic Description
Title and title pageTitle • Identify main variables and theoretical issues under investigation, the relationships between them. Identify the
populations studied.
Author note • Provide, in the author note, acknowledgment and explanation of any special circumstances, including• Registration information if the study has been registered• Use of data also appearing in previous publications• Prior reporting of the fundamental data in dissertations or conference papers• Sources of funding or other support• Relationships or affiliations that may be perceived as conflicts of interest• Previous (or current affiliation of authors) if different from location where study was conducted• Contact information for the corresponding author• Additional information of importance to the reader that may not be appropriately included in other sections of
the paper
AbstractObjectives • State the problem under investigation.
• Main hypotheses
Participants • Describe subjects (animal research) or participants (human research), specifying their pertinent characteristics forthis study; in animal research, include genus and species. Participants will be described in greater detail in thebody of the paper.
Study method • Describe the study method, including• Research design (e.g., experiment, observational study)• Sample size• Materials used (e.g., instruments, apparatus)• Outcome measures• Data-gathering procedures, including a brief description of the source of any secondary data. If the study is a
secondary data analysis, so indicate.
Findings • Report findings, including effect sizes and confidence intervals or statistical significance levels.
Conclusions • State conclusions, beyond just results, and report the implications or applications.
IntroductionProblem • State the importance of the problem, including theoretical or practical implications.
Review of relevantscholarship
• Provide a succinct review of relevant scholarship, including• Relation to previous work• Differences between the current report and earlier reports if some aspects of this study have been reported on
previously
Hypothesis, aims, andobjectives
• State specific hypotheses, aims, and objectives, including• Theories or other means used to derive hypotheses• Primary and secondary hypotheses; other planned analyses
• State how hypotheses and research design relate to one another.
MethodInclusion and exclusion • Report inclusion and exclusion criteria, including any restrictions based on demographic characteristics.
Participantcharacteristics
• Report major demographic characteristics (e.g., age, sex, ethnicity, socioeconomic status) as well as importanttopic-specific characteristics (e.g., achievement level in studies of educational interventions).
• In the case of animal research, report the genus, species, and strain number or other specific identification, such asthe name and location of the supplier and the stock designation. Give the number of animals and the animals’sex, age, weight, physiological condition, genetic modification status, genotype, health–immune status; ifknown, drug- or test-naïve, and previous procedures to which the animal may have been subjected.
Sampling procedures • Describe procedures for selecting participants, including• Sampling method if a systematic sampling plan was implemented• Percentage of sample approached that actually participated• Whether self-selection into the study occurred (either by individuals or by units, such as schools or clinics)
• Settings and locations where data were collected as well as dates of data collection.• Agreements and payments made to participants• Institutional Review Board agreements, ethical standards met, and safety monitoring
6 APPELBAUM ET AL.

Table 1 (continued)
Paper section and topic Description
Sample size, power,and precision
• Describe the sample size, power, and precision, including• Intended sample size• Achieved sample size, if different from intended sample size• Determination of sample size, including
• Power analysis, or methods used to determine precision of parameter estimates• Explanation of any interim analyses and stopping rules employed
Measures andcovariates
• Define all primary and secondary measures and covariates, including measures collected but not included in thisreport.
Data collection • Describe methods used to collect data.
Quality ofmeasurements
• Describe methods used to enhance the quality of measurements, including• Training and reliability of data collectors• Use of multiple observations
Instrumentation • Provide information on validated or ad hoc instruments created for individual studies, for example, psychometricand biometric properties.
Masking • Report whether participants, those administering the experimental manipulations, and those assessing the outcomeswere aware of condition assignments.
• If masking took place, provide statement regarding how it was accomplished and if and how the success ofmasking was evaluated.
Psychometrics • Estimate and report values of reliability coefficients for the scores analyzed (i.e., the researcher’s sample), ifpossible. Provide estimates of convergent and discriminant validity where relevant.
• Report estimates related to the reliability of measures, including• Interrater reliability for subjectively scored measures and ratings• Test–retest coefficients in longitudinal studies in which the retest interval corresponds to the measurement
schedule used in the study• Internal consistency coefficients for composite scales in which these indices are appropriate for understanding the
nature of the instruments being employed in the study• Report the basic demographic characteristics of other samples if reporting reliability or validity coefficients from
those sample(s), such as those described in test manuals or in the norming information about the instrument.
Conditions and design • State whether conditions were manipulated or naturally observed. Report the type of design as per the JARS–Quanttables:
• Experimental manipulation with participants randomized• Table 2 and Module A
• Experimental manipulation without randomization• Table 2 and Module B
• Clinical trial with randomization• Table 2 and Modules A and C
• Clinical trial without randomization• Table 2 and Modules B and C
• Nonexperimental design (i.e., no experimental manipulation): observational design, epidemiological design,natural history, and so forth (single-group designs or multiple-group comparisons)
• Table 3• Longitudinal design
• Table 4• N-of-1 studies
• Table 5• Replications
• Table 6• Report the common name given to designs not currently covered in JARS–Quant.
Data diagnostics • Describe planned data diagnostics, including• Criteria for post-data collection exclusion of participants, if any• Criteria for deciding when to infer missing data and methods used for imputation of missing data• Defining and processing of statistical outliers• Analyses of data distributions• Data transformations to be used, if any
Analytic strategy • Describe the analytic strategy for inferential statistics and protection against experiment-wise error for• Primary hypotheses• Secondary hypotheses• Exploratory hypotheses
ResultsParticipant flow • Report the flow of participants, including
• Total number of participants in each group at each stage of the study• Flow of participants through each stage of the study (include figure depicting flow when possible; see Figure 2)
(table continues)
7QUANTITATIVE RESEARCH REPORTING STANDARDS

tations for specific kinds of designs and for use with specificstatistical approaches. The reporting standards for re-search synthesis and meta-analyses are self-contained inTable 9. In essence, Table 1 covers the basic features forreporting all forms of quantitative empirical studies. It isorganized around the usual structure of a journal articlefound in the behavioral and psychological sciences liter-ature. Whether individual items are reported in the text ofthe article or in archived supplemental materials dependson the flow of the article. Much of Table 1 is similar tothat of the original JARS Table 1, but some importantchanges are noted next.
Changes in Table 1
The Method section of the JARS–Quant Table 1 containssubsections on Data Diagnostics and Analytic Strategy.These subsections were added for two reasons. First, theyhighlight the importance of including in reports descriptionsof ways in which, if any, a data set has been modified priorto data analysis. These modifications could include, forexample, the exclusion of data, imputation of missing data,identification and adjustment of statistical outliers, and theapplication of data transformations to alter the distributionof data points. These subsections are included in the Method
Table 1 (continued)
Paper section and topic Description
Recruitment • Provide dates defining the periods of recruitment and repeated measures or follow-up.
Statistics and dataanalysis
• Provide information detailing the statistical and data-analytic methods employed, including• Missing data
• Frequency or percentages of missing data• Empirical evidence and/or theoretical arguments for the causes of data that are missing, for example, missing
completely at random (MCAR), missing at random (MAR), or missing not at random (MNAR)• Methods actually employed for addressing missing data, if any
• Descriptions of each primary and secondary outcome, including the total sample and each subgroup that includesthe number of cases, cell means, standard deviations, and other measures that characterize the data employed.
• Inferential statistics, including• Results of all inferential tests conducted, including exact p values if null hypothesis statistical testing (NHST)
methods were employed, including reporting the minimally sufficient set of statistics (e.g., dfs, mean square[MS] effect, MS error) needed to construct the tests
• Effect-size estimates and confidence intervals on those estimates that correspond to each inferential testconducted, when possible
• Clear differentiation between primary hypotheses and their tests–estimates, secondary hypotheses and theirtests–estimates, and exploratory hypotheses and their test–estimates
• Complex data analyses, for example, structural equation modeling analyses (see also Table 8), hierarchical linearmodels, factor analysis, and multivariate analyses, and so forth, including
• Details of the models estimated• Associated variance–covariance (or correlation) matrix or matrices• Identification of the statistical software used to run the analyses (e.g., SAS PROC GLM, or the particular R
library program)• Estimation problems (e.g., failure to converge, bad solution spaces), regression diagnostics, or analytic anomalies
that were detected and solutions to those problems.• Other data analyses performed, including adjusted analyses, if performed, indicating those that were planned and
those that were not planned (though not necessarily in the level of detail of primary analyses).• Report any problems with statistical assumptions and/or data distributions that could affect the validity of findings.
DiscussionSupport of original
hypotheses• Provide a statement of support or nonsupport for all hypotheses whether primary or secondary, including
• Distinction by primary and secondary hypotheses• Discussion of the implications of exploratory analyses in terms of both substantive findings and error rates that
may be uncontrolled
Similarity of results • Discuss similarities and differences between reported results and work of others.
Interpretation • Provide an interpretation of the results, taking into account• Sources of potential bias and threats to internal and statistical validity• Imprecision of measurement protocols• Overall number of tests or overlap among tests• Adequacy of sample sizes and sampling validity
Generalizability • Discuss generalizability (external validity) of the findings, taking into account• Target population (sampling validity)• Other contextual issues (setting, measurement, time; ecological validity)
Implications • Discuss implications for future research, program, or policy.
Note. Tables have been designed to be comprehensive and to apply widely. For any individual report, the author would be expected to select those itemsthat apply to the particular study.
8 APPELBAUM ET AL.

section of Table 1 because the criteria and methods used tomake such modifications should be established prior to dataanalysis. If such modifications occur after data analysis hasbegun, this should be mentioned in the report and a clearrationale for the post hoc modifications should be provided.In addition, the unmodified data set should be retained andmade available for verification purposes. Researchers mak-ing post hoc modifications should describe results based onboth the modified and the unmodified data sets (however,one of the two sets of analyses could be included in sup-plemental materials).
Second, the subsections of Method in Table 1 emphasize thedesignation of hypotheses as of primary, secondary, and ex-ploratory interest. These designations are meant to help conveyto readers how experiment-wise results, of both null hypothesissignificance tests and effect-size estimations, might be influ-enced by chance. This distinction in hypotheses is also re-flected in changes to the JARS–Quant that appear in thesubsections on Statistical and Data Analysis and Discussion inTable 1.
Animal research. References to animal research inTable 1 have been slightly modified to include the wordsgenetic modification status, genotype, health–immunestatus, drug- or test-naïve, and previous procedures tomake JARS–Quant consistent with the reporting stan-dards included in ARRIVE (Kilkenny et al., 2010).
Psychometrics. When describing psychometric charac-teristics, authors should use language that is consistent withthe recommendations of the most recent standards for edu-cational and psychological testing (American EducationalResearch Association, American Psychological Associa-tion, & National Council on Measurement in Education,2014). Specifically, the term reliability should refer to testscores in particular samples and not to tests or testinginstruments. Likewise, the term validity should refer not toa test but to the proposed interpretations of test scores(Reynolds & Livingston, 2012). That is, reliability andvalidity are not properties of tests that are invariant acrossall samples or proposed score interpretations (Thompson,2003). Best practice is to estimate both reliability and va-lidity, when possible, within the researcher’s sample orsamples (i.e., the scores analyzed). If the report includesvalues of reliability or validity coefficients from other pub-lished or unpublished sources, then these should be directlycompared with the characteristics of the researcher’s sam-ple. Finally, the report should contain the appropriate typesof score reliability coefficients, given the characteristics ofthe test, design, or analysis (see Slaney, Tkatchouk, Gabriel,& Maraun, 2009, for more information).
Neural measurement techniques. Although there areno changes in the content of Table 1 concerning neural mea-surement techniques, the variety of such techniques (includingelectroencephalogram [EEG], fMRI, magnetoencephalogra-phy [MEG], ERP, etc.) and their use have increased greatly in
the past 2 decades. Alongside these developments in the tech-niques, sets of reporting standards for them have emerged. TheJARS–Quant Working Group does not specifically endorsethese independent standards but recognizes their value forreporting details of data collection and processing that areoutside of the purview of this report.
When reporting the results of studies using this class ofmeasurements, researchers must make full information aboutthe technique accessible, including advanced data-processinginformation, either in the text of the paper or in the supple-mental materials (usually the latter). These reporting expecta-tions are in addition to those that would be expected in studiesthat do not employ this set of measurements. Other than thechanges noted above, all of the other elements in the originalTable 1 remain in full application, including the use of subjectflow diagrams as illustrated in Figure 2. No items in theoriginal Table 1 were eliminated.
Reporting Standards for Studies With anExperimental Manipulation
Listed in Table 2 are reporting standards for studies in whichthere is an experimental manipulation. Presented in Table 2 areadditional modules that then further refine reporting standardsfor cases when assignment of participants to manipulation isdone by a random process (Module A), when assignment isnonrandom (Module B), or when the study is a randomizedclinical trial or a randomized control trial (Module C). Table 2with Modules A and B were all present in the original JARSbut have been slightly revised. Module C on reporting stan-dards for clinical trials is new to JARS–Quant.
Clinical Trials
Listed in Table 2 Module C are the new additional re-porting standards for formal clinical trials. There are twosimilar terms used to describe a wide class of studies withexperimental manipulations: randomized control trials andrandomized clinical trials (which are a subset of random-ized control trials). In the literature, there is a tendency touse both terms interchangeably—however, a randomizedclinical trial is a subset of the larger universe of randomizedcontrolled trials. Module C includes reporting standards forclinical trials because certain investigations do require re-searchers to use these reporting standards. It would not berequired for the reporting or registration of a more generalrandomized control trial, for example, in a university settingaimed at evaluating the efficacy of a new approach to teachcalculus skills among college students; however, registra-tion of studies with nonhealth outcomes may neverthelessbe desirable.
In this context, a clinical trial is a research investigationthat evaluates the effects of one or more health-relatedinterventions (e.g., psychotherapy, medication, or a diet
9QUANTITATIVE RESEARCH REPORTING STANDARDS

intervention) on health outcomes (e.g., depression or diabe-tes) by prospectively assigning humans or groups of peopleto various experimental conditions. Assignment or alloca-tion can be accomplished either randomly or nonrandomly(see Table 2, Modules A and B). Although the originalJARS Table 1 included reporting standards that covered
many aspects of a clinical trial, there are additional require-ments for modern clinical trials. Thus, Module C was addedto JARS–Quant.
One important difference concerns increased calls, bothnationally and internationally, for clinical trial registration.This involves providing information to a registry about the
Assessed for eligibility (n = )
Enrollment
Assignment
Excluded (total n = ) because
Did not meet inclusion criteria(n = )
Refused to participate(n = )
Other reasons (n = )
Assigned to experimental group(n = )
Received experimental manipulation(n = )
Did not receive experimental manipulation
(n = )Give reasons
Assigned to comparison group(n = )
Received comparison manipulation (if any)
(n = )Did not receive comparison manipulation
(n = )Give reasons
Lost to follow-up (n = )Give reasons
Discontinued participation (n = )Give reasons
Follow-Up
Lost to follow-up (n = )Give reasons
Discontinued participation(n = )Give reasons
Analyzed (n = )
Excluded from analysis (n = ) Give reasons
Analysis
Analyzed ( n = )
Excluded from analysis ( n = )Give reasons
Figure 2. Flow of participants through each stage of an experiment or quasi-experiment. This flowchart is anadaptation of the flowchart offered by the CONSORT Group (Schulz, Altman, Moher, & the CONSORT Group,2010).
10 APPELBAUM ET AL.

Table 2Reporting Standards for Studies With an Experimental Manipulation (in Addition to Material Presented in Table 1)
Paper section and topic Description
General principlesMethod
Experimental manipulations • Provide details of the experimental manipulation(s) intended for each study condition, includingcomparison conditions, and how and when experimental manipulations were actually administered,including
• Content of the specific experimental manipulations (if experimental manipulation is part of a clinicaltrial, address Module C)
• Summary or paraphrasing of instructions, unless they are unusual or compose the experimentalmanipulation, in which case they may be presented verbatim
• Method of experimental manipulation delivery• Description of apparatus and materials used and their function in the experiment
• Specialized equipment by model and supplier• Deliverer: who delivered the experimental manipulations
• Level of professional training• Level of training in specific experimental manipulations
• Number of deliverers, and in the case of experimental manipulations, the M, SD, and range of numberof individuals–units treated by each
• Setting: where the manipulations or experimental manipulations occurred• Exposure quantity and duration: how many sessions, episodes, or events were intended to be delivered
and how long they were intended to last• Time span: how long it took to deliver the experimental manipulation to each unit• Activities to increase compliance or adherence (e.g., incentives)• Use of language other than English and the translation method• Sufficient detail to allow for replication, including reference to or a copy of the manual of procedures.
If the manual of procedures is available, and how others may obtain it
Units of delivery and analysis • State the unit of delivery (how participants were grouped during delivery).• Describe the smallest unit that was analyzed (and in the case of experiments, that was randomly assigned
to conditions) to assess experimental manipulation effects (e.g., individuals, work groups, classes).• Describe the analytical method used to account for this (e.g., adjusting the standard error estimates by the
design effect or using multilevel analysis) if the unit of analysis differed from the unit of deliver.
ResultsParticipant flow • Report the total number of groups (if experimental manipulation was administered at the group level) and
the number of participants assigned to each group, including• Number of participants approached for inclusion• Number of participants who began the experiment• Number of participants who did not complete the experiment or crossed over to other conditions, with
reasons• Number of participants included in primary analyses
• Include a figure describing the flow of participants through each stage of the study (see Figure 2).
Treatment fidelity • Provide evidence on whether the experimental manipulation was implemented as intended.
Baseline data • Describe baseline demographic and clinical characteristics of each group.
Adverse events and side effects • Report all important adverse events or side effects in each experimental condition. If none, state so.
Discussion • Discuss results, taking into account the mechanism by which the experimental manipulation was intendedto work (causal pathways) or alternative mechanisms.
• Discuss the success of, and barriers to, implementing the experimental manipulation; fidelity ofimplementation if an experimental manipulation is involved.
• Discuss generalizability (external validity and construct validity) of the findings, taking into account• Characteristics of the experimental manipulation• How, what outcomes were measured• Length of follow-up• Incentives• Compliance rates
• Describe the theoretical or practical significance of outcomes and the basis for these interpretations.
Module A: Reporting standards for studies using random assignmentMethod
Random assignment method • Describe the unit of randomization and the procedure used to generate the random assignment sequence,including details of any restriction (e.g., blocking, stratification).
Random assignment implementationand concealment
• State whether and how the sequence was concealed until experimental manipulations were assigned,including who• Generated the assignment sequence• Enrolled participants
(table continues)
11QUANTITATIVE RESEARCH REPORTING STANDARDS

Table 2 (continued)
Paper section and topic Description
• Assigned participants to groups
Masking • Report whether participants, those administering the experimental manipulations, and those assessing theoutcomes were aware of condition assignments.
• Provide a statement regarding how any masking (if it took place) was accomplished and whether and howthe success of masking was evaluated.
Statistical methods • Describe statistical methods used to compare groups on primary outcome(s).• Describe statistical methods used for additional analyses, such as subgroup comparisons and adjusted
analysis.• Describe statistical methods used for mediation or moderation analyses, if conducted.
Module B: Reporting standards for studies using nonrandom assignmentMethod
Assignment method • Report the unit of assignment (i.e., the unit being assigned to study conditions; e.g., individual, group,community).
• Describe the method used to assign units to study conditions, including details of any restriction (e.g.,blocking, stratification, minimization).
• State procedures employed to help minimize selection bias (e.g., matching, propensity score matching).
Masking • Report whether participants, those administering the experimental manipulation, and those assessing theoutcomes were aware of condition assignments.
• Report whether masking took place. Provide a statement regarding how it was accomplished and how thesuccess of masking was evaluated, if it was evaluated.
Statistical methods • Describe statistical methods used to compare study groups on primary outcome(s), including complexmethods for correlated data.
• Describe statistical methods used for any additional analyses conducted, such as subgroup analyses andadjusted analysis (e.g., methods for modeling pretest differences and adjusting for them).
• Describe statistical methods used for mediation or moderation analyses, if these analyses were used.
Module C: Reporting standards for studies involving clinical trialsTitle and title page • State whether trial was registered prior to implementation.
Abstract • State whether the trial was registered. If the trial was registered, state where and include the registrationnumber.
• Describe public health implications of trial results.
Introduction • State the rationale for evaluating specific intervention(s) for a given clinical problem, disorder, orvariable.
• Describe the approach, if any, to assess mediators and moderators of treatment effects.• Describe potential public health implications of study.• State how results from current study can advance knowledge in this area.
MethodParticipant characteristics • State the method(s) of ascertaining how participants met all inclusion and exclusion criteria, especially if
assessing clinical diagnosis(es).
Sampling procedures • Provide details regarding similarities and differences of data collection locations if multisite study.
Measures • State whether clinical assessors were• Involved in providing treatment for studies involving clinical assessments• Aware or unaware of assignment to condition at post-treatment and follow-up assessment(s); (if
unaware, how was this accomplished?)
Experimental interventions • Report whether the study protocol was publicly available (e.g., published) prior to enrolling participants;if so, where and when.
• Describe how intervention in this study differed from the “standard” approach in order to tailor it to anew population (e.g., differing age, ethnicity, comorbidity).
• Describe any materials (e.g., clinical handouts, data recorders) provided to participants and howinformation about them can obtained (e.g., URL address).
• Describe any changes to the protocol during the course of the study, including all changes to theintervention, outcomes, and methods of analysis.
• Describe the Data and Safety Monitoring Board.• Describe any stopping rules.
Treatment fidelity • Describe method and results regarding treatment deliverers’ (e.g., therapists) adherence to the plannedintervention protocol (e.g., therapy manual).
• Describe method and results of treatment deliverers’ (e.g., therapists) competence in implementing theplanned intervention protocol (e.g., therapy manual).
• Describe (if relevant) method and results regarding whether participants (i.e., treatment recipients)understood and/or followed treatment recommendations (e.g., did they comprehend what the treatmentwas intended to do, complete homework assignments if given, and/or practice activities assigned outsideof the treatment setting?).
12 APPELBAUM ET AL.

study prior to its implementation as well as a summary ofresults upon its completion. Trial registration can enhancetransparency by providing a complete description of the trialto both the scientific community and the general public.From an ethical perspective, the Declaration of Helsinki,which is the set of ethical principles regarding human ex-perimentation developed by the World Medical Association(2013), stated that “every clinical trial must be registered ina publicly accessible database before recruitment of the firstsubject” (p. 2193). Trial registration also helps minimizepublication bias and selective reporting of results. As ofJanuary 18, 2017, all clinical trials, funded in whole or inpart by the National Institutes of Health (NIH), must beregistered in ClinicalTrials.gov. A clinical trial is definedby NIH as a “research study in which one or more humansubjects are prospectively assigned to one or more interven-tions (which may include placebo or other control) to eval-uate the effects of those interventions on health-relatedbiomedical or behavioral outcomes” (NIH, 2014, para. 4).Relevant to the majority of clinical trials conducted by psy-chologists, this definition includes various types of psychother-apy and psychosocial interventions (e.g., cognitive therapy,diet, exercise, problem-solving training) as well as deliverysystems (e.g., telemedicine, face-to-face interviews). Addi-tional information can be found in FAQs on the NIH website(http://www.grants.nih.gov/clinicaltrials_fdaaa/faq.htm#5052).
On an international basis, the World Health Organization(WHO) manages the International Clinical Trials RegistryPlatform (http://www.who.int/ictrp/trial_reg/en/), which pro-vides a way to search ClinicalTrials.gov and other registries.Information about where a trial is registered should be reportedon the title page, in the abstract, and in the reporting of theexperimental manipulation. A second issue involves thedifference in the amount of information necessary to ade-quately describe the experimental manipulation imple-mented in a clinical trial. This can include details regardingone or more psychotherapy treatment conditions as well asany comparators and control conditions.
In addition, because of the potential variability in perfor-mance among both assessors or data gatherers of clinical
information (e.g., those conducting complex clinical inter-views) and psychotherapists or interventionists, more de-tails are usually requested. One issue involves taking stepsto monitor how the intervention was delivered. This is oftenreferred to as treatment integrity or fidelity, and includes thedegree to which the planned intervention (e.g., as describedin a treatment manual) was delivered by a therapist (e.g., didthe individuals implementing the experimental manipula-tion follow the protocol?) and taken-up by participants (e.g.,did the clients attend all sessions?; see Borrelli, 2011; Mont-gomery, Underhill, Gardner, Operario, & Mayo-Wilson,2013; Nezu & Nezu, 2008). This information would bereported in the Results section.
Of particular importance, highlighted in this new module isthe need to report mild to severe adverse events, or occurrencesmore likely to happen when evaluating interventions meant toaffect health outcomes compared with other types of researchinvestigations. Recent research has indicated that few behav-ioral health intervention studies monitor and report adverseevents other than serious occurrences, such as suicide or hos-pitalization (see Peterson, Roache, Raj, & Young-McCaughan,2012; for the STRONG STAR Consortium). Increased distresssymptomatology or the negative effects of treatment on othersare rarely reported (Duggan, Parry, McMurran, Davidson, &Dennis, 2014). Without such information, patients are unableto ascertain the full array of possible risks or benefits ofpsychological interventions, clinicians are unable to determinethe valence and direction of a benefit–harm analysis, and theability of policymakers and professional organizations to de-velop valid clinical practice guidelines is severely hampered.Such information, even including a statement that no adverseeffects occurred, would be reported in the Results section.
Nonexperimental Research
Table 3 is new to JARS–Quant and deals with reportingstandards for studies in which no variables are manipulated.Instead, the main goal of such studies is to observe, de-scribe, classify, or analyze the naturally occurring relationsbetween variables of interest. These studies are sometimes
Table 2 (continued)
Paper section and topic Description
• Describe any additional methods used to enhance treatment fidelity.
Research design • Provide rationale for length of follow-up assessment.
Results • Describe how treatment fidelity (i.e., therapist adherence and competence ratings) and participantadherence was related to intervention outcome.
• Describe method of assessing clinical significance, including if the threshold for clinical significance wasprespecified (e.g., as part of a publicly available protocol).
• Identify possible differences in treatment effects due to intervention deliverer.• Describe possible differences in treatment effects due to data collection site if multisite study.• Describe results of analyses of moderation–mediation effects, if tested.• Explain why study was discontinued, if appropriate.• Describe frequency and type of adverse effects that occurred (or state that none occurred).
Discussion • Describe how this study advances knowledge about the intervention, clinical problem, and/or population.
13QUANTITATIVE RESEARCH REPORTING STANDARDS

called observational, correlational, or natural history stud-ies. Given the nature of the research question, such studiesmay have different designs or sampling plans (e.g., prospec-tive, retrospective, case-control, cohort, cohort-sequential).They include single-group studies, in which relationsamong attributes in a naturally occurring group are analyzedas well as studies in which comparisons are made acrosstwo or more naturally occurring groups on variables ofinterest. Reporting guidelines in Table 3 were informed, in
part, by the STrengthening the Reporting of OBservationalstudies in Epidemiology (STROBE) reporting standards(http://www.strobe-statement.org/index.php). As with othertables, Table 3 is intended to be used along with Table 1.
Longitudinal Research
In almost all cases, a longitudinal study (Table 4)employs one of the basic study designs but the same
Table 3Reporting Standards for Studies Using No Experimental Manipulation (Single-Group Designs, Natural-Group Comparisons, etc.; inAddition to Material Presented in Table 1)
Paper section and topic Description
Title/AbstractStudy design • Describe the design of the study.
Data use • State the type of data used.
MethodParticipant selection • Describe the method(s) of selecting participants (i.e., the units to be observed, classified, etc.), including
• Method(s) of selecting participants for each group (e.g., methods of sampling, place of recruitment) and the numberof cases in each group
• Matching criteria (e.g., propensity score), if matching was used• Identify data sources used (e.g., sources of observations, archival records), and if relevant, include codes or algorithms
to select participants or link records.
Variables • Define all variables clearly, including• Exposure• Potential predictors, confounders, and effect modifiers
• State how each variable was measured.
Comparability ofassessment
• Describe comparability of assessment across groups (e.g., the likelihood of observing or recording an outcome in eachgroup for reasons unrelated to the effect of the intervention).
Analysis • Describe how predictors, confounders, and effect modifiers were included in the analysis.
DiscussionLimitations • Describe potential limitations of the study. As relevant, describe the possibility of misclassification, unmeasured
confounding, and changing eligibility criteria over time.
Table 4Reporting Standards for Longitudinal Studies (in Addition to Material Presented in Table 1)
Paper section and topic Description
General reporting expectationSample characteristics
(when appropriate)• Describe reporting (sampling or randomization) unit—individual, dyad, family, classroom:
• N per group, age, and sex distribution• Ethnic composition• Socioeconomic status, home language, immigrant status, education level, and family characteristics• Country, region, city, and geographic characteristics
Sample recruitment andretention methods
Attrition • Report attrition at each wave, breaking down reasons for attrition.• Report any differential attrition by major sociodemographic and experimental condition.
Additional sampledescription
• Report any contextual changes for participants (units) as the study progressed (school closures–mergers,major economic changes; for long-term studies, major social changes that may need explanation forcontemporary readers to understand the context of the study during its early years).
Method and measurement • Specify independent variables and dependent variables at each wave of data collection.• Report the years in which each wave of the data collection occurred.
Missing data • Report the amount of missing data and how issues of missing data where handled analytically.
Analysis • Specify analytic approaches utilized and assumptions made in performing these analyses.Multiple publication • Provide information on where any portions of the data have been previously published and the degree of
overlap with current report.
14 APPELBAUM ET AL.

experimental unit or units are observed on the sameresponse variables on more than one occasion. In thesestudies, the objective is usually to understand theoccasion-changes either in and of themselves or as func-tions of other influences. As used here, longitudinaldesigns are distinct from three other similar designs.Rather than the passage of time (or some other metric),occasion might also refer to experimental manipulationssuch as dosage level, experimental condition, and soforth, and may occur within a single session or in differ-ent sessions. The latter kinds of designs are often calledwithin-subject designs and generally have different re-porting standards than for what is being referred to hereas longitudinal studies. Although all longitudinal studiesare within-subject, not all within-subject designs are lon-gitudinal. Also, there are designs in which the sameexperimental units are measured on several different de-pendent variables at various points during a single ses-sion, but no attribute is measured on more than oneoccasion. These are multivariate outcome studies, andreporting standards for longitudinal studies do not gen-erally apply to such studies. Finally, there are time-seriesexperiments that generally have their own reporting stan-dards.
Longitudinal studies come in many different shapesand forms and are traditionally, but not uniquely, seen indevelopmental, geriatric, and educational studies as wellas in clinical trials. These studies may typically involvesome preintervention measures, an intervention, and thenone or more postintervention measures. Other longitudi-nal studies may involve a selection of cases at a particulartime or event and then repeated observations of theseparticipants on a prespecified schedule (which may ormay not be the actual achieved schedule). The prespeci-fied schedule may be time or event based.
Some work has been published on reporting standardsfor longitudinal studies (Tooth, Ware, Bain, Purdie, &Dobson, 2005), but most of these are designed to reportstudies that arise from epidemiology. To develop report-ing standards that would reflect longitudinal studies inthe behavioral sciences, several organizations were con-sulted, including the Governing Council of the Societyfor Research in Child Development. The Working Groupreceived assistance from the Governing Council of theSociety for Research in Child Development in creatingstandards for reporting longitudinal studies.
As with other reporting standards, those for longitudi-nal studies can be divided into two general classes: (a)those items that are required for a well-trained reader tobe able to make decisions concerning the validity andscope of application of the findings as the article is beingread, and (b) those details that might be necessary for afine-grained understanding of the work and its possiblereplication. Information of the first type should appear in
the body of the paper, whereas the more fine-grainedinformation can be made available in the supplementalmaterials. Because most longitudinal studies are, at anyone measuring instance, a traditional experimental orobservational design, the reporting standards for thatclass of design also would be expected to be followed inthe report. In addition, any materials that pertain to theentire study (e.g., a study registration number) would beexpected to appear as it would in a nonlongitudinalstudy.
It is expected that when important conditions change fromobservational period to observational period (e.g., a testform is changed, a new measure that is purportedly mea-suring a similar or the same construct is substituted for anearlier measure, when major life events occur such as familystructure changes for some participants), these will beclearly noted. In such cases, the dates of data collection(e.g., years 2010–2015) should be given.
N-of-1
A class of studies (see Table 5) known as N-of-1 exper-imental designs (also known as single-case studies) arecommonly employed in many areas of behavioral and edu-cational research, but there has been limited specification ofreporting standards for this class of design. In addition,there is ample evidence of incomplete reporting in single-case intervention research (e.g., Barker, Mellalieu, McCar-thy, Jones, & Moran, 2013; Didden, Korzilius, van Oor-souw, & Sturmey, 2006; Maggin, Chafouleas, Goddard, &Johnson, 2011; Smith, 2012; Tate, Perdices, McDonald,Togher, & Rosenkoetter, 2014).
Although reporting guidelines for N-of-1 trials currentlyexist (CONSORT Extension for N-of-1 Trials [CENT];Shamseer et al., 2015; Vohra et al., 2015), no reportingguidelines have been available specifically for behavioralscience research. The SCRIBE 2016 guideline (Single-CaseReporting Guideline In BEhavioural interventions) was de-veloped to address this need (Tate, Perdices, Rosenkoetter,McDonald, et al., 2016; Tate, Perdices, Rosenkoetter, Shad-ish, et al., 2016). The SCRIBE 2016 guideline providesresearchers who conduct single-case experiments with aminimum standard, in the form of a 26-item checklist, withwhich they can write their reports clearly and accurately.The SCRIBE 2016 guideline is intended to be used in thefour prototypical designs often used in single-case experi-ments: withdrawal–reversal, multiple baseline, alternating–simultaneous treatments, and changing criterion as well ascombinations and variants of the designs. Two primaryarticles on the SCRIBE 2016 are available: (a) a SCRIBEStatement (Tate, Perdices, Rosenkoetter, Shadish, et al.,2016) that describes the methodology of their development,and (b) an explanation and elaboration article (Tate, Perdi-ces, Rosenkoetter, McDonald, et al., 2016) that provides a
15QUANTITATIVE RESEARCH REPORTING STANDARDS

rationale for each of the 26 items, along with examples fromthe literature of adequate reporting of the items.
The SCRIBE 2016 checklist will provide researchers,authors, reviewers, and editors involved in the publicationof results of single-case trials with a tool to measure theclarity and accuracy of reporting. The checklist is alsoexpected to facilitate the replication of these studies. InTable 5, a portion of the SCRIBE 2016 formulation issummarized. In this table, which is intended to be used inconjunction with Table 1 and the Table 2 modules, thoseelements of SCRIBE 2016 that are unique to the single-casedesign are summarized.
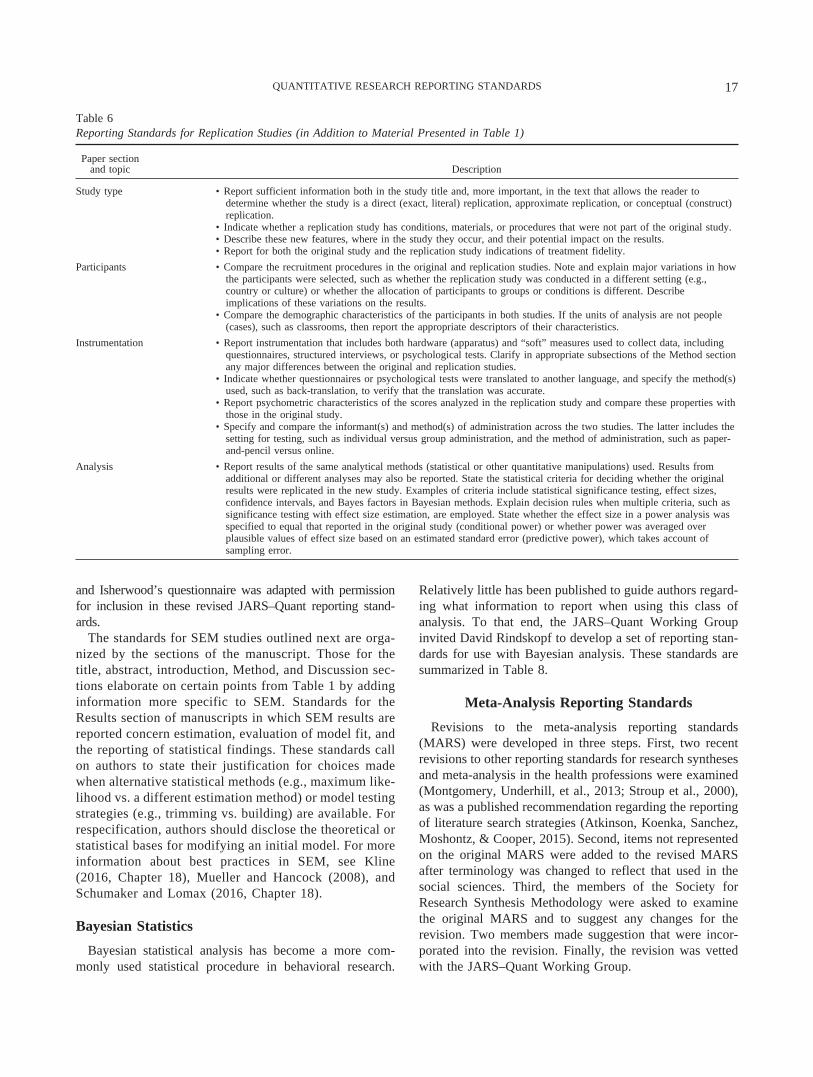
Studies Reporting Replications
Reproducibility is a core scientific principle. Increasingly,there have been efforts to make replication more likely,including the adoption of reporting standards such as these,policy changes in journals to include publication of repli-cation studies as part of their primary mission, and so forth(Begley & Ellis, 2012; Nosek & Lakens, 2013; Open Sci-ence Collaboration, 2015). At the same time, there is anecessity to ensure that the replication studies themselvesare reported in such a way that readers can easily understandwhat was done and how to evaluate the claims made inthose replication studies (See Table 6). These standardsconcern external replication, which occurs when research-ers state that a study being reported is a repetition of one ormore specific, previously published, or archived studies.They do not apply to internal replication, which involvescross-validation of analyses within the same sample or theuse of resampling or randomization procedures, such asbootstrapping, that recombine or generate cases to estimatethe statistical precision of specific estimators.
Reporting should highlight the comparisons betweenthe original and replication studies such that sufficient
detail is provided to permit evaluation of whether anydifferences in outcomes between the original and thereplication study are due to differences such as in par-ticipants, conditions, measures, methods of analysis, orother factors induced into the replication study. Moreinformation about terms and concepts mentioned in thesestandards is available in Mackey (2012) and Maxwell,Lau, and Howard (2015).
Reporting Standards for SomeQuantitative Procedures
Although reporting standards are generally associatedwith entire research designs, some quantitative proce-dures are of sufficient complexity and open to suchinternal variation that additional information (beyond justthe name of the technique and a few parameters) needs tobe reported for the reader to be able to fully comprehendthe analysis. Researchers may need additional informa-tion to evaluate the conclusions that the authors havedrawn or replicate the analysis with their own data.
Structural Equation ModelingStructural equation modeling (SEM) is a family of statistical
techniques that involve the specification of a structural ormeasurement model, given relevant theory and previous em-pirical results. These statistical techniques will include a seriesof analytic steps that estimate effects represented in the model(parameters) and evaluate the extent of correspondence be-tween the model and data. Hoyle and Isherwood (2013) de-veloped standards for studies in which results of SEM analysesare reported (see Table 7). These standards take the form of acomprehensive description of data preparation, specification ofthe initial model(s), estimation, model fit assessment, respeci-fication of the model(s), and the reporting of the results. Hoyle
Table 5Reporting Standards for N-of-1 Studies (in Addition to Material Presented in Table 1)
Paper section and topic Description
Design • Describe the design, including• Design type (e.g., withdrawal-reversal, multiple-baseline, alternating-treatments, changing-criterion, some
combination thereof, or adaptive design)• Phases and phase sequence (whether determined a priori or data-driven) and, if applicable, criteria for
phase changeType of design
Procedural changes • Describe any procedural changes that occurred during the course of the investigation after the start of thestudy.
Replication • Describe any planned replication.
Randomization • State whether randomization was used, and if so, describe the randomization method and the elements of thestudy that were randomized (e.g., during which phases treatment and control conditions were instituted).
AnalysisSequence completed • Report for each participant the sequence actually completed, including the number of trials for each session
for each case.• State when participant(s) who did not complete the sequence stopped and the reason for stopping.
Outcomes and estimation • Report results for each participant, including raw data for each target behavior and other outcomes.
16 APPELBAUM ET AL.
and Isherwood’s questionnaire was adapted with permissionfor inclusion in these revised JARS–Quant reporting stand-ards.
The standards for SEM studies outlined next are orga-nized by the sections of the manuscript. Those for thetitle, abstract, introduction, Method, and Discussion sec-tions elaborate on certain points from Table 1 by addinginformation more specific to SEM. Standards for theResults section of manuscripts in which SEM results arereported concern estimation, evaluation of model fit, andthe reporting of statistical findings. These standards callon authors to state their justification for choices madewhen alternative statistical methods (e.g., maximum like-lihood vs. a different estimation method) or model testingstrategies (e.g., trimming vs. building) are available. Forrespecification, authors should disclose the theoretical orstatistical bases for modifying an initial model. For moreinformation about best practices in SEM, see Kline(2016, Chapter 18), Mueller and Hancock (2008), andSchumaker and Lomax (2016, Chapter 18).
Bayesian Statistics
Bayesian statistical analysis has become a more com-monly used statistical procedure in behavioral research.
Relatively little has been published to guide authors regard-ing what information to report when using this class ofanalysis. To that end, the JARS–Quant Working Groupinvited David Rindskopf to develop a set of reporting stan-dards for use with Bayesian analysis. These standards aresummarized in Table 8.
Meta-Analysis Reporting Standards
Revisions to the meta-analysis reporting standards(MARS) were developed in three steps. First, two recentrevisions to other reporting standards for research synthesesand meta-analysis in the health professions were examined(Montgomery, Underhill, et al., 2013; Stroup et al., 2000),as was a published recommendation regarding the reportingof literature search strategies (Atkinson, Koenka, Sanchez,Moshontz, & Cooper, 2015). Second, items not representedon the original MARS were added to the revised MARSafter terminology was changed to reflect that used in thesocial sciences. Third, the members of the Society forResearch Synthesis Methodology were asked to examinethe original MARS and to suggest any changes for therevision. Two members made suggestion that were incor-porated into the revision. Finally, the revision was vettedwith the JARS–Quant Working Group.
Table 6Reporting Standards for Replication Studies (in Addition to Material Presented in Table 1)
Paper sectionand topic Description
Study type • Report sufficient information both in the study title and, more important, in the text that allows the reader todetermine whether the study is a direct (exact, literal) replication, approximate replication, or conceptual (construct)replication.
• Indicate whether a replication study has conditions, materials, or procedures that were not part of the original study.• Describe these new features, where in the study they occur, and their potential impact on the results.• Report for both the original study and the replication study indications of treatment fidelity.
Participants • Compare the recruitment procedures in the original and replication studies. Note and explain major variations in howthe participants were selected, such as whether the replication study was conducted in a different setting (e.g.,country or culture) or whether the allocation of participants to groups or conditions is different. Describeimplications of these variations on the results.
• Compare the demographic characteristics of the participants in both studies. If the units of analysis are not people(cases), such as classrooms, then report the appropriate descriptors of their characteristics.
Instrumentation • Report instrumentation that includes both hardware (apparatus) and “soft” measures used to collect data, includingquestionnaires, structured interviews, or psychological tests. Clarify in appropriate subsections of the Method sectionany major differences between the original and replication studies.
• Indicate whether questionnaires or psychological tests were translated to another language, and specify the method(s)used, such as back-translation, to verify that the translation was accurate.
• Report psychometric characteristics of the scores analyzed in the replication study and compare these properties withthose in the original study.
• Specify and compare the informant(s) and method(s) of administration across the two studies. The latter includes thesetting for testing, such as individual versus group administration, and the method of administration, such as paper-and-pencil versus online.
Analysis • Report results of the same analytical methods (statistical or other quantitative manipulations) used. Results fromadditional or different analyses may also be reported. State the statistical criteria for deciding whether the originalresults were replicated in the new study. Examples of criteria include statistical significance testing, effect sizes,confidence intervals, and Bayes factors in Bayesian methods. Explain decision rules when multiple criteria, such assignificance testing with effect size estimation, are employed. State whether the effect size in a power analysis wasspecified to equal that reported in the original study (conditional power) or whether power was averaged overplausible values of effect size based on an estimated standard error (predictive power), which takes account ofsampling error.
17QUANTITATIVE RESEARCH REPORTING STANDARDS
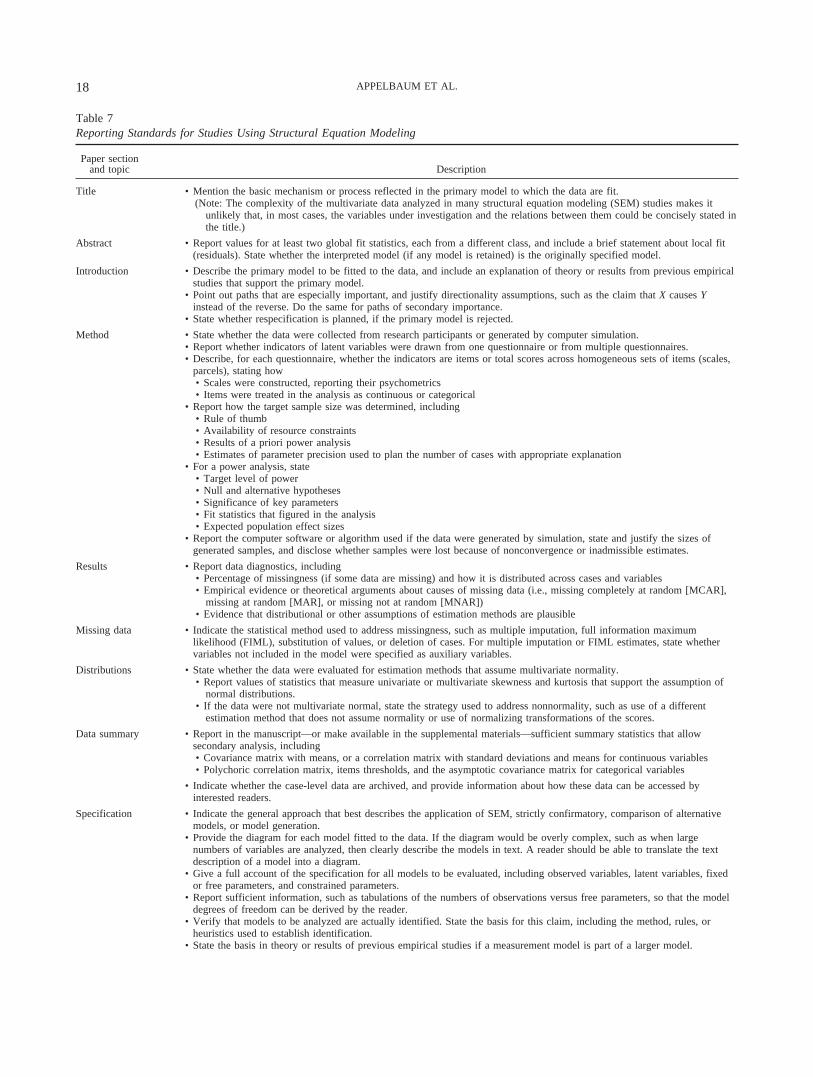
Table 7Reporting Standards for Studies Using Structural Equation Modeling
Paper sectionand topic Description
Title • Mention the basic mechanism or process reflected in the primary model to which the data are fit.(Note: The complexity of the multivariate data analyzed in many structural equation modeling (SEM) studies makes it
unlikely that, in most cases, the variables under investigation and the relations between them could be concisely stated inthe title.)
Abstract • Report values for at least two global fit statistics, each from a different class, and include a brief statement about local fit(residuals). State whether the interpreted model (if any model is retained) is the originally specified model.
Introduction • Describe the primary model to be fitted to the data, and include an explanation of theory or results from previous empiricalstudies that support the primary model.
• Point out paths that are especially important, and justify directionality assumptions, such as the claim that X causes Yinstead of the reverse. Do the same for paths of secondary importance.
• State whether respecification is planned, if the primary model is rejected.
Method • State whether the data were collected from research participants or generated by computer simulation.• Report whether indicators of latent variables were drawn from one questionnaire or from multiple questionnaires.• Describe, for each questionnaire, whether the indicators are items or total scores across homogeneous sets of items (scales,
parcels), stating how• Scales were constructed, reporting their psychometrics• Items were treated in the analysis as continuous or categorical
• Report how the target sample size was determined, including• Rule of thumb• Availability of resource constraints• Results of a priori power analysis• Estimates of parameter precision used to plan the number of cases with appropriate explanation
• For a power analysis, state• Target level of power• Null and alternative hypotheses• Significance of key parameters• Fit statistics that figured in the analysis• Expected population effect sizes
• Report the computer software or algorithm used if the data were generated by simulation, state and justify the sizes ofgenerated samples, and disclose whether samples were lost because of nonconvergence or inadmissible estimates.
Results • Report data diagnostics, including• Percentage of missingness (if some data are missing) and how it is distributed across cases and variables• Empirical evidence or theoretical arguments about causes of missing data (i.e., missing completely at random [MCAR],
missing at random [MAR], or missing not at random [MNAR])• Evidence that distributional or other assumptions of estimation methods are plausible
Missing data • Indicate the statistical method used to address missingness, such as multiple imputation, full information maximumlikelihood (FIML), substitution of values, or deletion of cases. For multiple imputation or FIML estimates, state whethervariables not included in the model were specified as auxiliary variables.
Distributions • State whether the data were evaluated for estimation methods that assume multivariate normality.• Report values of statistics that measure univariate or multivariate skewness and kurtosis that support the assumption of
normal distributions.• If the data were not multivariate normal, state the strategy used to address nonnormality, such as use of a different
estimation method that does not assume normality or use of normalizing transformations of the scores.
Data summary • Report in the manuscript—or make available in the supplemental materials—sufficient summary statistics that allowsecondary analysis, including• Covariance matrix with means, or a correlation matrix with standard deviations and means for continuous variables• Polychoric correlation matrix, items thresholds, and the asymptotic covariance matrix for categorical variables
• Indicate whether the case-level data are archived, and provide information about how these data can be accessed byinterested readers.
Specification • Indicate the general approach that best describes the application of SEM, strictly confirmatory, comparison of alternativemodels, or model generation.
• Provide the diagram for each model fitted to the data. If the diagram would be overly complex, such as when largenumbers of variables are analyzed, then clearly describe the models in text. A reader should be able to translate the textdescription of a model into a diagram.
• Give a full account of the specification for all models to be evaluated, including observed variables, latent variables, fixedor free parameters, and constrained parameters.
• Report sufficient information, such as tabulations of the numbers of observations versus free parameters, so that the modeldegrees of freedom can be derived by the reader.
• Verify that models to be analyzed are actually identified. State the basis for this claim, including the method, rules, orheuristics used to establish identification.
• State the basis in theory or results of previous empirical studies if a measurement model is part of a larger model.
18 APPELBAUM ET AL.

The revised MARS (see Table 9) includes six groups ofchanges. First, the wording has been revised to clarifythat many sections of the MARS should be completed byresearch synthesists whether or not the evidence in theirreport is amenable to conducting a meta-analysis. Sec-ond, additional detail has been added to the description ofthe title page and author note. Most important, authorsare now asked to (a) explicitly state whether a possible orperceived conflict of interest may exist, and (b) providethe name and document entry number if the work hadbeen placed in a research register prior to being con-ducted (e.g., University of York, n.d.). Third, in recog-nition of the growing number of distinct research ques-tions with unique techniques to which research synthesesare now being applied, both the abstract and the intro-duction sections now ask that authors specify the type ofsynthesis being conducted. Fourth, the Search Strategysection has been expanded to deal directly with the five
types of strategies used most frequently in literaturesearches. Details of these searches are now asked for toallow more precise replication of searches and the eval-uation of whether biases might exist in the retrievedliterature. Fifth, the section on Coding Procedures hasbeen expanded to include more information on codedevelopment. The section has also been changed withregard to reporting of coder reliability. Sixth, a subsec-tion has been added to the Statistical Methods sectionasking for the reporting of recently developed statisticaloutcomes of meta-analysis.
Some Final Thoughts
The JARS–Quant formulations, like those of the originalJARS, were developed specifically for use in the social,behavioral, and educational sciences. They incorporate nu-merous ideas from other reporting standards, of which there
Table 7 (continued)
Paper sectionand topic Description
• Describe fully the specification of the mean structure if the model has a means component.• Explain the rationale for including error correlations in the model if correlated error terms are specified.• Explain how the effects are specified if the model includes interaction effects.• Explain how nonindependence is accounted for in the model for nested data (e.g., occasions within persons, students within
classrooms).• Describe any comparisons of parameters to be made between groups or occasions, and indicate which parameters are to be
compared if models are fitted to data from multiple groups or occasions.
Estimation • State the software (including version) used in the analysis. Also state the estimation method used and justify its use (i.e.,whether its assumptions are supported by the data).
• Disclose any default criteria in the software, such as the maximum number of iterations or level of tolerance, that wereadjusted in order to achieve a converged and admissible solution.
• Report any evidence of an inadmissible solution (e.g., error variances less than zero or constrained by the computer at zero;estimated absolute correlations or proportions of explained variance that exceed 1.0). Explain what was done to deal withthe problem.
Model fit • Report fit statistics or indices about global (omnibus) fit interpreted using criteria justified by citation of most recentevidence-based recommendations for all models to be interpreted.
• Report information about local fit, such as covariance, standardized, normalized, or correlation residuals, that justifyretaining the model at the level of pairs of observed variables for all interpreted models.
• State the strategy or criteria used to select one model over another if alternative models were compared. Report results ofdifference tests for comparisons between alternative models.
• State the test and criterion for testing estimates of individual parameters. If parameter estimated were compared over groupsor occasions, indicate how those comparisons were made.
Respecification • Indicate whether one or more interpreted models was a product of respecification. If so, then describe the method used tosearch for misspecified parameters.
• State which parameters were fixed or freed to produce the interpreted model. Also provide a theoretical or conceptualrationale for parameters that were fixed or freed after specification searching.
• Indicate whether models for which results are presented were specified before or after fitting other models or otherwiseexamining the data.
Estimates • Report both unstandardized and standardized estimates for all estimated parameters.• Report the corresponding standard errors, especially if outcomes of significance testing for individual parameters are
reported. State the cutoffs for levels of statistical significance, if such cutoffs were used.• Report estimates of indirect effects, both unstandardized and standardized. Also report values of standard errors for indirect
effects, if possible. State and justify the strategy for testing indirect effects.• Report estimates of interaction effects and also results of follow-up analyses that clarify the underlying pattern for
interpreted interactions. Also report values of standard errors for such interactions.
Discussion • Summarize the modifications to the original model and the bases, theoretical or statistical, for doing so.• Address the issue of equivalent models that fit the same data as well as retained models or alternative-but-nonequivalent
models that explain the data nearly as well as retained models. Justify the preference for retained models over equivalent ornear-equivalent versions.
19QUANTITATIVE RESEARCH REPORTING STANDARDS

are many. As with the original JARS, they share manyfeatures of other widely used systems such as CONSORT.In many cases, the Working Group has fairly directlyadapted the schema of other systems (e.g., N-of-1 reportingstandards); in other cases, other reporting systems are re-ferred to without any details (e.g., standards for reportingmeasures of neural activities); and in some cases, com-pletely new standards were developed, sometimes aided byindividuals or groups of individuals who were not membersof the Working Group (e.g., standards for reporting resultsusing Bayesian analyses, longitudinal studies, and studiespurporting to be replication studies). As in the originalJARS, the ways in which the tables might be used (e.g., asa formal checklist, as a reference list for editors, authors,and reviewers) are not specified. Some editors may wish todevelop formal checklists; some educators who teach sci-entific writing for psychology (see Cooper, 2011) mightwish to utilize the tables as part of classroom handouts. The
purpose of the tables in this article is as a communicationdevice to organize otherwise complex and numerousideas.
No matter the approach, the goal was to provide reportingstandards that would be appropriate for most of the empir-ical, quantitative research conducted by those individualswho identify their work, at least in part, as behavioral,social, or educational science. The intent was to span aswide a range of work as possible, including randomizedclinical trials, single-case designs, observational studies,longitudinal studies, research synthesis, and other forms ofempirical study—including qualitative studies and mixedmethod studies that were the province of the JARS–QualWorking Group.
Although the focus for the development of JARS–Quantwas the social, behavioral, and educational sciences, the Work-ing Group stayed keenly aware that many fields use some ofthese domains in their work—medicine, nursing, law, and
Table 8Reporting Standards for Studies Using Bayesian Techniques
Paper sectionand topic Description
Model • Completely specify both the systematic and the stochastic parts of the analyzed model, and give the rationale forchoices of functional forms and distributions.
Distributions • Describe the prior distribution(s) for model parameters of interest. If the priors are informative, state the rationale forthat choice, and conduct a sensitivity analysis to check the dependence of the results on the prior distribution.
• Describe the posterior distribution(s) for substantive model parameters and important functions of the parameters. Iffeasible, report the highest posterior density (HPD) interval for each parameter or function.
• Plot or describe the joint distribution if substantive parameters are correlated.• If predictions are made for observable quantities, make available either the actual predictive distribution and parameter
estimates, report summary statistics that describe the distribution, or a graphical summary.
Likelihood • Describe the unnormalized or normalized likelihood if the prior distribution is informative.
Plots • Include the prior distribution, likelihood, and posterior distribution in a single plot (i.e., a triplot) if the priordistribution is informative and plots are to be presented.
Decisions • Report the utilities, or costs and benefits, and explain how they were derived if the data are used for decision makingabout possible actions. Also provide a sensitivity analysis for various prior distributions or assumptions aboututilities for the decision.
Special cases • Explain the rationale for assuming exchangeability (or conditional exchangeability if there are covariates) formultilevel analyses. If relevant to the research context, present plots or tables of shrinkage-adjusted estimates andtheir confidence intervals.
• Report forest plots or caterpillar plots that include original and shrinkage-corrected estimates of effect sizes for eachstudy with confidence intervals for meta-analytic summaries. If feasible for the analytic method, provide aparameter trace plot where shrinkage-adjusted estimates are shown against the standard deviation of the residualeffects, combined with the posterior distribution of the residual variance.
• Describe the details of all decision rules, if these rules were decided (before or during the study), and theconsequences (results) of each decision in adaptive designs.
Computations • Describe in detail, including the number of chains, the number of burn-in iterations for each chain, and thinning ifMarkov chain Monte Carlo (MCMC) or another sampling procedure is used. Specify the methods used to check forconvergence and their results.
Model fit • Describe the procedures used to check the fit of the model, and the results of those checks.
Bayes factors • Specify the models being compared if Bayes Factors are calculated.• Report the Bayes Factors and how they were interpreted.• Test the sensitivity of the Bayes Factors to assumptions about prior distributions.
Bayesian modelaveraging
• State the parameter or function of parameters being estimated in Bayesian model averaging. Either plot the distributionor list the mean and standard deviation if it is near normal; otherwise, list a number of percentiles for thedistribution if it is not near normal.
• Describe how the models were generated and if a reduced set was used for averaging, how the selection was madeand which models were used in the averaging.
20 APPELBAUM ET AL.

Table 9Information Recommended for Inclusion in Manuscripts Reporting Meta-Analyses
Paper section andtopic Description
Title • State the research question and type of research synthesis (e.g., narrative synthesis, meta-analysis).
Author note • List all sources of monetary and in-kind funding support; state the role of funders in conducting the synthesis and decidingto publish the results, if any.
• Describe possible conflicts of interest, including financial and other nonfinancial interests.• Give the place where the synthesis is registered and its registry number, if registered.• Provide name, affiliation, and e-mail address of corresponding author.
AbstractObjectives • State the research problems, questions, or hypotheses under investigation.
Eligibility criteria • Describe the characteristics for inclusion of studies, including independent variables (treatments, interventions), dependentvariables (outcomes, criteria), and eligible study designs.
Methods ofsynthesis
• Describe the methods for synthesizing study results, including• Statistical and other methods used to summarize and to compare studies• Specific methods used to integrate studies if a meta-analysis was conducted (e.g., effect-size metric, averaging method,
the model used in homogeneity analysis)
Results • State the results of the synthesis, including• Number of included studies and participants, and their important characteristics• Results for the primary outcome(s) and moderator analyses• Effect size(s) and confidence interval(s) associated with each analysis if aa meta-analysis was conducted
Conclusions • Describe strengths and limitations of the evidence, including evidence of inconsistency, imprecision, risk of bias in theincluded studies and risk of reporting biases.
IntroductionProblem • State the question or relation(s) under investigation, including
• Historical background, including previous syntheses and meta-analyses related to the topic• Theoretical, policy, and/or practical issues related to the question or relation(s) of interest• Populations and settings to which the question or relation(s) is relevant• Rationale for (a) choice of study designs, (b) the selection and coding of outcomes, (c) the selection and coding potential
moderators or mediators of results• Psychometric characteristics of outcome measures and other variables
Objectives • State the hypotheses examined, indicating which were prespecified, including• Question in terms of relevant participant characteristics (including animal populations), independent variables
(experimental manipulations, treatments, or interventions), ruling out of possible confounding variables, dependentvariables (outcomes, criterion), and other features of study designs
• Method(s) of synthesis and if meta-analysis was used, the specific methods used to integrate studies (e.g., effect-sizemetric, averaging method, the model used in homogeneity analysis)
Protocol • List where the full protocol can be found (e.g., a supplement), or state that there was no protocol. State that the fullprotocol was published (or archived in a public registry) or that it was not published before the review was conducted.
MethodInclusion and
exclusioncriteria
• Describe the criteria for selecting studies, including• Independent variables (e.g., experimental manipulations, types of treatments or interventions or predictor variables)• Dependent variable (e.g., outcomes, in syntheses of clinical research including both potential benefits and potential
adverse effects)• Eligible study designs (e.g., methods of sampling or treatment assignment)• Handling of multiple reports about the same study or sample, describing which are primary and handling of multiple
measures using the same participants• Restrictions on study inclusion (e.g., by study age, language, location, or report type)• Changes to the prespecified inclusion and exclusion criteria, and when these changes were made• Handling of reports that did not contain sufficient information to judge eligibility (e.g., lacking information about study
design) and reports that did not include sufficient information for analysis (e.g., did not report numerical data aboutthose outcomes)
Informationsources
• Describe all information sources:• Search strategies of electronic searches, such that they could be repeated (e.g., include the search terms used, Boolean
connectors, fields searched, explosion of terms)• Databases searched (e.g., PsycINFO, ClinicalTrials.gov), including dates of coverage (i.e., earliest and latest records
included in the search), and software and search platforms used• Names of specific journals that were searched and the volumes checked• Explanation of rationale for choosing reference lists if examined (e.g., other relevant articles, previous research
syntheses)• Documents for which forward (citation) searches were conducted, stating why these documents were chosen• Number of researchers contacted if study authors or individual researchers were contacted to find studies or to obtain
more information about included studies, as well as criteria for making contact (e.g., previous relevant publications), andresponse rate
(table continues)
21QUANTITATIVE RESEARCH REPORTING STANDARDS

Table 9 (continued)
Paper section andtopic Description
• Dates of contact if other direct contact searches were conducted such as contacting corporate sponsors or mailings todistribution lists
• Search strategies in addition to those above and the results of these searches
Study selection • Describe the process for deciding which studies would be included in the syntheses and/or included in the meta-analysis,including
• Document elements (e.g., title, abstract, full text) used to make decisions about inclusion or exclusion from the synthesisat each step of the screening process
• Qualifications (e.g., training, educational or professional status) of those who conducted each step in the study selectionprocess, stating whether each step was conducted by a single person or in duplicate as well as an explanation of howreliability was assessed if one screener was used and how disagreements were resolved if multiple were used
Data collection • Describe methods of extracting data from reports, including• Variables for which data were sought and the variable categories• Qualifications of those who conducted each step in the data extraction process, stating whether each step was conducted
by a single person or in duplicate and an explanation of how reliability was assessed if one screener was used and howdisagreements were resolved if multiple screeners were used as well as whether data coding forms, instructions forcompletion, and the data (including metadata) are available, stating where they can be found (e.g., public registry,supplemental materials)
Methods forassessing riskto internalvalidity
• Describe any methods used to assess risk to internal validity in individual study results, including• Risks assessed and criteria for concluding risk exists or does not exist• Methods for including risk to internal validity in the decisions to synthesize of the data and the interpretation of results
Summarymeasures
• Describe the statistical methods for calculating effect sizes, including the metric(s) used (e.g., correlation coefficients,differences in means, risk ratios) and formula(s) used to calculate effect sizes.
Methods ofsynthesis
• Describe narrative and statistical methods used to compare studies. If meta-analysis was conducted, describe the methodsused to combine effects across studies and the model used to estimate the heterogeneity of the effects sizes (e.g., afixed-effect, random-effects model robust variance estimation), including
• Rationale for the method of synthesis• Methods for weighting study results• Methods to estimate imprecision (e.g., confidence or credibility intervals) both within and between studies• Description of all transformations or corrections (e.g., to account for small samples or unequal group numbers) and
adjustments (e.g., for clustering, missing data, measurement artifacts, or construct-level relationships) made to the dataand justification for these
• Additional analyses (e.g., subgroup analyses, meta-regression), including whether each analysis was prespecified or posthoc
• Selection of prior distributions and assessment of model fit if Bayesian analyses were conducted• Name and version number of computer programs used for the analysis• Statistical code and where it can be found (e.g., a supplement)
Publication biasand selectivereporting
• Address the adequacy of methods used (e.g., contacting authors for unreported outcomes to identify unpublished studiesand unreported data). Describe any statistical methods used to test for publication bias and selective reporting oraddress the potential limitations of the synthesis’s results if no such methods were used.
ResultsStudy selection • Describe the selection of studies, ideally with a flowchart, including
• Number of citations assessed for eligibility• Number of citations and number of unique studies included in the syntheses• Reasons for excluding studies at each stage of screening• Table with complete citations for studies that met many but not all inclusion criteria with reasons for exclusion (e.g.,
effect size was not calculable)
Studycharacteristics
• Summarize the characteristics of included studies. Provide a table showing, for each included study, the principle variablesfor which data were sought, including
• Characteristics of the independent and outcome or dependent variables and main moderator variables• Important characteristics of participants (e.g., age, sex, ethnicity)• Important contextual variables (e.g., setting, date)• Study design (e.g., methods of sampling or treatment assignment).• Report where the full data set is available (e.g., from the authors, supplemental materials, registry)
Results ofindividualstudies
• Report the results for each study or comparison (e.g., the effect size with confidence intervals for each independentvariable). If possible, present this information in a figure (e.g., forest plot).
Synthesis ofresults
• Report a synthesis (e.g., meta-analysis) for each study result (e.g., weighted average effect sizes, confidence intervals,estimates of heterogeneity of results).
22 APPELBAUM ET AL.

social work, to name but a few. In developing the JARS–Quantrecommendations, the Working Group tried to ensure thatthese reporting standards would be usable for scholarly work inother fields but ones that incorporate aspects of the social,behavioral, and educational sciences into them.
The implementation of reporting standards is a slowprocess, with many individuals contributing to realizingthe goals set forth in the JARS–Quant. Certainly, journaleditors, associate editors, and manuscript reviewers willbe prime movers of the adoption of any set of standards.This fact, however, implies that scholars who have themost contact with the authors of journal articles must beencouraged to be aware of these reporting standards andencourage their use. It is also incumbent upon publishers(such as APA) to provide training materials that presentthese standards in convenient formats. This is essential ifthose entering the field—indeed anyone committed to theadvancement of transparent social sciences—are to ac-quire the habit of utilizing reporting standards as a part oftheir formulation of how scholarly research is reported.
Much can be said about the value of adopting reportingstandards and developing ways to provide creative andforward thinking tools for communicating and trainingthose who use these standards. However, most basic is therealization that these reporting standards are important waysof systematically communicating the work that scholarshave done in the process of doing their science. Thesestandards do not specify how the science should be done butrather what about the science needs to be reported so that (a)
scientific claims can be clearly understood, assessed, andevaluated by the reader, and (b) the work can be replicatedwith reasonable accuracy such that a replication wouldreflect the science being reported. The Working Groupdoes, at the same time, recognize that specifying what needsto be reported also influences what data need to be gathered(one cannot report the reasons for drop-out if one does notcollect that data). Therefore, a command of the reportingstandards is a critical part of the initial planning of anempirical study. This initial understanding may not onlyease the task of complete and transparent reporting but alsoimprove the implementation of the research.
References
American Educational Research Association, American Psychological As-sociation, & National Council on Measurement in Education. (2014).Standards for educational and psychological testing. Washington, DC:Author.
American Psychological Association. (2010). Publication manual of theAmerican Psychological Association (6th ed.). Washington, DC: Author.
APA Publications and Communications Board Working Group on JournalArticle Reporting Standards. (2008). Reporting standards for research inpsychology: Why do we need them? What might they be? AmericanPsychologist, 63, 839–851. http://dx.doi.org/10.1037/0003-066X.63.9.839
Atkinson, K. M., Koenka, A. C., Sanchez, C. E., Moshontz, H., & Cooper,H. (2015). Reporting standards for literature searches and report inclu-sion criteria: Making research syntheses more transparent and easy toreplicate. Research Synthesis Methods, 6, 87–95. http://dx.doi.org/10.1002/jrsm.1127
Table 9 (continued)
Paper section andtopic Description
Assessment ofinternalvalidity ofindividualstudies
• Describe risks of bias different design features might introduce into the synthesis results.
Publication andreporting bias
• Describe risk of bias across studies, including• Statement about whether (a) unpublished studies and unreported data, or (b) only published data were included in the
synthesis and the rationale if only published data were used• Assessments of the impact of publication bias (e.g., modeling of data censoring, trim-and-fill analysis)• Results of any statistical analyses looking for selective reporting of results within studies
Adverse andharmful effects
• Report any adverse or harmful effects identified in individual studies.
DiscussionSummary of the
evidence• Summarize the main findings, including
• Main results of the synthesis, including all results of prespecified analyses• Overall quality of the evidence• Strengths and limitations (e.g., inconsistency, imprecision, risk of bias, and publication bias or selective outcome
reporting) of findings• Alternative explanations for observed results (e.g., confounding, statistical power)• Similarities and differences with previous syntheses
Generalizability • Describe the generalizability (external validity) of conclusions, including• Implications for related populations, intervention variations, dependent (outcome) variables
Implications • Interpret the results in light of previous evidence.• Address the implications for further research, theory, policy, and/or practice.
23QUANTITATIVE RESEARCH REPORTING STANDARDS
Barker, J. B., Mellalieu, S. D., McCarthy, P. J., Jones, M. V., & Moran, A.(2013). A review of single-case research in sport psychology 1997–2012: Research trends and future directions. Journal of Applied SportPsychology, 25, 4–32. http://dx.doi.org/10.1080/10413200.2012.709579
Begley, C. G., & Ellis, L. M. (2012, March 28). Drug development: Raisestandards for preclinical cancer research. Nature, 483, 531–533. http://dx.doi.org/10.1038/483531a
Borrelli, B. (2011). The assessment, monitoring, and enhancement oftreatment fidelity in public health clinical trials. Journal of Public HealthDentistry, 71(Suppl. 1), S52–S63. http://dx.doi.org/10.1111/j.1752-7325.2011.00233.x
Cooper, H. (2011). Reporting research in psychology: How to meet journalarticle standards. Washington, DC: American Psychological Associa-tion.
Cybulski, L., Mayo-Wilson, E., & Grant, S. (2016). Improving transpar-ency and reproducibility through registration: The status of interventiontrials published in clinical psychology journals. Journal of Consultingand Clinical Psychology, 84, 753–767. http://dx.doi.org/10.1037/ccp0000115
Didden, R., Korzilius, H., van Oorsouw, W., & Sturmey, P. (2006).Behavioral treatment of challenging behaviors in individuals with mildmental retardation: Meta-analysis of single-subject research. AmericanJournal on Mental Retardation, 111, 290–298. http://dx.doi.org/10.1352/0895-8017(2006)111
Duggan, C., Parry, G., McMurran, M., Davidson, K., & Dennis, J. (2014).The recording of adverse events from psychological treatments in clin-ical trials: Evidence from a review of NIHR-funded trials. Trials, 15,335. http://dx.doi.org/10.1186/1745-6215-15-335
Hoyle, R. H., & Isherwood, J. C. (2013). Reporting results from structuralequation modeling analyses in Archives of Scientific Psychology. Ar-chives of Scientific Psychology, 1, 14–22. http://dx.doi.org/10.1037/arc0000004
Kilkenny, C., Browne, W. J., Browne, W. J., Cuthill, I. C., Emerson, M.,& Aktman, D. G. (2010). Improving bioscience research reporting: TheARRIVE guidelines for reporting animal research. PLoS Biology, 8(6),e1000412. http://dx.doi.org/10.1371/journal.pbio.1000412
Kline, R. B. (2016). Principles and practice of structural equation mod-eling (4th ed.). New York, NY: Guilford Press.
Mackey, A. (2012). Why (or why not), when, and how to replicateresearch. In G. Porte (Ed.), Replication research in applied linguistics(pp. 21–46). New York, NY: Cambridge University Press.
Maggin, D. M., Chafouleas, S. M., Goddard, K. M., & Johnson, A. H.(2011). A systematic evaluation of token economies as a classroommanagement tool for students with challenging behavior. Journal ofSchool Psychology, 49, 529–554. http://dx.doi.org/10.1016/j.jsp.2011.05.001
Maxwell, S. E., Lau, M. Y., & Howard, G. S. (2015). Is psychologysuffering from a replication crisis? What does “failure to replicate”really mean? American Psychologist, 70, 487–498. http://dx.doi.org/10.1037/a0039400
Montgomery, P., Grant, S. P., Hopewell, S., Macdonald, G., Moher, D.,Michie, S., & Mayo-Wilson, E. (2013, September 2). Protocol forCONSORT-SPI: An extension for social and psychological interven-tions. Implementation Science, 8, 1–7. http://dx.doi.org/10.1186/1748-5908-8-99
Montgomery, P., Underhill, K., Gardner, F., Operario, D., & Mayo-Wilson,E. (2013). The Oxford Implementation Index: A new tool for incorpo-rating implementation data into systematic reviews and meta-analyses.Journal of Clinical Epidemiology, 66, 874–882. http://dx.doi.org/10.1016/j.jclinepi.2013.03.006
Mueller, R. O., & Hancock, G. R. (2008). Best practices in structuralequation modeling. In J. W. Osborne (Ed.), Best practices in quantitativemethods (pp. 488–508). Thousand Oaks, CA: Sage.
National Institutes of Health. (2014, October). Notice of revised NIHdefinition of “clinical trial” (Notice No. NOT-OD-15-015). Retrievedfrom https://grants.nih.gov/grants/guide/noticefiles/
Nezu, A. M., & Nezu, C. M. (2008). Ensuring treatment integrity. In A. M.Nezu & C. M. Nezu (Eds.), Evidence-based outcome research: A prac-tical guide to conducting randomized clinical trials for psychosocialinterventions (pp. 263–281). New York, NY: Oxford University Press.
Nichols, T. E., Das, S., Eickhoff, S. B., Evans, A. C., Glatard, T., Hanke,M., . . . Yeo, B. T. (2017). Best practices in data analysis and sharing inneuroimaging using MRI. Nature Neuroscience, 20, 299–303. http://dx.doi.org/10.1038/nn.4500
Nosek, B. A., & Lakens, D. (Eds.). (2013). Replications of importantresults in social psychology [Special issue]. Social Psychology, 44.
Open Science Collaboration. (2015, August 28). Estimating the reproduc-ibility of psychological science. Science, 349, aac4716. http://dx.doi.org/10.1126/science.aac4716
Peterson, A. L., Roache, J. D., Raj, J., & Young-McCaughan, S. (2012).The need for expanded monitoring of adverse events in behavioral healthclinical trials. Contemporary Clinical Trials, 34, 152–154. http://dx.doi.org/10.1016/j.cct.2012.10.009
Picton, T. W., Bentin, S., Berg, P., Donchin, E., Hillyard, S. A., Johnson,R., Jr, . . . Taylor, M. J. (2000). Guidelines for using human event-relatedpotentials to study cognition: Recording standards and publication cri-teria. Psychophysiology, 37, 127–152. http://dx.doi.org/10.1111/1469-8986.3720127
Reynolds, C. R., & Livingston, R. B. (2012). Mastering modern psycho-logical testing: Theory & methods. Boston, MA: Pearson.
Schulz, K. F., Altman, D. G., Moher, D., & the CONSORT Group. (2010).CONSORT 2010 statement: Updated guidelines for reporting parallelgroup randomized trials. Annals of Internal Medicine, 152, 726–732.http://dx.doi.org/10.7326/0003-4819-152-11-201006010-00232
Schumaker, R. E., & Lomax, R. G. (2016). A beginner’s guide to structuralequation modeling (4th ed.). New York, NY: Routledge.
Shamseer, L., Sampson, M., Bukutu, C., Schmid, C. H., Nikles, J., Tate, R.,. . . CENT group. (2015). CONSORT extension for reporting N-of-1Trials (CENT) 2015: Explanation and elaboration. British Medical Jour-nal, 350, h1793. http://dx.doi.org/10.1136/bmj.h1793
Slaney, K. L., Tkatchouk, M., Gabriel, S. M., & Maraun, M. D. (2009).Psychometric assessment and reporting practices: Incongruence betweentheory and practice. Journal of Psychoeducational Assessment, 27, 465–476. http://dx.doi.org/10.1177/0734282909335781
Smith, J. D. (2012). Single-case experimental designs: A systematic reviewof published research and current standards. Psychological Methods, 17,510–550. http://dx.doi.org/10.1037/a0029312
Stroup, D. F., Berlin, J. A., Morton, S. C., Olkin, I., Williamson, G. D.,Rennie, D., . . . Thacker, S. B. (2000, April 19). Meta-analysis ofobservational studies in epidemiology: A proposal for reporting. Meta-analysis Of Observational Studies in Epidemiology (MOOSE) group.Journal of the American Medical Association, 283, 2008–2012.
Tate, R. L., Perdices, M., McDonald, S., Togher, L., & Rosenkoetter, U.(2014). The design, conduct and report of single-case research: Re-sources to improve the quality of the neurorehabilitation literature.Neuropsychological Rehabilitation, 24, 315–331. http://dx.doi.org/10.1080/09602011.2013.875043
Tate, R. L., Perdices, M., Rosenkoetter, U., McDonald, S., Togher, L.,Shadish, W., . . . Vohra, S. (2016). The Single-Case Reporting guidelineIn BEhavioural interventions (SCRIBE) 2016: Explanation and elabo-ration. Archives of Scientific Psychology, 4, 10–31. http://dx.doi.org/10.1037/arc0000027
Tate, R. L., Perdices, M., Rosenkoetter, U., Shadish, W., Vohra, S., Barlow,D. H., . . . Wilson, B. (2016). The Single-Case Reporting guideline InBEhavioural interventions (SCRIBE) 2016 statement. Archives of ScientificPsychology, 4, 1–9. http://dx.doi.org/10.1037/arc0000026
Thompson, B. (Ed.), (2003). Score reliability. Thousand Oaks, CA: Sage.
24 APPELBAUM ET AL.

Tooth, L., Ware, R., Bain, C., Purdie, D. M., & Dobson, A. (2005). Qualityof reporting of observational longitudinal research. American Journal ofEpidemiology, 161, 280–288. http://dx.doi.org/10.1093/aje/kwi042
University of York. (n.d.). Welcome to PROSPERO. Retrieved from http://www.crd.york.ac.uk/PROSPERO/
Vohra, S., Shamseer, L., Sampson, M., Bukutu, C., Schmid, C. H., Tate, R.,. . . CENT group. (2015). CONSORT extension for reporting N-of-1trials (CENT) 2015 statement. British Medical Journal, 350, h1738.http://dx.doi.org/10.1136/bmj.h1738
World Medical Association. (2013, November 27). World Medical Asso-ciation Declaration of Helsinki: Ethical principles for medical researchinvolving human subjects. Journal of the American Medical Association,310, 2191–2194. http://dx.doi.org/10.1001/jama.2013.281053
Received September 6, 2016Revision received June 27, 2017
Accepted June 29, 2017 �
25QUANTITATIVE RESEARCH REPORTING STANDARDS