jonathan norris
TRANSCRIPT
Private FundingTrends Presentation
Venture Healthcare – Industry Update
OIS 2015
November 2015
Jon Norris, Managing Director
Jon Norris - [email protected] 3
Manage West Coast Healthcare Relationshipsfor SVB across the SVB Platform, including
Fund of Funds (Investment as LP) Direct Equity (Co-Investments and Rights to Invest) Commercial Bank (Venture/Mezzanine Debt, Asset-based Debt,
New Fundings) Equity Financing Strategy for Early Stage and Venture-Backed
Companies Industry Thought Leadership
Jon Norris: Managing Director, SVB Capital
Jonathan NorrisManaging Director, HealthcareSilicon Valley Bank
Mobile [email protected]: @jonnysvb
Publications Trends in Healthcare Investments and Exits (2015) A Year of Dazzling Returns: 2014 Healthcare Investments
and Exits (2015) Trends in Healthcare Investments and Exits (2014) Strong Momentum in Healthcare (2013) First Mover Advantage (2012) Continued Rebound (2012) Trends in M&A (2011) Bringing Home the Bacon (2010)
Jon Norris - [email protected] 4
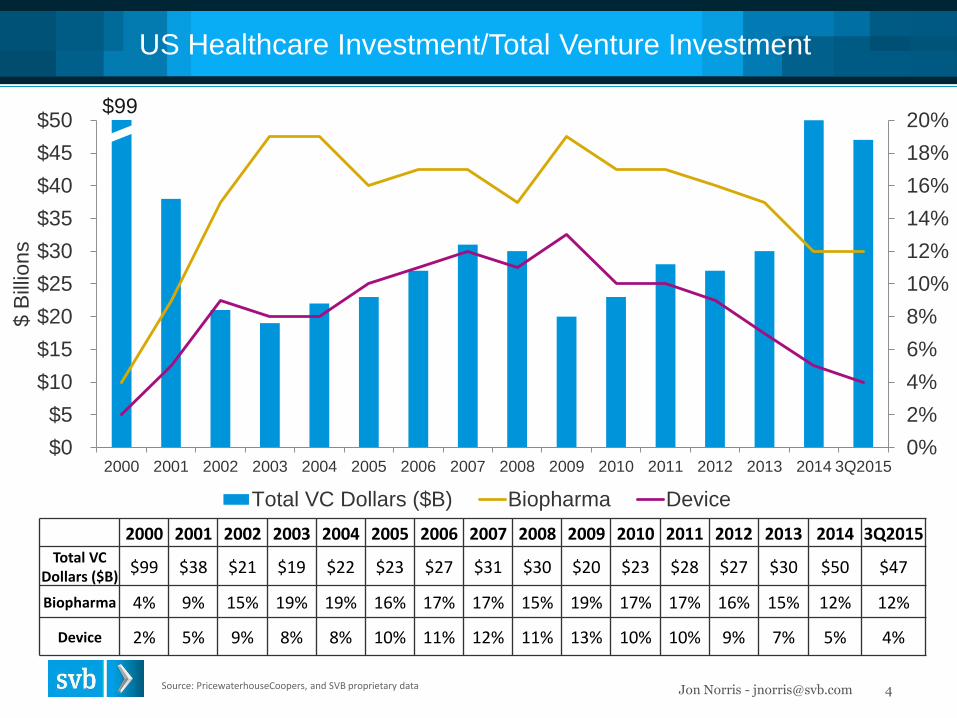
2000 2001 2002 2003 2004 2005 2006 2007 2008 2009 2010 2011 2012 2013 2014 3Q2015Total VC
Dollars ($B)$99 $38 $21 $19 $22 $23 $27 $31 $30 $20 $23 $28 $27 $30 $50 $47
Biopharma 4% 9% 15% 19% 19% 16% 17% 17% 15% 19% 17% 17% 16% 15% 12% 12%
Device 2% 5% 9% 8% 8% 10% 11% 12% 11% 13% 10% 10% 9% 7% 5% 4%
US Healthcare Investment/Total Venture Investment
Source: PricewaterhouseCoopers, and SVB proprietary data
0%
2%
4%
6%
8%
10%
12%
14%
16%
18%
20%
$0
$5
$10
$15
$20
$25
$30
$35
$40
$45
$50
2000 2001 2002 2003 2004 2005 2006 2007 2008 2009 2010 2011 2012 2013 2014 3Q2015
$ B
illio
ns
Total VC Dollars ($B) Biopharma Device
$99
5Jon Norris - [email protected] 5
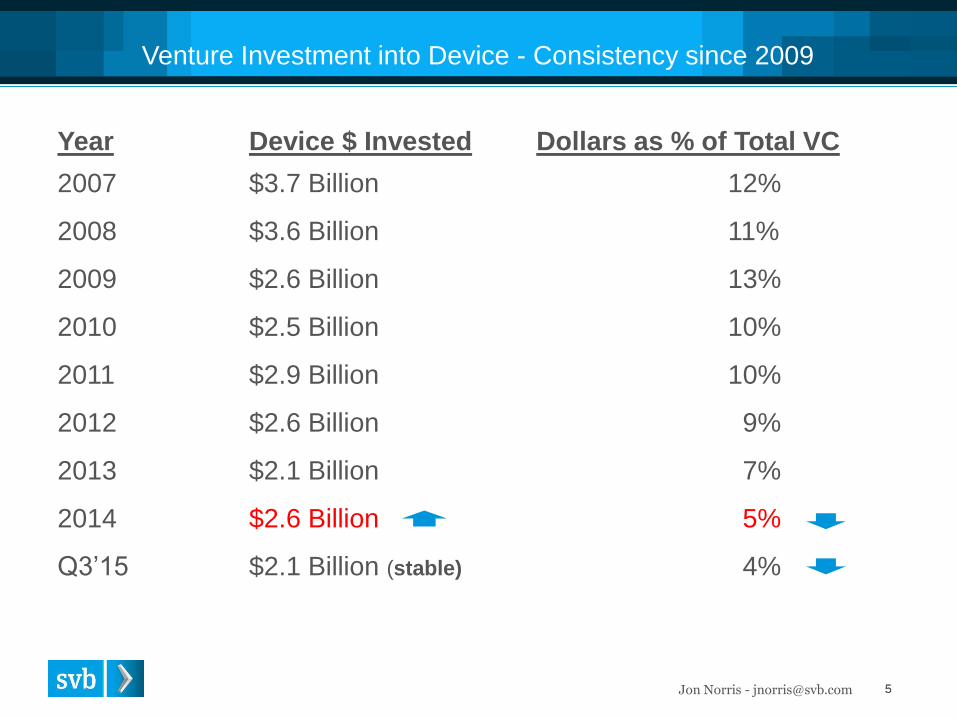
Venture Investment into Device - Consistency since 2009
Year Device $ Invested Dollars as % of Total VC
2007 $3.7 Billion 12%
2008 $3.6 Billion 11%
2009 $2.6 Billion 13%
2010 $2.5 Billion 10%
2011 $2.9 Billion 10%
2012 $2.6 Billion 9%
2013 $2.1 Billion 7%
2014 $2.6 Billion 5%
Q3’15 $2.1 Billion (stable) 4%
Jon Norris - [email protected] 6
0%
100%
200%
300%
400%
500%
0
1
2
3
4
5
6
7
8
9
10
2005 2006 2007 2008 2009 2010 2011 2012 2013 2014
$ B
illio
ns
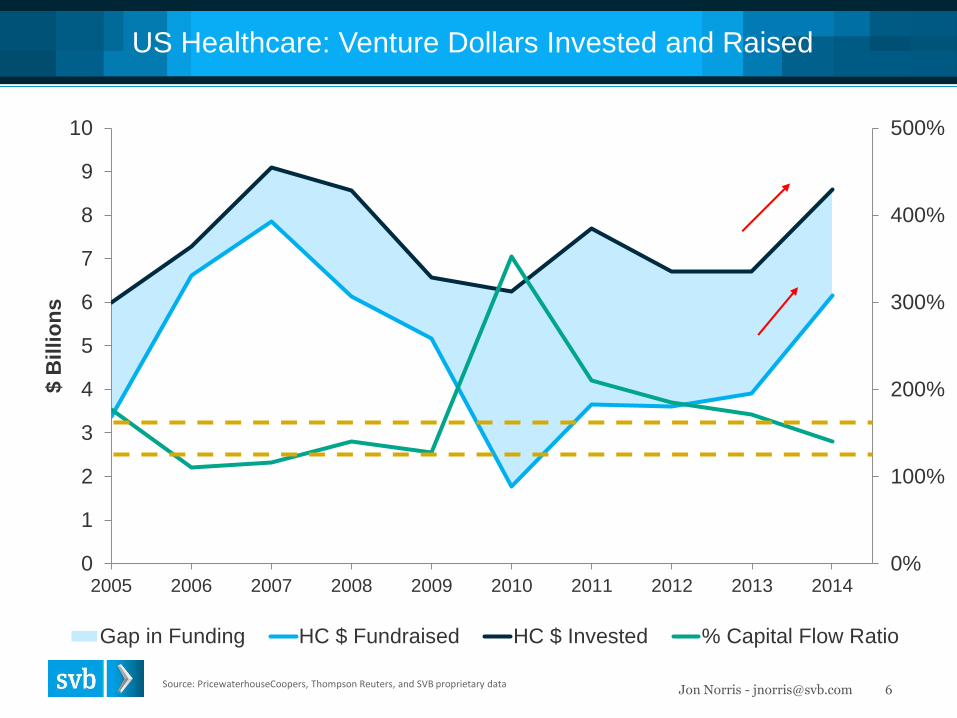
Gap in Funding HC $ Fundraised HC $ Invested % Capital Flow Ratio
Source: PricewaterhouseCoopers, Thompson Reuters, and SVB proprietary data
US Healthcare: Venture Dollars Invested and Raised
Jon Norris - [email protected] 7
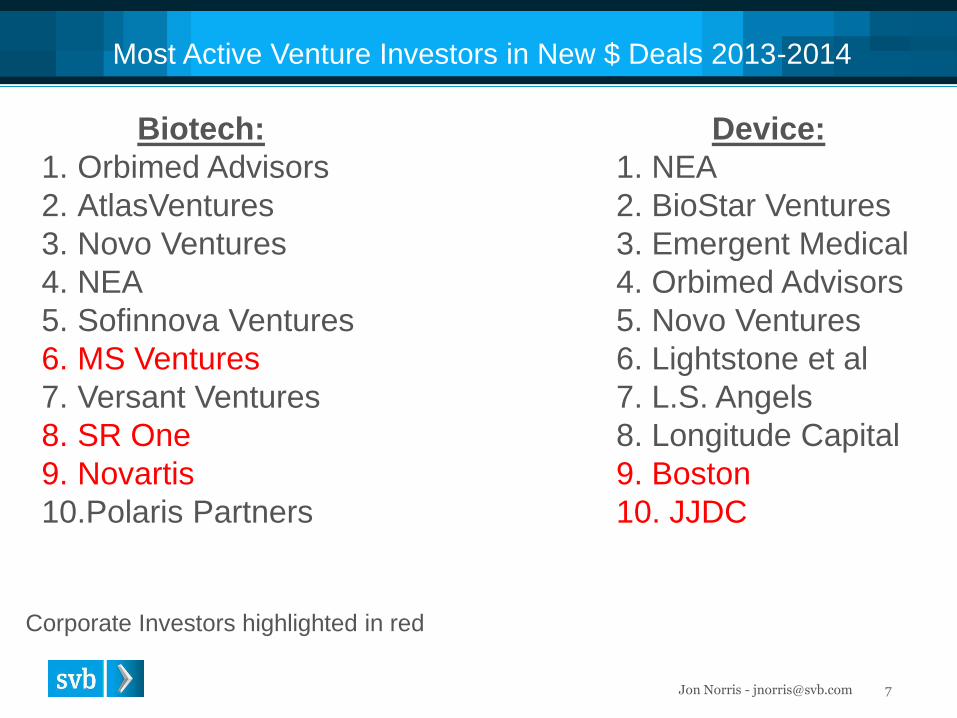
Most Active Venture Investors in New $ Deals 2013-2014
Biotech: Device:1. Orbimed Advisors 1. NEA2. AtlasVentures 2. BioStar Ventures3. Novo Ventures 3. Emergent Medical4. NEA 4. Orbimed Advisors5. Sofinnova Ventures 5. Novo Ventures6. MS Ventures 6. Lightstone et al7. Versant Ventures 7. L.S. Angels8. SR One 8. Longitude Capital 9. Novartis 9. Boston10.Polaris Partners 10. JJDC
Corporate Investors highlighted in red
Jon Norris - [email protected] 8
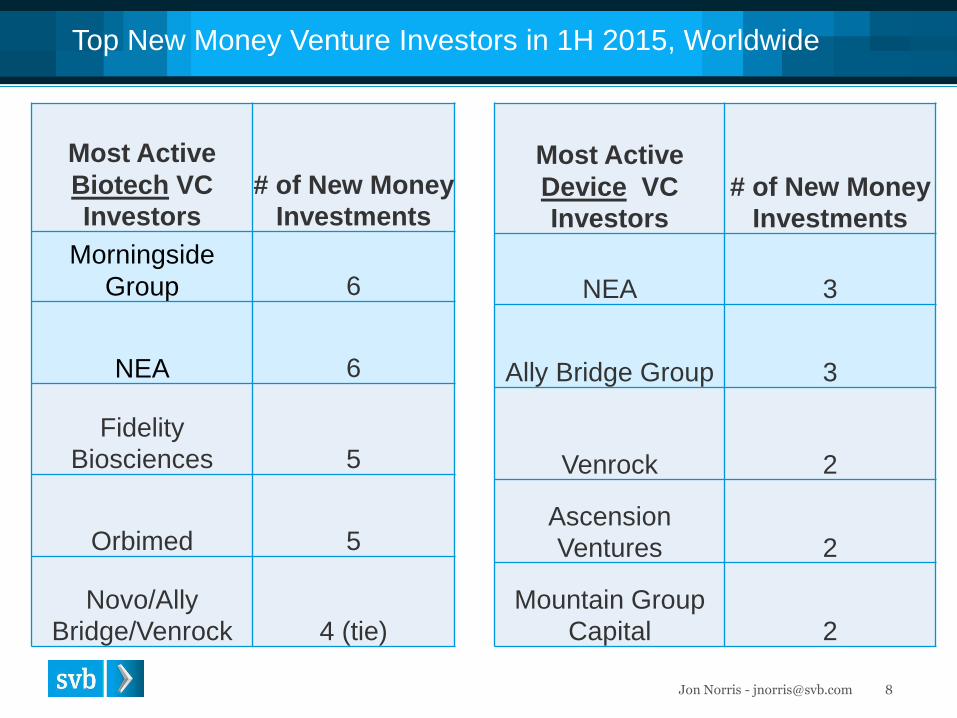
Top New Money Venture Investors in 1H 2015, Worldwide
Most Active Biotech VCInvestors
# of New Money Investments
MorningsideGroup 6
NEA 6
Fidelity Biosciences 5
Orbimed 5
Novo/Ally Bridge/Venrock 4 (tie)
Most Active Device VC Investors
# of New Money Investments
NEA 3
Ally Bridge Group 3
Venrock 2
AscensionVentures 2
Mountain Group Capital 2
Jon Norris - [email protected] 9
Q3 ‘15 Bio Financing Update
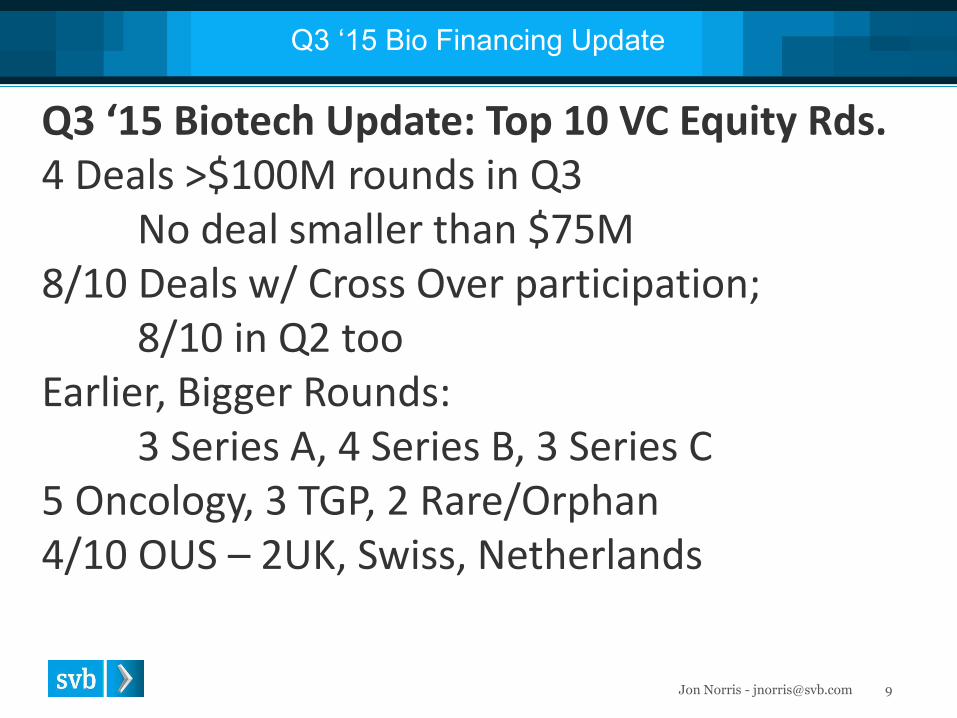
Q3 ‘15 Biotech Update: Top 10 VC Equity Rds.4 Deals >$100M rounds in Q3
No deal smaller than $75M 8/10 Deals w/ Cross Over participation;
8/10 in Q2 tooEarlier, Bigger Rounds:
3 Series A, 4 Series B, 3 Series C5 Oncology, 3 TGP, 2 Rare/Orphan4/10 OUS – 2UK, Swiss, Netherlands
Jon Norris - [email protected] 10
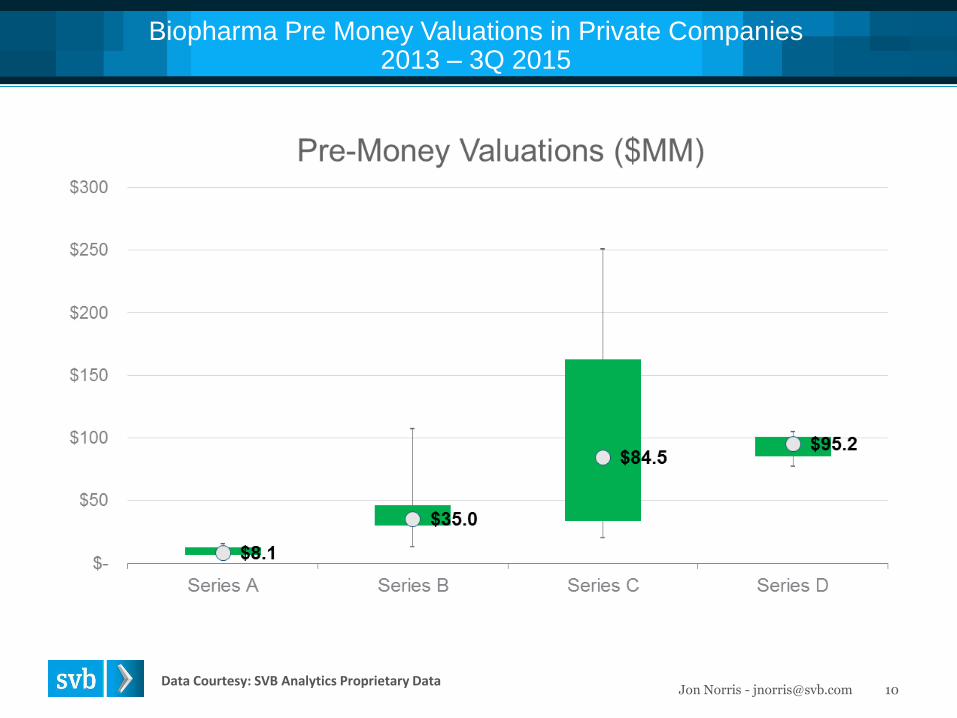
Biopharma Pre Money Valuations in Private Companies 2013 – 3Q 2015
Data Courtesy: SVB Analytics Proprietary Data
Jon Norris - [email protected] 11
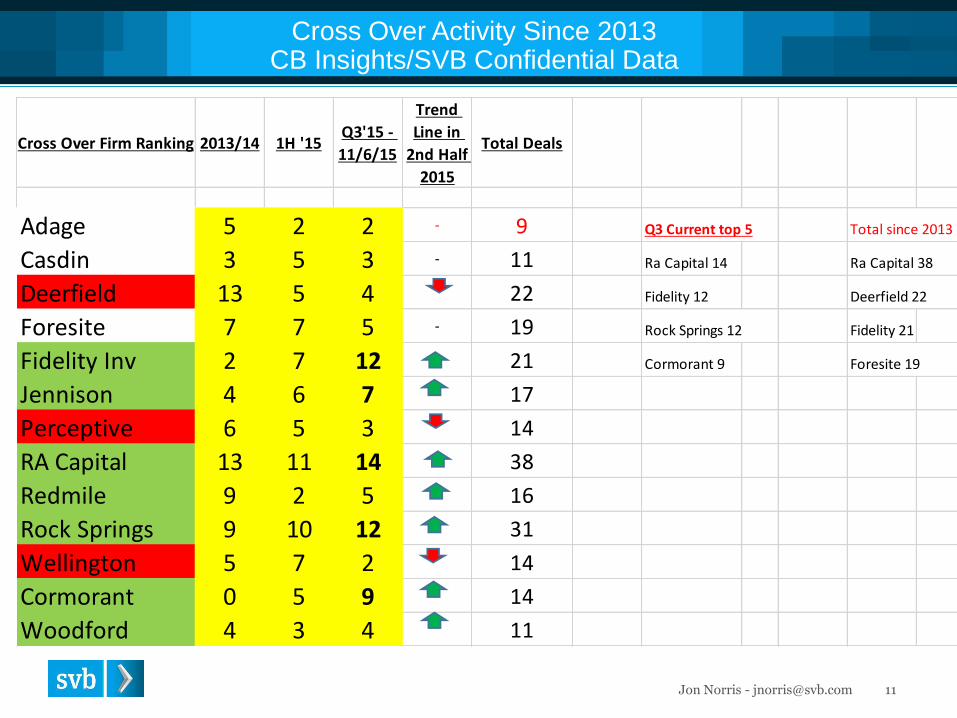
Cross Over Activity Since 2013CB Insights/SVB Confidential Data
Cross Over Firm Ranking 2013/14 1H '15Q3'15 -
11/6/15
Trend
Line in
2nd Half
2015
Total Deals
Adage 5 2 2 - 9 Q3 Current top 5 Total since 2013
Casdin 3 5 3 - 11 Ra Capital 14 Ra Capital 38
Deerfield 13 5 4 22 Fidelity 12 Deerfield 22
Foresite 7 7 5 - 19 Rock Springs 12 Fidelity 21
Fidelity Inv 2 7 12 21 Cormorant 9 Foresite 19
Jennison 4 6 7 17
Perceptive 6 5 3 14
RA Capital 13 11 14 38
Redmile 9 2 5 16
Rock Springs 9 10 12 - 31
Wellington 5 7 2 14
Cormorant 0 5 9 14
Woodford 4 3 4 11
Jon Norris - [email protected] 12
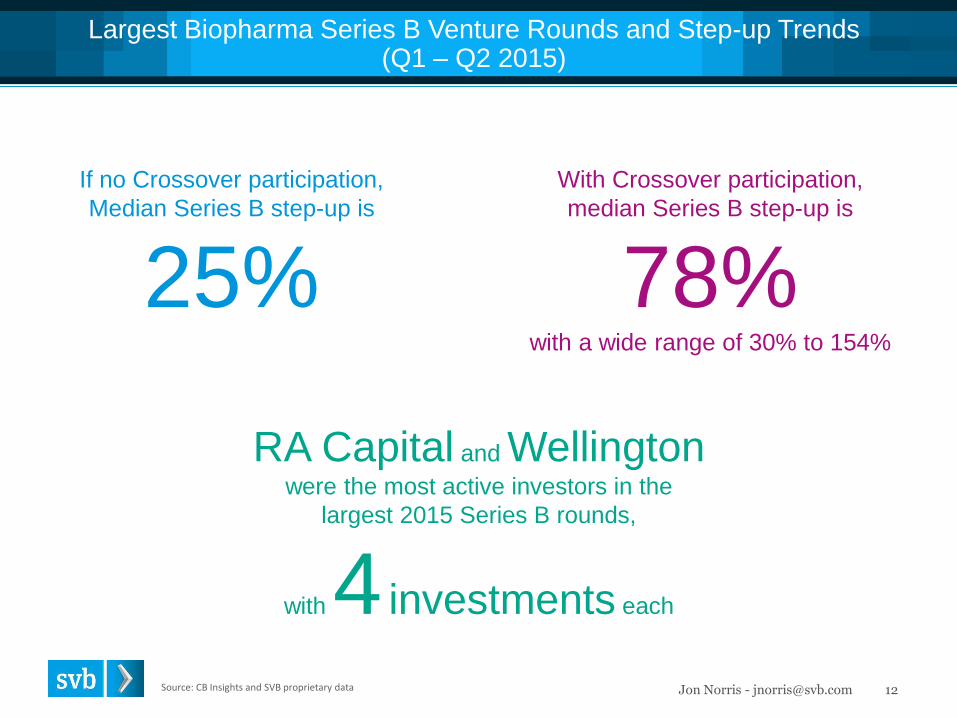
Largest Biopharma Series B Venture Rounds and Step-up Trends(Q1 – Q2 2015)
If no Crossover participation,Median Series B step-up is
25%With Crossover participation, median Series B step-up is
78%with a wide range of 30% to 154%
RA Capital and Wellington were the most active investors in the
largest 2015 Series B rounds,
with 4 investments each
Source: CB Insights and SVB proprietary data
Jon Norris - [email protected] 13IPOs = VC backed IPOs raising > $25M
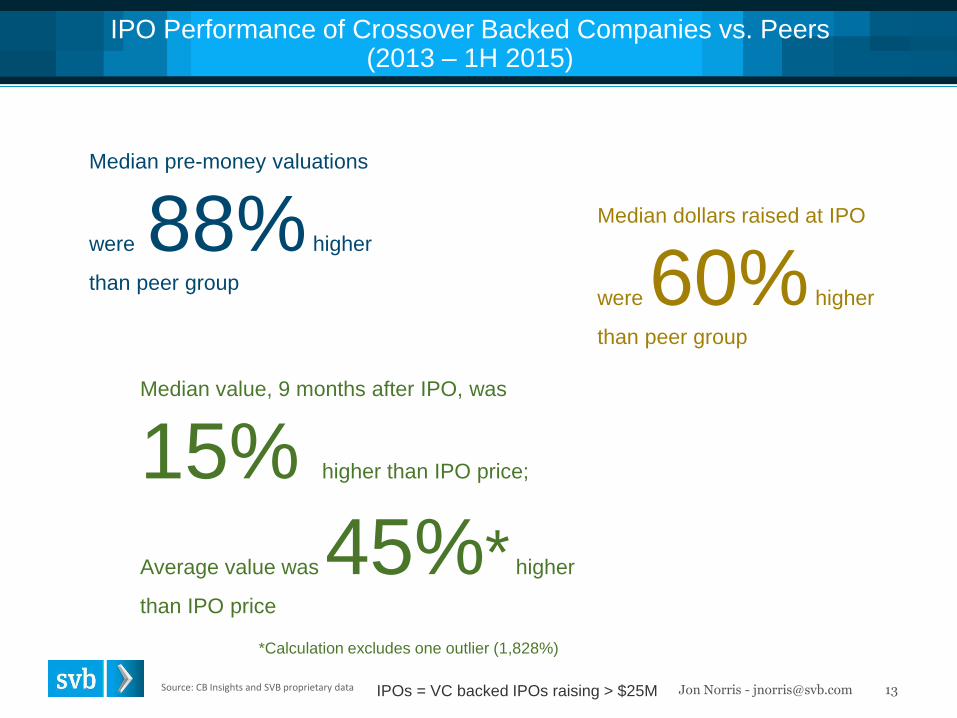
IPO Performance of Crossover Backed Companies vs. Peers(2013 – 1H 2015)
Median pre-money valuations
were 88% higher
than peer group
Median dollars raised at IPO
were 60% higher
than peer group
Median value, 9 months after IPO, was
15% higher than IPO price;
Average value was 45%* higher
than IPO price
Source: CB Insights and SVB proprietary data
*Calculation excludes one outlier (1,828%)
14Jon Norris - [email protected] 14
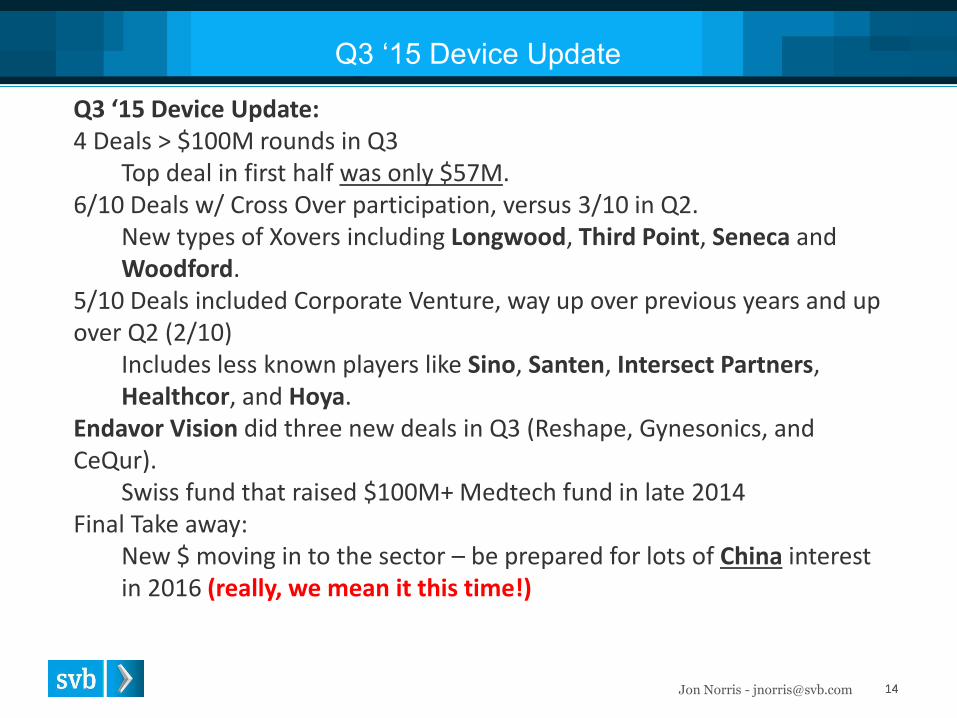
Q3 ‘15 Device Update
Q3 ‘15 Device Update:4 Deals > $100M rounds in Q3
Top deal in first half was only $57M.6/10 Deals w/ Cross Over participation, versus 3/10 in Q2.
New types of Xovers including Longwood, Third Point, Seneca and Woodford.
5/10 Deals included Corporate Venture, way up over previous years and up over Q2 (2/10)
Includes less known players like Sino, Santen, Intersect Partners, Healthcor, and Hoya.
Endavor Vision did three new deals in Q3 (Reshape, Gynesonics, and CeQur).
Swiss fund that raised $100M+ Medtech fund in late 2014Final Take away:
New $ moving in to the sector – be prepared for lots of China interest in 2016 (really, we mean it this time!)
15Jon Norris - [email protected] 15
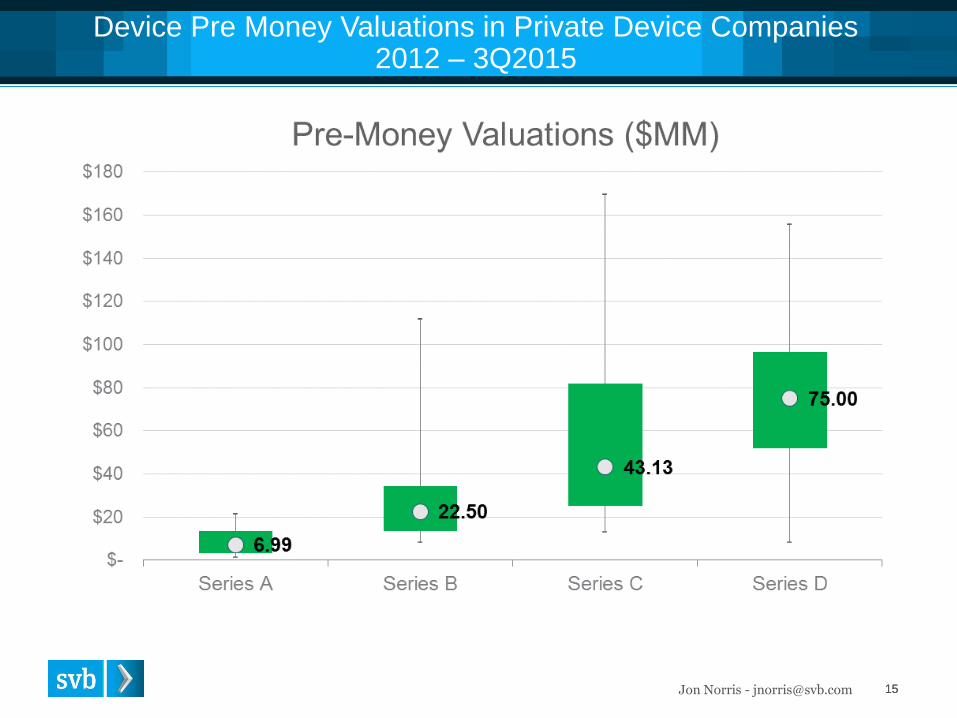
Device Pre Money Valuations in Private Device Companies 2012 – 3Q2015
Jon Norris - [email protected] 16
0
10
20
30
40
50
60
70
80
90
2005 2006 2007 2008 2009 2010 2011 2012 2013 2014 3Q2015
# o
f B
ig E
xits
Big Exit M&A VC-Backed IPOs
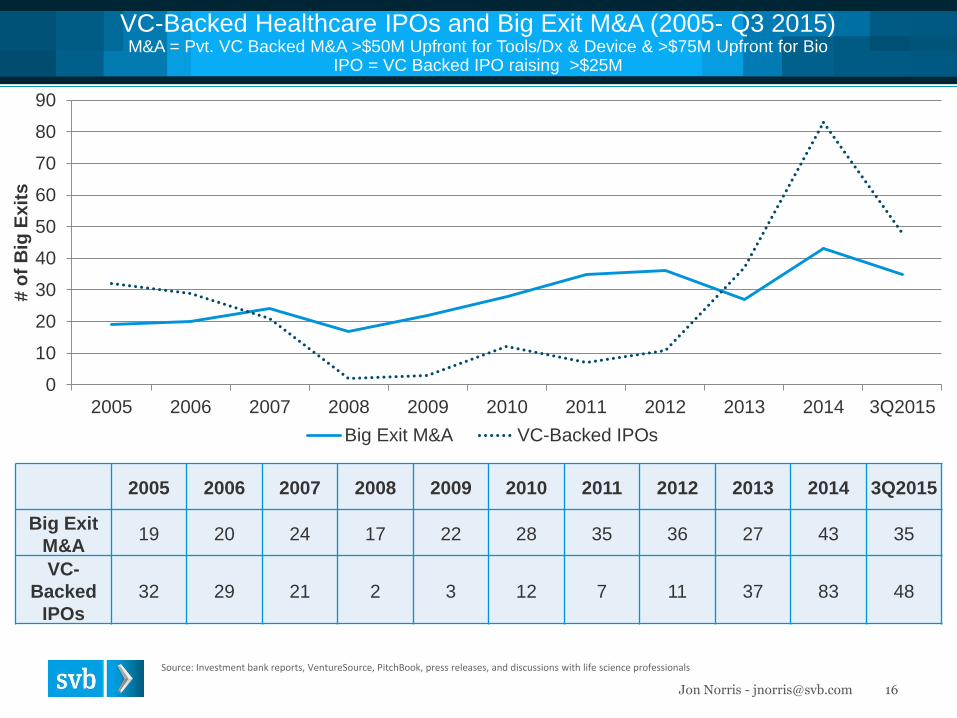
VC-Backed Healthcare IPOs and Big Exit M&A (2005- Q3 2015)M&A = Pvt. VC Backed M&A >$50M Upfront for Tools/Dx & Device & >$75M Upfront for Bio
IPO = VC Backed IPO raising >$25M
Source: Investment bank reports, VentureSource, PitchBook, press releases, and discussions with life science professionals
2005 2006 2007 2008 2009 2010 2011 2012 2013 2014 3Q2015
Big Exit M&A
19 20 24 17 22 28 35 36 27 43 35
VC-Backed
IPOs32 29 21 2 3 12 7 11 37 83 48
Jon Norris - [email protected] 17
0
2
4
6
8
10
12
14
16
18
20
22
2005 2006 2007 2008 2009 2010 2011 2012 2013 2014 3Q2015
Tota
l Val
ue
($ B
illio
ns)
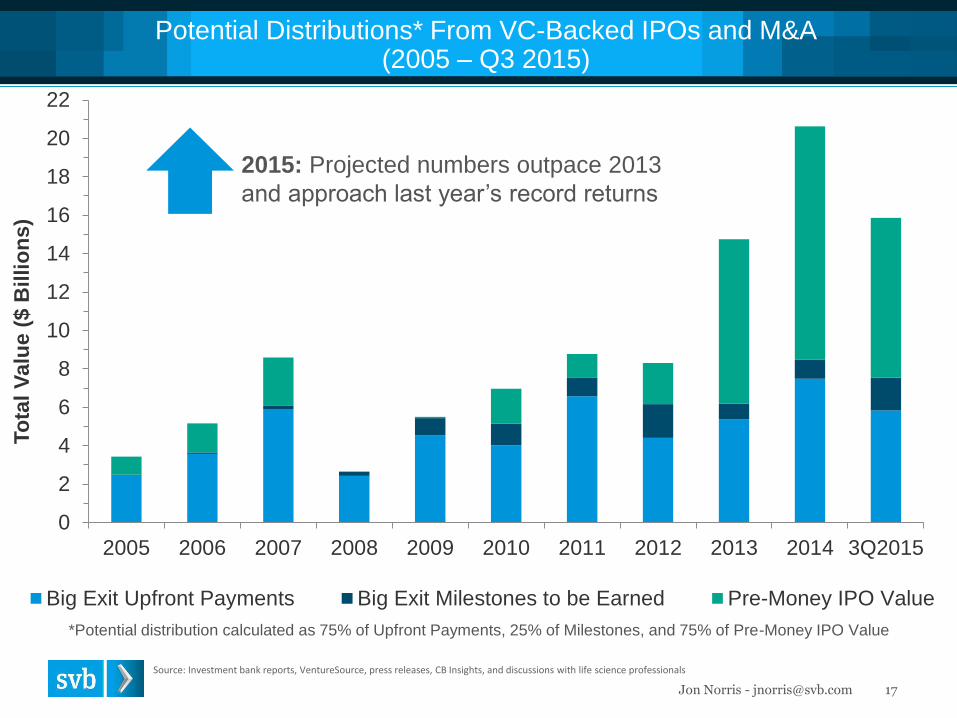
Big Exit Upfront Payments Big Exit Milestones to be Earned Pre-Money IPO Value*Potential distribution calculated as 75% of Upfront Payments, 25% of Milestones, and 75% of Pre-Money IPO Value
Potential Distributions* From VC-Backed IPOs and M&A(2005 – Q3 2015)
Source: Investment bank reports, VentureSource, press releases, CB Insights, and discussions with life science professionals
2015: Projected numbers outpace 2013and approach last year’s record returns
Frazier Life Sciences Retreat
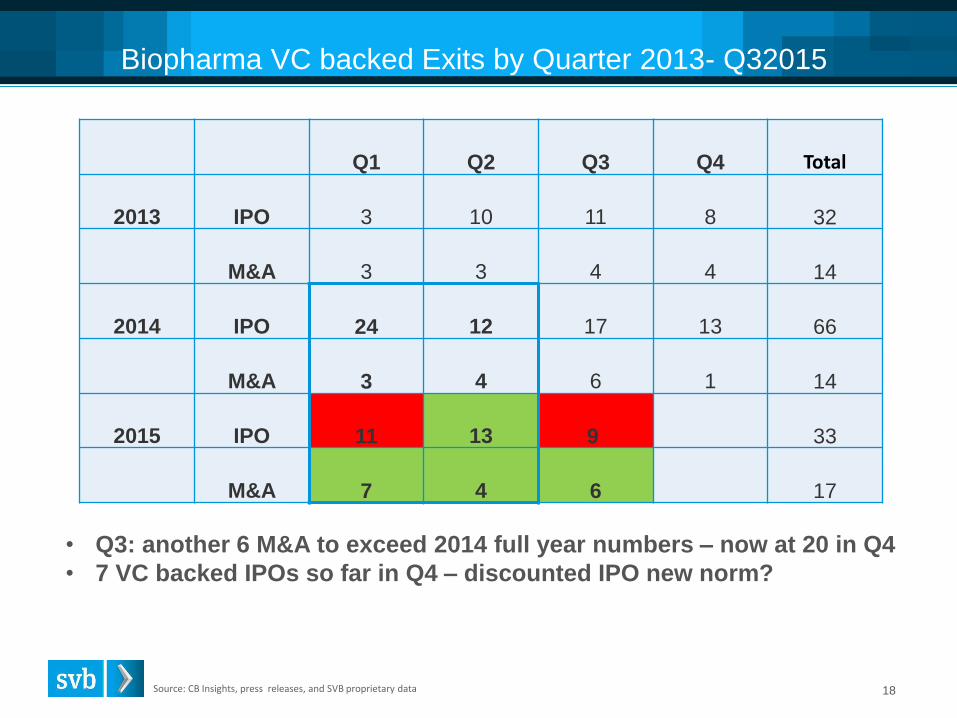
Biopharma VC backed Exits by Quarter 2013- Q32015
Q1 Q2 Q3 Q4 Total
2013 IPO 3 10 11 8 32
M&A 3 3 4 4 14
2014 IPO 24 12 17 13 66
M&A 3 4 6 1 14
2015 IPO 11 13 9 33
M&A 7 4 6 17
• Q3: another 6 M&A to exceed 2014 full year numbers – now at 20 in Q4• 7 VC backed IPOs so far in Q4 – discounted IPO new norm?
Source: CB Insights, press releases, and SVB proprietary data 18
19Jon Norris - [email protected]
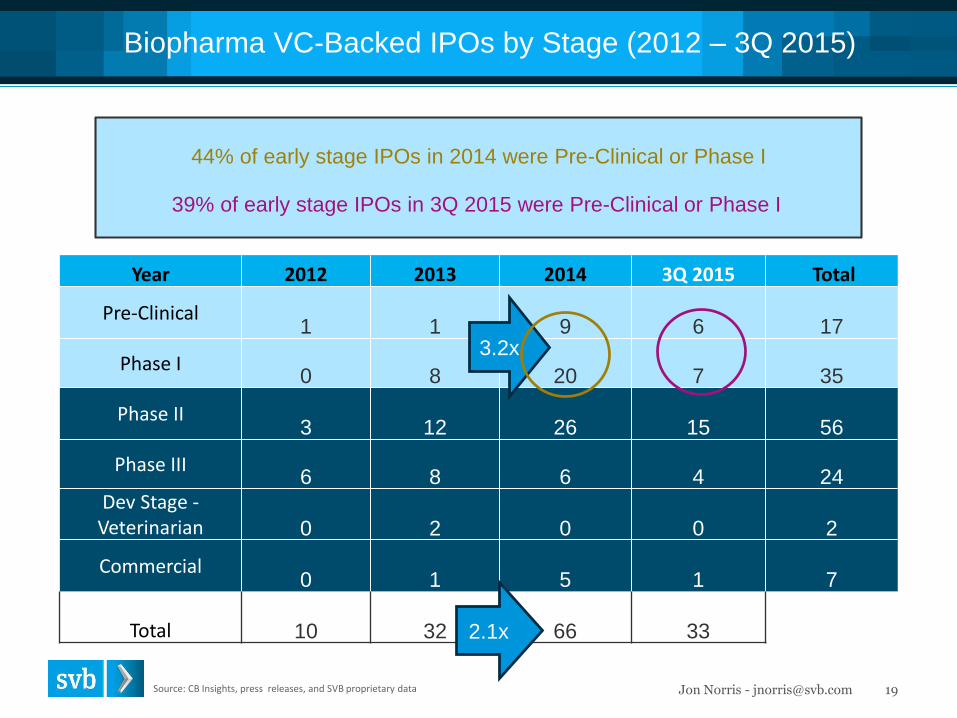
Biopharma VC-Backed IPOs by Stage (2012 – 3Q 2015)
Year 2012 2013 2014 3Q 2015 Total
Pre-Clinical1 1 9 6 17
Phase I0 8 20 7 35
Phase II3 12 26 15 56
Phase III6 8 6 4 24
Dev Stage -Veterinarian 0 2 0 0 2
Commercial0 1 5 1 7
Total 10 32 66 33
Source: CB Insights, press releases, and SVB proprietary data
2.1x
3.2x
44% of early stage IPOs in 2014 were Pre-Clinical or Phase I
39% of early stage IPOs in 3Q 2015 were Pre-Clinical or Phase I
Jon Norris - [email protected] 20
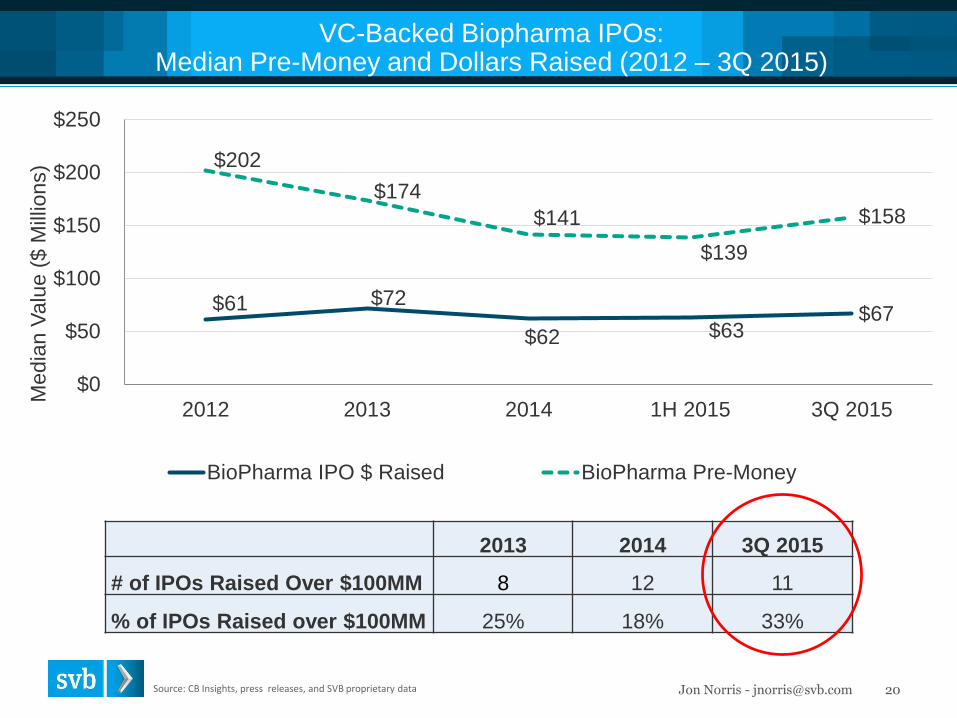
VC-Backed Biopharma IPOs: Median Pre-Money and Dollars Raised (2012 – 3Q 2015)
Source: CB Insights, press releases, and SVB proprietary data
2013 2014 3Q 2015
# of IPOs Raised Over $100MM 8 12 11
% of IPOs Raised over $100MM 25% 18% 33%
$61 $72
$62 $63 $67
$202
$174 $141
$139
$158
$0
$50
$100
$150
$200
$250
2012 2013 2014 1H 2015 3Q 2015
Med
ian
Val
ue (
$ M
illio
ns)
BioPharma IPO $ Raised BioPharma Pre-Money
21Jon Norris - [email protected]
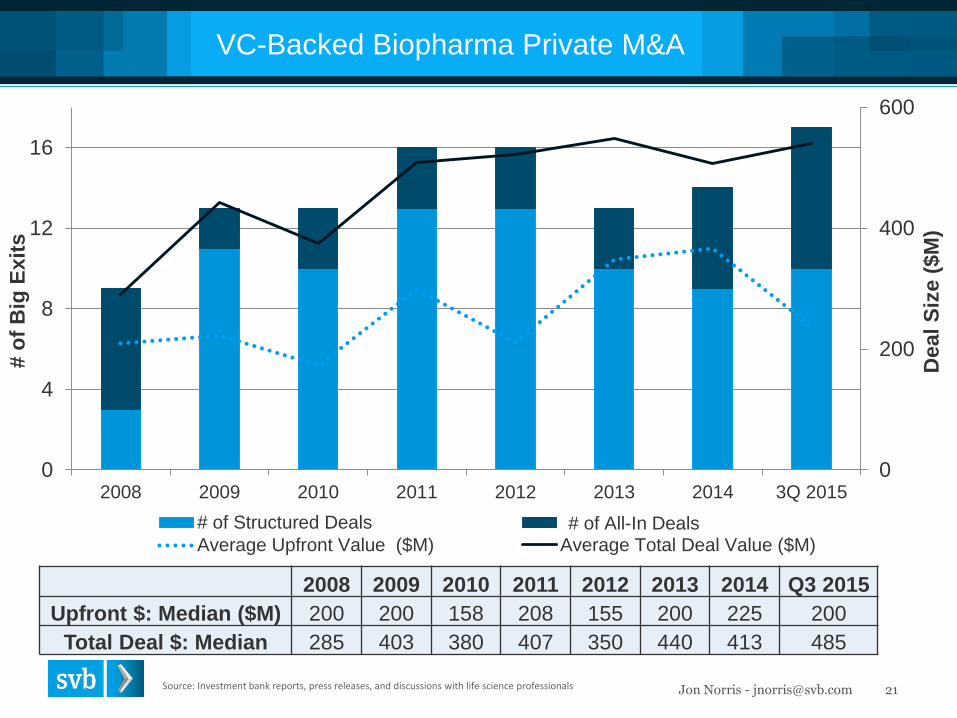
VC-Backed Biopharma Private M&A
Source: Investment bank reports, press releases, and discussions with life science professionals
0
200
400
600
0
4
8
12
16
2008 2009 2010 2011 2012 2013 2014 3Q 2015
Dea
l Siz
e ($
M)
# o
f B
ig E
xits
# of Structured Deals Total # of ExitsAverage Upfront Value ($M) Average Total Deal Value ($M)
# of All-In Deals
2008 2009 2010 2011 2012 2013 2014 Q3 2015Upfront $: Median ($M) 200 200 158 208 155 200 225 200
Total Deal $: Median 285 403 380 407 350 440 413 485
Jon Norris - [email protected] 22
0
2
4
6
8
10
12
14
16
18
2009 2010 2011 2012 2013 2014 3Q 2015
# o
f C
om
pan
ies
Pre-Clinical Phase I Phase II Phase III Commercial
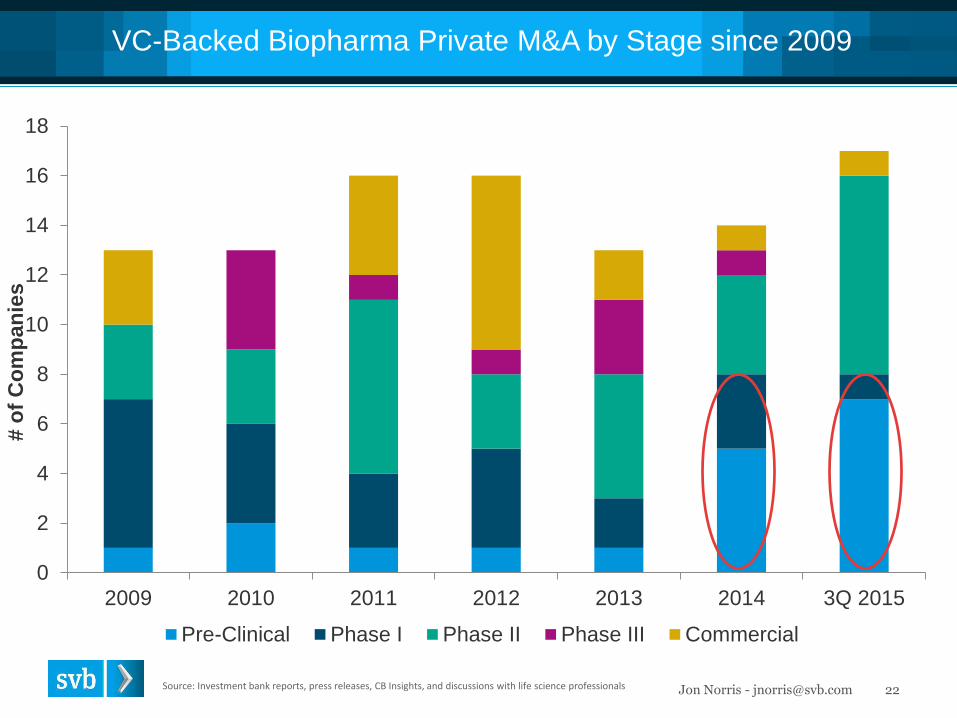
VC-Backed Biopharma Private M&A by Stage since 2009
Source: Investment bank reports, press releases, CB Insights, and discussions with life science professionals
Jon Norris - [email protected] 23
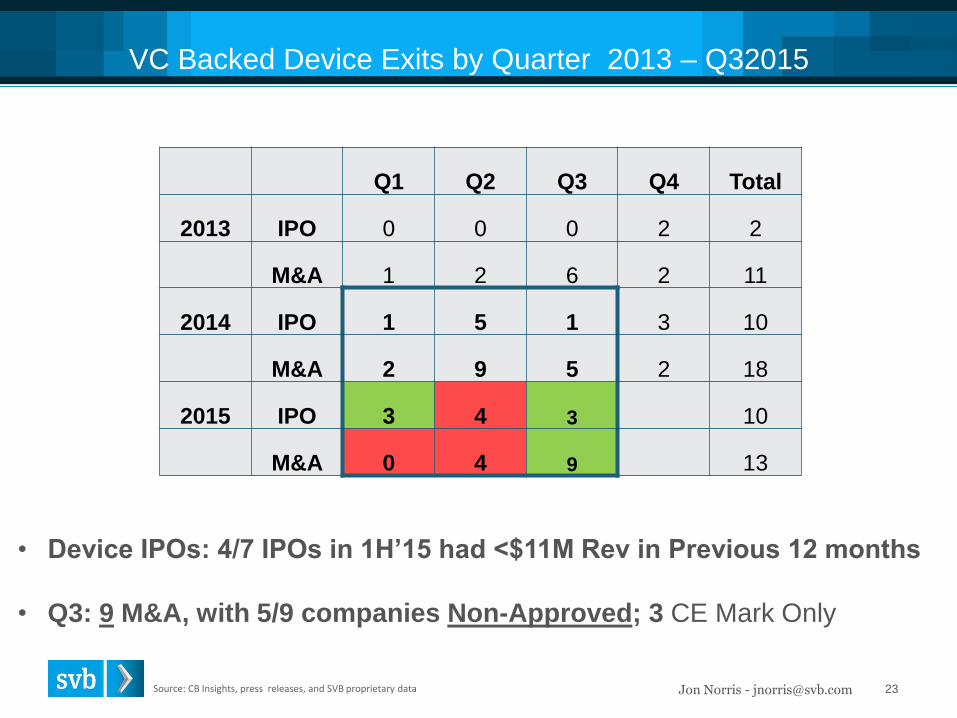
VC Backed Device Exits by Quarter 2013 – Q32015
• Device IPOs: 4/7 IPOs in 1H’15 had <$11M Rev in Previous 12 months
• Q3: 9 M&A, with 5/9 companies Non-Approved; 3 CE Mark Only
Source: CB Insights, press releases, and SVB proprietary data
Q1 Q2 Q3 Q4 Total
2013 IPO 0 0 0 2 2
M&A 1 2 6 2 11
2014 IPO 1 5 1 3 10
M&A 2 9 5 2 18
2015 IPO 3 4 3 10
M&A 0 4 9 13
Jon Norris - [email protected] 24
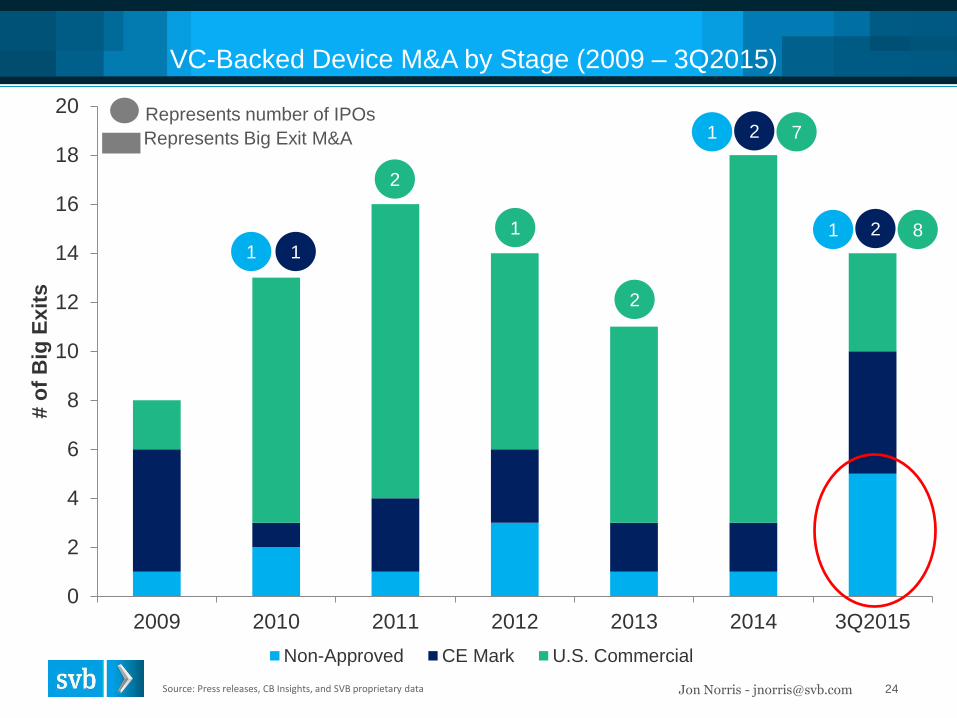
VC-Backed Device M&A by Stage (2009 – 3Q2015)
Source: Press releases, CB Insights, and SVB proprietary data
0
2
4
6
8
10
12
14
16
18
20
2009 2010 2011 2012 2013 2014 3Q2015
# o
f B
ig E
xits
Non-Approved CE Mark U.S. Commercial
Represents number of IPOsRepresents Big Exit M&A
1 1
2
1
2
1 2 7
1 2 8
Jon Norris - [email protected] 25Source: Press releases, CB Insights, and SVB proprietary data
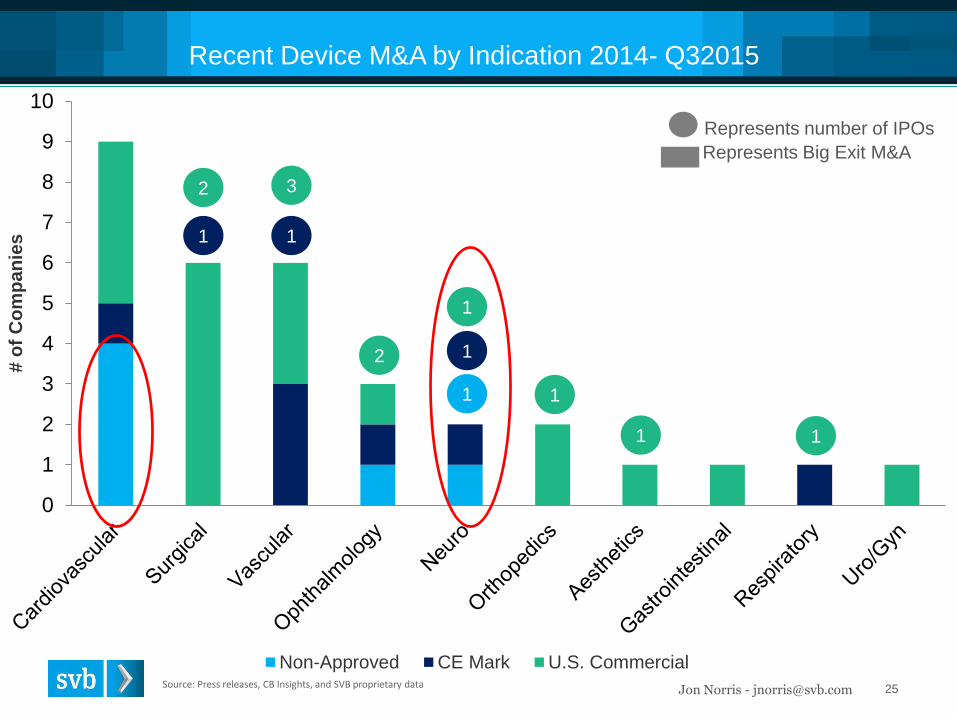
Recent Device M&A by Indication 2014- Q32015
0
1
2
3
4
5
6
7
8
9
10
# o
f C
om
pan
ies
Non-Approved CE Mark U.S. Commercial
Represents number of IPOsRepresents Big Exit M&A
1 1
1
1
1
2 3
2
1
1 1
Jon Norris - [email protected] 26
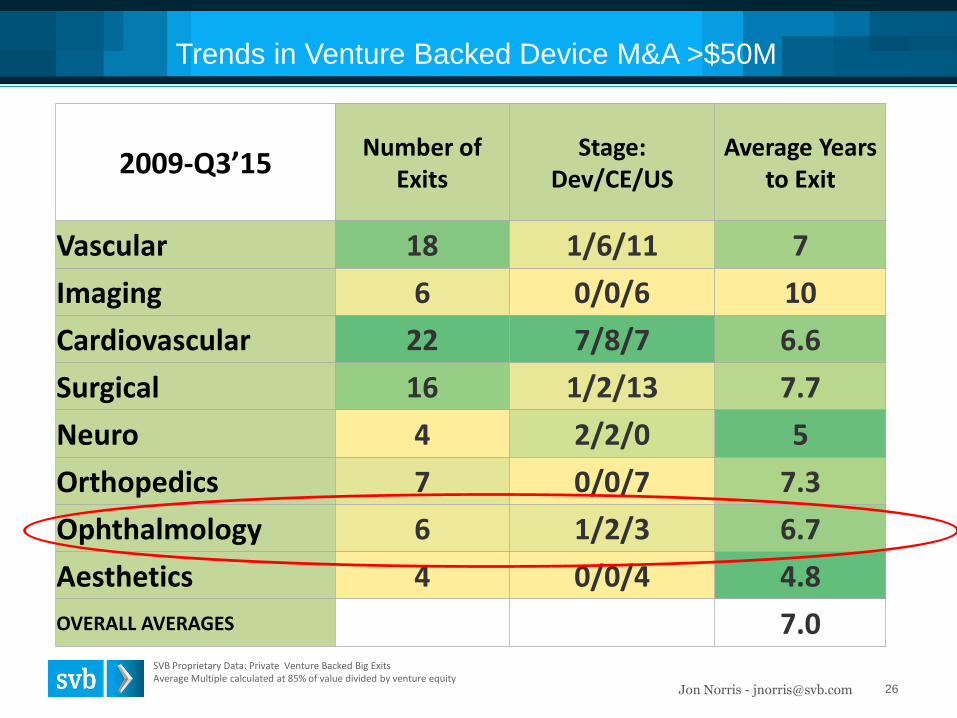
Trends in Venture Backed Device M&A >$50M
SVB Proprietary Data: Private Venture Backed Big ExitsAverage Multiple calculated at 85% of value divided by venture equity
2009-Q3’15Number of
ExitsStage:
Dev/CE/USAverage Years
to Exit
Vascular 18 1/6/11 7
Imaging 6 0/0/6 10
Cardiovascular 22 7/8/7 6.6
Surgical 16 1/2/13 7.7
Neuro 4 2/2/0 5
Orthopedics 7 0/0/7 7.3
Ophthalmology 6 1/2/3 6.7
Aesthetics 4 0/0/4 4.8
OVERALL AVERAGES 7.0
Jon Norris - [email protected] 27
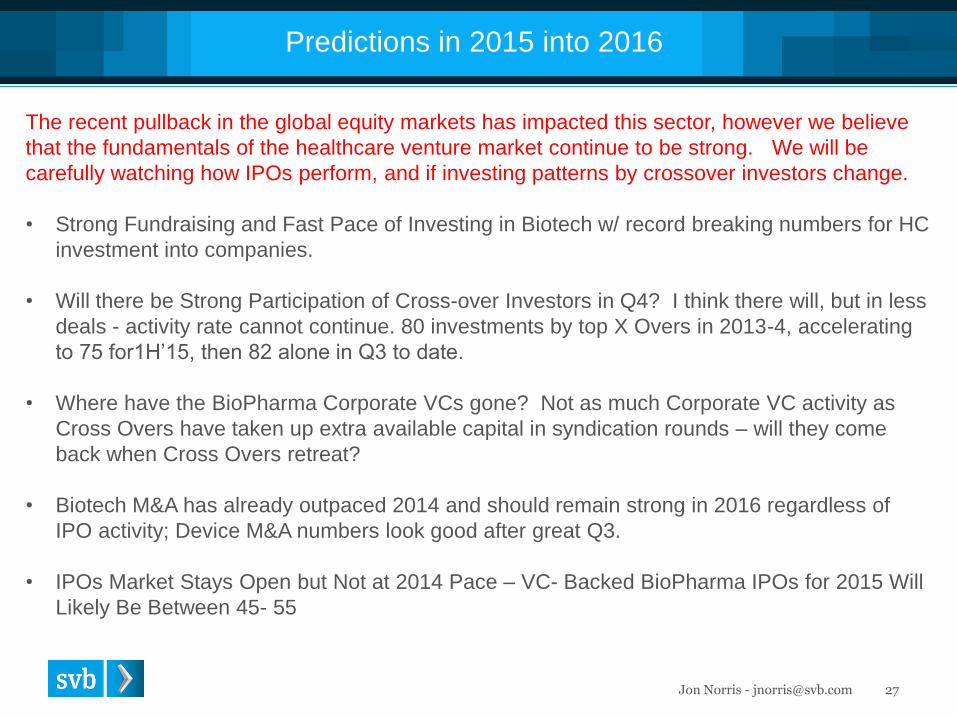
Predictions in 2015 into 2016
The recent pullback in the global equity markets has impacted this sector, however we believe that the fundamentals of the healthcare venture market continue to be strong. We will be carefully watching how IPOs perform, and if investing patterns by crossover investors change.
• Strong Fundraising and Fast Pace of Investing in Biotech w/ record breaking numbers for HC investment into companies.
• Will there be Strong Participation of Cross-over Investors in Q4? I think there will, but in less deals - activity rate cannot continue. 80 investments by top X Overs in 2013-4, accelerating to 75 for1H’15, then 82 alone in Q3 to date.
• Where have the BioPharma Corporate VCs gone? Not as much Corporate VC activity as Cross Overs have taken up extra available capital in syndication rounds – will they come back when Cross Overs retreat?
• Biotech M&A has already outpaced 2014 and should remain strong in 2016 regardless of IPO activity; Device M&A numbers look good after great Q3.
• IPOs Market Stays Open but Not at 2014 Pace – VC- Backed BioPharma IPOs for 2015 Will Likely Be Between 45- 55
Thank you!!!