john noll portfolio
TRANSCRIPT
11/13/09Portfolio for John Noll1
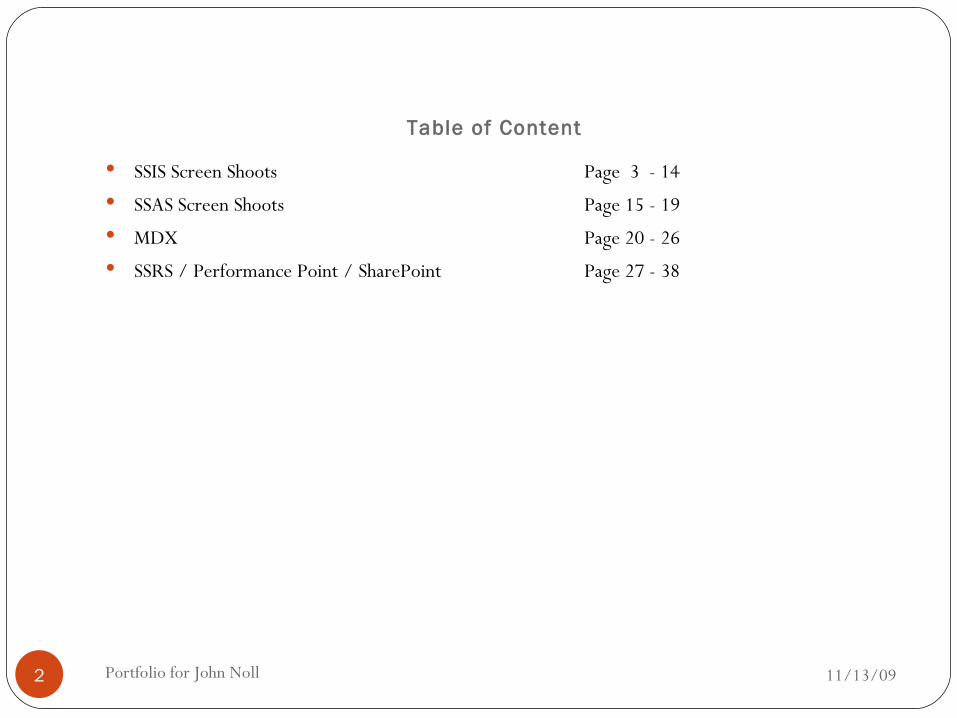
Table of Content
11/13/09Portfolio for John Noll2
SSIS Screen Shoots Page 3 - 14 SSAS Screen Shoots Page 15 - 19 MDX Page 20 - 26 SSRS / Performance Point / SharePoint Page 27 - 38
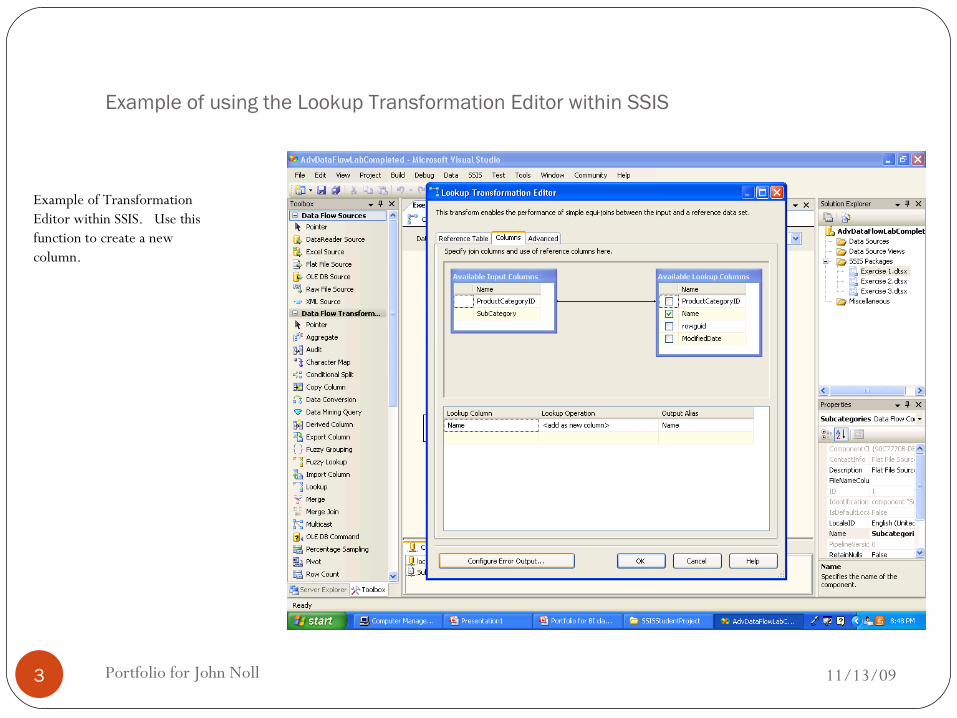
Example of using the Lookup Transformation Editor within SSIS
11/13/09Portfolio for John Noll3
Example of Transformation Editor within SSIS. Use this function to create a new column.
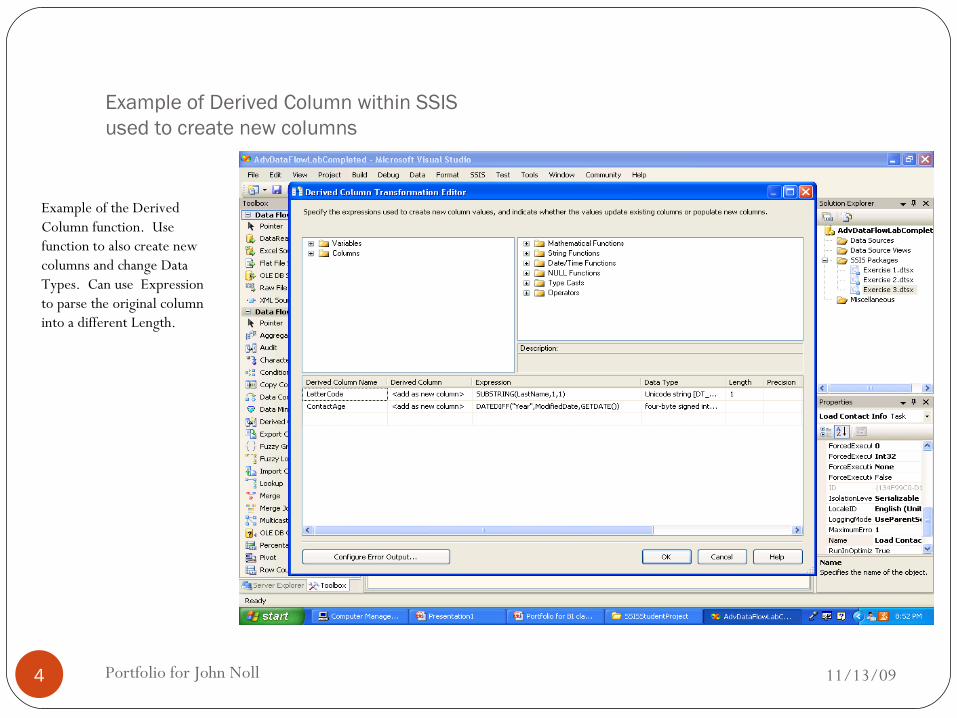
Example of Derived Column within SSISused to create new columns
11/13/09Portfolio for John Noll4
Example of the Derived Column function. Use function to also create new columns and change Data Types. Can use Expression to parse the original column into a different Length.
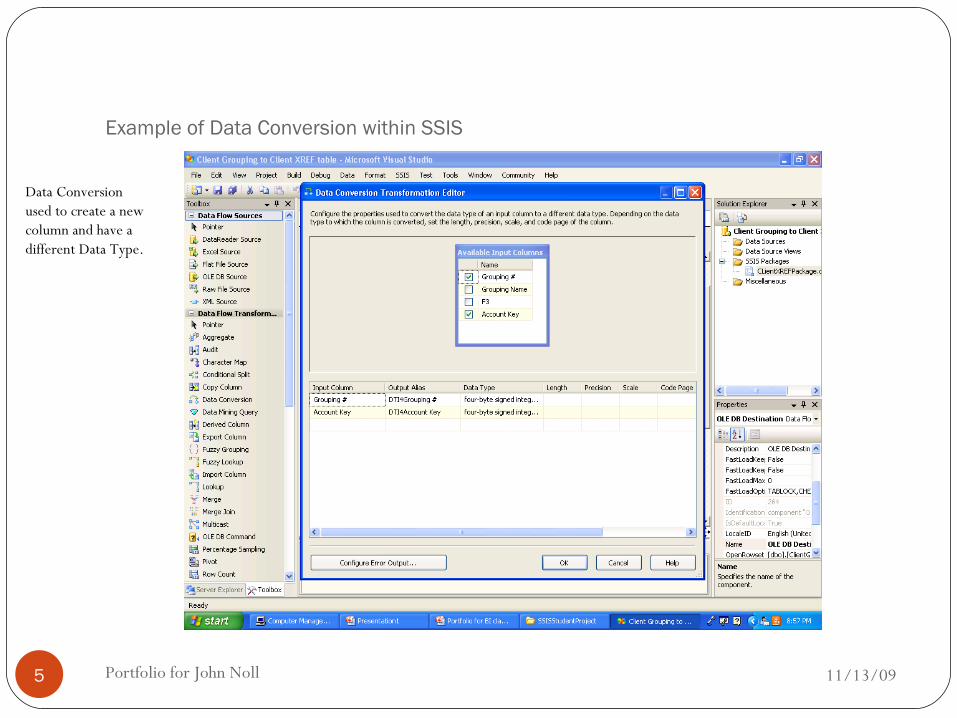
Example of Data Conversion within SSIS
11/13/09Portfolio for John Noll5
Data Conversion used to create a new column and have a different Data Type.
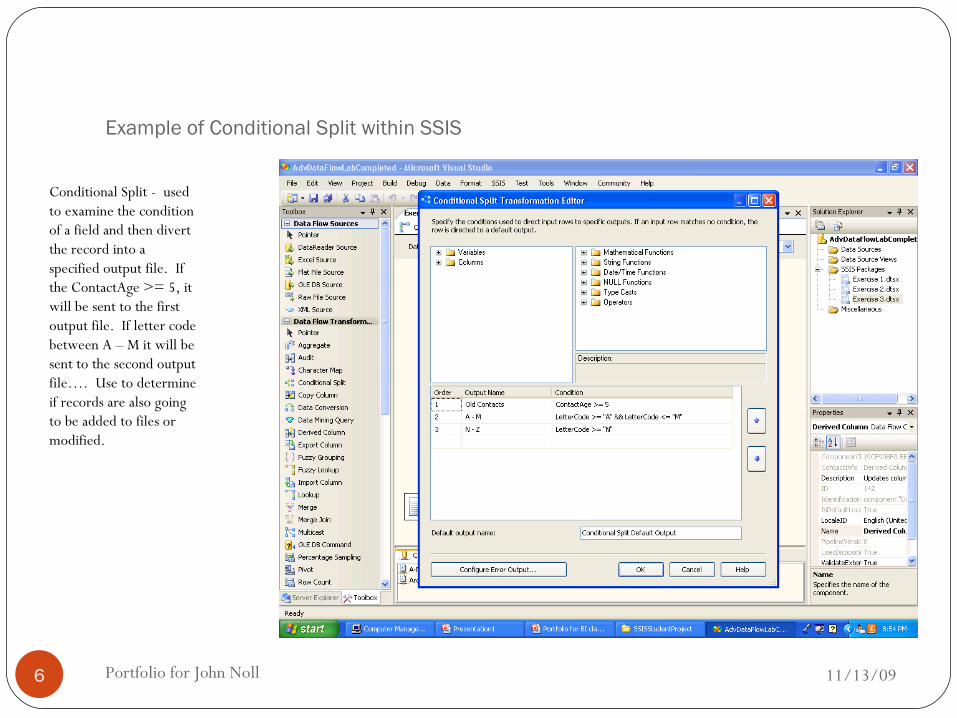
Example of Conditional Split within SSIS
11/13/09Portfolio for John Noll6
Conditional Split - used to examine the condition of a field and then divert the record into a specified output file. If the ContactAge >= 5, it will be sent to the first output file. If letter code between A – M it will be sent to the second output file…. Use to determine if records are also going to be added to files or modified.
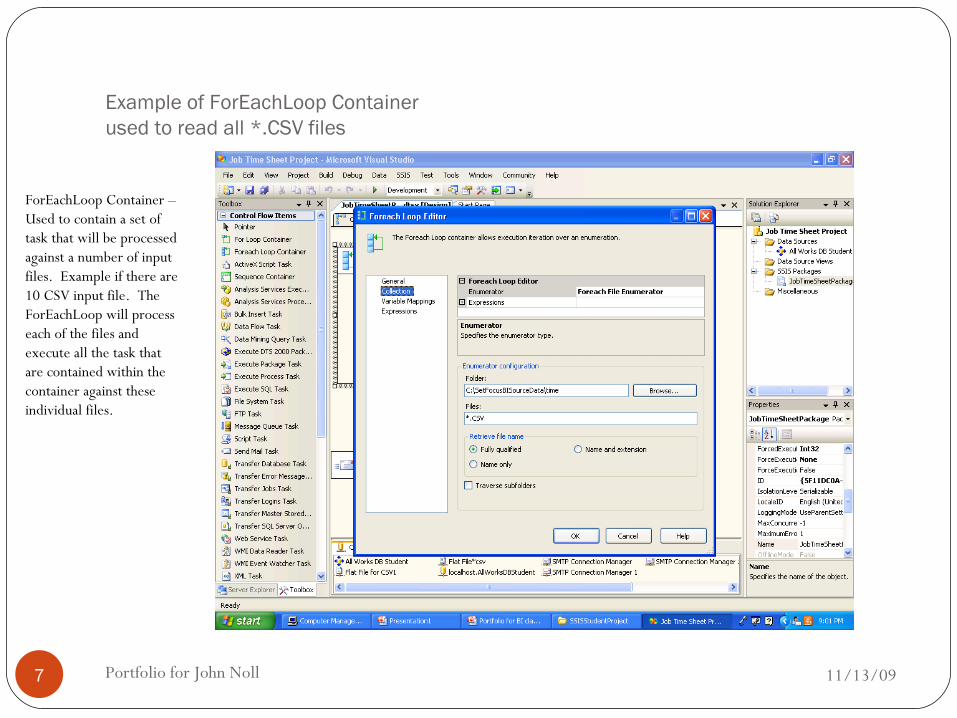
Example of ForEachLoop Container used to read all *.CSV files
11/13/09Portfolio for John Noll7
ForEachLoop Container – Used to contain a set of task that will be processed against a number of input files. Example if there are 10 CSV input file. The ForEachLoop will process each of the files and execute all the task that are contained within the container against these individual files.
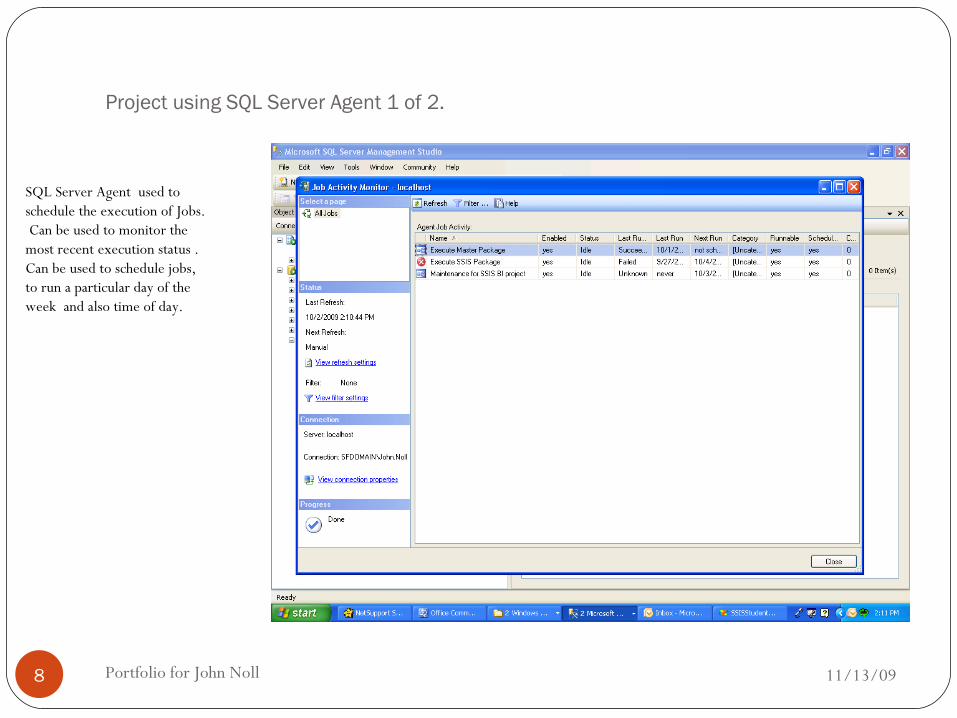
Project using SQL Server Agent 1 of 2.
11/13/09Portfolio for John Noll8
SQL Server Agent used to schedule the execution of Jobs. Can be used to monitor the most recent execution status . Can be used to schedule jobs, to run a particular day of the week and also time of day.
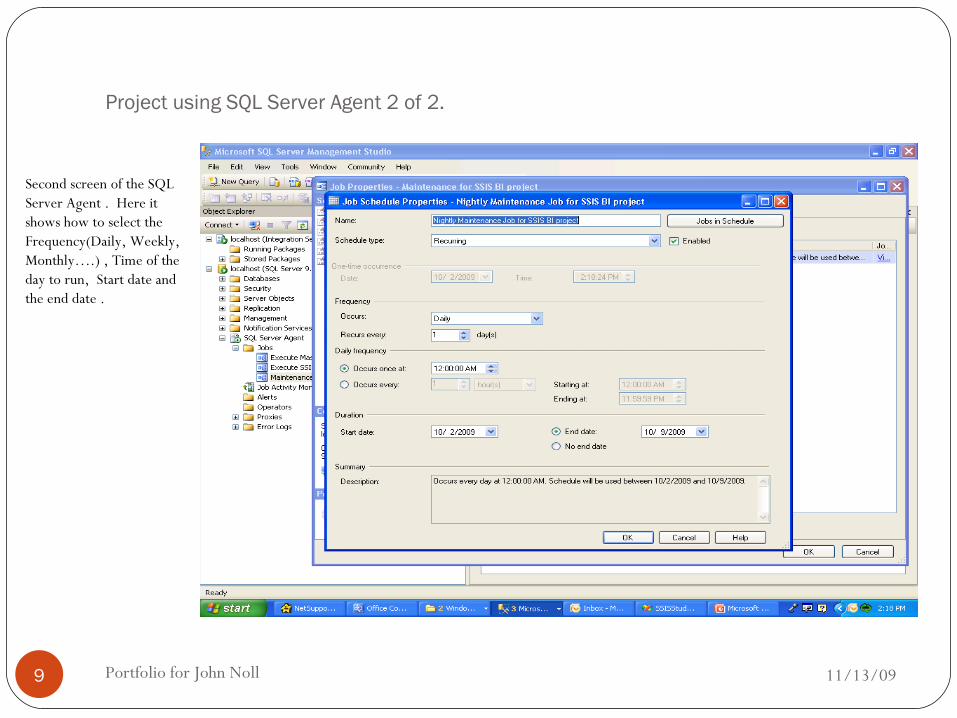
Project using SQL Server Agent 2 of 2.
11/13/09Portfolio for John Noll9
Second screen of the SQL Server Agent . Here it shows how to select the Frequency(Daily, Weekly, Monthly….) , Time of the day to run, Start date and the end date .
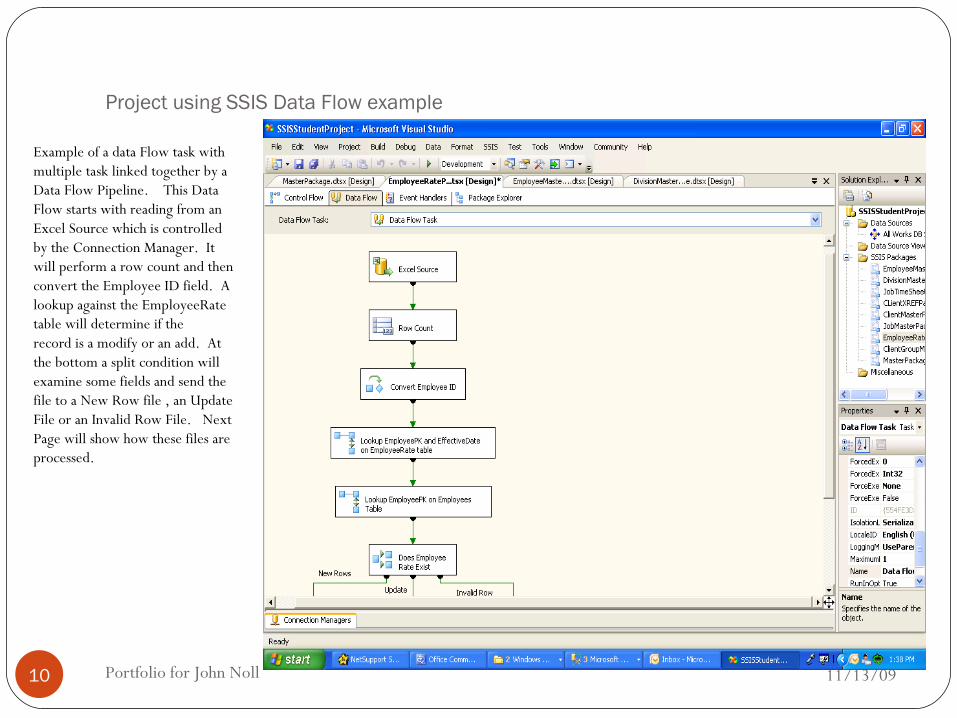
Project using SSIS Data Flow example
11/13/09Portfolio for John Noll10
Example of a data Flow task with multiple task linked together by a Data Flow Pipeline. This Data Flow starts with reading from an Excel Source which is controlled by the Connection Manager. It will perform a row count and then convert the Employee ID field. A lookup against the EmployeeRate table will determine if the record is a modify or an add. At the bottom a split condition will examine some fields and send the file to a New Row file , an Update File or an Invalid Row File. Next Page will show how these files are processed.
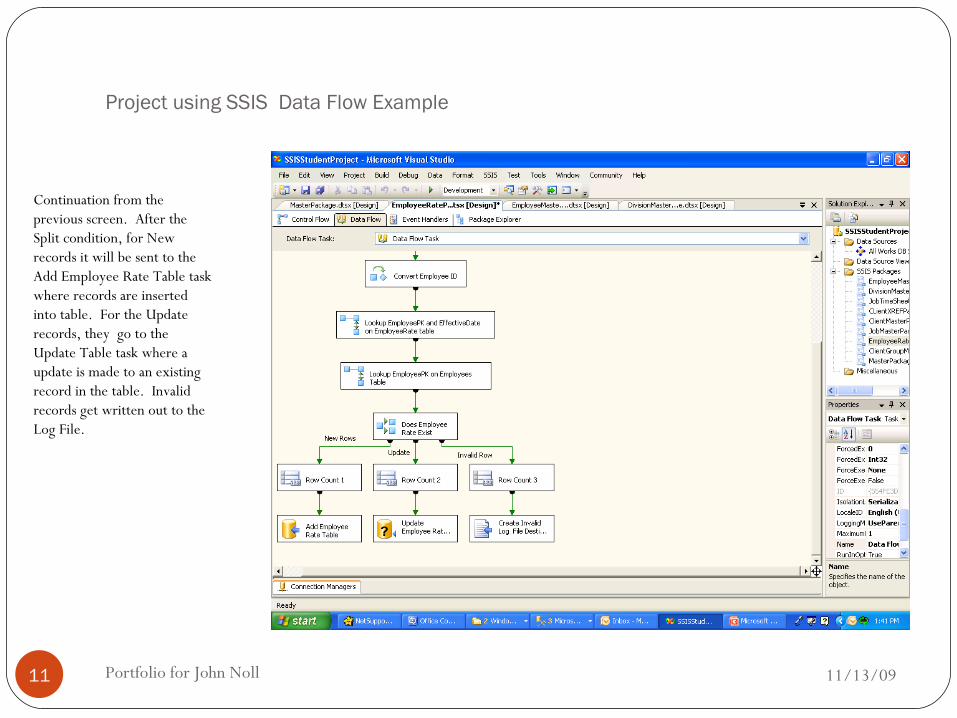
Project using SSIS Data Flow Example
11/13/09Portfolio for John Noll11
Continuation from the previous screen. After the Split condition, for New records it will be sent to the Add Employee Rate Table task where records are inserted into table. For the Update records, they go to the Update Table task where a update is made to an existing record in the table. Invalid records get written out to the Log File.

Project using SSIS Control Flow Example 1 of 3
11/13/09Portfolio for John Noll12
Example of the Control Flow stream with precedence Constraints which show which the order of task execution. Does not show data flow, that is in the data flow task.
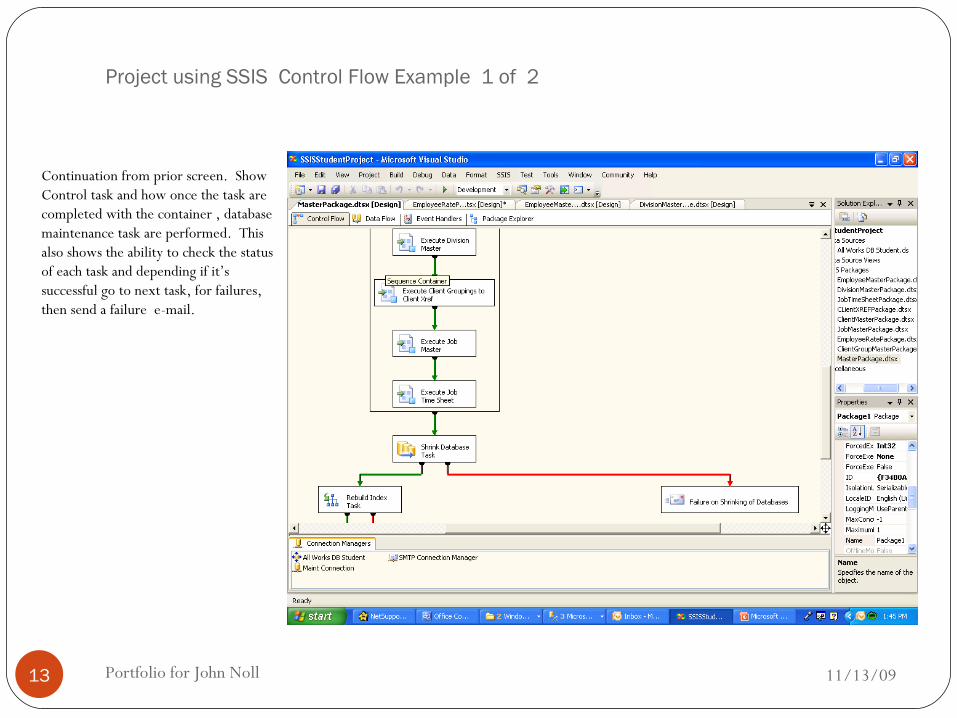
Project using SSIS Control Flow Example 1 of 2
11/13/09Portfolio for John Noll13
Continuation from prior screen. Show Control task and how once the task are completed with the container , database maintenance task are performed. This also shows the ability to check the status of each task and depending if it’s successful go to next task, for failures, then send a failure e-mail.
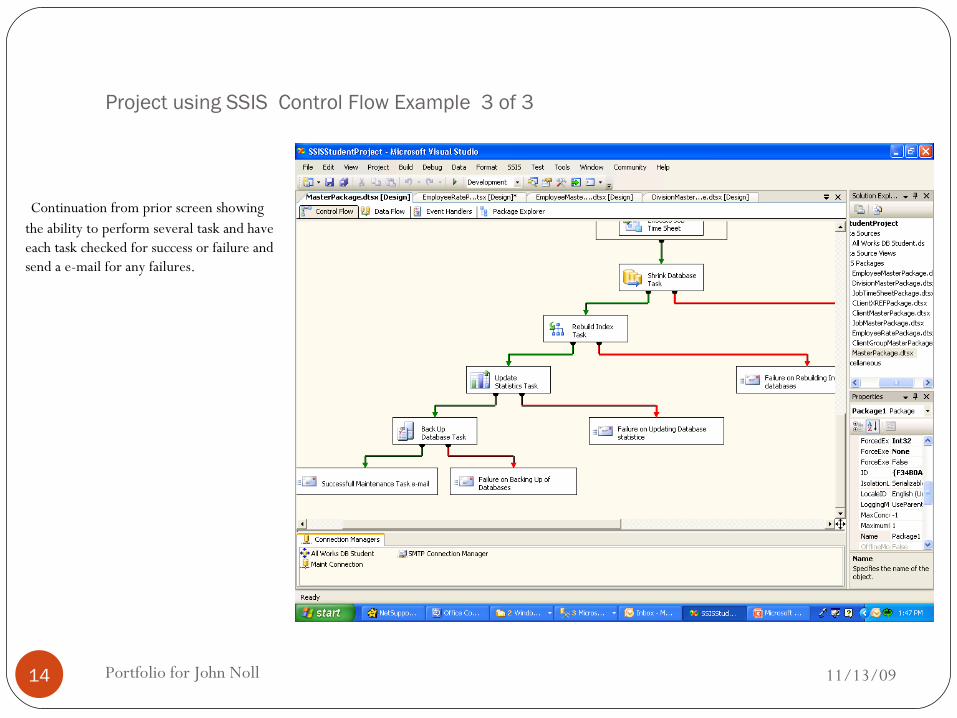
Project using SSIS Control Flow Example 3 of 3
11/13/09Portfolio for John Noll14
Continuation from prior screen showing the ability to perform several task and have each task checked for success or failure and send a e-mail for any failures.
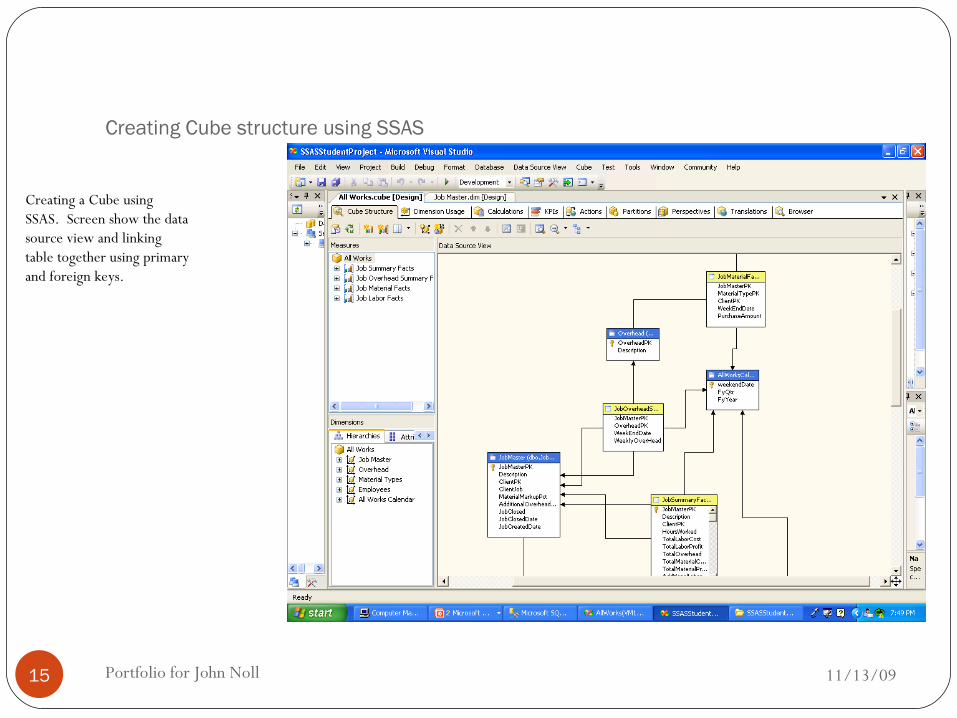
Creating Cube structure using SSAS
11/13/09Portfolio for John Noll15
Creating a Cube using SSAS. Screen show the data source view and linking table together using primary and foreign keys.
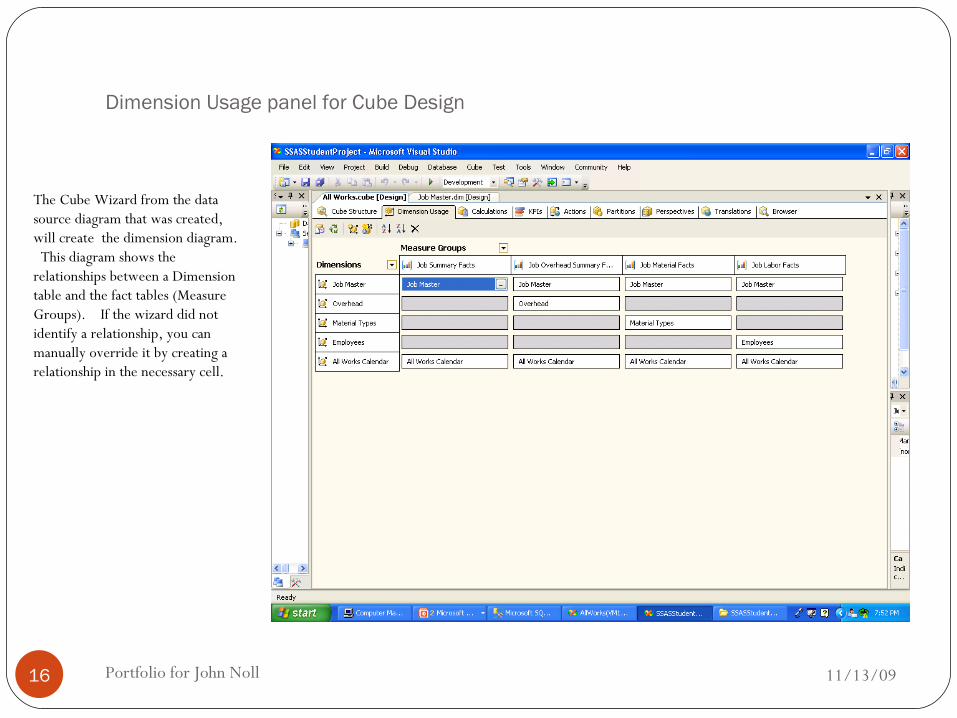
Dimension Usage panel for Cube Design
11/13/09Portfolio for John Noll16
The Cube Wizard from the data source diagram that was created, will create the dimension diagram. This diagram shows the relationships between a Dimension table and the fact tables (Measure Groups). If the wizard did not identify a relationship, you can manually override it by creating a relationship in the necessary cell.
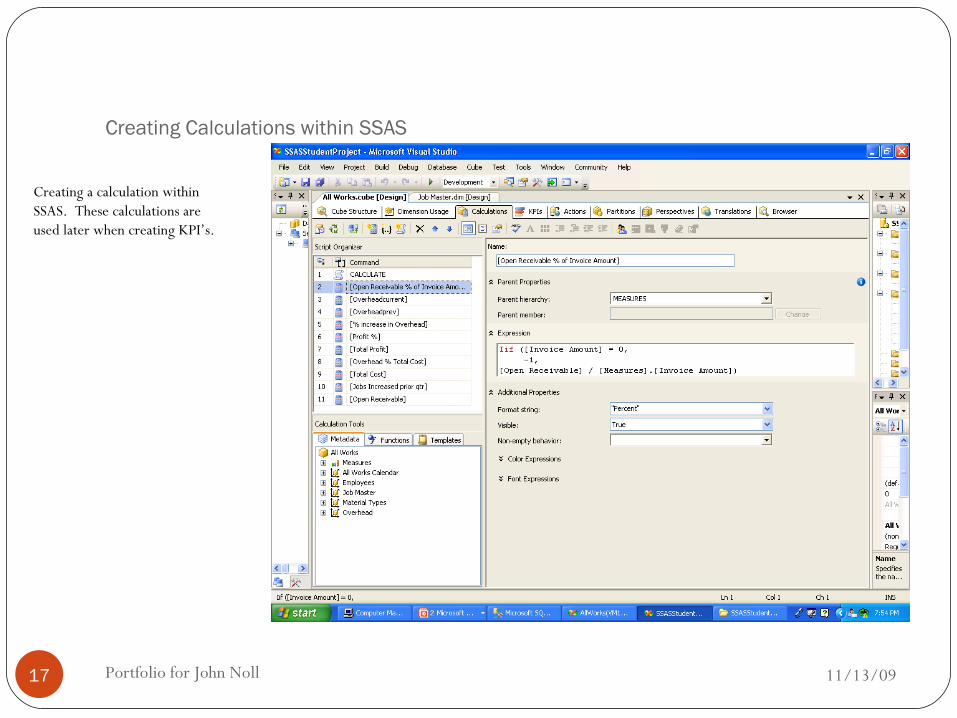
Creating Calculations within SSAS
11/13/09Portfolio for John Noll17
Creating a calculation within SSAS. These calculations are used later when creating KPI’s.
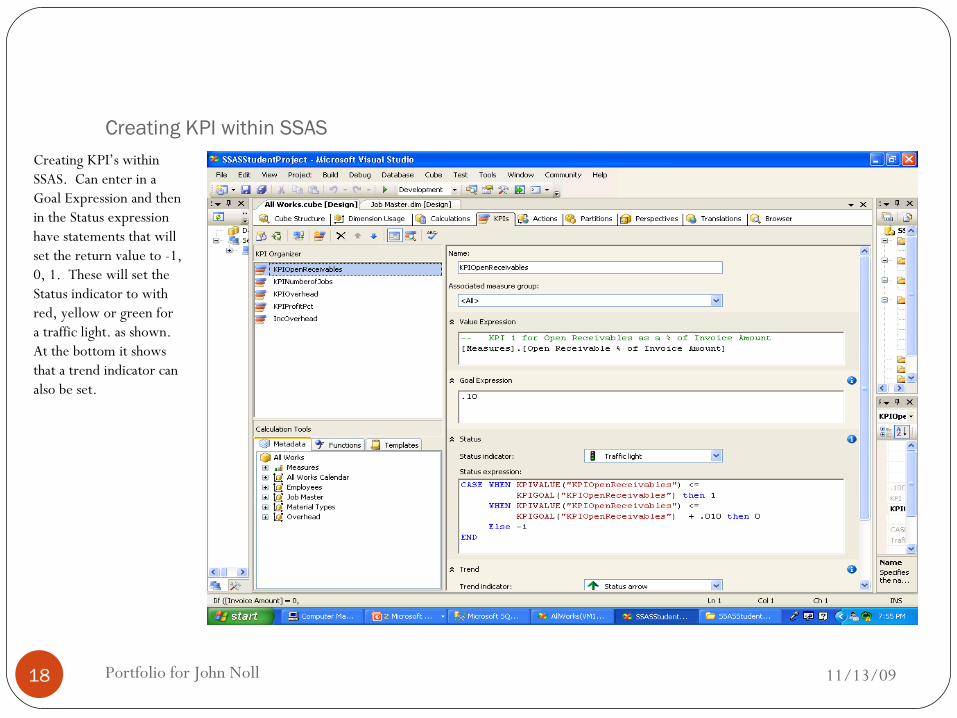
Creating KPI within SSAS
11/13/09Portfolio for John Noll18
Creating KPI’s within SSAS. Can enter in a Goal Expression and then in the Status expression have statements that will set the return value to -1, 0, 1. These will set the Status indicator to with red, yellow or green for a traffic light. as shown. At the bottom it shows that a trend indicator can also be set.
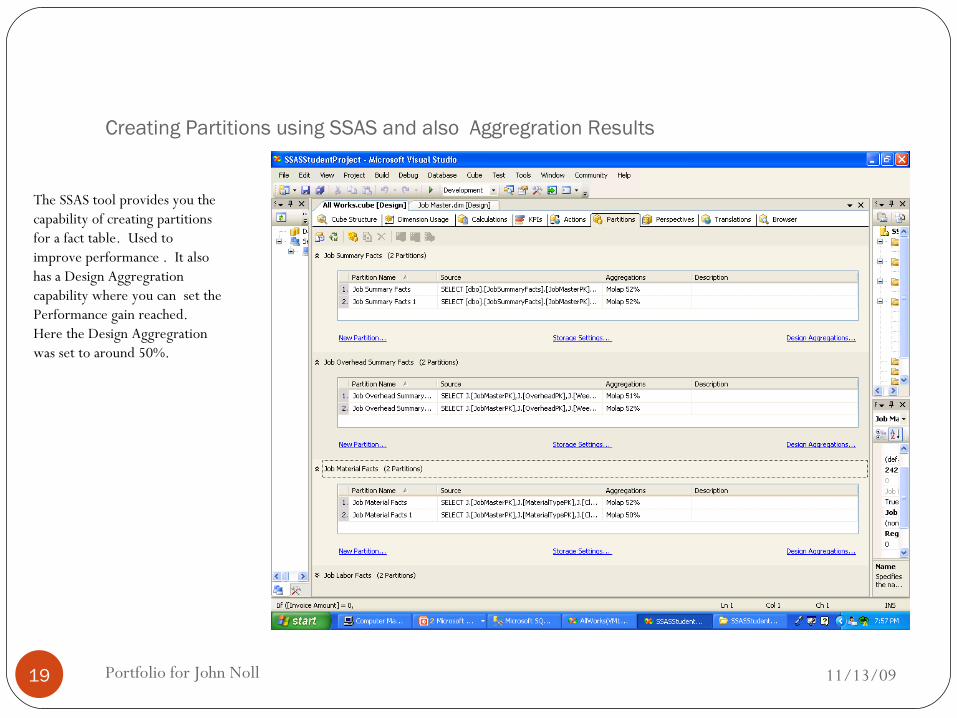
Creating Partitions using SSAS and also Aggregration Results
11/13/09Portfolio for John Noll19
The SSAS tool provides you the capability of creating partitions for a fact table. Used to improve performance . It also has a Design Aggregration capability where you can set the Performance gain reached. Here the Design Aggregration was set to around 50%.
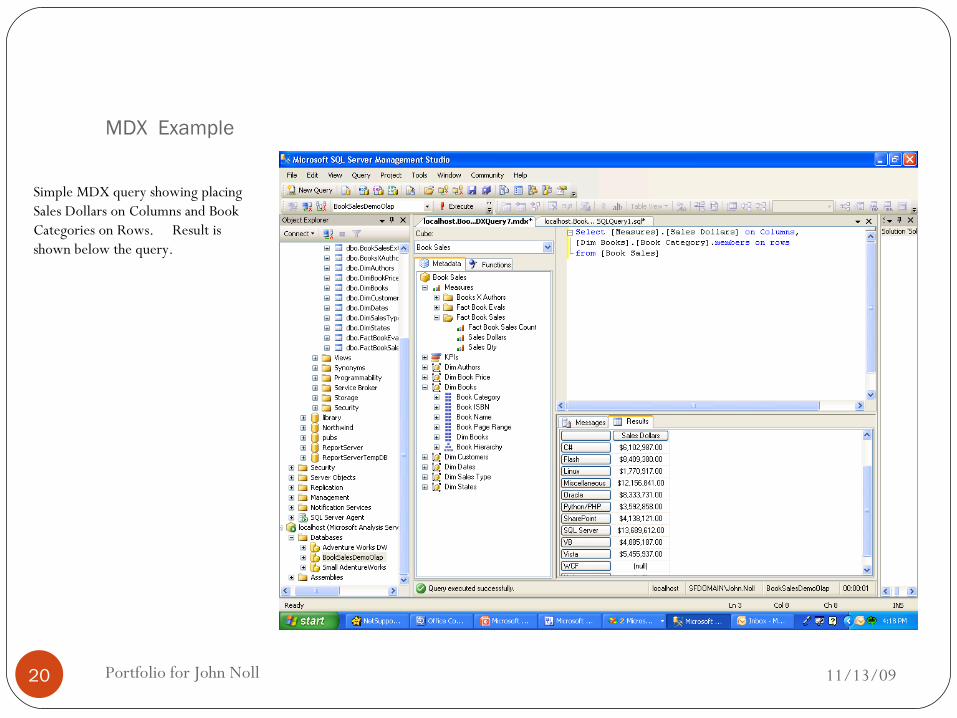
MDX Example
11/13/09Portfolio for John Noll20
Simple MDX query showing placing Sales Dollars on Columns and Book Categories on Rows. Result is shown below the query.
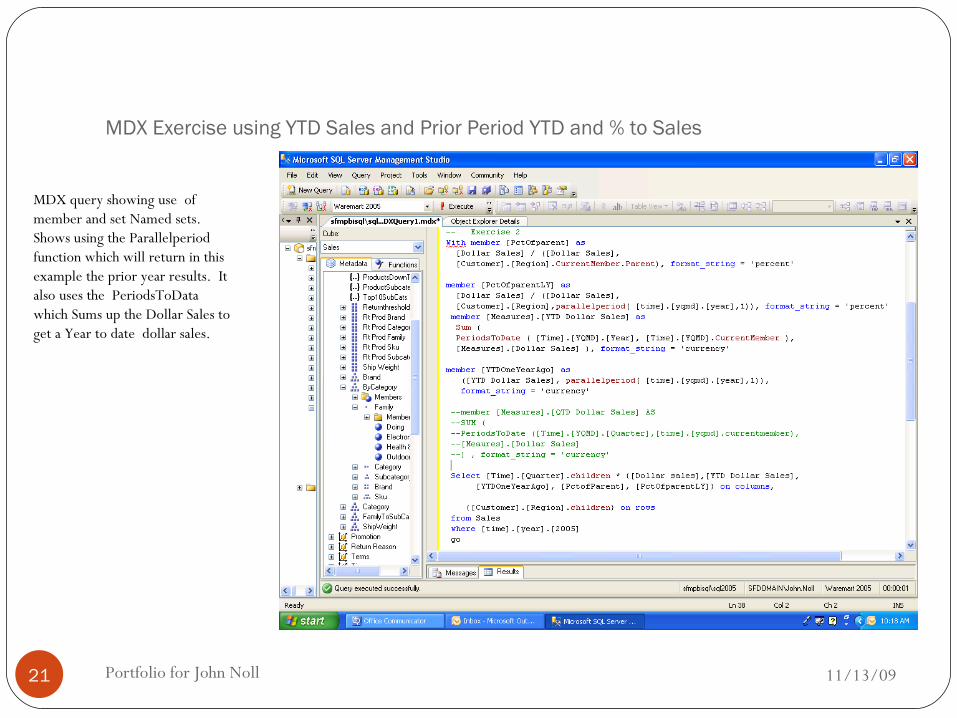
MDX Exercise using YTD Sales and Prior Period YTD and % to Sales
11/13/09Portfolio for John Noll21
MDX query showing use of member and set Named sets.Shows using the Parallelperiod function which will return in this example the prior year results. It also uses the PeriodsToData which Sums up the Dollar Sales to get a Year to date dollar sales.
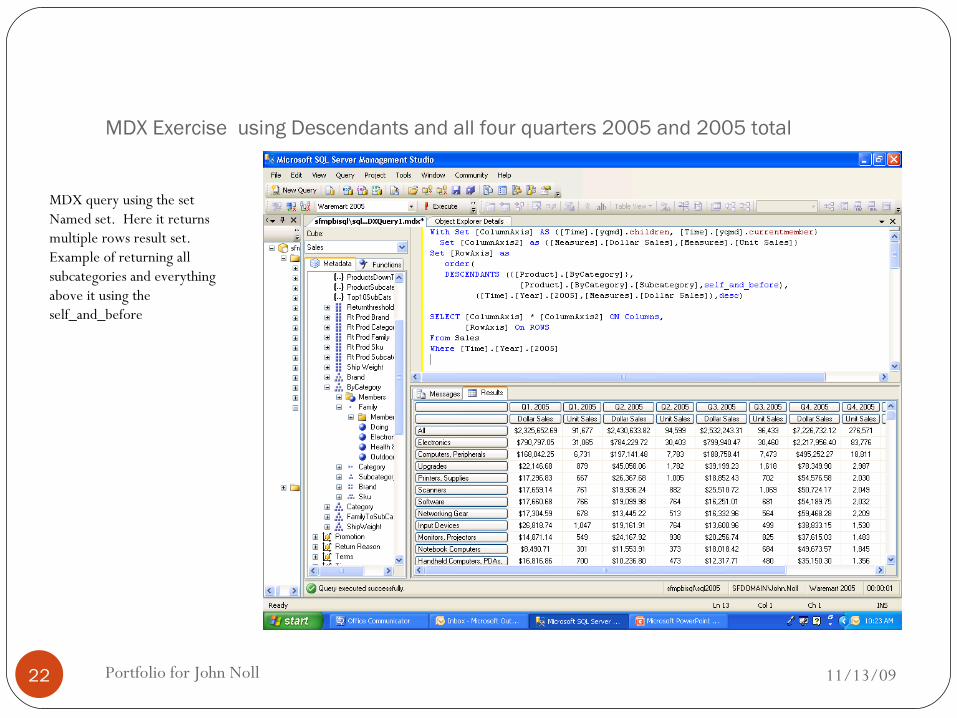
MDX Exercise using Descendants and all four quarters 2005 and 2005 total
11/13/09Portfolio for John Noll22
MDX query using the set Named set. Here it returns multiple rows result set. Example of returning all subcategories and everything above it using the self_and_before
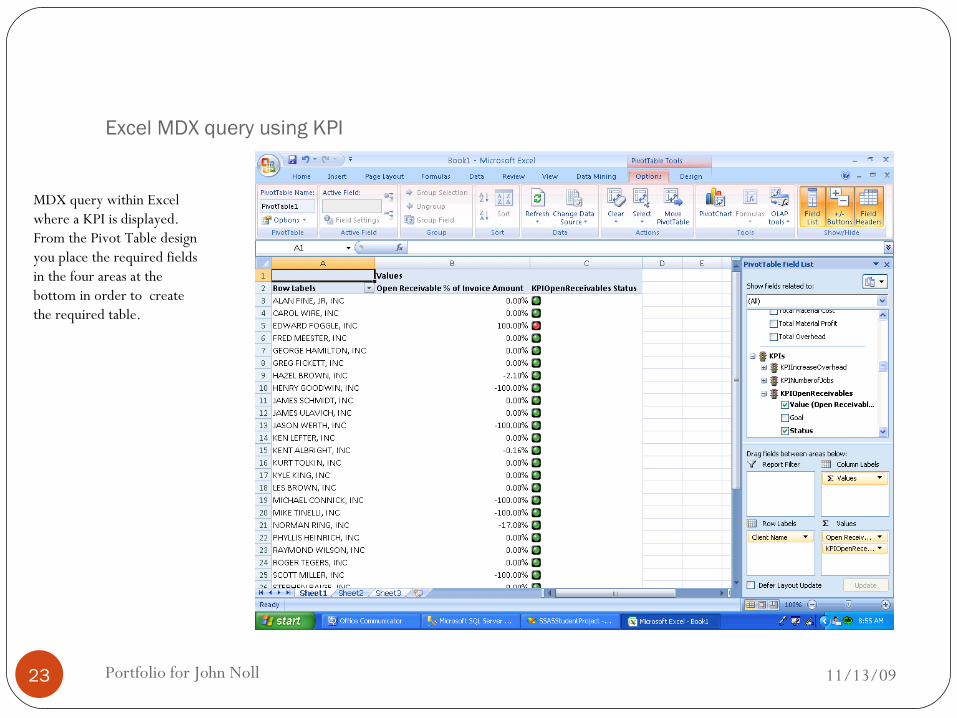
Excel MDX query using KPI
11/13/09Portfolio for John Noll23
MDX query within Excel where a KPI is displayed. From the Pivot Table design you place the required fields in the four areas at the bottom in order to create the required table.
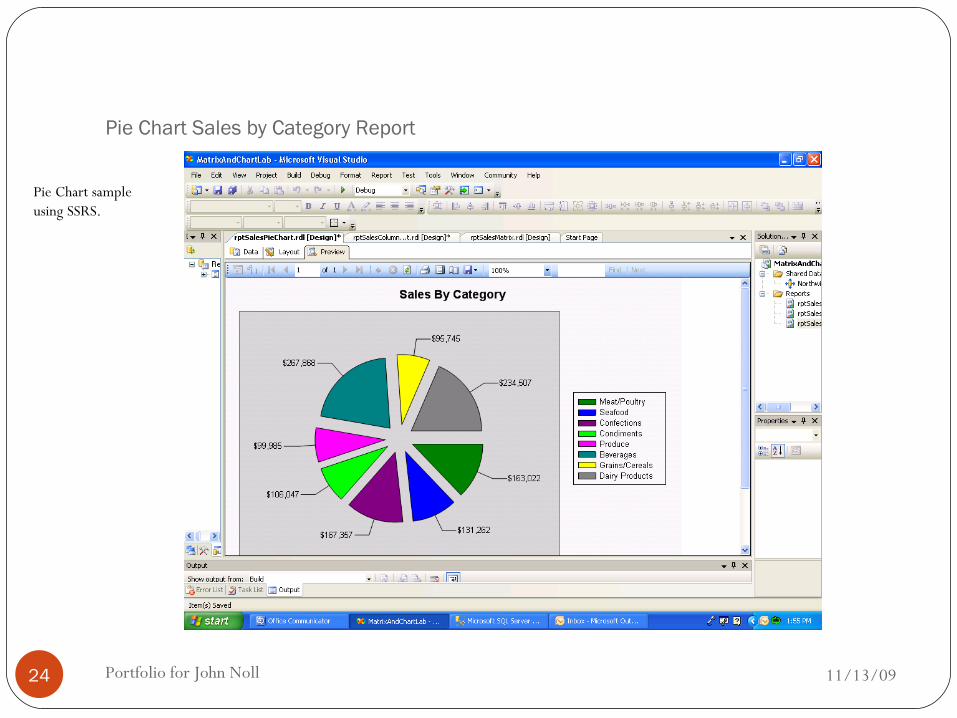
Pie Chart Sales by Category Report
11/13/09Portfolio for John Noll24
Pie Chart sample using SSRS.
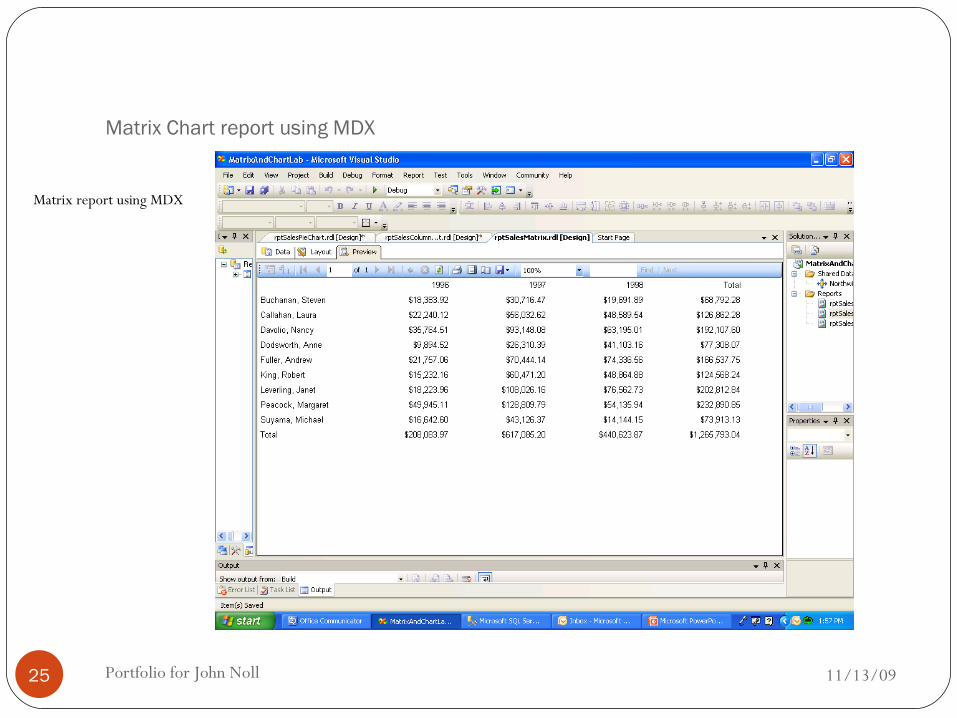
Matrix Chart report using MDX
11/13/09Portfolio for John Noll25
Matrix report using MDX
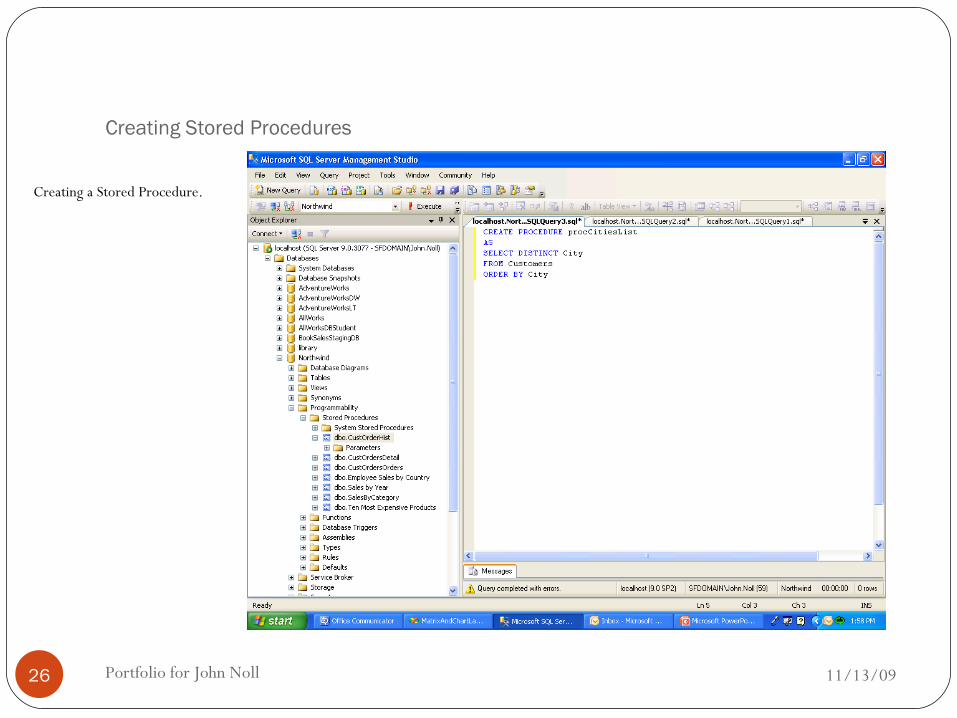
Creating Stored Procedures
11/13/09Portfolio for John Noll26
Creating a Stored Procedure.
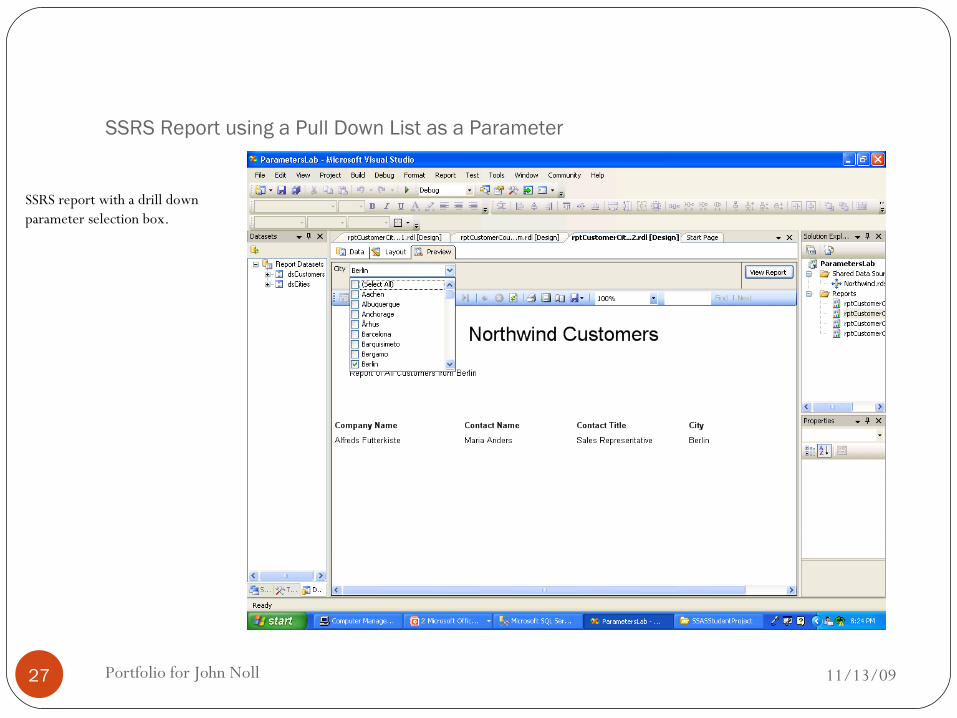
SSRS Report using a Pull Down List as a Parameter
11/13/09Portfolio for John Noll27
SSRS report with a drill down parameter selection box.
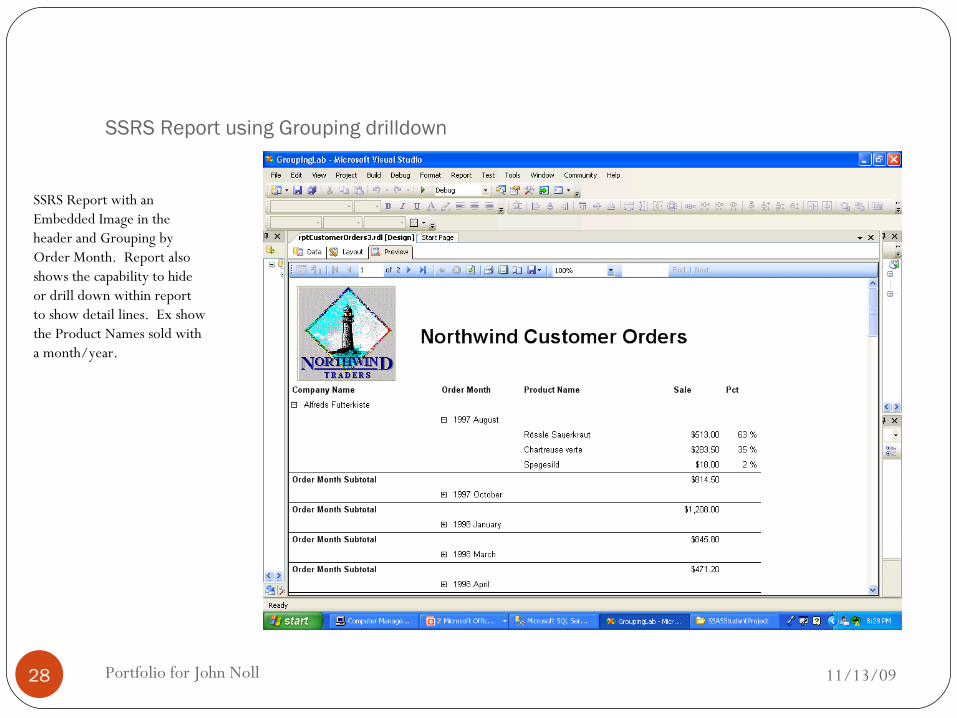
SSRS Report using Grouping drilldown
11/13/09Portfolio for John Noll28
SSRS Report with an Embedded Image in the header and Grouping by Order Month. Report also shows the capability to hide or drill down within report to show detail lines. Ex show the Product Names sold with a month/year.
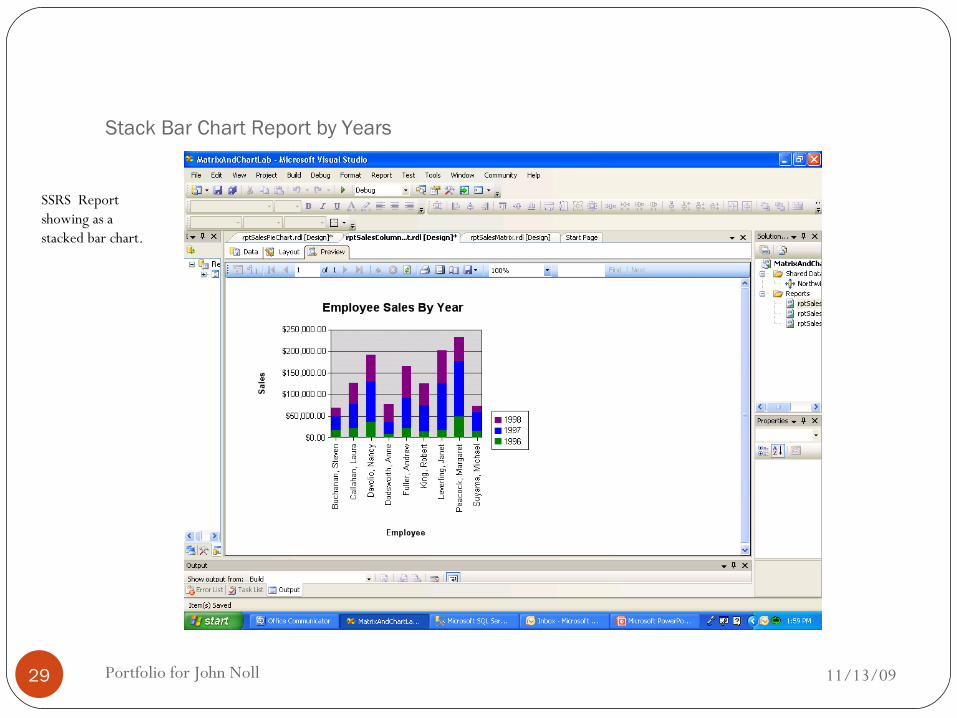
Stack Bar Chart Report by Years
11/13/09Portfolio for John Noll29
SSRS Report showing as a stacked bar chart.
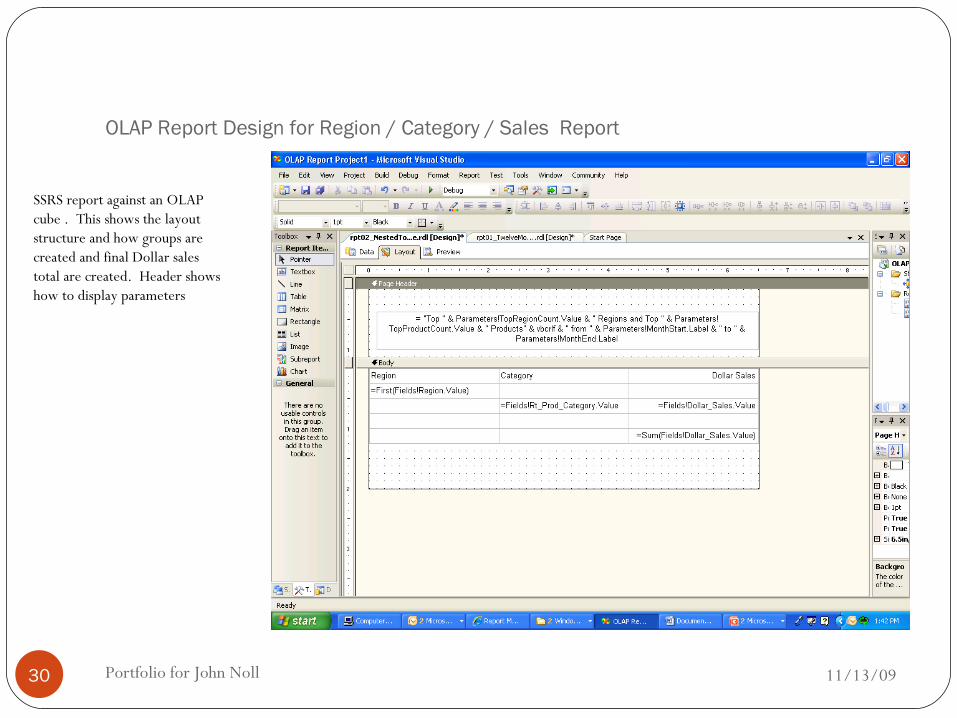
OLAP Report Design for Region / Category / Sales Report
11/13/09Portfolio for John Noll30
SSRS report against an OLAP cube . This shows the layout structure and how groups are created and final Dollar sales total are created. Header shows how to display parameters
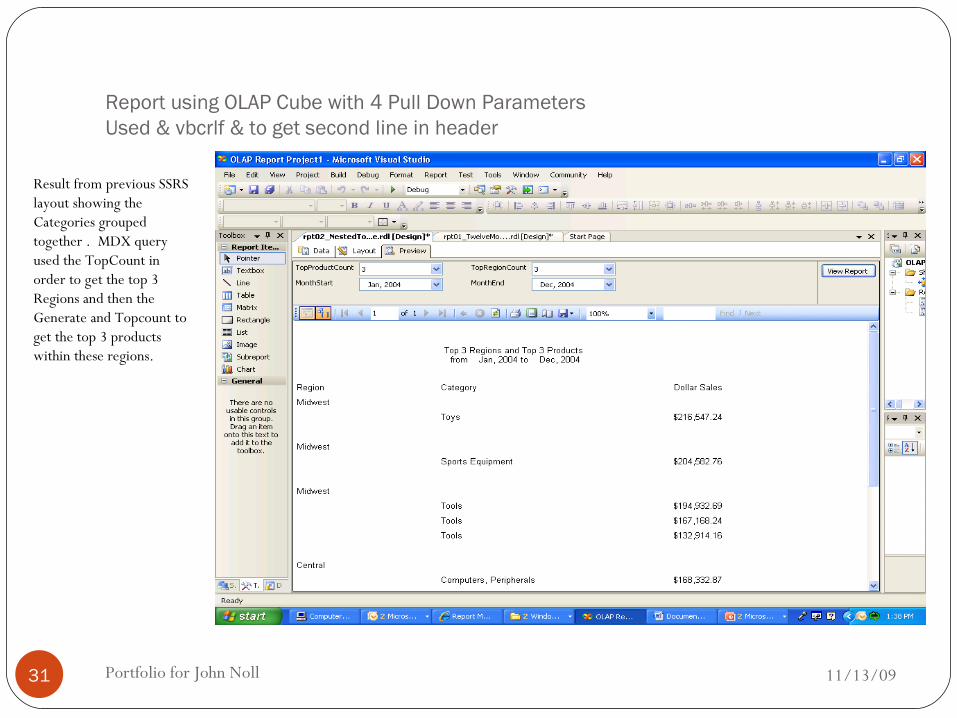
Report using OLAP Cube with 4 Pull Down Parameters Used & vbcrlf & to get second line in header
11/13/09Portfolio for John Noll31
Result from previous SSRS layout showing the Categories grouped together . MDX query used the TopCount in order to get the top 3 Regions and then the Generate and Topcount to get the top 3 products within these regions.
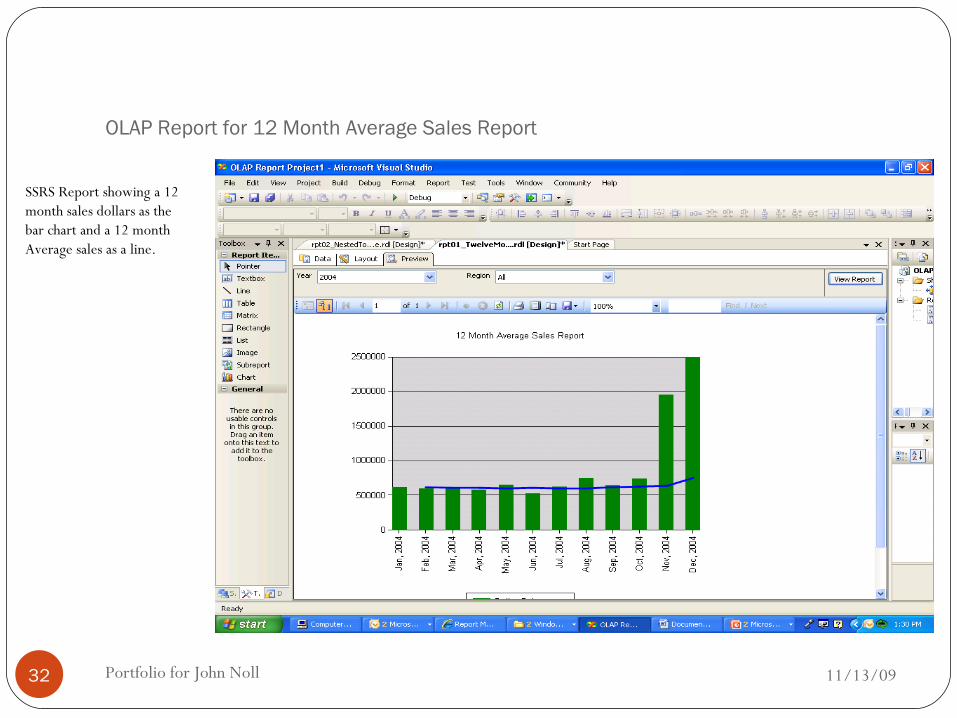
OLAP Report for 12 Month Average Sales Report
11/13/09Portfolio for John Noll32
SSRS Report showing a 12 month sales dollars as the bar chart and a 12 month Average sales as a line.
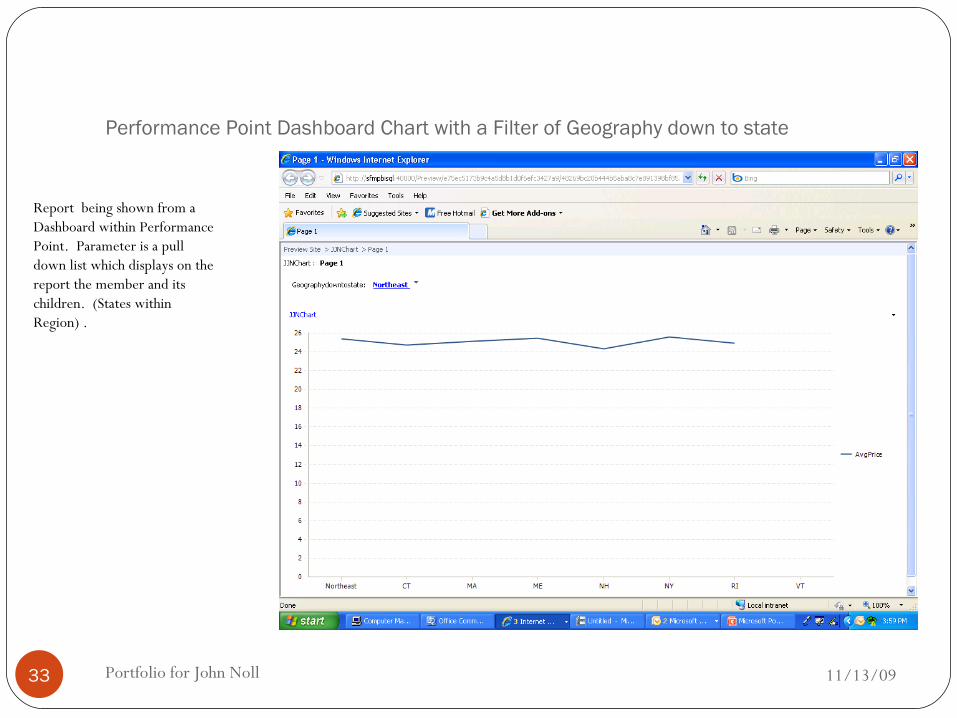
Performance Point Dashboard Chart with a Filter of Geography down to state
11/13/09Portfolio for John Noll33
Report being shown from a Dashboard within Performance Point. Parameter is a pull down list which displays on the report the member and its children. (States within Region) .
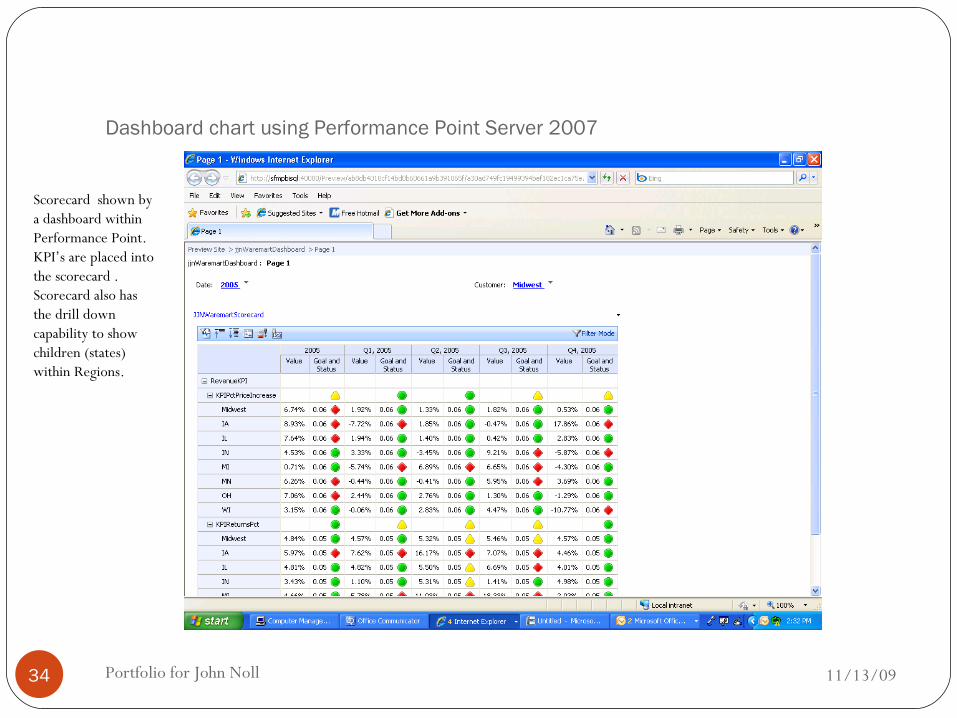
Dashboard chart using Performance Point Server 2007
11/13/09Portfolio for John Noll34
Scorecard shown by a dashboard within Performance Point. KPI’s are placed into the scorecard . Scorecard also has the drill down capability to show children (states) within Regions.
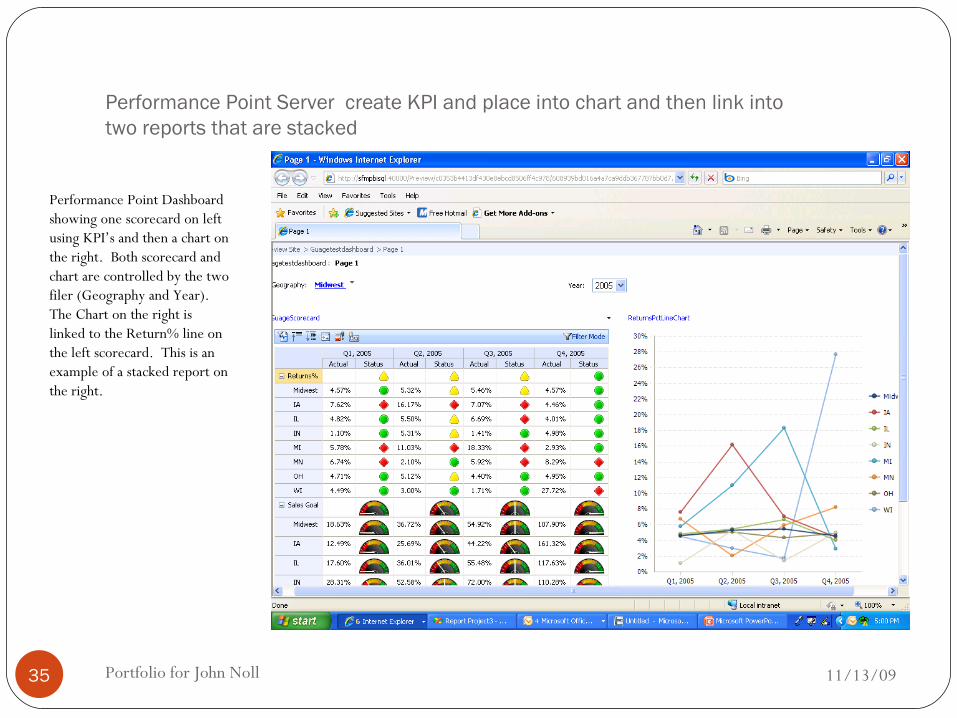
Performance Point Server create KPI and place into chart and then link into two reports that are stacked
11/13/09Portfolio for John Noll35
Performance Point Dashboard showing one scorecard on left using KPI’s and then a chart on the right. Both scorecard and chart are controlled by the two filer (Geography and Year). The Chart on the right is linked to the Return% line on the left scorecard. This is an example of a stacked report on the right.
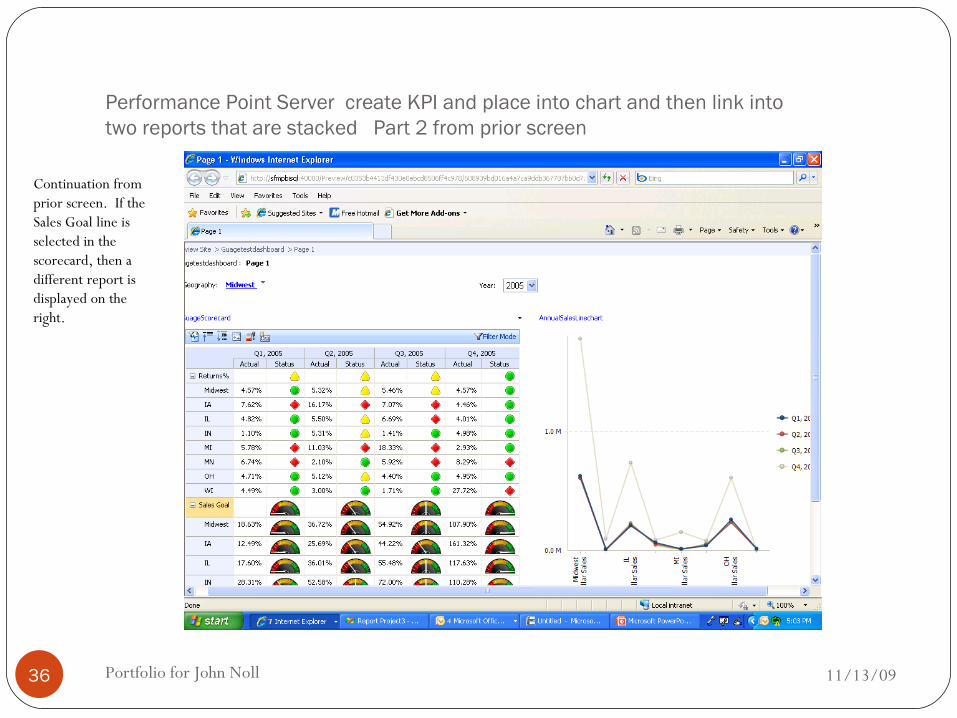
Performance Point Server create KPI and place into chart and then link into two reports that are stacked Part 2 from prior screen
11/13/09Portfolio for John Noll36
Continuation from prior screen. If the Sales Goal line is selected in the scorecard, then a different report is displayed on the right.
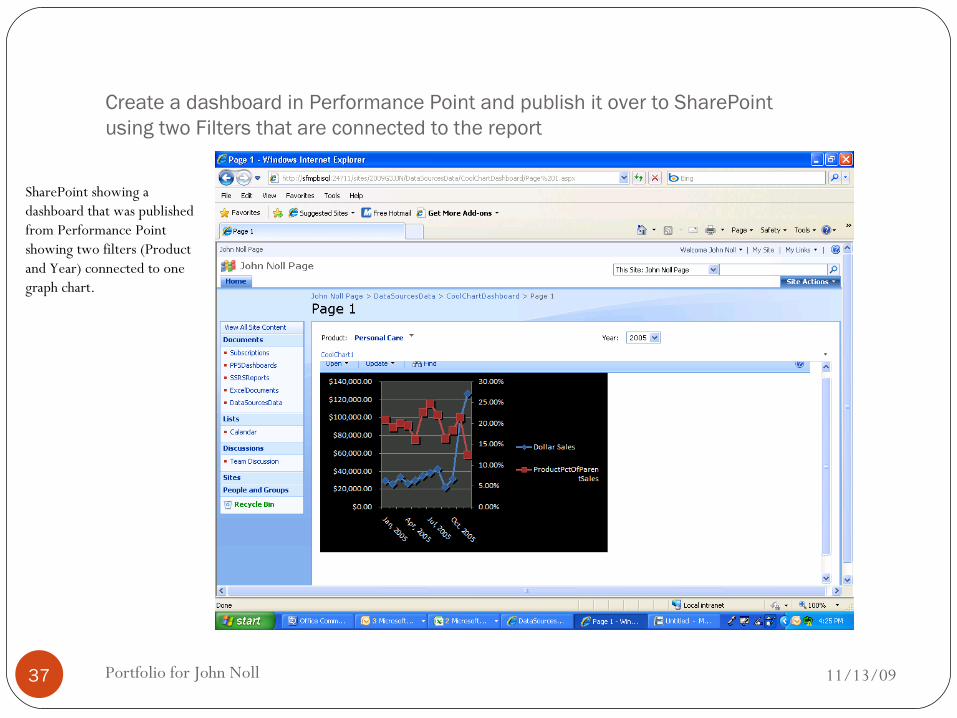
Create a dashboard in Performance Point and publish it over to SharePointusing two Filters that are connected to the report
11/13/09Portfolio for John Noll37
SharePoint showing a dashboard that was published from Performance Point showing two filters (Product and Year) connected to one graph chart.
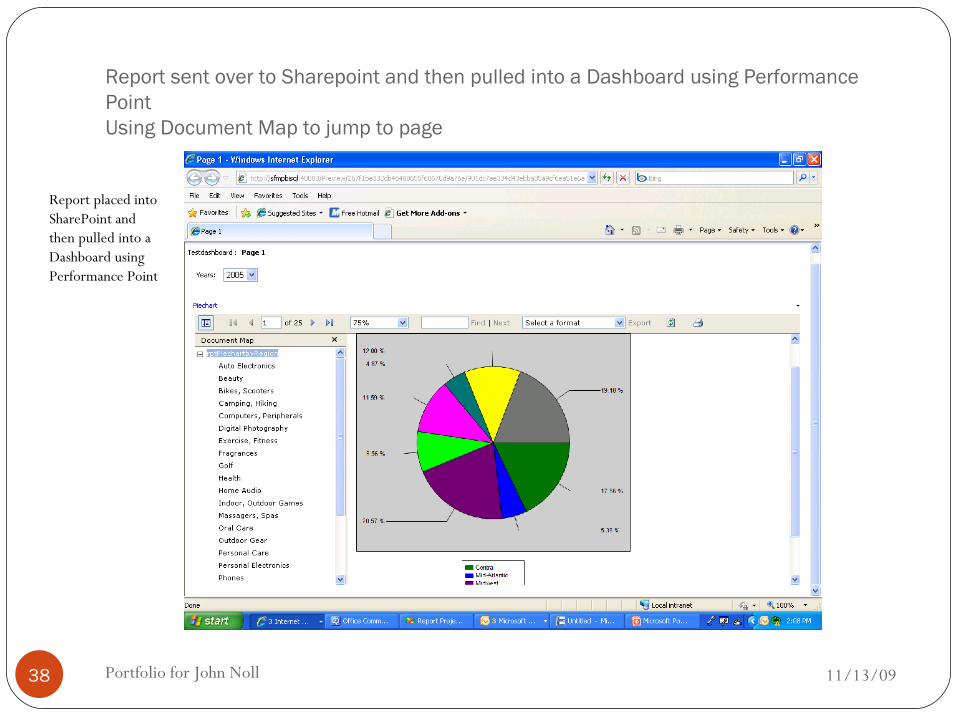
Report sent over to Sharepoint and then pulled into a Dashboard using Performance Point Using Document Map to jump to page
11/13/09Portfolio for John Noll38
Report placed into SharePoint and then pulled into a Dashboard using Performance Point