john jacob, ph.d. ricardo lópez, m.s
DESCRIPTION
Higher or Lower Density? What Gives the Best Bang for the Buck for Mitigating the Effects of Development?. John Jacob, Ph.d. Ricardo López, M.S. Low Impact Development Vs. Urban Sprawl. Low Impact Development (LID) Increase the amount of perviousness in developed areas Smart Growth - PowerPoint PPT PresentationTRANSCRIPT

Houston, TXHouston, TXMay 8-210, 2006May 8-210, 2006 The AWRA 2006 Conference on GIS & Water RThe AWRA 2006 Conference on GIS & Water R
esources IVesources IV
AWRAAWRA11
Higher or Lower Density?Higher or Lower Density? What Gives the Best Bang for the What Gives the Best Bang for the Buck for Mitigating the Effects of Buck for Mitigating the Effects of
Development?Development?
Higher or Lower Density?Higher or Lower Density? What Gives the Best Bang for the What Gives the Best Bang for the Buck for Mitigating the Effects of Buck for Mitigating the Effects of
Development?Development?
John Jacob, Ph.d.John Jacob, Ph.d.Ricardo López, M.S.Ricardo López, M.S.
Houston, TXHouston, TXMay 8-210, 2006May 8-210, 2006 The AWRA 2006 Conference on GIS & Water RThe AWRA 2006 Conference on GIS & Water R
esources IVesources IV
AWRAAWRA22-30-30
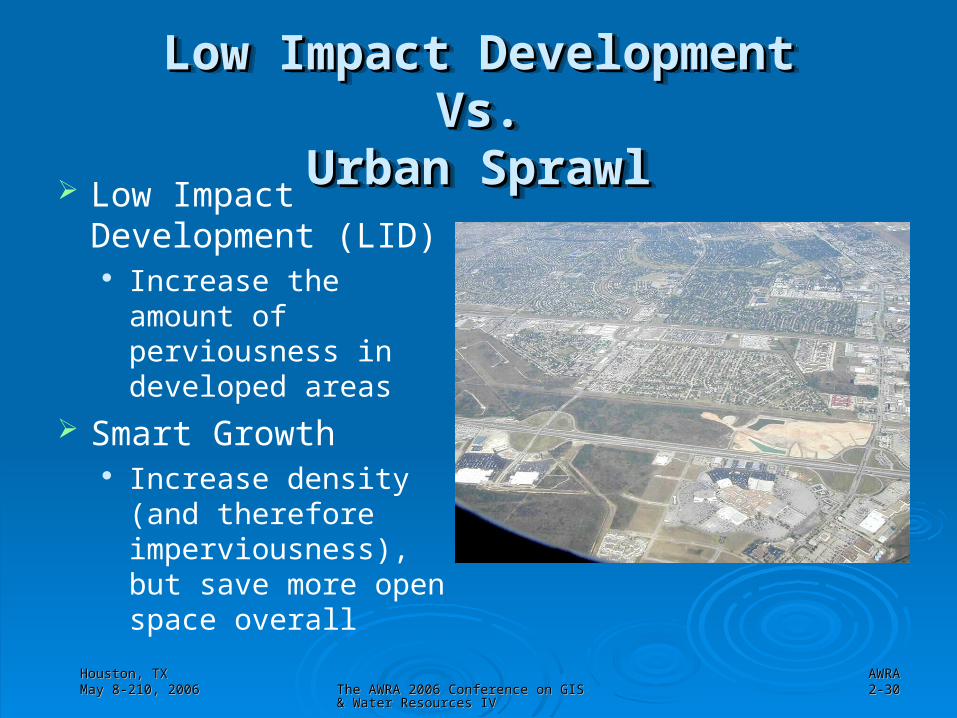
Low Impact DevelopmentLow Impact DevelopmentVs.Vs.
Urban SprawlUrban Sprawl
Low Impact DevelopmentLow Impact DevelopmentVs.Vs.
Urban SprawlUrban Sprawl Low Impact Development (LID)
Increase the amount of perviousness in developed areas
Smart Growth Increase density (and
therefore imperviousness), but save more open space overall
Houston, TXHouston, TXMay 8-210, 2006May 8-210, 2006 The AWRA 2006 Conference on GIS & Water RThe AWRA 2006 Conference on GIS & Water R
esources IVesources IV
AWRAAWRA33-30-30
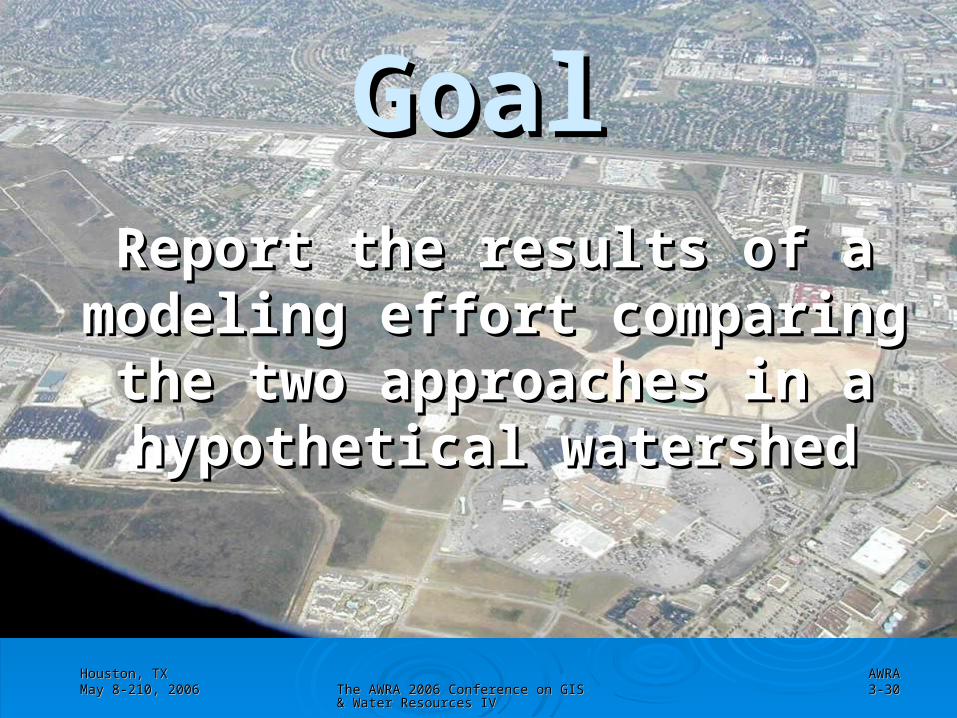
GoalGoalReport the results of a Report the results of a
modeling effort comparing modeling effort comparing the two approaches in a the two approaches in a hypothetical watershedhypothetical watershed

Houston, TXHouston, TXMay 8-210, 2006May 8-210, 2006 The AWRA 2006 Conference on GIS & Water RThe AWRA 2006 Conference on GIS & Water R
esources IVesources IV
AWRAAWRA44-30-30
Impervious land coverImpervious land cover Impervious land coverImpervious land cover
Impervious surface features are those that Impervious surface features are those that prohibit water from naturally infiltrating the prohibit water from naturally infiltrating the ground (concrete, pavement, etc)ground (concrete, pavement, etc)
Urban Landscapes:Urban Landscapes: Concrete, pavement, rooftopsConcrete, pavement, rooftops Swimming PoolsSwimming Pools
Impervious Land CoverImpervious Land Cover: essentially the area that : essentially the area that is not “green” is not “green”
Houston, TXHouston, TXMay 8-210, 2006May 8-210, 2006 The AWRA 2006 Conference on GIS & Water RThe AWRA 2006 Conference on GIS & Water R
esources IVesources IV
AWRAAWRA55-30-30
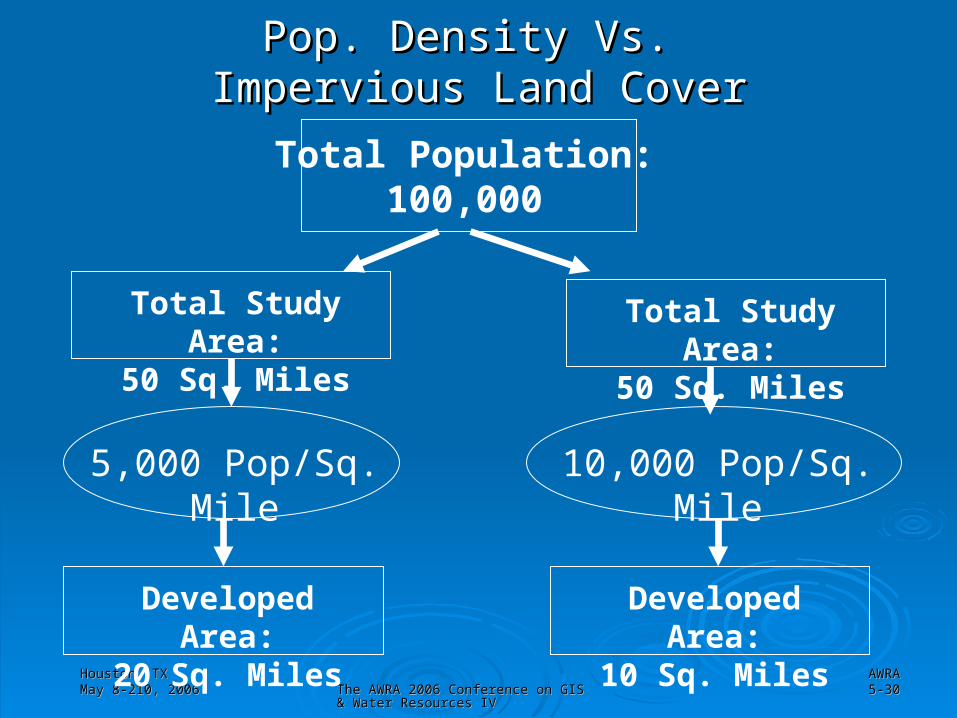
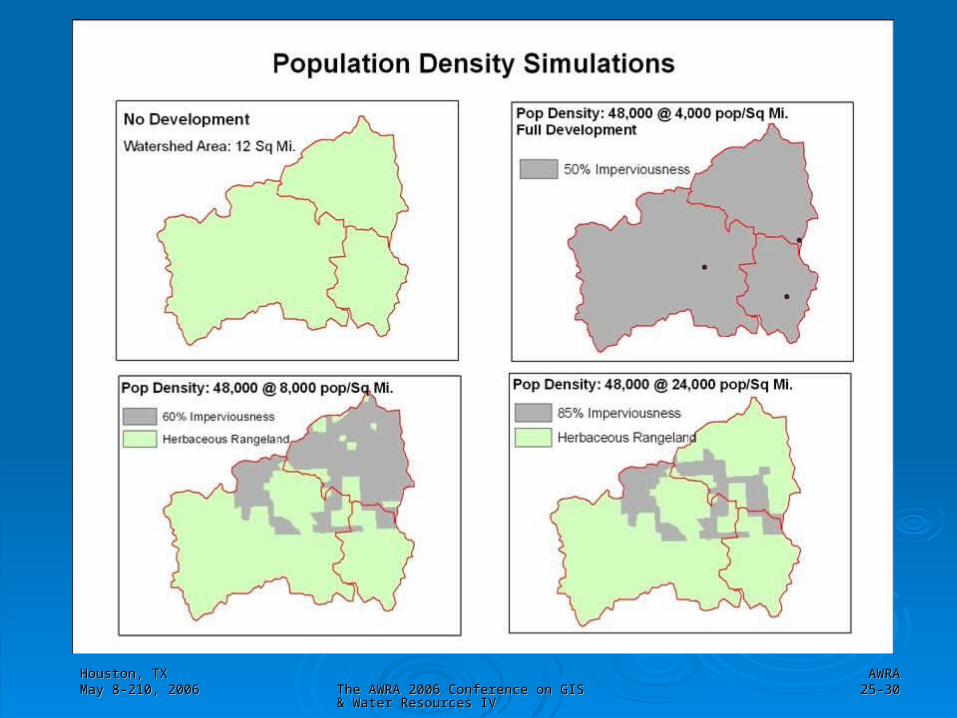
Pop. Density Vs. Pop. Density Vs. Impervious Land CoverImpervious Land Cover
Total Population:100,000
5,000 Pop/Sq. Mile
Total Study Area:50 Sq. Miles
10,000 Pop/Sq. Mile
Total Study Area:50 Sq. Miles
Developed Area:20 Sq. Miles
Developed Area:10 Sq. Miles
May 8-210, 2006May 8-210, 2006 The AWRA 2006 Conference on GIS & Water ResouThe AWRA 2006 Conference on GIS & Water Resources IVrces IV
66
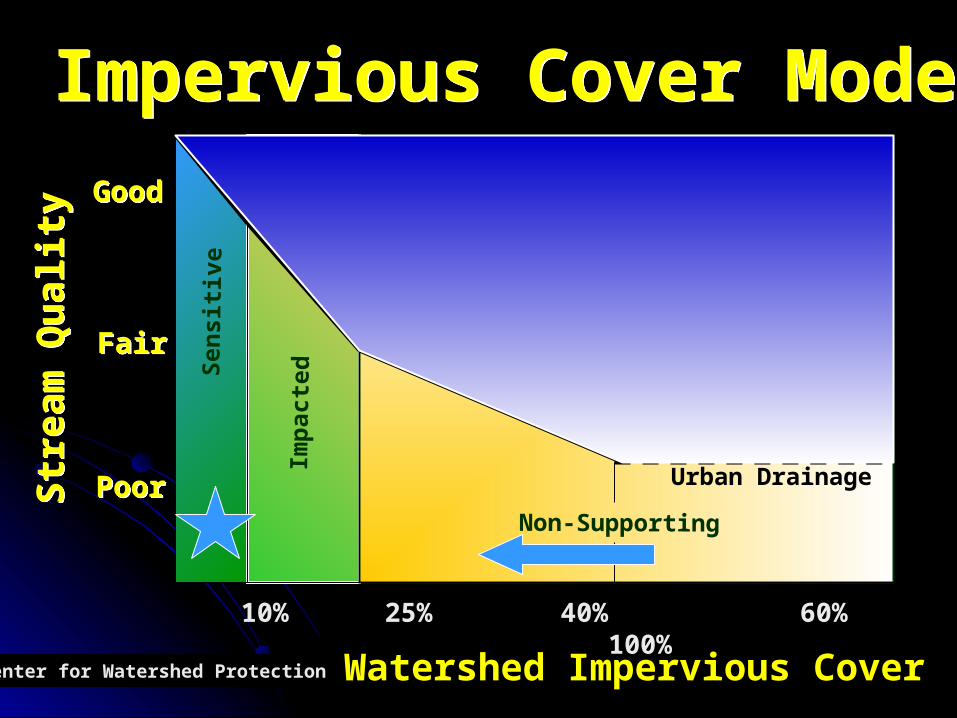
GoodGood
FairFair
PoorPoor
Watershed Impervious CoverWatershed Impervious Cover
Str
eam
Qu
ality
Str
eam
Qu
ality
Sen
sit
ive
Imp
acte
d
Non-Supporting
Urban Drainage
Impervious Cover Model Impervious Cover Model
10% 25% 40% 60% 100%
Center for Watershed Protection
May 8-210, 2006May 8-210, 2006 The AWRA 2006 Conference on GIS & Water ResouThe AWRA 2006 Conference on GIS & Water Resources IVrces IV
77
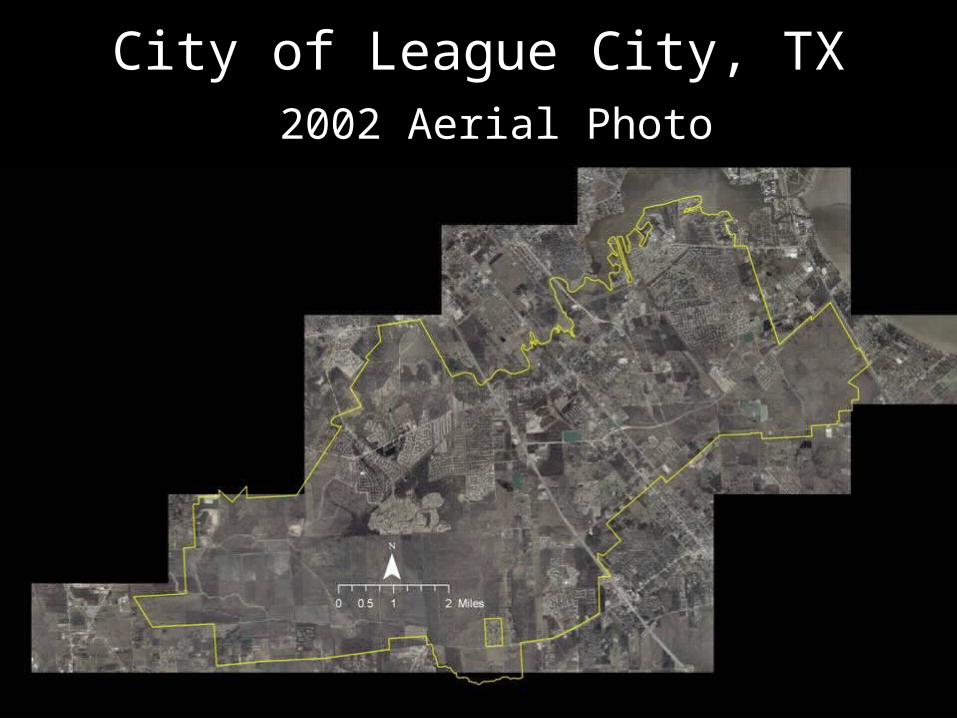
City of League City, TXCity of League City, TX 2002 Aerial Photo2002 Aerial Photo

Houston, TXHouston, TXMay 8-210, 2006May 8-210, 2006 The AWRA 2006 Conference on GIS & Water RThe AWRA 2006 Conference on GIS & Water R
esources IVesources IV
AWRAAWRA88-30-30
Houston, TXHouston, TXMay 8-210, 2006May 8-210, 2006 The AWRA 2006 Conference on GIS & Water RThe AWRA 2006 Conference on GIS & Water R
esources IVesources IV
AWRAAWRA99-30-30
100,000 new residents

Houston, TXHouston, TXMay 8-210, 2006May 8-210, 2006 The AWRA 2006 Conference on GIS & Water RThe AWRA 2006 Conference on GIS & Water R
esources IVesources IV
AWRAAWRA1010-30-30
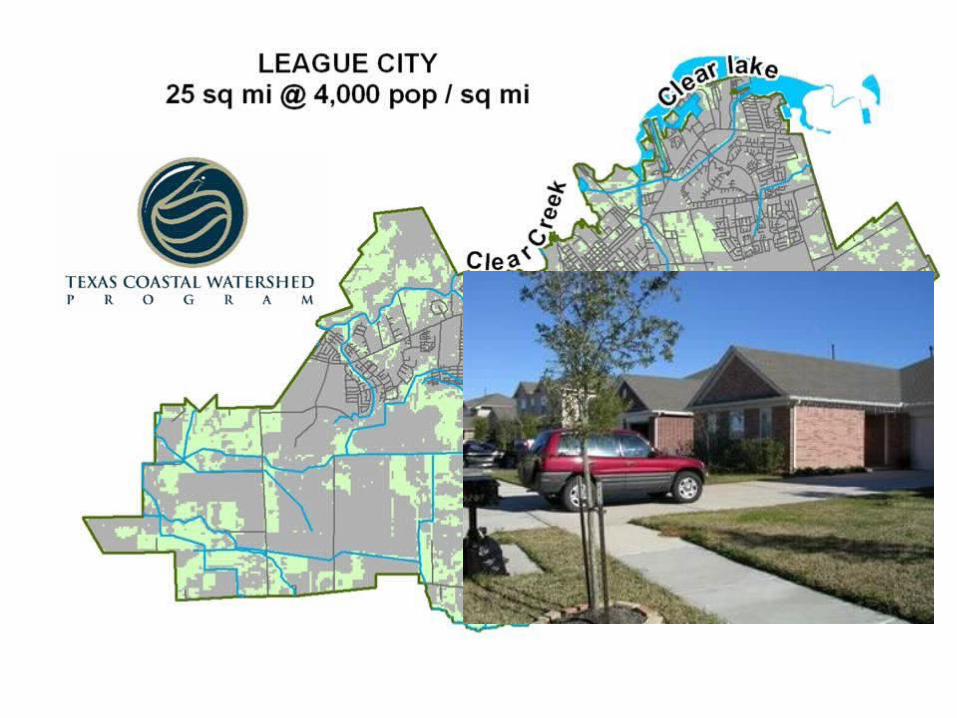
100,000 new residents
8.3 sq mi @ 12,000 pop / sq mi

Houston, TXHouston, TXMay 8-210, 2006May 8-210, 2006 The AWRA 2006 Conference on GIS & Water RThe AWRA 2006 Conference on GIS & Water R
esources IVesources IV
AWRAAWRA1111-30-30
100,000 new residents
3.4 sq mi @ 30,000 pop / sq mi
Houston, TXHouston, TXMay 8-210, 2006May 8-210, 2006 The AWRA 2006 Conference on GIS & Water RThe AWRA 2006 Conference on GIS & Water R
esources IVesources IV
AWRAAWRA1212-30-30
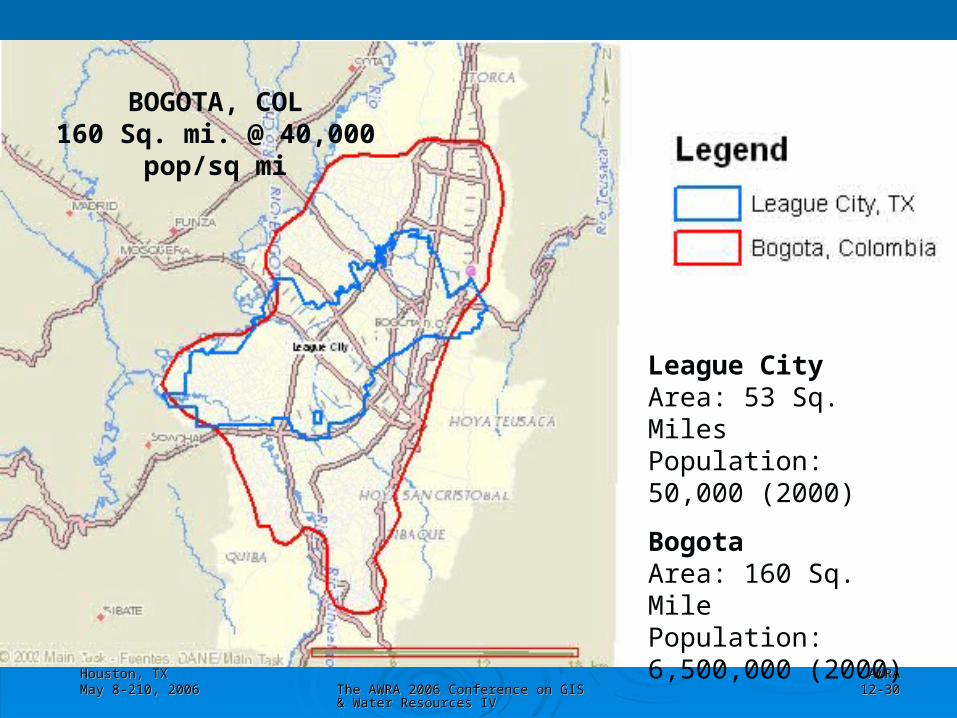
League City Area: 53 Sq. MilesPopulation: 50,000 (2000)
BogotaArea: 160 Sq. MilePopulation: 6,500,000 (2000)
BOGOTA, COL160 Sq. mi. @ 40,000 pop/sq mi
Houston, TXHouston, TXMay 8-210, 2006May 8-210, 2006 The AWRA 2006 Conference on GIS & Water RThe AWRA 2006 Conference on GIS & Water R
esources IVesources IV
AWRAAWRA1313
Pollutant Load Pollutant Load CalculationsCalculations

Houston, TXHouston, TXMay 8-210, 2006May 8-210, 2006 The AWRA 2006 Conference on GIS & Water RThe AWRA 2006 Conference on GIS & Water R
esources IVesources IV
AWRAAWRA1414-30-30
Pollutant Load Model (1)Pollutant Load Model (1)Input: LULC Input: LULC VectorVector format format
ArcGIS 9 Model BuilderArcGIS 9 Model Builder

Houston, TXHouston, TXMay 8-210, 2006May 8-210, 2006 The AWRA 2006 Conference on GIS & Water RThe AWRA 2006 Conference on GIS & Water R
esources IVesources IV
AWRAAWRA1515-30-30
Pollutant Load Model (2)Pollutant Load Model (2)Input: LULC Input: LULC RasterRaster format format
ArcGIS 9 Model BuilderArcGIS 9 Model Builder
Houston, TXHouston, TXMay 8-210, 2006May 8-210, 2006 The AWRA 2006 Conference on GIS & Water RThe AWRA 2006 Conference on GIS & Water R
esources IVesources IV
AWRAAWRA1616-30-30
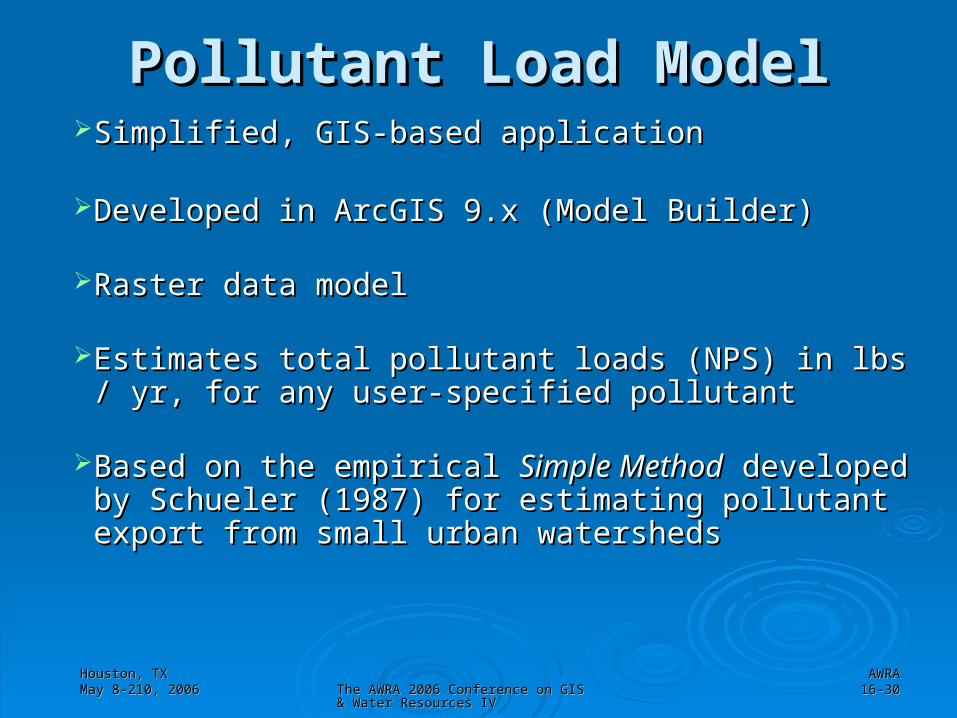
Pollutant Load ModelPollutant Load ModelSimplified, GIS-based applicationSimplified, GIS-based application
Developed in ArcGIS 9.x (Model Builder)Developed in ArcGIS 9.x (Model Builder)
Raster data model Raster data model
Estimates total pollutant loads (NPS) in lbs / yr, for any Estimates total pollutant loads (NPS) in lbs / yr, for any user-specified pollutantuser-specified pollutant
Based on the empirical Based on the empirical Simple MethodSimple Method developed by developed by Schueler (1987) for estimating pollutant export from Schueler (1987) for estimating pollutant export from small urban watersheds small urban watersheds

Houston, TXHouston, TXMay 8-210, 2006May 8-210, 2006 The AWRA 2006 Conference on GIS & Water RThe AWRA 2006 Conference on GIS & Water R
esources IVesources IV
AWRAAWRA1717-30-30
Model Input DataModel Input Data
Geo-spatial Data Geo-spatial Data Watershed BoundariesWatershed Boundaries Land-Use/Land-Cover (LULC) - VLand-Use/Land-Cover (LULC) - Vectorector or or
rasterraster
Tabular DataTabular Data Event Mean Concentration (EMC) table - Event Mean Concentration (EMC) table -
TextText (csv) (csv) Imperviousness factors table - Imperviousness factors table - TextText (csv) (csv)
Houston, TXHouston, TXMay 8-210, 2006May 8-210, 2006 The AWRA 2006 Conference on GIS & Water RThe AWRA 2006 Conference on GIS & Water R
esources IVesources IV
AWRAAWRA1818-30-30
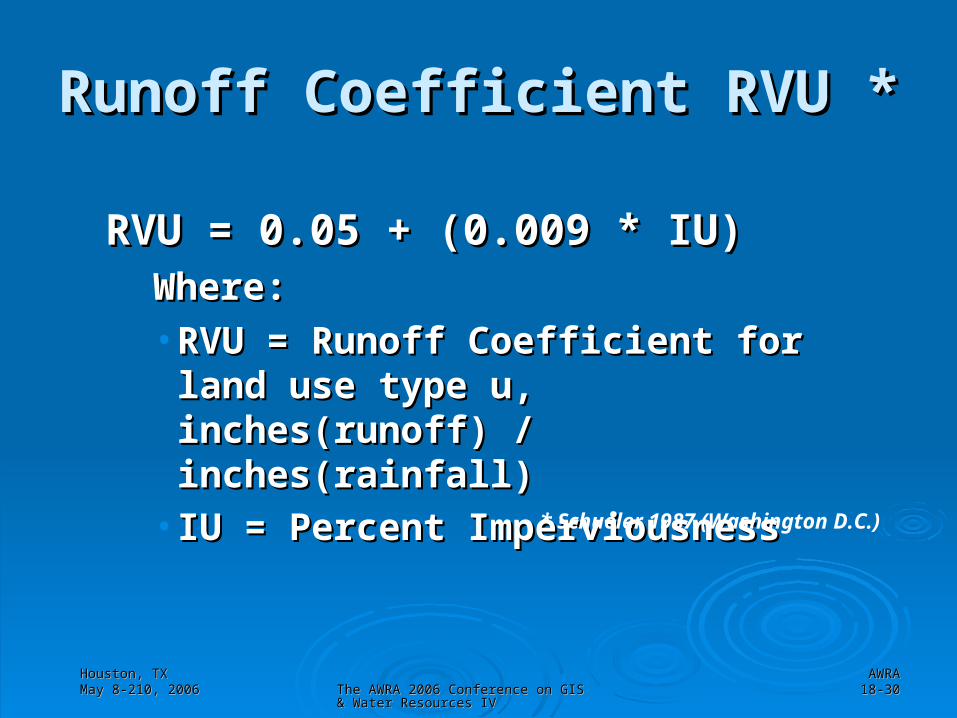
Runoff Coefficient RVU *Runoff Coefficient RVU *
RVU = 0.05 + (0.009 * IU)RVU = 0.05 + (0.009 * IU)Where: Where: • RVU = Runoff Coefficient for land use RVU = Runoff Coefficient for land use
type u, inches(runoff) / inches(rainfall) type u, inches(runoff) / inches(rainfall) • IU = Percent ImperviousnessIU = Percent Imperviousness
* Schueler 1987 (Washington D.C.)

Houston, TXHouston, TXMay 8-210, 2006May 8-210, 2006 The AWRA 2006 Conference on GIS & Water RThe AWRA 2006 Conference on GIS & Water R
esources IVesources IV
AWRAAWRA1919-30-30
IMP - Imperviousness valuesIMP - Imperviousness values(%)(%)
Houston, TXHouston, TXMay 8-210, 2006May 8-210, 2006 The AWRA 2006 Conference on GIS & Water RThe AWRA 2006 Conference on GIS & Water R
esources IVesources IV
AWRAAWRA2020-30-30
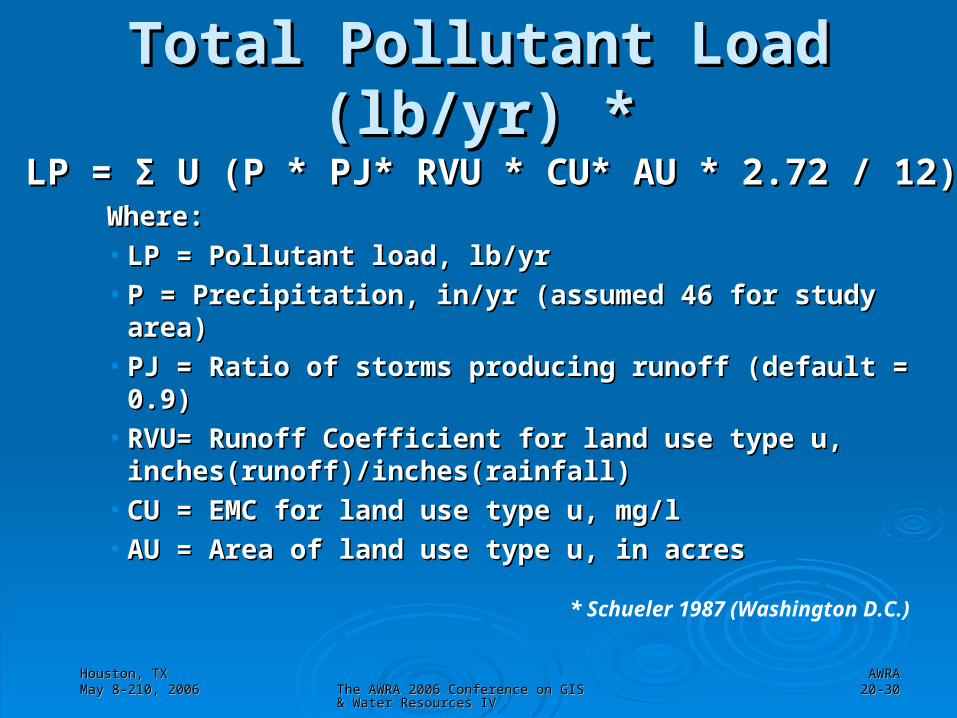
Total Pollutant Load (lb/yr) *Total Pollutant Load (lb/yr) *
LP = Σ U (P * PJ* RVU * CU* AU * 2.72 / 12)LP = Σ U (P * PJ* RVU * CU* AU * 2.72 / 12)Where: Where: • LP = Pollutant load, lb/yrLP = Pollutant load, lb/yr• P = Precipitation, in/yr (assumed 46 for study area)P = Precipitation, in/yr (assumed 46 for study area)• PJ = Ratio of storms producing runoff (default = 0.9)PJ = Ratio of storms producing runoff (default = 0.9)• RVU= Runoff Coefficient for land use type u, RVU= Runoff Coefficient for land use type u,
inches(runoff)/inches(rainfall)inches(runoff)/inches(rainfall)• CU = EMC for land use type u, mg/lCU = EMC for land use type u, mg/l• AU = Area of land use type u, in acresAU = Area of land use type u, in acres
* Schueler 1987 (Washington D.C.)

Houston, TXHouston, TXMay 8-210, 2006May 8-210, 2006 The AWRA 2006 Conference on GIS & Water RThe AWRA 2006 Conference on GIS & Water R
esources IVesources IV
AWRAAWRA2121-30-30
Event Mean Concentration (EMC)Event Mean Concentration (EMC)Event Mean Concentration (EMC)Event Mean Concentration (EMC)
An EMC is defined as the total An EMC is defined as the total constituent mass discharge divided by constituent mass discharge divided by the total runoff volume (EPA 1983)the total runoff volume (EPA 1983)
EMCs were developed by the EPA’s EMCs were developed by the EPA’s Nationwide Urban Runoff Program Nationwide Urban Runoff Program (NURP) (1983) to serve as a national (NURP) (1983) to serve as a national measure of the magnitude of urban measure of the magnitude of urban runoff, specifically pollutant loadingsrunoff, specifically pollutant loadings

Houston, TXHouston, TXMay 8-210, 2006May 8-210, 2006 The AWRA 2006 Conference on GIS & Water RThe AWRA 2006 Conference on GIS & Water R
esources IVesources IV
AWRAAWRA2222-30-30
EMC - Event Mean Concentration values EMC - Event Mean Concentration values for TSS, BOD, TN and TP in mg/lfor TSS, BOD, TN and TP in mg/l(Houston Area EMC Database)(Houston Area EMC Database)
GBNEP – 15March 1992

Houston, TXHouston, TXMay 8-210, 2006May 8-210, 2006 The AWRA 2006 Conference on GIS & Water RThe AWRA 2006 Conference on GIS & Water R
esources IVesources IV
AWRAAWRA2323-30-30
ScenariosScenarios
No development Full buildout at 4000 people/mi2 (Status Quo) Same population as full buildout but at 12,000
people/mi2 Same population as full buildout but at 30,000
people/mi2 Full-buildout scenario at 4000 people/mi2 with
the addition of best management practices (BMPs or “LID”) treating 20% of the area with a 65% effectiveness.

Houston, TXHouston, TXMay 8-210, 2006May 8-210, 2006 The AWRA 2006 Conference on GIS & Water RThe AWRA 2006 Conference on GIS & Water R
esources IVesources IV
AWRAAWRA2424
ResultsResults
Houston, TXHouston, TXMay 8-210, 2006May 8-210, 2006 The AWRA 2006 Conference on GIS & Water RThe AWRA 2006 Conference on GIS & Water R
esources IVesources IV
AWRAAWRA2525-30-30

Houston, TXHouston, TXMay 8-210, 2006May 8-210, 2006 The AWRA 2006 Conference on GIS & Water RThe AWRA 2006 Conference on GIS & Water R
esources IVesources IV
AWRAAWRA2626-30-30
Pollutant Loads - Comparison ChartPollutant Loads - Comparison Chart(lbs / year)(lbs / year)
Total Nitrogen Total Phosphorus
Biochemical Oxygen Demand Total Suspended Solids
Houston, TXHouston, TXMay 8-210, 2006May 8-210, 2006 The AWRA 2006 Conference on GIS & Water RThe AWRA 2006 Conference on GIS & Water R
esources IVesources IV
AWRAAWRA2727-30-30
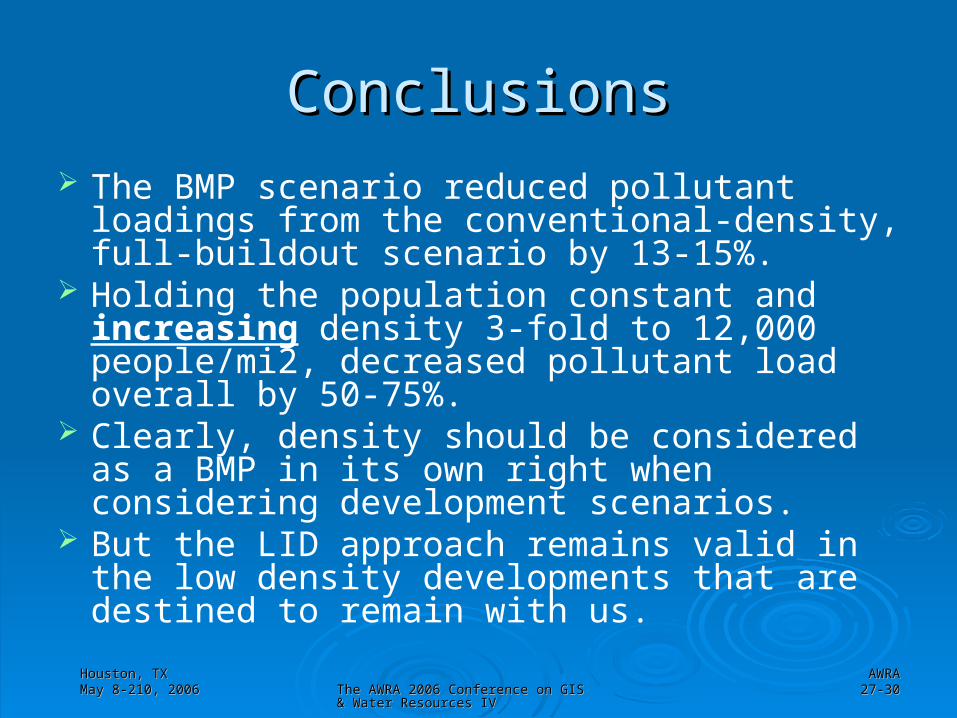
ConclusionsConclusions The BMP scenario reduced pollutant loadings
from the conventional-density, full-buildout scenario by 13-15%.
Holding the population constant and increasing density 3-fold to 12,000 people/mi2, decreased pollutant load overall by 50-75%.
Clearly, density should be considered as a BMP in its own right when considering development scenarios.
But the LID approach remains valid in the low density developments that are destined to remain with us.

Houston, TXHouston, TXMay 8-210, 2006May 8-210, 2006 The AWRA 2006 Conference on GIS & Water RThe AWRA 2006 Conference on GIS & Water R
esources IVesources IV
AWRAAWRA2828-30-30
Texas Sea Grant / Tx. Coop. ExtensionTexas Sea Grant / Tx. Coop. ExtensionTexas A&M UniversityTexas A&M University
www.urban-nature.orgwww.urban-nature.orgRicardo A Lopez M.S.Ricardo A Lopez M.S.
17000 El Camino Real, Suite 30117000 El Camino Real, Suite 301Houston, TX 77058Houston, TX 77058
(281) 218 0570(281) 218 0570E-mail: E-mail: [email protected]

Houston, TXHouston, TXMay 8-210, 2006May 8-210, 2006 The AWRA 2006 Conference on GIS & Water RThe AWRA 2006 Conference on GIS & Water R
esources IVesources IV
AWRAAWRA2929
AppendixAppendix

Houston, TXHouston, TXMay 8-210, 2006May 8-210, 2006 The AWRA 2006 Conference on GIS & Water RThe AWRA 2006 Conference on GIS & Water R
esources IVesources IV
AWRAAWRA3030-30-30
What is Urban Sprawl?What is Urban Sprawl? To spread out in a way that is not organized.To spread out in a way that is not organized.
www.inhs.uiuc.edu/chf/pub/virtualbird/glossary.htmlwww.inhs.uiuc.edu/chf/pub/virtualbird/glossary.html
Haphazard growth or outward extension of a city Haphazard growth or outward extension of a city resulting from uncontrolled or poorly managed resulting from uncontrolled or poorly managed development.development.www.co.monterey.ca.us/gpu/glossary2.htmwww.co.monterey.ca.us/gpu/glossary2.htm
Current development patterns, where rural land is Current development patterns, where rural land is converted to urban uses more quickly than needed to converted to urban uses more quickly than needed to house new residents and support new businesses, and house new residents and support new businesses, and people become more dependent on automobiles. people become more dependent on automobiles. www.smartgrowth.org/bibliographies/greenlit_search/glwww.smartgrowth.org/bibliographies/greenlit_search/glossary.htmlossary.html

Houston, TXHouston, TXMay 8-210, 2006May 8-210, 2006 The AWRA 2006 Conference on GIS & Water RThe AWRA 2006 Conference on GIS & Water R
esources IVesources IV
AWRAAWRA3131-30-30
BASINSBASINS
BASINSBASINS: Better Assessment Science Integrating : Better Assessment Science Integrating Point and Nonpoint Sources – U.S. Environmental Point and Nonpoint Sources – U.S. Environmental Protection Agency (EPA)Protection Agency (EPA) Multipurpose environmental analysis system designed Multipurpose environmental analysis system designed
to perform watershed and water quality-based studiesto perform watershed and water quality-based studies Makes it possible to quickly assess large amounts of Makes it possible to quickly assess large amounts of
point source and non-point source datapoint source and non-point source data Geographic Information System (GIS) tool developed Geographic Information System (GIS) tool developed
as an extension to ArcView software program as an extension to ArcView software program (Environmental System Research Institute – ESRI)(Environmental System Research Institute – ESRI)

Houston, TXHouston, TXMay 8-210, 2006May 8-210, 2006 The AWRA 2006 Conference on GIS & Water RThe AWRA 2006 Conference on GIS & Water R
esources IVesources IV
AWRAAWRA3232-30-30
Watershed BoundaryWatershed Boundary WatershedsWatersheds define the areas for which the define the areas for which the
pollutant loads are calculatedpollutant loads are calculated Available from local Available from local government agenciesgovernment agencies in most in most
moderate- to high-density urban areasmoderate- to high-density urban areas May be derived using standard GIS or BASINS May be derived using standard GIS or BASINS
tools and the United States Geological Survey tools and the United States Geological Survey (USGS) (USGS) Digital Elevation ModelDigital Elevation Model (DEM) data files (DEM) data files (See appendix)(See appendix)
Dataset must have a code field containing Dataset must have a code field containing unique unique identifiersidentifiers for each watershed for each watershed
Vector format, projected CS, same projection and Vector format, projected CS, same projection and datum, stored in meters (map units)datum, stored in meters (map units)

Houston, TXHouston, TXMay 8-210, 2006May 8-210, 2006 The AWRA 2006 Conference on GIS & Water RThe AWRA 2006 Conference on GIS & Water R
esources IVesources IV
AWRAAWRA3333-30-30
LULC DatasetLULC Dataset
Defines Land-Use/Land-Cover types for the Defines Land-Use/Land-Cover types for the study areastudy area
Dataset must encompass the entire watershedDataset must encompass the entire watershed Essential for calculating the pollutant loads.Essential for calculating the pollutant loads. Available from local Available from local government agenciesgovernment agencies in in
most moderate- to high-density urban areasmost moderate- to high-density urban areas If available in If available in rasterraster format (grid of cells), must format (grid of cells), must
be converted to be converted to vectorvector format (polygon spatial format (polygon spatial features)features)
Houston, TXHouston, TXMay 8-210, 2006May 8-210, 2006 The AWRA 2006 Conference on GIS & Water RThe AWRA 2006 Conference on GIS & Water R
esources IVesources IV
AWRAAWRA3434-30-30
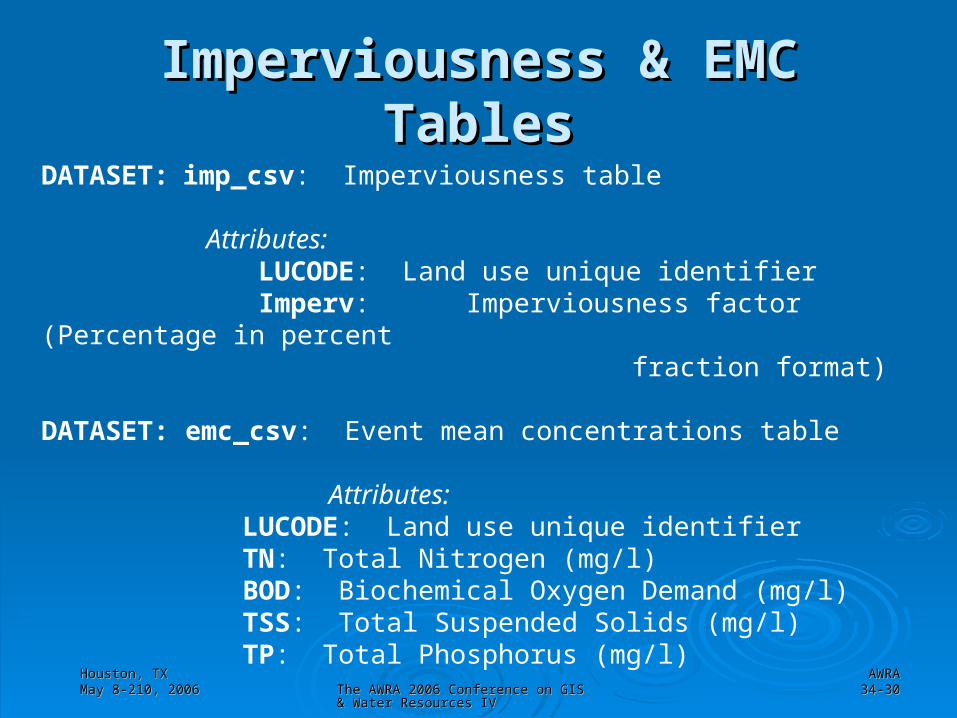
Imperviousness & EMCImperviousness & EMCTablesTables
DATASET: imp_csv: Imperviousness table Attributes: LUCODE: Land use unique identifier Imperv: Imperviousness factor (Percentage in percent
fraction format)
DATASET: emc_csv: Event mean concentrations table
Attributes: LUCODE: Land use unique identifier TN: Total Nitrogen (mg/l) BOD: Biochemical Oxygen Demand (mg/l) TSS: Total Suspended Solids (mg/l) TP: Total Phosphorus (mg/l)

Houston, TXHouston, TXMay 8-210, 2006May 8-210, 2006 The AWRA 2006 Conference on GIS & Water RThe AWRA 2006 Conference on GIS & Water R
esources IVesources IV
AWRAAWRA3535-30-30
Software ReferencesSoftware References
P-LOADP-LOAD (ArcView extension to (ArcView extension to BASINSBASINS (Better (Better Assessment Science Integrating Point & Nonpoint Assessment Science Integrating Point & Nonpoint Sources – U.S. Environmental Protection Agency - Sources – U.S. Environmental Protection Agency - EPA):EPA):
BASINS 3.1 Description:BASINS 3.1 Description:http://www.epa.gov/waterscience/ftp/basins/system/http://www.epa.gov/waterscience/ftp/basins/system/BASINS3/areadb3.htmBASINS3/areadb3.htmDownload BASINS 3.1 program and data:Download BASINS 3.1 program and data:http://www.epa.gov/waterscience/basins/index.htmlhttp://www.epa.gov/waterscience/basins/index.html