jim salinger presentation
TRANSCRIPT
S C H O O L O F E N V I R O N M E N T
Living in a warmer world 4 December 2014
Living in a warmer world: Climate change impacts on Auckland
Dr Jim Salinger, School of Environment University of Auckland
Living in a warmer world: 4 December 2014
Outline
• Our changing climate
• Future projections: Auckland • Impacts: Extremes
• Agriculture and Health
• Oceans and fisheries
• Pacific Communities – our front yard
Living in a warmer world: 4 December 2014
Living in a warmer world: 4 December 2014
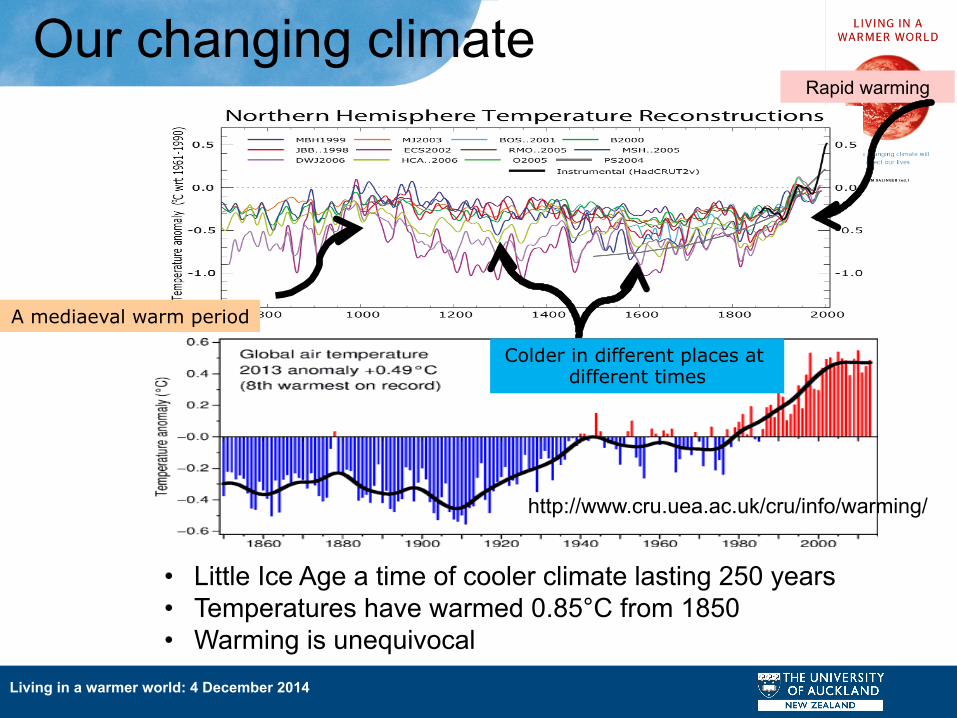
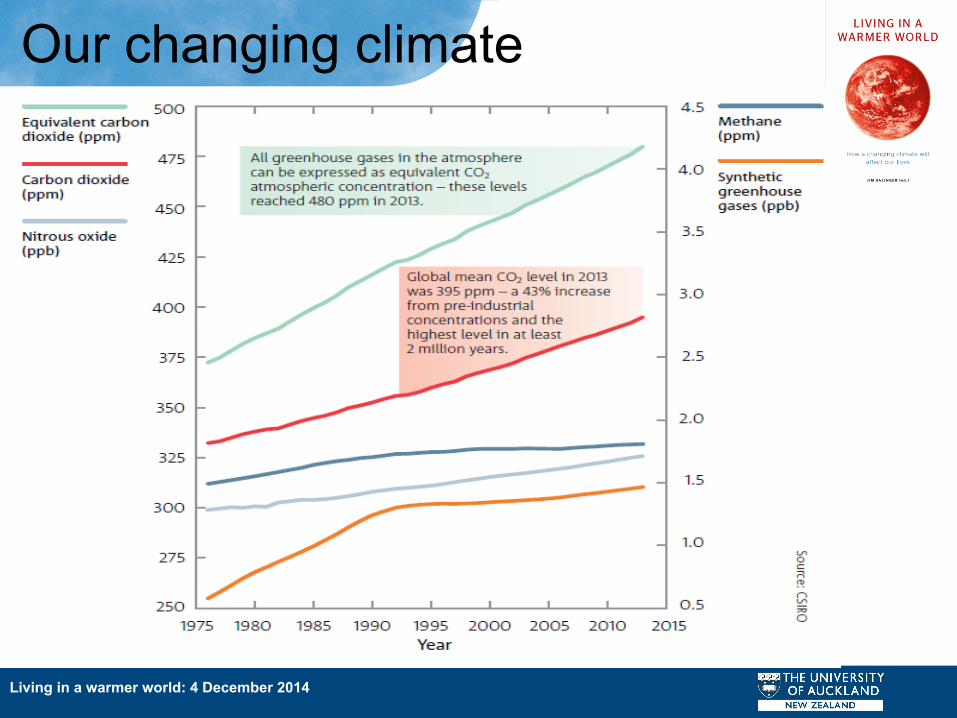
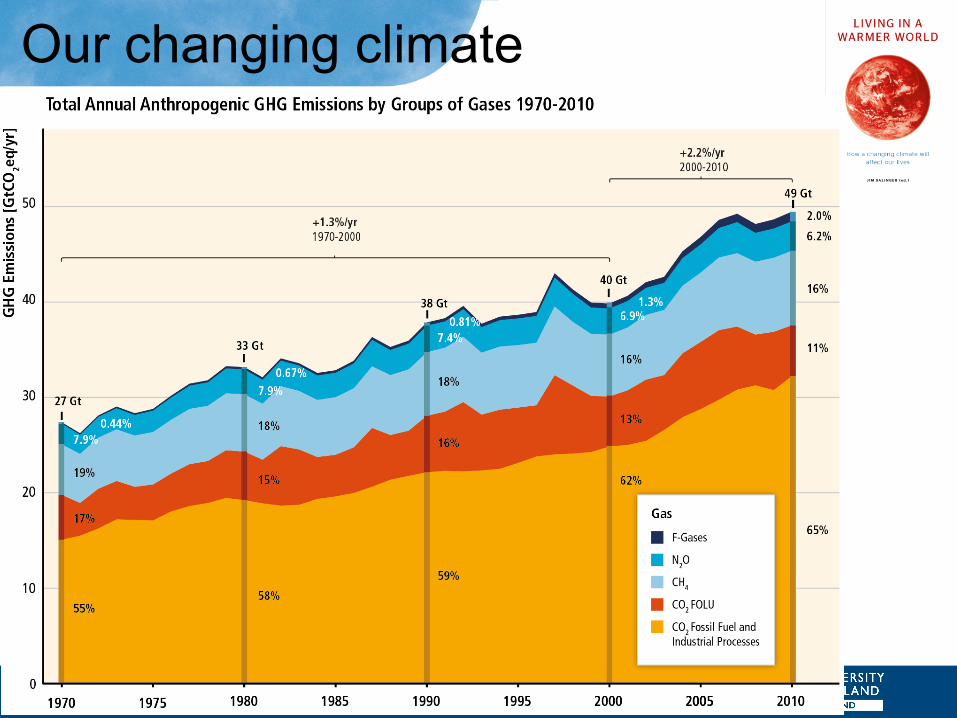
Our changing climate
• Little Ice Age a time of cooler climate lasting 250 years • Temperatures have warmed 0.85°C from 1850 • Warming is unequivocal
A mediaeval warm period
Rapid warming
Colder in different places at different times
http://www.cru.uea.ac.uk/cru/info/warming/
Living in a warmer world: 4 December 2014
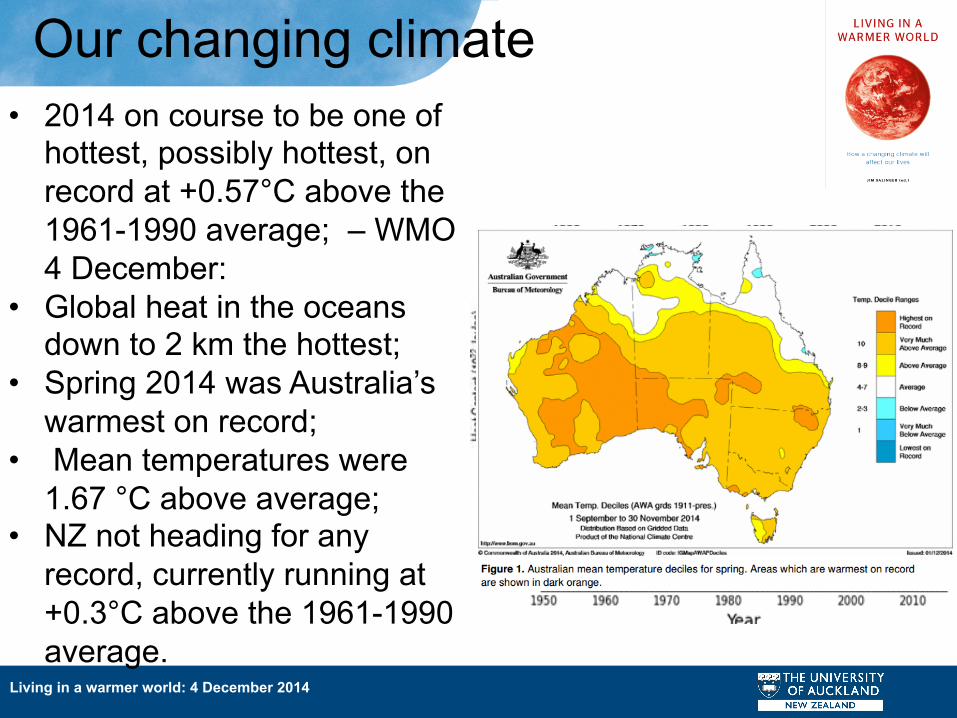
• 2014 on course to be one of hottest, possibly hottest, on record at +0.57°C above the 1961-1990 average; – WMO 4 December:
• Global heat in the oceans down to 2 km the hottest;
• Spring 2014 was Australia’s warmest on record;
• Mean temperatures were 1.67 °C above average;
• NZ not heading for any record, currently running at +0.3°C above the 1961-1990 average.
Our changing climate
Living in a warmer world: 4 December 2014
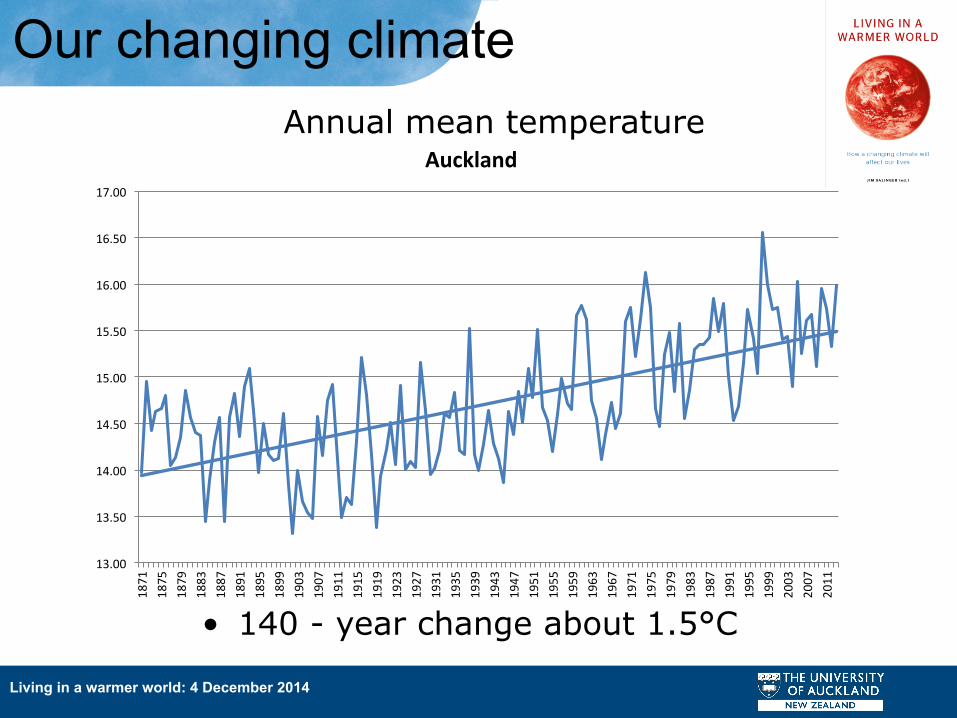
Our changing climate Annual mean temperature
• 140 - year change about 1.5°C
13.00
13.50
14.00
14.50
15.00
15.50
16.00
16.50
17.00
1871
1875
1879
1883
1887
1891
1895
1899
1903
1907
1911
1915
1919
1923
1927
1931
1935
1939
1943
1947
1951
1955
1959
1963
1967
1971
1975
1979
1983
1987
1991
1995
1999
2003
2007
2011
Auckland
Living in a warmer world: 4 December 2014
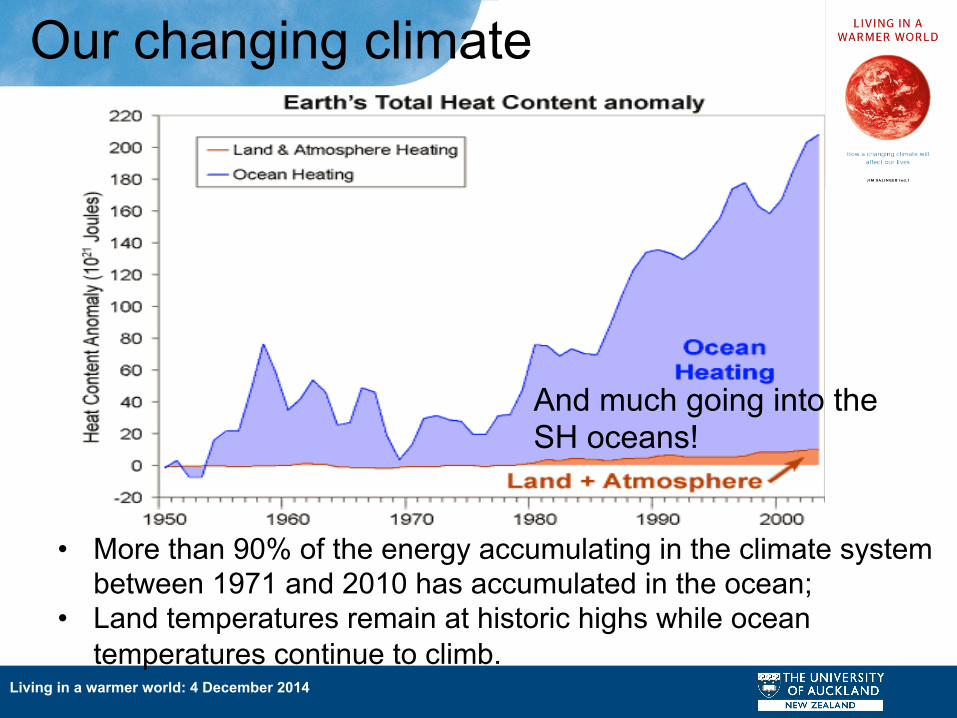
• More than 90% of the energy accumulating in the climate system between 1971 and 2010 has accumulated in the ocean;
• Land temperatures remain at historic highs while ocean temperatures continue to climb.
And much going into the SH oceans!
Our changing climate
Living in a warmer world: 4 December 2014
Our changing climate
Living in a warmer world: 4 December 2014
Our changing climate
-‐1.5
-‐1
-‐0.5
0
0.5
1
1.5
Drou
ght Ind
ex
Growing Season
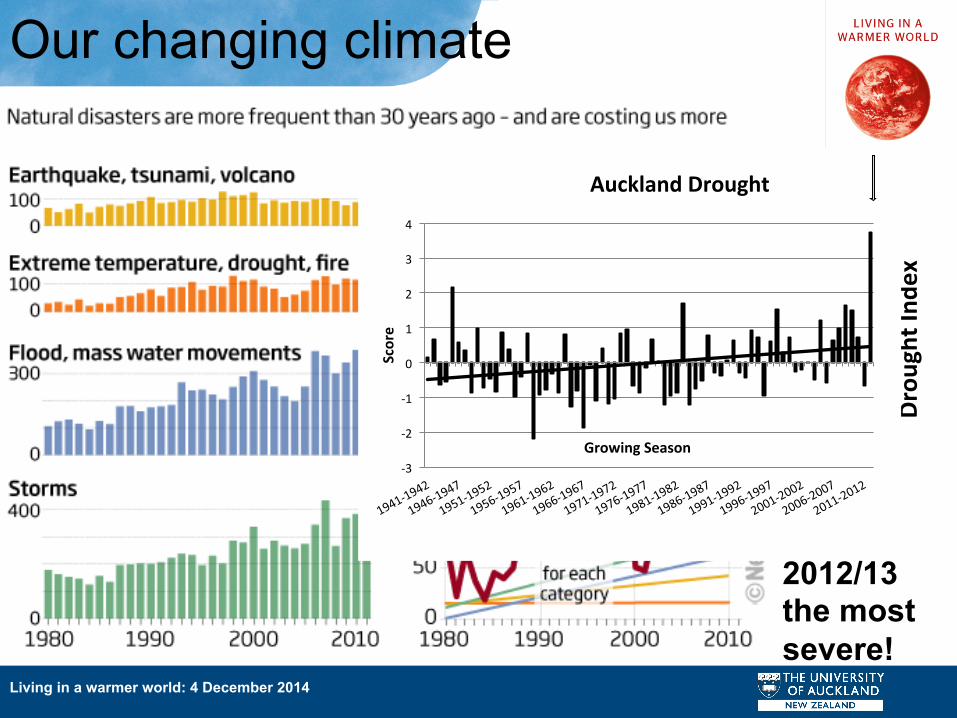
New Zealand Drought Index 1941 -‐ 2013
-‐3
-‐2
-‐1
0
1
2
3
4
Score
Growing Season
Auckland Drought
2012/13 the most severe!
Living in a warmer world: 4 December 2014
Our changing climate
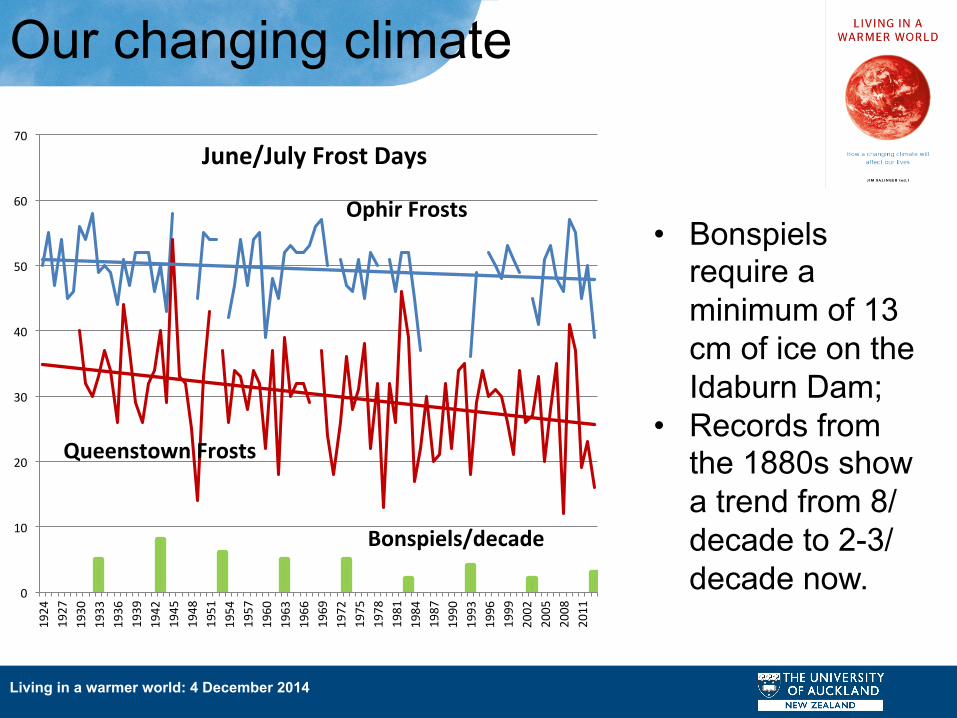
• Bonspiels require a minimum of 13 cm of ice on the Idaburn Dam;
• Records from the 1880s show a trend from 8/decade to 2-3/decade now. 0
10
20
30
40
50
60
70
1924
1927
1930
1933
1936
1939
1942
1945
1948
1951
1954
1957
1960
1963
1966
1969
1972
1975
1978
1981
1984
1987
1990
1993
1996
1999
2002
2005
2008
2011
Ophir Frosts
Queenstown Frosts
Bonspiels/decade
June/July Frost Days
Living in a warmer world: 4 December 2014
Our changing climate
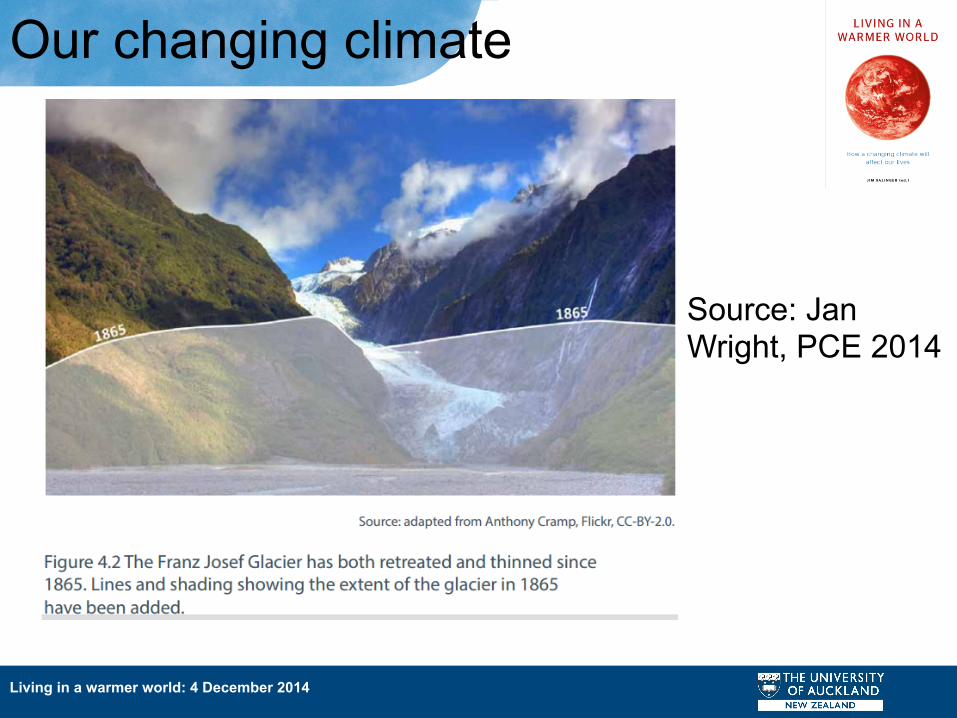
Source: Jan Wright, PCE 2014
Living in a warmer world: 4 December 2014
Our changing climate
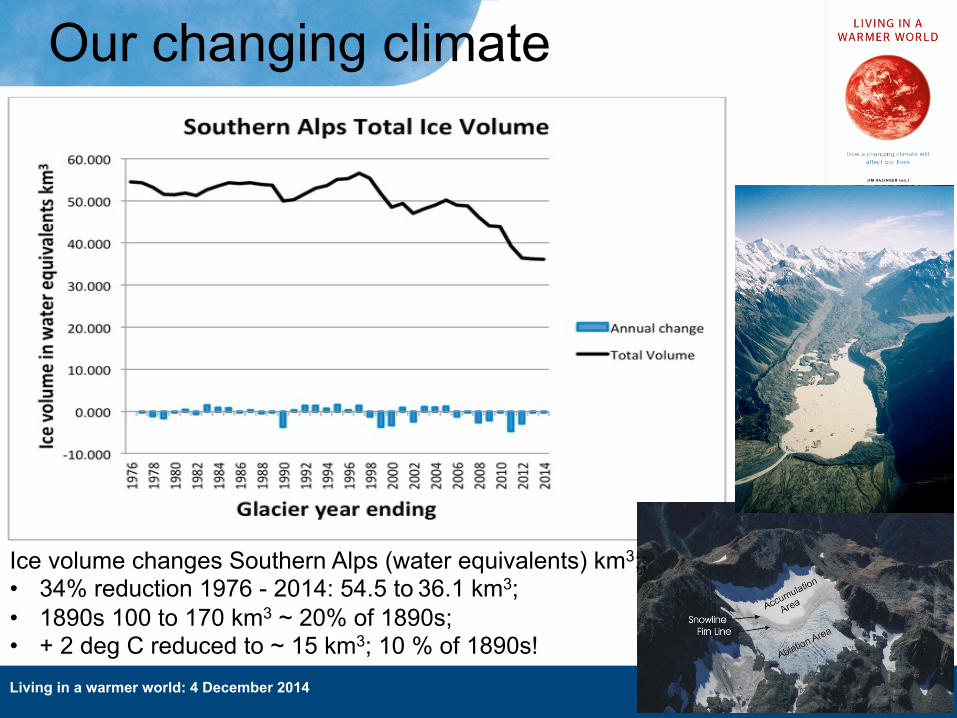
Tasman
Ice volume changes Southern Alps (water equivalents) km3;; • 34% reduction 1976 - 2014: 54.5 to 36.1 km3; • 1890s 100 to 170 km3 ~ 20% of 1890s; • + 2 deg C reduced to ~ 15 km3; 10 % of 1890s!
Living in a warmer world: 4 December 2014
Our changing climate
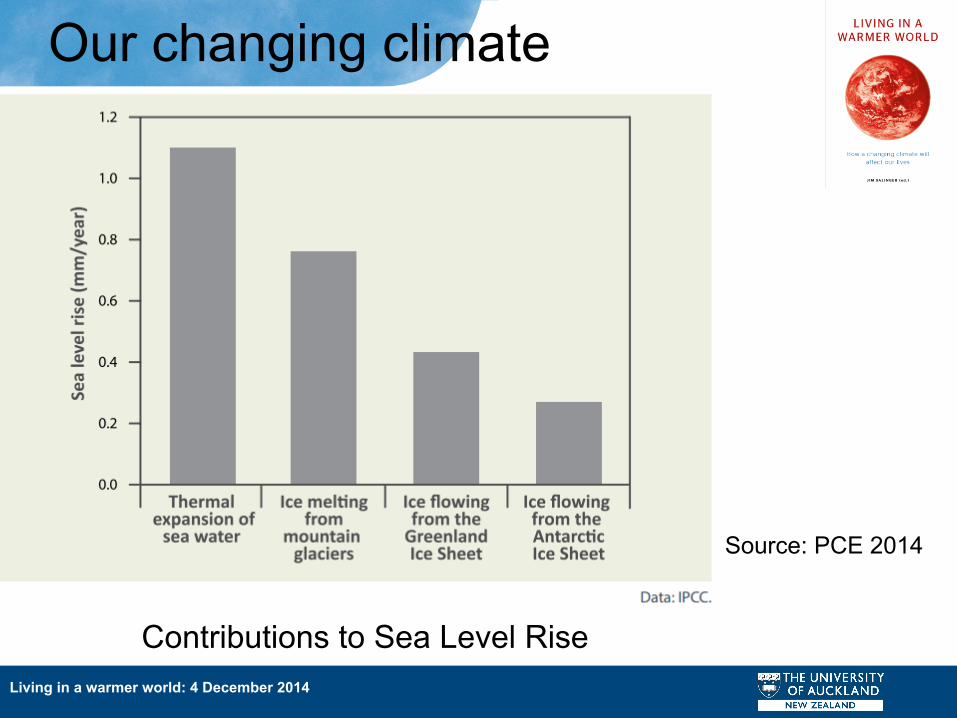
Source: PCE 2014
Contributions to Sea Level Rise
Living in a warmer world: 4 December 2014
Our changing climate
Living in a warmer world: 4 December 2014
Our changing climate
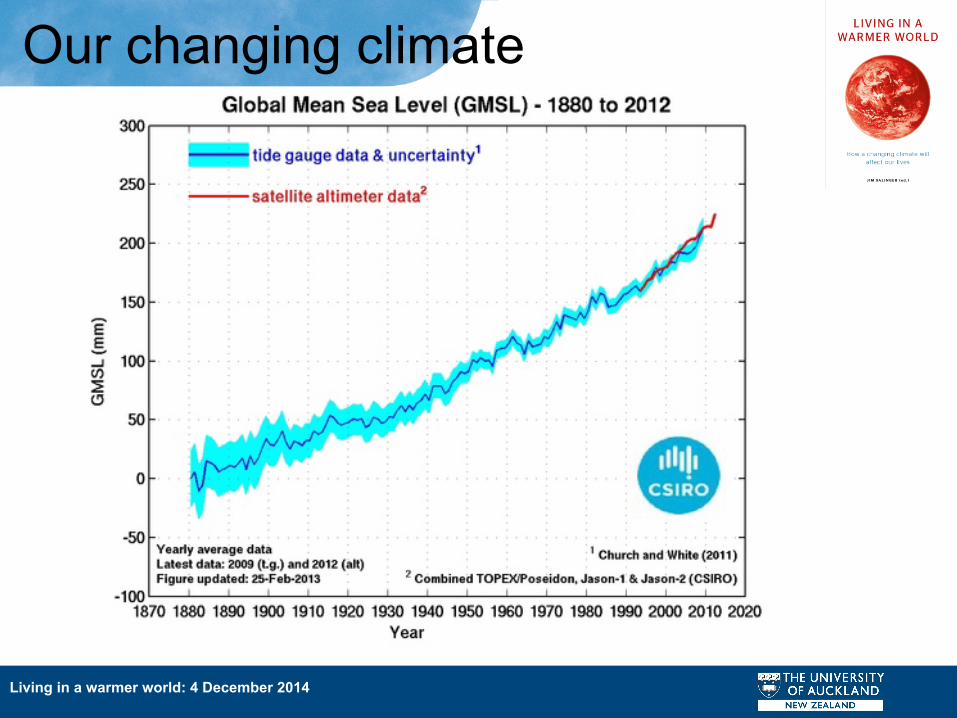
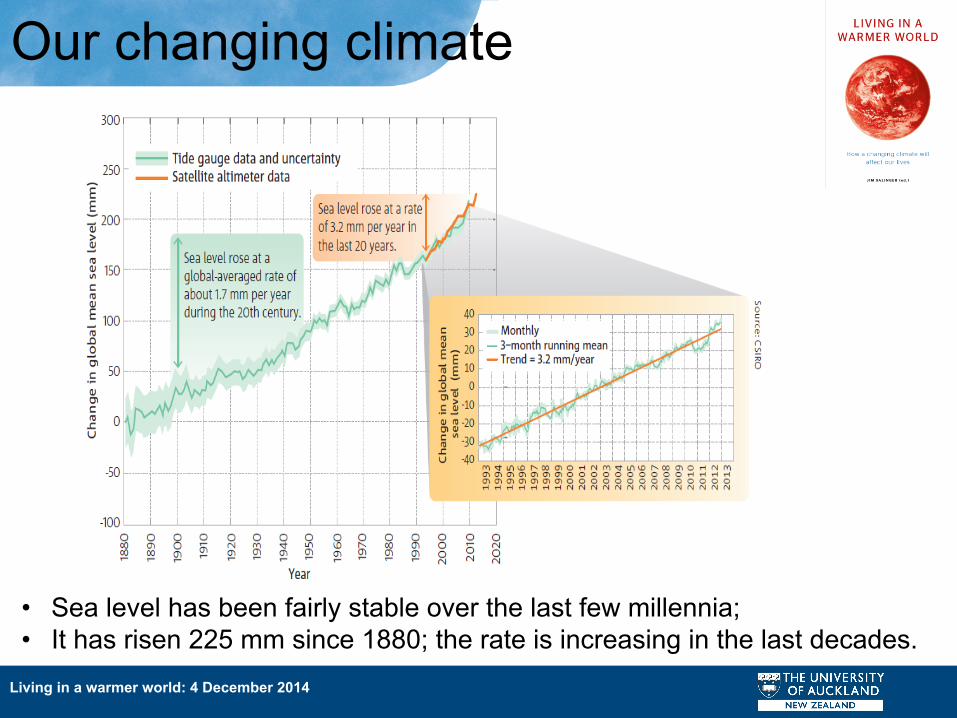
• Sea level has been fairly stable over the last few millennia; • It has risen 225 mm since 1880; the rate is increasing in the last decades.
Living in a warmer world: 4 December 2014
Our changing climate
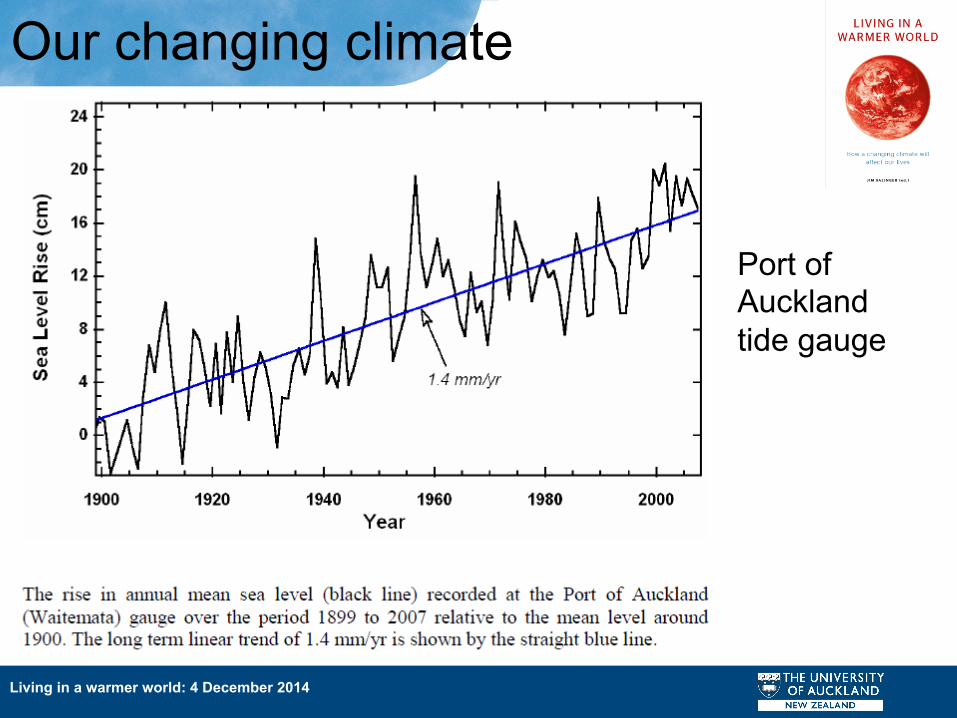
Port of Auckland tide gauge
Living in a warmer world: 4 December 2014
Our changing climate
Living in a warmer world: 4 December 2014
Our changing climate
Living in a warmer world: 4 December 2014
Our changing climate
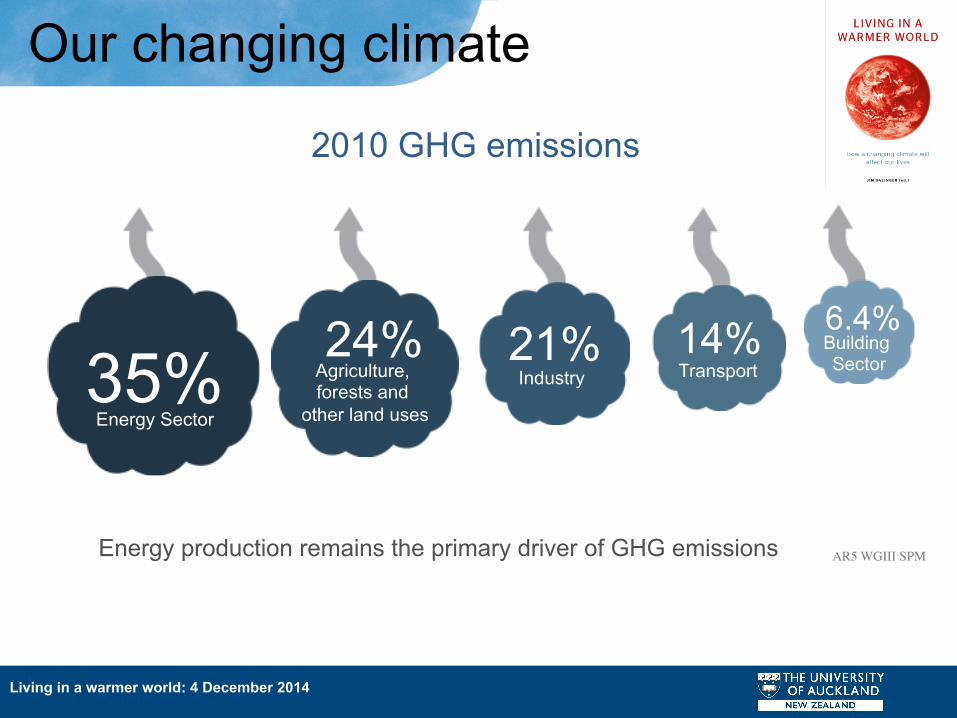
Energy production remains the primary driver of GHG emissions
35% 24% 21% 14% 6.4%
2010 GHG emissions
Energy Sector
Agriculture, forests and
other land uses
Industry Transport Building Sector
AR5 WGIII SPM
Living in a warmer world: 4 December 2014
Our changing climate
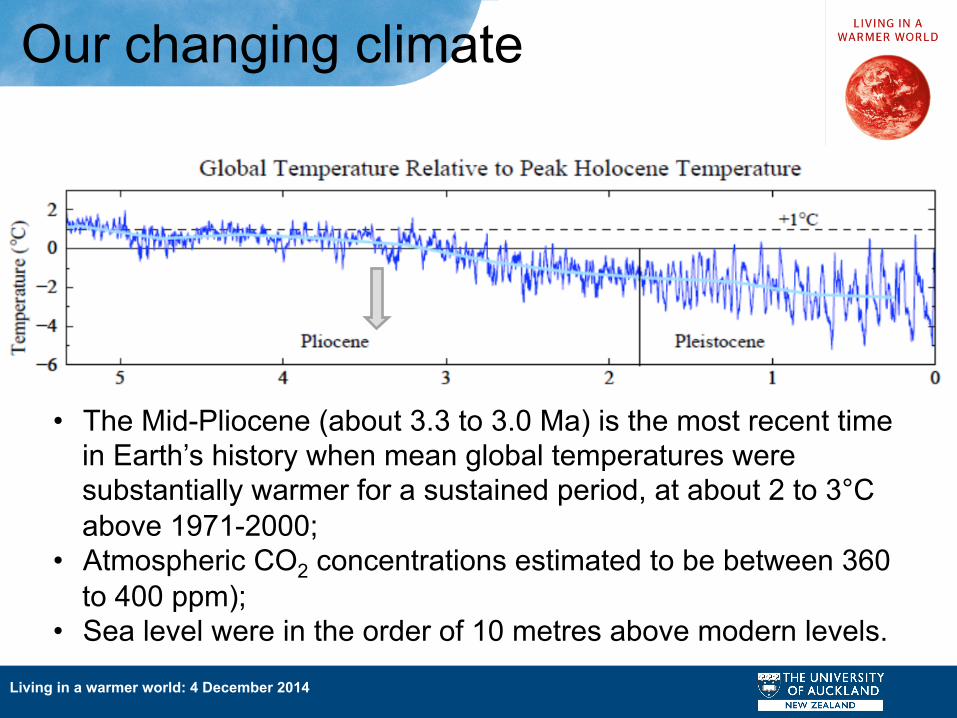
• The Mid-Pliocene (about 3.3 to 3.0 Ma) is the most recent time in Earth’s history when mean global temperatures were substantially warmer for a sustained period, at about 2 to 3°C above 1971-2000;
• Atmospheric CO2 concentrations estimated to be between 360 to 400 ppm);
• Sea level were in the order of 10 metres above modern levels.
Living in a warmer world: 4 December 2014
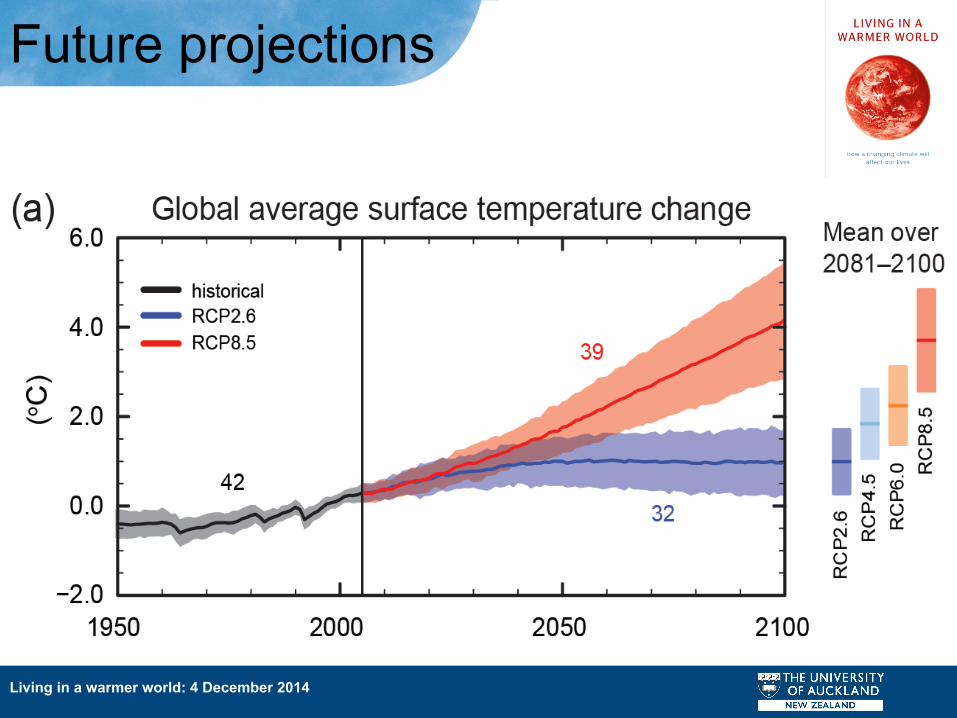
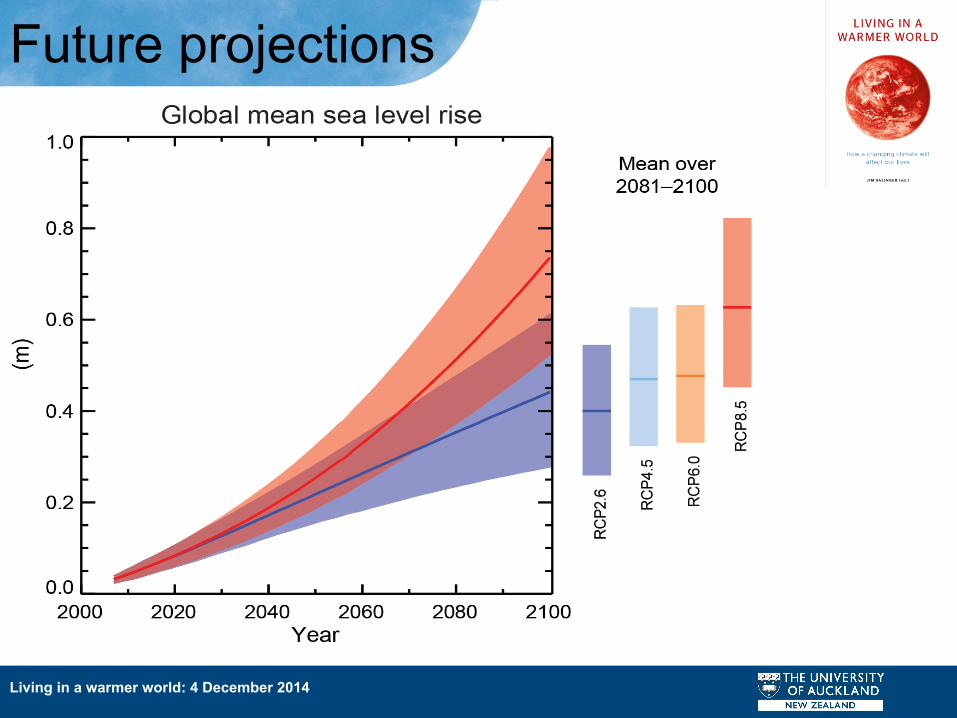
Future projections
Living in a warmer world: 4 December 2014
Future projections
Living in a warmer world: 4 December 2014
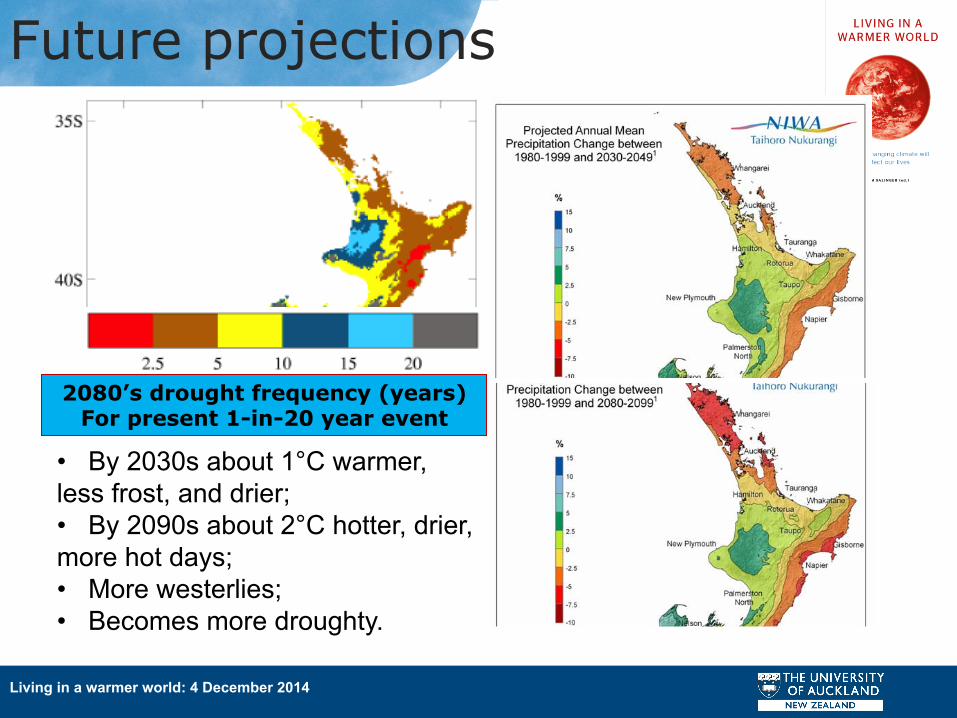
Future projections
• By 2030s about 1°C warmer, less frost, and drier; • By 2090s about 2°C hotter, drier, more hot days; • More westerlies; • Becomes more droughty.
2080’s drought frequency (years) For present 1-in-20 year event
Living in a warmer world: 4 December 2014
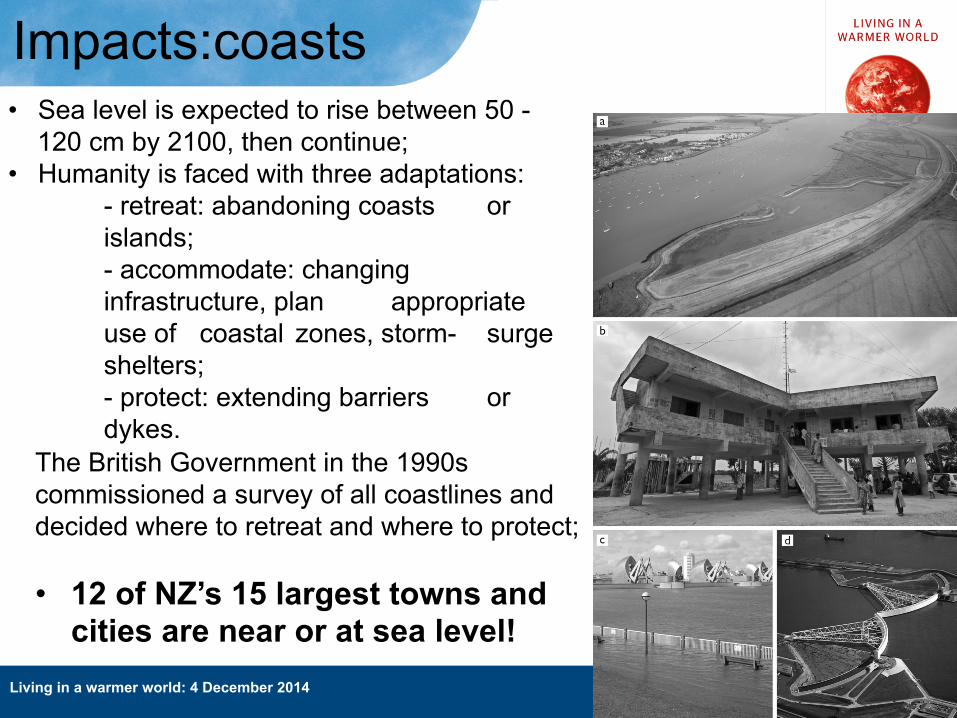
Impacts:coasts • Sea level is expected to rise between 50 -
120 cm by 2100, then continue; • Humanity is faced with three adaptations: - retreat: abandoning coasts or
islands; - accommodate: changing infrastructure, plan appropriate use of coastal zones, storm- surge shelters; - protect: extending barriers or dykes.
The British Government in the 1990s commissioned a survey of all coastlines and decided where to retreat and where to protect; • 12 of NZ’s 15 largest towns and
cities are near or at sea level!
Living in a warmer world: 4 December 2014
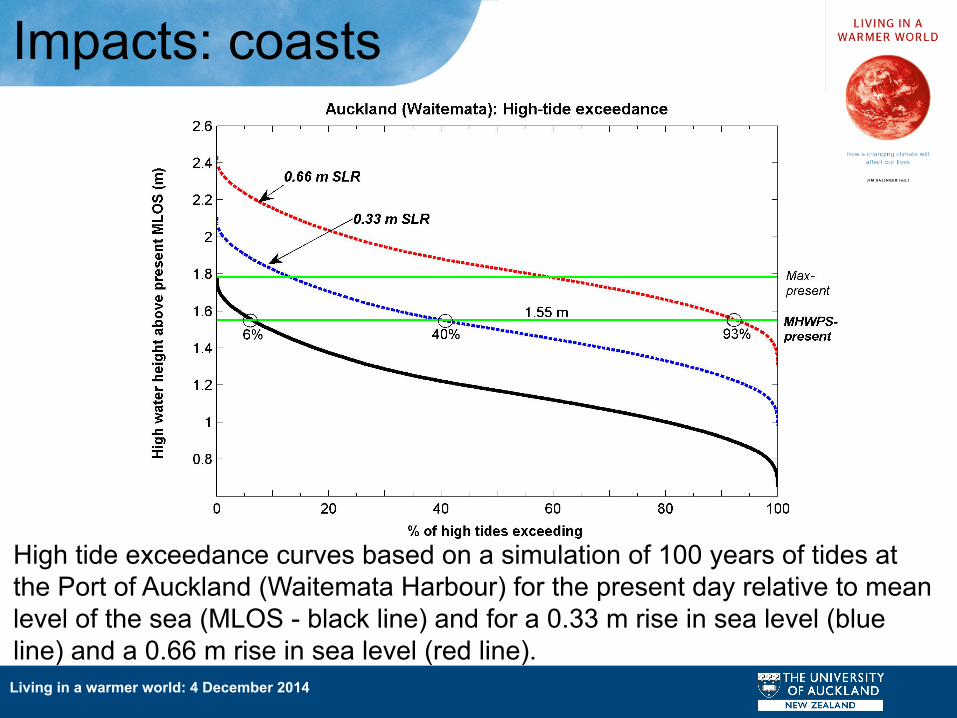
High tide exceedance curves based on a simulation of 100 years of tides at the Port of Auckland (Waitemata Harbour) for the present day relative to mean level of the sea (MLOS - black line) and for a 0.33 m rise in sea level (blue line) and a 0.66 m rise in sea level (red line).
Impacts: coasts
Living in a warmer world: 4 December 2014
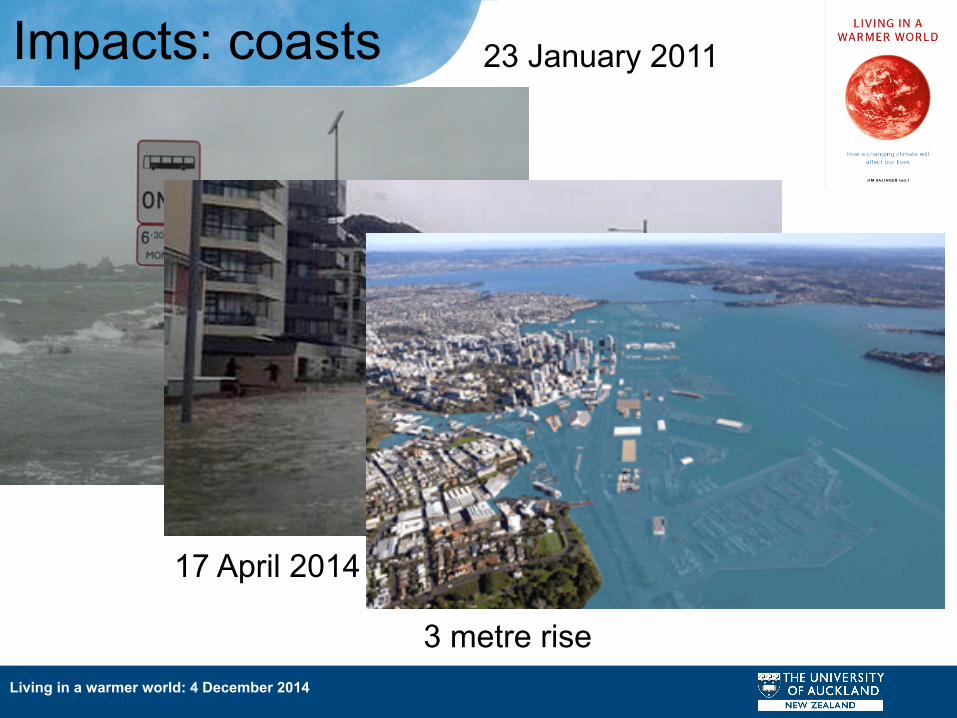
Impacts: coasts 23 January 2011
17 April 2014
3 metre rise
Living in a warmer world: 4 December 2014
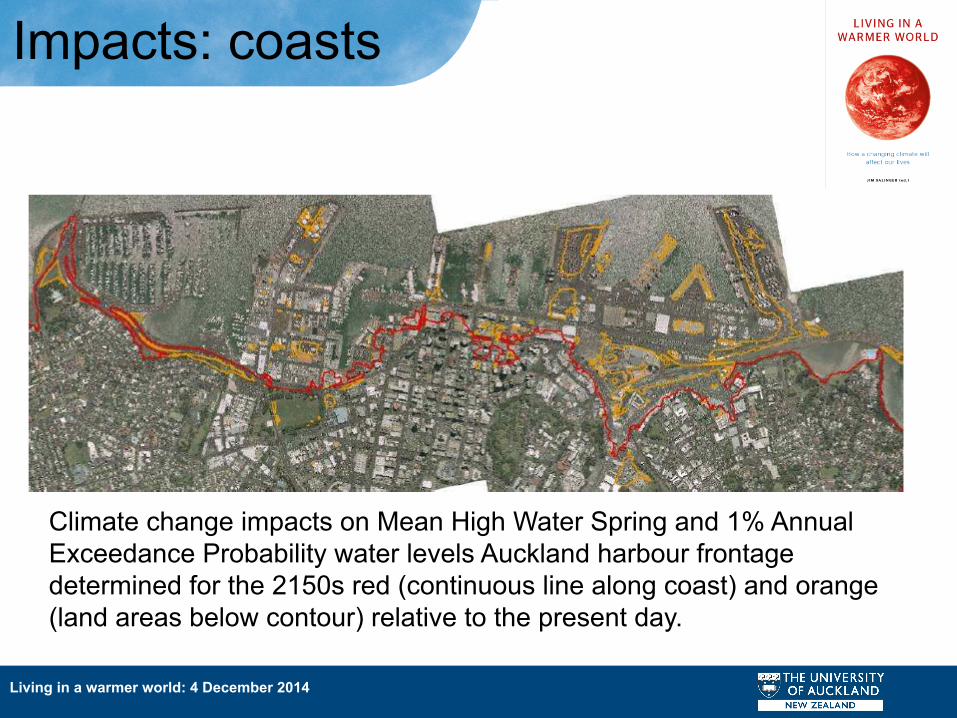
Climate change impacts on Mean High Water Spring and 1% Annual Exceedance Probability water levels Auckland harbour frontage determined for the 2150s red (continuous line along coast) and orange (land areas below contour) relative to the present day.
Impacts: coasts
Living in a warmer world: 4 December 2014
Impacts: infrastructure
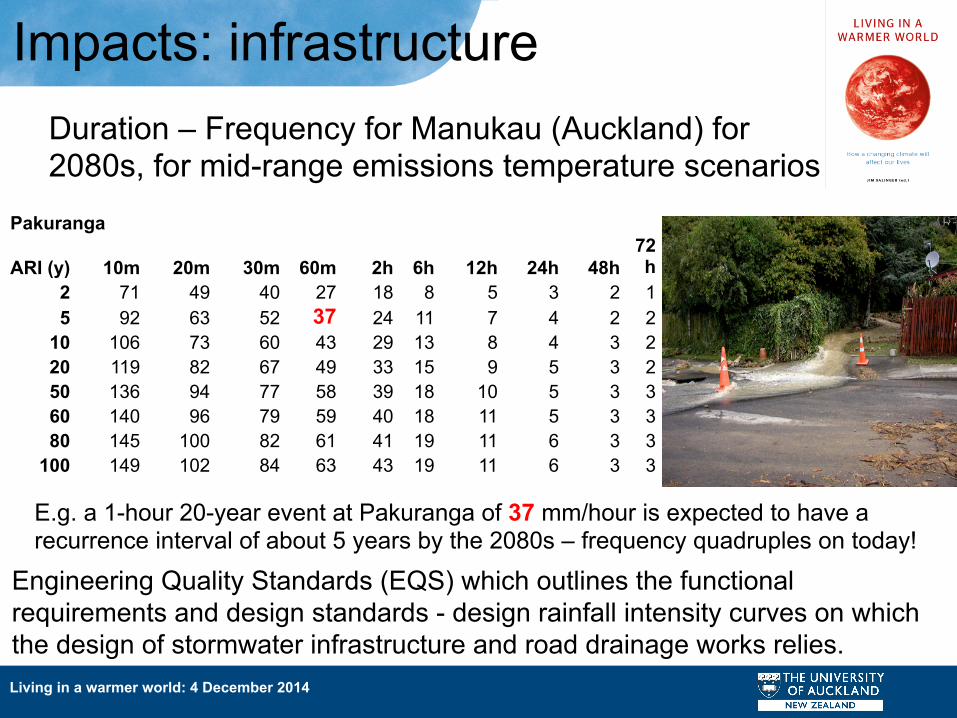
Engineering Quality Standards (EQS) which outlines the functional requirements and design standards - design rainfall intensity curves on which the design of stormwater infrastructure and road drainage works relies.
Duration – Frequency for Manukau (Auckland) for 2080s, for mid-range emissions temperature scenarios
E.g. a 1-hour 20-year event at Pakuranga of 37 mm/hour is expected to have a recurrence interval of about 5 years by the 2080s – frequency quadruples on today!
Pakuranga
ARI (y) 10m 20m 30m 60m 2h 6h 12h 24h 48h 72h
2 71 49 40 27 18 8 5 3 2 1 5 92 63 52 37 24 11 7 4 2 2
10 106 73 60 43 29 13 8 4 3 2 20 119 82 67 49 33 15 9 5 3 2 50 136 94 77 58 39 18 10 5 3 3 60 140 96 79 59 40 18 11 5 3 3 80 145 100 82 61 41 19 11 6 3 3
100 149 102 84 63 43 19 11 6 3 3
Living in a warmer world: 4 December 2014
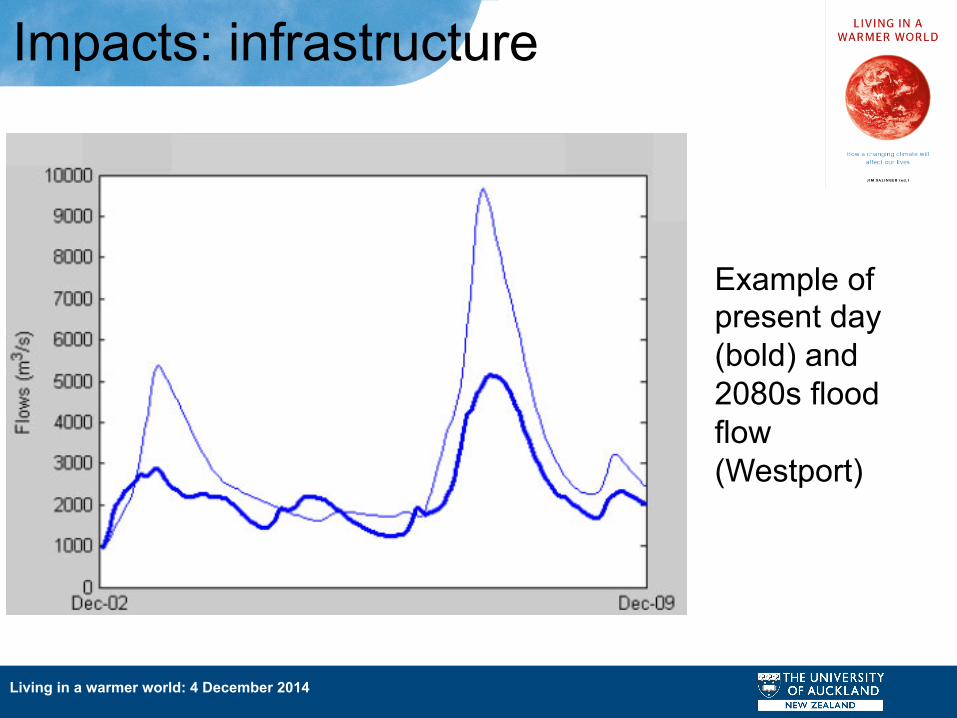
Impacts: infrastructure
Example of present day (bold) and 2080s flood flow (Westport)
Living in a warmer world: 4 December 2014
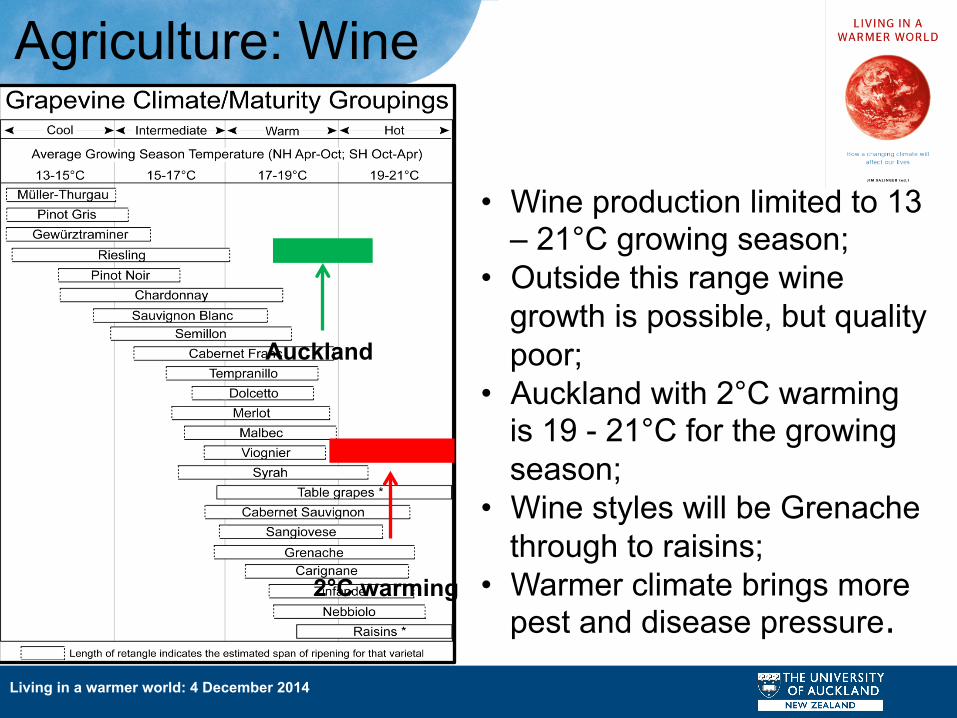
Agriculture: Wine
• Wine production limited to 13 – 21°C growing season;
• Outside this range wine growth is possible, but quality poor;
• Auckland with 2°C warming is 19 - 21°C for the growing season;
• Wine styles will be Grenache through to raisins;
• Warmer climate brings more pest and disease pressure.
Auckland
2°C warming

Living in a warmer world: 4 December 2014
• Hayward kiwifruit production may become uneconomic in Auckland over the next 50 years, due to a lack of winter chilling;
• Sub-tropical crops such as avocados and citrus will benefit from a trend towards warmer average conditions;
• Some tropical fruit crops can presently be grown in localised micro-climates in Auckland but it is likely that opportunities for these crops will increase.
Agriculture: Crops
Living in a warmer world: 4 December 2014
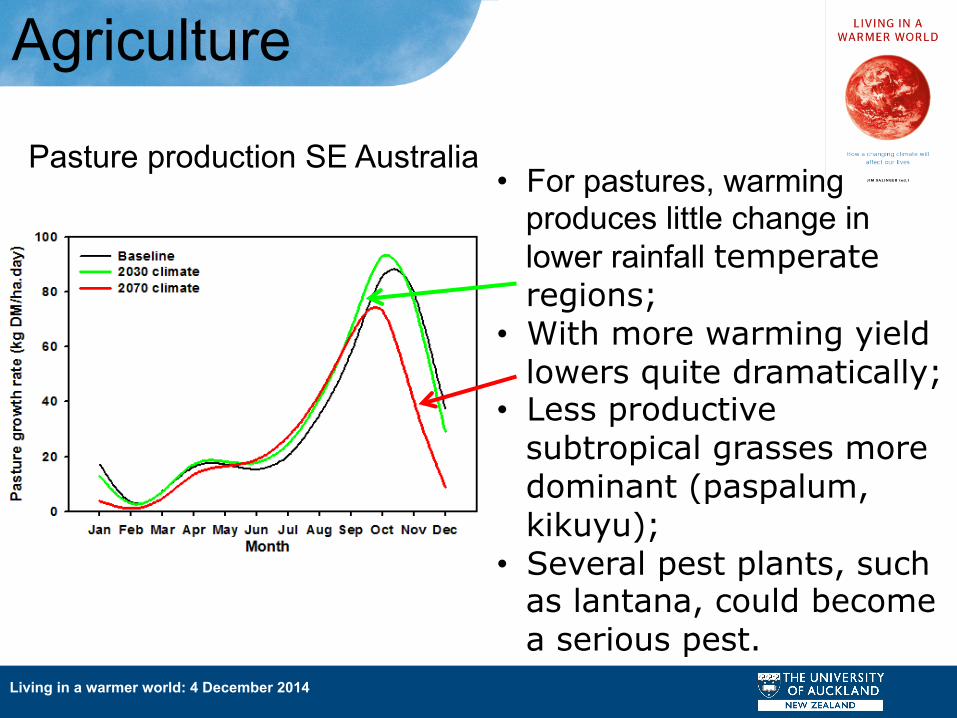
Agriculture
Pasture production SE Australia • For pastures, warming
produces little change in lower rainfall temperate regions;
• With more warming yield lowers quite dramatically;
• Less productive subtropical grasses more dominant (paspalum, kikuyu);
• Several pest plants, such as lantana, could become a serious pest.
Living in a warmer world: 4 December 2014
Fisheries
Living in a warmer world: 4 December 2014
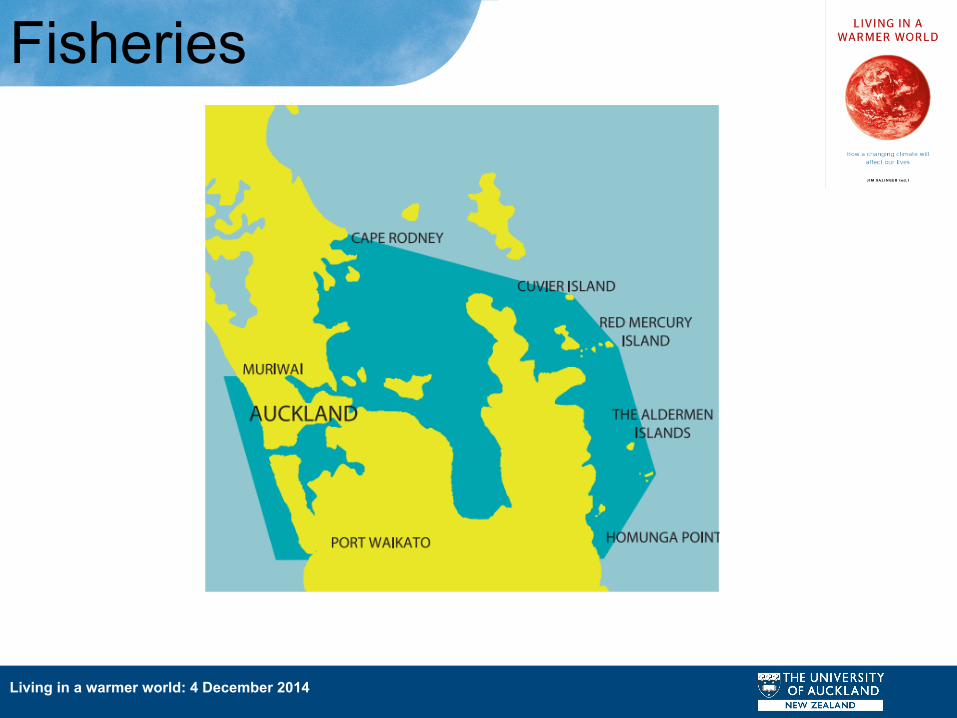
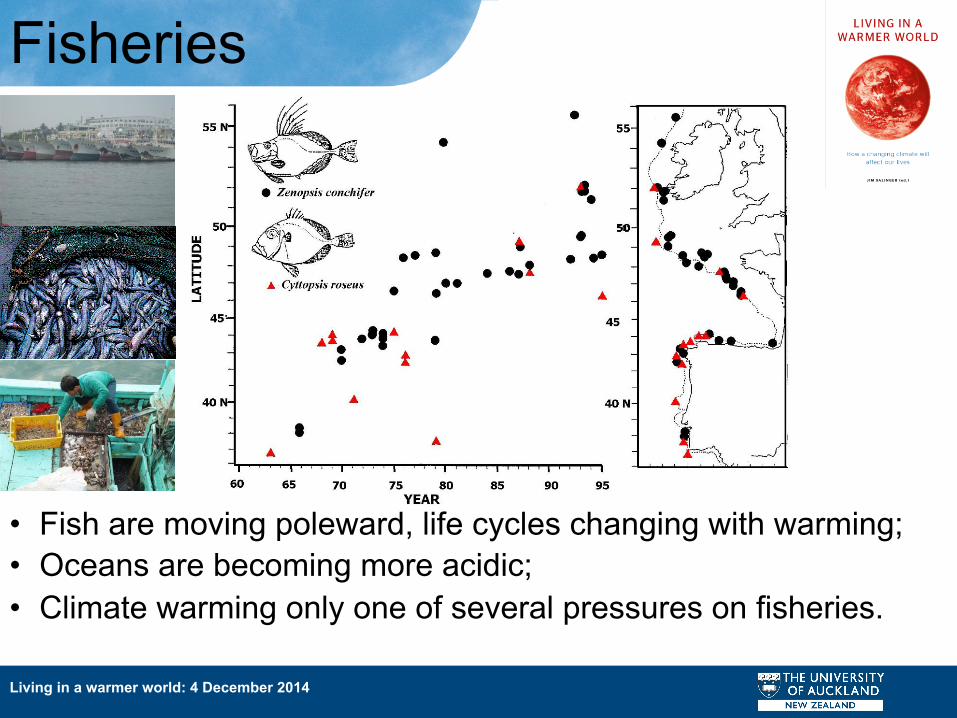
Fisheries
• Fish are moving poleward, life cycles changing with warming; • Oceans are becoming more acidic; • Climate warming only one of several pressures on fisheries.
Living in a warmer world: 4 December 2014
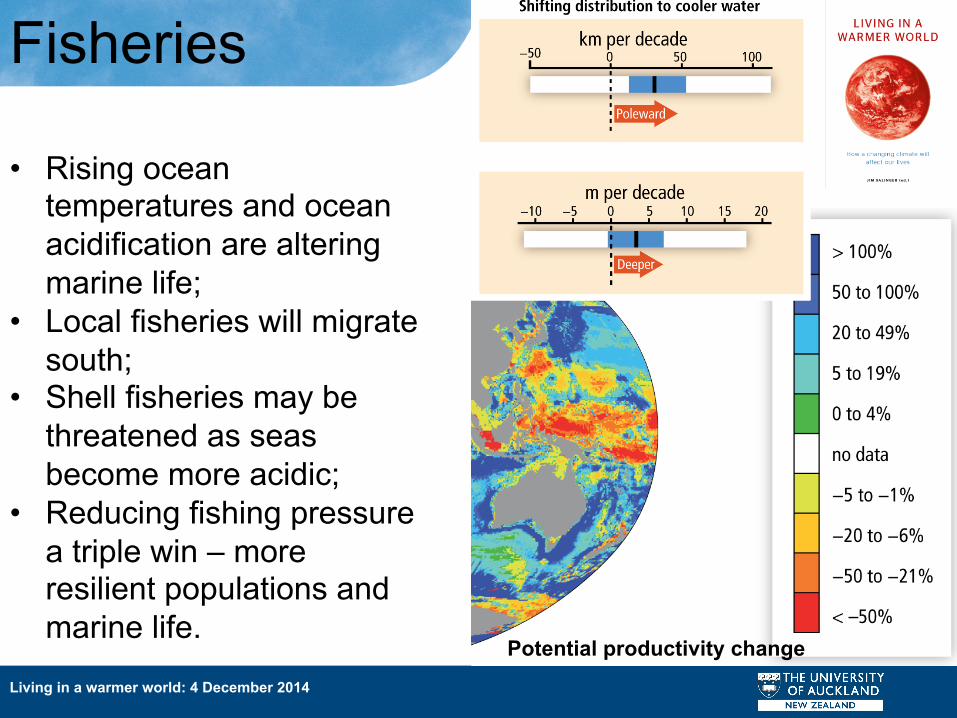
• Rising ocean temperatures and ocean acidification are altering marine life;
• Local fisheries will migrate south;
• Shell fisheries may be threatened as seas become more acidic;
• Reducing fishing pressure a triple win – more resilient populations and marine life.
Fisheries
Potential productivity change
Living in a warmer world: 4 December 2014
Health
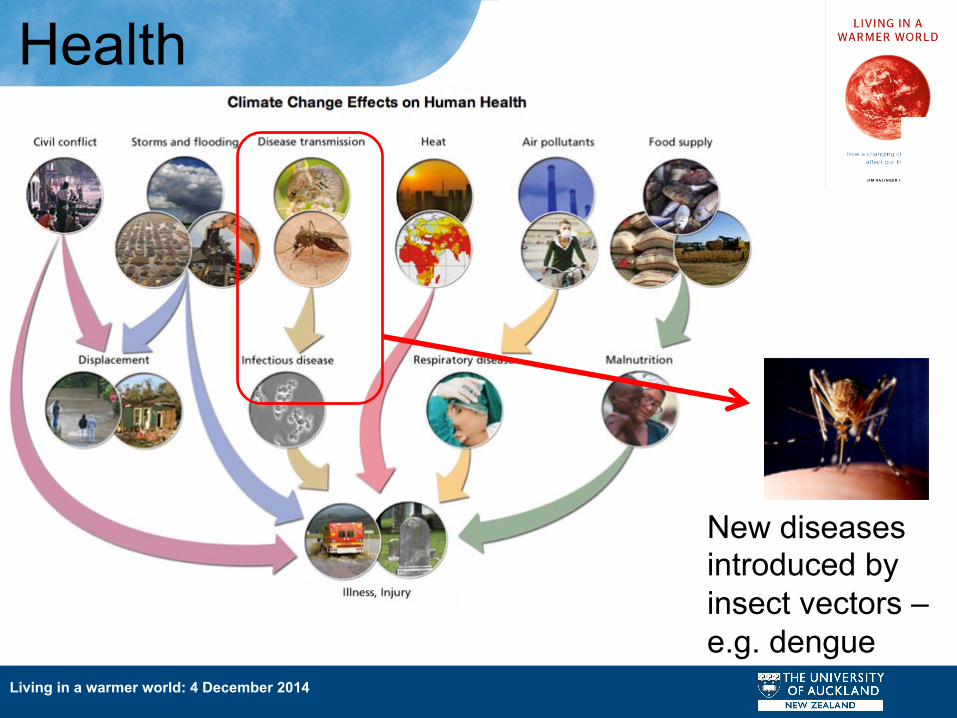
New diseases introduced by insect vectors – e.g. dengue
Living in a warmer world: 4 December 2014
Health
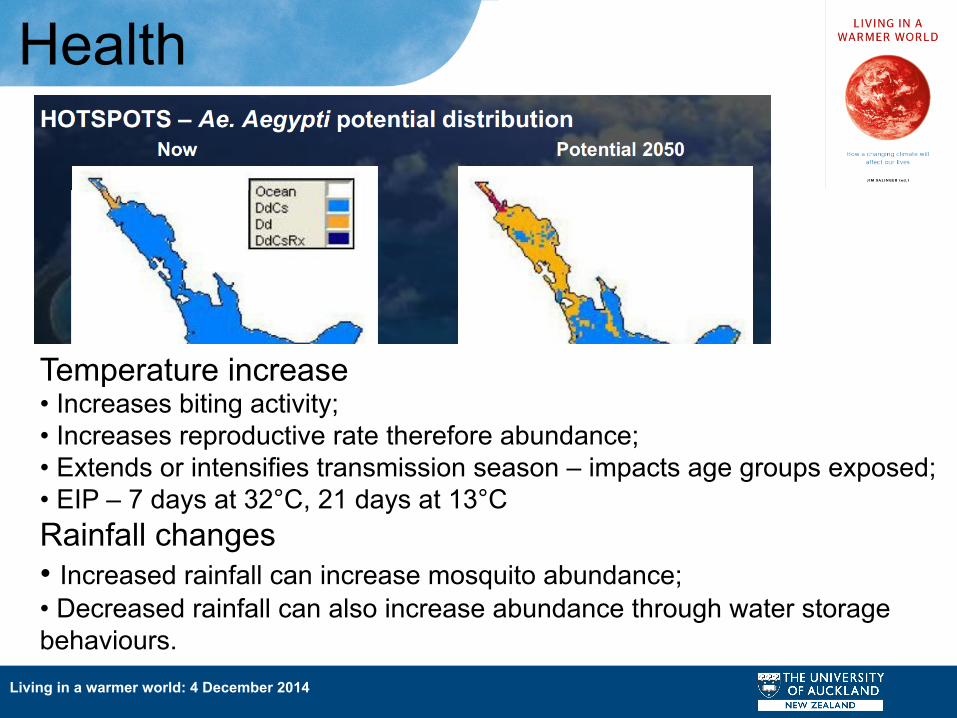
Temperature increase • Increases biting activity; • Increases reproductive rate therefore abundance; • Extends or intensifies transmission season – impacts age groups exposed; • EIP – 7 days at 32°C, 21 days at 13°C Rainfall changes • Increased rainfall can increase mosquito abundance; • Decreased rainfall can also increase abundance through water storage behaviours.
Living in a warmer world: 4 December 2014
Pacific climate change
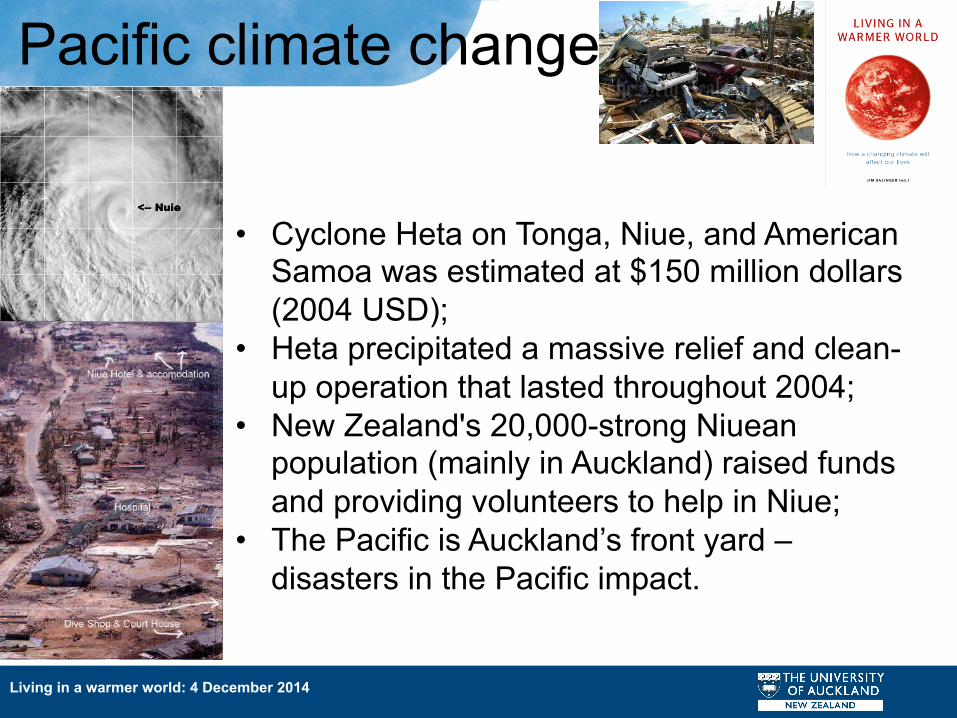
• Cyclone Heta on Tonga, Niue, and American Samoa was estimated at $150 million dollars (2004 USD);
• Heta precipitated a massive relief and clean-up operation that lasted throughout 2004;
• New Zealand's 20,000-strong Niuean population (mainly in Auckland) raised funds and providing volunteers to help in Niue;
• The Pacific is Auckland’s front yard – disasters in the Pacific impact.
Living in a warmer world: 4 December 2014
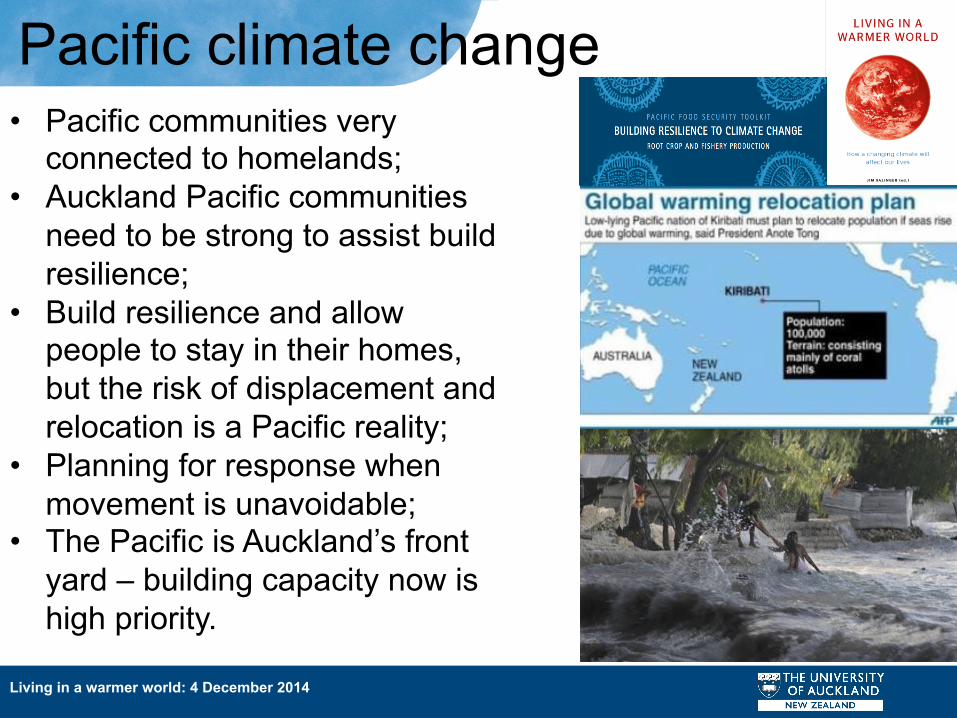
• Pacific communities very connected to homelands;
• Auckland Pacific communities need to be strong to assist build resilience;
• Build resilience and allow people to stay in their homes, but the risk of displacement and relocation is a Pacific reality;
• Planning for response when movement is unavoidable;
• The Pacific is Auckland’s front yard – building capacity now is high priority.
Pacific climate change
Living in a warmer world: 4 December 2014
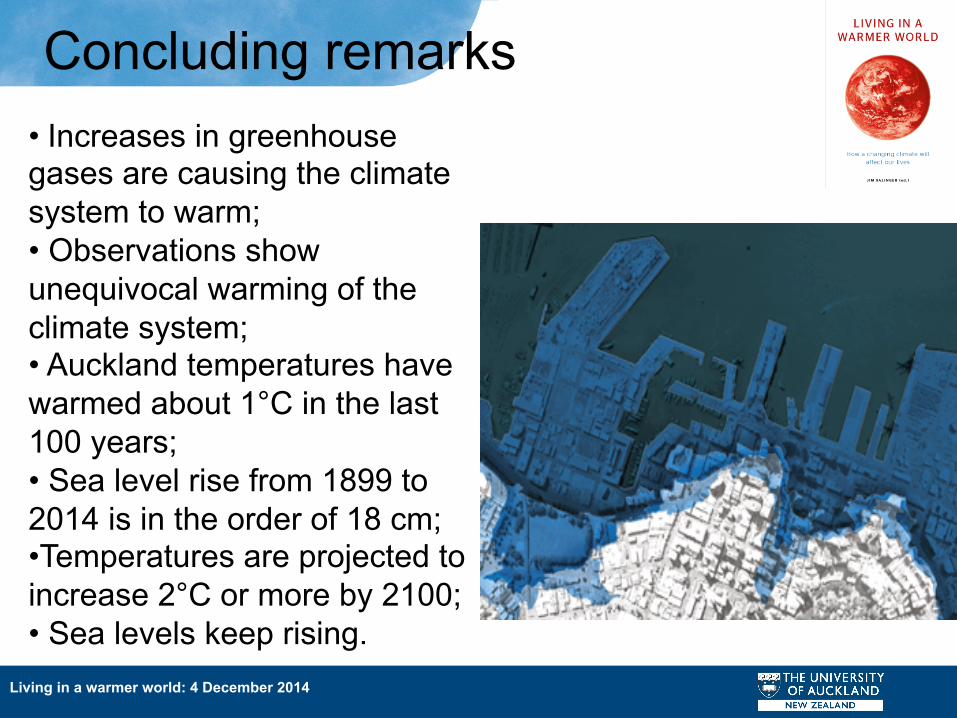
Concluding remarks • Increases in greenhouse gases are causing the climate system to warm; • Observations show unequivocal warming of the climate system; • Auckland temperatures have warmed about 1°C in the last 100 years; • Sea level rise from 1899 to 2014 is in the order of 18 cm; • Temperatures are projected to increase 2°C or more by 2100; • Sea levels keep rising.
Living in a warmer world: 4 December 2014
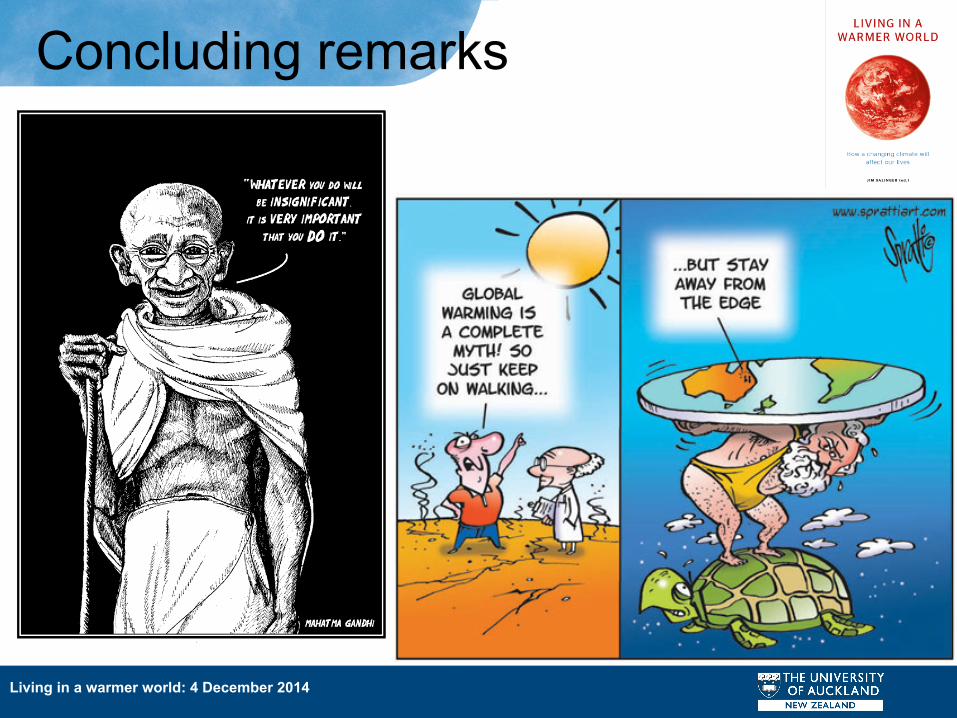
Concluding remarks
Living in a warmer world: 4 December 2014
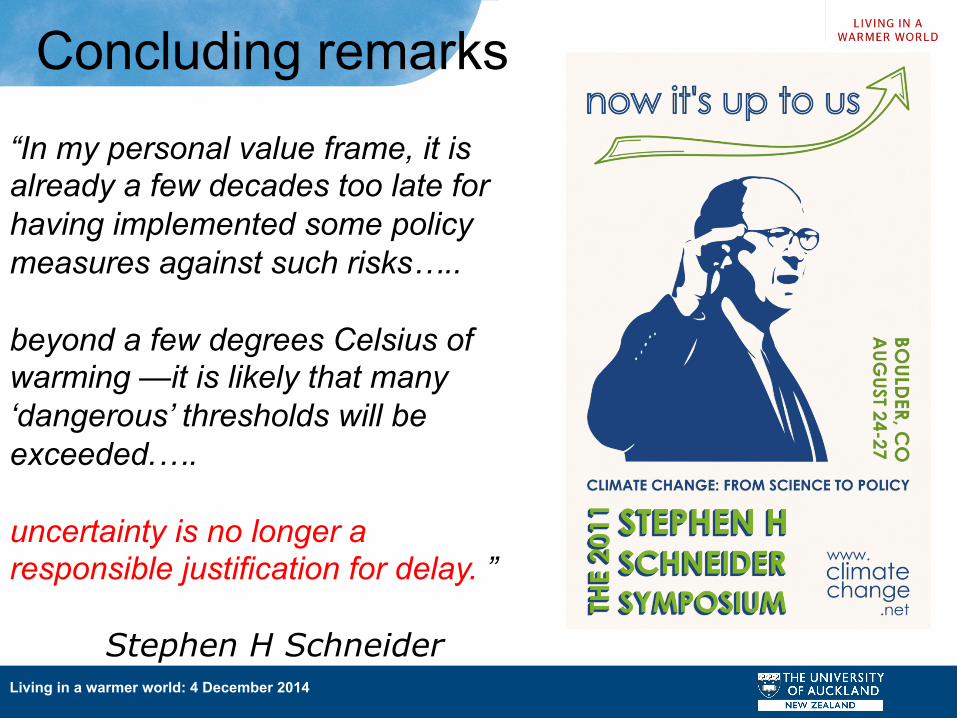
“In my personal value frame, it is already a few decades too late for having implemented some policy measures against such risks….. beyond a few degrees Celsius of warming —it is likely that many ‘dangerous’ thresholds will be exceeded.…. uncertainty is no longer a responsible justification for delay. ”
Stephen H Schneider
Concluding remarks